Article

Damage Mechanism of Trivalent Chromium Coatings under Tensile Stress

1
Laboratoire Génie de Production, Ecole Nationale d’Ingénieurs de Tarbes, INPT, Université de Toulouse, 47 Av. d’Azereix, 65016 Tarbes, France
2
Mecaprotec Industries, 34 Boulevard de Joffrery, 31600 Muret, France
*
Author to whom correspondence should be addressed.
Coatings 2023, 13(7), 1194; https://doi.org/10.3390/coatings13071194
Submission received: 28 May 2023 / Revised: 18 June 2023 / Accepted: 27 June 2023 / Published: 3 July 2023

Abstract

:
Due to new environmental regulations, hexavalent chromium electrolytes can no longer be used for thick, hard chromium plating. In response to this industrial and environmental challenge, trivalent chromium electrolyte plating has been developed. In this paper, we propose a study of the adhesion of CrIII coatings based on the implementation of numerical models in comparison with an identified experimental scenario. The aim is to dissociate the influence of coating and substrate behaviours from the adhesion work by describing the intrinsic damage of the chromium layer and the coating–substrate interface. Two types of cracking were studied: transverse cracking and delamination. For the former, the crack density was higher for CrIII than for CrVI and increased with deformation and coating thickness. Microtensile tests with scanning electron microscopy (SEM) observations allowed us to highlight the cracking process in the coating (transverse cracking) and at the coating–substrate interface (delamination). The numerical simulation of the test allowed us to estimate a damage-initiation threshold normal stress of 1900 MPa, which occurred at an average applied strain of 2.5%. Delamination of the coating was complete at an average strain of 13.6% and an interfacial normal stress of 2600 MPa.

1. Introduction

Since the implementation of the European REACH directive (Registration, Evaluation, Authorisation of Chemicals products), which aims to ban chromium trioxide-based baths, the search for an alternative solution has become a substantial scientific, industrial and environmental challenge. Several lines of research are currently underway to replace hexavalent chromium plating [1,2,3]. An analysis of these different alternatives highlights two possible development paths:
-
Developing and implementing new processes involving a “product/process” technological breakthrough. This is particularly the case for dry processes such as physical/chemical vapor deposition (PVD-CVD) and high-velocity oxygen fuel (HVOF).
-
The implementation of processes without a tangible technological breakthrough. This is the case for electrolytic processes, which are intended to meet the need to treat parts with complex geometries, mainly where an internal surface is difficult to access.
The development of coatings from trivalent chromium electrolytes is a promising alternative. The coatings obtained are generally studied from the point of view of their performance characteristics, but their intrinsic properties remain largely unknown. The development of trivalent chromium coatings is still under development. There is no consensus in the literature on the electrolyte composition, with many formulations used by different authors [4,5,6,7]. The formation of chromium coatings from trivalent chromium electrolytes results in coatings with lower crystallinity and hardness. In addition, their thickness is small: much less than 100 μm [7]. Their different growth mode explains these main differences between coatings developed from CrIII or CrVI ions. The mechanisms involved in reducing trivalent chromium differ from those of hexavalent chromium. Hoare et al. showed that the reduction of CrVI ions proceeds in several steps: CrVI→CrIII→CrII→Cr0, catalysed by the HSO4 ion [8,9]. In an aqueous solution, CrIII forms a stable [Cr(H2O)6]3+ complex, implying a different reduction mechanism from that in CrVI solutions. Therefore, the use of trivalent chromium solutions requires the introduction of a complexing agent into the electrolyte, such as formate (HCOO) [10], oxalate (HOOC-COO) [11], acetate (C2H3O2) [12], glycinate (C2H4NO2) [13] or even carbamate (CO2NH2) [14]. Trivalent chromium coatings contain more dissolved gases (oxygen, nitrogen and hydrogen) than hexavalent coatings [15]. The presence of carbon is a strong characteristic of trivalent coatings. It will be significant for the microstructural and mechanical properties of the coatings before and after heat treatment.
The trivalent chromium coatings studied are almost systematically amorphous or nanocrystalline [7,15,16,17,18,19,20], rendering their characterisation even more complex. Bikulcius measures crystallite sizes in the nanometre range [21]. A broad diffraction peak is observed for a diffraction angle close to 45° (Cu anticathode, λkα = 1.54 Å). Tsai highlights the role of carbon in the crystallographic structure of these coatings. The author states that the coatings have a hexagonal structure at a carbon content of 1 wt.% and are amorphous at a carbon content of 3.3 wt.% [22]. Liang et al. show that a crystalline layer can also be obtained from a sulphate electrolyte if the current density is low [23].
Trivalent chromium coatings generally have a lower crack density than hexavalent chromium coatings. However, many cracks run through the entire coating thickness, a phenomenon known as macrocracking. Bikulcius shows that adding additives to the electrolyte reduces the deepening of cracks [21]. The density and size of the cracks decrease with bath temperature [24]. Mahdavi believes that damage results from the inherent brittleness of the amorphous structures [25] and a large amount of hydrogen absorbed at the cathode, which creates internal stresses [26]. The initiation of cracks at the origin of decohesions and their propagation kinetics in the thickness of the layers as a function of the deformation imposed by the substrate have not been determined. To access this information, we have developed local in situ measurements under scanning electron microscopy (SEM). SEM allows for the better detection of cracks by coupling the different observation modes offered by this instrument: secondary or backscattered electron. Two types of complementary observations were, thus, developed: front-view observations, which allowed us to follow the kinetics of damage by chromium cracking during the tensile test, and cross-sectional observations, which allowed us to identify more precisely the initiation and propagation of cracks in the thickness of the coatings.
To establish a quantitative criterion characteristic of the adhesion of chromium coatings, we propose to implement tools to dissociate the influence of “external factors” from the adhesion work during a tensile test. In the literature, the quantification of the adhesion of hard coatings on soft substrates is classically determined by analytical models based on works by Agrawal and Raj [27,28,29,30]. However, chromium’s damage mechanisms are far from these models’ fundamental assumptions. Contrary to the cases studied in the literature, hard chromium is fundamentally cracked, which complicates the determination of the strain generating the first transverse cracks. Moreover, these models are based on delamination of the layer when the crack density is at its maximum. Other authors propose studying different systems’ bond strength using finite element modelling [31,32,33,34,35,36,37,38,39,40,41]. In particular, Zhu et al. propose a numerical model to jointly simulate initiation and propagation of surface-emerging cracks and coating–substrate interfacial cracks using a cohesive zone approach [42]. More recently, Jiang et al. investigated the tensile behaviour of a zirconium alloy coated with a chromium layer deposited by multi-arc ion plating [39]. The authors could determine a minimum interfacial fracture toughness by modelling the coating–substrate interface.
In this paper, we propose a study of the adhesion of chromium coatings based on the implementation of numerical models compared to an identified experimental scenario. The aim is to dissociate the influence of the coating and substrate behaviour (plasticity and toughness) from the adhesion work by describing the intrinsic damage of the chromium layer and the coating–substrate interface.

2. Materials and Methods

2.1. Coating Deposition

The coatings were performed by direct electrodeposition on a one-millimetre-thick low-alloyed (1.6747) steel substrate (heat-treated to obtain ultimate tensile strength between 1080 and 1230 MPa) [43]. Trivalent chromium was electrodeposited in electrolytes containing trivalent chromium salt (CrCl3 H2O), glycine, sodium chloride (NaCl) and aluminium chlorohydrate (AlCl3 6H2O). The pH of the solution varied between 0 and 2. The coatings were prepared in 85-litre tanks. All coatings were produced at a deposition rate of approx. one micrometre per minute. After processing, all coatings were furnace-degassed at 190 °C for 3 h to limit hydrogen embrittlement. The postprocessed trivalent chromium coating no longer contained hydrogen but only traces of carbon [30,43]. Heat treatments at 300 and 700 °C were performed for one hour in a conventional Nabertherm N 30/85HA forced-convection furnace without gas shielding. The surface of trivalent chromium coatings showed a network of surface cracks (Figure 1). Multiple cracks distributed throughout the coating and cracks crossing the entire coating thickness were observed in the cross-section. The thickness of the coating was 51 ± 1 μm. The intrinsic properties of these trivalent chromium coatings as a function of their microstructure were explained in a previous article. Trivalent chromium deposits exhibit elastofragile behaviour. Their stiffnesses vary from 182 to 211 GPa, respectively, depending on their structure, which is mainly amorphous in the raw state and crystalline after post-treatment at 300 °C. Their low toughness in the raw state (1.37 ± 0.13 MPa√m) has been attributed to their high interstitial carbon content, destabilising the crystalline structure.

2.2. Coating Characterisation

In situ microtensile tests in a scanning electron microscope (ZEISS EVO HD 15, Paris, France) were designed and performed according to the surface preparation, the electrodeposition conditions and post-heat treatments. A Deben Microtest 5000 W tensile stage (GATAN, Le Port-Marly, France) was used (Figure 2a). The sample geometry is detailed in Figure 2b. The tested length was 14 mm, with a 3 mm wide and 1 mm thick cross-section. The tested length was sized to allow the maximum displacement of the jaws to attain fracture of the steel substrate. The crosshead speed was chosen according to ISO standard NF EN 6892-1 and was set to 0.5 mm.min−1.
To analyse the cracking damage mode of coatings, observations were conducted either on the top surface of the specimens (top view, Figure 2c) or on the edge of samples (sectional view, Figure 2d). Surface observation of the coating during the tensile test allowed a large area to be observed. This provided an adequate crack count statistic, which is primarily of interest for quantifying adhesion from analytical models. However, as mentioned above, this method does not allow direct observation of the coating–substrate interface. When observing the surface, delamination of the coating was detected when the surface crack was stabilised. However, the delamination mechanisms may be progressive rather than simultaneous and cannot be identified by this observation. Thus, we chose to develop a complementary test, allowing the simultaneous observation of the whole thickness of the chromium coating and its interface with substrate. In this way, it was possible to characterise the evolution of damage in the thickness of the coating and at the interface during the tensile test.
In the broadest sense (initiation and propagation), the evolution of cracks in the coatings during the test was quantified using SEM observations in the backscattered electron mode. Interruptions in the test were allowed to integrate the images properly. During these interruptions, a slight relaxation of the specimen was predicted to occur for a short time (Figure 3). Therefore, a 30 s dwell time was defined to allow the force applied to the specimen to stabilise before an SEM image was recorded. The test was interrupted every 0.25 or 0.5 mm of displacement. The area of interest observed by SEM imaging represented a surface area of 7 mm2 (magnification ×100) for surface analysis and 0.077 mm2 for section analysis (magnification ×1000) (Figure 1). A crack count along the tensile axis was performed for each image acquired using the intercept method. For the front-view observations, the number of cracks given as a function of the influence parameters was determined by taking the average intersections between three lines drawn per image and the cracks. In addition, continuous video recording of the SEM scan allowed the initiation of layer delamination in real time. The evolution of transverse layer damage (cracking orthogonal to the top surface) and interface damage (loss of adhesion) was followed for the cross-sectional observations during the tensile test. Three magnifications were used for each test, namely ×250, ×1000 and ×2500. A secondary electron (SE) and backscatter electron (BSD) image was taken for each magnification. The contrast and brightness of the images were optimised to improve the grey-level distribution in the image correlation area for the SE images and to help observation of cracks for the backscattered electron images.

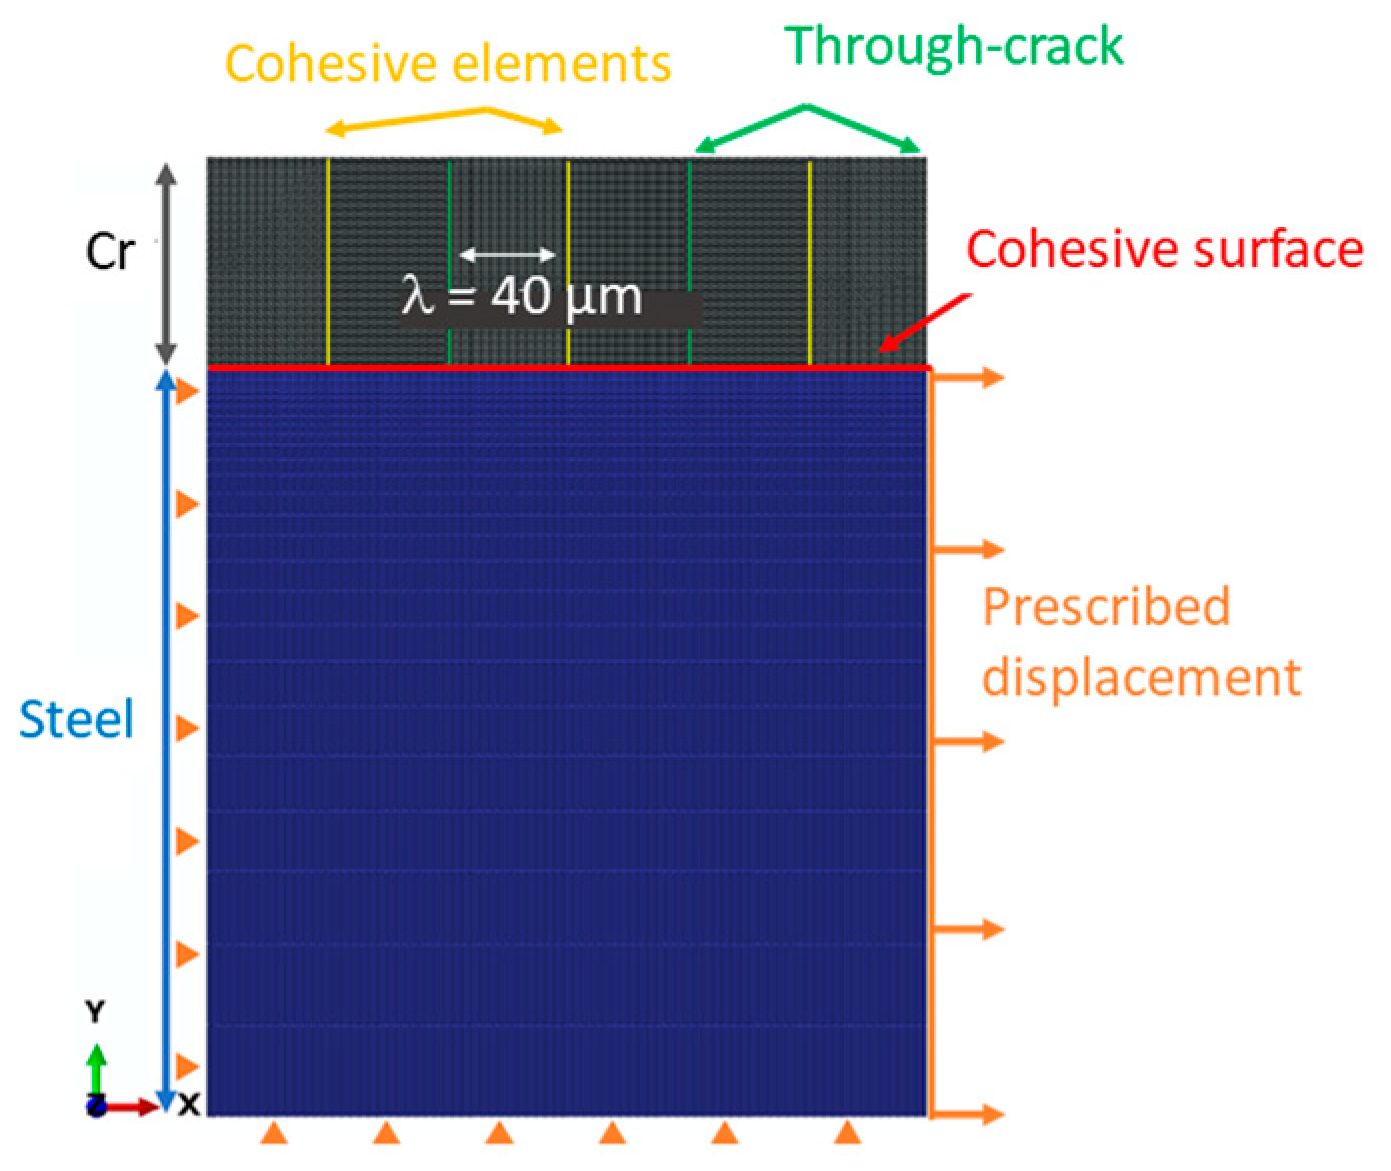
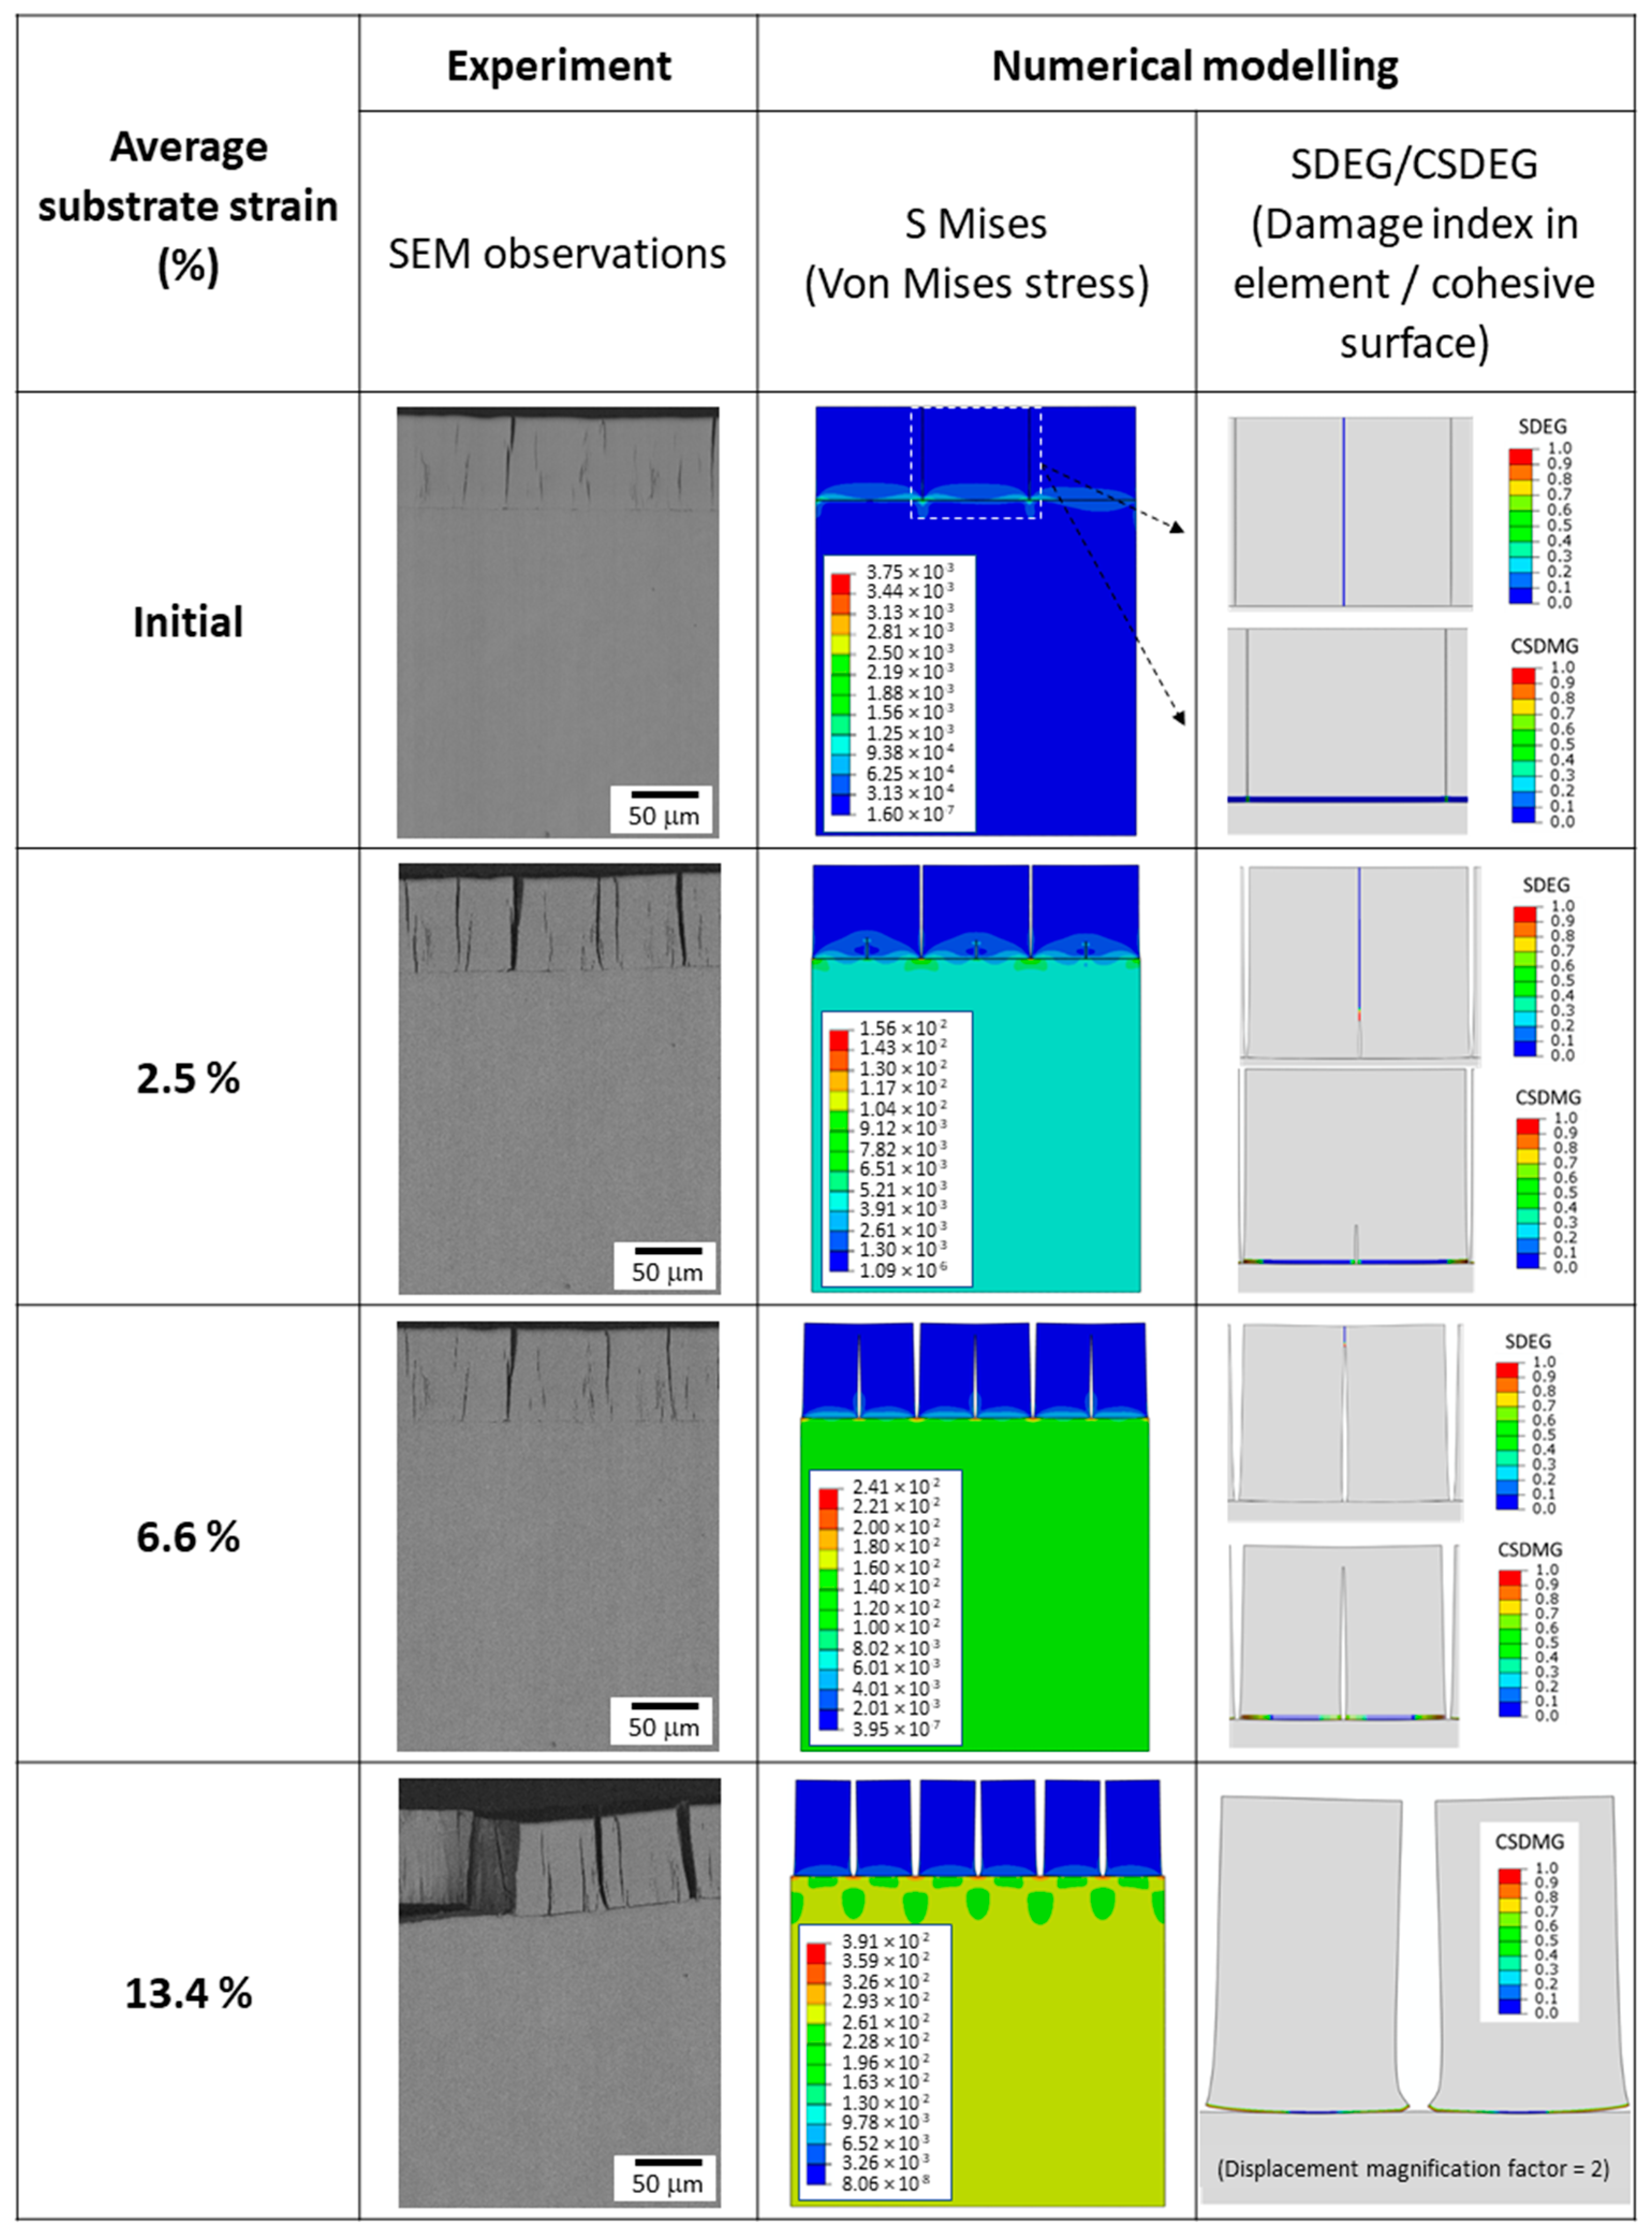
2.3. Methodology for the Numerical Simulation of the Tensile Adhesion Test

In the tensile adhesion test, the work the two adherents dissipate during their deformation and the relaxations generated by chromium damage (cracking) needed to be considered. From a numerical point of view, the first phenomenon can be correctly modelled by choosing rheological models adapted to the coating and the substrate. The second can be described by fracture mechanics or damage models such as the virtual crack closure technique (VCCT), extended finite element method (XFEM), cohesive zones, etc. In this work, the crack propagation will be considered through the implementation of cohesive zone models (CZM), which allow the translation of the loss of properties of a stressed interface. The numerical integration of these models will be carried out by using cohesive elements for the crack initiation/propagation within the chromium layer (vertical crack). In the case of delamination of the coating, i.e., when a crack propagates at the interface between the chromium layer and the substrate (horizontal cracking), we have chosen to use cohesive surfaces. They allow better management of the interfaces, especially when we do not want to assign a thickness to them. The behaviour of adhesive surfaces and cohesive elements is similar. In both cases, the damage is modelled by a traction–separation law [44].
When analysing the delamination of a coating from a discontinuity, i.e., a normal crack in the layer, it appears that the propagation mode is usually mixed and in varying proportions depending on the geometric configuration of the system and the distance from the crack tip to the free edge [44,45]. The combination of modes I and II is considered by implementing an initiation criterion and a mixed propagation criterion. The Benzeggagh–Kenane criterion [46] is typically used when the critical shear failure energies in the two plane directions are identical. The parameter 𝜂 that drives the mixed mode during the damage evolution phase is often set to 1. Since we do not have a test that allows us to independently determine the initiation stress of mode I and mode II, these stresses are assumed to be equal.
The parameters of the cohesive zone behaviour model for the simulation were evaluated by fitting a tensile test observed in a transverse view. The chosen experimental condition corresponded to chromium plating using Cr formulation under standard conditions. This condition showed adhesive failure at a local strain of 13.4%, corresponding to the average of all strains along the tensile axis determined by digital image correlation. This event determined the threshold stress for “cohesive surface damage” ( σ i 0 ). Since no experimental test was available to decide on the total energy required to break the cohesive surfaces, this value was equal to chromium’s intrinsic toughness.
The damage-initiation stress parameters for surfaces and cohesive elements were recalibrated by a trial-and-error method to match the experimental and simulated substrate deformation. For cohesive surfaces, failure was considered to occur when at least 80% of the surface was delaminated.
The numerical model developed was a two-dimensional model of the same size as the experimental observations, i.e., 240 μm by 320 μm. The layer thickness was 70 μm, and the test was strain-driven by controlling the displacement of the right edge of the modelled substrate (Figure 4). The model was simplified for the geometric description of the cracks. The cracks were straight and regularly spaced. The initial through-crack was modelled by splitting the nodes into the lines representing the cracks. The spacing between initial cracks was 80 μm. Cracks not yet open in the chromium coating were modelled by placing cohesive elements of type COH2D4 (Abaqus/CAE 2021). These elements had a width of 0.5 μm and a length of 1 μm. By experimental observations, the distance between the cohesive zones and the initial cracks was 40 μm. Therefore, the initial spacing between each crack was 80 μm. The bond between the coating and the substrate was modelled by a cohesive surface (here, the line in red (Figure 4)). The mesh was created outside the cohesive areas using planar 4-node quadrilateral plane stress elements CPS4. The size of the elements in the coating was 1 × 1 μm. Refinement was performed in the substrate to limit the model’s size and, thus, the computational time. The complete model consisted of 26,000 elements.
The behaviour of the 1.6747 substrate was of the elastoplastic type, considering nonlinear isotropic strain hardening. Tensile tests were performed for the characterisation. Young’s modulus was 210 GPa, and the yield strength was 800 MPa. The strain-hardening model was defined by considering all points of the rational stress–strain curve. Poisson’s ratio was assumed to be 0.33.
The chromium layer was of the elastic–fragile type. The parameters describing its behaviour were derived from the determination of the intrinsic properties of the coating presented in [43]. Young’s measured modulus was 180 GPa, and the yield strength was 5 GPa. Poisson’s ratio was assumed to be 0.21. The intrinsic cracking of the layer was modelled by cohesive zones whose behaviour was described by a threshold stress and a mode I degradation energy. In the absence of precise information, the mode I fracture energy was determined from the intrinsic chromium toughness K I C = 1.37   M P a m and the classical equation ( K I C = E G I C / 1 ν 2 ) in the same manner as Sebastiani et al. [47]. The mode I fracture energy was then G I C = 10   J . m 2 .

3. Results

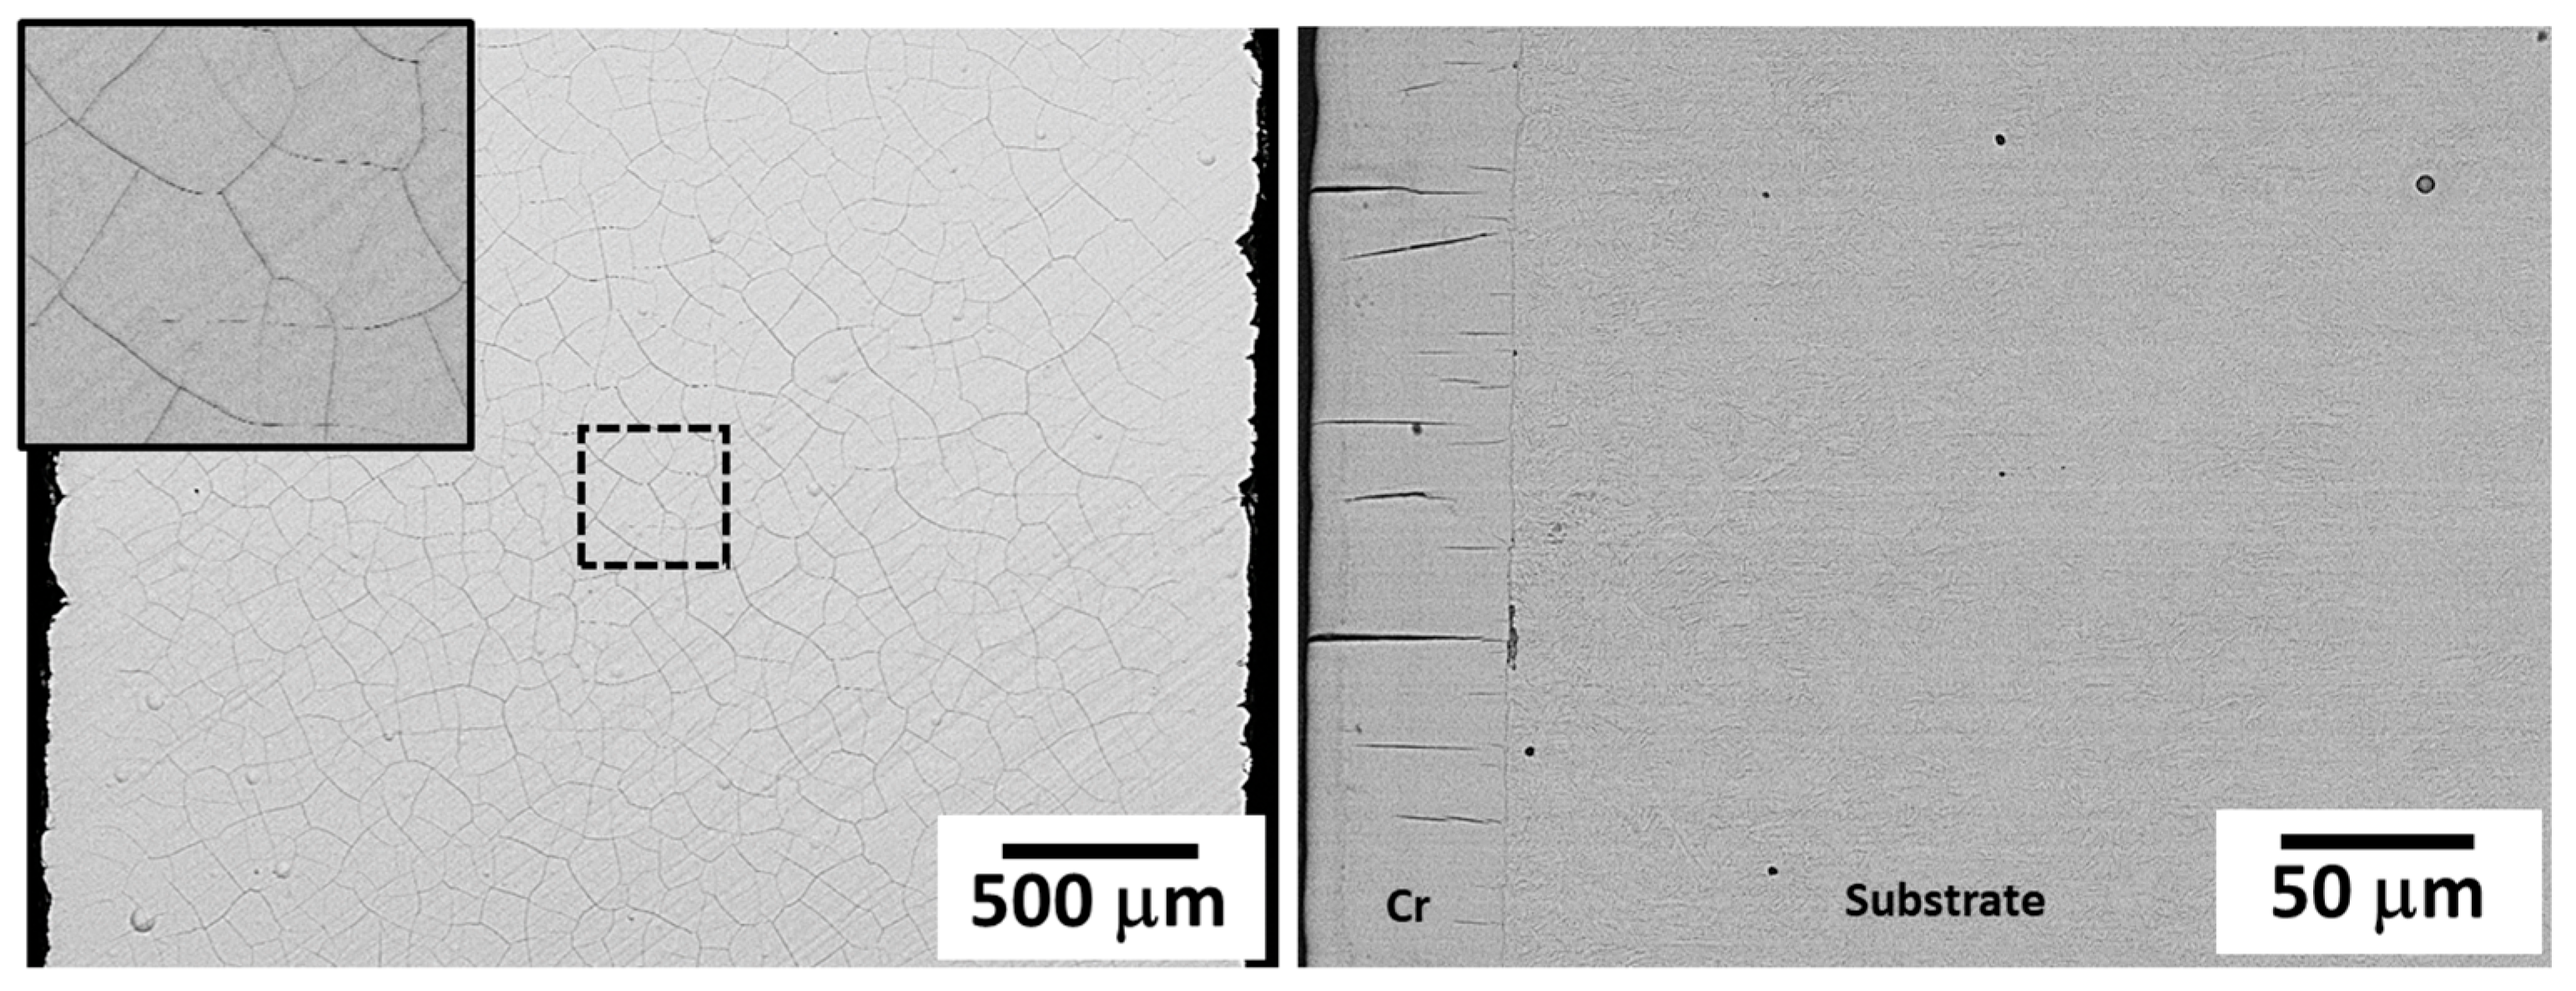
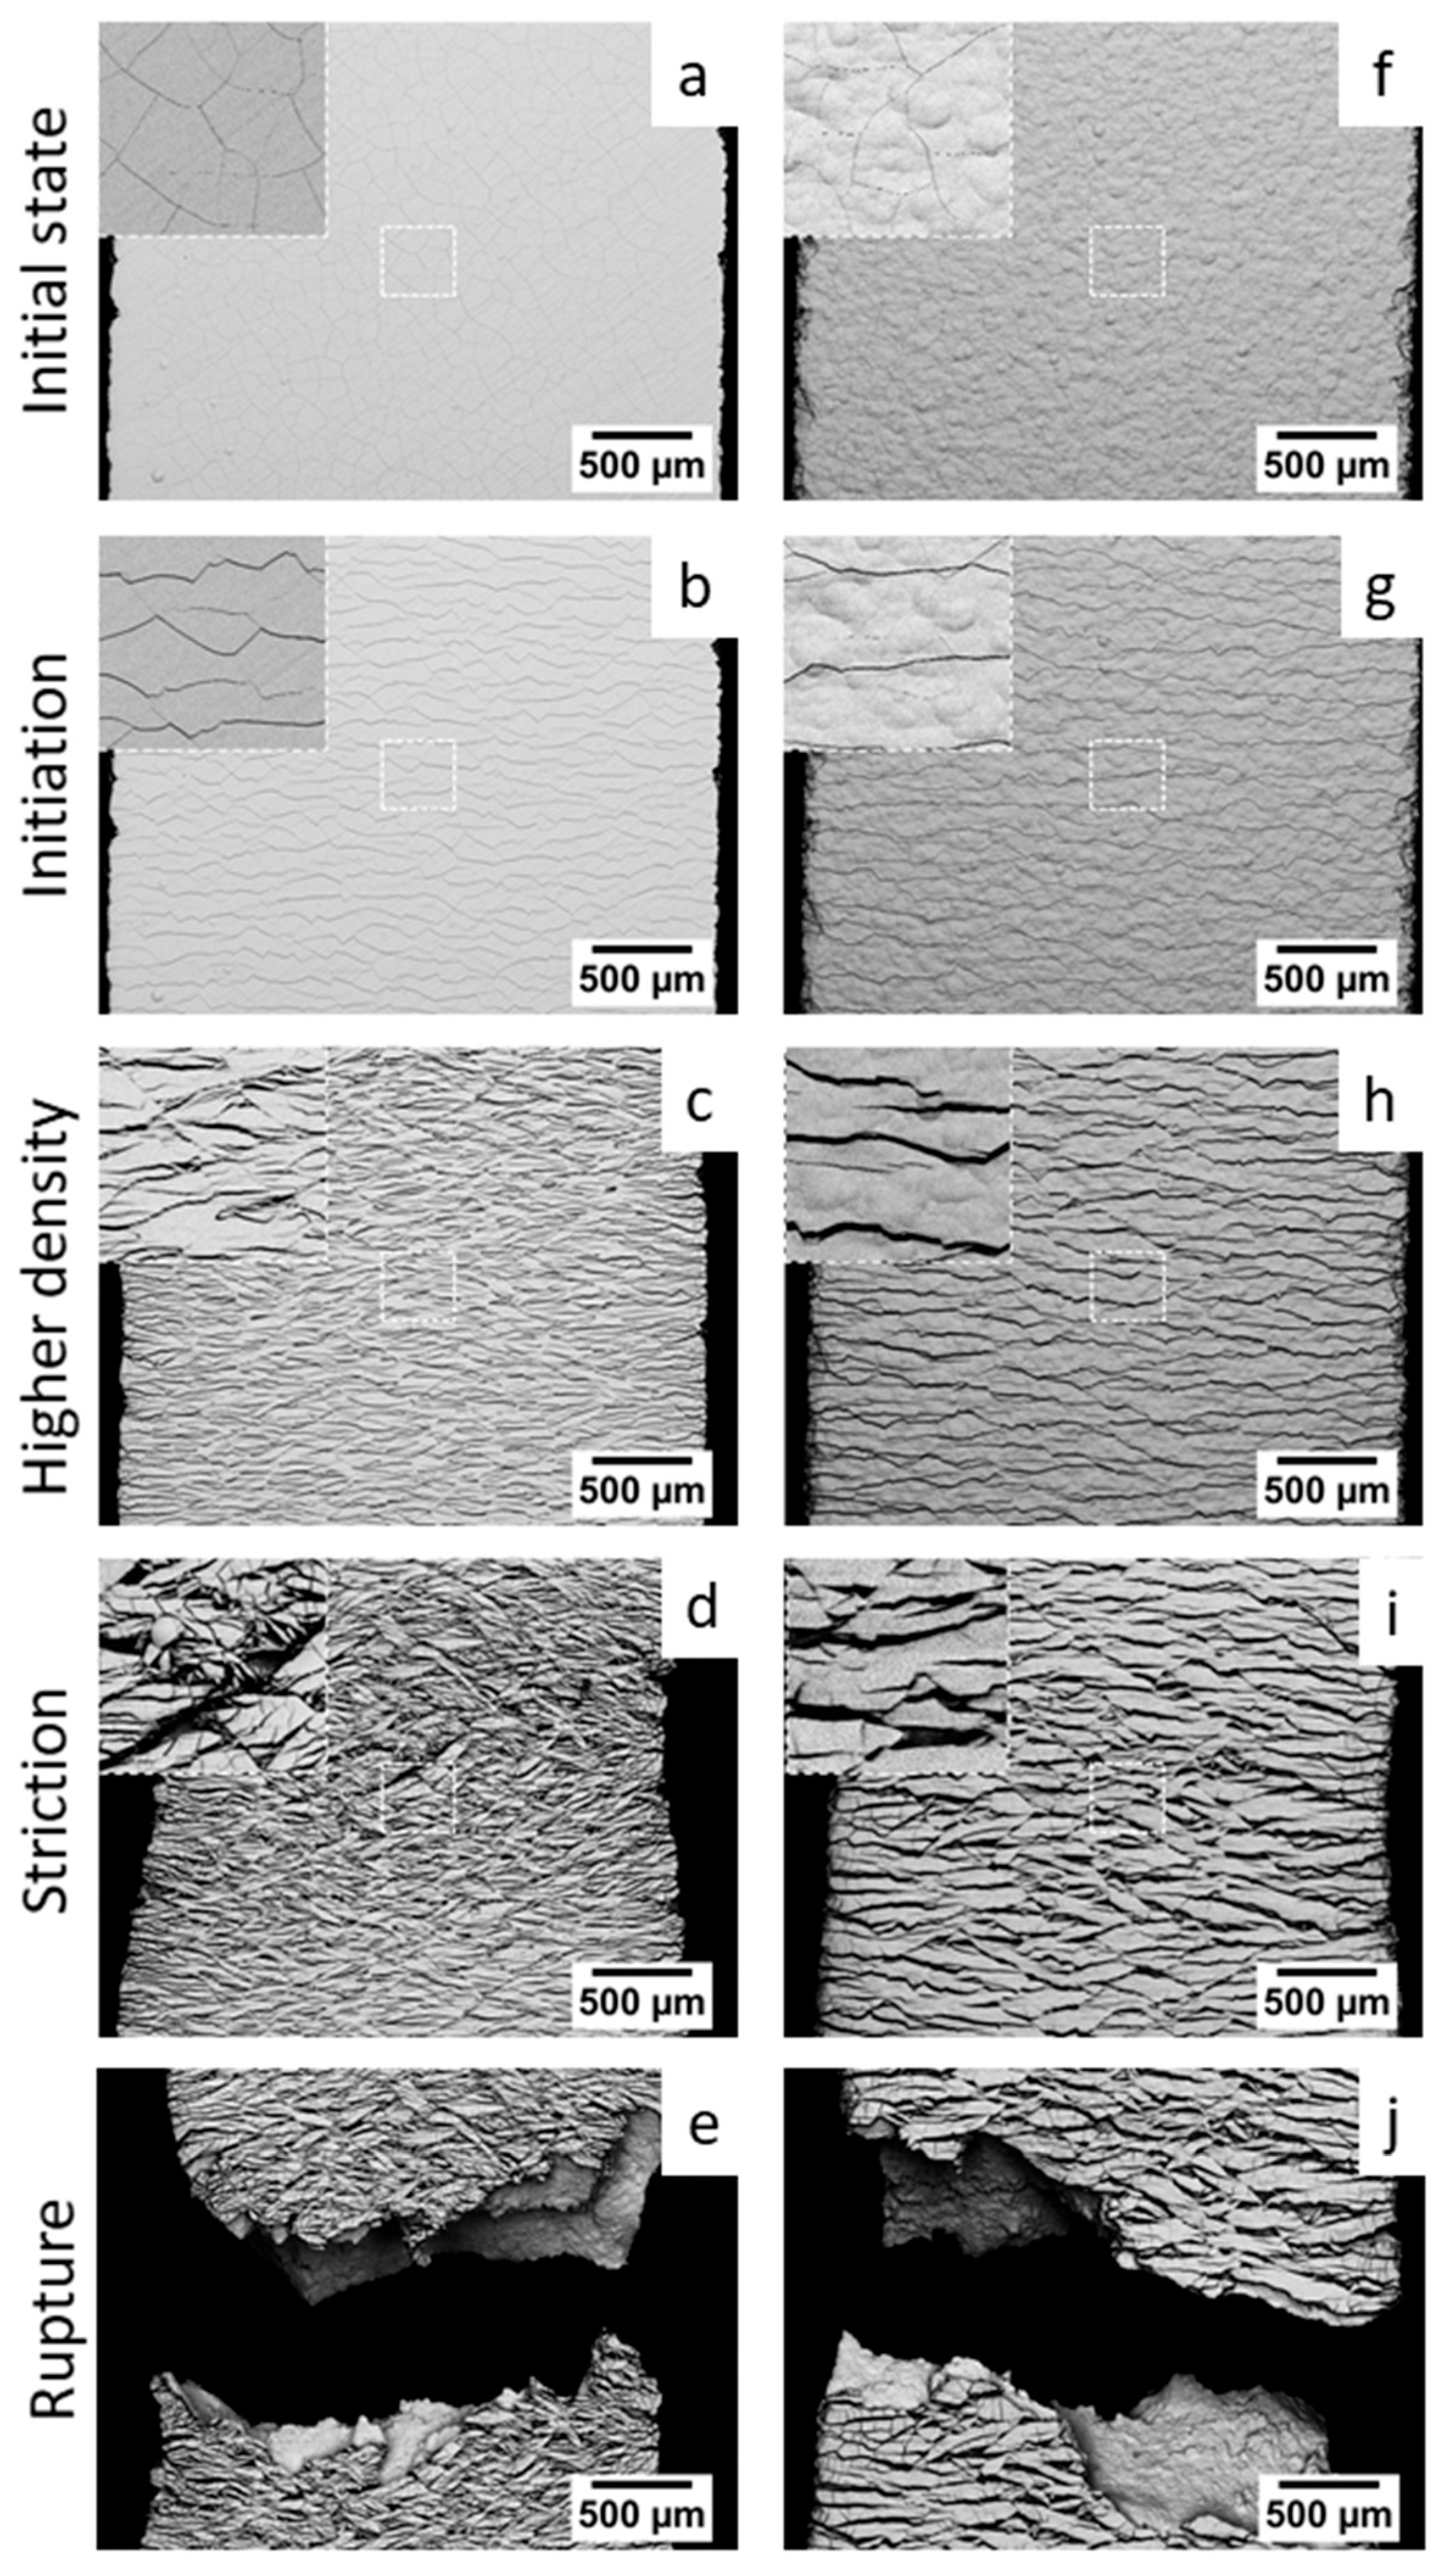
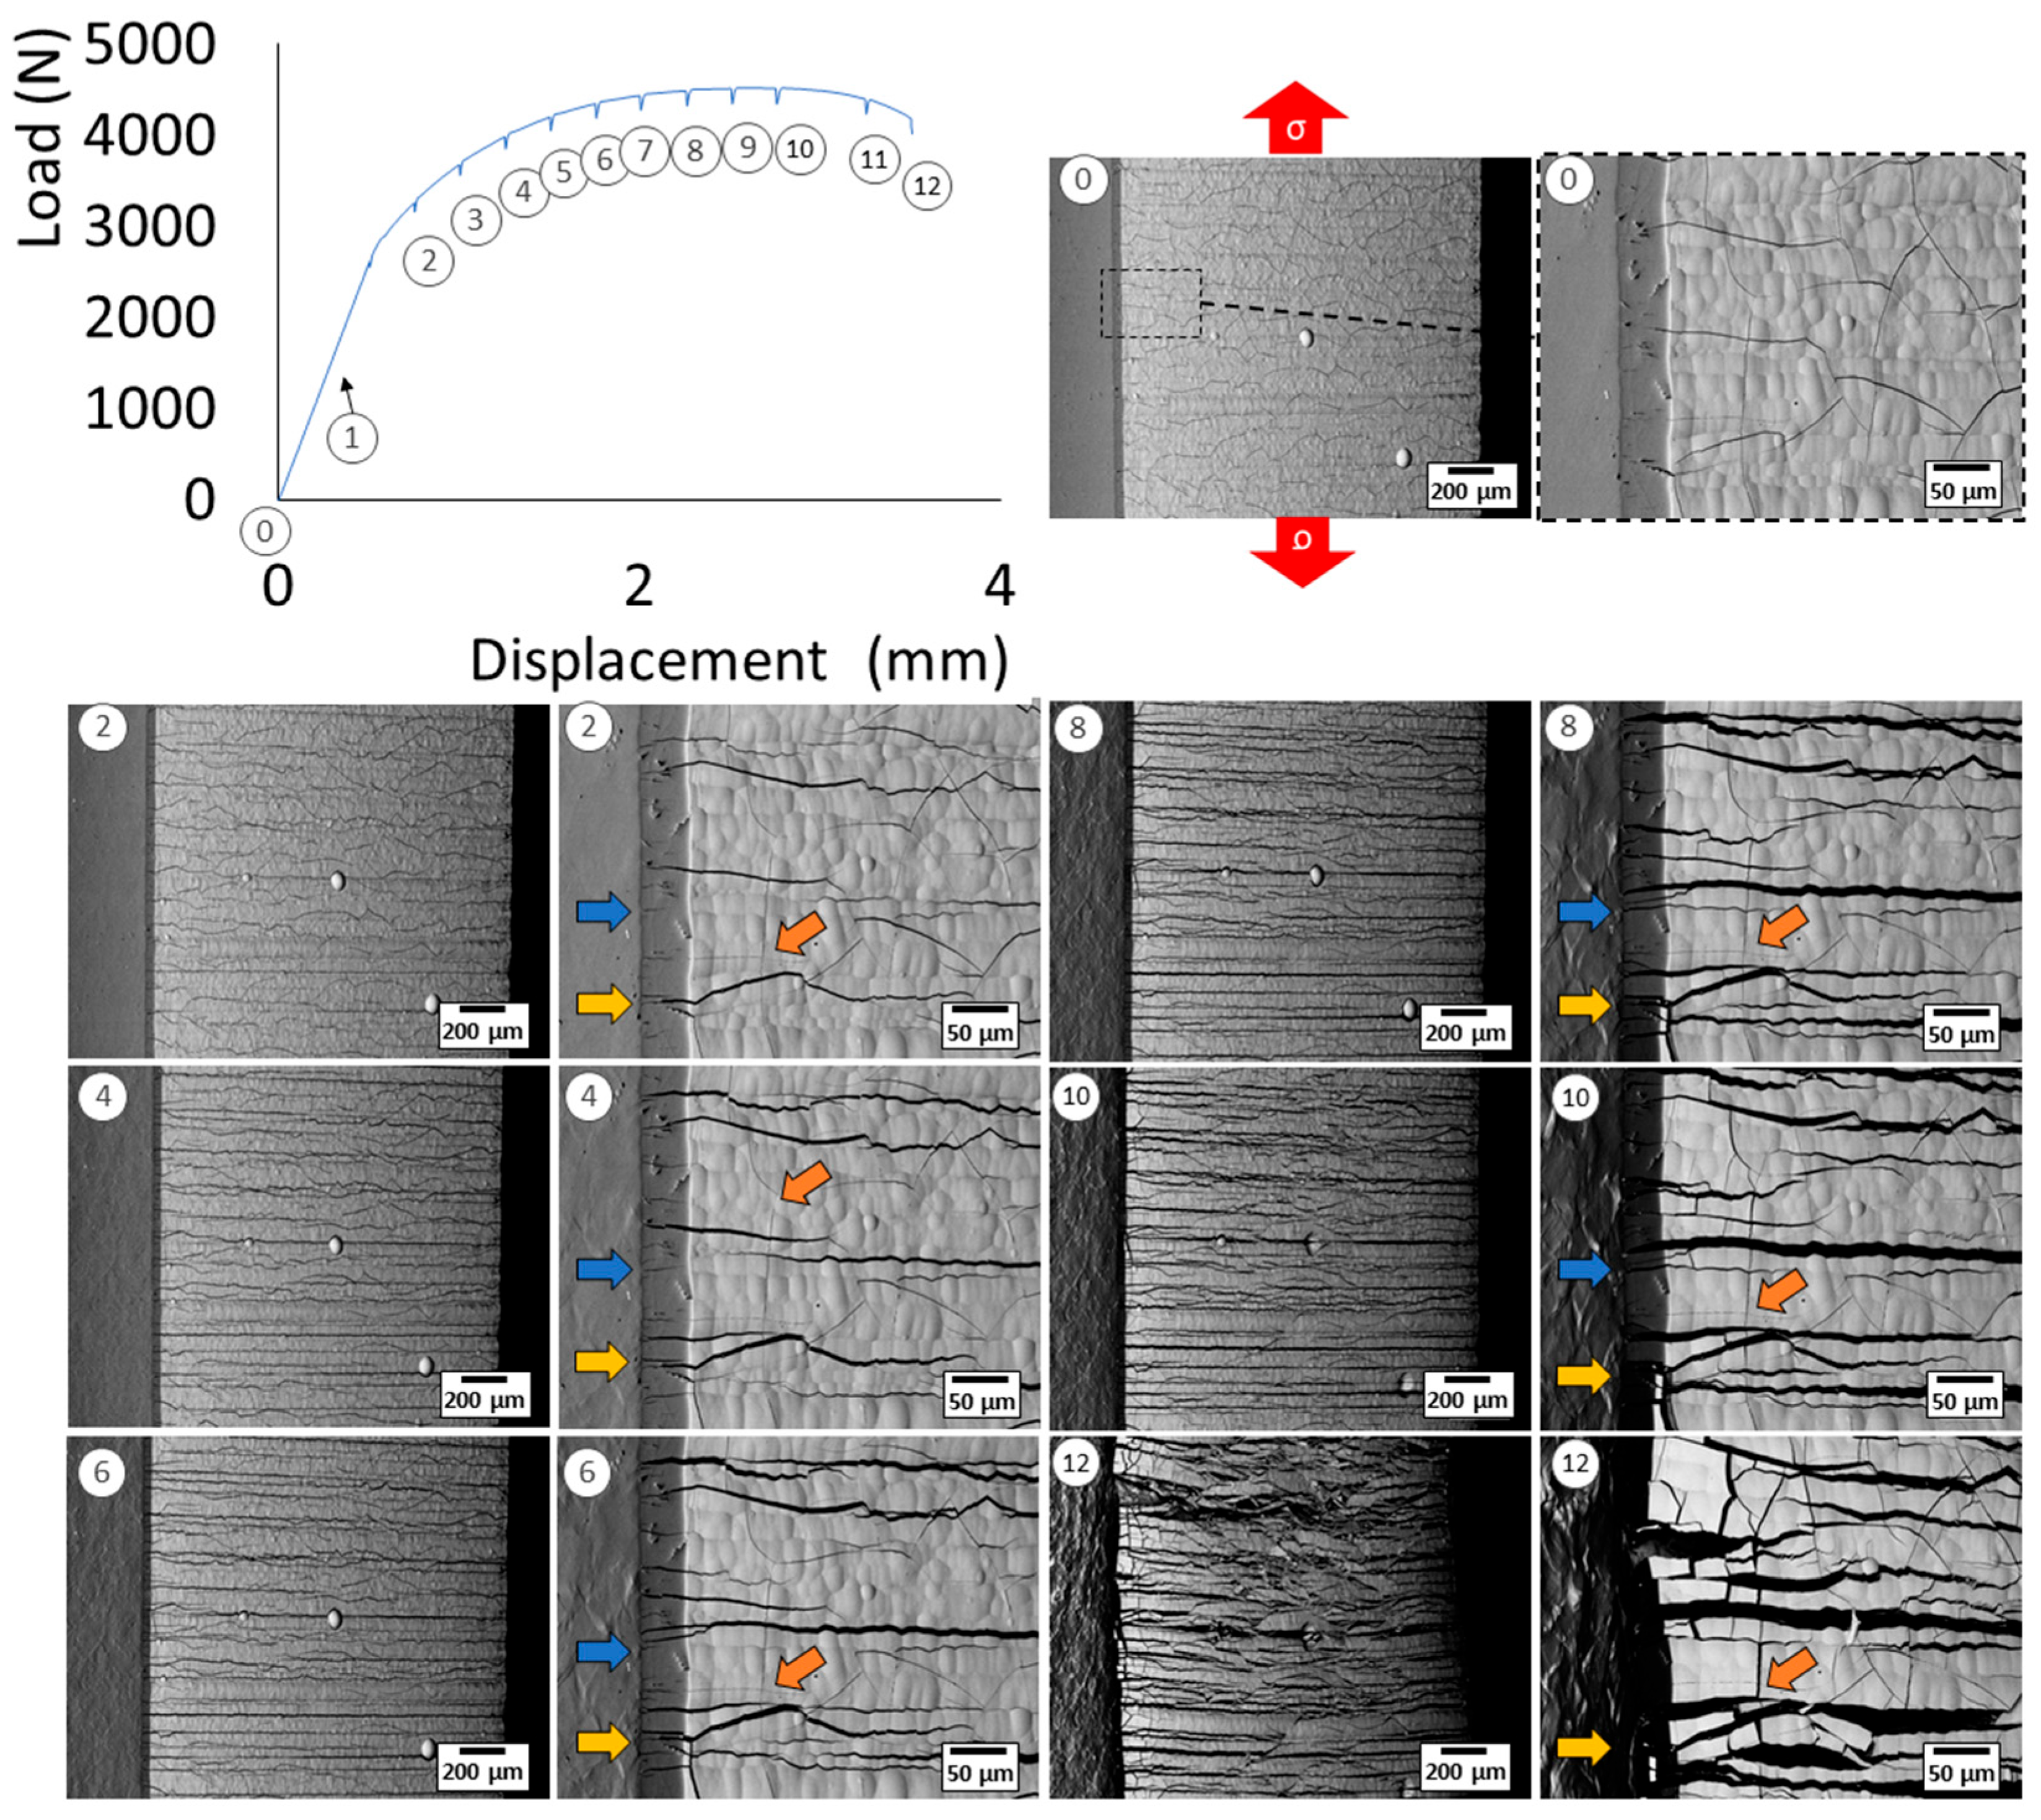
3.1. Damage Mechanism of Hexavalent Chromium Reference Coatings

The evolution of cracking during the tensile test was compared between the deposition of hexavalent chromium CrVI and that of trivalent chromium CrIII. The typical evolution of chromium cracking during the tensile test is shown in Figure 5. Four stages of cracking can be defined:
-
The initial state, corresponding to the density of cracks in the coating before loading;
-
Initiation, corresponding to the appearance of additional cracks perpendicular to the tensile axis;
-
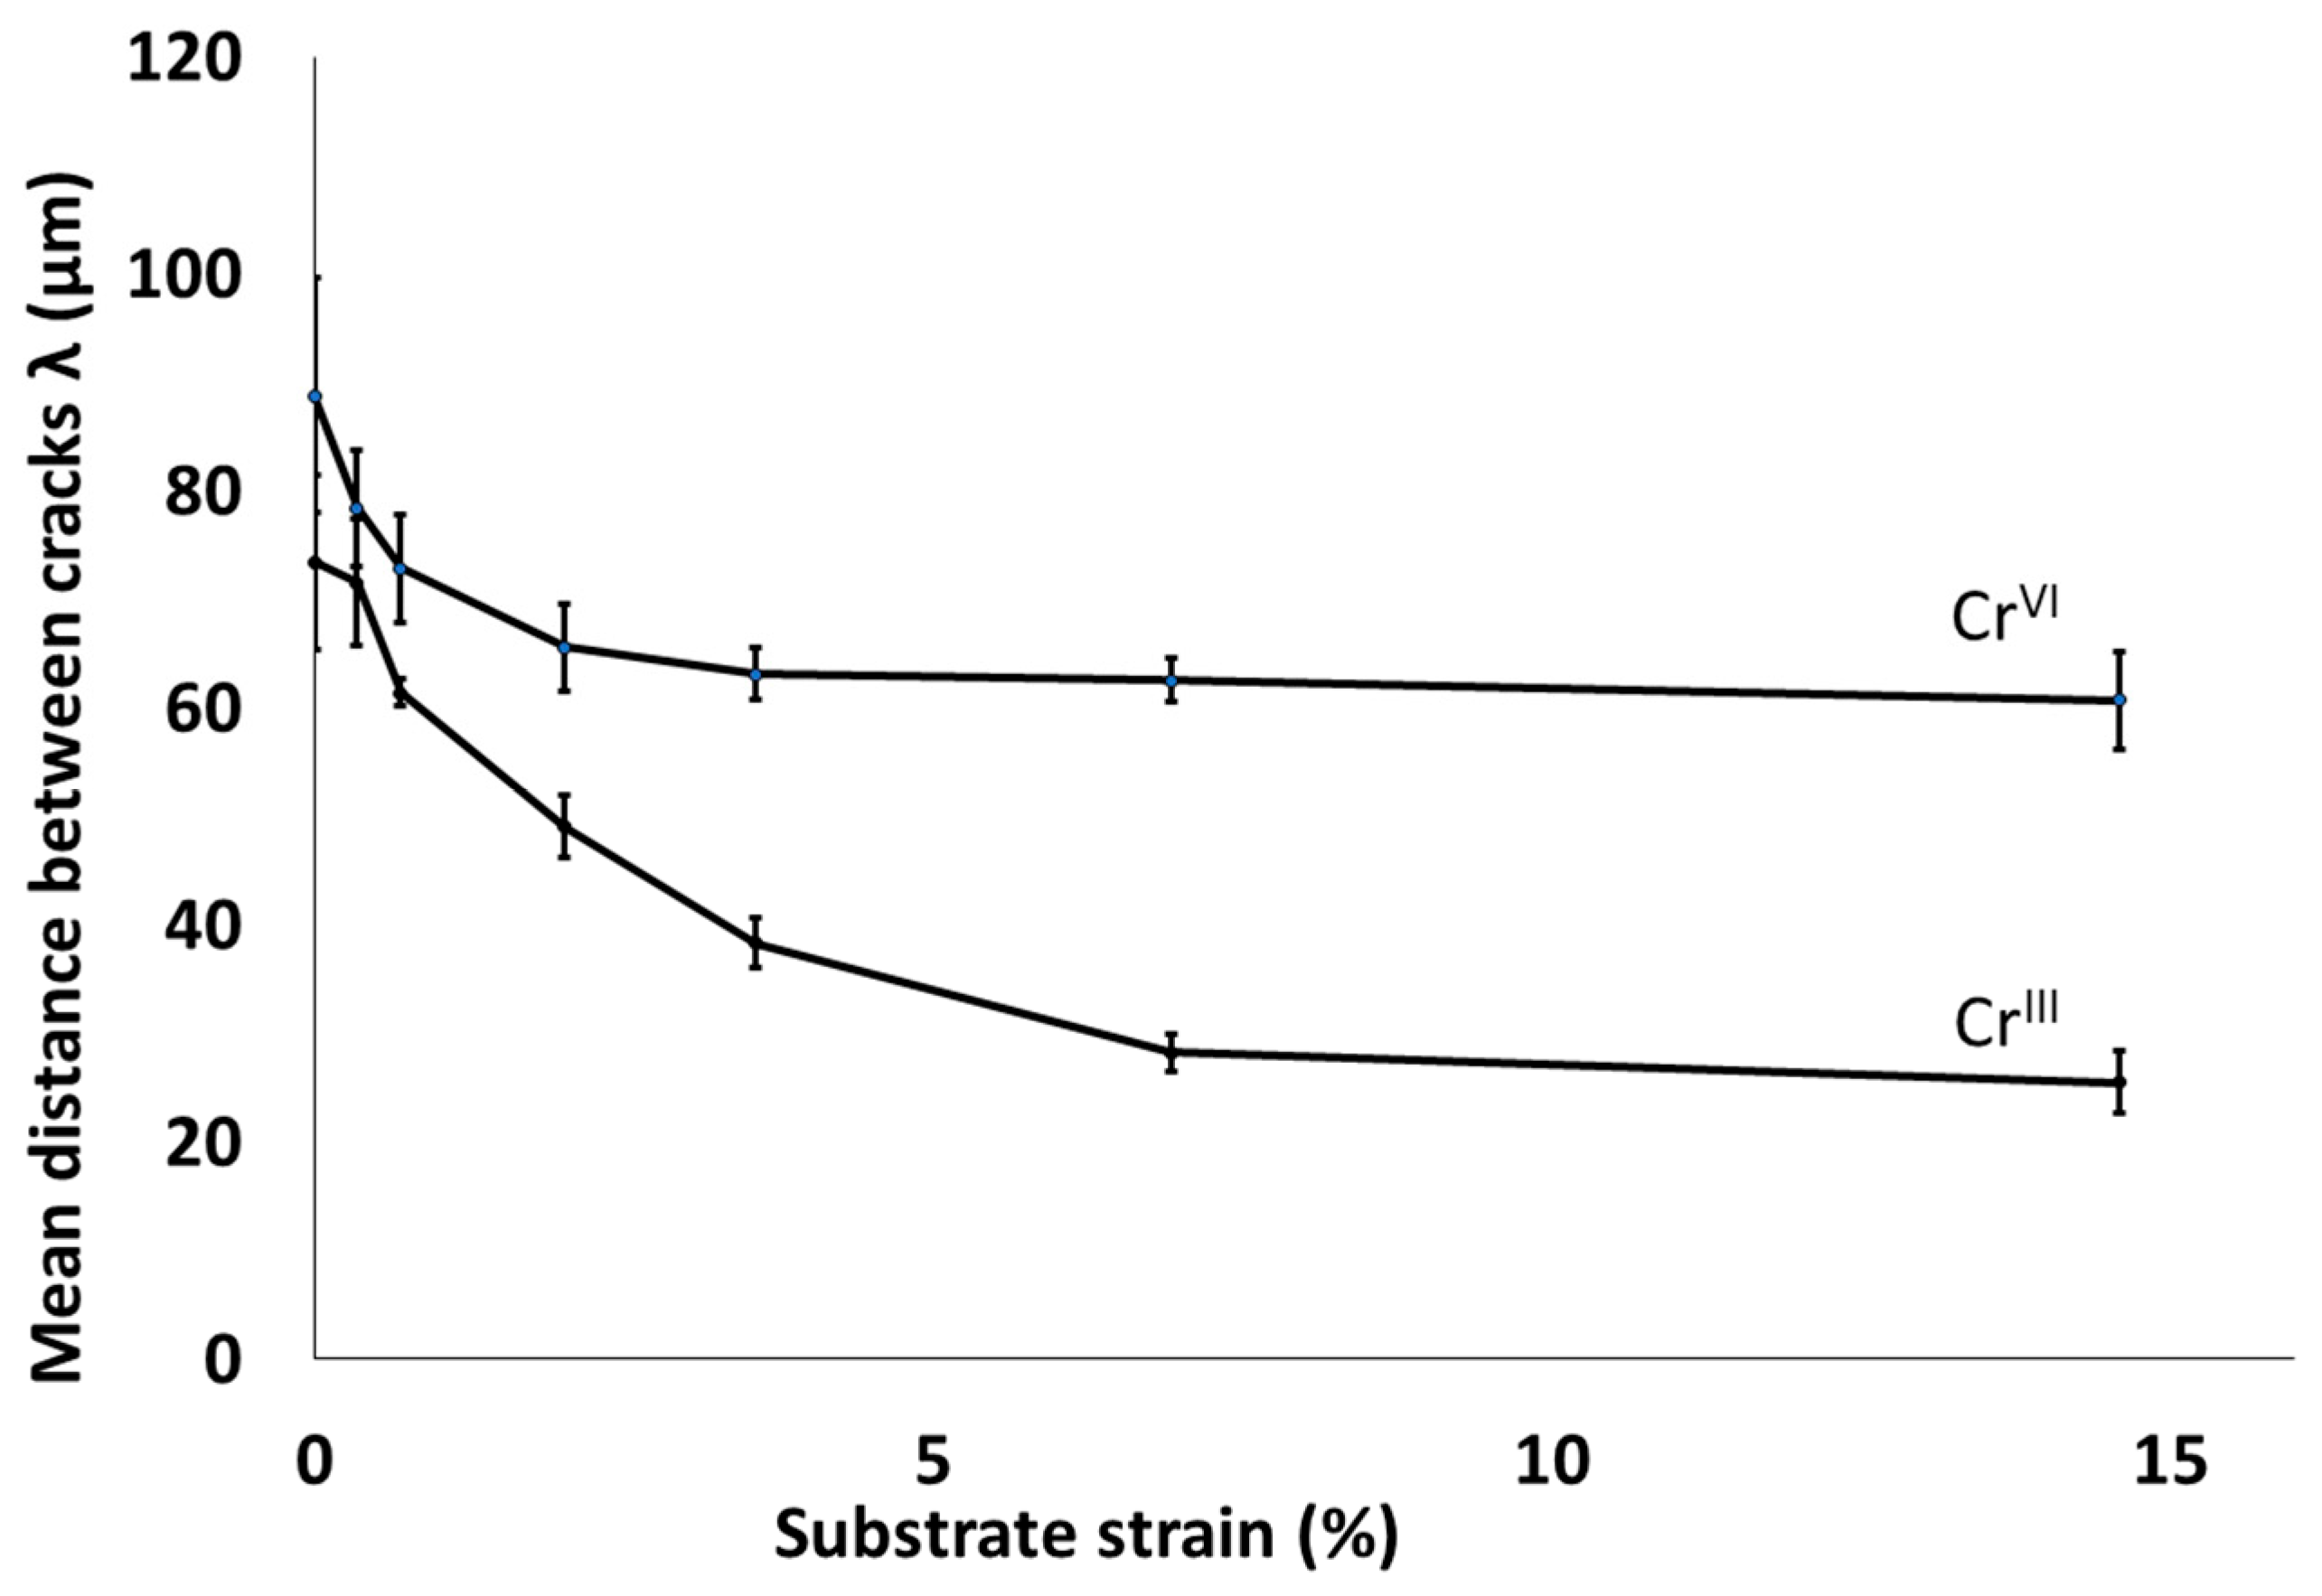
Crack propagation, corresponding to the evolution of the crack rate during the test (always perpendicular to the tensile axis);
-
Stabilisation, which indicates the end of the crack density evolution.
In both cases, an increase in crack density was effectively observed from the first stages of substrate deformation. This density then increased as the imposed deformation increased until it stabilised (Figure 6). Hexavalent chromium reached its maximum crack density between 2 and 4% strain, while trivalent chromium stabilised at around 7%. The minimum crack spacing (𝜆), the length between each crack when the maximum cracking rate is reached, also differed between these coatings. Hexavalent chromium stabilised at a 𝜆 value of 60 μm, while trivalent chromium stabilised at a 𝜆 value of around 30 μm. This difference could be attributed to the differences in intrinsic mechanical properties between these two types of coatings. Indeed, CrIII coating has been shown to exhibit brittle behaviour with much lower toughness than hexavalent chromium, with values of 1.37 MPa√m and more than 5 MPa√m, respectively [43].

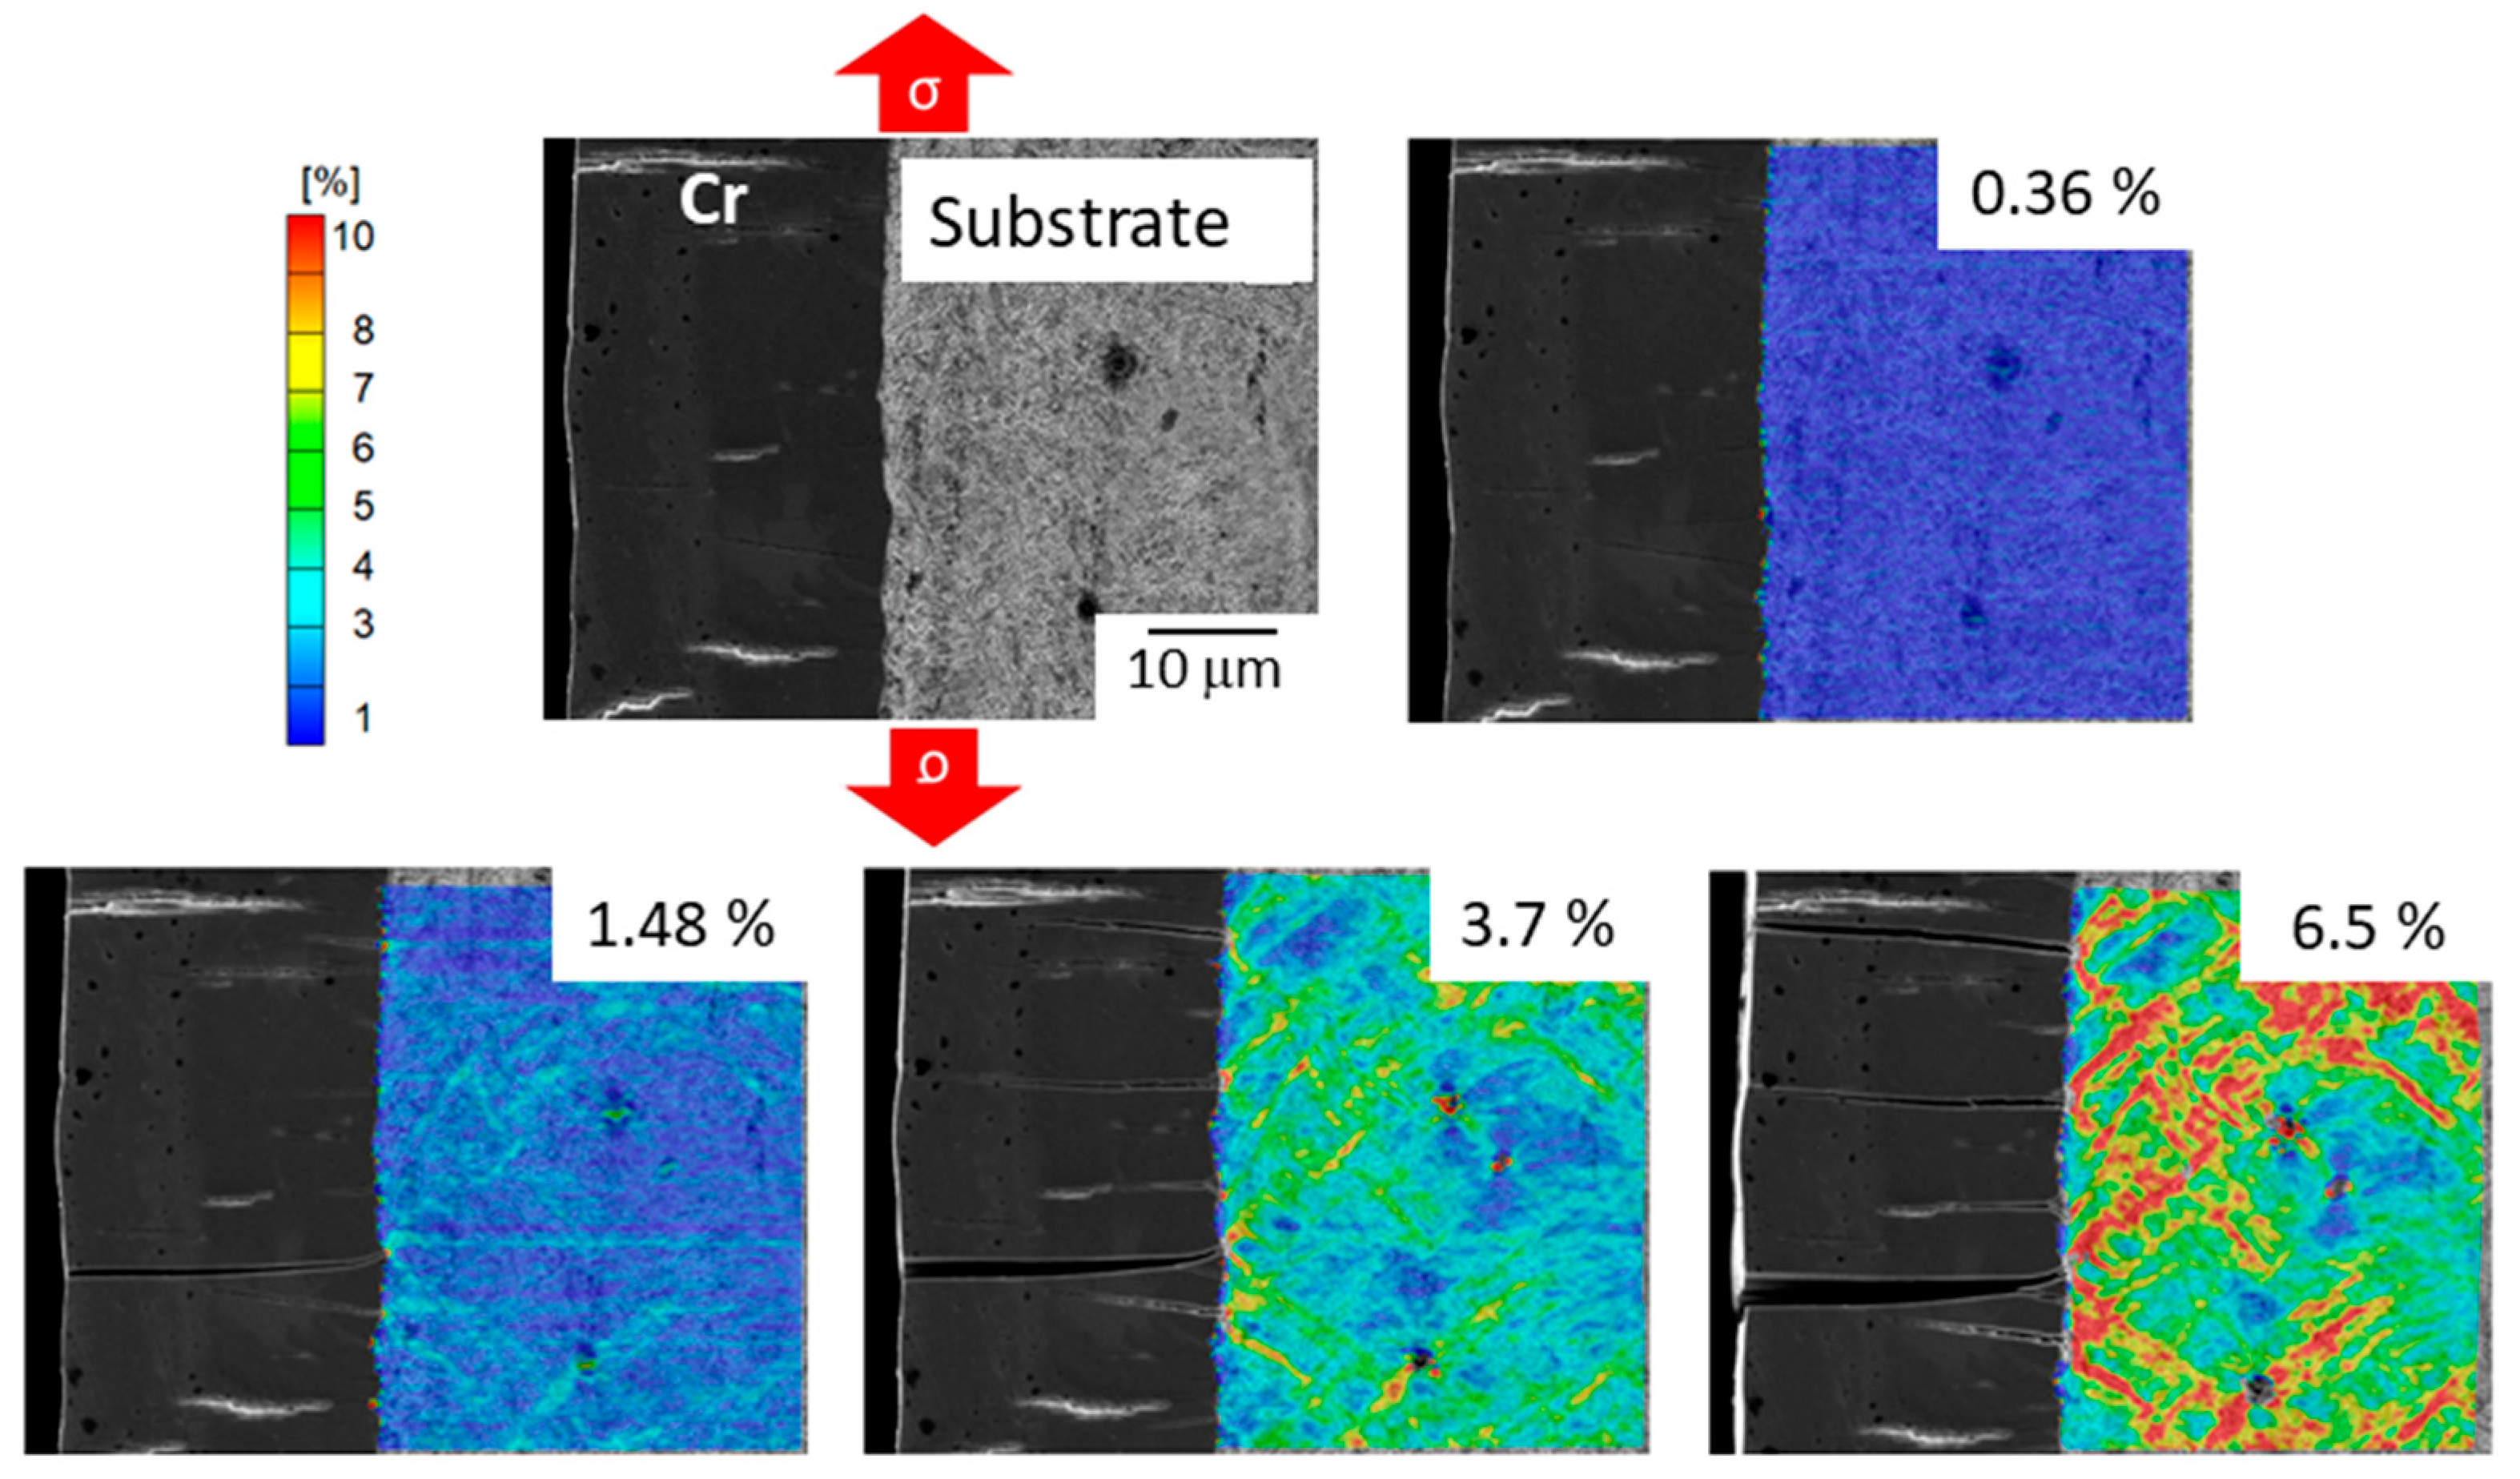
3.2. Damage Mechanism of Trivalent Chromium Coatings

The crack evolution was characterised by different thicknesses of trivalent chromium coatings developed under the same conditions (Figure 7). Only the deposition time was varied to obtain coatings of different thicknesses. Regardless of the thickness of the coatings, the crack density increased with the applied strain rate. However, it was evident that the crack density varied with the thickness of the coatings for a given strain rate.
The initial crack density was highly dependent on the thickness of the coating. The crack density of the 10 μm thick coating was 3.5 times greater than the 50 μm thick one, while it was five times greater for the 100 μm coating. However, the increasing strain imposed by the substrate during the test tended to reduce these differences. A significant increase in crack density was observed for the 100 μm coating, in contrast to the 10 μm coating, which evolved very little. The crack evolution of the 50 μm coating was intermediate between that of the other two coatings. Therefore, the cohesion of chromium is strongly influenced by its thickness.

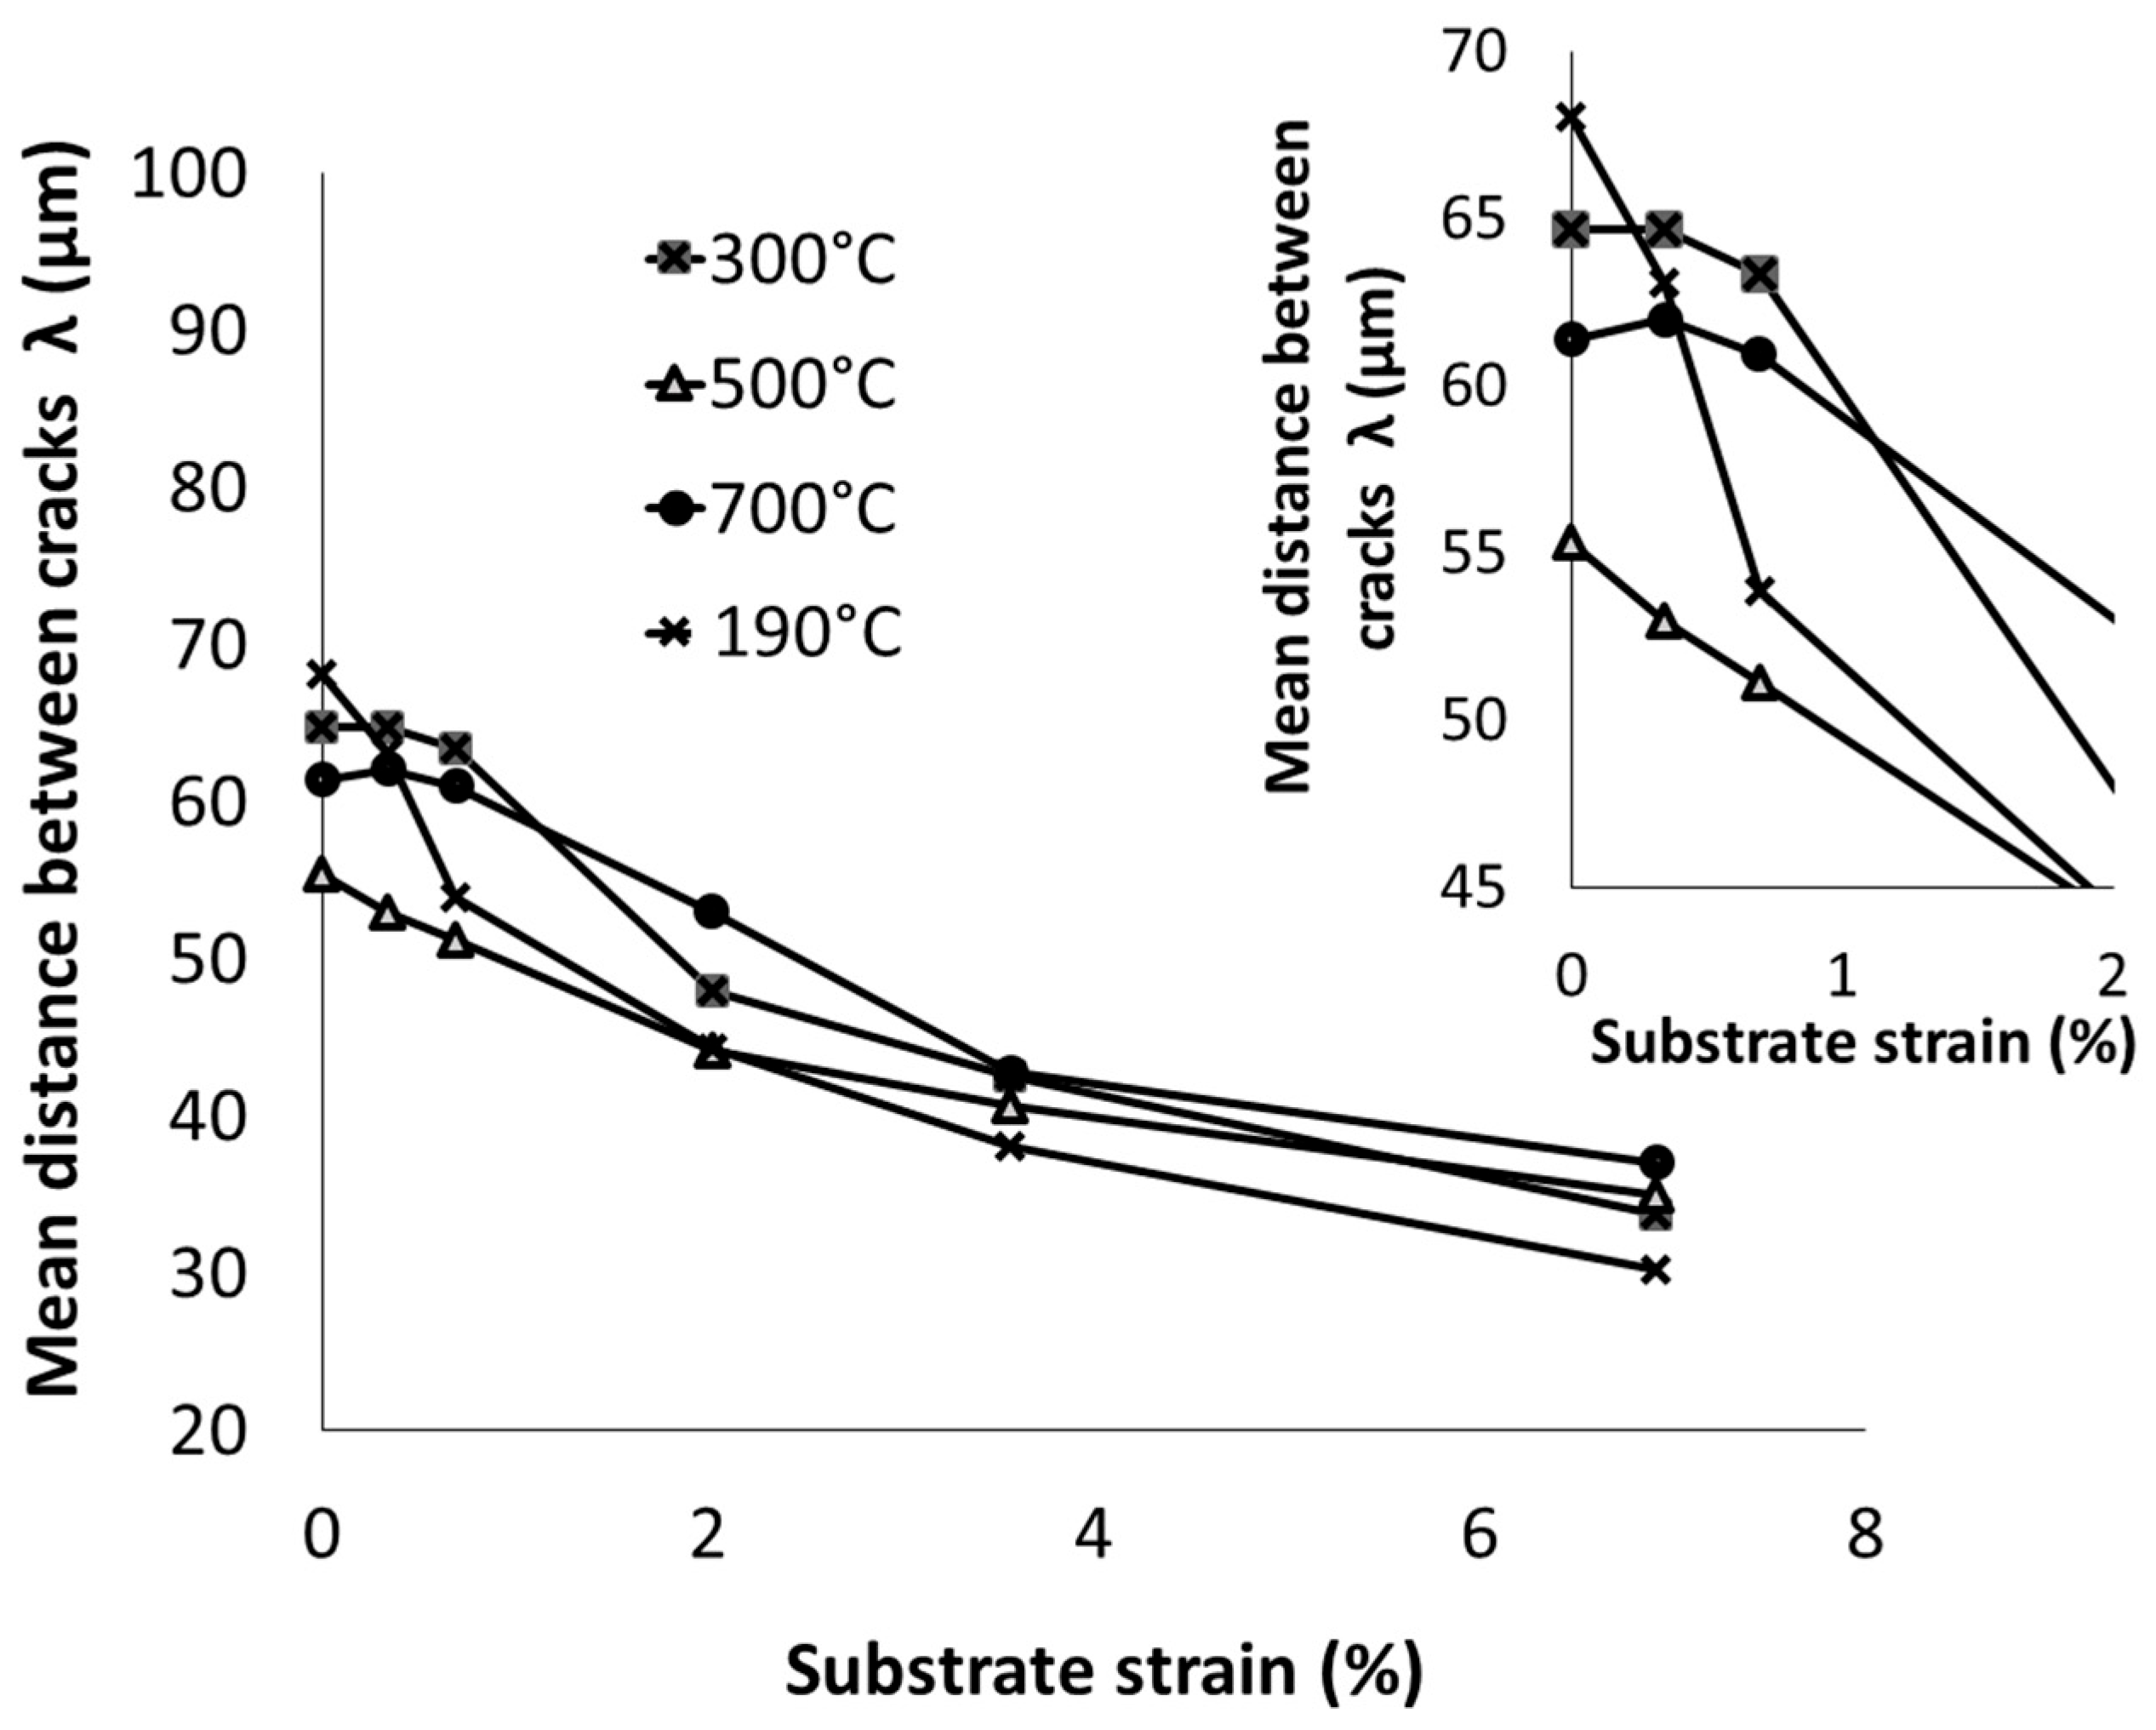
3.3. Damage Mechanism of Trivalent Chromium Coatings Post-Heat Treatment

The influence of the post-heat treatment on the evolution of surface cracking of chromium during the tensile test was also characterised. For this purpose, three post-heat-treatment temperatures (300, 500 and 700 °C for 1 h) were studied and compared with the average curves obtained without heat treatment under standard conditions. The results are shown in Figure 8. The crack density for a 7% substrate strain decreased slightly with increasing heat-treatment temperature. The evolution of the crack rate seemed to follow the same tendency, regardless of the condition tested for strains between 1 and 7%. On the other hand, in the early stages of deformation, the specimens subjected to post-heat treatment at 300 and 700 °C showed a stable crack density (up to 0.7% substrate strain).
The authors’ previous work shows that the application of heat treatment reduces the level of residual stresses in these coatings, where they can vary from 479 MPa for untreated amorphous samples to low compressive stresses after 1 h at 700 °C [48]. Therefore, the stresses in the layer are lower than for the degassed specimens. A more significant deformation of the substrate would consequently be necessary to reach the same stress level in the coating and, thus, cause its cracking. This could partly explain this phenomenon. In addition, they also show that chromium crystallisation occurs at temperatures between 250 and 300 °C. Microstructural rearrangements are, therefore, expected, and in particular, we were able to show a significant gain in the intrinsic toughness of chromium toughness from 1.37 to 2, for example, for a treatment at 300 °C [49]. This could also contribute to delaying the damage of the layer during these first levels of substrate deformation. However, this “delay” in damage was not observed for the specimen treated at 500 °C. Nevertheless, a slight increase in crack density was observed for the first few strains. In this case, we assume that the carbide precipitation leading to the hardness peak could accentuate the brittleness of the coating. This would not allow it to accommodate the deformations.

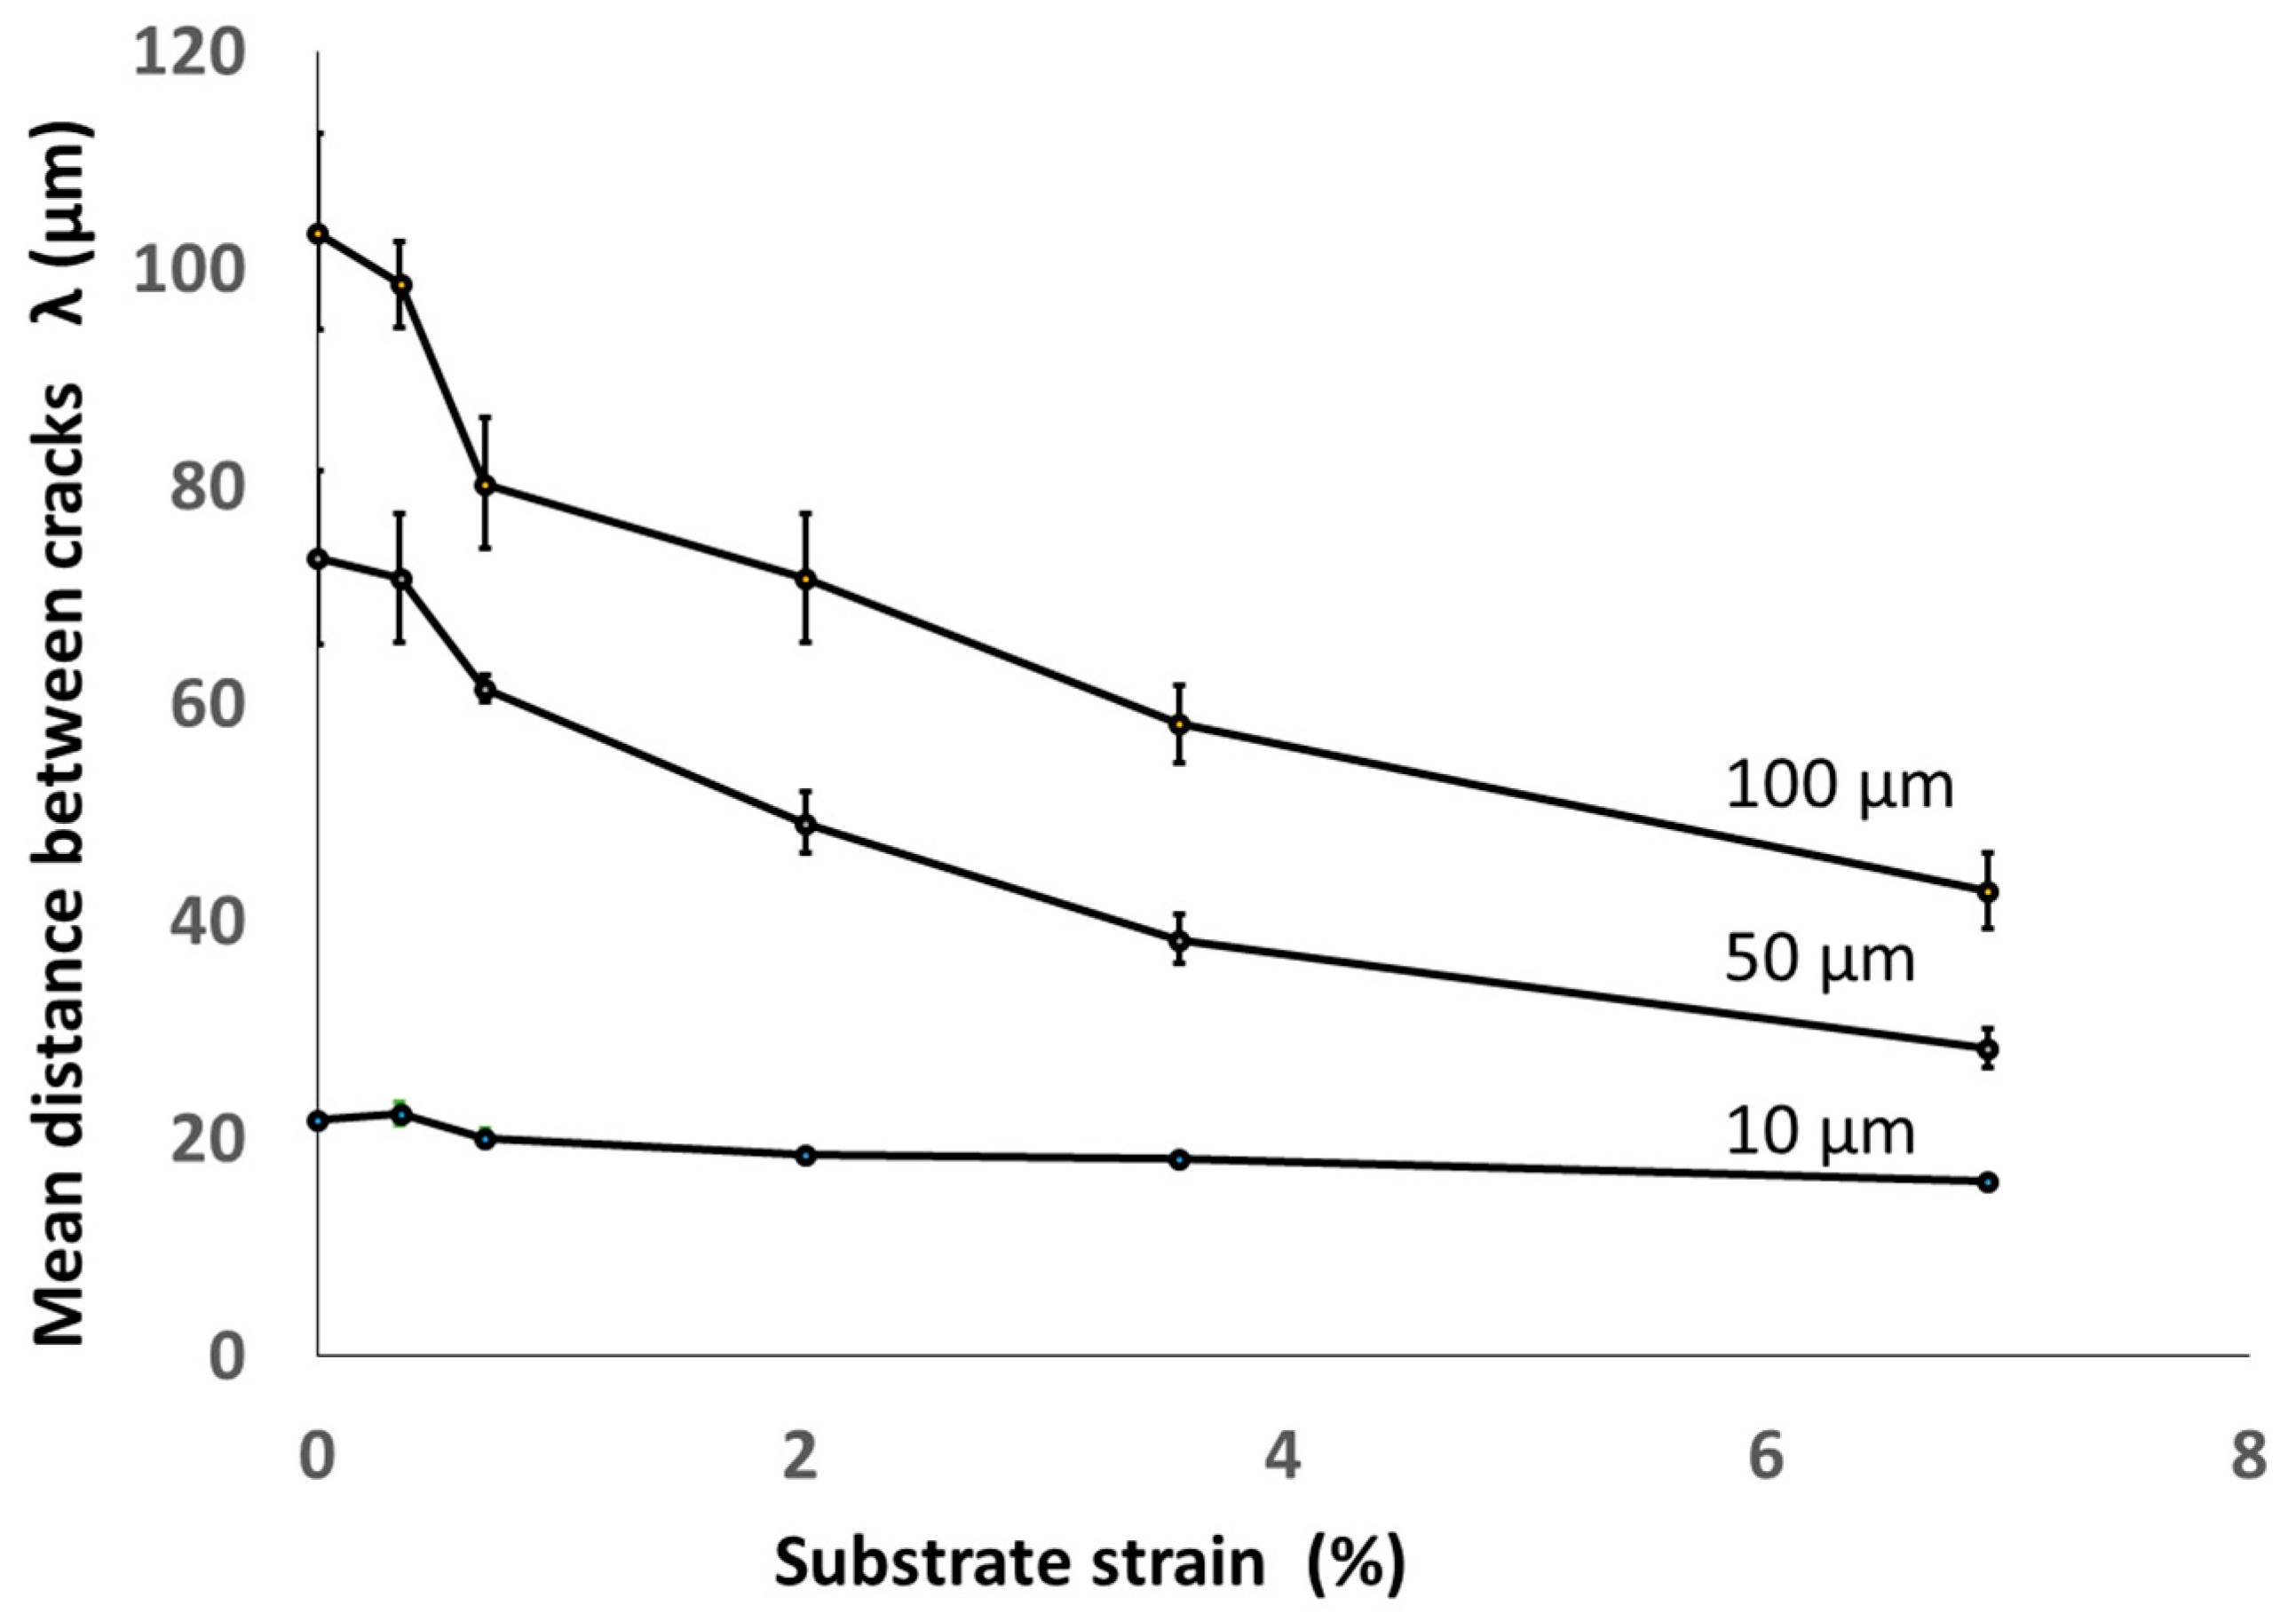
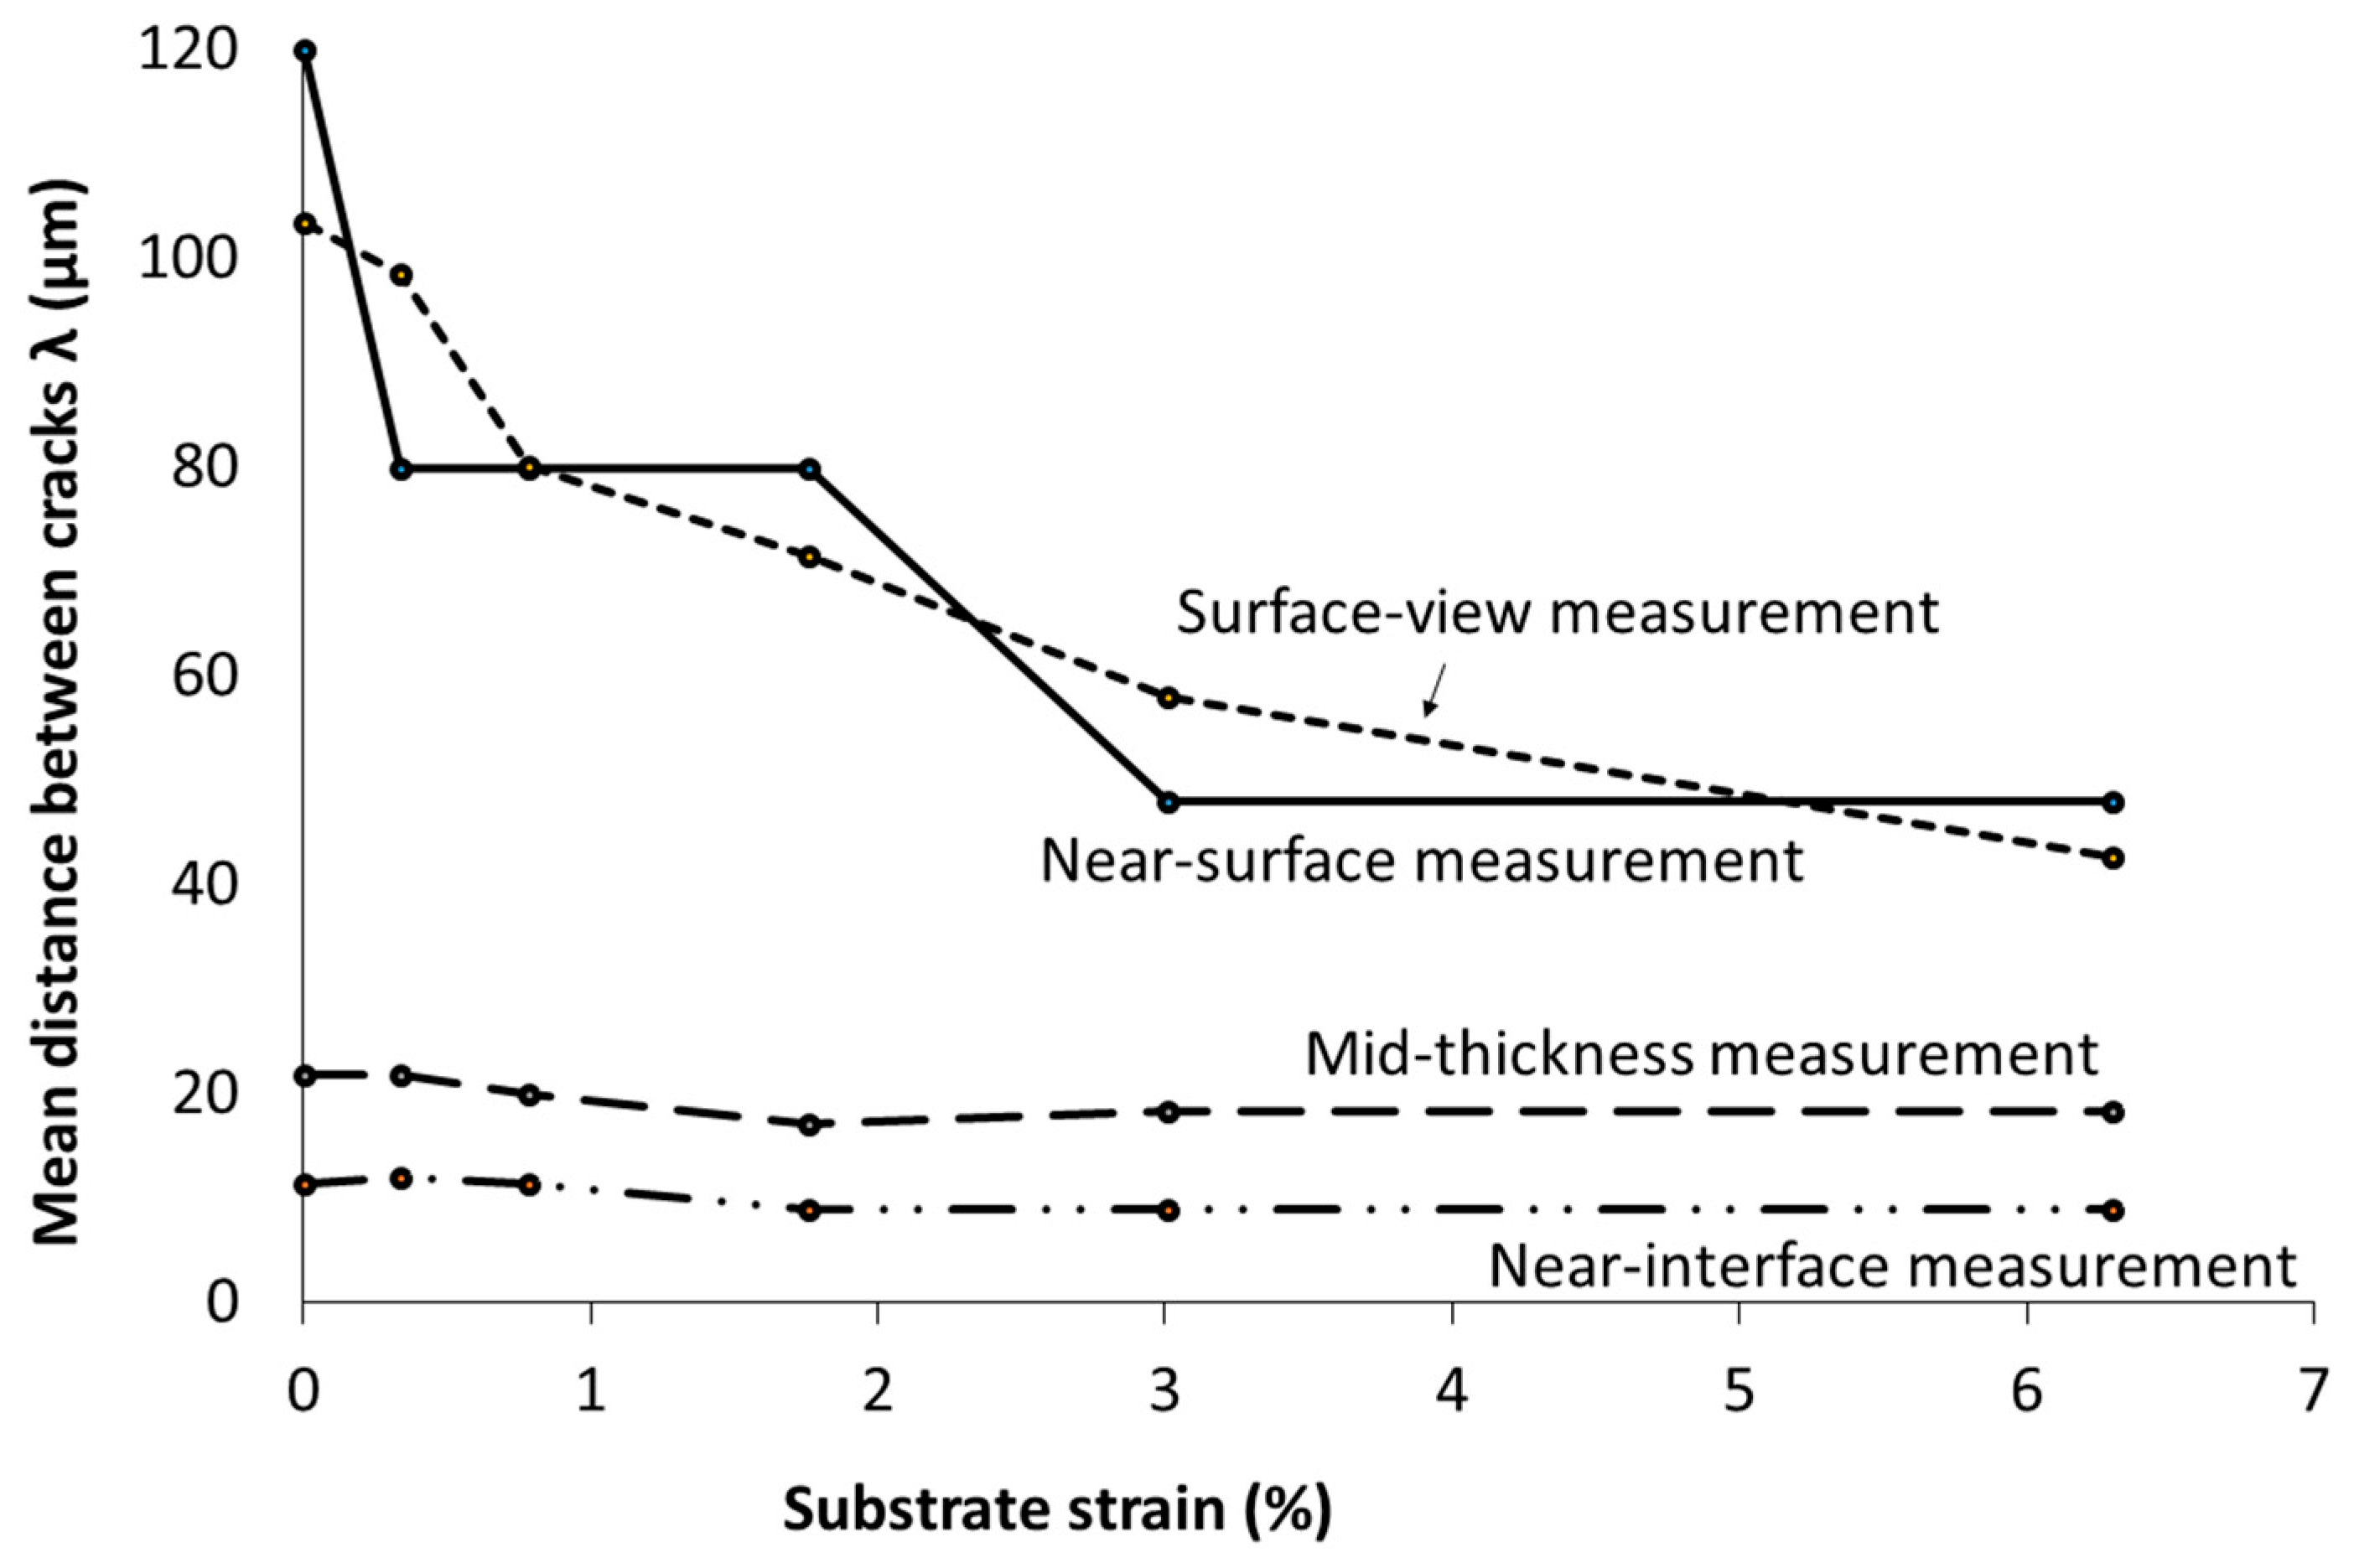
3.4. Study of the Evolution of Cracking in the Thickness of Coatings

First, to link the observations conducted on the surface and in the slice, tests were performed by tilting the specimen in the SEM by 50°. This orientation of the specimen allowed simultaneous observation of the cracks on the surface and in the thickness of the coating. Figure 9 shows a sequence of observations obtained by scanning electron microscopy as a function of the deformation imposed. These observations, obtained by scanning electron microscopy, were carried out in the same zone to follow crack initiation and propagation as a function of the imposed deformation level. The same area was observed for two magnifications (×150 and ×750) for each deformation level. Several conclusions can be drawn. First, these observations confirm that the cracks initiated and propagated mainly in the direction perpendicular to the tensile stress direction. On the other hand, pre-existing cracks appeared to play a role in crack initiation during the tensile test. Only transversely oriented precracks developed or joined during the tensile test (Figure 9: blue arrow). The large precracks, which initially extended through the thickness of the coating, continued to grow as a function of the imposed substrate deformation (Figure 9: yellow arrow). Finally, the cracks parallel to the load widened only after the specimen had been stressed (Figure 9: orange arrow).
Further tests allowed us to determine the crack propagation through the thickness of the coatings. A sequence of SEM micrographs taken from the specimen section during the tensile test is shown in Figure 10. Cracking began at an initial crack near the interface and propagated toward the coating surface (Figure 10: blue arrows). A selection of initial precracks occurred. Initial cracks close to a crack propagating toward the surface were ‘stable’ up to a given level of strain (Figure 10: yellow and orange arrows). They could also create a new through-thickness crack and, thus, reduce the mean crack gap previously measured at the surface (Figure 10).
To confirm the mechanism involved in crack propagation through the coatings’ thickness, a quantification of crack density as a function of distance from the interface was performed. For each test, the crack density was measured for three positions from the coating/substrate interface: a first reading just under the top surface, a second at half-thickness and, finally, a reading just above the interface (Figure 11). The crack density was minimal near the substrate/coating interface and increased toward the top surface. The average spacing between cracks was approximately 20 microns at mid-depth and 10 to 15 microns near the interface. These averaged values, which are very close, changed little as a function of the imposed strain. The situation was quite different for cracks located near the top surface of the coatings. For the latter, the initial average distance was higher than 100 microns and decreased to 40 microns for an imposed substrate strain greater than 6%.
These changes in crack density across the thickness of the coatings confirmed the crack initiation and propagation patterns previously observed under tensile loading. The strain imposed on the coating by the substrate appeared to “activate” the propagation of some pre-existing cracks near the interface. Their number depended on the average strain rate of the substrate. To understand why only a few cracks among all those present at the interface propagated, local strain measurements of the substrate were performed by image correlation.
Figure 12 shows the typical evolution of the substrate strain during the tensile test. The use of natural speckles on the 1.6747 alloy allowed the use of image correlation at different magnifications. At ×2500 magnification, the spatial strain resolution (Rse) was lower, allowing a more localised description of the strain distribution. During the tensile test, shear bands were observed in the plasticity region. They manifested as strain concentrations in the form of bands oriented approximately 45° to the tensile axis in the substrate.
The slip bands rejoined at the open cracks near the chromium–substrate interface. Strain appeared localised only in the shear bands, relaxing the surrounding areas. The result was a considerable heterogeneity of strain along the interface. We show that the uniaxial tensile test does not allow the imposition of a homogeneous substrate strain in the plasticity domain of this type of substrate.
This heterogeneity of the substrate strain hypothetically explains the saturation phenomenon of the surface crack rate observed in the previous paragraphs. Indeed, despite the increase in the strain in the homogeneous plasticity domain of the substrate and the absence of chromium adhesion losses, we observed a stabilisation of the surface crack density for both hexavalent and trivalent chromium.
Therefore, we can hypothesise that when the substrate enters the plasticity domain, stress concentrations are located at the interface at the level of the cracks. These concentrations will select the activation of slip bands near the interface. The high strains near the cracks with stress concentrations will cause the cracks to open at the intersection of the bands. As the tensile test continues, new cracks open under the stress imposed by the substrate strain at the interface. Eventually, the stresses concentrate only in the shear bands, relaxing the surrounding material and preventing new cracks from opening. As a result, the deformation is concentrated only in the shear bands, causing the cracks to widen and stopping the propagation of the surrounding cracks.

3.5. Estimation of a Numerical Adhesion Criterion

The cross-sectional view configuration was used to develop a 2D numerical model of the test. This configuration is advantageous because it allows simultaneous observation of the interface and the evolution of the crack in the chromium. Therefore, it was used as a comparative experimental scenario to evaluate interface delamination. The front-view configuration was used to define the cracking rate in the chromium layer, as this configuration provides better statistics.
The results of the recalibration of the numerical model parameters are presented in Figure 13. These results were compared with the experimental observations carried out on the cross-section by scanning electron microscopy. In the initial state, the level of residual stresses led to the failure of the first node of the cohesive surface at the crack tip (Figure 13). This was due to locally generated stress concentrations. As the test proceeded, new crack initiation was observed at a substrate strain of approximately 2.5%. The stress level (in mode I) at the onset of cohesive element damage (cracking in chromium) was recalculated from this event. A threshold stress of 1900 MPa was determined. The generated cracks propagated from the interface to the surface by experimental observations. For a strain of 6.6% applied to the substrate, 50% of the chromium–steel interface was fractured, and the cracks propagated 81% within the thickness of the coating. Finally, for a strain of 13.4% imposed on the substrate, 80% of the chrome–steel interface was fractured. We considered the interface failure to be complete at this point. This second event allowed us to reset the stress that initiated the first cohesive surface damage to a value of 2600 MPa.

4. Conclusions

This work is placed in the general context of developing chromium-plating processes using CrIII ions instead of CrVI ions, which will soon be banned by the European REACH directive. Based on experimental and numerical studies, this paper presents a study of the adhesion of CrIII coatings on a steel substrate. We developed local in situ measurements by means of SEM. The initiation of cracks at the origin of decohesions and their propagation kinetics in the thickness of the layers as a function of the strain imposed by the substrate were determined. Front-view observations allowed us to follow the kinetics of chromium cracking damage during the tensile test. The crack density was higher for CrIII than for CrVI. In both cases, it increased with the strain and stabilised at a value of 7% for the former and 2 to 4% for the latter. The intercrack space was then 30 and 40 µm, respectively. The density of the cracks at the beginning and after loading depended on the thickness of the coating and was higher the thinner the coating became. The cross-sectional observations allowed us to identify more precisely the initiation and propagation of cracks in the thickness of the coatings. The observations allowed us to specify the respective roles of the different pre-existing cracks in the damage kinetics. An important role was played by the pre-existing cracks located at the substrate–layer interface. We have also shown that the presence of cracks favoured the localisation of plastic shear bands in the substrate, which, in turn, favoured the opening of certain cracks. The numerical simulation of the test allowed us to estimate a damage-initiation threshold stress of 1900 MPa, which occurred at an average applied strain of 2.5%. The delamination of the layer was complete at an average strain of 13.6% and a threshold stress of 2600 MPa.

Author Contributions

Conceptualisation, R.G., O.D., B.F. and J.A.; validation, O.D., B.F., Y.B. and J.A.; investigation, R.G., Y.B. and B.F.; writing—original draft preparation, R.G. and J.A.; writing—review and editing, R.G., O.D., B.F., Y.B., C.G. and J.A.; supervision, O.D. and J.A.; project administration, C.G. and J.A.; funding acquisition, C.G. and J.A. All authors have read and agreed to the published version of the manuscript.

Funding

This research and the APC were funded by BPI France and Région Occitanie Pyrénées-Méditerranée, Chromaero project grant number CP/2018-OCT/12.07.

Institutional Review Board Statement

Not applicable.

Informed Consent Statement

Not applicable.

Data Availability Statement

Not applicable.

Acknowledgments

The authors thank Lucie Bres from Collins Aerospace for producing the hexavalent chromium coatings, and Jade Pécune (LGP-ENIT) and Nathalie Aubazac (LGP-ENIT) for their support in the sample’s preparation and SEM observation.

Conflicts of Interest

The authors declare no conflict of interest.

References

  1. Mohan, S.; Saravanan, G.; Renganathan, N.G. Comparison of Chromium Coatings and Electrochemical Behaviour with Direct Current and Pulse Current Deposition in Trivalent Chromium Formate Urea Bath as Alternative to Conventional Cr Coatings. Surf. Eng. 2011, 27, 775–783. [Google Scholar] [CrossRef]
  2. Protsenko, V.S.; Danilov, F.I. Chromium Electroplating from Trivalent Chromium Baths as an Environmentally Friendly Alternative to Hazardous Hexavalent Chromium Baths: Comparative Study on Advantages and Disadvantages. Clean Techn Env. Policy 2014, 16, 1201–1206. [Google Scholar] [CrossRef]
  3. Wang, S.; Ma, C.; Walsh, F.C. Alternative Tribological Coatings to Electrodeposited Hard Chromium: A Critical Review. Trans. IMF 2020, 98, 173–185. [Google Scholar] [CrossRef]
  4. Hordienko, V.O.; Protsenko, V.S.; Kwon, S.C.; Lee, J.-Y.; Danilov, F.I. Electrodeposition of Chromium Coatings from Sulfate–Carbamide Electrolytes Based on Cr(III) Compounds. Mater. Sci. 2011, 46, 647–652. [Google Scholar] [CrossRef]
  5. Mohan, S.; Vijayakumar, J.; Saravanan, G. Influence of CH3SO3H and AlCl3 in Direct and Pulse Current Electrodeposition of Trivalent Chromium. Surf. Eng. 2009, 25, 570–576. [Google Scholar] [CrossRef]
  6. Protsenko, V.; Danilov, F. Kinetics and Mechanism of Chromium Electrodeposition from Formate and Oxalate Solutions of Cr(III) Compounds. Electrochim. Acta 2009, 54, 5666–5672. [Google Scholar] [CrossRef]
  7. Danilov, F.I.; Protsenko, V.S.; Gordiienko, V.O.; Kwon, S.C.; Lee, J.Y.; Kim, M. Nanocrystalline Hard Chromium Electrodeposition from Trivalent Chromium Bath Containing Carbamide and Formic Acid: Structure, Composition, Electrochemical Corrosion Behavior, Hardness and Wear Characteristics of Deposits. Appl. Surf. Sci. 2011, 257, 8048–8053. [Google Scholar] [CrossRef]
  8. Hoare, J.P. A Voltammetric Study of the Reduction of Chromic Acid on Bright Platinum. J. Electrochem. Soc. 1983, 130, 1475. [Google Scholar] [CrossRef]
  9. Hoare, J.P. On the Mechanisms of Chromium Electrodeposition. J. Electrochem. Soc. 1979, 126, 190–199. [Google Scholar] [CrossRef]
  10. Lu, C.-E.; Pu, N.-W.; Hou, K.-H.; Tseng, C.-C.; Ger, M.-D. The Effect of Formic Acid Concentration on the Conductivity and Corrosion Resistance of Chromium Carbide Coatings Electroplated with Trivalent Chromium. Appl. Surf. Sci. 2013, 282, 544–551. [Google Scholar] [CrossRef]
  11. Zeng, Z.; Sun, Y.; Zhang, J. The Electrochemical Reduction Mechanism of Trivalent Chromium in the Presence of Formic Acid. Electrochem. Commun. 2009, 11, 331–334. [Google Scholar] [CrossRef]
  12. Del Pianta, D.; Frayret, J.; Gleyzes, C.; Cugnet, C.; Dupin, J.C.; Le Hecho, I. Determination of the Chromium(III) Reduction Mechanism during Chromium Electroplating. Electrochim. Acta 2018, 284, 234–241. [Google Scholar] [CrossRef]
  13. Baral, A.; Engelken, R. Modeling, Optimization, and Comparative Analysis of Trivalent Chromium Electrodeposition from Aqueous Glycine and Formic Acid Baths. J. Electrochem. Soc. 2005, 152, C504. [Google Scholar] [CrossRef]
  14. Protsenko, V.S.; Gordiienko, V.O.; Danilov, F.I.; Kwon, S.C. Thick Chromium Electrodeposition from Trivalent Chromium Bath Containing Carbamide and Formic Acid. Metal Finishing 2011, 109, 33–37. [Google Scholar] [CrossRef]
  15. Ferreira, E.S.C.; Pereira, C.M.; Silva, A.F. Electrochemical Studies of Metallic Chromium Electrodeposition from a Cr(III) Bath. J. Electroanal. Chem. 2013, 707, 52–58. [Google Scholar] [CrossRef]
  16. Ghaziof, S.; Golozar, M.A.; Raeissi, K. Characterization of As-Deposited and Annealed Cr–C Alloy Coatings Produced from a Trivalent Chromium Bath. J. Alloys Compd. 2010, 496, 164–168. [Google Scholar] [CrossRef]
  17. Ghaziof, S.; Raeissi, K.; Golozar, M.A. Improving the Corrosion Performance of Cr–C Amorphous Coatings on Steel Substrate by Modifying the Steel Surface Preparation. Surf. Coat. Technol. 2010, 205, 2174–2183. [Google Scholar] [CrossRef]
  18. Kwon, S.C.; Kim, M.; Park, S.U.; Kim, D.Y.; Kim, D.; Nam, K.S.; Choi, Y. Characterization of Intermediate Cr-C Layer Fabricated by Electrodeposition in Hexavalent and Trivalent Chromium Baths. Surf. Coat. Technol. 2004, 183, 151–156. [Google Scholar] [CrossRef]
  19. Nam, K.-S.; Lee, K.-H.; Kwon, S.-C.; Lee, D.Y.; Song, Y.-S. Improved Wear and Corrosion Resistance of Chromium(III) Plating by Oxynitrocarburising and Steam Oxidation. Mater. Lett. 2004, 58, 3540–3544. [Google Scholar] [CrossRef]
  20. Zeng, Z.; Wang, L.; Liang, A.; Chen, L.; Zhang, J. Fabrication of a Nanocrystalline Cr–C Layer with Excellent Anti-Wear Performance. Mater. Lett. 2007, 61, 4107–4109. [Google Scholar] [CrossRef]
  21. Bikulčius, G.; Češūnienė, A.; Matijošius, T.; Selskienė, A.; Pakštas, V. Investigation of the Properties of Cr Coatings Deposited in an Improved Cr(III) Electrolyte. Chemija 2019, 30, 69–77. [Google Scholar] [CrossRef]
  22. Tsai, R.; Wu, S. Phase Stability of Chromium Plating from Chromic Acid Electrolyte Containing Formic Acid. J. Electrochem. Soc. 1990, 137, 3057–3060. [Google Scholar] [CrossRef]
  23. Liang, A.; Liu, Q.; Zhang, B.; Ni, L.; Zhang, J. Preparation of Crystalline Chromium Coating on Cu Substrate Directly by DC Electrodepositing from Wholly Environmentally Acceptable Cr(III) Electrolyte. Mater. Lett. 2014, 119, 131–134. [Google Scholar] [CrossRef]
  24. Mahdavi, S.; Allahkaram, S.R.; Heidarzadeh, A. Characteristics and Properties of Cr Coatings Electrodeposited from Cr(III) Baths. Mater. Res. Express 2018, 6, 026403. [Google Scholar] [CrossRef]
  25. Zeng, Z.; Zhang, J. Electrodeposition and Tribological Behavior of Amorphous Chromium-Alumina Composite Coatings. Surf. Coat. Technol. 2008, 202, 2725–2730. [Google Scholar] [CrossRef]
  26. Gabe, D.R. The Role of Hydrogen in Metal Electrodeposition Processes. J. Appl. Electrochem. 1997, 27, 908–915. [Google Scholar] [CrossRef]
  27. Bouaziz, H.; Brinza, O.; Haddar, N.; Gasperini, M.; Feki, M. In-Situ SEM Study of Crack Initiation, Propagation and Interfacial Debonding of Ni-P Coating during Tensile Tests: Heat Treatment Effect. Mater. Charact. 2017, 123, 106–114. [Google Scholar] [CrossRef]
  28. Chen, B.F.; Hwang, J.; Chen, I.F.; Yu, G.P.; Huang, J.-H. A Tensile-Film-Cracking Model for Evaluating Interfacial Shear Strength of Elastic Film on Ductile Substrate. Surf. Coat. Technol. 2000, 126, 91–95. [Google Scholar] [CrossRef]
  29. Xie, C.; Tong, W. Cracking and Decohesion of a Thin Al2O3 Film on a Ductile Al–5%Mg Substrate. Acta Mater. 2005, 53, 477–485. [Google Scholar] [CrossRef]
  30. Ohmura, T.; Matsuoka, S. Evaluation of Mechanical Properties of Ceramic Coatings on a Metal Substrate. Surf. Coat. Technol. 2003, 169–170, 728–731. [Google Scholar] [CrossRef]
  31. Azevedo, J.C.S.; Campilho, R.D.S.G.; Da Silva, F.J.G.; Faneco, T.M.S.; Lopes, R.M. Cohesive Law Estimation of Adhesive Joints in Mode II Condition. Theor. Appl. Fract. Mech. 2015, 80, 143–154. [Google Scholar] [CrossRef]
  32. Campilho, R.D.S.G.; Banea, M.D.; Neto, J.A.B.P.; Da Silva, L.F.M. Modelling Adhesive Joints with Cohesive Zone Models: Effect of the Cohesive Law Shape of the Adhesive Layer. Int. J. Adhes. Adhes. 2013, 44, 48–56. [Google Scholar] [CrossRef] [Green Version]
  33. Fukumasu, N.K.; Souza, R.M. Numerical Evaluation of Cohesive and Adhesive Failure Modes during the Indentation of Coated Systems with Compliant Substrates. Surf. Coat. Technol. 2014, 260, 266–271. [Google Scholar] [CrossRef] [Green Version]
  34. Han, X.; Chao, Y.; Zhang, W.; Chao, Y.; Wu, C. Study on the Effect of Post Curing on the Mode II Fracture Energy of Structural Adhesive Using a Parameter Identification Approach. Int. J. Adhes. Adhes. 2019, 95, 102398. [Google Scholar] [CrossRef]
  35. Liao, L.; Huang, C.; Sawa, T. Effect of Adhesive Thickness, Adhesive Type and Scarf Angle on the Mechanical Properties of Scarf Adhesive Joints. Int. J. Solids Struct. 2013, 50, 4333–4340. [Google Scholar] [CrossRef] [Green Version]
  36. Rocha, A.V.M.; Akhavan-Safar, A.; Carbas, R.; Marques, E.A.S.; Goyal, R.; El-zein, M.; Da Silva, L.F.M. Numerical Analysis of Mixed-Mode Fatigue Crack Growth of Adhesive Joints Using CZM. Theor. Appl. Fract. Mech. 2020, 106, 102493. [Google Scholar] [CrossRef]
  37. Stuparu, F.A.; Apostol, D.A.; Constantinescu, D.M.; Picu, C.R.; Sandu, M.; Sorohan, S. Cohesive and XFEM Evaluation of Adhesive Failure for Dissimilar Single-Lap Joints. Procedia Struct. Integr. 2016, 2, 316–325. [Google Scholar] [CrossRef] [Green Version]
  38. Watson, B.; Worswick, M.J.; Cronin, D.S. Quantification of Mixed Mode Loading and Bond Line Thickness on Adhesive Joint Strength Using Novel Test Specimen Geometry. Int. J. Adhes. Adhes. 2020, 102, 102682. [Google Scholar] [CrossRef]
  39. Jiang, J.; Zhai, H.; Gong, P.; Zhang, W.; He, X.; Ma, X.; Wang, B. In-Situ Study on the Tensile Behavior of Cr-Coated Zircaloy for Accident Tolerant Fuel Claddings. Surf. Coat. Technol. 2020, 394, 125747. [Google Scholar] [CrossRef]
  40. Dalverny, O.; Tongne, A.; Ho, C.; Alexis, J.; Châtel, S.; Faure, B. Numerical Simulation of Interfacial Delamination between SiO2 Thin Film and Polymeric Substrate. In Proceedings of the AIP Conference Proceedings 2196, Ischia, Italy, 12 December 2019; p. 020014. [Google Scholar]
  41. Fan, X.L.; Xu, R.; Zhang, W.X.; Wang, T.J. Effect of Periodic Surface Cracks on the Interfacial Fracture of Thermal Barrier Coating System. Appl. Surf. Sci. 2012, 258, 9816–9823. [Google Scholar] [CrossRef]
  42. Zhu, W.; Yang, L.; Guo, J.W.; Zhou, Y.C.; Lu, C. Numerical Study on Interaction of Surface Cracking and Interfacial Delamination in Thermal Barrier Coatings under Tension. Appl. Surf. Sci. 2014, 315, 292–298. [Google Scholar] [CrossRef]
  43. Guillon, R.; Dalverny, O.; Fori, B.; Gazeau, C.; Alexis, J. Mechanical Behaviour of Hard Chromium Deposited from a Trivalent Chromium Bath. Coatings 2022, 12, 354. [Google Scholar] [CrossRef]
  44. Zhu, W.; Yang, L.; Guo, J.W.; Zhou, Y.C.; Lu, C. Determination of Interfacial Adhesion Energies of Thermal Barrier Coatings by Compression Test Combined with a Cohesive Zone Finite Element Model. Int. J. Plast. 2015, 64, 76–87. [Google Scholar] [CrossRef]
  45. Li, S.; Yang, H.; Qi, H.; Song, J.; Yang, X.; Shi, D. Experimental Study and Numerical Modeling of the Damage Evolution of Thermal Barrier Coating Systems under Tension. Sci. China Technol. Sci. 2018, 61, 1882–1888. [Google Scholar] [CrossRef]
  46. Benzeggagh, M.L.; Kenane, M. Measurement of Mixed-Mode Delamination Fracture Toughness of Unidirectional Glass/Epoxy Composites with Mixed-Mode Bending Apparatus. Compos. Sci. Technol. 1996, 56, 439–449. [Google Scholar] [CrossRef]
  47. Sebastiani, M.; Johanns, K.E.; Herbert, E.G.; Carassiti, F.; Pharr, G.M. A Novel Pillar Indentation Splitting Test for Measuring Fracture Toughness of Thin Ceramic Coatings. Philos. Mag. 2015, 95, 1928–1944. [Google Scholar] [CrossRef]
  48. Guillon, R.; Stéphan, C.; Balcaen, Y.; Josse, C.; Fori, B.; Dalverny, O.; Alexis, J. An Estimation of Local Residual Stresses in Amorphous and Crystallized Trivalent Chromium Coatings. Coatings 2023, 13, 124. [Google Scholar] [CrossRef]
  49. Guillon, R. Amélioration de L’adhérence de Revêtements Électrolytiques de Chrome: Étude Expérimentale et Numérique. Ph.D. Thesis, University of Toulouse, Toulouse, France, 2022. [Google Scholar]
Figure 1. Front view and sectional view of the coatings. A higher magnification observation of the cracks present in the framed zone is also given.
Coatings 13 01194 g001
Figure 2. (a) Microtensile test installed on the stage of the scanning electron microscope; (b) geometry of the tensile specimens; observation of the samples, (c) front view and (d) sectional view; blue areas stand for coating. The arrow indicates the direction of observation.
Coatings 13 01194 g002
Figure 3. Tensile test on a coated sample; (a) typical force–displacement curves, showing some load drops during dwell times; (b,c) load versus time curves showing the relaxation phenomena.
Coatings 13 01194 g003
Figure 4. Construction of the numerical model; mesh and boundary conditions of the 2D model of the tensile test of coated specimens. The substrate is blue, the chromium coating is grey and the green lines show pre-existing cracks.
Coatings 13 01194 g004
Figure 5. Evolution of CrIII (ae) and CrVI (fj) chromium coatings cracking during the tensile test at different characteristic steps. SE microscopy. An observation of the cracking, at higher magnification, of the framed zone is also given for each level of deformation.
Coatings 13 01194 g005
Figure 6. Evolution of crack distance of CrIII and CrVI coatings during the tensile test.
Coatings 13 01194 g006
Figure 7. Evolution of the cracking of CrIII trivalent chromium coatings during the tensile test as a function of the coating thickness.
Coatings 13 01194 g007
Figure 8. Evolution of cracking during tensile testing of CrIII trivalent chromium coatings as a function of post-heat-treatment temperature.
Coatings 13 01194 g008
Figure 9. Illustration of the cracking evolution observed in a 50°-tilted view for two magnifications (×150 and ×750): CrIII coating, steel substrate. SEM microscopy. Yellow, blue and orange arrows indicates pre-existing cracks with different behavior (see text).
Coatings 13 01194 g009
Figure 10. Illustration of the typical evolution of a crack during the tensile test observed in cross-sectional view: CrIII coating; steel substrate. Backscattered electron microscopy.
Coatings 13 01194 g010
Figure 11. Cross-sectional and front-view cracking evolution for a 100 μm thick CrIIIB trivalent chromium coating on 1.6747 substrate.
Coatings 13 01194 g011
Figure 12. Strain fields in the substrate near the interface along the tensile axis. Magnification ×1000 (Rse 7.3 μm) and ×2500 (Rse 2 μm).
Coatings 13 01194 g012
Figure 13. Comparison of experimental and numerical simulation results (stresses are expressed in TPa).
Coatings 13 01194 g013
Disclaimer/Publisher’s Note: The statements, opinions and data contained in all publications are solely those of the individual author(s) and contributor(s) and not of MDPI and/or the editor(s). MDPI and/or the editor(s) disclaim responsibility for any injury to people or property resulting from any ideas, methods, instructions or products referred to in the content.

