Article

Ring-Core Photonic Crystal Fiber Sensor Based on SPR for Extra-Wide Refractive Index Detection

1
School of Physics and Electronic Engineering, Northeast Petroleum University, Daqing 163318, China
2
Department of Physics, City University of Hong Kong, Tat Chee Avenue, Kowloon, Hong Kong 999077, China
3
Department of Materials Science and Engineering, City University of Hong Kong, Tat Chee Avenue, Kowloon, Hong Kong 999077, China
4
Department of Biomedical Engineering, City University of Hong Kong, Tat Chee Avenue, Kowloon, Hong Kong 999077, China
*
Author to whom correspondence should be addressed.
Coatings 2023, 13(7), 1207; https://doi.org/10.3390/coatings13071207
Submission received: 9 June 2023 / Revised: 30 June 2023 / Accepted: 3 July 2023 / Published: 5 July 2023
(This article belongs to the Special Issue Enhanced Thin-Film Application on Sensors)

Abstract

:
Spurred by the rapid development of fiber optic sensing technology, photonic crystal fiber (PCF) sensors based on surface plasmon resonance (SPR) have received widespread attention. However, they can only detect a narrow range, and the coating process is complex. Herein, a wide-range SPR sensor is designed. It consists of a ring-core PCF filled with plasmonic materials. Compared to the process of depositing a coating inside the air hole, the analyte and gold nanowires fill our PCF, thus simplifying the manufacturing complexity. The ring-core structure enhances the directional power transmission between the guided mode and the surface plasmon polariton (SPP) mode. The sensor is numerically analyzed using the finite element method (FEM). The results show that the PCF-SPR sensor has a wavelength sensitivity and amplitude sensitivity of 40,000 nm/RIU and 2141 RIU−1, and the resolution is 2.5 × 10⁻⁶ RIU−1 for the detection range of 1.13–1.45. The high-sensitivity sensor boasting a wide refractive index detection range performs better than conventional solid-core PCF-SPR sensors, boding well for biochemical sensing.

1. Introduction

Optical fiber sensing technology is regarded as one of the key components of intelligent detection fields which has been pushing great progresses in the new scientific and technological revolution [1]. In recent years, highly sensitive sensors with an extra-wide detection range are urgently needed in order to accurately measure concentrations of biomedical analytes, harmful chemicals, and environmental pollutants [2,3]. Among the reported sensors, photonic crystal fiber sensors based on surface plasmon resonance (PCF-SPR) for refractive index (RI) detection have undoubtedly gained great attention due to their advantages of small size, extremely high sensitivity, and remote monitoring. PCF-SPR sensors are integrated with the superiorities of both the PCF and SPR sensing techniques [4,5]. On the one hand, surface plasmon resonance (SPR) is a physical optical phenomenon that occurs at the metal/dielectric interface, which is extremely sensitive to the RI of the surrounding medium [6,7,8,9]. On the other hand, PCF is a new type of microstructured optical fiber with periodically arranged air holes introduced into the cladding, which has been widely used in fiber optic communication, fluorescence enhancement, and other fields due to the flexibility of the structural design. In addition, the combination of PCF and SPR technology can effectively improve the RI range and sensitivity of sensors, and PCF–SPR has become one of the hot topics in the optical field [10,11,12,13].
The dominant advantage of PCF-SPR sensors lies in their comprehensive high performances regarding controllable wavelength and higher wavelength sensitivity and resolution as well as figure of merit. For instance, compared with conventional optical fibers, the effective RI of the guide mode in single-mode fibers is close to that of the core material; single-mode fiber SPR sensors have been demonstrated almost exclusively in visible light, which limits the RI detection range and sensitivity of the sensors [14]. In principle, by using multimode fibers, the phase matching conditions of SPR can occur in the near-infrared band. However, the power distribution of higher-order modes in multimode fiber SPR sensors is very sensitive to emission conditions, which increases additional noise [15].
More recently, much of the work has focused on exaggerated RI detection ranges, controlled resonance wavelengths, and extremely high sensitivity. For example, Wang et al. [16] have designed a polarization-independent PCF-SPR sensor that can monitor the RI range of 1.20–1.33 with a wavelength sensitivity of 12,000 nm/RIU and corresponding to a resolution of 8.3 × 10⁻⁶ RIU−1. The resonance wavelengths of most PCF-SPR sensors are concentrated in the visible and near-infrared wavelength regions. Han et al. [17] have proposed a D-type PCF-SPR sensor for the refractive range of 1.37–1.41, boasting a sensitivity of 6000 nm/RIU and a resolution of 1.667 × 10⁻⁵ RIU−1. To date, the maximum wavelength sensitivity is up to 11,000–11,600 nm/RIU with a higher resolution of 10−6 RIU−1, displaying great application potential in biomedicine. However, the detection range of the appealed PCF-SPR sensor is mostly limited and cannot achieve both high RI detection and low RI detection. For PCF-SPR sensors, the sensing is fundamentally based on RI detection, and an extra-wide detection range is desired in the fields of biology, biomedicine, and chemistry. Consequently, it is essential to propose a sensor that works in a wider RI range of analyte [18,19,20]. So far, a variety of types of PCF-SPR sensors have been proposed and simulated, such as D-shaped, dual-core shaped, and open-slit shaped PCF [21,22,23,24]. Compared with the above structures, the ring-core PCF structure enhances the directional power transmission between the guided mode and the surface plasmon polariton (SPP) mode. This kind of structure adds large air holes inside the core, thus the effective RI of the guided mode is close to the solution to be measured, and the optical field of the core guide is more likely to leak to the metal region, ensuring efficient coupling between the guided mode and plasmonic mode [25,26,27,28]. Therefore, the ring-core structure is worthy of exploration and is expected to contribute novel strategies to the structure optimization of PCF-SPR sensors.
Herein, a new ring-core PCF-SPR sensor with high sensitivity and a wide RI detection range was designed. By using the COMSOL Multiphysics software, finite element analysis was performed to optimize the sensor. The numerical results indicate that the maximum wavelength sensitivity of the sensor is 40,000 nm/RIU, and the optimal resolution is 2.56 × 10⁻⁶ RIU−1. More importantly, the applicable RI range is between 1.13 and 1.45, resulting in an improved sensitivity and detection range, which covers the detection of most known biological analytes, such as proteins, viruses or DNA/RNA, and glucose concentration in blood cells, etc. The ultra-high sensitivity can be used to monitor almost all possible damping in biomolecules, consequently having a high potential in applications such as biology and bioanalysis [29,30].

2. Numerical Modelling

The mode characteristics and properties of the ring-core PCF-SPR sensors were analyzed based on the finite element method. Figure 1 shows the cross-section of a ring-core PCF-SPR structure. This structure consists of a central analyte channel and two layers of air holes. The diameter of the central analyte channel is R. The inner air hole is made up of air holes of two different sizes of R1 and R2. Two air holes with diameters of R2 are distributed between adjacent air holes with diameters of R1, and the outer layer consists of eighteen air holes with a diameter of R3. The distances from the central channel to the air holes with inner layer diameters R2 and R1 are d1 and d2, respectively. The interval between the two adjacent air holes with a diameter of R2 in the inner layer is d3, and the spacing between the outer air hole and air hole with a diameter of R1 in the inner layer is d4. The orange area of the structure is filled with the analyte, while the blue area shows the bulk material of silica. Considering the dispersion in the bulk material, the RI changes with the wavelength of the incident light. The Sellmeier equation in Equation (1) is used to derive the RI of silica [31]:
n 2 ( λ ) = 1 + A 1 λ 2 λ 2 B 1 + A 2 λ 2 λ 2 B 2 + A 3 λ 2 λ 2 B 3
where A1 = 0.6961663, A2 = 0.4079426, A3 = 0.897479, B1 = 0.684043, B2 = 0.1162414 and B3 = 9.896161. Filling the air hole with a diameter of R1 in the positive x direction with gold medium, the dielectric constant of gold is represented by the Drude model definition in Equation (2) [32]:
ε A u ( ω ) = ε ω p 2 ω ( ω + i ω τ )
For gold, ε = 9.75, ωp = 1.36 × 10¹⁶ rad/s, and ωτ = 1.45 × 10¹⁴ rad/s. However, the traditional coating process is complex, and directly filling the gold medium can reduce the operation complexity and increase the effects of the PCF-SPR. The outer green area is the perfect matching layer (PML). The PML is considered as the boundary condition to absorb the transitory field dispersed from the PCF structure, which can reduce the reflection of electromagnetic fields in the fiber and make the calculation results more accurate. The designed structure is divided by using the free triangular mesh in the finite element software. The entire grid contains 14,898 domain units and 1618 boundary units with a maximum cell size of 2.99 and a minimum cell size of 0.0134, which makes it easier to identify the appropriate modes and produce more accurate results. After preliminary simulation, a set of initial structural parameters is generated to excite the SPR and obtain good loss spectra. The initial parameters are as follows: diameter of the central analyte channel R = 14 μm; inner layer large air hole diameter R1 = 2 μm; inner layer small air hole diameter R2 = 1 μm; outer air hole R3 = 2.5 μm, d1 = 9.5 μm, d2 = 10.5 μm, d3 = 0.5 μm, and d4 = 0.5 μm.
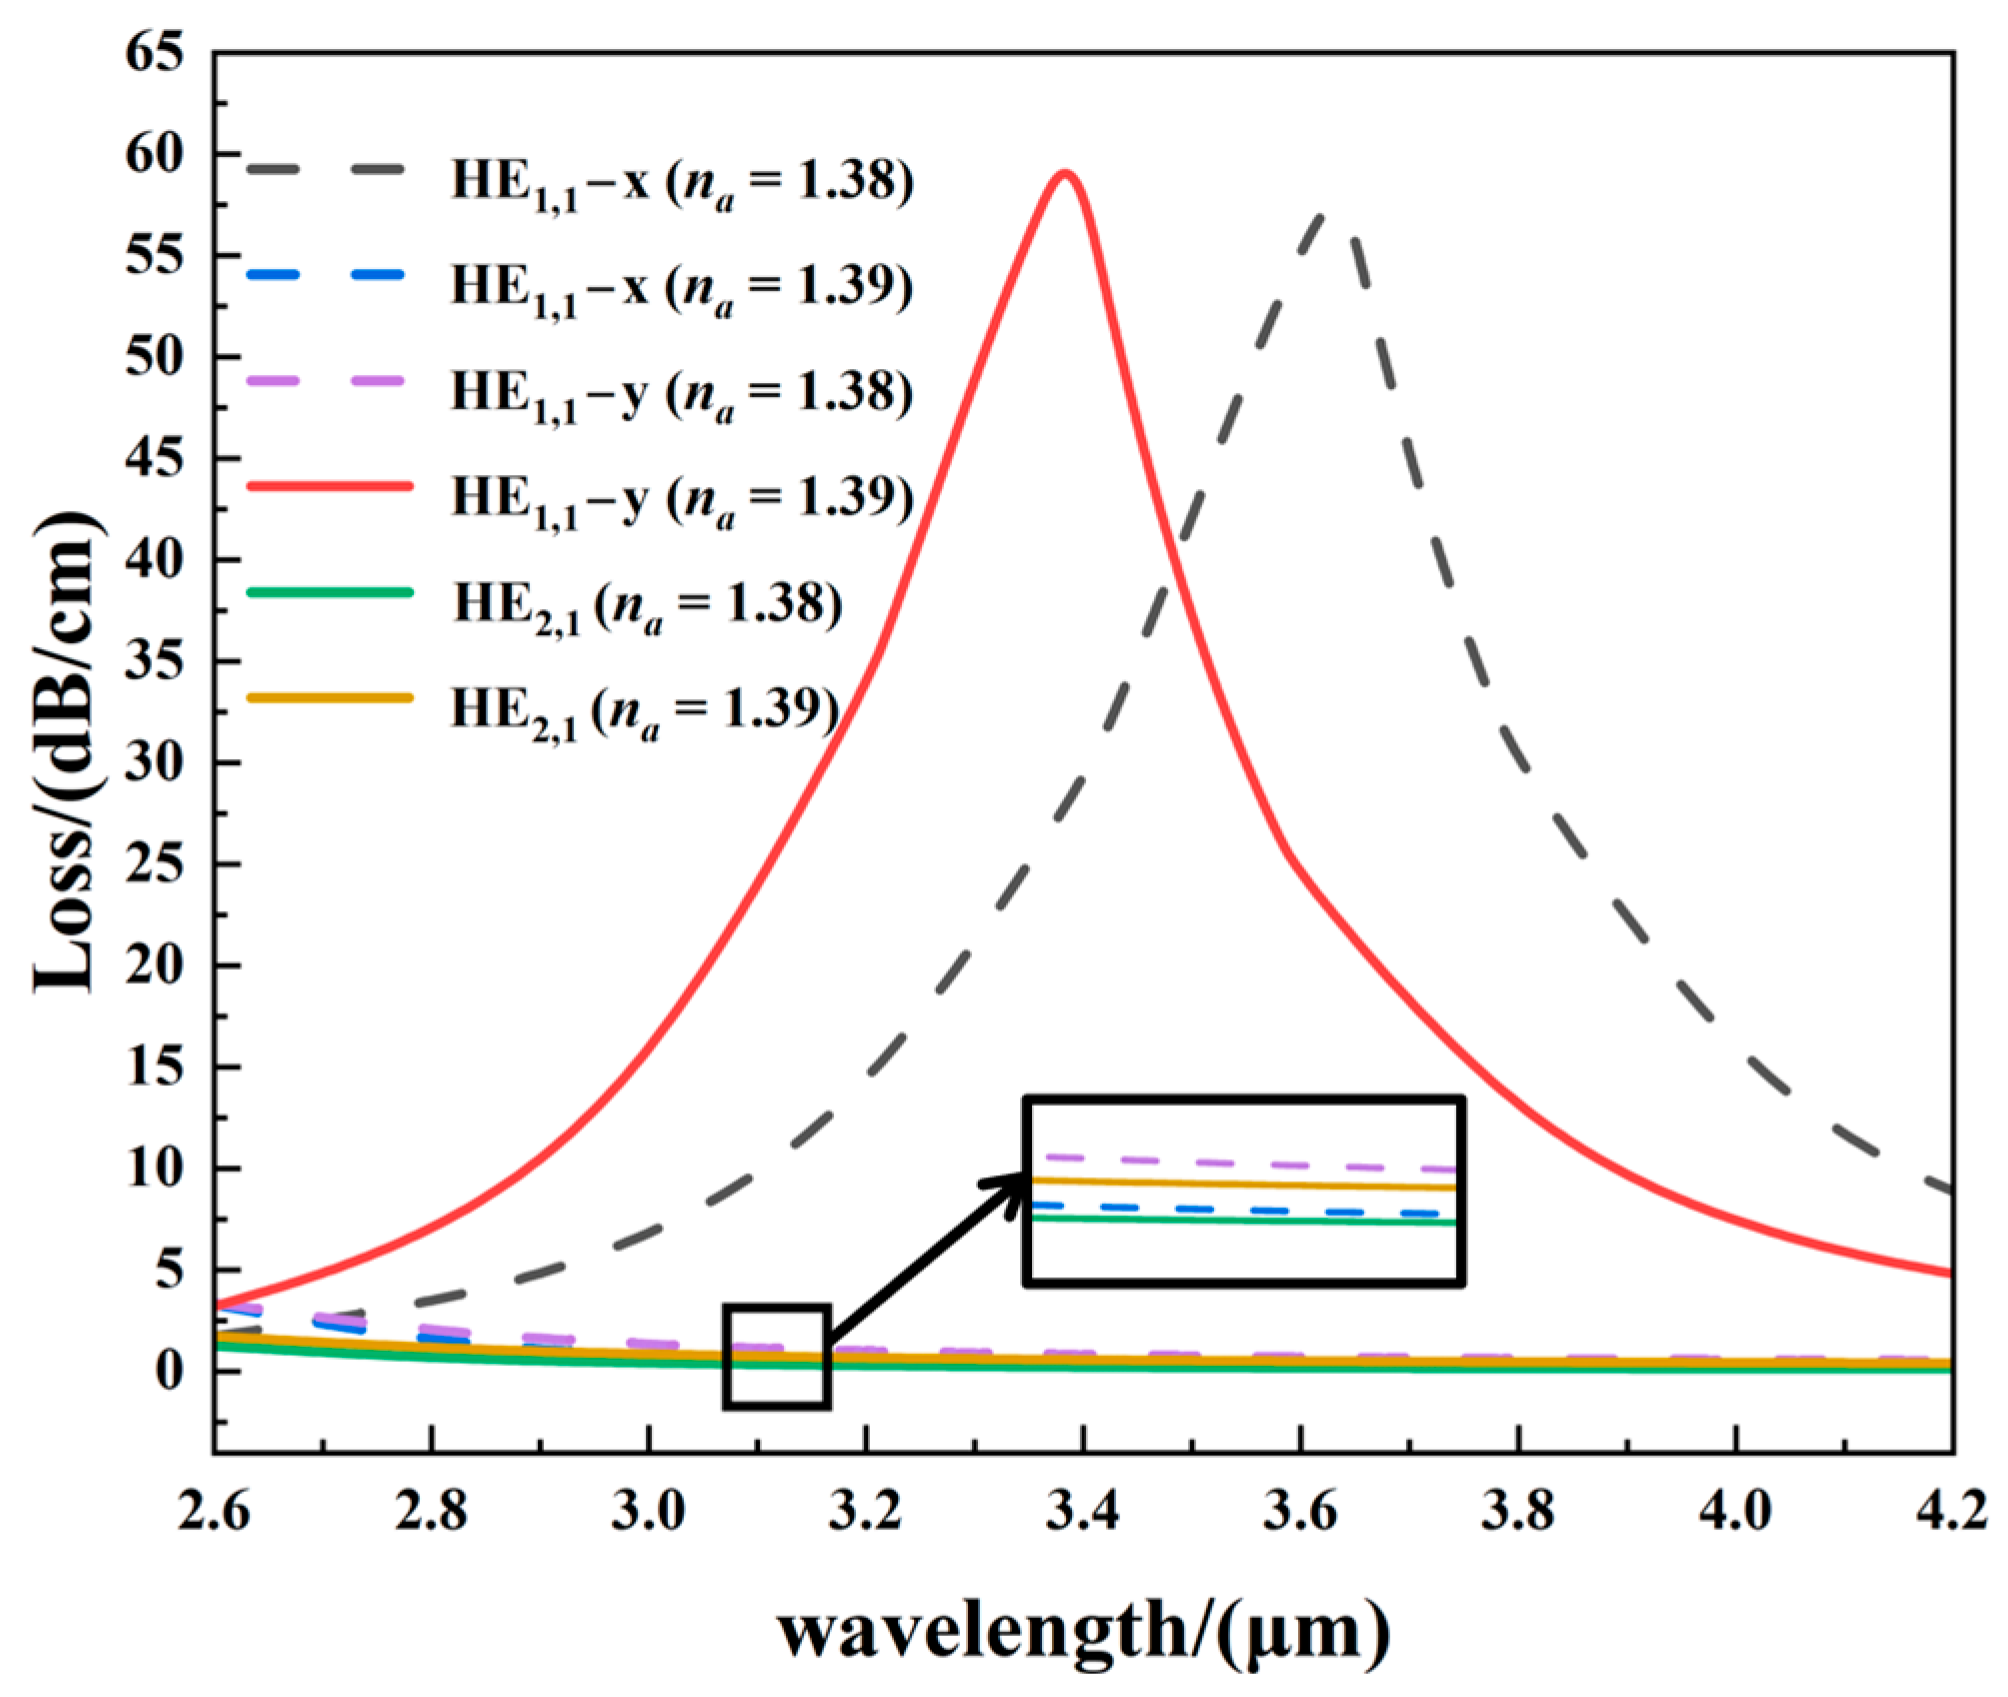
Using this set of parameters, the structure may stably support multiple modes, but different modes have different effects when exciting the SPR. In fact, the ring-core PCF-SPR is composed of a metal waveguide on the right and a PCF waveguide on the left. The SPP modes in the metal waveguide on the right can sense changes in the RI of the analyte. The PCF waveguide on the left has the fundamental mode HE1,1 and higher-order mode HE2,1, with different modes corresponding to two polarization states, namely x−polarization and y−polarization. Figure 2 shows the coupling effect of different modes with plasmonic modes for an RI of 1.38. The loss can be calculated from Equation (3) [33]:
L = 8.686 × 2 π λ × 10 7 Im ( n e f f ) ( dB / cm )
where λ stands for the wavelength of the incident light in vacuum with a unit of nanometer (nm) and Im(neff) is the imaginary part of the effective RI of the fundamental mode. There is a sharp loss peak in the x−polarization state of the HE1,1 mode, but there is almost no change in the resonance curve of the y-polarization state of the HE1,1 mode and the higher-order mode HE2,1 mode. Figure 3 shows the optical field distributions of the HE1,1 mode x−and y-polarization states as well as the HE2,1 mode. The HE1,1 mode has a linear polarization state, and the direction of the electric field consistently points towards the vicinity of the metal, thus making it easier to excite the SPR. Therefore, we chose the HE1,1 mode x−polarization as the excitation mode.
Based on the initial parameters, the RI detection range is determined to be 1.13–1.45, within which effective resonance curves can be obtained. At the same time, it is important to investigate the influences of several important parameters on the sensing properties in order to observe if improvements have been made to the structure. The simulation results indicate that the analyte channel R, inner air hole R1, and outer air hole R2 have significant effects. The wavelength sensitivity from 1.38 to 1.39 is in the middle of the entire detection range. Moreover, the refractive indices of common biochemical substances such as silicone oil and sucrose are also located in this range and are widely used in basic fields such as chemical processing and biomedicine, providing typical irreplaceability. Therefore, 1.38 and 1.39 were chosen as the detection ranges for the media to be measured in this work. In order to analyze and improve these three important parameters, we take the method of keeping the remaining parameters unchanged and improving each parameter in turn. Considering the degree of influence of the three parameters on the wavelength sensitivity of the PCF sensor, firstly the diameter of the central analyte channel R was optimized, followed by the inner air hole diameter R2 and the outer air hole diameter R3.
The initial parameter of the central analyte channel is R = 7 μm. When R > 8 μm, the thickness of the ring-core area is too small and the mode cannot be stably transmitted, causing mode distortion and the inability to excite the SPR. On the other hand, if the ring-core area is too large, the analyte channel is too small and difficult to prepare. Thus, the optimization diameter of the analyte channel R is 6 μm ≤ R ≤ 8 μm, with a step size of 0.5 μm. Figure 4a shows the loss spectra of analytes for different R values. As the diameter of the analyte channel increases, the resonance wavelength blue-shifts and the loss increases gradually. The trend of the resonance wavelength and wavelength sensitivity is shown in Figure 4b. The resonance wavelength is positively correlated with the diameter of the analyte channel. When R > 7.5 μm, the wavelength sensitivity of the PCF structure shows a significant downward trend. When 6 μm ≤ R ≤ 7.5 μm, the wavelength sensitivity fluctuates between 24,000 and 25,000 nm/RIU. According to the FOM and FWHM shown in Figure 4c, when R = 7 μm, the FOM has the maximum value, indicating that the overall quality of the loss spectrum is better. The corresponding FWHM curve also exhibits a valley at this value. When the FWHM is too large, the resonance peak is not sharp, resulting in poor resolution. Hence, R = 7 μm was chosen as the diameter of the analyte channel, at which point the wavelength sensitivity is 25,000 nm/RIU.
The R1 of the inner air hole was optimized to determine the gold medium. The initial parameter was R1 = 2 μm. When R1 > 2 μm, the fundamental mode is closer to the SPP mode and there is excessive loss at a short detection distance. When R1 < 1.2 μm, the air hole spacing is wide and cannot constrain the energy to the ring core, resulting in weak resonance between the fundamental mode and SPP mode. R1 decreases from 2 μm to 1.2 μm in steps of 0.2 μm. The loss spectra corresponding to the analytes with RIs from 1.38 to 1.39 are shown in Figure 5a. As R1 abates, the resonance wavelength red-shifts, and the loss rises. On the other hand, as shown in Figure 5b, the resonance wavelength change is inversely proportional to R1. Different R1 values have no remarkable influence on the wavelength sensitivity and, in fact, almost do not alter the wavelength sensitivity. Therefore, R1 is not the main factor. When R1 < 1.8 μm, the resonance curve exhibits irregular subpeaks, and as the diameter of R1 declines, the fluctuation of the subpeaks increases. Figure 5c shows the changes in FOM and FWHM. When R1 ≥ 1.8 μm, the FOM shows a negative correlation with R1. When R1 = 1.8 μm, the FWHM of the resonance curve is narrower, and R1 is determined to be 1.8 μm.
Based on R = 7 μm and R1 = 1.8 μm, the outer air hole R3 was optimized. The initial R3 was 2.5 μm. It is shown experimentally that the size of the outer air hole should be optimized within the range of 1.7 μm–2.5 μm. Values that are too large and too small affect the degree of coupling between the fundamental mode and SPP mode. Figure 6a shows the loss spectra when R3 goes up from 1.7 μm to 2.5 μm in steps of 0.2 μm. When R3 = 1.7 μm, there is a clear subpeak in the resonance curve. When the diameter of the air hole exceeds 1.7 μm, the position of the resonance peak remains almost unchanged and shows a slight loss. The resonance curves overlap in the figure. Figure 6b displays the resonance wavelength and wavelength sensitivity. The resonance wavelength is negatively correlated with R3, and there is almost no obvious change when the sensitivity increases to 25,000 nm/RIU. As shown in Figure 6c, when R3 > 1.7 μm, the FOM and FWHM changes are consistent with the wavelength sensitivity. A large diameter reduces the difficulty in the optical fiber drawing process, and thus, the air hole with the maximum diameter is selected, i.e., R3 = 2.5 μm. The optimal wavelength sensitivity is 25,000 nm/RIU. In summary, R = 7 μm, R1 = 1.8 μm, and R3 = 2.5 μm.
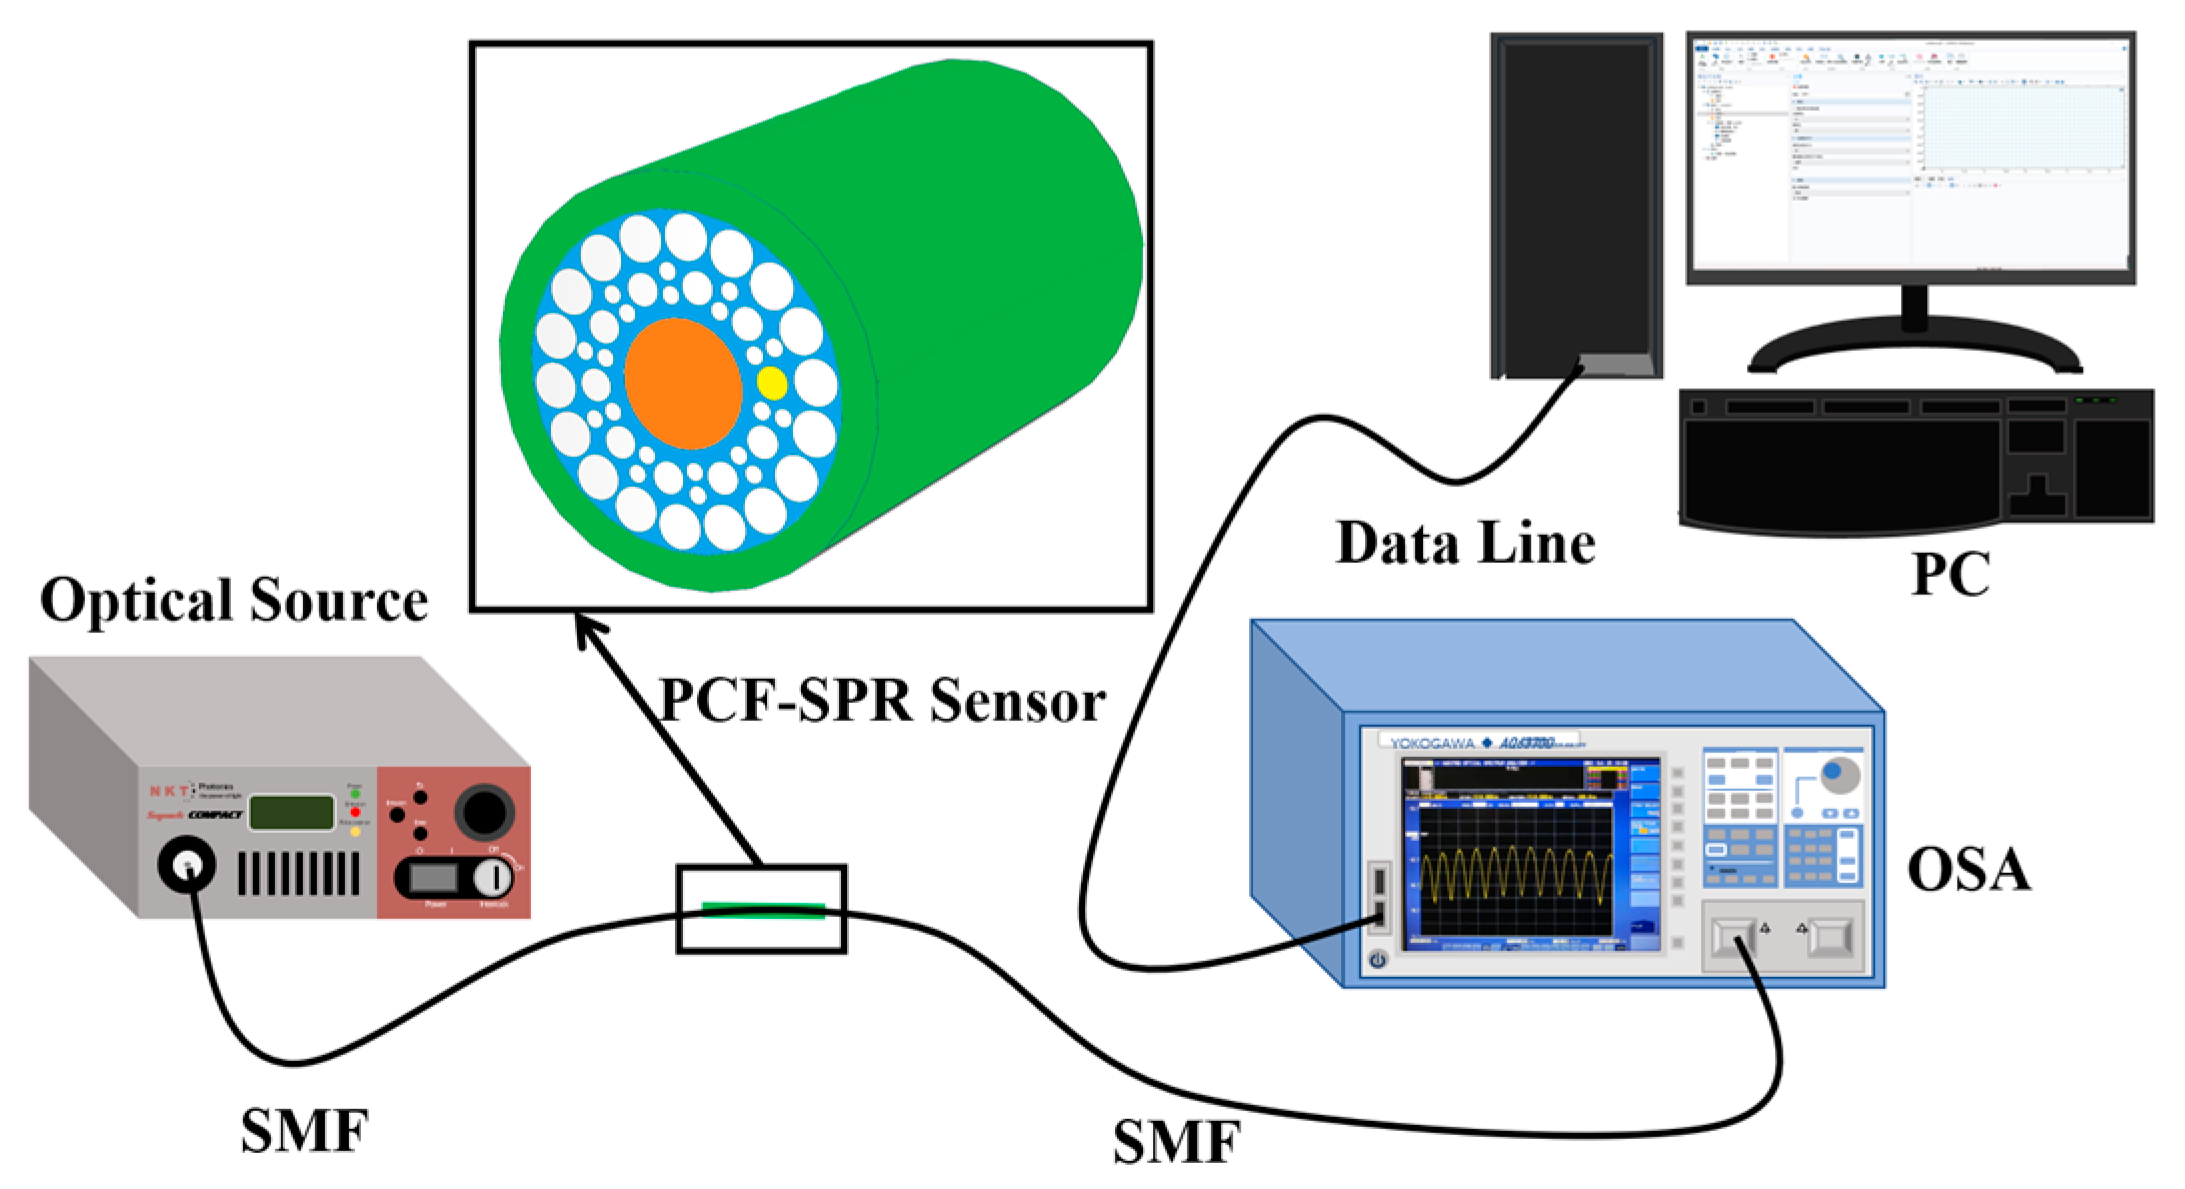
PCF structures can be fabricated using the sol–gel method, which utilizes the catalyst to hydrolyze the materials, and shrinkage leads to the sol formation [34]. SiO2 powder is processed into optical fiber preform using gel heat treatment; the optical fiber preform is melted at a high temperature in the drawing tower and is drawn to form an optical fiber [35,36]. Afterwards, the metal fills the air hole by chemical deposition, and the PCF-SPR sensor is completed after coating. The schematic diagram of the sensor to detect RI (s) is depicted in Figure 7. SMF is welded on both sides of the sensor, and the light source and OSA are connected separately. The data measured by the OSA are transmitted to a PC to generate the loss spectra.

3. Results and Discussion

3.1. Coupling Characteristics

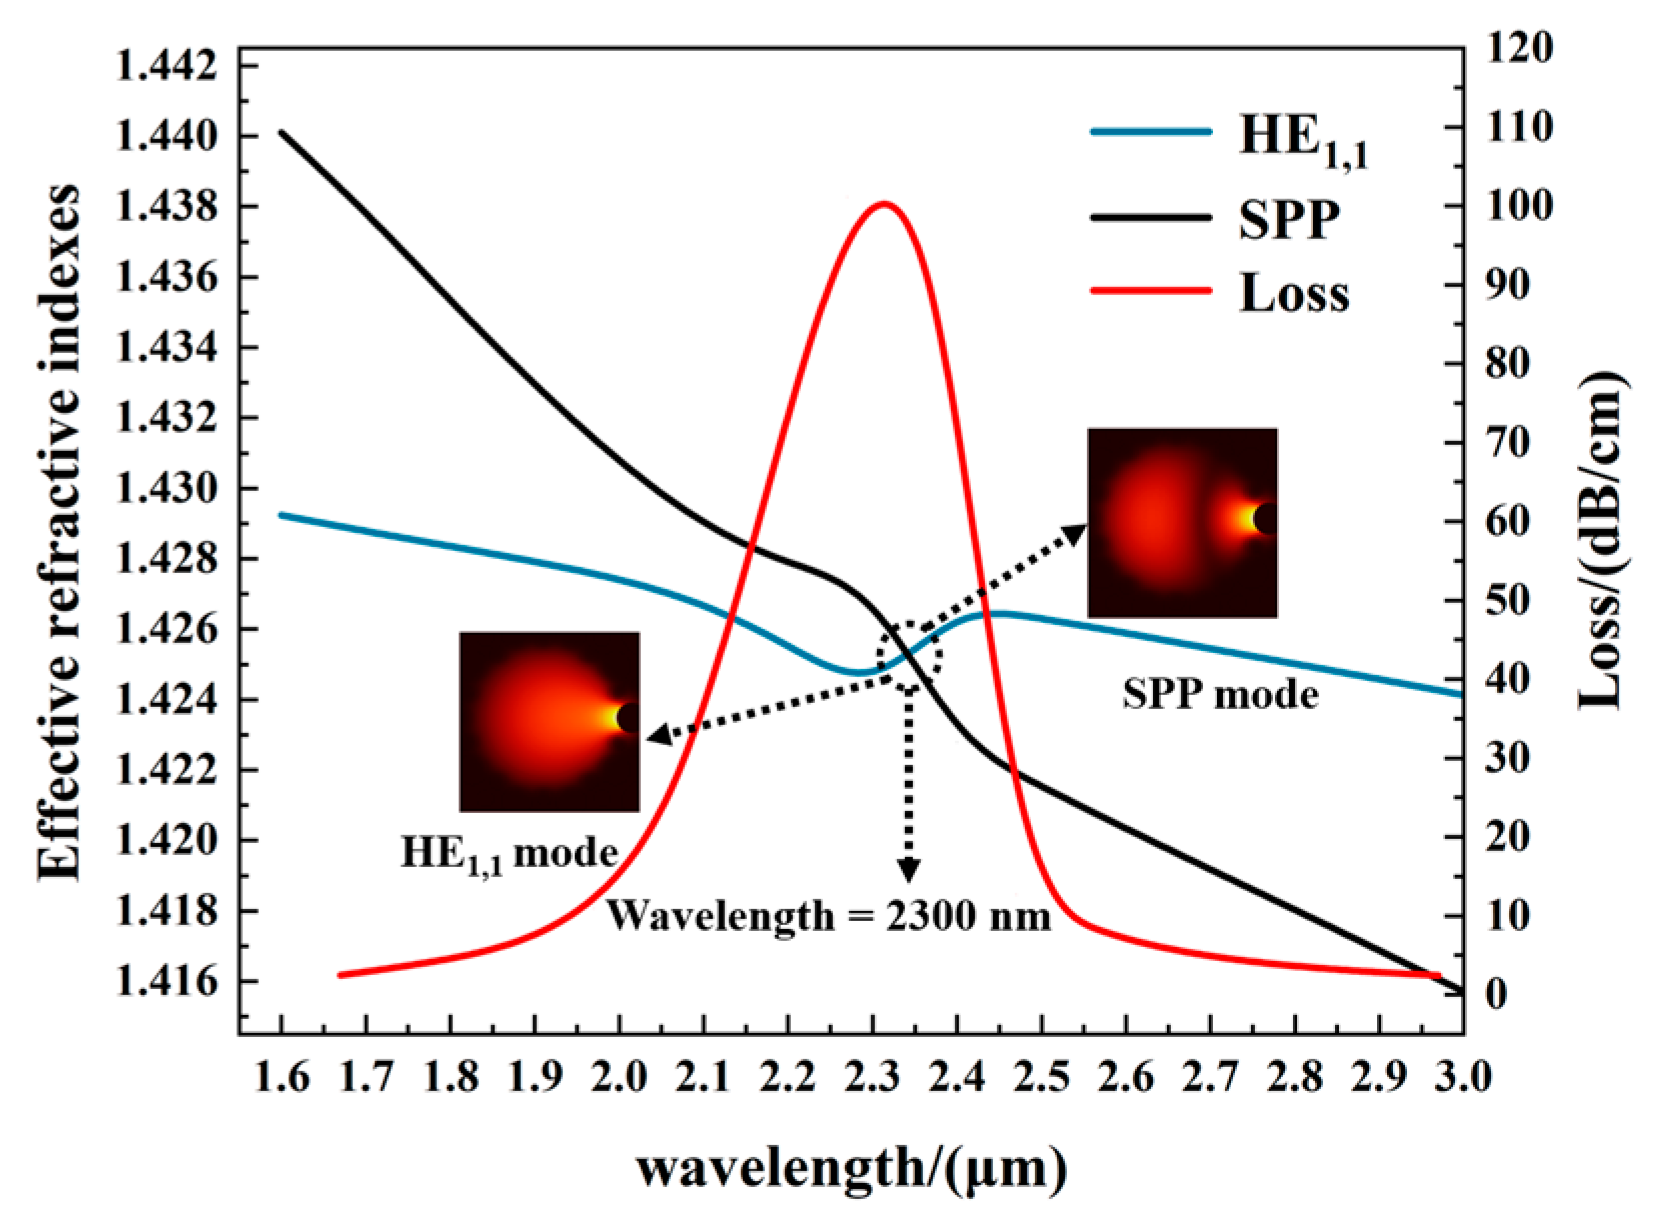
After optimizing the structure, excellent sensing characteristics are obtained. Here, we focus on the coupling characteristics, sensitivity, FOM, and other important indicators of the PCF sensor. In general, the resonance conditions of the HE1,1 mode and plasmonic mode require the propagation constants to be equal. That is, the dispersion curves of the HE1,1 mode and plasmonic mode should intersect. When the RI of the analyte is 1.43, the dispersion relation diagrams of the HE1,1 mode and the plasmonic mode are as shown in Figure 8. The effective RI of the fundamental mode moves gradually closer to that of the plasmonic mode until it is reversed. At 2300 nm, the dispersion curve of the fundamental mode intersects that of the plasmonic mode. At this point, the loss spectrum of the fundamental mode shows a peak, indicating that most of the fundamental mode energy is transferred to the plasmonic mode, and the energy coupling is strongest at that point, thereby meeting the phase matching condition. Thus, the SPR is excited, and this wavelength at that point is the resonant wavelength.
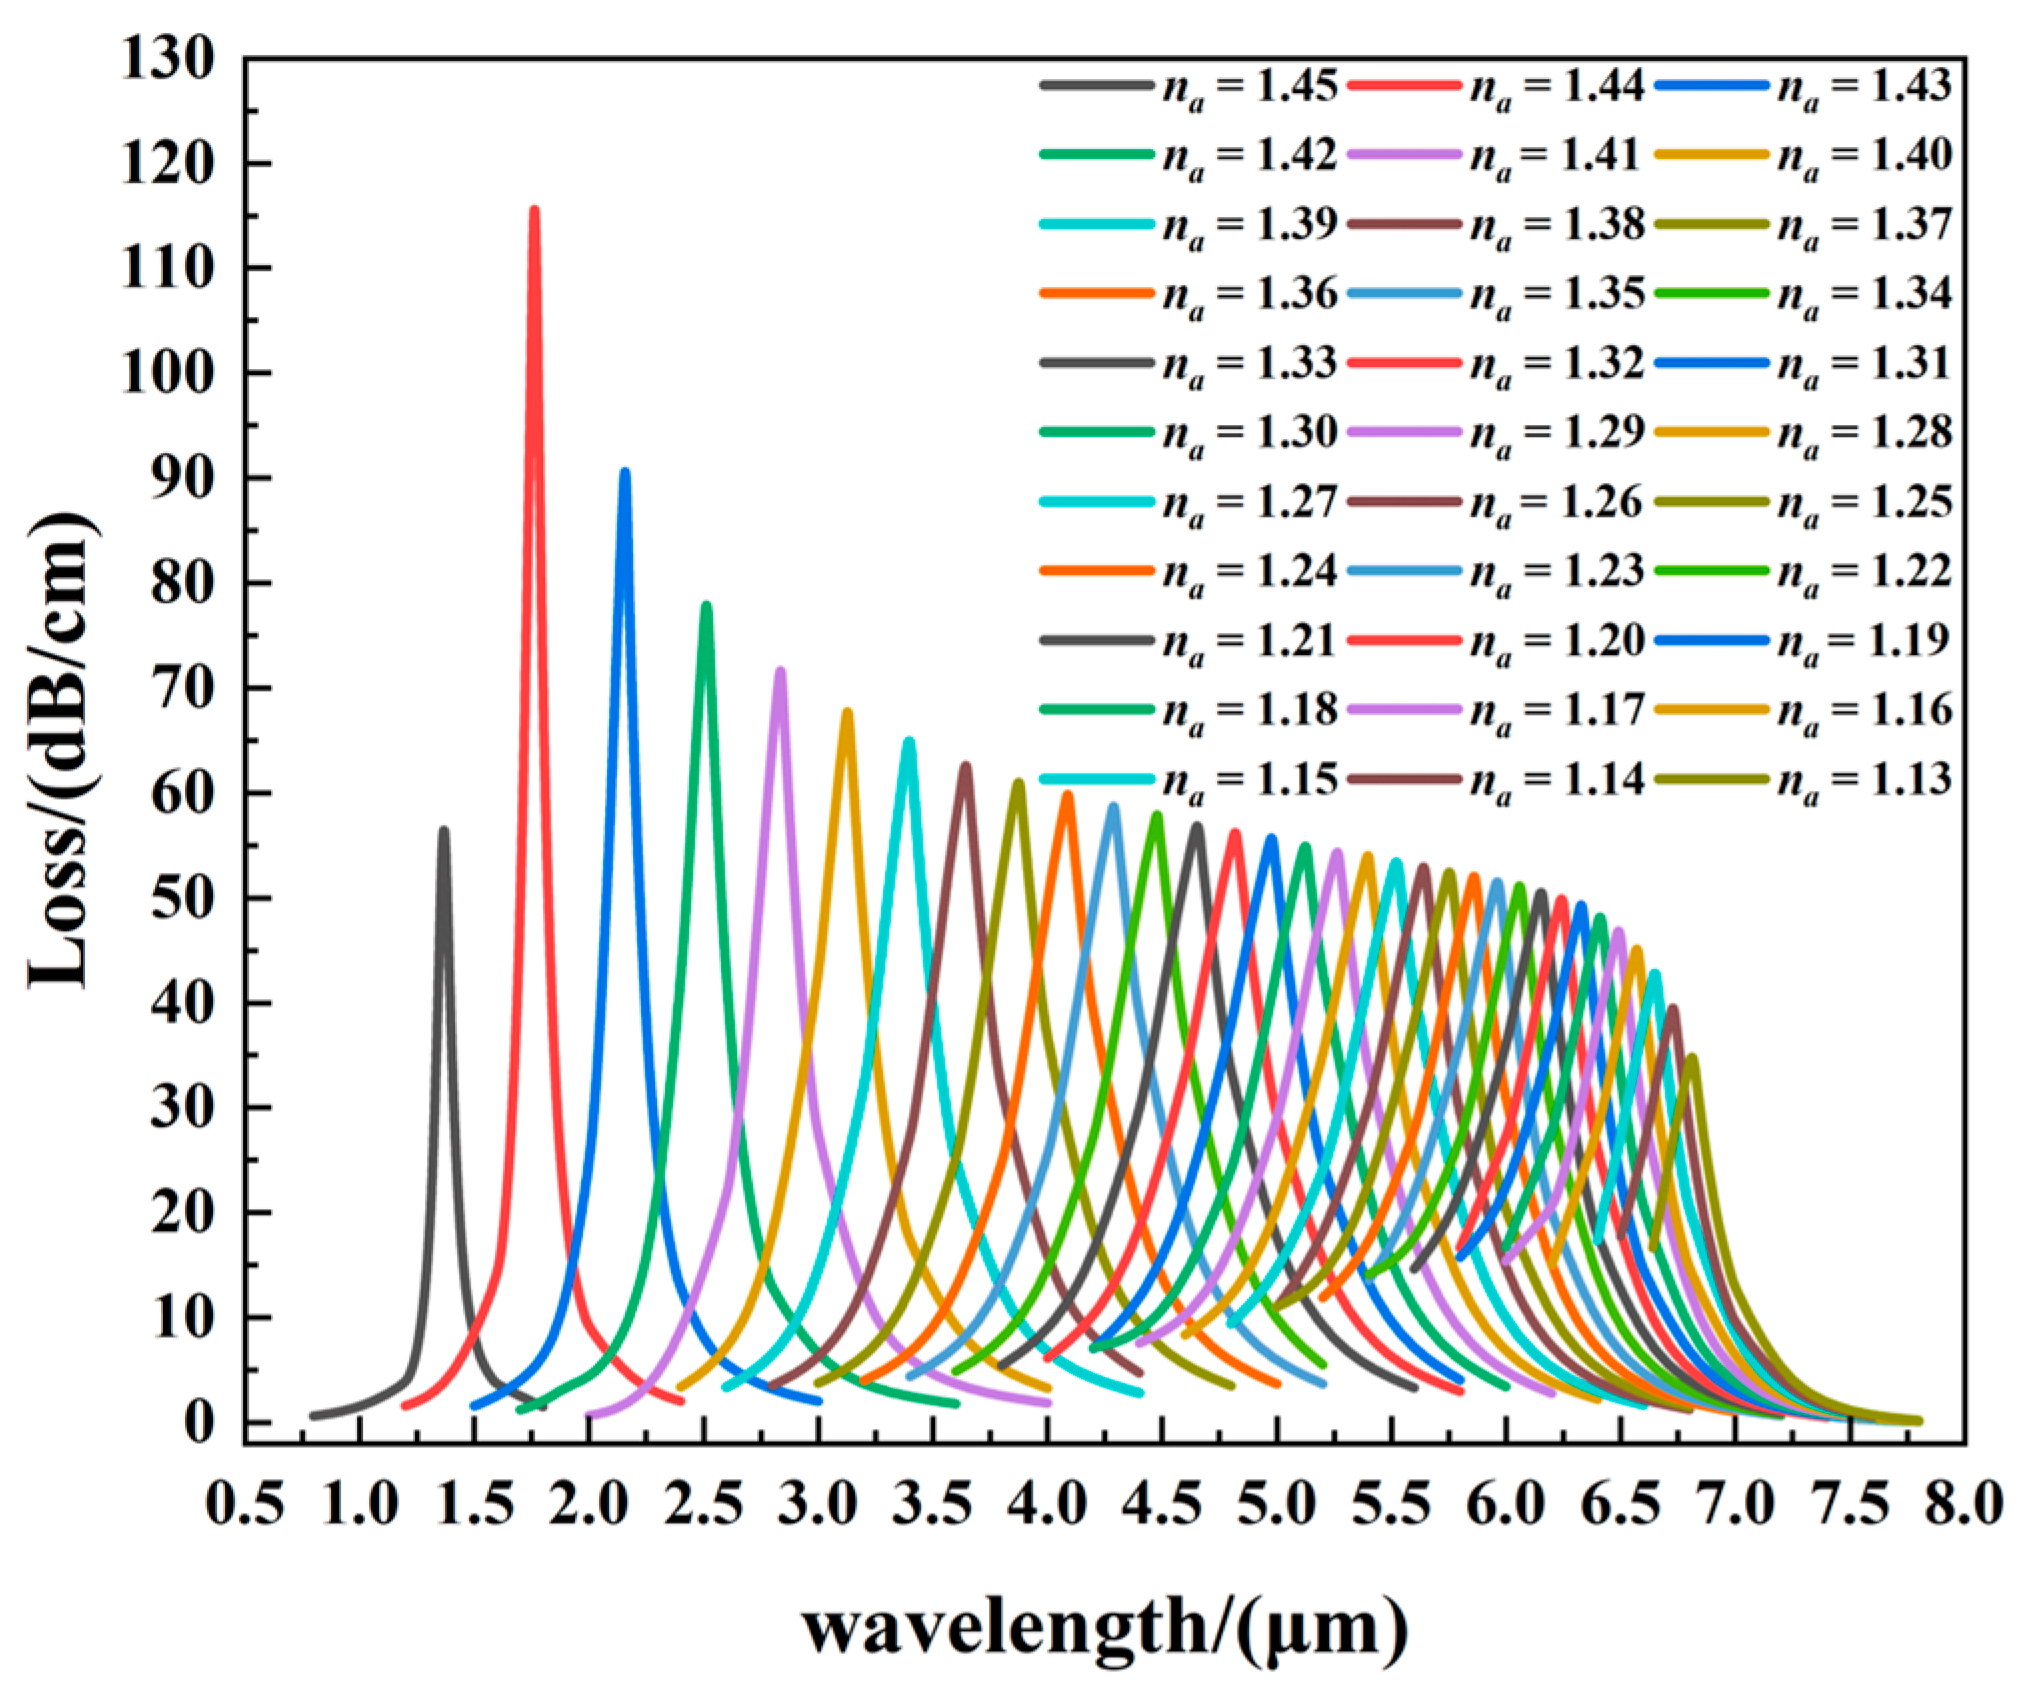
Figure 9 exhibits the fundamental mode and SPP mode at different wavelengths and reveals the changes in the electric fields between the fundamental mode and SPP mode during the coupling process. As shown in Figure 9a,d, when the incident wavelength is less than the resonant wavelength, the energy of the fundamental mode and SPP mode is limited to the ring-core region and near the metal, and hence, energy transfer is not significant. As the wavelength approaches the resonant wavelength, a portion of the energy is transferred from the fundamental mode to the SPP mode. At the resonant wavelength, as shown in Figure 9b,e, the energy exchange between the fundamental mode and SPP mode is the largest, and coupling is the strongest. At this point, the SPR is excited. Figure 9c,f show that when the incident wavelength exceeds the resonant wavelength, some of the energy transferred from the fundamental mode to the SPP mode returns to the fundamental mode. The process of exciting the SPR is actually a process of energy conversion. When the phase-matching condition is satisfied, strong coupling occurs between the fundamental mode and the SPP mode, and the intensity of the reflected light drops sharply and reaches a minimum value, forming a depression in the transmission spectrum. However, for different RIs, the coupling degree between the fundamental mode and SPP mode varies, and the peak loss changes. When the RI range is 1.13–1.45, the loss spectrum of the sensor is as shown in Figure 10. When the analyte RI increases, the resonance wavelength of the fundamental mode blue-shifts and the loss peak first increases and then diminishes. The RI range is from 1.13 to 1.44, and the fundamental mode loss is positively correlated with the resonance wavelength. When na = 1.44–1.45, the peak loss declines sharply. The resonance peak becomes sharper and the coupling between the two modes becomes better. It is seen that changing the refractive index of surrounding medium will also change the position of the resonance peak. The shift of the resonance peak can inverse the change in the characteristic physical parameters of the medium to detect the refractive index of the analyte.

3.2. Wavelength Sensitivity and Resolution

To evaluate the performance of PCF-SPR sensors, sensitivity and resolution are the two critical parameters. When SPR sensors use the wavelength detection methods, one of the important indicators is the wavelength sensitivity, which is defined as the drift of the resonance wavelength caused by changes in unit RI, as shown in Equation (4) [37]:
S ( λ ) = Δ λ p e a k Δ n a
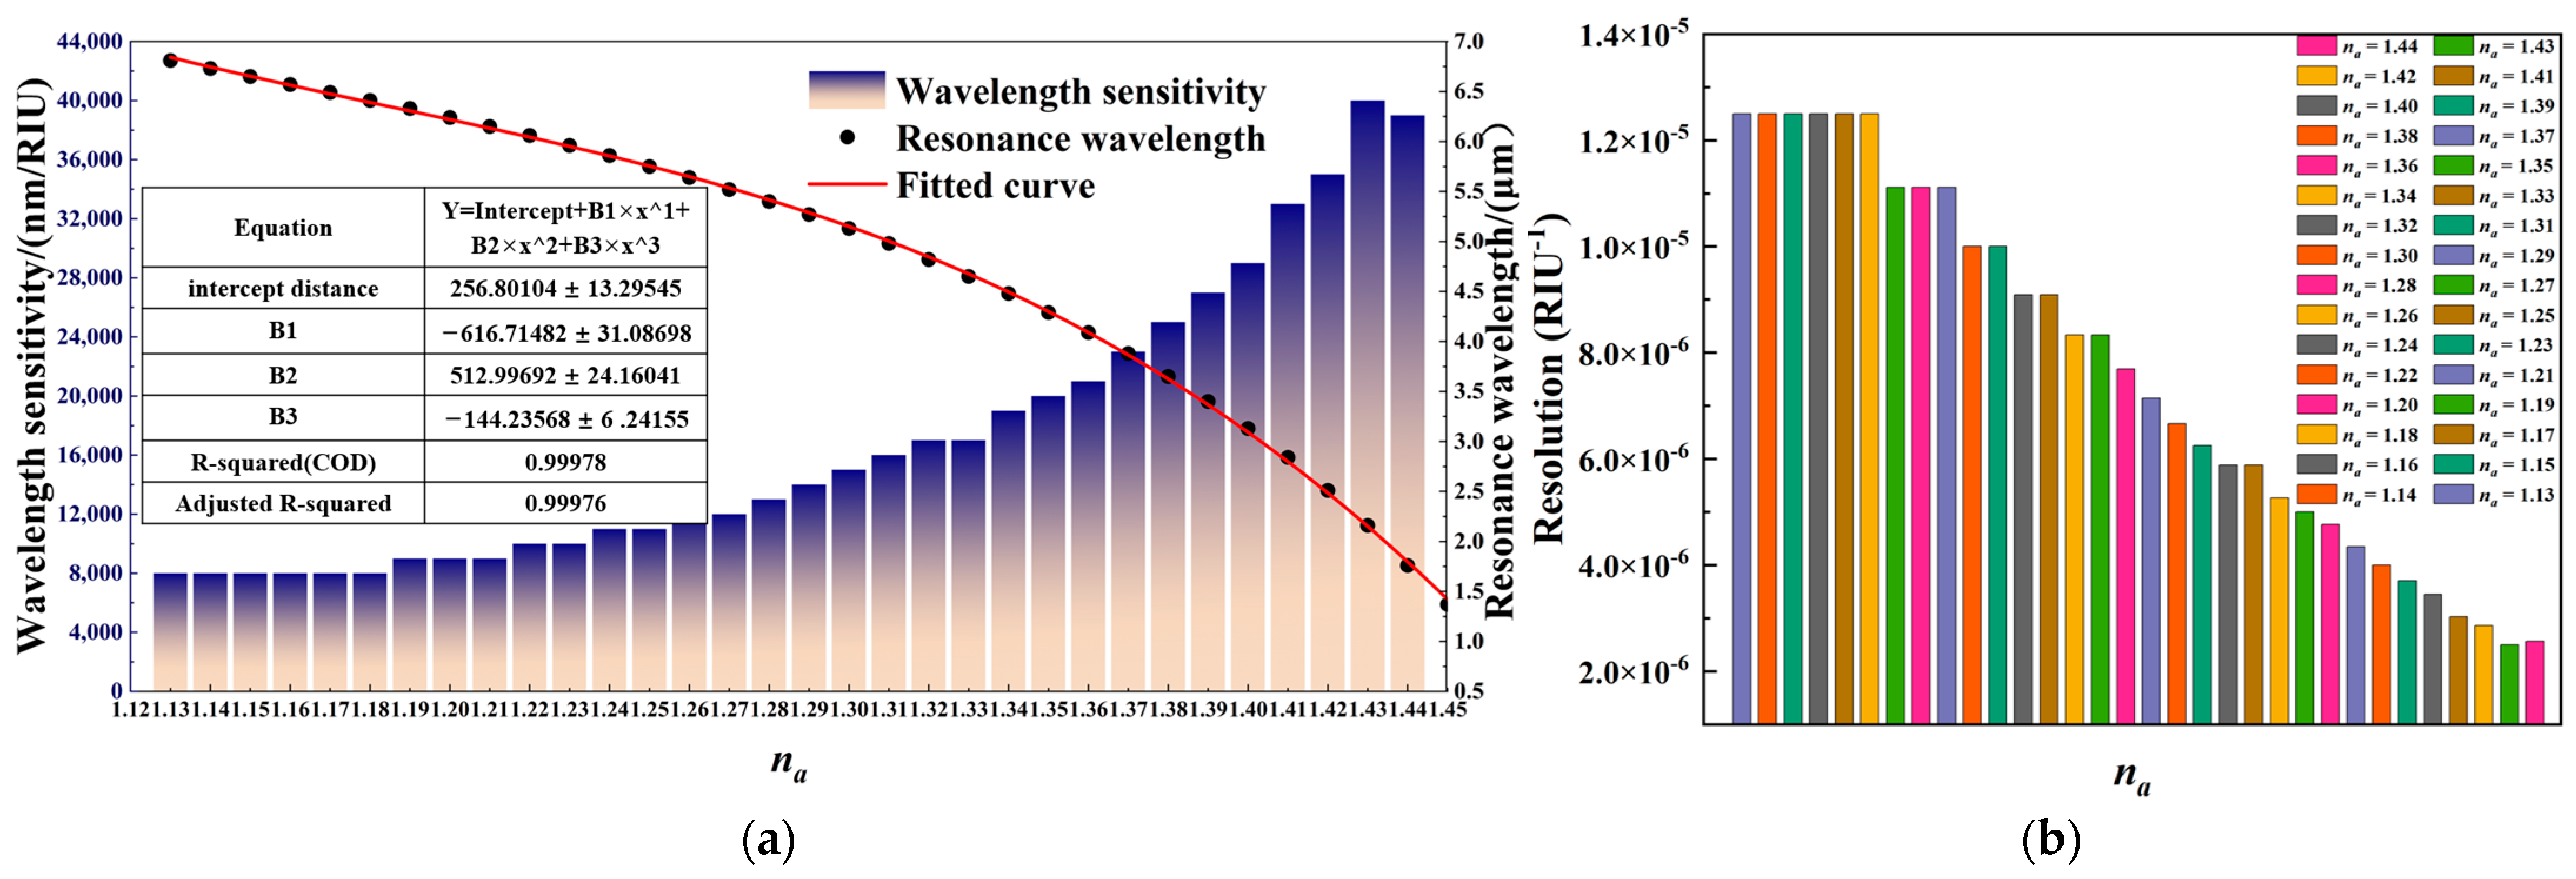
where Δλpeak is the resonance wavelength shift and Δna represents the change in the analyte RI. The wavelength sensitivity of the sensor is shown in Figure 11a. The wavelength sensitivity increases with increasing analyte RIs. When the RI is 1.43, the maximum wavelength sensitivity is 40,000 nm/RIU, and the average wavelength sensitivity of the entire detection range is 17,000 nm/RIU. Figure 11a discloses the resonance wavelength variations. As the RI increases, the resonance wavelength blue-shifts. When the RI is in the range of 1.13–1.45, the response curve of the sensor exhibits nonlinear changes. The relationship between the RI and resonant wavelength of the analyte obtained by polynomial fitting is shown in Equation (5):
Y = I N T E R C E P T + B 1 X + B 2 X 2 + B 3 X 3
where INTERCEPT = 256.80104 ± 13.29545, B1 = −616.71482 ± 31.08698, B2 = 512.99692 ± 24.16041 and B3 = −144.23568 ± 6.24155.
The resolution reflects the minimum RI change that the sensor can detect from the analyte, as shown in Equation (6) [38]:
R = Δ λ min S ( λ )
where the minimum resolution wavelength Δλmin = 0.1 nm and S(λ) is the sensitivity of the corresponding wavelength. Figure 11b presents the resolution of the sensor in the detection range. When the RI goes up, the resolution decreases. In some RI ranges, the resolution remains almost unchanged, and the optimal resolution is 2.56 × 10⁻⁶ RIU−1.

3.3. Structural Sensitivity

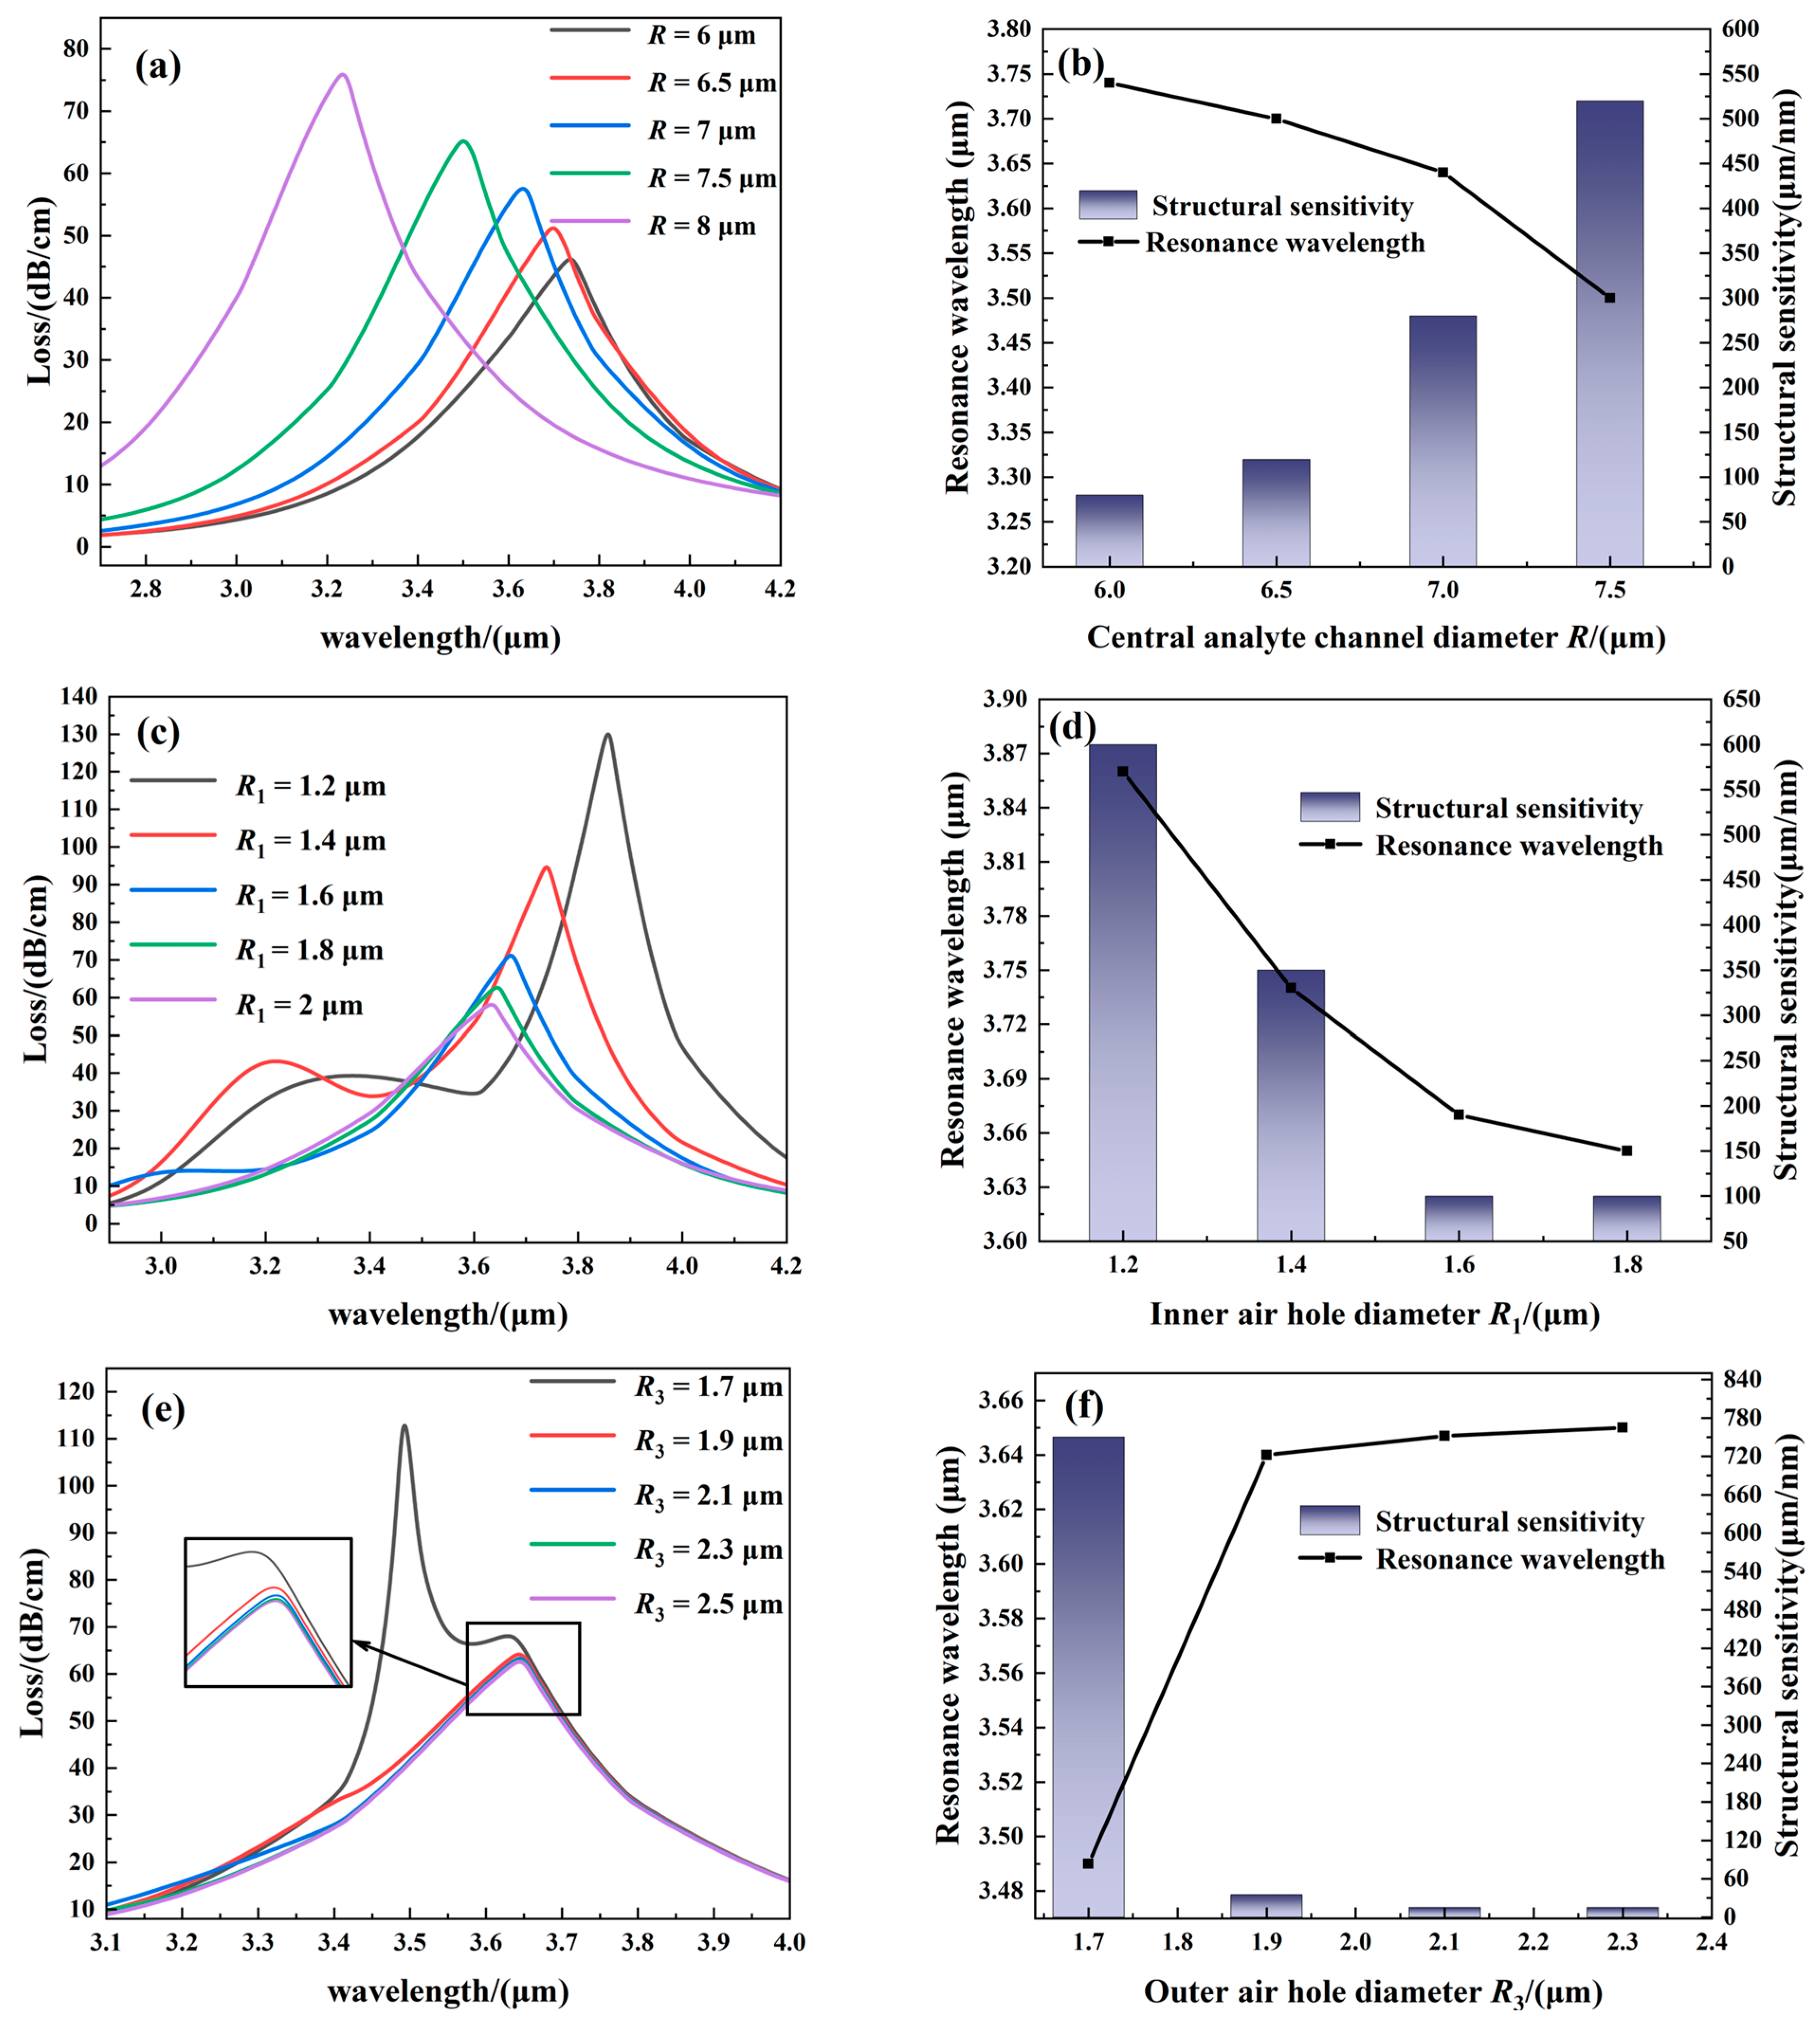
In manufacturing, there is normally a deviation between the actual preparation and theoretical simulated values. The structural sensitivity reflects the impact of the structural parameter changes on the sensing performance, which is described by the ratio of the wavelength to parameter changes. A smaller structural sensitivity increases the stability and the tolerance of production errors. Consequently, when designing PCF-SPR sensors, the impact of structural parameters should be minimized. Figure 12a–d describe the structural sensitivity of R, R1, and R3 for an RI of na = 1.38. Figure 12a,b show that as R3 increases, the resonance wavelength blue-shifts. A larger R3 reduces the distance between the fundamental mode and SPP mode to boost the resonance intensity. At the same time, the structural sensitivity is proportional to the diameter of the analyte channel. For an inner layer air hole diameter R1 shown in Figure 12c,d, as R1 goes up, the resonance wavelength shifts towards shorter wavelengths. The reason for the declining resonance intensity is that the spacing between the air holes in the cladding decreases, thus hindering the energy leakage of the fundamental mode to the SPP mode. The overall structural sensitivity shows a downward trend, and in the range of 1.6 μm to 1.8 μm, the structural sensitivity stabilizes at 100 nm. Figure 12e,f show that when the diameter R3 of the outer air hole increases, the resonance wavelength red-shifts, while the loss and structure sensitivity decrease. When the diameter of the air hole is 1.9 μm, the loss curve basically coincides and the changes in the structural sensitivity decrease gradually, indicating that when the outer air hole has a certain value, the alteration of the structural parameters has less effect on the sensor performance.

3.4. Amplitude Sensitivity

To simplify the measurement of the sensitivity of the PCF, in addition to the wavelength method, the amplitude method is adopted. The sensitivity of the PCF sensor can be expressed by the amplitude sensitivity (7) [39]:
s A ( λ ) = 1 α ( λ , n a ) α ( λ , n a ) n a
where ∂α(λ,na) is the loss at a certain wavelength when the RI of the analyte is na, α(λ,na) is the difference in the loss caused by changes in the RIs of adjacent analytes, and ∂na is the change in the RI of the analyte. Figure 13 shows the changes in the amplitude sensitivity for different RIs. When the RI goes up, the amplitude sensitivity increases first and then decreases. The curve of amplitude sensitivity is similar, showing no obvious changes in the range of 1.13–1.38. The peak appears in the range of 1.38–1.44, and the maximum amplitude sensitivity of the sensor is 2052 RIU−1.

3.5. FOM

FOM is a physical quantity that measures the overall performance of a sensor. It reflects the comprehensive quality of the loss spectrum and is defined as the ratio of wavelength sensitivity to FWHM for the RI of a specific analyte by Equation (8) [40]:
FOM = S ( λ ) FWHM
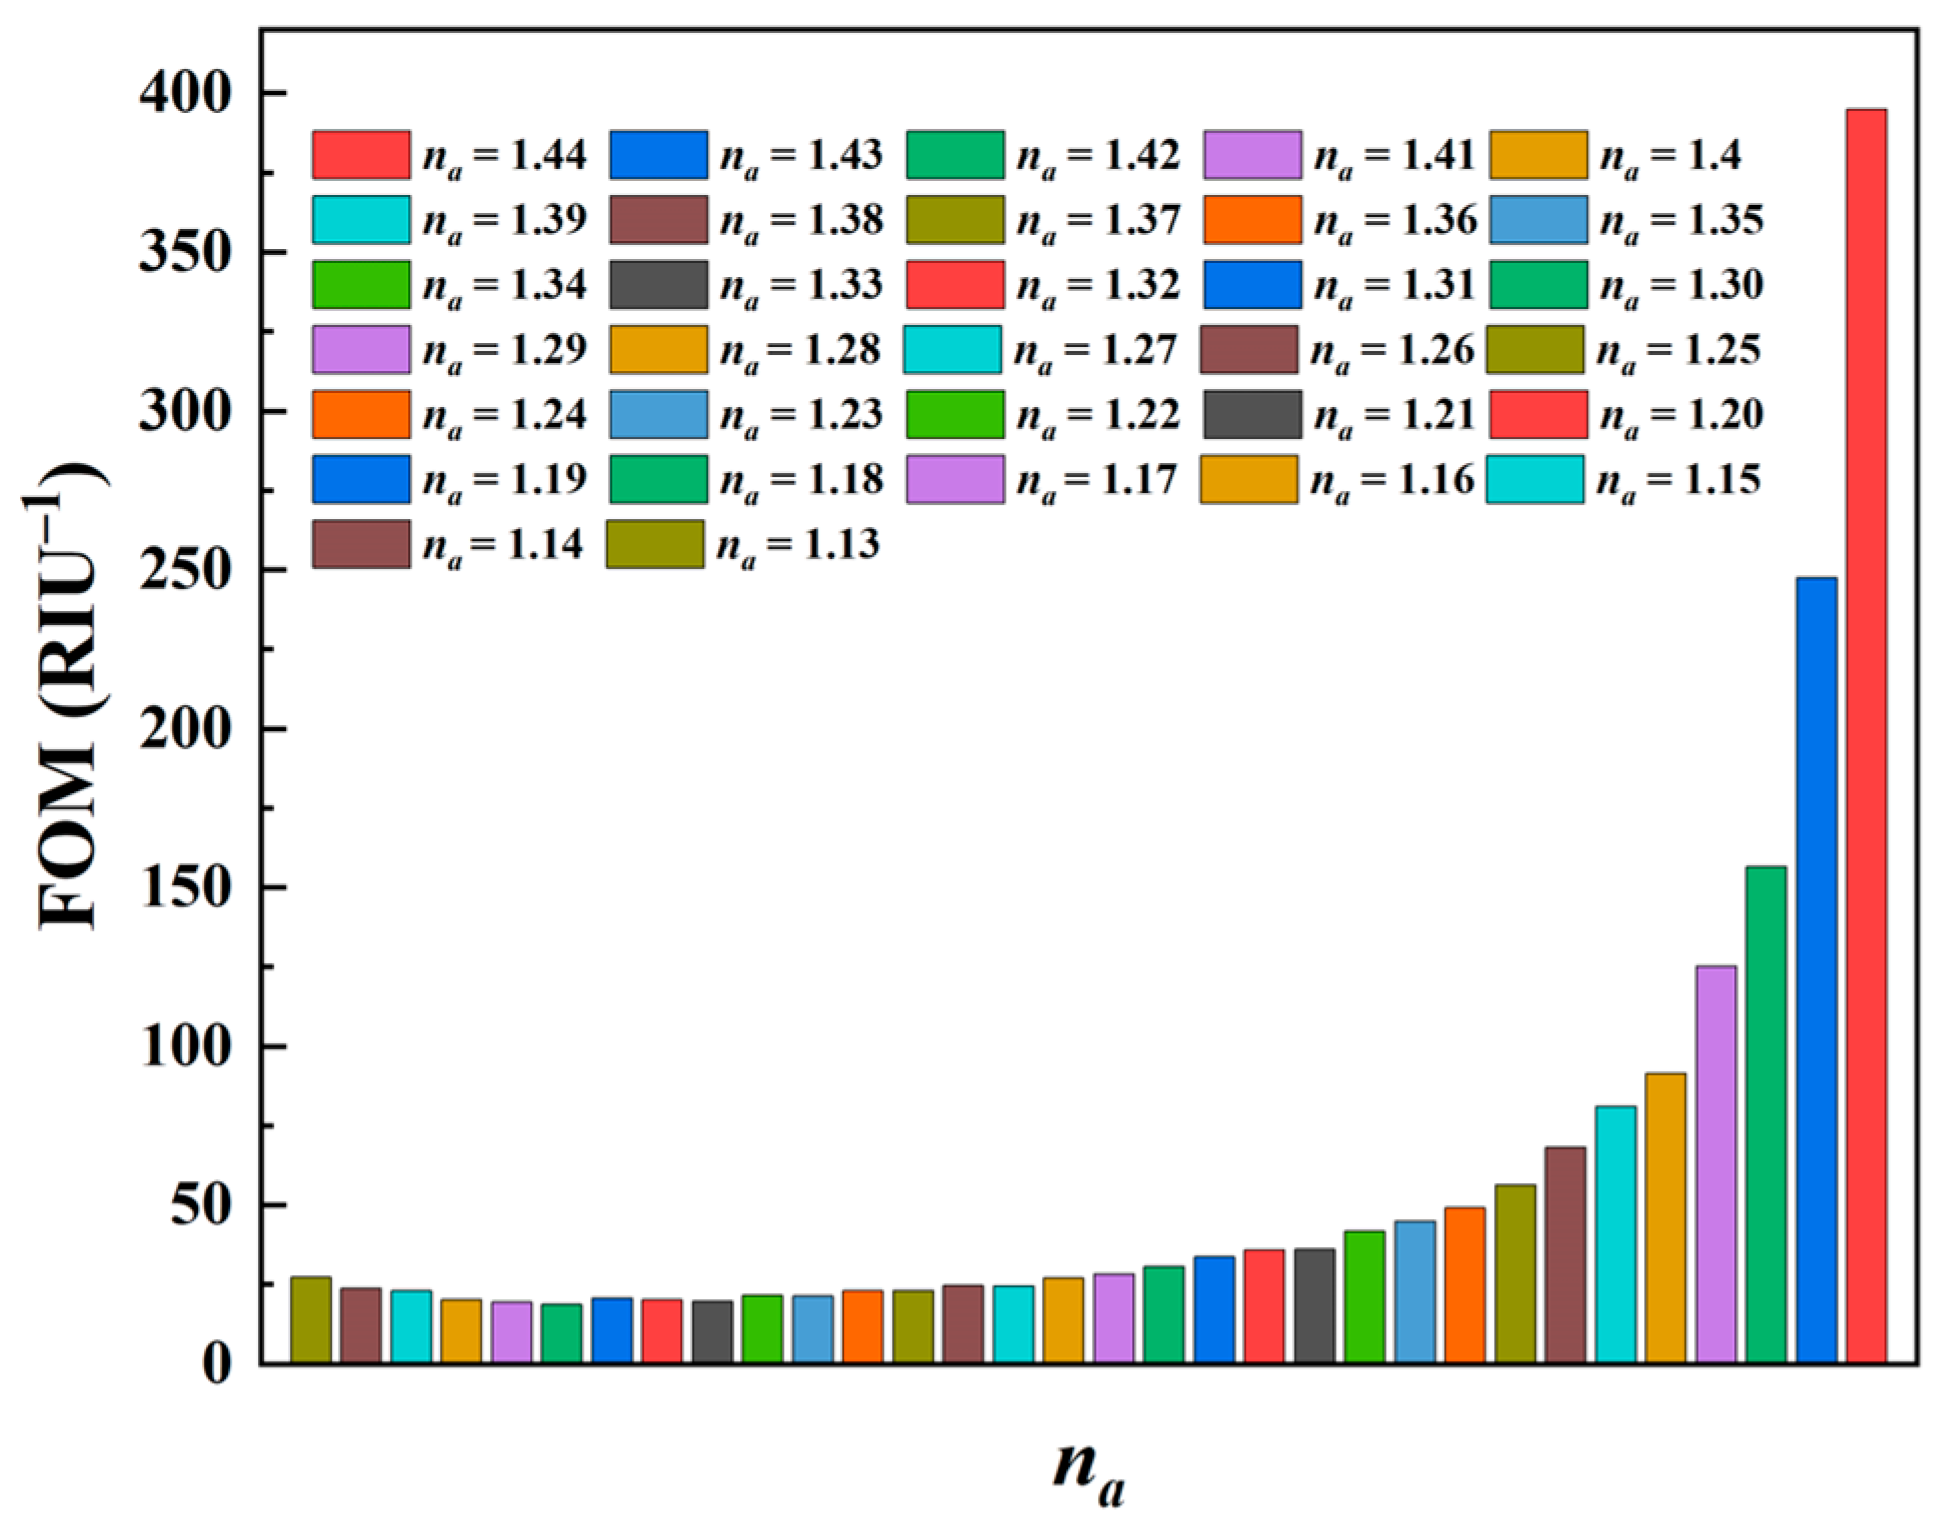
where FWHM is the full width at half maximum. The FWHM must be considered in practical applications in addition to the sensitivity, resolution, and other indicators of the sensor. The accuracy of the resonance wavelength of SPR sensors depends on the FWHM. Figure 14 presents the relationship between FOM and RIs. As the RI goes up, FOM increases. When the RI is 1.44, the maximum FOM is 394 RIU−1.

3.6. Comparison of Properties

To illustrate the advantages of the PCF-SPR sensor, the important characteristics are compared with those of similar sensors reported recently, and as shown in Table 1, in comparison with the traditional solid-core structures, our PCF sensor not only has a better structure but also shows higher sensitivity in a wide RI range of 1.13–1.45.

4. Conclusions

A new ring-core PCF-SPR sensor with high sensitivity and a wide detection range was designed. The SPP mode was excited by directly filling the gold medium to simplify the preparation. The ring-core structure exhibits a high degree of coupling between modes. Using the wavelength sensitivity and FOM as the main indicators, the COMSOL software was used to analyze the analyte channel, inner layer air hole, and outer layer air. The numerical results indicate that the stable detection of the RI of the analyte was accomplished in a wide RI range between 1.13 and 1.45. When the RI of the analyte is 1.43, the maximum wavelength sensitivity, amplitude sensitivity, and resolution are 40,000 nm/RIU, 2141 RIU−1, and 2.5 × 10⁻⁶ RIU−1, respectively. The sensor also delivers high performance in terms of the FOM and FWHM. Within the detection range, the FOM is 394 RIU−1 and the FWHM is less than 0.5 μm. It thus has great potential in many applications, such as petrochemical and environmental detection.

Author Contributions

Methodology, J.W.; formal analysis, J.L.; investigation, W.L.; data curation, L.Y.; writing-original draft, J.H.; supervision, Q.L.; project administration, C.L.; funding acquisition, P.K.C. and C.L. All authors have read and agreed to the published version of the manuscript.

Funding

This work was jointly supported by Heilongjiang Provincial Natural Science Foundation of China [JQ2023F001], Outstanding young and middle-aged research and innovation team of Northeast Petroleum University [KYCXTD201801], Local Universities Reformation and Development Personnel Training Supporting Project from Central Authorities, Postdoctoral scientific research development fund of Heilongjiang Province (LBH-Q20081), City University of Hong Kong Donation Research Grant [DON-RMG No. 9229021], City University of Hong Kong Strategic Research Grant [SRG 7005505], and City University of Hong Kong Donation Grant [9220061].

Institutional Review Board Statement

Not applicable.

Informed Consent Statement

Not applicable.

Data Availability Statement

Not applicable.

Conflicts of Interest

The authors declare no conflict of interest.

References

  1. Culshaw, B. Optical fiber sensor technologies: Opportunities and-perhaps-pitfalls. J. Light. Technol. 2004, 22, 39. [Google Scholar] [CrossRef]
  2. Chen, X.; Xia, L.; Li, C. Surface plasmon resonance sensor based on a novel D-shaped photonic crystal fiber for low refractive index detection. IEEE Photonics J. 2018, 10, 1–9. [Google Scholar] [CrossRef]
  3. Liu, W.; Hu, C.; Zhou, L.; Yi, Z.; Liu, C.; Lv, J.; Yang, L.; Chu, P.K. A square-lattice D-shaped photonic crystal fiber sensor based on SPR to detect analytes with large refractive indexes. Phys. E Low-Dimens. Syst. Nanostructures 2022, 138, 115106. [Google Scholar] [CrossRef]
  4. Liu, W.; Shi, Y.; Yi, Z.; Liu, C.; Wang, F.; Li, X.; Lv, J.; Yang, L.; Chu, P.K. Surface plasmon resonance chemical sensor composed of a microstructured optical fiber for the detection of an ultra-wide refractive index range and gas-liquid pollutants. Opt. Express 2021, 29, 40734–40747. [Google Scholar] [CrossRef]
  5. Liu, W.; Liu, C.; Wang, J.; Lv, J.; Lv, Y.; Yang, L.; An, N.; Yi, Z.; Liu, Q.; Hu, C. Surface plasmon resonance sensor composed of microstructured optical fibers for monitoring of external and internal environments in biological and environmental sensing. Results Phys. 2023, 47, 106365. [Google Scholar] [CrossRef]
  6. Liu, C.; Lü, J.; Liu, W.; Wang, F.; Chu, P.K. Overview of refractive index sensors comprising photonic crystal fibers based on the surface plasmon resonance effect. Chin. Opt. Lett. 2021, 19, 102202. [Google Scholar] [CrossRef]
  7. Hien, N.D. Optical properties of a single quantum well with Pöschl–Teller confinement potential. Phys. E Low-Dimens. Syst. Nanostructures 2023, 145, 115504. [Google Scholar] [CrossRef]
  8. Zhukova, L.; Salimgareev, D.; Lvov, A.; Yuzhakova, A.; Korsakov, A.; Belousov, D.; Lipustin, K.; Kondrashin, V. Highly transparent ceramics for the spectral range from 1.0 to 60.0 µm based on solid solutions of the system AgBr–AgI–TlI–TlBr. Chin. Opt. Lett. 2021, 19, 021602. [Google Scholar] [CrossRef]
  9. Butt, M.; Khonina, S.; Kazanskiy, N. Plasmonics: A necessity in the field of sensing—A review. Fiber Integr. Opt. 2021, 40, 14–47. [Google Scholar] [CrossRef]
  10. Jain, S.; Choudhary, K.; Kumar, S. Photonic crystal fiber-based SPR sensor for broad range of refractive index sensing applications. Opt. Fiber Technol. 2022, 73, 103030. [Google Scholar] [CrossRef]
  11. Singh, Y.; Raghuwanshi, S.K. Titanium dioxide (TiO2) coated optical fiber-based SPR sensor in near-infrared region with bimetallic structure for enhanced sensitivity. Optik 2021, 226, 165842. [Google Scholar] [CrossRef]
  12. Liu, W.; Hu, C.; Zhou, L.; Yi, Z.; Liu, C.; Lv, J.; Yang, L.; Chu, P.K. Ultra-sensitive hexagonal PCF-SPR sensor with a broad detection range. J. Mod. Opt. 2020, 67, 1545–1554. [Google Scholar] [CrossRef]
  13. Xiong, Y.; Shepherd, S.; Tibbs, J.; Bacon, A.; Liu, W.; Akin, L.D.; Ayupova, T.; Bhaskar, S.; Cunningham, B.T. Photonic crystal enhanced fluorescence: A review on design strategies and applications. Micromachines 2023, 14, 668. [Google Scholar] [CrossRef] [PubMed]
  14. Gauvreau, B.; Hassani, A.; Fehri, M.F.; Kabashin, A.; Skorobogatiy, M. Photonic bandgap fiber-based surface plasmon resonance sensors. Opt. Express 2007, 15, 11413–11426. [Google Scholar] [CrossRef] [PubMed] [Green Version]
  15. Hassani, A.; Skorobogatiy, M. Design criteria for microstructured-optical-fiber-based surface-plasmon-resonance sensors. J. Opt. Soc. Am. B 2007, 24, 1423–1429. [Google Scholar] [CrossRef]
  16. Wang, J.; Pei, L.; Wu, L.; Wang, J.; Ruan, Z.; Zheng, J. A polarization-independent SPR sensor based on photonic crystal fiber for low RI detection. Plasmonics 2020, 15, 327–333. [Google Scholar] [CrossRef]
  17. Liang, H.; Shen, T.; Feng, Y.; Liu, H.; Han, W. A D-Shaped photonic crystal fiber refractive index sensor coated with graphene and zinc oxide. Sensors 2020, 21, 71. [Google Scholar] [CrossRef]
  18. Ramani, U.; Kumar, H.; Singh, B.K.; Pandey, P.C. Design of surface plasmon resonance based both side polished photonic crystal fiber for highly efficient refractive index sensor. Optik 2021, 248, 168062. [Google Scholar] [CrossRef]
  19. Yang, H.; Wang, G.; Lu, Y.; Yao, J. Highly sensitive refractive index sensor based on SPR with silver and titanium dioxide coating. Opt. Quantum Electron. 2021, 53, 341. [Google Scholar] [CrossRef]
  20. Islam, M.S.; Sultana, J.; Dinovitser, A.; Ng, B.W.-H.; Abbott, D. A gold coated plasmonic sensor for biomedical and biochemical analyte detection. In Proceedings of the 2018 43rd International Conference on Infrared, Millimeter, and Terahertz Waves (IRMMW-THz), Nagoya, Japan, 9–14 September 2018; pp. 1–2. [Google Scholar]
  21. Liu, W.; Hu, C.; Zhou, L.; Yi, Z.; Shi, Y.; Liu, C.; Lv, J.; Yang, L.; Chu, P.K. A highly sensitive D-type photonic crystal fiber infrared sensor with indium tin oxide based on surface plasmon resonance. Mod. Phys. Lett. B 2022, 36, 2150499. [Google Scholar] [CrossRef]
  22. Hossain, M.B.; Mahendiran, T.; Abdulrazak, L.F.; Mehedi, I.M.; Hossain, M.A.; Rana, M.M. Numerical analysis of gold coating based quasi D-shape dual core PCF SPR sensor. Opt. Quantum Electron. 2020, 52, 446. [Google Scholar] [CrossRef]
  23. Liu, W.; Wang, F.; Liu, C.; Yang, L.; Liu, Q.; Su, W.; Lv, J.; An, S.; Li, X.; Sun, T. A hollow dual-core PCF-SPR sensor with gold layers on the inner and outer surfaces of the thin cladding. Results Opt. 2020, 1, 100004. [Google Scholar] [CrossRef]
  24. Noman, A.A.; Haque, E.; Hossain, M.A.; Hai, N.H.; Namihira, Y.; Ahmed, F. Sensitivity enhancement of modified D-shaped microchannel PCF-based surface plasmon resonance sensor. Sensors 2020, 20, 6049. [Google Scholar] [CrossRef]
  25. Liu, C.; Fu, H.; Lv, Y.; Yi, Z.; Lin, J.; Lv, J.; Yang, L.; Chu, P.K. HE1, 1 mode-excited surface plasmon resonance for refractive index sensing by photonic crystal fibers with high sensitivity and long detection distance. Optik 2022, 265, 169471. [Google Scholar] [CrossRef]
  26. Zhou, X.; Cheng, T.; Li, S.; Suzuki, T.; Ohishi, Y. Practical sensing approach based on surface plasmon resonance in a photonic crystal fiber. OSA Contin. 2018, 1, 1332–1340. [Google Scholar] [CrossRef]
  27. Luan, N.; Yao, J. A hollow-core photonic crystal fiber-based SPR sensor with large detection range. IEEE Photonics J. 2017, 9, 1–7. [Google Scholar] [CrossRef]
  28. Paul, A.K.; Habib, M.S.; Hai, N.H.; Razzak, S.A. An air-core photonic crystal fiber based plasmonic sensor for high refractive index sensing. Opt. Commun. 2020, 464, 125556. [Google Scholar] [CrossRef]
  29. Rachana, M.; Charles, I.; Swarnakar, S.; Krishna, S.V.; Kumar, S. Recent advances in photonic crystal fiber-based sensors for biomedical applications. Opt. Fiber Technol. 2022, 74, 103085. [Google Scholar] [CrossRef]
  30. Mumtaz, F.; Roman, M.; Zhang, B.; Abbas, L.G.; Dai, Y.; Ashraf, M.A.; Fiaz, M.A.; Kumar, A. MXene (Ti3C2Tx) coated highly-sensitive D-shaped photonic crystal fiber based SPR-biosensor. Photonics Nanostructures-Fundam. Appl. 2022, 52, 101090. [Google Scholar] [CrossRef]
  31. Islam, M.R.; Iftekher, A.; Hasan, K.R.; Nayen, M.J.; Islam, S.B.; Islam, R.; Khan, R.L.; Moazzam, E.; Tasnim, Z. Surface plasmon resonance based highly sensitive gold coated PCF biosensor. Appl. Phys. A 2021, 127, 118. [Google Scholar] [CrossRef]
  32. Fan, Z.; Chu, S.; Zhang, X.; Meng, J.; Fan, Y.; Zhang, Y. Two Kinds of Liquid Crystal Filled PCFs Temperature and RI Sensors Based on SPR. IEEE Sens. J. 2023, 23, 5766–5772. [Google Scholar] [CrossRef]
  33. Pandey, S.K.; Singh, S.; Prajapati, Y. A novel PCF design with an ultra-flattened dispersion and low confinement loss by varying tiny air-hole concentration at core and cladding. Opt. Rev. 2021, 28, 304–313. [Google Scholar] [CrossRef]
  34. Wang, S.; Li, Z.; Yu, C.; Wang, M.; Feng, S.; Zhou, Q.; Chen, D.; Hu, L. Fabrication and laser behaviors of Yb3+ doped silica large mode area photonic crystal fiber prepared by sol–gel method. Opt. Mater. 2013, 35, 1752–1755. [Google Scholar] [CrossRef]
  35. Wang, S.; Feng, S.; Wang, M.; Yu, C.; Zhou, Q.; Li, H.; Tang, Y.; Chen, D.; Hu, L. Optical and laser properties of Yb3+-doped Al2O3–P2O5–SiO2 large-mode-area photonic crystal fiber prepared by the sol–gel method. Laser Phys. Lett. 2013, 10, 115802. [Google Scholar] [CrossRef]
  36. Xu, L.; Liu, C.; Shi, Y.; Yi, Z.; Lv, J.; Yang, L.; Wang, J.; Chu, P.K. High-sensitivity photonic crystal fiber methane sensor with a ring core based on surface plasmon resonance and orbital angular momentum theory. Optik 2023, 286, 170941. [Google Scholar] [CrossRef]
  37. Shakya, A.K.; Ramola, A.; Singh, S.; Van, V. Design of an ultra-sensitive bimetallic anisotropic PCF SPR biosensor for liquid analytes sensing. Opt. Express 2022, 30, 9233–9255. [Google Scholar] [CrossRef]
  38. Roh, S.; Chung, T.; Lee, B. Overview of the characteristics of micro-and nano-structured surface plasmon resonance sensors. Sensors 2011, 11, 1565–1588. [Google Scholar] [CrossRef] [Green Version]
  39. Kabashin, A.V.; Patskovsky, S.; Grigorenko, A.N. Phase and amplitude sensitivities in surface plasmon resonance bio and chemical sensing. Opt. Express 2009, 17, 21191–21204. [Google Scholar] [CrossRef] [PubMed]
  40. Islam, M.R.; Khan, M.M.I.; Siraz, S.; Mehjabin, F.; Rahman, M.; Islam, M.; Anzum, M.S.; Chowdhury, J.A.; Noor, F. Design and analysis of a QC-SPR-PCF sensor for multipurpose sensing with supremely high FOM. Appl. Nanosci. 2022, 12, 29–45. [Google Scholar] [CrossRef]
  41. Hoque, A.M.T.; Al-tabatabaie, K.F.; Ali, M.E.; Arshad, A.; Mitu, S.S.I.; Qureshi, K.K. U-grooved Selectively Coated and Highly Sensitive PCF-SPR Sensor for Broad Range Analyte RI Detection. IEEE Access 2023. [Google Scholar] [CrossRef]
  42. Irawan, D.; Ramadhan, K.; Fitmawati, F.; Hanto, D.; Widiyatmoko, B. High-Performance of Star-Photonics Crystal Fiber Based on Surface Plasmon Resonance Sensor. Indian J. Pure Appl. Phys. (IJPAP) 2022, 60, 727–733. [Google Scholar]
  43. Guo, Y.; Li, J.; Li, S.; Liu, Y.; Zhang, S.; Wang, J.; Wang, S.; Zhang, W.; Cheng, T.; Hao, R. Dual-polarized optical sensing of microstructure fiber with pentagonal-lattice based on surface plasmon resonance in the near-IR spectrum. Optik 2020, 202, 163671. [Google Scholar] [CrossRef]
  44. Fang, H.; Wei, C.; Yang, H.; Zhao, B.; Yuan, L.; Li, J. D-shaped photonic crystal fiber plasmonic sensor based on silver-titanium dioxide composite micro-grating. Plasmonics 2021, 16, 2049–2059. [Google Scholar] [CrossRef]
  45. Kaur, V.; Singh, S. Design of titanium nitride coated PCF-SPR sensor for liquid sensing applications. Opt. Fiber Technol. 2019, 48, 159–164. [Google Scholar] [CrossRef]
Figure 1. Cross-section of the ring-core PCF-SPR sensor.
Coatings 13 01207 g001
Figure 2. Coupling effects of the HE1,1 mode x−polarization state, HE1,1 mode y−polarization state, and HE2,1 mode with the SPP mode for na = 1.38.
Coatings 13 01207 g002
Figure 3. HE1,1 mode electric field distributions: (a) x−polarization and (b) y−polarization; (c) HE2,1 mode electric field distributions.
Coatings 13 01207 g003
Figure 4. (a) Loss curves; (b) wavelength sensitivity, and (c) relationship between FOM and FWHM: na = 1.38, 1.39, corresponding to a central analyte channel diameter of 6 μm ≤ R ≤ 8 μm.
Coatings 13 01207 g004
Figure 5. (a) Loss peak; (b) wavelength sensitivity, and (c) relationship between FOM and FWHM: na = 1.38, 1.39, corresponding to the inner air hole diameter of 1.2 μm ≤ R1 ≤ 2 μm.
Coatings 13 01207 g005
Figure 6. (a) Loss peak; (b) wavelength sensitivity, and (c) relationship between FOM and FWHM: na = 1.38, 1.39, corresponding to the outer air hole diameter of 1.7 μm ≤ R3 ≤ 2.5 μm.
Coatings 13 01207 g006
Figure 7. Schematic of the detection process using the PCF-SPR sensor.
Coatings 13 01207 g007
Figure 8. Relationship between the effective RIs and wavelengths of the fundamental mode and SPP mode as well as influence of the wavelengths on the fundamental mode loss.
Coatings 13 01207 g008
Figure 9. (ac) Distributions of the electric field of the fundamental mode and (df) electric fields of the SPP mode at 1800 nm, 2200 nm, and 2400 nm.
Coatings 13 01207 g009
Figure 10. Loss spectra of the fundamental mode for na = 1.13–1.4.
Coatings 13 01207 g010
Figure 11. (a) PCF-SPR sensor wavelength sensitivity (histogram) and linear fitting of the resonance wavelengths and analyte RIs (dotted line); (b) resolution of the PCF-SPR sensor.
Coatings 13 01207 g011
Figure 12. (a) Loss peak and (b) structural sensitivity of the PCF-SPR sensor: na = 1.38, corresponding to a central analyte channel diameter of 6 μm ≤ R ≤ 7.5 μm; (c) loss peak and (d) structural sensitivity of the PCF-SPR sensor: na = 1.38, corresponding to inner air hole diameter of 1.2 μm ≤ R1 ≤ 1.8 μm; (e) loss peak and (f) structural sensitivity of the PCF-SPR sensor: na = 1.38, corresponding to the outer air hole diameter of 1.7 μm ≤ R3 ≤ 2.3 μm.
Coatings 13 01207 g012
Figure 13. Changes in the amplitude sensitivity with wavelength.
Coatings 13 01207 g013
Figure 14. Relationship between the overall characteristics of the PCF-SPR sensor and the analyte RIs.
Coatings 13 01207 g014
Table 1. Comparison of the characteristics of our sensor with those of recently reported PCF-SPR sensors.
RefCharacteristicRI RangesWavelength Sensitivity Range (nm/RIU)Resolution (RIU)
[41]Solid−PCF1.29–1.40600–12,5008.0 × 10−6
[42]Solid−PCF1.30–1.391000–12,0005.4 × 10−5
[43]Solid−PCF1.32–1.38X-pol:N/A—10,286
Y-pol:N/A—9464
9.72 × 10⁻⁶
[44]Solid−PCF1.33–1.402400–10,3009.71 × 10−6
[45]Eccentric−core PCF1.385–1.405000–10,0002.0 × 10−5
This workRing−core PCF1.13–1.458000–40,0002.5 × 10−6
Disclaimer/Publisher’s Note: The statements, opinions and data contained in all publications are solely those of the individual author(s) and contributor(s) and not of MDPI and/or the editor(s). MDPI and/or the editor(s) disclaim responsibility for any injury to people or property resulting from any ideas, methods, instructions or products referred to in the content.