Abstract
DZ22B alloy is commonly used as a blade material for aircraft engines and gas turbines, and its preparation process is an important factor affecting its performance. In the present work, a reliable numerical model is established through ProCAST numerical simulation and auxiliary experimental verification methods, based on which the effect of casting speed on the grain and dendrite growth of DZ22B superalloy blades is studied. The results indicate that increasing the pulling speed can reduce the spacing between secondary dendrites, which is beneficial for the growth of dendrites. Based on numerical simulation and experimental verification, it is suggested that the pulling rate of the directional solidification DZ22B superalloy blade should be 6-2 mm/min variable speed pulling to improve the production success rate.
1. Introduction
Nickel-based superalloys have been widely used in aero engines and gas turbines to produce turbine blades with excellent high-temperature tensile strength, stress fracture, and creep properties [1,2,3,4,5,6,7]. DZ22B nickel-based superalloy has good casting performance, high-temperature oxidation resistance, and corrosion resistance, and is a common material for directional column crystal blades of aero engines [8,9,10]. However, during the solidification process, the blade is often prone to casting defects such as holes, shrinkage, and hot cracks [11,12]. Random testing of samples in different furnaces shows that the qualification rate of the samples is low, and through analysis, it is found that the main reason is defects such as slag inclusions or cracks in the samples.
Pulling speed has always been one of the most important process parameters in the directional solidification process of DZ22B superalloy blades, which affects the growth rate of dendrite tips, is closely related to the temperature gradient of the leading liquid phase of the solid-liquid interface, and also affects the occurrence of various defects in the casting process [13,14,15,16,17,18,19,20]. Therefore, the method of combining experiment and numerical simulation is used to study the effect of pulling speed on grain and dendrite growth of DZ22B superalloy blades [21], and the optimization parameters can be proposed in a targeted manner.
2. Establishment of ProCAST Numerical Simulation Model
2.1. Pre-Process Run Parameters
The casting material is DZ22B superalloy from the first author’s affiliation with Aecc South Industry Company Limited, and the alloy composition is shown in Table 1. By consulting the manual [22] and combining the Procast database, the thermal physical parameters of some DZ22B superalloys are obtained as shown in Figure 1. Firstly, in order to ensure the uniformity of the composition, the DSC sample is taken from the DZ22B master alloy rather than the blade. Furthermore, a sample of about 20 mg is cut from the base metal of the DZ22B alloy, and the DSC curve is measured by using the DSC404F3 differential scanning calorimeter. As shown in Figure 1g, it can be concluded that the liquid temperature of DZ22B is 1392.6 °C and the solid temperature is 1330.9 °C. While the heat transfer coefficients of the mold shell and water-cooled crystallizer have constant values, the interfacial heat transfer coefficient between the casting and the mold shell changes with temperature according to the actual casting phase. For instance, in the solid phase range, this coefficient is 600 W·m−2·K−1, value that increases in the melting process to a range of 600–1500 W·m−2·K−1; according to the solid-liquid proportion, above the liquid phase is 1500 W·m−2·K−1. Other simulation parameters are shown in Table 2.

Table 1.
Chemical composition of DZ22B superalloy (wt.% ).
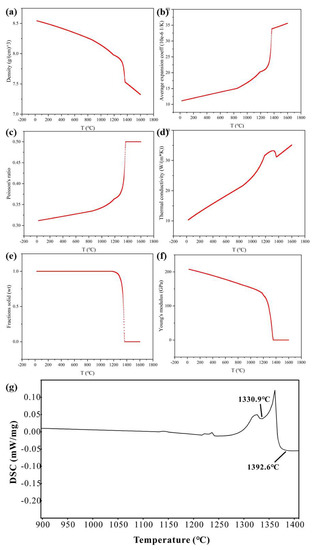
Figure 1.
Thermophysical parameters as a function of temperature, (a) Temperature—density. (b) Temperature—average coefficient of expansion. (c) Temperature—Poisson’s ratio. (d) Temperature—thermal conductivity. (e) Temperature—solid fraction. (f) Temperature—Young’s modulus. (g) DSC curve.
Table 2.
Main simulation parameters.
2.2. Casting and Mold Shell Model Building and Meshing
In the actual directional solidification casting production, it requires a longer time for the entire directional solidification process, which includes preheating and solidification cooling. Thus, the form of multiple blades in one mold is generally used to improve casting production efficiency.
Figure 2a is a three-dimensional model diagram of the casting of DZ22B superalloy blades with multiple sets of blades established by UG modeling software. The casting consists of a gating system, blades and a chassis, and the casting consists of 12 blades with an axisymmetric distribution as a whole.
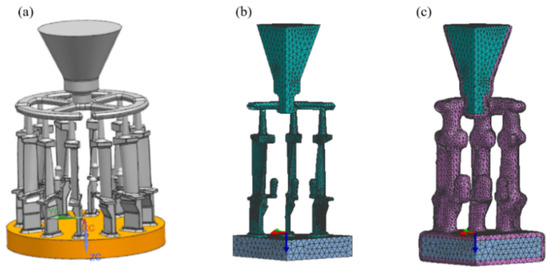
Figure 2.
A multi-set blade geometry model and mesh model. (a) geometric model; (b) quarter mesh model and (c) shell mesh model with shell thickness of 8 mm.
Firstly, the model was split into quarters by using the UG modeling software because the model structure is symmetrical. Furthermore, considering the complexity of the turbine blade structure, the visual-mesh model was used to segment the surface mesh. The mesh was refined at the exhaust edge of the blade body and the small size of the truncated surface to ensure that there are enough mesh layers in the cross-sectional thickness direction, as shown in Figure 2b. Finally, the assembly of each part of the mesh was carried out after careful inspection and repair. The non-shaped shell surface and two symmetrical surfaces were specified. The thickness of the shell is set to 8mm, and the shell mesh is generated as shown in Figure 2c.
2.3. Temperature Field Heat Transfer Model
In the directional solidification process, the metal pouring and solidification steps of turbine blade castings take place in a vacuum environment. In the simulation of the whole process of directional solidification, the geometry of the furnace, the shape of the blades on the quenching plate, and the pulling speed are very important. The heat transfer process of the directional solidification process can be described by the law of conservation of energy, which can be written as:
where T is temperature; t is time; is the density of matter; is the specific heat of the material; is the thermal conductivity; is an internal heat source; is the heat flux density between the surface element and the environment. When solidifying, the liquid alloy releases latent heat, and the internal heat source can be expressed as:
In the formula, H is the latent heat, is the volume fraction of the solid phase, and the heat flux density of different directional solidification technologies is different. Using the improved Monte Carlo ray tracing model [23], the thermal radiation between the current cell and the nth reference unit is calculated as:
where is the Stefan-Boltzmann constant; “N = 50” is the number of rays; is an energy factor; T, , and S are the temperature, blackness coefficient, and surface area of the surface unit, respectively. , , and are the surface temperature, blackness coefficient, t, and surface area of the nth element, respectively.
2.4. Grain and Dendrite Growth Models
In order to simulate grain growth during the solidification process of superalloys, an improved correspondence analysis (CA) method is used [24,25]. The total nucleation point density n(ΔT) given a supercooled ΔT is calculated using the continuous nucleation model [24]:
According to the Kurz-Giovanola-Trivedi (KGT) [26] kinetic equation, the growth rate of the interdendrite during solidification v(T) is:
where and are kinetic coefficients.
2.5. Thermal Crack Susceptibility Model
In order to predict the thermal cracking sensitivity of castings, a thermal cracking sensitivity model based on Gurson’s constitutive model is used [27] hot tearing indicator (HTI). The model is based on a strain-driven model of total strain during solidification. When the solids fraction is in the range of critical solids fraction (typically 50%) and 99%, the model calculates the elastoplastic strain at a given node and describes the thermal crack sensitivity of the casting by considering the initiation and growth of pores in the mushy zone of the casting. HTI is defined as follows:
where is the critical cumulative effective plastic strain at the beginning of the hot cracking state, is the time at the condensation temperature at which the liquid state begins to transition to a solid state, and is the effective plastic strain rate, and the time at the solid phase temperature. HTI is actually a cumulative plastic strain in the semi-solid region corresponding to the pore nucleus. Therefore, it can reflect the sensitivity of hot cracking during solidification. Gurson’s constitutive model and the proposed HTI model are implemented in ProCAST finite element software, and HTI should be used to explore different influencing factors of the same alloy.
3. Procast Numerically Simulates the Effect of Pulling Speed on DZ22B Superalloy Blades
3.1. Effect of Pulling Speed on Temperature Field of DZ22B Superalloy Blade
In order to investigate the effect of pulling speed on the temperature field of DZ22B superalloy blades during directional solidification while keeping other simulation parameters such as shell wall thickness, thermal conductivity of the mold shell, interfacial heat transfer coefficient, shell temperature, and insulation time unchanged. The ProCAST preprocessing module set the pulling speed to 2 mm/min, 6 mm/min, and 10 mm/min, respectively. The temperature field simulation results obtained are shown in Figure 3.
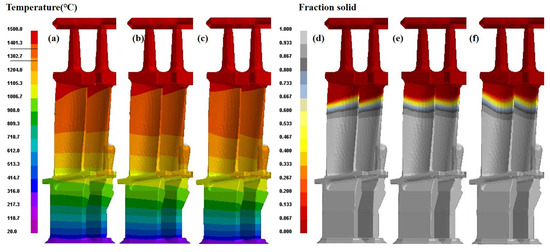
Figure 3.
Schematic diagram of the temperature field and the corresponding paste zone at different pulling speeds, (a,d) 2 mm/min. (b,e) 6 mm/min. (c,f) 10 mm/min.
From the simulation results, the change in pulling speed will significantly affect the temperature field and mushy zone. In the early stage of pulling, the whole casting has just entered the cooling area made of the water-cooled copper ring through the thermal insulation zone; the main heat dissipation method at this time is the cooling provided by the cold plate in contact with the bottom of the casting, and the three different pulling speeds have no obvious effect on the mushy zone at the lower end of the blade. The temperature gradient is large, and the isotherm interface is very flat. As the pulling progresses, the body of the blade begins to enter the cooling zone, at which time the cooling effect provided by the cold plate is weakened due to distance, and the furnace radiation plays the main role in heat dissipation. At this time, the isotherm at the blade position showed different shapes with the change of pumping speed, and the solid-liquid interface isotherm showed an upward convex form at 2 mm/min, and the mushy zone became uneven. When the pulling speed is 6 mm/min, the solid-liquid interface isotherm turns stable, and the mushy zone tends to be horizontal. When the pulling speed is increased to 10 mm/min, the solid-liquid interface isotherm is concave, the paste area deviates significantly from the straight state, and the solidification speed of the exhaust edge position is much greater than that of the intake side. The morphology of the mushy zone affects the growth trend of grains, and the speed of 6 mm/min at the three pulling speeds is more conducive to the growth of straight columnar crystals.
3.2. Effect of Pulling Speed on the Microstructure of DZ22B Superalloy Blades
Figure 4 shows the grain trend diagram at different pulling speeds, and it can be seen that the number of grains is not much different under the three pulling speeds, but the pulling speed has a certain influence on the grain direction. At low pulling speeds, the grain trend is relatively stable because the paste area is relatively stable. At the pulling speed of 10 mm/min, the paste area is concave, the grain trend has a tendency to diverge, the angle between the grain trend and the <001> direction in the microstructure is large, and the angle is close to 30°. Deviated grains can produce hetero-crystalline defects, which degrade the structure properties formed by the final solidification.
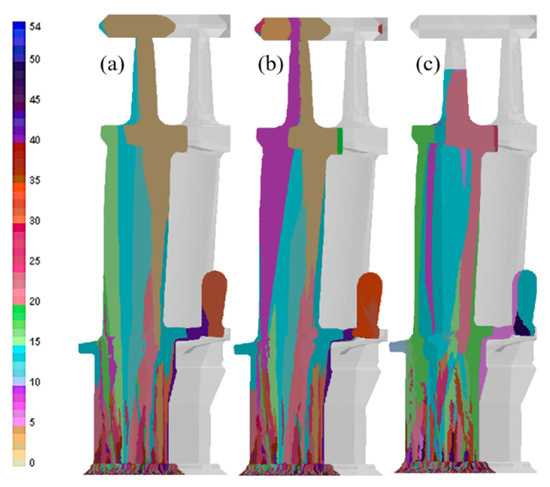
Figure 4.
Schematic diagram of grain direction at different pulling speeds, (a) 2 mm/min. (b) 6 mm/min. (c) 10 mm/min.
The simulation results show that the dendrites have not fully grown when the pulling speed is too high. Moreover, too fast pulling speed resulted in thenges bec growth direction of the casting changes because the thermal radiation direction of the blades is uncertain and the heat loss is excessive, leading the dendrites to be tilted. Too fast pulling speed will also make the growth of columnar crystals unstable; the upper part of the blade grain will be few and divergent, and even transverse columnar crystals may appear. Only by increasing the ratio of a temperature gradient to growth rate and adjusting to determine the appropriate pumping rate can better columnar crystals be obtained.
Adjusting the pulling speed is an artificially adjustable process to effectively change the cooling rate of castings, this change will be reflected in the dendrite spacing of the solidified structure of castings, especially on the secondary dendrite arm spacing (SDAS) with the same temperature gradient. Figure 5 shows the distribution of secondary dendrite spacing at different pulling speeds, and it can be seen that the secondary dendrite spacing significantly decreases with an increase in pulling speed. At a pumping speed of 2 mm/min, the SDAS range of the blade body position is between 44–56 μm; At a pumping speed of 6 mm/min, the SDAS range of the blade body position is between 36–48 μm; When the pulling speed is increased to 10 mm/min, the SDAS drops to 32–40 μm. The secondary dendrite spacing is reduced and the microstructure performance is improved, so an appropriate increase in the pulling speed can achieve the purpose of optimizing the structure.
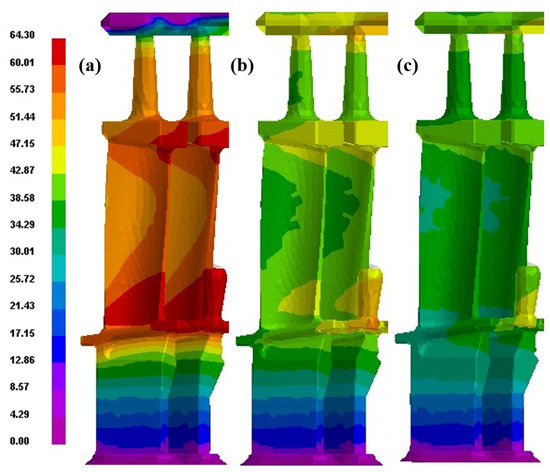
Figure 5.
Secondary dendrite spacing diagram at different pull-out speeds, (a) 2 mm/min. (b) 6 mm/min. (c) 10 mm/min.
3.3. Effect of Pulling Speed on the Thermal Cracking Tendency of DZ22B Superalloy Blade
Figure 6 is the effective plastic strain diagram of the blade and the corresponding thermal crack index HTI diagram at different pulling speeds, from which it can be seen that changing the pulling speed has a certain effect on the plastic strain and thermal cracking sensitivity of the blade after solidification. The chance of thermal cracking of the blade is lowest at a pulling speed of 6 mm/min, and only a small number of hot crack-sensitive areas are located at the junction of the upper part of the blade body with the blade crown. However, the thermal cracking sensitivity of the blade formed by directional solidification at lower or higher pulling speeds is large, and hot cracks may be formed in many places. The effective plastic strain value obtained by simulation has a certain relationship with the pulling speed, and the effective plastic strain of the blade at the pulling speeds of 2 mm/min and 10 mm/min is significantly greater than the pulling speed of 6 mm/min.
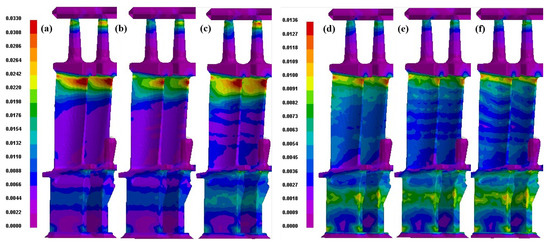
Figure 6.
Effective plastic strain diagram of the blade at different pulling speeds and HTI diagram of the thermal crack index, (a,d) 2 mm/min. (b,e) 6 mm/min. (c,f) 10 mm/min.
3.4. Experimental Verification
Experiments are conducted on blades with hot cracks produced by AECC Southern Industry Company Limited. The cracks are detected using fluorescence detection, while the macroscopic grain distribution is observed after the sample is corroded with hydrochloric acid, and it is found that the hot crack is generated in the middle and upper part of the exhaust side of the blade body; usually a crack penetrates the blade body. The fluorescence detection and macroscopic grain corrosion results are shown in Figure 7. The pulling speeds are 2 mm/min, 6 mm/min, and 10 mm/min for DZ22B superalloy blades, which are the same as those actually produced, and cross-sectional samples are prepared by taking the middle and upper positions of the blade body. SEM images of the blade pores after the corrosion process are obtained at various pulling speeds (Figure 8 and Figure 9).
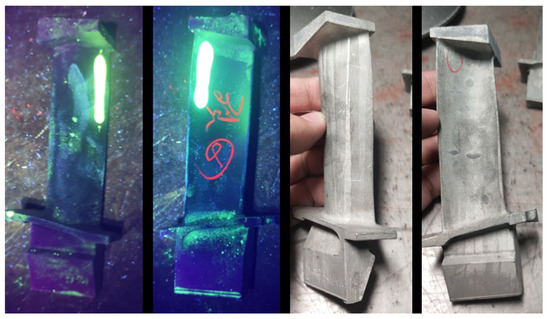
Figure 7.
The fluorescence detection and macroscopic grain corrosion of the hot cracked blade, and the red circle is the hot crack.
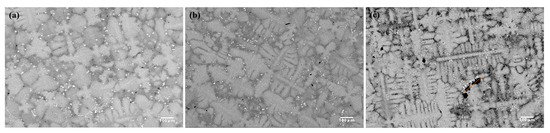
Figure 8.
Cylindrical specimen mid-pore SEM diagram at different pull-out speeds, (a) 2 mm/min. (b) 6 mm/min. (c) 10 mm/min.
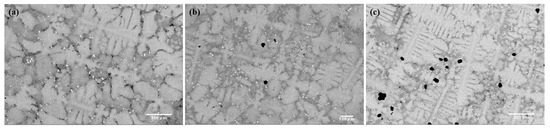
Figure 9.
SEM diagram of the upper porosity of a specimen at different pulling speeds, (a) 2 mm/min. (b) 6 mm/min. (c) 10 mm/min.
By observing the sample SEM diagram at different pulling speeds, it can be seen that as the pulling speed increases, the secondary dendrite spacing is significantly shortened, and the secondary dendrite spacing is the largest at the pulling speed of 2 mm/min, so its cracking tendency will be higher. The dendrite spacing depends mainly on the temperature gradient and the solidification rate R, the product of which is called the cooling rate, so (·R) determines the size of the dendrite spacing as follows:
In which, is the primary dendrite spacing; is the secondary dendrite spacing; is the capillary constant; is the temperature gradient at the front edge of the solid-liquid interface; k is the solute partition coefficient; is the concentration of alloying elements; is the diffusion coefficient of solute elements in the liquid phase; is the slope of the liquid line; k is the solidification rate; B is a constant; V is the pulling speed. It can be seen that for superalloys with fixed composition, except for and R, the other quantities have fixed values. Primary dendrite spacing, secondary dendrite spacing, and cooling rate (· R) satisfy a positively correlated relationship. In general, the increase in the pulling speed makes the temperature gradient of the liquid phase smaller but not large, the overall cooling rate (· R) increases, and the distance between primary and secondary dendrites decreases. In addition, with the continuous improvement of the pulling speed, the cooling rate of the blades accelerates, and the heat dissipation effect becomes better and better, resulting in the refinement of the cast dendrite structure, so the crystalline size also decreases. Therefore, the tendency for thermal cracking can be reduced to a certain extent by increasing the pulling speed.
The number of shrinkage holes at the three pulling speeds in the middle of the sample was relatively small; fine shrinkage holes were distributed between the dendrites at the pulling speeds of 2 and 6 mm/min, and irregular shrinkage holes were clustered together at the 10 mm/min pulling speed, and the pore length reached 160.2 μm. By observing the pore SEM diagram of three different pumping speeds in the upper part of the specimen, it can be found that with the increase in pulling speed, the number of pores increases significantly, and the shrinkage holes have aggregation at the pulling speed of 10 mm/min. The percentage of porosity at 2 mm/min, 6 mm/min, and 10 mm/min pulling speeds is calculated by Image-pro, which is 0.079%, 0.239%, and 0.643%, respectively; the faster the pulling speed, the more pores in the upper part of the test bar. When the pulling speed is 10 mm/min, although the transverse dendrite group obtained is small, it can be seen that the dendrite orientation is disordered and the occlusion of the longitudinal secondary dendrite is inadequate. The reason for this phenomenon is that the growth rate of the crystal is lower than the pulling rate, the solid-liquid interface growth front is below the insulation plate, the solidification environment of the axial one-dimensional heat flow changes, and the heat loss occurs along the transverse direction, resulting in dendrite orientation disorder. At the same time, a large pulling speed will increase the solidification rate of the blades and the volume of solidified solids per unit of time, thus releasing more heat from the latent heat of crystallization. Furthermore, it will decrease the negative temperature gradient parallel to the growth direction of the secondary dendrite and reduce the growth driving force, resulting in insufficient occlusion of the secondary dendrite. In addition, when the pulling speed is too fast, the radiation heat dissipation will deviate from the directional solidification direction, which can easily lead to oblique crystals and crystal-breaking defects. In short, excessive pulling speed will increase the tendency of alloy hot cracking.
In summary, with the increase in pulling speed, the cooling rate during the directional solidification of castings gradually becomes faster, while the primary and secondary dendrite spacing of the alloy decreases. When the pulling speed of directional solidification is too small, although the temperature gradient is improved, the cooling rate of the casting is slow, the dendrite spacing is large, and the solidification segregation is significant. When the directional solidification pulling speed is too large, although the cooling speed is fast and the dendrite spacing is small, it is not conducive to the sequential solidification of the casting, the secondary dendrite bite is insufficient, and the tendency to form micro constriction is increased; therefore, in order to reduce the enthusiastic tendency of directional solidification, a moderate pulling rate should be selected, and the experimental results are in good agreement with the simulation results.
4. ProCAST Numerically Simulates the Effect of Variable Speed Pulling Process on DZ22B Superalloy Blades
Turbine blades are often prepared at a single pulling rate in the industrial production of directional solidification. In the previous work, the influence of a constant pulling rate on the shape and temperature gradient of the solid-liquid interface, as well as the influence on the structural performance of blades, were systematically analyzed. Appropriate pulling speed can reduce the secondary dendrite spacing of microstructure, improve casting performance, reduce pore formation, and reduce the thermal crack sensitivity index. The uniform speed pulling law obtained above is applied to the exploration of the variable speed pulling process: the initial pulling rate is 6 mm/min, the pulling height is 110 mm, the later variable speed is 2 mm/min or 10 mm/min, and the pulling height is not less than 180 mm, and the pulling speed scheme of different parts of the blade is obtained as shown in Figure 10.
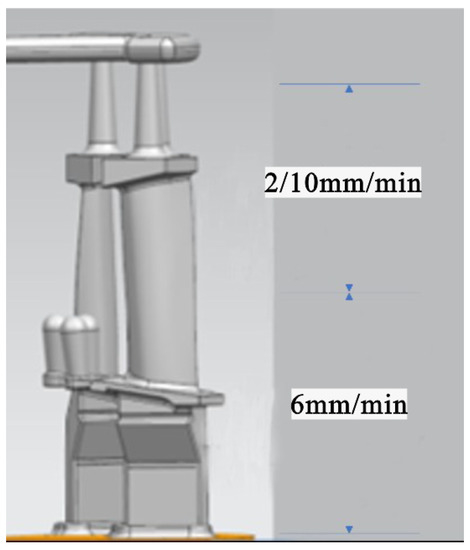
Figure 10.
Variable speed pulling scheme.
After measuring the blade length in advance, taking the position of the heat insulation baffle as the reference point, the pulling speed of 6 mm/min is adopted in the early stage because the alloy liquid is affected by the excited chill plate during the directional solidification in the early stage, the cooling gradient is very large, and the mushy area moves faster. The variable speed is realized below the marginal plate, and the effect of variable speed pulling on the hot cracking tendency of DZ22B alloy is studied from 6 mm/min to 2 mm/min or 10 mm/min.
4.1. Effect of Variable Speed Pulling on Temperature Field of DZ22B Superalloy Blade
The pulling speed has a great influence on the temperature gradient of the liquid phase at the front edge of the solid-liquid interface, and the regulation of the variable speed pulling process is directly reflected in the evolution of the temperature field and the morphological change of the mushy zone during the directional solidification process of the casting. The temperature field comparison chart of the 6–2 mm/min and 6–10 mm/min variable speed pulling processes is shown in Figure 11 and Figure 12; it is the comparison chart of the solidified mushy area of 6–2 mm/min and 6–10 mm/min variable speed pulling processes.
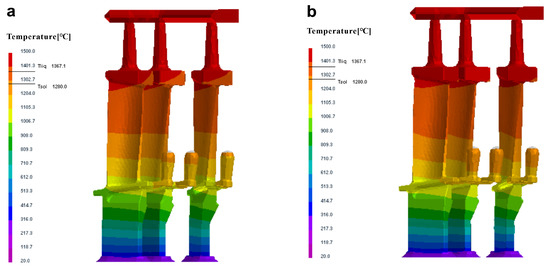
Figure 11.
ProCAST simulation of variable speed pulling directional solidification temperature field results, (a) 6–2 mm/min. (b) 6–10 mm/min.
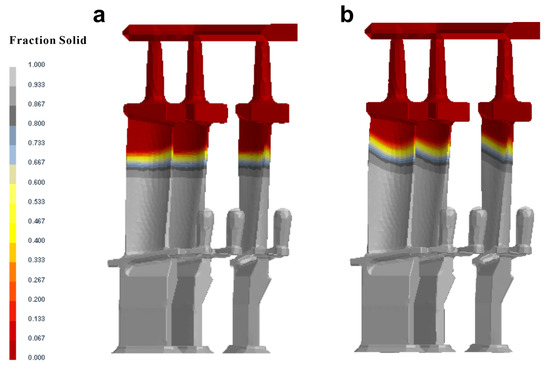
Figure 12.
ProCAST simulated variable speed pulling directional solidification mushy zone morphology, (a) 6–2 mm/min. (b) 6–10 mm/min.
When the mushy area is in the upper position, the casting has just completed the deceleration pulling of 6 mm/min–2 mm/min or the accelerated pulling of 6 mm/min–10 mm/min, it can be seen that the mushy area of the upper part of the blade in Figure 12a is relatively flat, while the mushy area of the upper part of the blade in Figure 12b is concave, which will affect the solidification behavior of the upper part of the blade, making the solidification structure uneven and easy to form uneven stress, resulting in hot cracks.
4.2. Effect of Variable Speed Pulling on the Thermal Cracking Tendency of DZ22B Superalloy Blade
Figure 13 and Figure 14 show the effective plastic strain diagram of the variable speed pulling blade and the corresponding thermal crack index HTI diagram, in which it can be seen that the plastic strain is concentrated in the upper position of the blade. It can be seen that the strain diagram of 6 mm/min slowing down to 2 mm/min or accelerating to 10 mm/min is obtained by decelerating the pulling speed to 2 mm/min or accelerating to 10 mm/min at the upper part of the blade, and the stress gap in the upper part of the blade is particularly obvious compared with the strain diagram accelerated to 10 mm/min. When the pulling rate accelerates to 10 mm/min, the cooling is accelerated due to the increase in speed, which increases the internal stress and finally leads to the generation of thermal cracking.
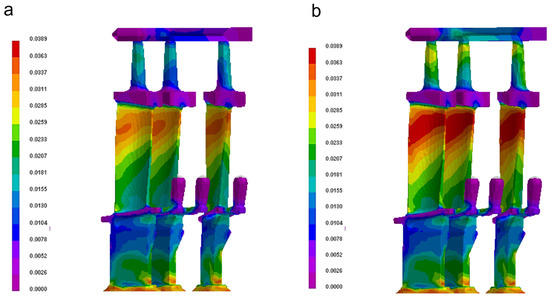
Figure 13.
Comparison of the equivalent force of variable speed pulling blades, (a) 6–2 mm/min. (b) 6–10 mm/min.
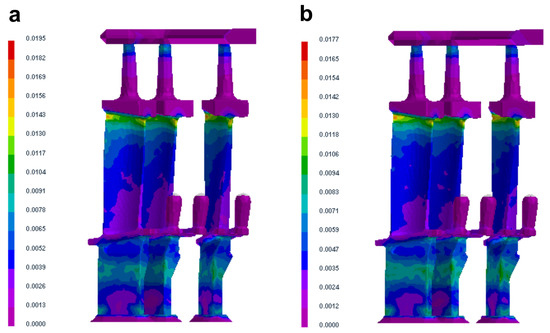
Figure 14.
Comparison of the thermal cracking tendency of variable speed pulling blades, (a) 6–2 mm/min. (b) 6–10 mm/min.
The color bars and corresponding numbers on the left side of the simulated image indicate the trend of the simulation parameters. In Figure 14, purple represents a small tendency for thermal cracking, while red represents a large tendency for thermal cracking. It can be seen from Figure 14 that the variable speed pulling rate of 6 mm/min–10 mm/min is larger than the variable speed pulling rate of 6 mm/min–2 mm/min, and the dark blue region is larger and the purple region is smaller, indicating that the area with a large thermal cracking tendency is wider. According to the simulation results of uniform pulling, it can also be seen that when the pulling rate is constant, the hot cracking tendency of the upper edge of the last solidified blade is greater, and the pulling rate should be reduced so that the last solidified part can be fully compensated, thereby reducing the thermal cracking tendency. Therefore, from the perspective of reducing the tendency of thermal cracking, a variable speed pulling rate of 6 mm/min–2 mm/min should be selected.
4.3. Experimental Verification
In order to study the effect of variable speed pulling rate on DZ22B directional solidification single crystal blades, three experiments with different variable speed pulling rates are designed, namely: (a) the first 110 mm crystal pulling speed is 6 mm/min, then reduced to 2 mm/min, the pulling height is not less than 180 mm. (b) The front and rear pulling rates remain unchanged, and the pulling speed is 6 mm/min. (c) The first 110 mm crystal pulling speed is 6 mm/min and then rises to 10 mm/min, and the pulling height is not less than 180 mm.
Through fluorescence non-destructive testing, no cracks were found at these three pulling rates, indicating that the change in pulling rate would not result in cracks. As shown in Figure 15, microcracks can be observed in the microstructures whose pulling rates are different. However, it should be noted that the crack size is significantly larger when the pulling rate is constant at 6 mm/min. Therefore, variable speed pulling can effectively reduce microcracks, thereby reducing the tendency for hot cracking.
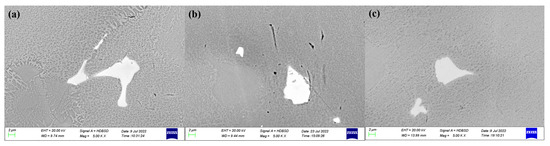
Figure 15.
SEM diagram of precipitated phase in the middle of the air intake side, (a) 6–2 mm/min. (b) 6–6 mm/min. (c) 6–10 mm/min.
Figure 16 shows the sampling position of the secondary dendrite spacing, no obvious cracks were found on the cut surface of each group of blades after sampling, and Figure 17 shows the secondary dendrite photos of the upper position of the blades with different pulling rates, and there is no obvious change in the secondary dendrite spacing in the area where the speed has changed. However, it can be observed that when the pulling rate is 6–10 mm/min, the dendrite orientation is disordered and the longitudinal secondary dendrite bite is insufficient. The microstructure of different pulling rates is shown in Figure 18: it can be found that the structure size is more uniform at the pulling rate of 6–2 mm/min, there is no abnormally developed secondary dendrite, and the grain trend is relatively stable.
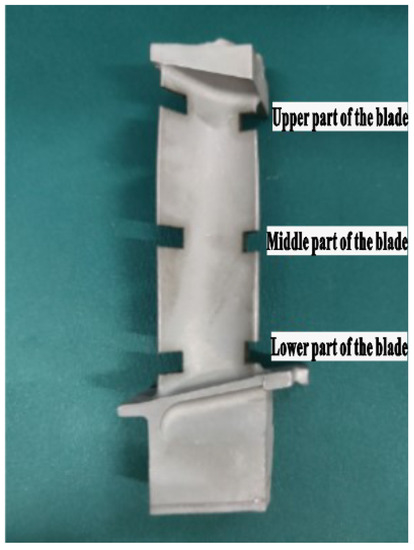
Figure 16.
Sampling position of secondary dendrite spacing.
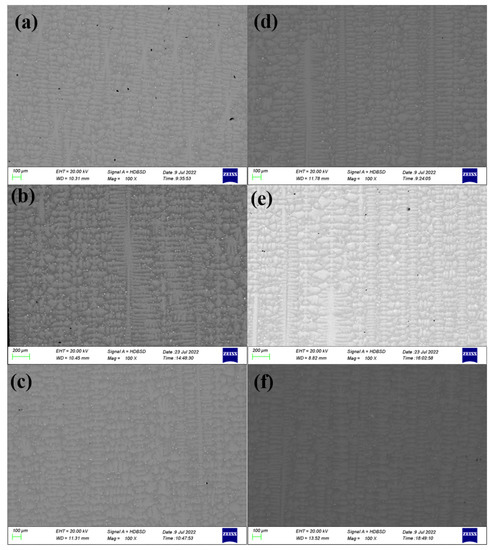
Figure 17.
Secondary dendrite SEM diagram at the upper position of the intake end, (a) 6–2 mm/min. (b) 6–6 mm/min. (c) 6–10 mm/min. Secondary dendrite SEM diagram at the upper position of the exhaust end, (d) 6–2 mm/min. (e) 6–6 mm/min. (f) 6–10 mm/min.
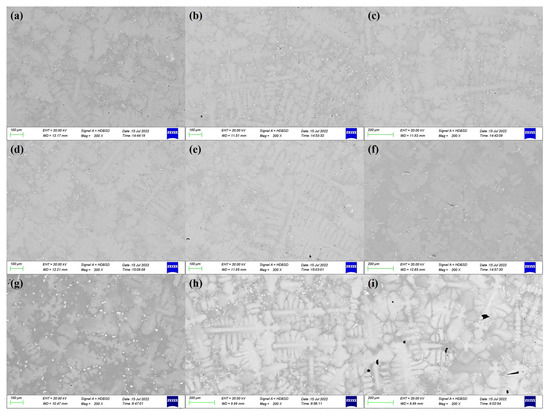
Figure 18.
6–2 mm/min pulling speed, blade cross-section, SEM diagram, (a) lower part of the blade. (b) the middle part of the blade. (c) the upper part of the blade. 6–6 mm/min pulling speed, blade cross-section, SEM diagram, (d) lower part of the blade. (e) the middle part of the blade. (f) the upper part of the blade. 6–10 mm/min pulling speed, blade cross-section, SEM diagram, (g) lower part of the blade. (h) the middle part of the blade. (i) the upper part of the blade.
When the pulling speed is too high, the shape of the mushy area is concave, which is not conducive to the formation of uniform, straight columnar crystals. Under the three pulling speeds, the grain orientation with lower and medium pulling speeds is better. The structure size is more uniform at the pulling speed of 6–2 mm/min, and there is no abnormally developed secondary dendrite; while the grain trend is relatively stable, the higher the pulling speed, the greater the chance of forming pores when the casting solidifies in the later stage, and the formation of pores may be the cause of thermal cracking. Therefore, a pulling rate of 6–2 mm/min should be selected when changing the speed of pulling.
5. Conclusions
DZ22B alloy is commonly used as a blade material for aircraft engines and gas turbines, and its preparation process is an important factor affecting its performance. In the present work, a reliable numerical model has been established through ProCast numerical simulation that assumes a set of fixed operating and thermo physical parameters and complemented with an auxiliary experimental verification method. The effect of casting speed on the grain and dendrite growth of DZ22B superalloy blades is studied. Based on numerical simulation and experimental verification, the following conclusions can be drawn:
(a) The simulation results show that the solid-liquid interface isotherm is convex at a pulling speed of 2 mm/min, the solid-liquid interface is concave at a pulling speed of 10 mm/min, the solid-liquid interface isotherm changes smoothly at a pulling speed of 6 mm/min.
(b) The morphology of the mushy zone affects the growth trend of grains, and the speed of 6 mm/min is more conducive to the growth of straight columnar crystals, which is consistent with the experimental results.
(c) Variable-speed pulling can effectively reduce micro-cracks, thereby reducing the tendency for hot cracking. At the pulling speed of 6–2 mm/min, the grain size is more uniform, and there are no abnormally developed secondary dendrites.
(d) Based on the above results, it is recommended to select 6–2 mm/min variable pulling speed for the directional solidification of the DZ22B superalloy blade.
Author Contributions
Conceptualization, B.H.; Methodology, W.X.; Validation, W.Z. and X.W.; Writing—original draft, D.Z.; Writing—review & editing, J.H.; Supervision, Y.W. and Y.L. All authors have read and agreed to the published version of the manuscript.
Funding
This work was financially supported by the Provincial Department of Education Project (Nos. 21C0090).
Institutional Review Board Statement
Not applicable.
Informed Consent Statement
Not applicable.
Data Availability Statement
Not applicable.
Conflicts of Interest
The authors declare no conflict of interest.
References
- Xiao, X. Thermal fatigue behaviors of three cast nickel base superalloys. Acta Met. Sin 2011, 47, 1129–1134. [Google Scholar]
- Khan, M.A. Oxidation and hot corrosion behavior of nickel-based superalloy for gas turbine applications. Mater. Manuf. Process 2014, 29, 832–839. [Google Scholar] [CrossRef]
- Zhang, S. Anisotropie creep rupture properties of a nickel-base single crystal superalloy at high temperature. J. Mater. Sci. Technol. 2011, 27, 107–112. [Google Scholar] [CrossRef]
- Liu, C. Effect of withdrawal rates on microstructure and creep strength of a single crystal superalloy processed by LMC. J. Mater. Sci. Technol. 2010, 26, 306–310. [Google Scholar] [CrossRef]
- Han, G. Effect of threshold stress on anisotropic creep properties of single crystal nickel-base superalloy SRR99. J. Mater. Sci. Technol. 2012, 28, 439–445. [Google Scholar] [CrossRef]
- Liu, Y. Interaction between CA6-MA crucible and molten wrought Ni-based superalloys. J. Eur. Ceram. Soc. 2023, 43, 1714–1722. [Google Scholar] [CrossRef]
- Su, S.A. The formation and evolution of stray grains in remelted interface in the seed crystal during the directional solidification of single crystal superalloys assisted by vertical static magnetic field. J. Acta Met. Sin 2022. [Google Scholar] [CrossRef]
- Li, F. Investigation of fused alumina based-mold facecoats for DZ22B directionally solidified blades. Materials 2019, 12, 606. [Google Scholar] [CrossRef]
- Liu, Y.N. Phase Transformation Process and Solidification Microstructure Transition of DZ22B superalloy. J. East China Jiaotong Univ. 2018, 35, 99–104. [Google Scholar]
- Li, Z. Effect of Slurry Thickness on the Quality of Aluminized Coatings. J. Mater. 2022, 15, 6758. [Google Scholar] [CrossRef]
- Yan, X. Investigation on material’s fatigue property variation among different regions of directional solidification turbine blades—Part I: Fatigue tests on full scale blades. J. Eng. Gas Turbine Power 2014, 136, 102502. [Google Scholar] [CrossRef]
- Xu, Z. Experimental study on mechanical properties of silica-based ceramic core for directional solidification of single crystal superalloy. Ceram. Int. 2018, 44, 394–401. [Google Scholar] [CrossRef]
- Kanyo, J.E. An overview of ceramic molds for investment casting of nickel superalloys. J. Eur. Ceram. Soc. 2020, 40, 4955–4973. [Google Scholar] [CrossRef]
- Du, B. Investigation on the microstructure and tensile behavior of a Ni-based IN792 superalloy. Adv. Mech. Eng. 2018, 10, 1687814017752167. [Google Scholar] [CrossRef]
- Zhao, Y. Phase-field simulation for the evolution of solid/liquid interface front in directional solidification process. J. Mater. Sci. Technol. 2019, 35, 1044–1052. [Google Scholar] [CrossRef]
- Shen, Y. Micro-segregation study of directional solidified Fe-Mn-C-Al TWIP steels. Met. Mater. Trans. 2020, 51, 2963–2975. [Google Scholar] [CrossRef]
- Zhu, C.S. Multi-phase field simulation of competitive grain growth for directional solidification. Chin. Phys. B 2022, 31, 068102. [Google Scholar] [CrossRef]
- Zhu, K. Mechanism of primary Si and Fe-segregation for a hypereutectic 90 wt.% Si-Ti alloy melt in directional solidification via electromagnetism. J. Iron Steel Res. Int. 2023, 30, 726–735. [Google Scholar] [CrossRef]
- Gao, Z. Multi-phase field model simulation based on MPI+ OpenMP parallel: Evolution of seaweed and dendritic structure in directional solidification. J. AIP Adv. 2022, 12, 035018. [Google Scholar] [CrossRef]
- Fang, H. Effects of Heating Power on Microstructure Evolution and Tensile Properties at Elevated Temperature by Directional Solidification for Ti2AlC/TiAl Composites. J. Adv. Eng. Mater. 2022, 24, 2100736. [Google Scholar] [CrossRef]
- Yu, F. The influence of anisotropy on the evolution of interfacial morphologies in directional solidification: A phase-field study. arXiv 2022, arXiv:2210.15673. [Google Scholar]
- The editorial board of china aeronautical materials handbook. DZ22B; In China Aeronautical Materials Handbook; Publishing House: Beijing, China, 2002; pp. 751–757.
- Qingyan, X. Progress on modeling and simulation of directional solidification of superalloy turbine blade casting. China Foundry 2012, 9, 69–77. [Google Scholar]
- Rappaz, M. Probabilistic modelling of microstructure formation in solidification processes. Acta Metall. 1993, 41, 345–360. [Google Scholar] [CrossRef]
- Gandin, C. A three-dimensional cellular automation-finite element model for the prediction of solidification grain structures. Met. Mater. Trans. 1999, 30, 3153–3165. [Google Scholar] [CrossRef]
- Kurz, W. Theory of microstructural development during rapid solidification. Acta Metall. 1986, 34, 823–830. [Google Scholar] [CrossRef]
- Zhu, J. Numerical modeling of hot tearing formation in metal casting and its validations. Int. J. Numer. Methods Eng. 2011, 87, 289–308. [Google Scholar] [CrossRef]


Disclaimer/Publisher’s Note: The statements, opinions and data contained in all publications are solely those of the individual author(s) and contributor(s) and not of MDPI and/or the editor(s). MDPI and/or the editor(s) disclaim responsibility for any injury to people or property resulting from any ideas, methods, instructions or products referred to in the content. |
© 2023 by the authors. Licensee MDPI, Basel, Switzerland. This article is an open access article distributed under the terms and conditions of the Creative Commons Attribution (CC BY) license (https://creativecommons.org/licenses/by/4.0/).