
Preparation and Photoelectrochemical Properties of Mo/N Co-Doped TiO2 Nanotube Array Films
Abstract
:1. Introduction
2. Materials and Methods
2.1. Preparation of Mo/N Co-Doped TiO2 Nanotube Films
2.2. Characterization and Testing
2.2.1. Characterization of Morphology and Structure
2.2.2. Photoelectrochemical Testing
3. Results and Discussion
4. Conclusions
Author Contributions
Funding
Institutional Review Board Statement
Informed Consent Statement
Data Availability Statement
Acknowledgments
Conflicts of Interest
References
- Su, T.; Shao, Q.; Qin, Z.; Guo, Z.; Wu, Z. Role of interfaces in two-dimensional photocatalyst for water splitting. ACS Catal. 2018, 8, 2253–2276. [Google Scholar] [CrossRef]
- Linsebigler, A.L.; Lu, G.Q.; Yates, J.T. Photocatalysis on TiO2 Surfaces: Principles, Mechanisms, and Selected Results. Chem. Rev. 1995, 95, 735–758. [Google Scholar] [CrossRef]
- Chen, D.; Cheng, Y.; Zhou, N.; Chen, P.; Wang, Y.; Li, K.; Huo, S.; Cheng, P.; Peng, P.; Zhang, R. Photocatalytic degradation of organic pollutants using TiO2-based photocatalysts: A review. J. Clean. Prod. 2020, 268, 121725. [Google Scholar] [CrossRef]
- Lan, Y.; Lu, Y.; Ren, Z. Mini review on photocatalysis of titanium dioxide nanoparticles and their solar applications. Nano Energy 2013, 2, 1031–1045. [Google Scholar] [CrossRef]
- Mancuso, A.; Sacco, O.; Vaiano, V.; Sannino, D.; Pragliola, S.; Venditto, V.; Morante, N. Visible light active Fe-Pr co-doped TiO2 for water pollutants degradation. Catal. Today 2021, 380, 93–104. [Google Scholar] [CrossRef]
- Luo, S.; Yan, B.; Shen, J. Intense photocurrent from Mo-doped TiO2 film with depletion layer array. ACS Appl. Mater. Interfaces 2014, 6, 8942–8946. [Google Scholar] [CrossRef]
- Wu, Q.; Ouyang, J.; Xie, K.; Sun, L.; Wang, M.; Lin, C. Ultrasound-assisted synthesis and visible-light-driven photocatalytic activity of Fe-incorporated TiO2 nanotube array photocatalysts. Hazard. Mater. 2012, 199, 410–417. [Google Scholar] [CrossRef]
- Yacoubi, B.; Samet, L.; Bennaceur, J.; Lamouchi, A.; Chtourou, R. Properties of transition metal doped-titania electrodes: Impact on efficiency of amorphous and nanocrystalline dye-sensitized solar cells. Mater. Sci. Semicond. Process. 2015, 30, 361–367. [Google Scholar] [CrossRef]
- Xie, Y.; Huang, N.; You, S.; Liu, Y.; Sebo, B.; Liang, L.; Fang, X.; Liu, W.; Guo, S.; Zhao, X. Improved performance of dye-sensitized solar cells by trace amount Cr-doped TiO2 photoelectrodes. J. Power Sources 2013, 224, 168–173. [Google Scholar] [CrossRef]
- Tong, Z.; Peng, T.; Sun, W.; Liu, W.; Guo, S.; Zhao, X. Introducing an intermediate band into dye-sensitized solar cells by W6+ doping into TiO2 nanocrystalline photoanodes. Phys. Chem. C 2014, 118, 16892–16895. [Google Scholar] [CrossRef]
- Li, X.; Wu, Y.; Shen, Y.; Sun, Y.; Yang, Y.; Xie, A. A novel bifunctional Ni-doped TiO2 inverse opal with enhanced SERS performance and excellent photocatalytic activity. Appl. Surf. Sci. 2018, 427, 739–744. [Google Scholar] [CrossRef]
- Zhang, C.; Liu, Y.; Zhou, J.; Jin, W.; Chen, W. Tunability of photo-catalytic selectivity of B-doped anatase TiO2 microspheres in the visible light. Dyes Pigment. 2018, 156, 213–218. [Google Scholar] [CrossRef]
- Neville, E.; MacElroy, J.; Thampi, K.; Sullivan, J. Visible light active C-doped titanate nanotubes prepared via alkaline hydrothermal treatment of C-doped nanoparticulate TiO2: Photo-electrochemical and photocatalytic properties. J. Photochem. Photobiol. A 2013, 267, 17–24. [Google Scholar] [CrossRef] [Green Version]
- Sun, Q.; Zhang, J.; Wang, P.; Zheng, J.; Zhang, X.; Cui, Y.; Feng, J.; Zhu, Y. Sulfur-doped TiO2 nanocrystalline photoanodes for dye-sensitized solar cells. Renew. Sustain. Energy 2012, 4, 023104. [Google Scholar] [CrossRef] [Green Version]
- Gao, Q.; Si, F.; Zhang, S.; Fang, Y.; Chen, X.; Yang, S. Hydrogenated F-doped TiO2 for photocatalytic hydrogen evolution and pollutant degradation. Int. J. Hydrogen Energy 2019, 44, 8011–8019. [Google Scholar] [CrossRef]
- Asahi, R.; Morikawa, T.; Ohwaki, T. Visible-light photocatalysis in nitrogen-doped titanium oxides. Science 2001, 293, 269–271. [Google Scholar] [CrossRef] [PubMed]
- Peighambardoust, N.; Asl, S.; Mohammadpour, R.; Asl, S. Band-gap narrowing and electrochemical properties in N-doped and reduced anodic TiO2 nanotube arrays. Electrichim. Acta 2018, 270, 245–255. [Google Scholar] [CrossRef]
- Chen, Y.; Wu, Q.; Zhou, C.; Jin, Q. Enhanced photocatalytic activity of La and N co-doped TiO2/diatomite composite. Powder Technol. 2017, 322, 296–300. [Google Scholar] [CrossRef]
- Xin, Z.; Liu, Q. Visible-light-induced degradation of formaldehyde over titania photocatalyst co-doped with nitrogen and nickel. Appl. Surf. Sci. 2008, 254, 4780–4785. [Google Scholar]
- Wang, X.; Yu, J.; Chen, Y.; Fu, X. ZrO2-modified mesoporous nanocrystalline TiO2-xNx as efficient visible light photocatalysts. Environ. Sci. Technol. 2006, 40, 2369–2374. [Google Scholar] [CrossRef]
- Kalantari, K.; Kalbasi, M.; Sohrabi, M.; Royaeee, S. Enhancing the photocatalytic oxidation of dibenzothiophene using visible light responsive Fe and N co-doped TiO2 nanoparticles. Ceram. Int. 2017, 43, 973–981. [Google Scholar] [CrossRef]
- Avilés-García, O.; Espino-Valencia, J.; Romero, R.; Luis Rico-Cerda, J.; Arroyo-Albiter, M.; Natividad, R. W and Mo doped TiO2: Synthesis, characterization and photocatalytic activity. Fuel 2017, 198, 31–41. [Google Scholar] [CrossRef]
- Yin, W.; Tang, H.; Wei, S.; Al-Jassim, M.; Turner, J.; Yan, Y. Band structure engineering of semiconductors for enhanced photoelectrochemical water splitting: The case of TiO2. Phys. Rev. B 2010, 82, 175–227. [Google Scholar] [CrossRef] [Green Version]
- Liu, N.; Chen, X.; Zhang, J.; Schwank, J. A review on TiO2-based nanotubes synthesized via hydrothermal method: Formation mechanism, structure modification, and photocatalytic applications. Catal. Today 2014, 225, 34–51. [Google Scholar] [CrossRef]
- Xue, D.; Luo, J.; Li, Z.; Yin, Y.; Shen, J. Enhanced Photoelectrochemical Properties from Mo-Doped TiO2 Nanotube Arrays Film. Coatings 2020, 10, 75. [Google Scholar] [CrossRef] [Green Version]
- Suwannaruang, T.; Kamonsuangkasem, K.; Kidkhunthod, P.; Chirawatkul, P.; Saiyasombat, C.; Chanlek, N.; Wantala, K. Influence of nitrogen content levels on structural properties and photocatalytic activities of nanorice-like N-doped TiO2 with various calcination temperatures. Mater. Res. Bull. 2018, 105, 265–276. [Google Scholar] [CrossRef]
- Li, Z.; Cui, X.; Hao, H.; Lu, M.; Lin, Y. Enhanced photoelectrochemical water splitting from Si quantum dots/TiO2 nanotube arrays composite electrodes. Mater. Res. Bull. 2015, 66, 9–15. [Google Scholar] [CrossRef]
- Mohamed, I.M.A.; Dao, V.D.; Yasin, A.S.; Barakat, N.A.M.; Choi, H.S. Design of an efficient photoanode for dye-sensitized solar cells using electrospun one-dimensional GO/N-doped nanocomposite SnO2/TiO2. Appl. Surf. Sci. 2017, 400, 355–364. [Google Scholar] [CrossRef]
- He, J.; Du, Y.E.; Bai, Y.; An, J.; Cai, X.M.; Chen, Y.Q.; Wang, P.F.; Yang, X.J.; Feng, Q. Facile Formation of Anatase/Rutile TiO2 Nanocomposites with Enhanced Photocatalytic Activity. Molecules 2019, 24, 2996. [Google Scholar] [CrossRef] [Green Version]
- Zerjav, G.; Zizek, K.; Zavasnik, J.; Pintar, A. Brookite vs. rutile vs. anatase: What’s behind their various photocatalytic activities? J. Environ. Chem. Eng. 2022, 10, 107722. [Google Scholar] [CrossRef]
- Zou, Z.R.; Zhou, Z.P.; Wang, H.Y. Magnetic properties of Mo-N co-doped TiO2 anatase nanotubes films. J. Mater. Sci. Mater. Electron. 2017, 28, 207–213. [Google Scholar] [CrossRef]
- Tan, K.; Zhang, H.; Xie, C.; Zheng, H.; Gu, Y.; Zhang, W. Visible-light absorption and photocatalytic activity in molybdenum and nitrogen-codoped TiO2. Catal. Commun. 2010, 11, 331–335. [Google Scholar] [CrossRef]
- Yamaguchi, K.; Konaka, Y.; Ohtsu, N. Enhanced hardness and photocatalytic performance in anodic N-doped TiO2 layer on titanium using a non-aqueous nitrate electrolyte. Surf. Coat. Technol. 2020, 386, 125424. [Google Scholar] [CrossRef]
- Zou, M.; Xiong, F.; Ganeshraja, A.; Feng, X.; Wang, C.; Thomas, T.; Yang, M. Visible light photocatalysts (Fe, N): TiO2 from ammonothermally processed, solvothermal self-assembly derived Fe-TiO2 mesoporous microspheres. Mater. Chem. Phys. 2017, 195, 259–267. [Google Scholar] [CrossRef]
- Khan, H.; Swati, I.; Younas, M.; Ullah, A. Chelated nitrogen-sulfur-co-doped TiO2: Synthesis, characterization, mechanistic and UV/Visible photocatalytic studies. Int. J. Photoenergy 2017, 7268641. [Google Scholar]
- Huang, J.; Guo, X.; Wang, B.; Li, L.; Zhao, M.; Dong, L.; Liu, X.; Huang, Y. Synthesis and Photocatalytic Activity of Mo-Doped TiO2 Nanoparticles. J. Spectrosc. 2015, 2015, 681850. [Google Scholar] [CrossRef] [Green Version]
- Liao, H.; Xie, L.; Zhang, Y.; Qiu, X.; Li, S.; Huang, Z.; Hou, H.; Ji, X. Mo-doped gray anatase TiO2: Lattice expansion for enhanced sodium storage. Electrochim. Acta 2016, 219, 227–234. [Google Scholar] [CrossRef]
- Merenda, A.; Rana, A.; Guirguis, A.; Zhu, D.M.; Kong, L.X.; Dumee, L.F. Enhanced Visible Light Sensitization of N-Doped TiO2 Nanotubes Containing Ti-Oxynitride Species Fabricated via Electrochemical Anodization of Titanium Nitride. J. Phys. Chem. C 2013, 123, 2189–2201. [Google Scholar] [CrossRef]
- Mollavali, M.; Rohani, S.; Elahifard, M.; Behjatmanesh-Ardakani, R.; Nourany, M. Band gap reduction of (Mo + N) co-doped TiO2 nanotube arrays with a significant enhancement in visible light photo-conversion: A combination of experimental and theoretical study. Int. J. Hydrogen Energy 2021, 46, 21475–21498. [Google Scholar] [CrossRef]
- Khan, M.; Xu, J.; Chen, N.; Cao, W. First principle calculations of the electronic and optical properties of pure and (Mo, N) co-doped anatase TiO2. J. Alloy. Compd. 2012, 513, 539–545. [Google Scholar] [CrossRef]
- Yu, X.; Li, C.; Ling, Y.; Tang, T.; Wu, Q.; Kong, J. First principles calculations of electronic and optical properties of Mo-doped rutile TiO2. J. Alloy. Compd. 2010, 507, 33–37. [Google Scholar] [CrossRef]
- Tauc, J.; Grigorov, R.; Vancu, A. Optical Properties and Electronic Structure of Amorphous Germanium. Phys. Status Solidi 1966, 15, 627. [Google Scholar] [CrossRef]
- Coulter, J.B.; Birnie, D.P. Assessing Tauc Plot Slope Quantification: ZnO Thin Films as a Model System. Phys. Status. Solidi B 2018, 255, 1700393. [Google Scholar] [CrossRef]
- Liu, H.L.; Lu, Z.H.; Yue, L.; Liu, J.; Gan, Z.H.; Shu, C.; Zhang, T.; Shi, J.; Xiong, R. (Mo plus N) codoped TiO2 for enhanced visible-light photoactivity. Appl. Surf. Sci. 2011, 257, 9355–9361. [Google Scholar] [CrossRef]
- Okato, T.; Sakano, T.; Obara, M. Suppression of photocatalytic efficiency in highly N-doped anatase films. Phys. Rev. B 2005, 72, 115124. [Google Scholar] [CrossRef]
- Fox, M.; Dulay, M. Heterogeneous Photocatalysis. Chem. Rev. 1993, 93, 341–357. [Google Scholar] [CrossRef]
- Liu, H.; Gong, H.; Zou, M.; Jiang, H.; Abolaji, R.; Tareen, A.; Hakala, B.; Yang, M. Mo-N-co-doped mesoporous TiO2 microspheres with enhanced visible light photocatalytic activity. Mater. Res. Bull. 2017, 96, 10–17. [Google Scholar] [CrossRef]
- Zhang, M.; Lu, D.D.; Yan, G.T.; Wu, J.; Yang, J.J. Fabrication of Mo plus N-Codoped TiO2 Nanotube Arrays by Anodization and Sputtering for Visible Light-Induced Photoelectrochemical and Photocatalytic Properties. J. Nanomater. 2013, 2013, 648346. [Google Scholar] [CrossRef]


| Anatase | Rutile | |
|---|---|---|
| PTiN = 0 W | 38.62% | 61.38% |
| PTiN = 25 W | 39.06% | 60.94% |
| PTiN = 35 W | 40.93% | 59.07% |
| PTiN = 50 W | 41.04% | 58.96% |
| PTiN = 75 W | 40.74% | 59.26% |
| PTiN = 100 W | 41.42% | 58.58% |
| Pure TiO2 | 36.43% | 63.57% |
| Anatase | Rutile | |||
|---|---|---|---|---|
| a (nm) | c (nm) | a (nm) | c (nm) | |
| PTiN = 0 W | 0.3790 | 0.9529 | 0.4620 | 0.2952 |
| PTiN = 25 W | 0.3791 | 0.9535 | 0.4623 | 0.2951 |
| PTiN = 35 W | 0.3793 | 0.9539 | 0.4630 | 0.2953 |
| PTiN = 50 W | 0.3794 | 0.9540 | 0.4628 | 0.2957 |
| PTiN = 75 W | 0.3794 | 0.9543 | 0.4633 | 0.2958 |
| PTiN = 100 W | 0.3798 | 0.9546 | 0.4639 | 0.2958 |
| Pure TiO2 | 0.3801 | 0.9549 | 0.4646 | 0.2961 |
| C | Mo | N | O | Ti | |
|---|---|---|---|---|---|
| PTiN = 25 W | 26.87% | 0.04% | 0.57% | 48.78% | 23.74% |
| PTiN = 35 W | 26.29% | 0.06% | 0.8% | 49.12% | 23.73% |
| PTiN = 50 W | 28.44% | 0.08% | 0.87% | 47.53% | 23.08% |
| PTiN = 75 W | 27.67% | 0.04% | 0.89% | 48.34% | 23.06% |
| PTiN = 100 W | 25.92% | 0.04% | 0.9% | 49.39% | 23.75% |
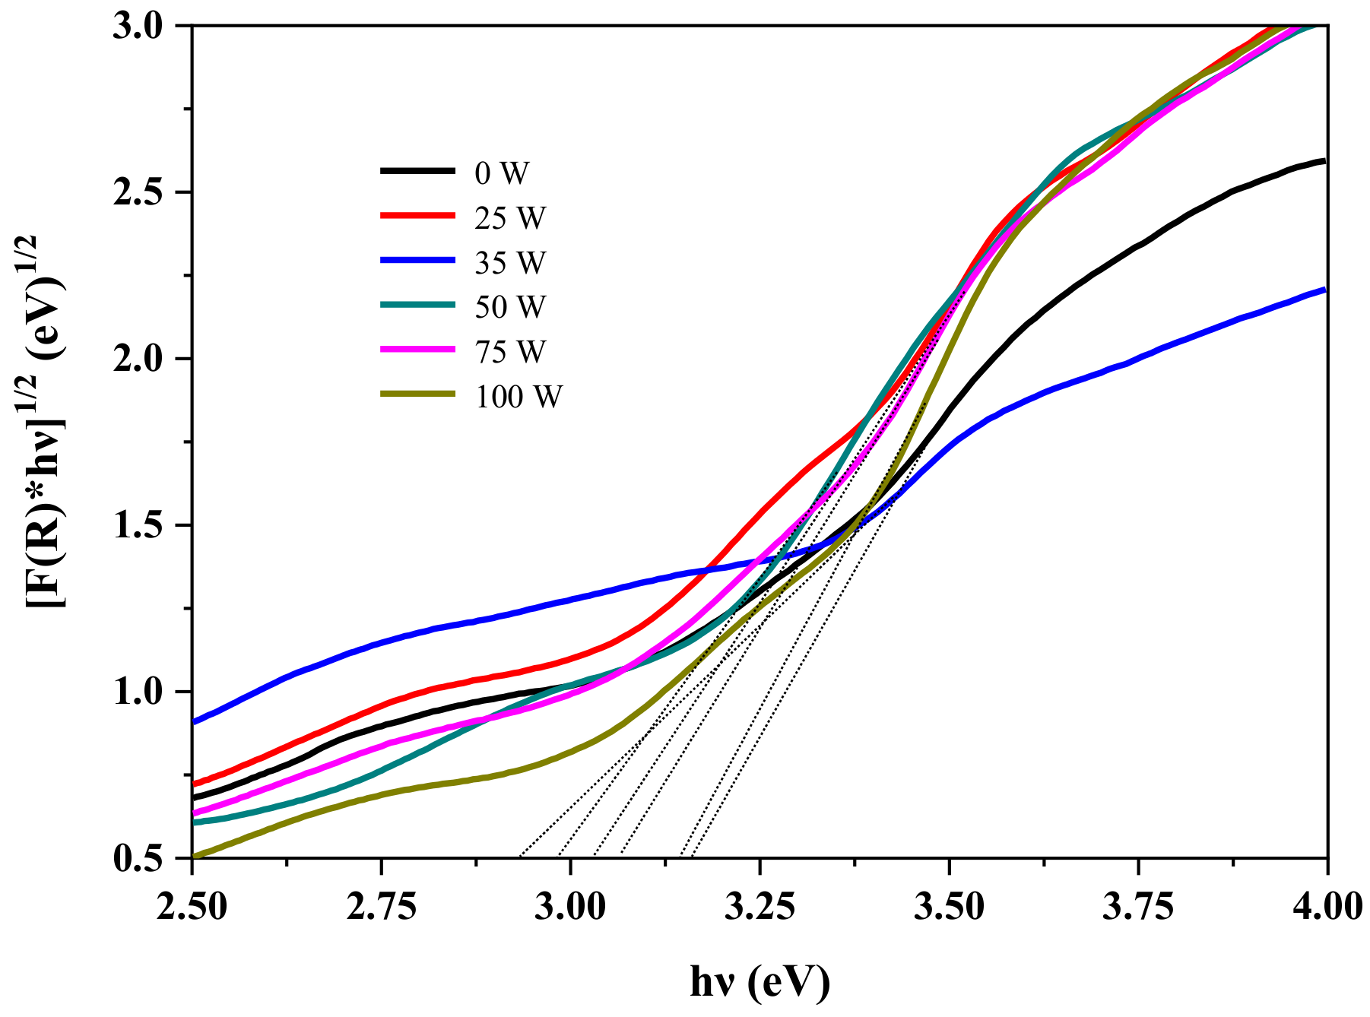
| Band Gap (eV) | |
|---|---|
| PTiN = 0 W | 3.16 |
| PTiN = 25 W | 3.07 |
| PTiN = 35 W | 2.93 |
| PTiN = 50 W | 2.98 |
| PTiN = 75 W | 3.03 |
| PTiN = 100 W | 3.15 |
| R2 | K’ | |
|---|---|---|
| Pure TiO2 | 0.98627 | 0.01028 |
| Mo-doped TiO2 | 0.99171 | 0.02062 |
| Mo/N co-doped TiO2 | 0.99287 | 0.02264 |
Disclaimer/Publisher’s Note: The statements, opinions and data contained in all publications are solely those of the individual author(s) and contributor(s) and not of MDPI and/or the editor(s). MDPI and/or the editor(s) disclaim responsibility for any injury to people or property resulting from any ideas, methods, instructions or products referred to in the content. |
© 2023 by the authors. Licensee MDPI, Basel, Switzerland. This article is an open access article distributed under the terms and conditions of the Creative Commons Attribution (CC BY) license (https://creativecommons.org/licenses/by/4.0/).
Share and Cite
Ding, Y.; Xue, D.; Yu, H.; Shen, J. Preparation and Photoelectrochemical Properties of Mo/N Co-Doped TiO2 Nanotube Array Films. Coatings 2023, 13, 1230. https://doi.org/10.3390/coatings13071230
Ding Y, Xue D, Yu H, Shen J. Preparation and Photoelectrochemical Properties of Mo/N Co-Doped TiO2 Nanotube Array Films. Coatings. 2023; 13(7):1230. https://doi.org/10.3390/coatings13071230
Chicago/Turabian StyleDing, Yaoxin, Danni Xue, Hanzhou Yu, and Jie Shen. 2023. "Preparation and Photoelectrochemical Properties of Mo/N Co-Doped TiO2 Nanotube Array Films" Coatings 13, no. 7: 1230. https://doi.org/10.3390/coatings13071230