
Ultrasonic Detection of Aliased Signal Separation Based on Adaptive Feature Dictionary and K–SVD Algorithm for Protective Coatings of Assembled Steel Structure
Abstract
:1. Introduction
2. Theoretical Backgrounds
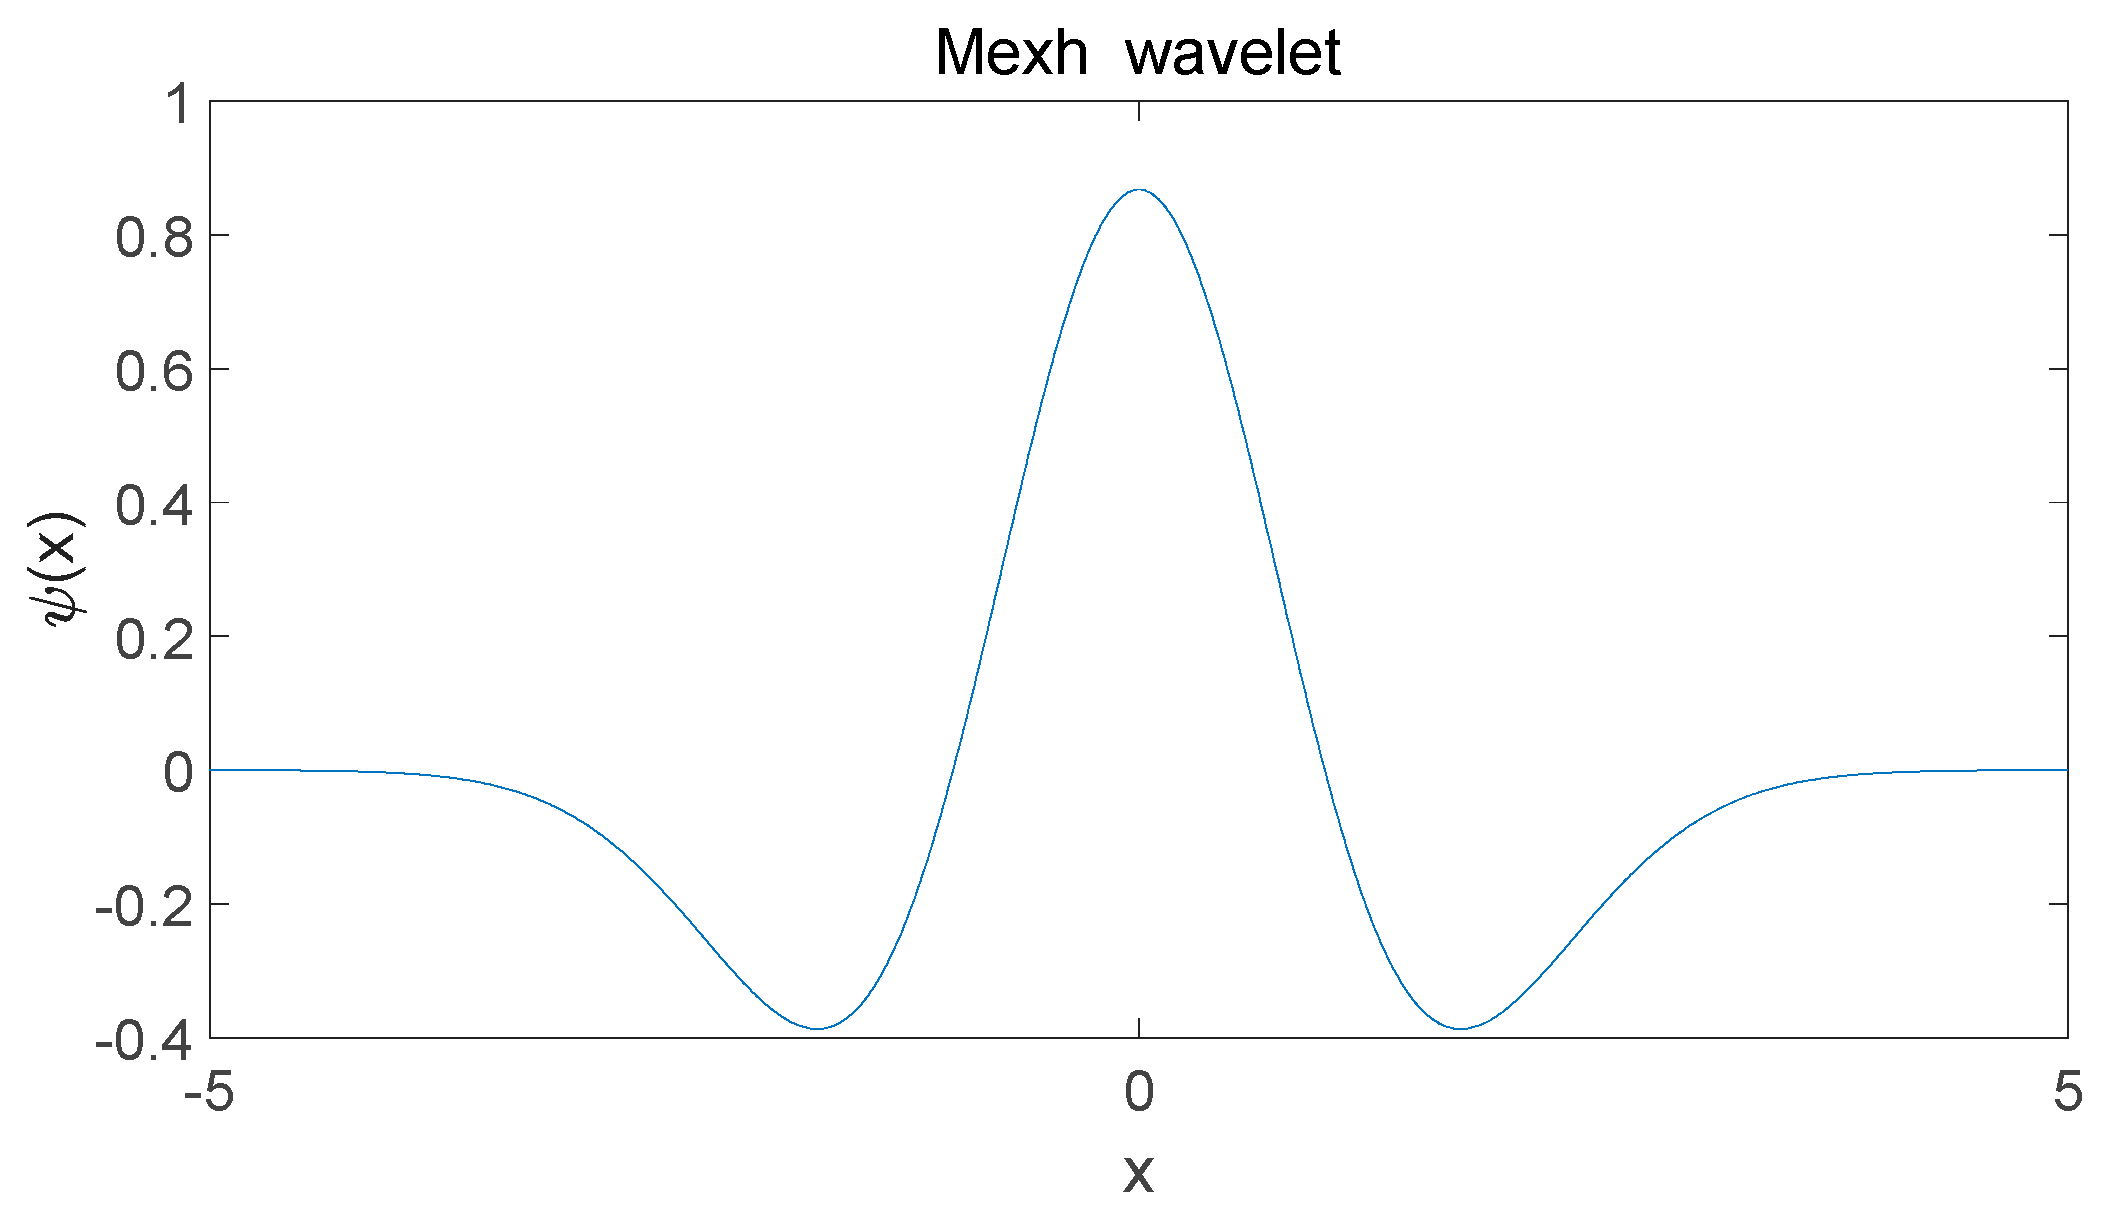
2.1. Wavelet Transform
2.2. K–SVD Algorithm
2.3. Construction of Signal Matrix and Initial Feature Dictionary
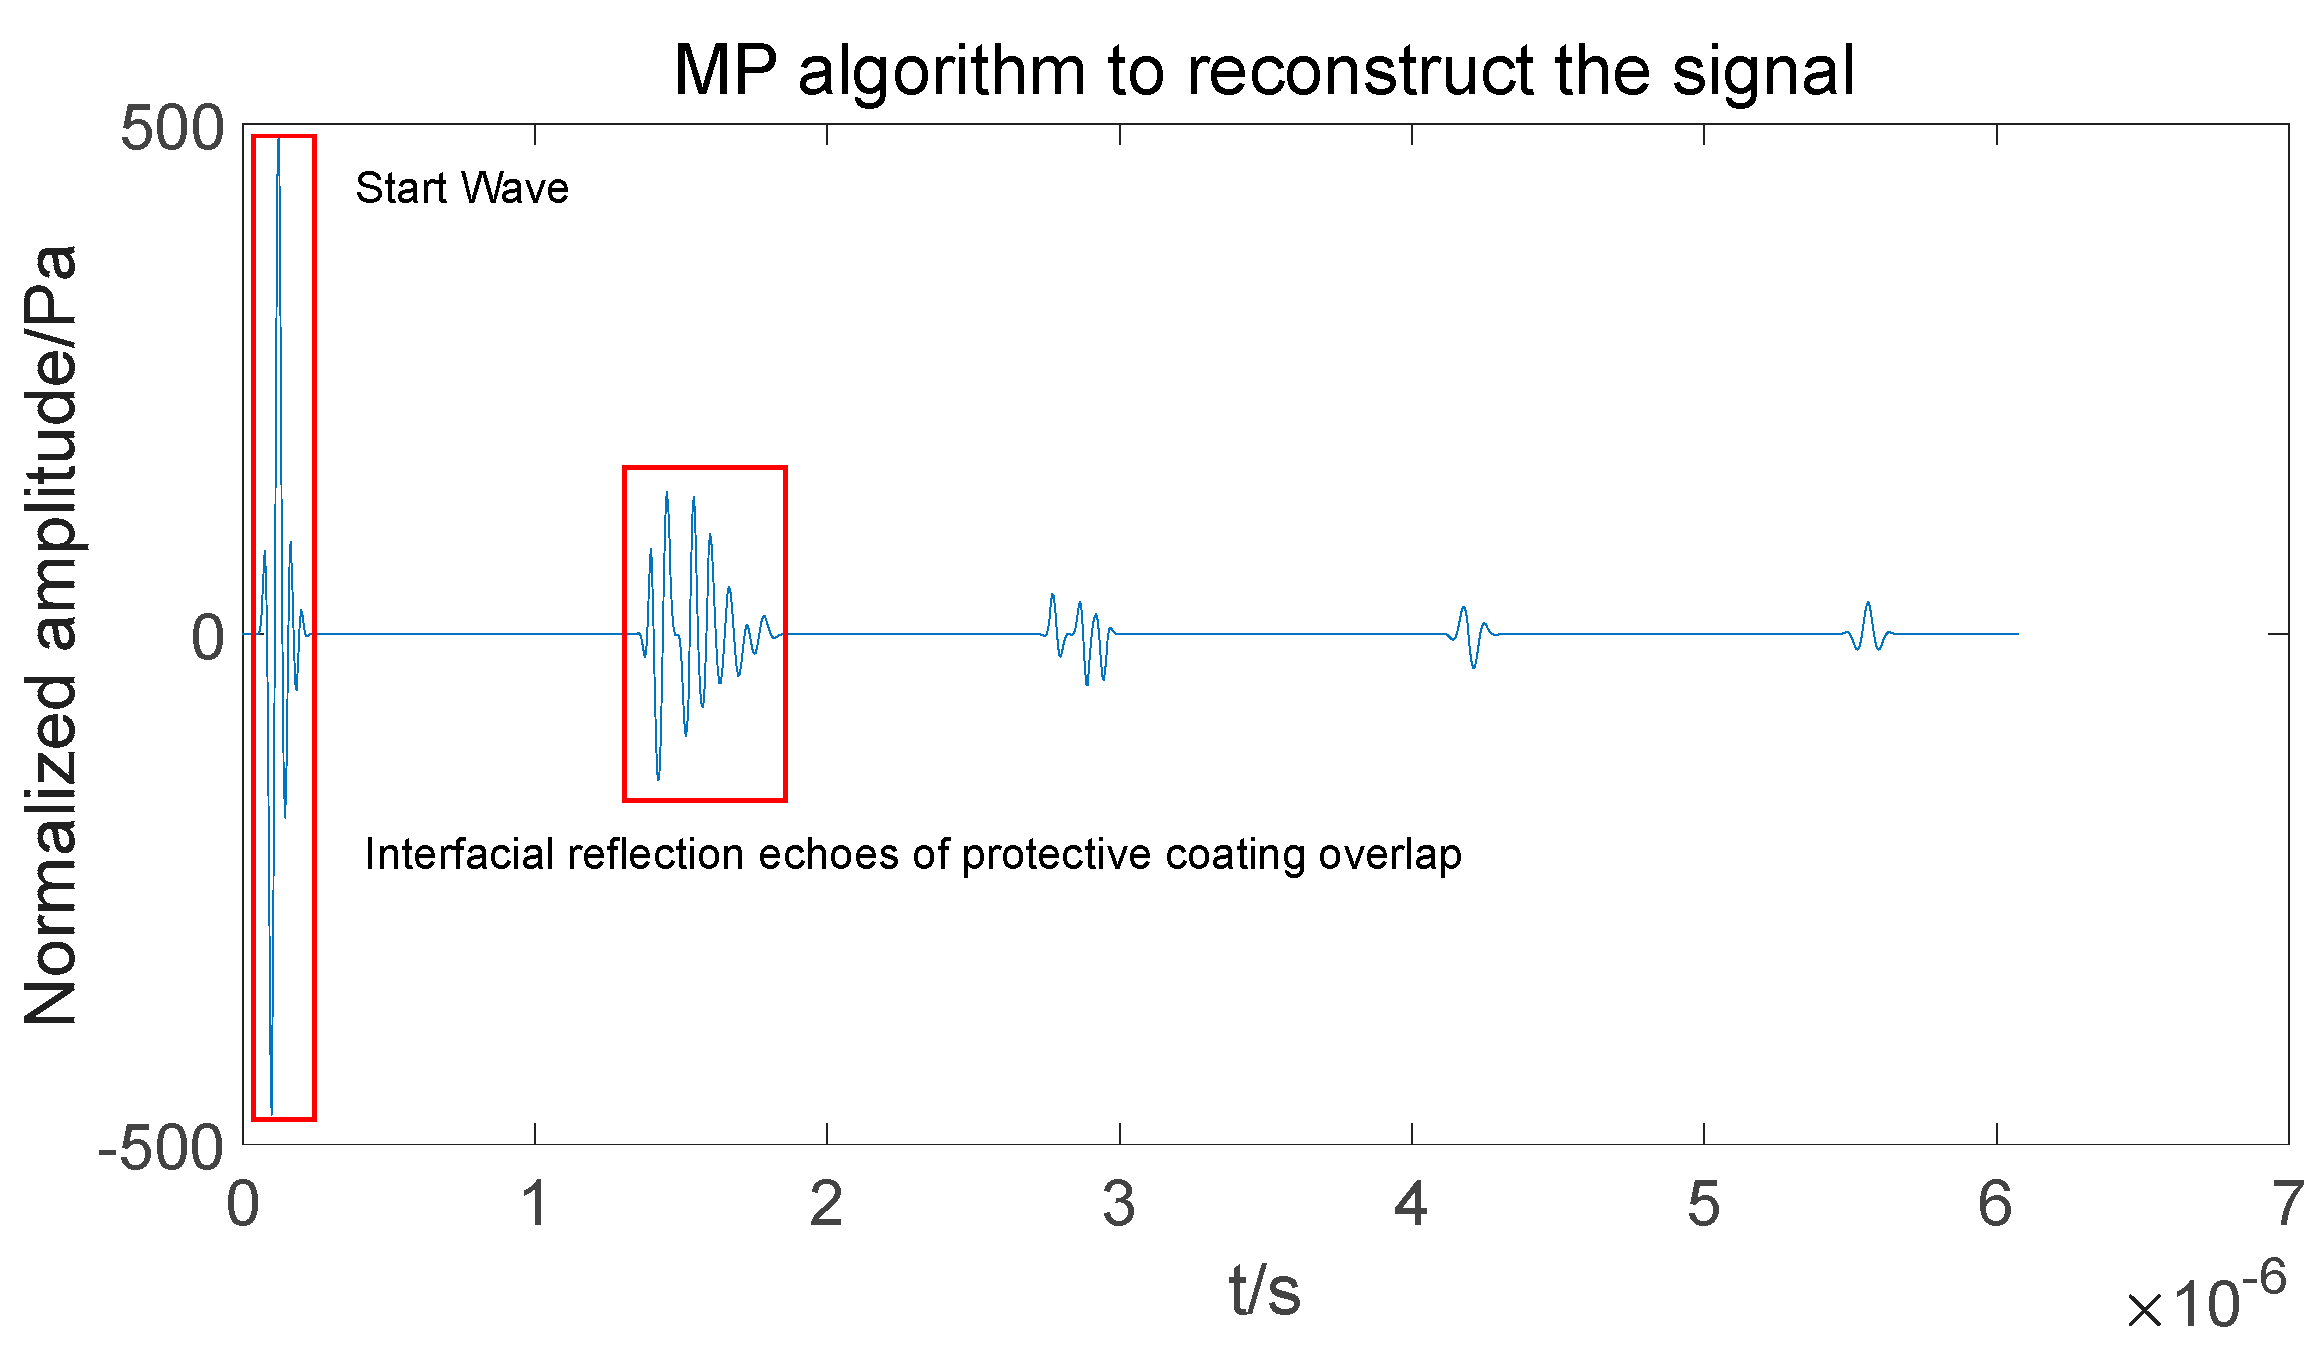
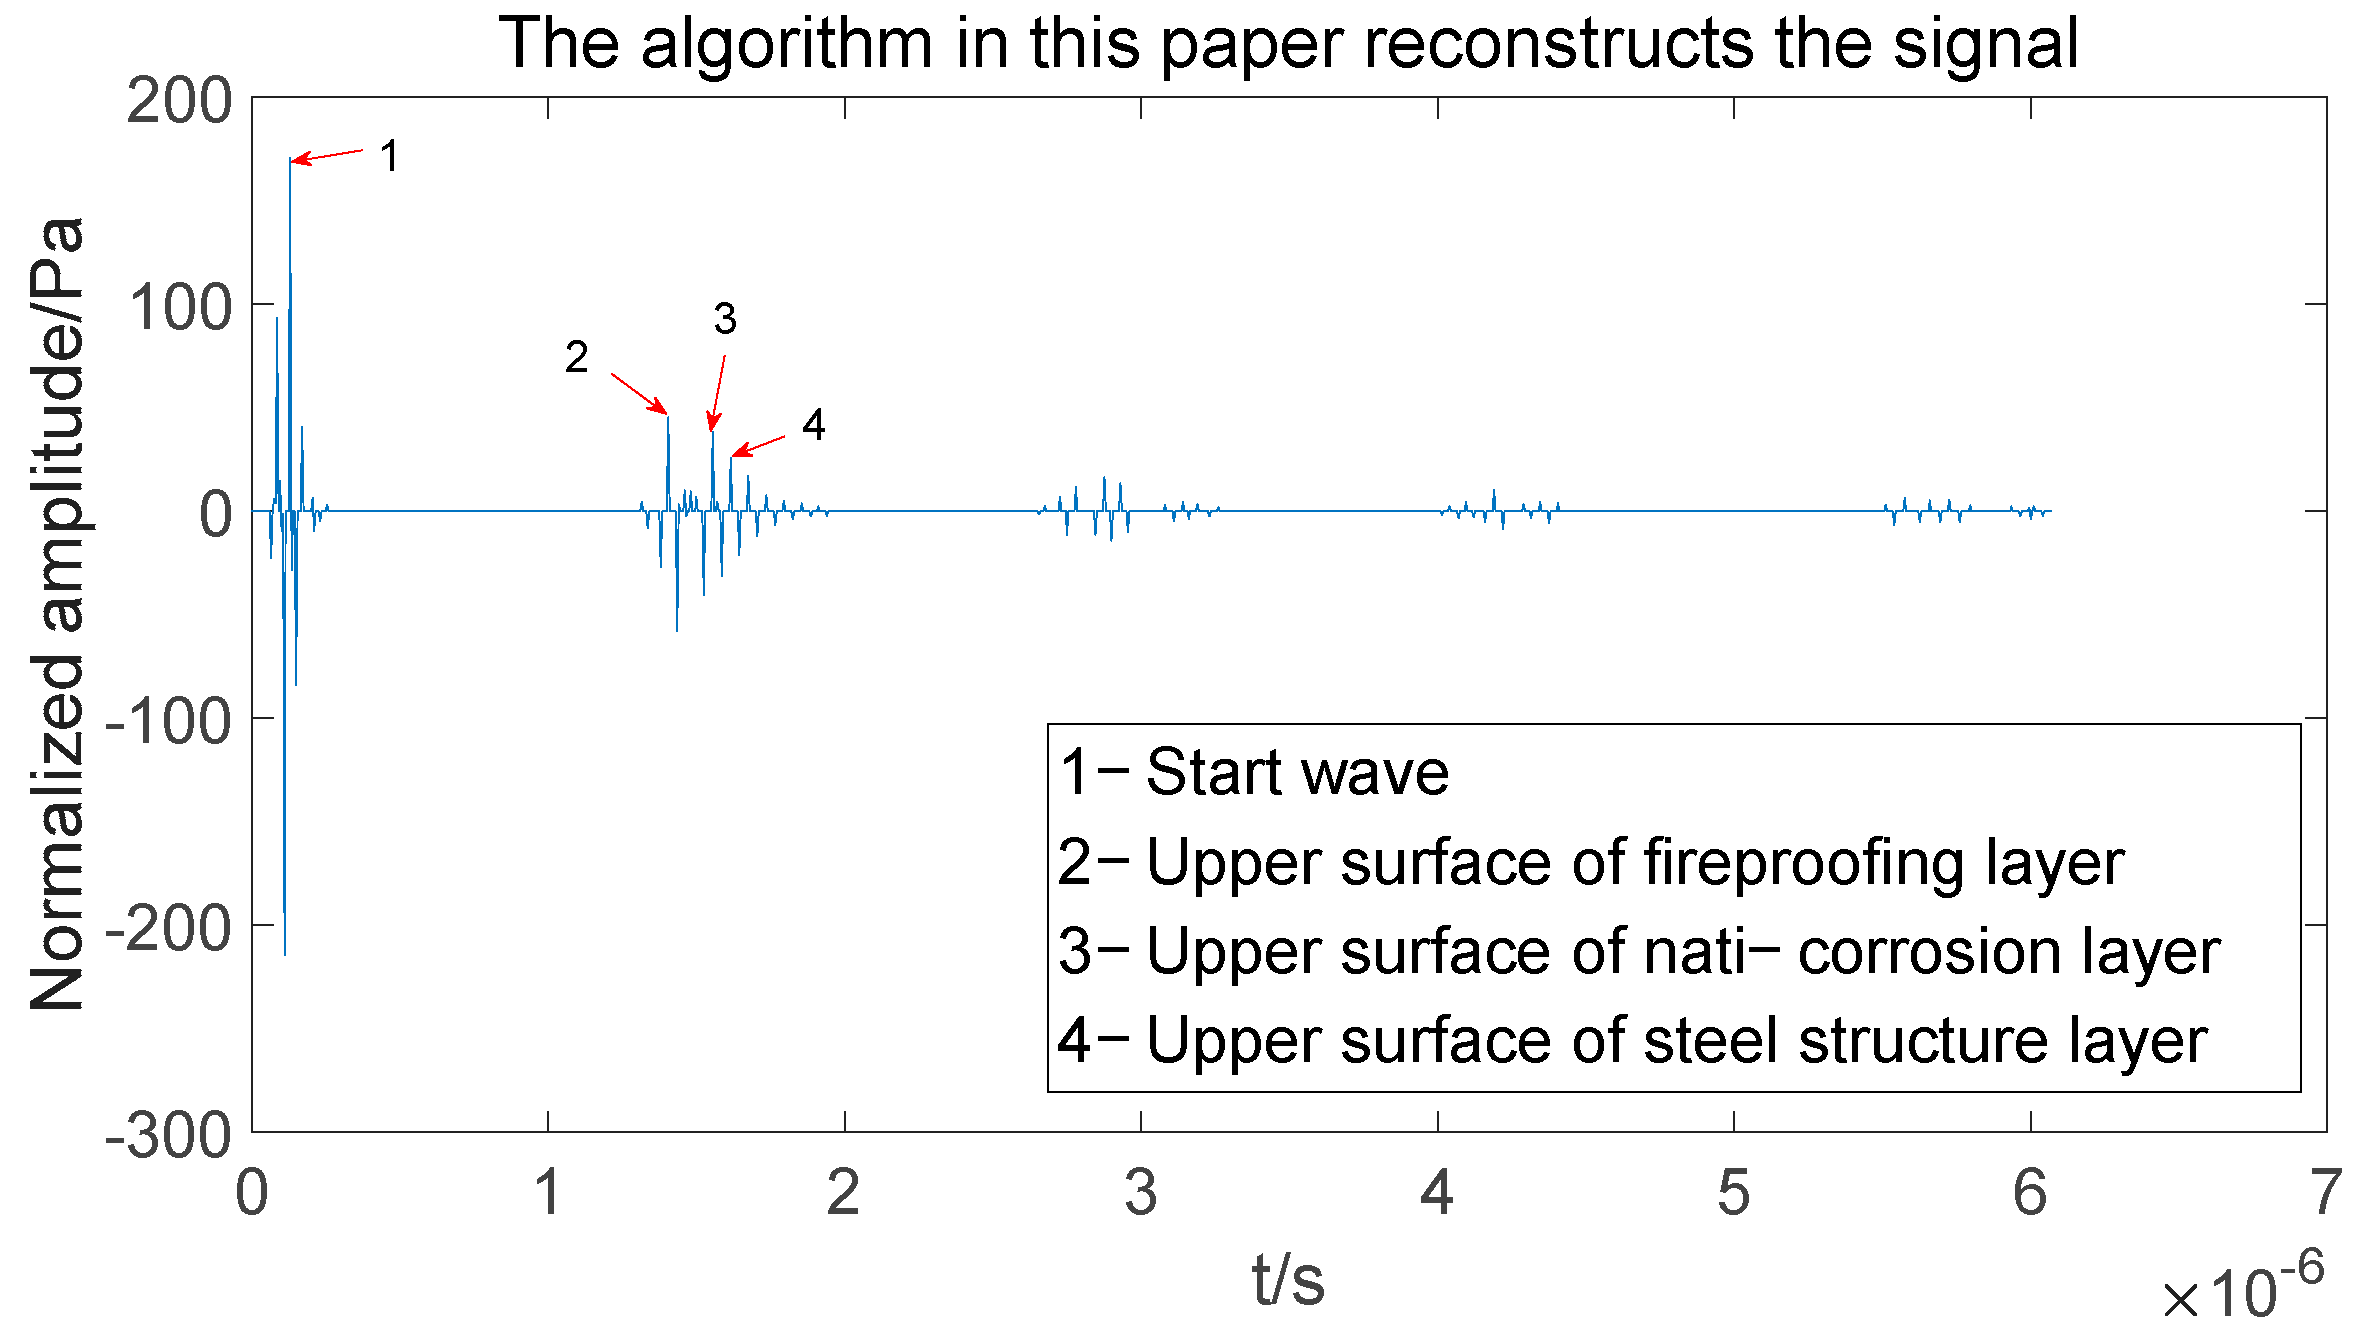
2.4. Signal Reconfiguration
3. Simulation Analysis
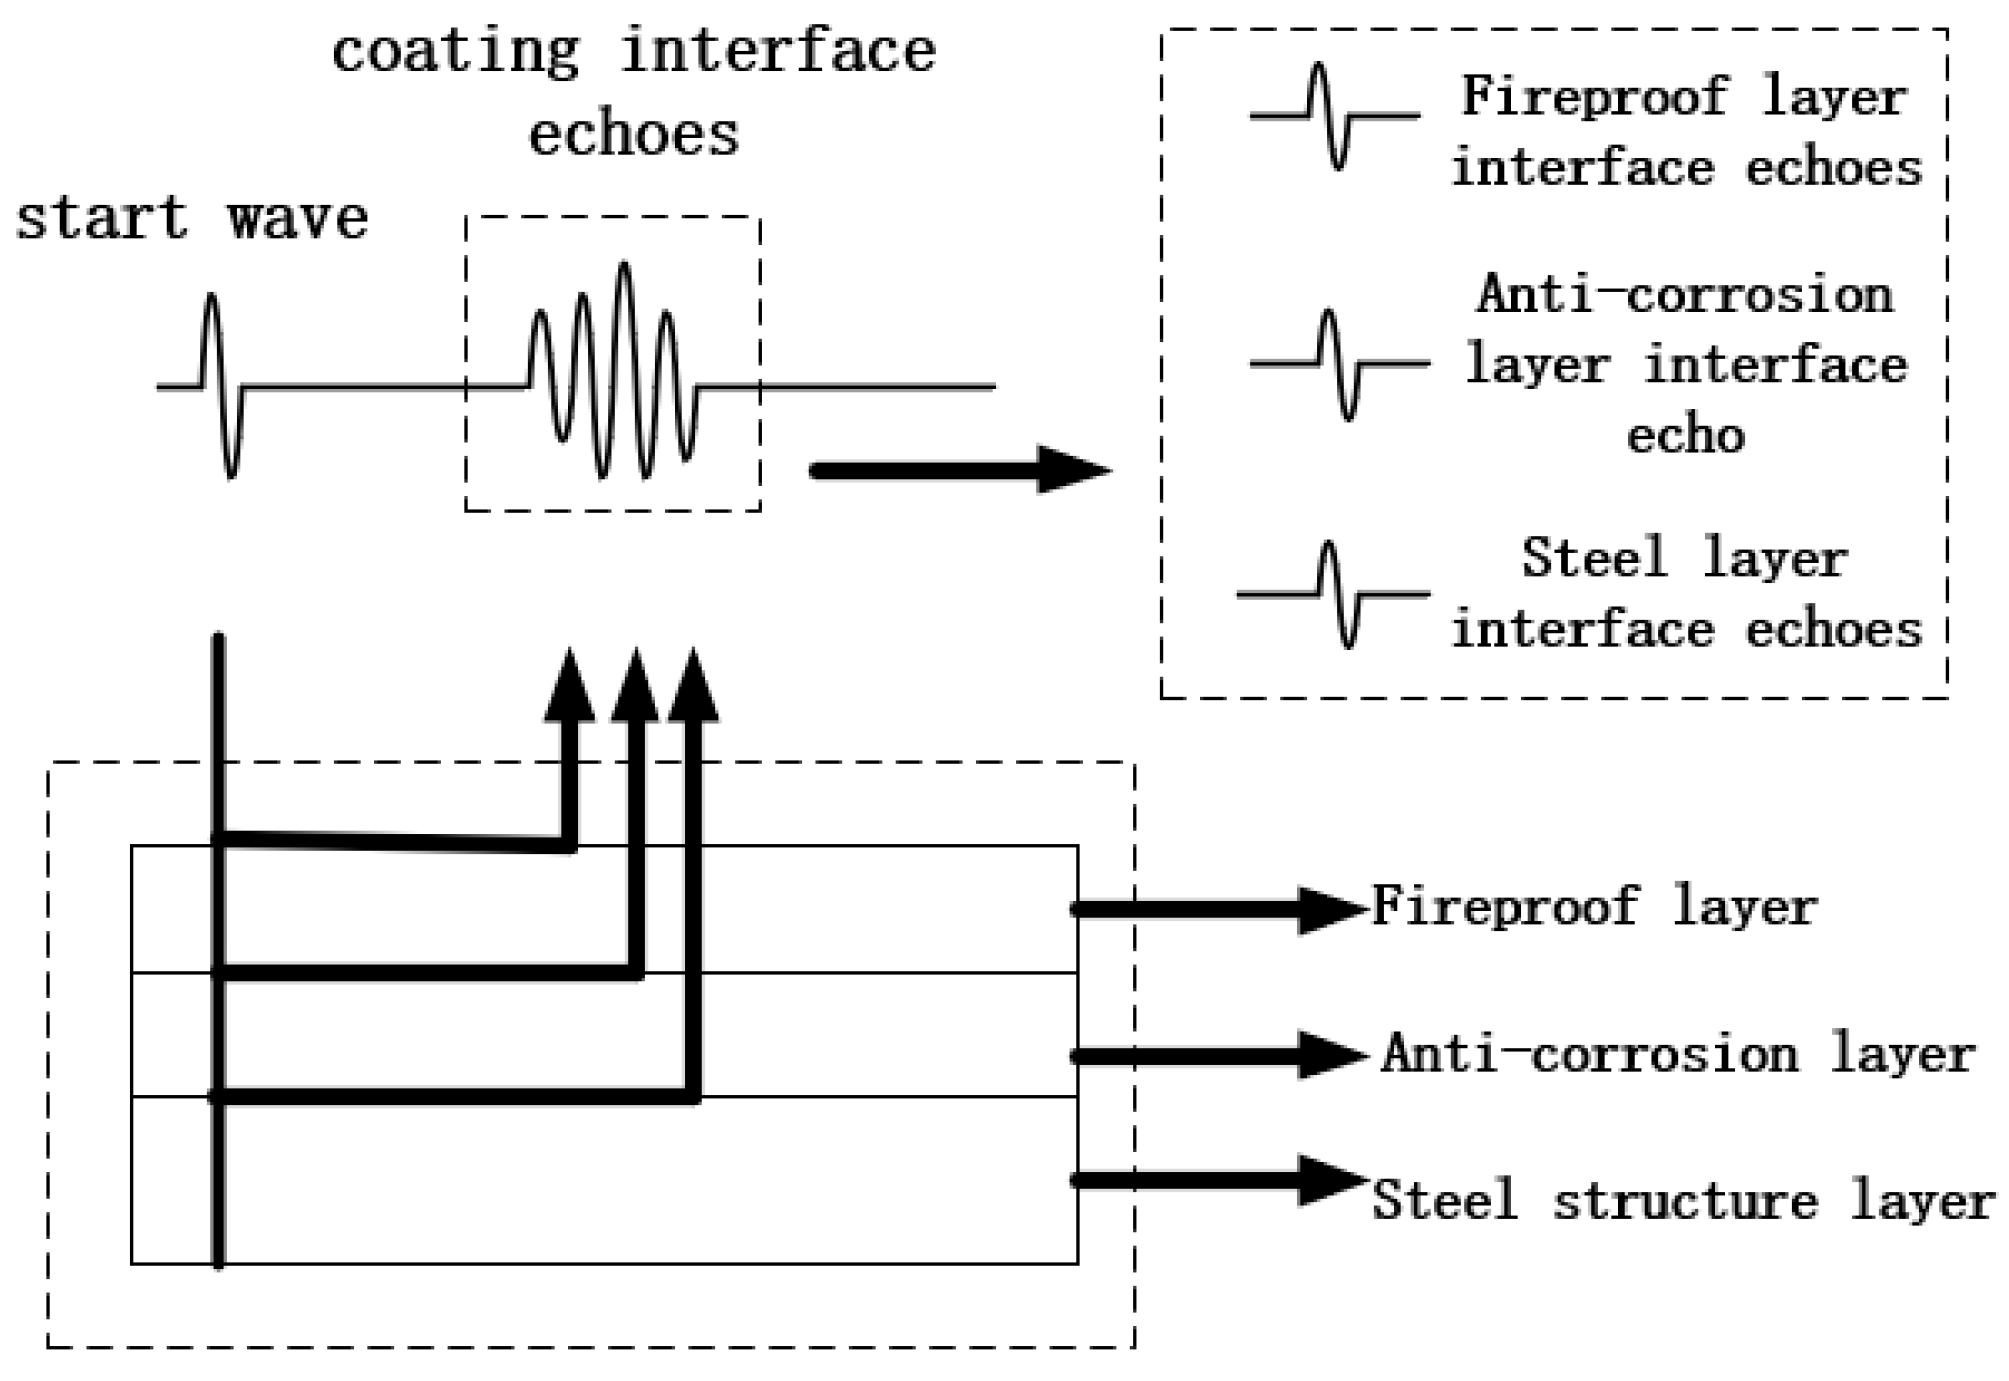
3.1. Protective Coating Modeling
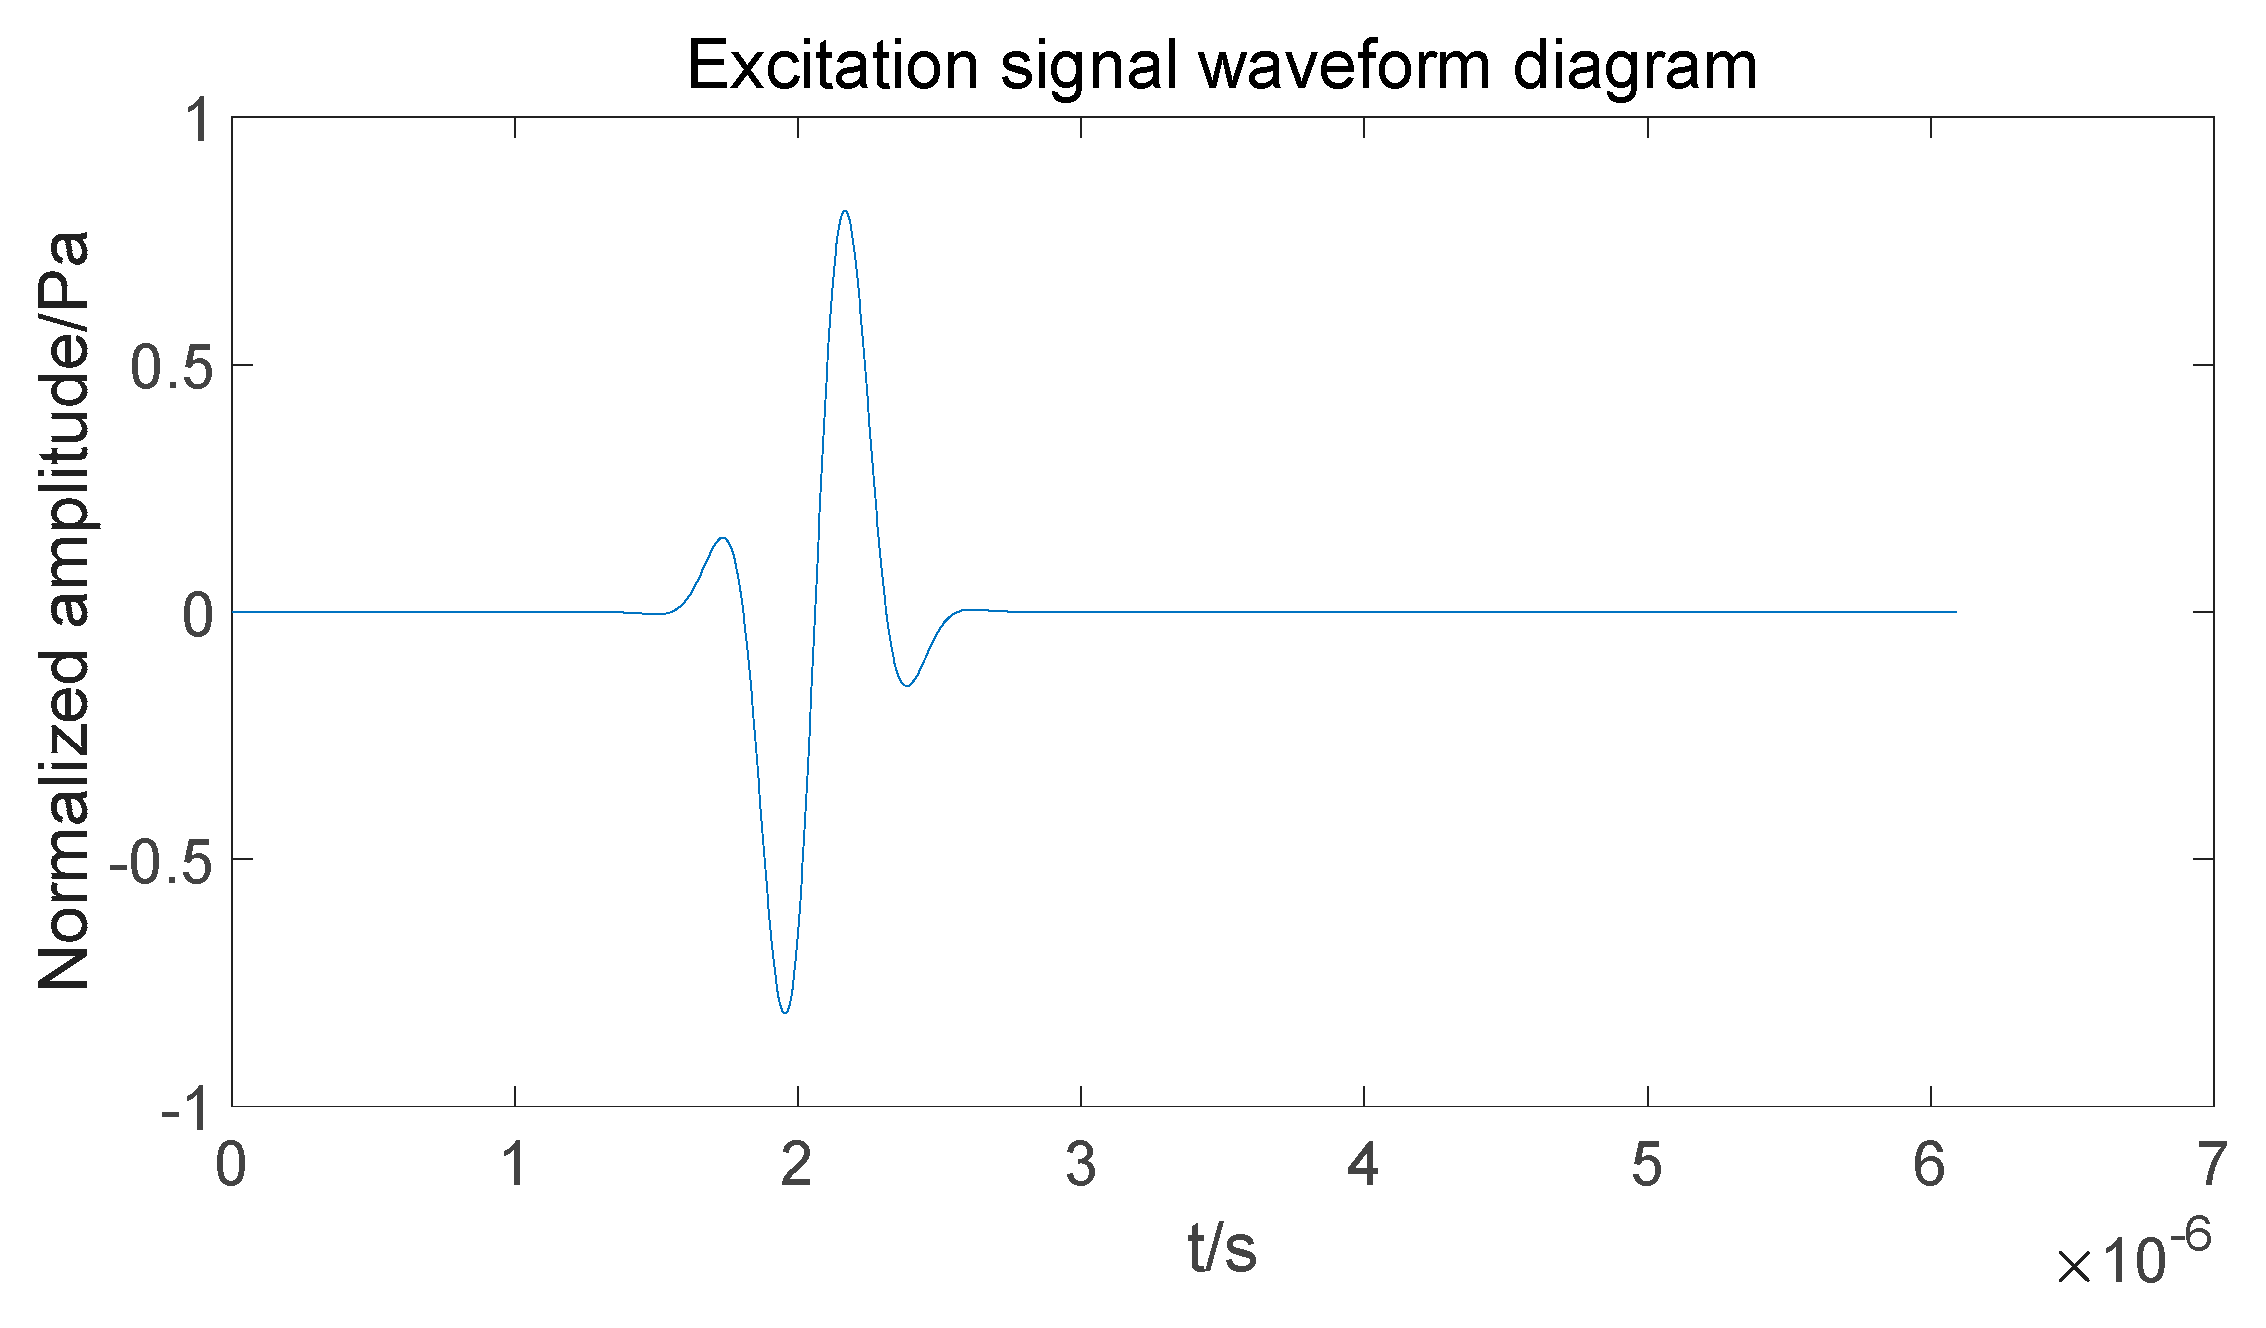
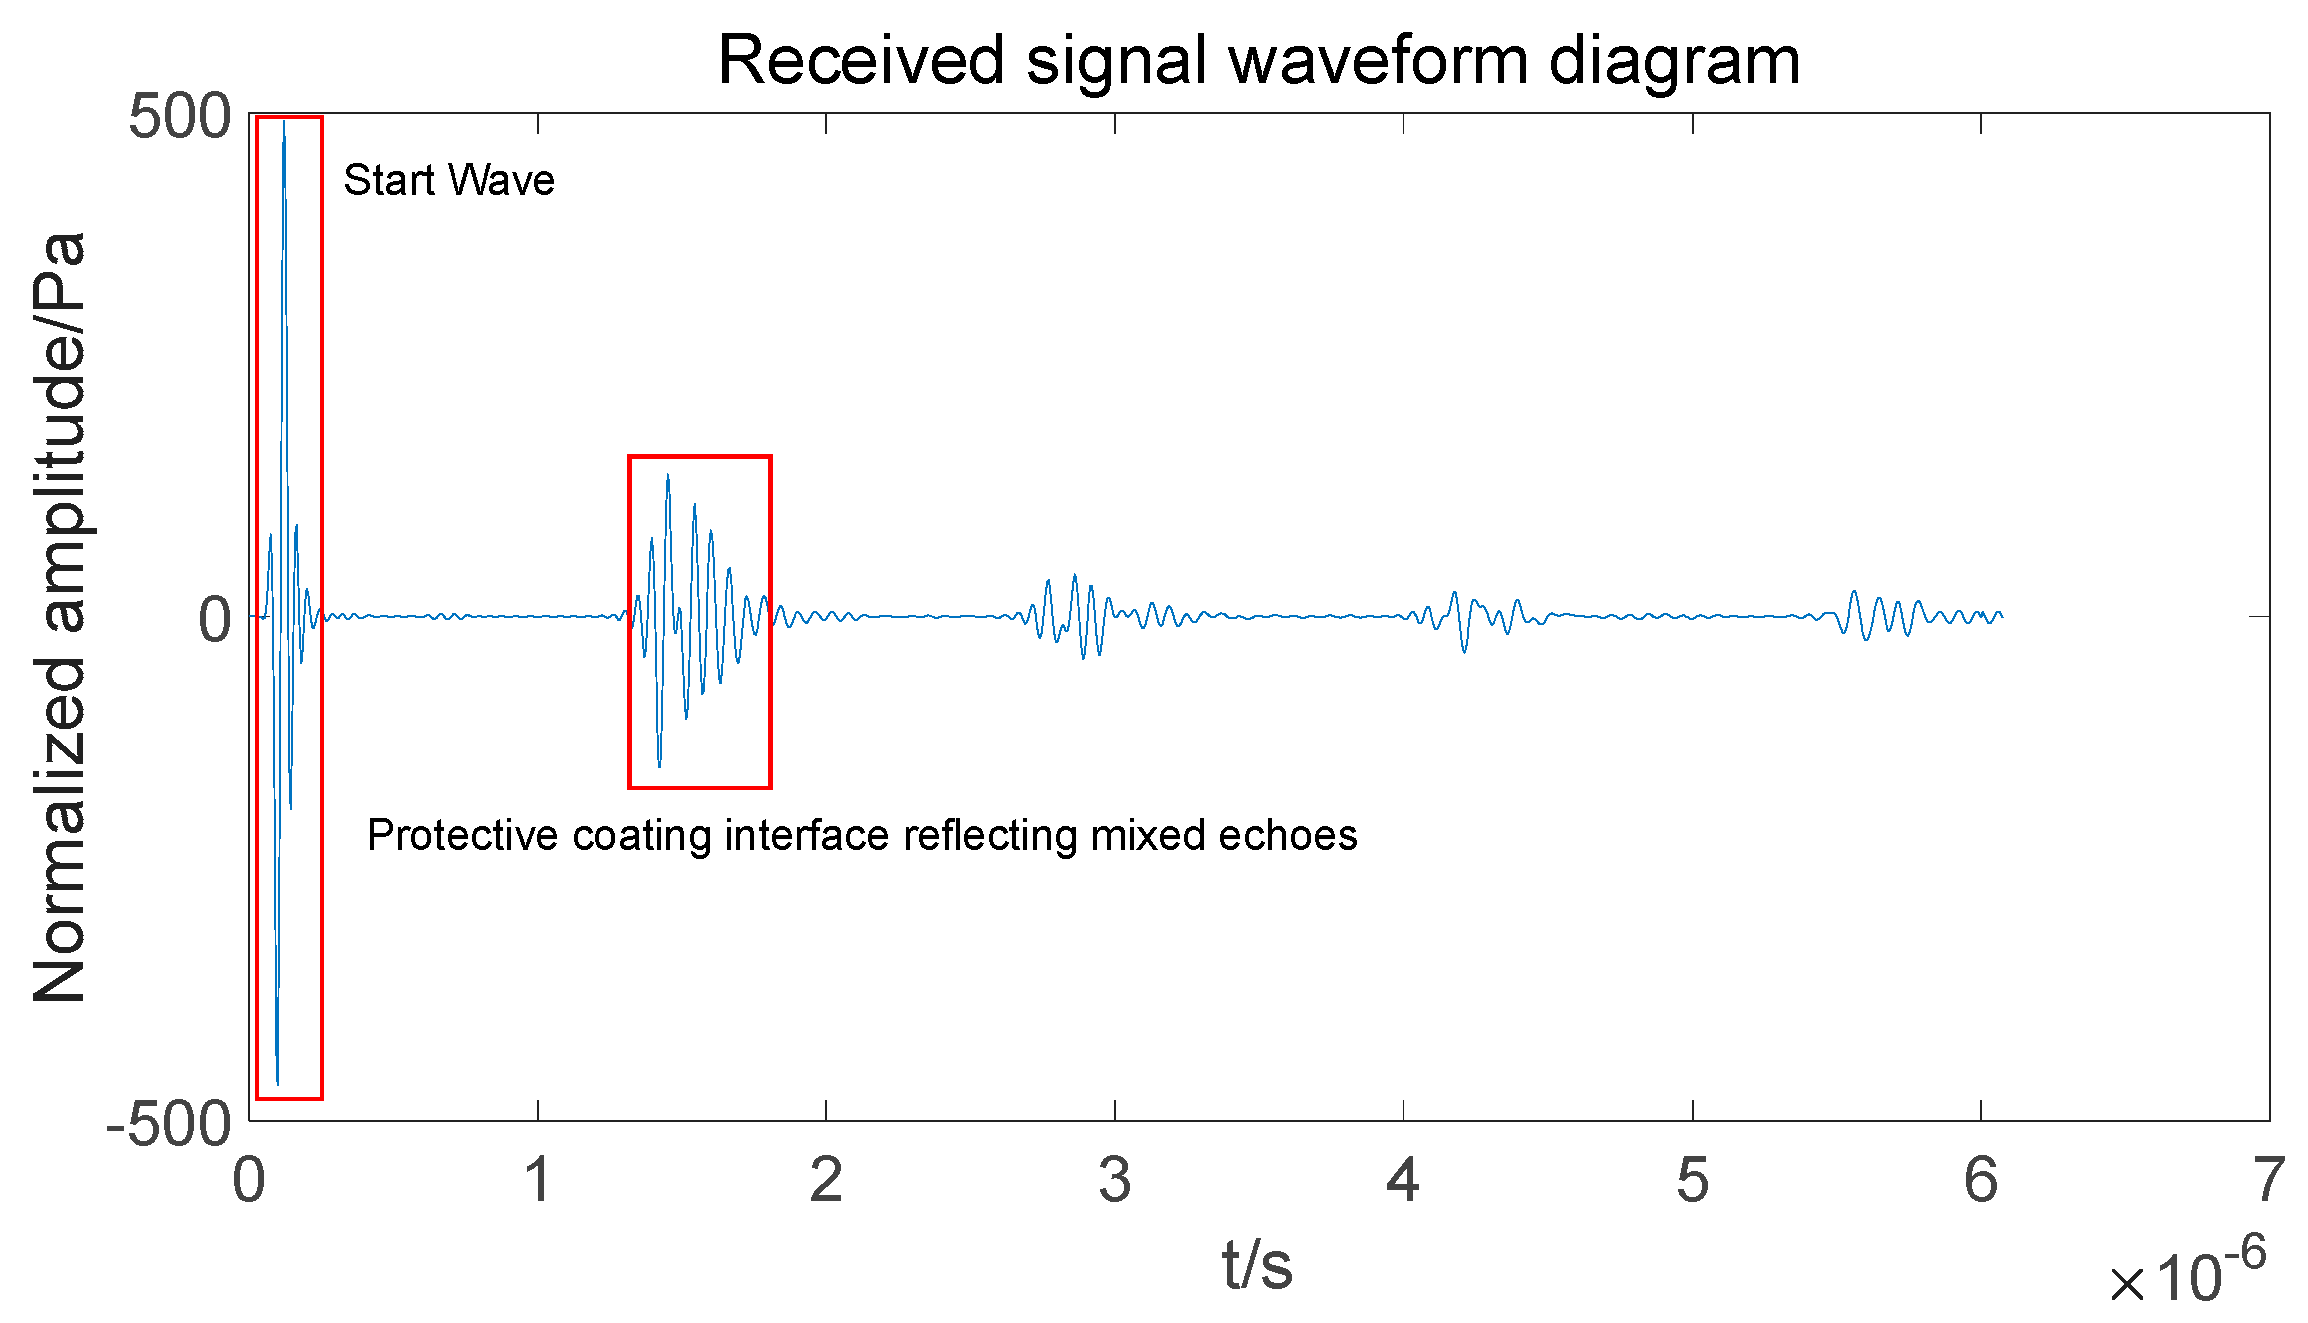
3.2. Simulation Results and Analysis
4. Experiment and Discussion
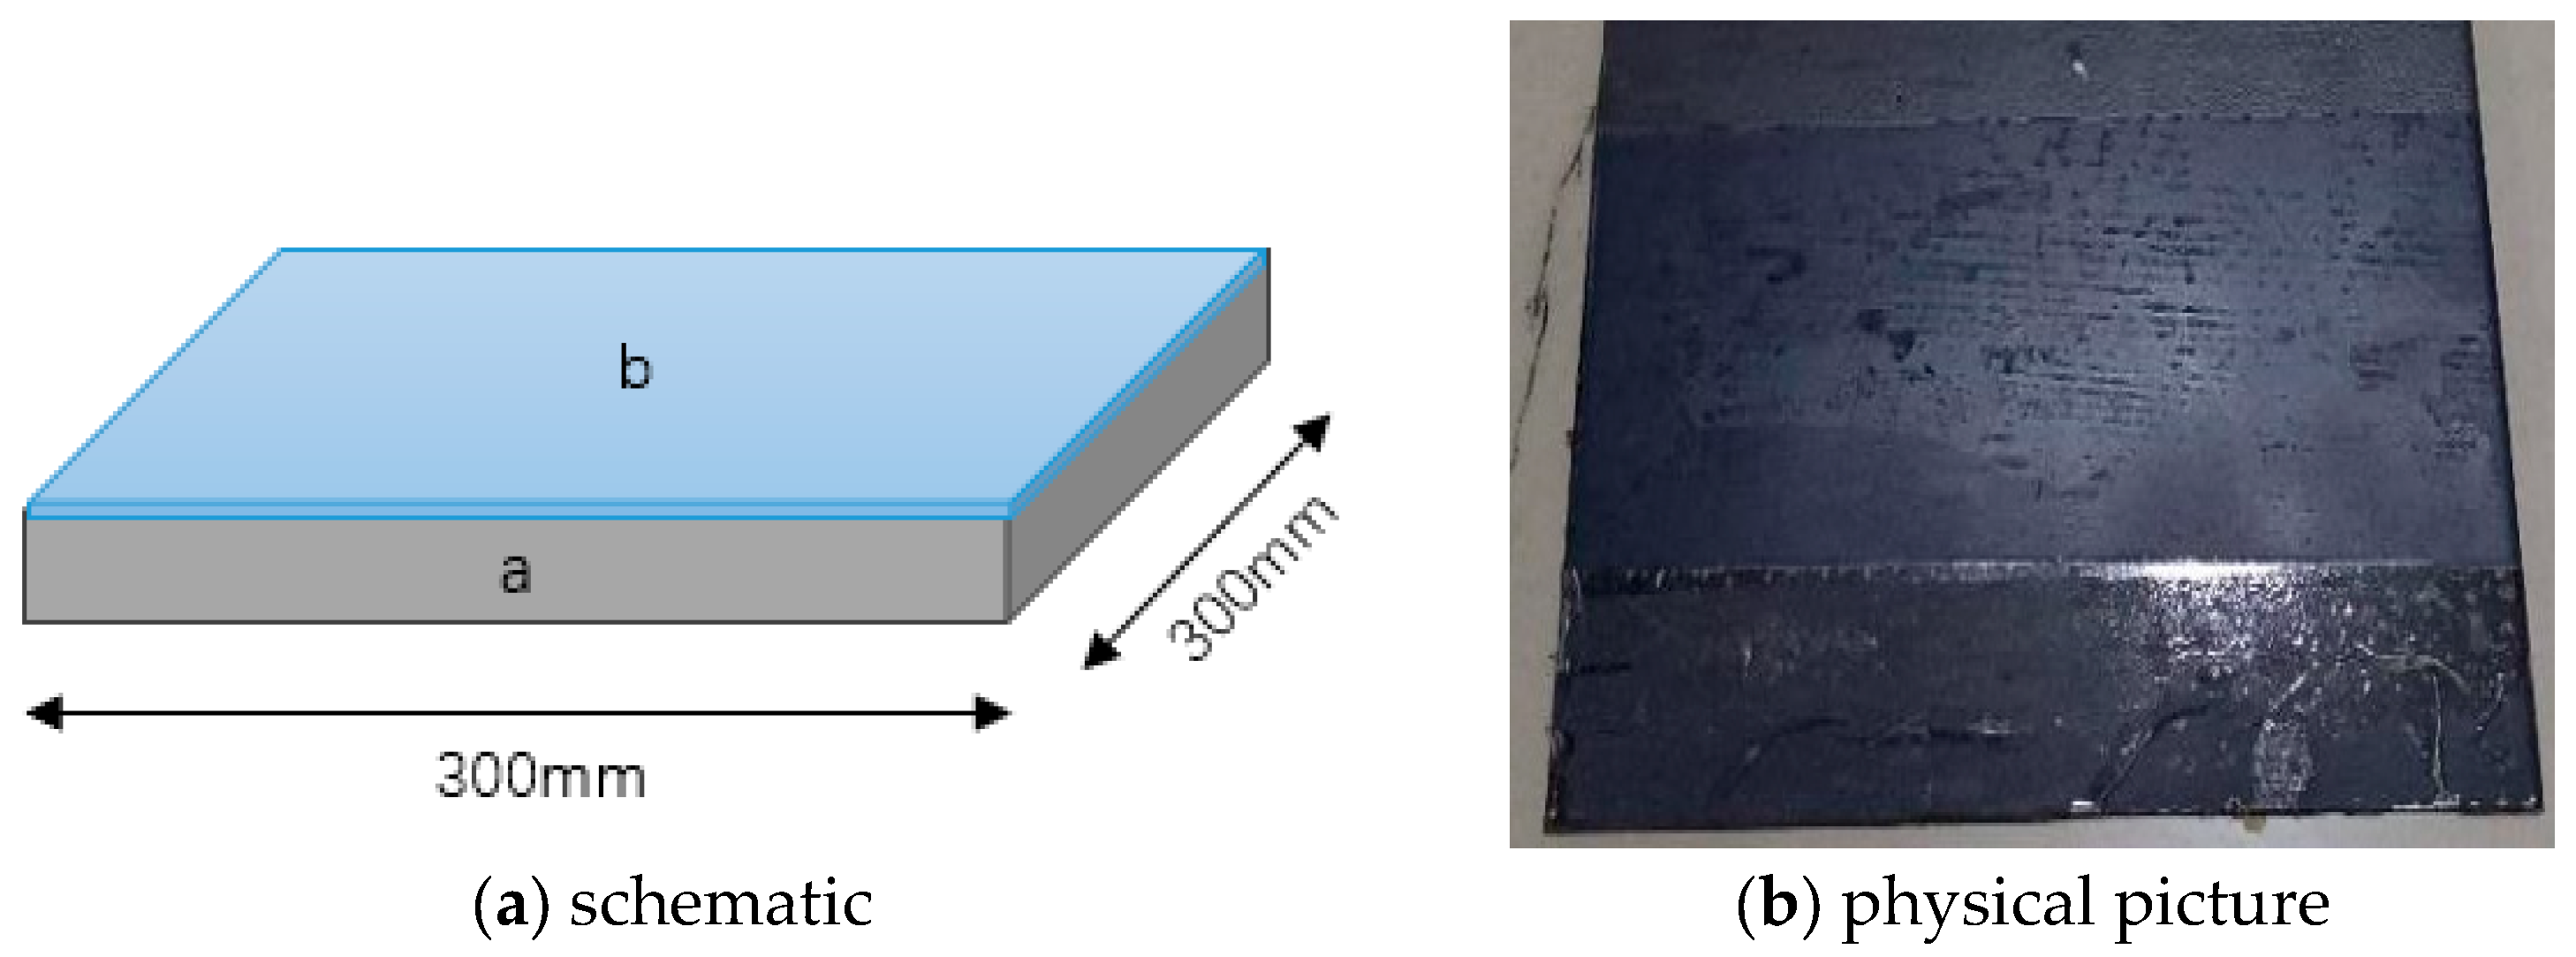
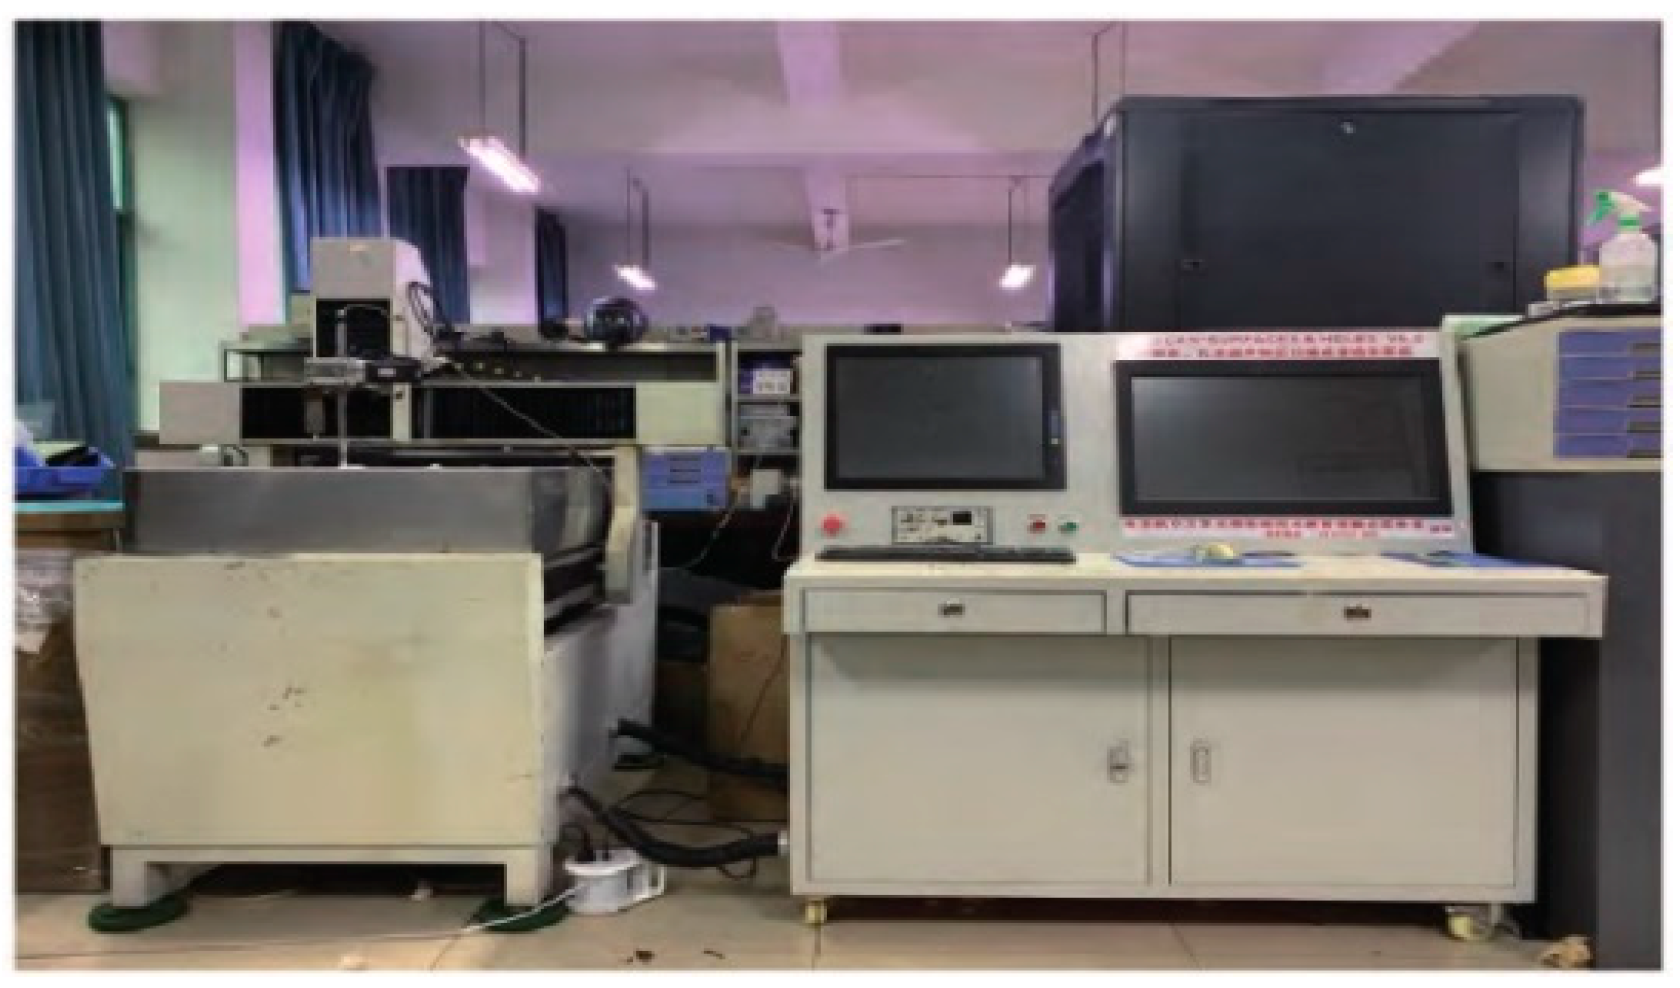
4.1. Specimen and Experimental Platform
4.2. Signal Decomposition Reconfiguration
5. Conclusions
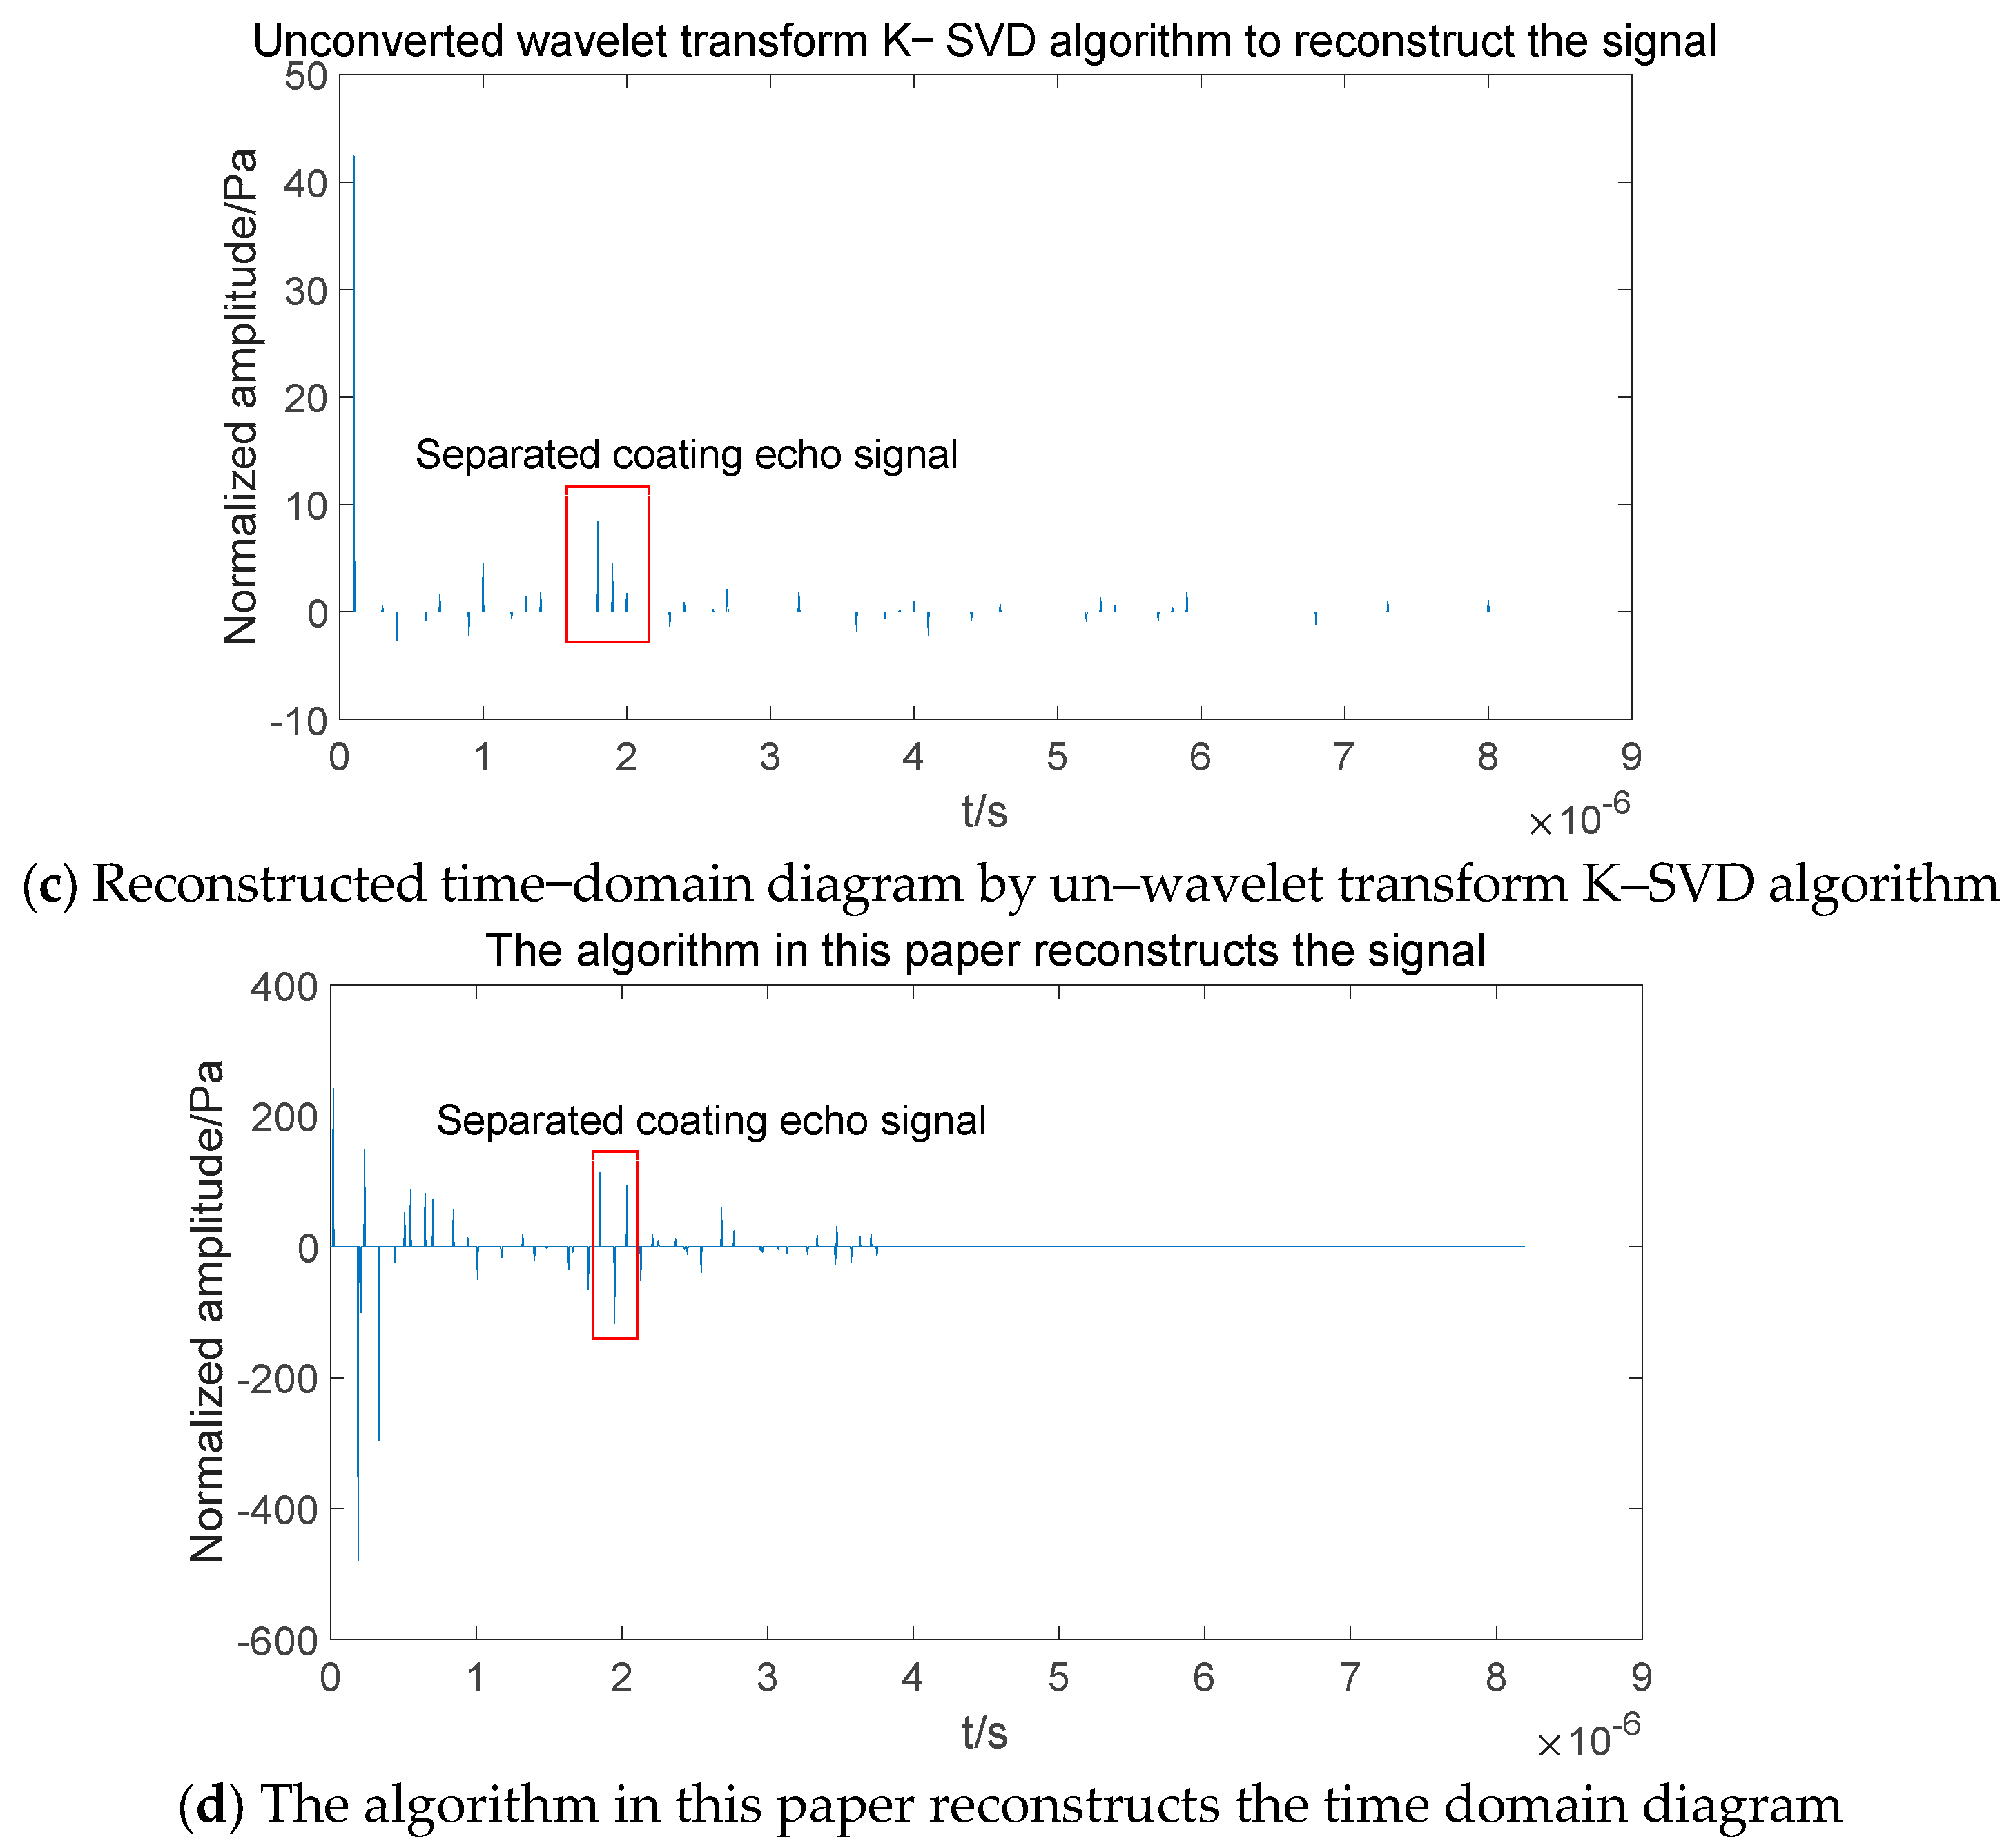
- The wavelet transform is used to identify the polar values of the detected signal as the input of dictionary learning, which can effectively avoid the influence of multiple features of the original signal on the signal mixing and separation, and the simulation and experiment show that the signal mixing and separation after wavelet transform are more accurate.
- The algorithm proposed in this paper, which trains the learning dictionary by signal extremes as features, greatly improves the algorithm operation efficiency while ensuring the accuracy of signal mixing and separation, and the simulation and experiment show that the detection relative error of the algorithm in this paper is within 9%, and the operation speed is 19 times higher than that of the MP algorithm.
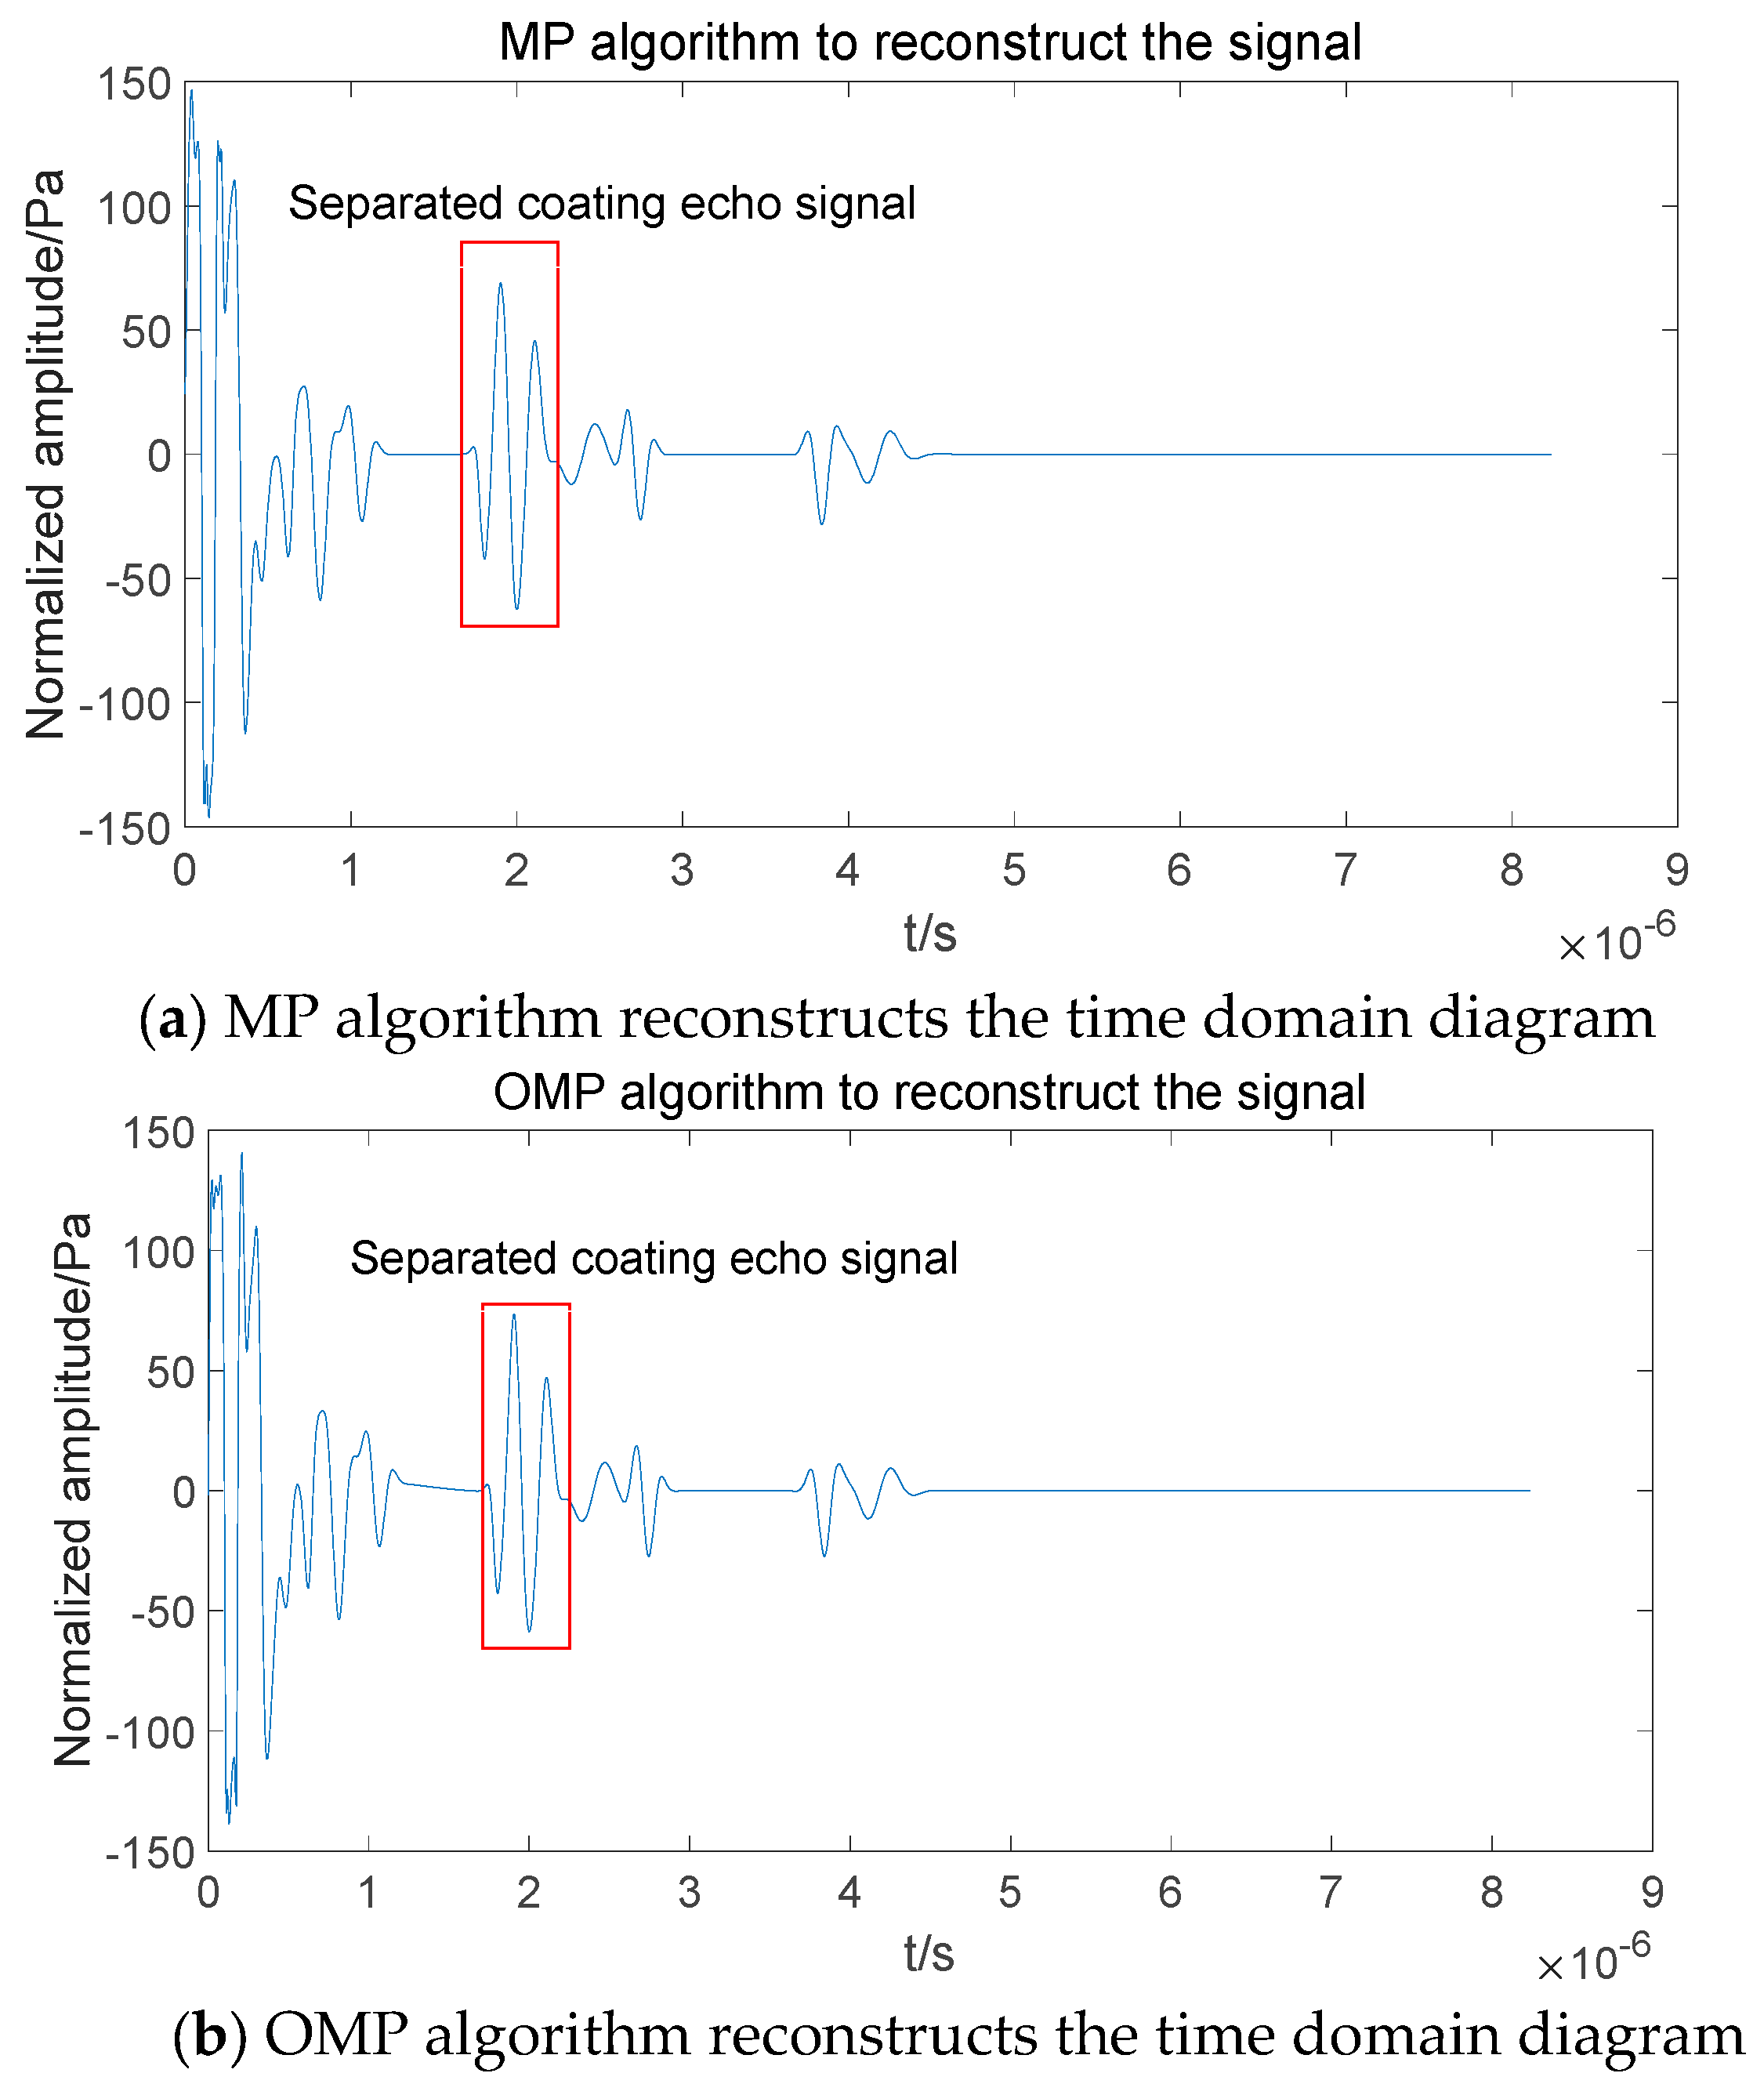
- The algorithm developed in this paper is more intuitive than the MP algorithm for the separation of the overlapped signals in the time domain, and the location of the coating echoes can be obtained more intuitively from the separated signals. At the same time, simulation and experiment show that for 0.1–0.2 mm thickness of the coating, ultrasonic detection of the mixed signals can be effectively separated and identified. Therefore, the method has great potential for use in coating thickness detection.
Author Contributions
Funding
Institutional Review Board Statement
Informed Consent Statement
Data Availability Statement
Conflicts of Interest
References
- Lu, L.; Zhao, Z.R.; Fu, L.; Zhang, X.Y. Discussion on Performance Optimization Method of Water-based Intumescent Fireproof Coatings for Steel Structure. Paint. Coat. Ind. 2022, 52, 70–76. [Google Scholar]
- Peng, B.; Zhou, S.X.; Wu, L.M.; You, B.; Gu, G.X. Exploitation of ultrathin fire-retardant coating material for exterior steel construction. Electroplat. Finish. 2009, 28, 46–49. [Google Scholar]
- Bai, Y.F.; Zhao, Z.X.; Sun, W.P.; PENG, W.S.; Jinag, Y.; Li, W.G.; Wang, S.X. Current status and development trend of anti-corrosion technology for steel structures in coastal power plants. Corros. Prot. 2019, 40, 293–298. [Google Scholar]
- Honarvar, F.; Varvani-Farahani, A. A review of ultrasonic testing applications in additive manufacturing: Defect evaluation, material characterization, and process control. Ultrasonics 2020, 108, 106227. [Google Scholar] [CrossRef] [PubMed]
- Golenishchev-Kutuzov, V.A.; Kalimullin, R.I.; Migachev, S.A.; Petrushenko, Y.Y.; Khasanov, A.A. Laser acoustic method for the inspection of flaws in metals and the metallized coatings of dielectrics. Russ. J. Nondestruct. Test. 2011, 47, 118–121. [Google Scholar] [CrossRef]
- Kumar, S.S.; Ravisankar, B. Evaluation of Quality Diffusion Bonding in Similar Material (Cu/Cu) Using Ultrasonic ‘C’ Scan Testing Method. Appl. Mech. Mater. 2014, 592–594, 289–293. [Google Scholar] [CrossRef]
- Malikov, A.K.u.; Kim, Y.H.; Yi, J.-H.; Kim, J.; Zhang, J.; Cho, Y. Neural-Network-Based Ultrasonic Inspection of Offshore Coated Concrete Specimens. Coatings 2022, 12, 773. [Google Scholar] [CrossRef]
- Zhang, J.; Cho, Y.; Kim, J.; Malikov, A.K.U.; Kim, Y.H.; Yi, J.-H. Nondestructive Inspection of Underwater Coating Layers Using Ultrasonic Lamb Waves. Coatings 2023, 4, 728. [Google Scholar] [CrossRef]
- Sun, L.M.; Lin, L.; Ma, M.Z.Y. Measurement of the Coatings Debonding Using Ultrasonic C-scan Imaging Based on Reflection Coefficient Amplitude Spectrum Characterizations. J. Mech. Eng. 2019, 55, 44–49. [Google Scholar]
- Lin, L.; Nie, Y.; Li, X.M. Ultrasonic Testing of Thin Layered Structure Based on Marr Wavelet Analysis. Mater. Eng. 2007, 2, 39–41+45. [Google Scholar]
- Zhang, Y.; Chen, Y.; Li, Q.F.; Lu, C.; Zhou, R.Q.; Long, S.R. Ultrasonic test and evaluation for iron-based amorphous coatings basedon wave packet decomposition. J. Vib. Shock 2021, 40, 38–45. [Google Scholar]
- Li, Q.; Zhang, X.; Zhu, J.; Huang, L.; Lu, C.; Chen, Y. Sensing Signal Analysis and Imaging Processing with High Frequency Ultrasonic Testing for Fe-based Amorphous Coatings. IEEE Sens. J. 2022, 22, 17455–17463. [Google Scholar] [CrossRef]
- Kishore, M.; Lee, H.; Abera, A.; Kim, H.J.; Seok, C.S.; Song, S.J. Quantitative Evaluation of Partial Delamination in Thermal Barrier Coatings Using Ultrasonic C-scan Imaging. Int. J. Precis. Eng. Manuf. 2020, 21, 157–165. [Google Scholar] [CrossRef]
- Zhang, S.; Lv, G.; Guo, S.; Zhang, Y.; Feng, W. Porosity Characterization of Thermal Barrier Coatings by Ultrasound with Genetic Algorithm Backpropagation Neural Network. Complexity 2021, 2021, 8869928. [Google Scholar] [CrossRef]
- Li, Y.J.; Han, Z.D.; Chen, Y.F. Research on Ultrasonic Testing Methods for Adhesion Quality of Ceramic Coatings. MATEC Web Conf. 2017, 114, 02001. [Google Scholar] [CrossRef]
- Chen, X.; Shaw, C.; Gelman, L.; Grattan, K.T. Advances in test and measurement of the interface adhesion and bond strengths in coating-substrate systems, emphasising blister and bulk techniques. Meas. J. Int. Meas. Confed. 2019, 139, 387–402. [Google Scholar] [CrossRef]
- Zhang, Z.; Guo, S.; Li, Q.; Cui, F.; Malcolm, A.A.; Su, Z.; Liu, M. Ultrasonic detection and characterization of delamination and rich resin in thick composites with waviness. Compos. Sci. Technol. 2020, 189, 108016. [Google Scholar] [CrossRef]
- Völker, C.; Shokouhi, P. Multi sensor data fusion approach for automatic honeycomb detection in concrete. NDT E Int. 2015, 71, 54–60. [Google Scholar] [CrossRef]
- La Malfa Ribolla, E.; Rezaee Hajidehi, M.; Rizzo, P.; Fileccia Scimemi, G.; Spada, A.; Giambanco, G. Ultrasonic inspection for the detection of debonding in CFRP-reinforced concrete. Struct. Infrastruct. Eng. 2018, 14, 807–816. [Google Scholar] [CrossRef]
- Zhang, G.M.; Zhang, C.; Harvey, D.M. Sparse signal representation and its applications in ultrasonic NDE. Ultrasonics 2012, 52, 351–363. [Google Scholar] [CrossRef]
- Benammar, A.; Chibane, F. Resolution Improvement of Ultrasonic Signals Using Sparse Deconvolution and Variational Mode Decomposition Algorithms. Russ. J. Nondestruct. Test. 2022, 56, 479–489. [Google Scholar] [CrossRef]
- Schnass, K.; Vandergheynst, P. Dictionary Preconditioning for Greedy Algorithms. IEEE Trans. Signal Process. 2008, 56, 1994–2002. [Google Scholar] [CrossRef] [Green Version]
- Aharon, M.; Elad, M.; Bruckstein, A. K–SVD: An Algorithm for Designing of Overcomplete Dictionaries for Sparse Representation. IEEE Trans. Signal Process. 2006, 54, 4311–4322. [Google Scholar] [CrossRef]
- Fan, W.; Chen, M.H.; Gao, N.J.; Zhang, C.X.; Zheng, G. OCT image speckle sparse noise reduction based on dictionary algorithm. Opto-Electron. Eng. 2019, 46, 180572. [Google Scholar]
- Cheng, G.; Zhang, J.B. Analysis on parameters of time-frequency atoms in matching pursuit based on Morlet wavelet. Prog. Geophys. 2019, 34, 2247–2255. [Google Scholar]
- Mor, E.; Azoulay, A.; Aladjem, M. A matching pursuit method for approximating overlapping ultrasonic echoes. IEEE Trans. Ultrason. Ferroelectr. Freq. Control 2010, 57, 1996–2004. [Google Scholar] [CrossRef]
- Liu, X.; Chen, C.; Zhao, Y.T.; Wang, X. Multi-Wavelet Decomposition and Reconstruction Based on Matching Pursuit Algorithm Fast Optimized by Particle Swarm. J. Jilin Univ. 2015, 45, 1855–1861. [Google Scholar]
- Liu, J.C.; Guo, R.; Qi, C.L. Signal MP-Based Sparse Decomposition with Modified Artificial Bee Colony Algorithm. Commun. Inf. Process. 2016, 35, 54–58. [Google Scholar]
- Elsayed, E.K.; Salem, D.; Aly, M. A Fast Quantum Particle Swarm Optimization Algorithm for Image Denoising Problem. Int. J. Intell. Eng. Syst. 2020, 13, 98–112. [Google Scholar] [CrossRef]
- Le, Y.X.; Yang, T.; Zeng, X.D. Seismic denoising with CEEMD and KSVD dictionary combined training. Oil Geophys. Prospect. 2019, 54, 729–736. [Google Scholar]
- Ma, L.Y.; Ma, H.B.; Liu, L. Speckle Noise Reduction in SAR image based on K–SVD. In Proceedings of the 2015 International Symposium on Computers & Informatics, Beijing, China, 17–18 January 2015; pp. 1615–1622. [Google Scholar] [CrossRef] [Green Version]
- Gong, W.R.; Li, H.Y.; Zhao, D. An Improved Denoising Model Based on the Analysis K–SVD Algorithm. Circuits Syst. Signal Process. 2017, 36, 4006–4021. [Google Scholar] [CrossRef]
- Qin, Y.; Zou, J.; Tang, B.; Wang, Y.; Chen, H. Transient Feature Extraction by the Improved Orthogonal Matching Pursuit and K–SVD Algorithm With Adaptive Transient Dictionary. IEEE Trans. Ind. Inform. 2020, 16, 215–227. [Google Scholar] [CrossRef]
- Li, X.L.; Qiao, T.Z. Singularity Detection Based on Wavelet Transform Modulus Maximum in Magnetic Memory Signal of Steel-cord Belt. Coal Mine Mach. 2013, 34, 89–92. [Google Scholar]
- Song, Y.; Shi, W.J.; Sun, B.C. Evaluation of railway wheel-flat via adaptive continuous wavelet transform modulus maximum algorithm. J. Vib. Shock 2021, 40, 168–178+209. [Google Scholar]
- Zhang, X.Y.; Chai, Y.; Li, H.F. Low SNR image denoising via sparse and redundant representations over K–SVD algorithm and residual ratio iteration termination. Opt. Technol. 2012, 38, 23–29. [Google Scholar] [CrossRef]
- Gu, J.F.; Su, M.X.; Cai, X.S. The COMSOL based sound filed simulation and image reconstruction of ultrasonic tomography. Technol. Acoust. 2016, 35, 231–234. [Google Scholar]


| Structural Layer | Poisson Ratio | Density | |
|---|---|---|---|
| water layer | / | / | 1000 |
| fireproof coating | 0.45 | 0.99 | 800 |
| anti-corrosion coating | 0.28 | 30 | 2400 |
| steel layer | 0.3 | 200 | 7850 |
| Coating | Actual Thickness (mm) | Detection of Thickness (mm) | Relative Error (%) |
|---|---|---|---|
| Fireproof layer | 0.1 | 0.103 | 3.0 |
| Anti-corrosion layer | 0.1 | 0.109 | 9.0 |
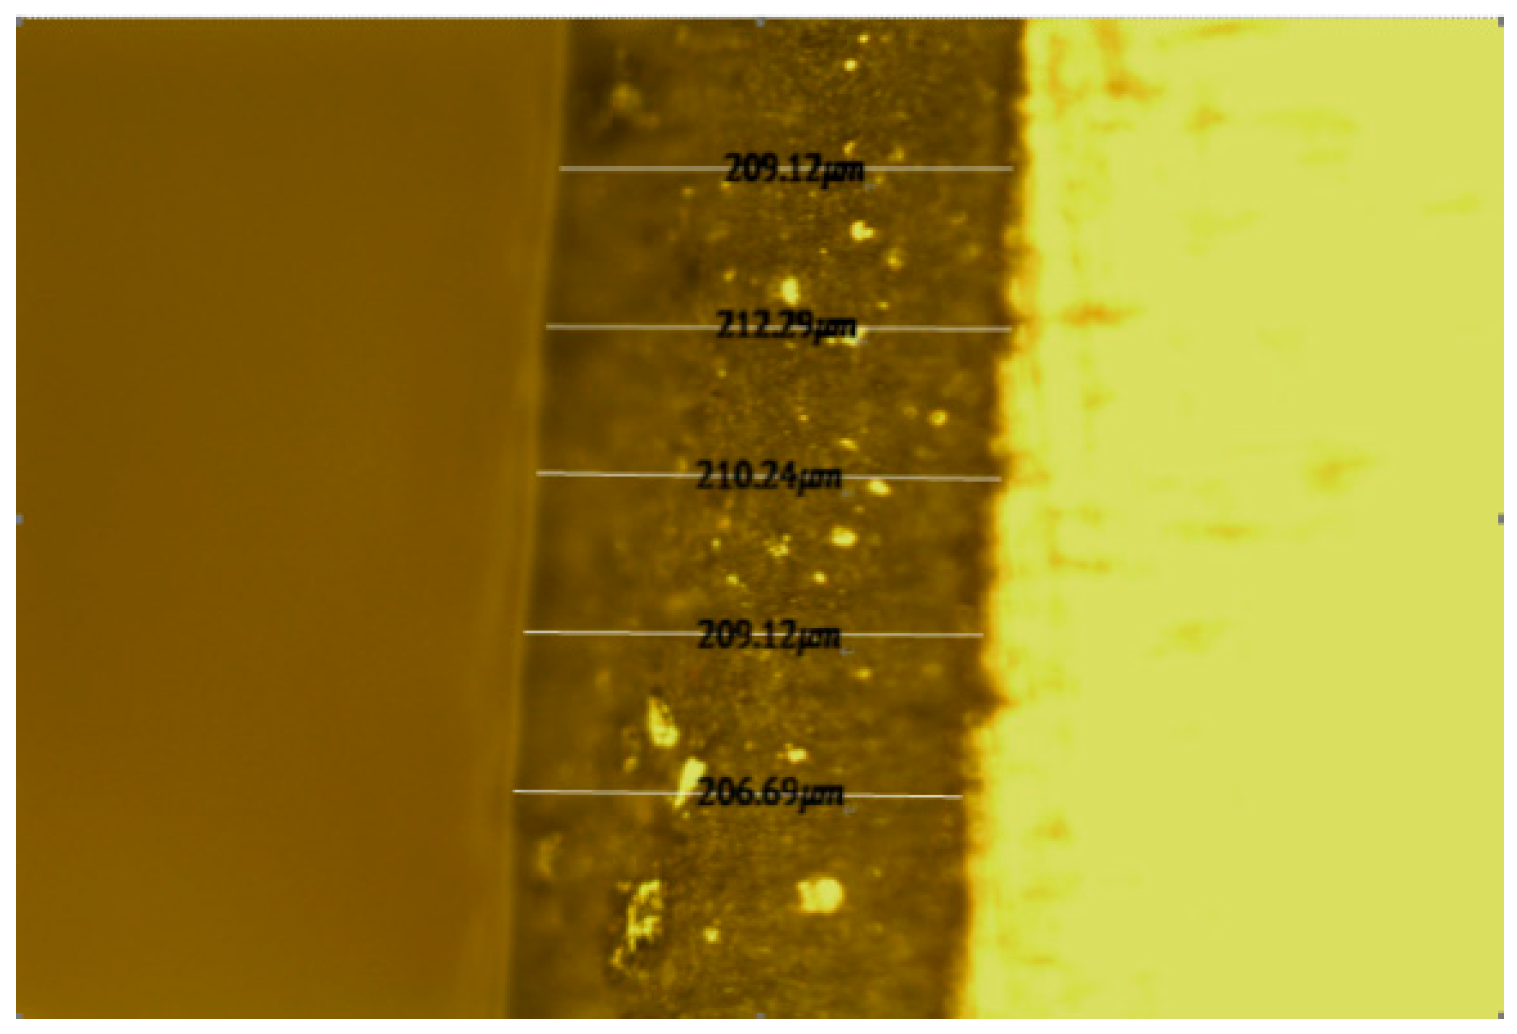
| Test Points | Coating Thickness Measurement Results | Average Thickness |
|---|---|---|
| 1 | 209.12 | 209.49 |
| 2 | 212.29 | |
| 3 | 210.24 | |
| 4 | 209.12 | |
| 5 | 206.69 |
| Serial Number | Detection of Thickness (mm) | Relative Error (%) |
|---|---|---|
| 1 | 0.1938 | 7.49 |
| 2 | 0.2147 | 2.50 |
| 3 | 0.1990 | 4.99 |
| 4 | 0.2042 | 2.54 |
| 5 | 0.2147 | 2.50 |
| 6 | 0.2252 | 7.51 |
| 7 | 0.2147 | 2.50 |
| 8 | 0.2252 | 7.51 |
| 9 | 0.2147 | 2.50 |
| 10 | 0.1992 | 4.91 |
Disclaimer/Publisher’s Note: The statements, opinions and data contained in all publications are solely those of the individual author(s) and contributor(s) and not of MDPI and/or the editor(s). MDPI and/or the editor(s) disclaim responsibility for any injury to people or property resulting from any ideas, methods, instructions or products referred to in the content. |
© 2023 by the authors. Licensee MDPI, Basel, Switzerland. This article is an open access article distributed under the terms and conditions of the Creative Commons Attribution (CC BY) license (https://creativecommons.org/licenses/by/4.0/).
Share and Cite
Liu, Y.; Zhou, R.; Wang, Z.; Li, Q.; Lu, C.; Wang, H. Ultrasonic Detection of Aliased Signal Separation Based on Adaptive Feature Dictionary and K–SVD Algorithm for Protective Coatings of Assembled Steel Structure. Coatings 2023, 13, 1239. https://doi.org/10.3390/coatings13071239
Liu Y, Zhou R, Wang Z, Li Q, Lu C, Wang H. Ultrasonic Detection of Aliased Signal Separation Based on Adaptive Feature Dictionary and K–SVD Algorithm for Protective Coatings of Assembled Steel Structure. Coatings. 2023; 13(7):1239. https://doi.org/10.3390/coatings13071239
Chicago/Turabian StyleLiu, Yiyi, Ruiqi Zhou, Zhigang Wang, Qiufeng Li, Chao Lu, and Haitao Wang. 2023. "Ultrasonic Detection of Aliased Signal Separation Based on Adaptive Feature Dictionary and K–SVD Algorithm for Protective Coatings of Assembled Steel Structure" Coatings 13, no. 7: 1239. https://doi.org/10.3390/coatings13071239