Article

The Corrosion Behavior of Al/Al2O3 Composite Films with Ultra-Dense Structure Exposed to Lead-Bismuth Eutectic at 450 to 650 °C

1
Science and Technology on Reactor Fuel and Materials Laboratory, Nuclear Power Institute of China, Chengdu 610041, China
2
School of Advanced Materials, Peking University Shenzhen Graduate School, Shenzhen 518055, China
3
College of Materials Science and Engineering, Sichuan University, Chengdu 610065, China
*
Authors to whom correspondence should be addressed.
Coatings 2023, 13(7), 1274; https://doi.org/10.3390/coatings13071274
Submission received: 27 May 2023 / Revised: 7 July 2023 / Accepted: 14 July 2023 / Published: 20 July 2023

Abstract

:
Al2O3 coatings are the most promising candidate material for mitigating (lead-bismuth eutectic) LBE corrosion at elevated temperatures, but preventing inward diffusion of Pb, Bi, and O for the ceramic coating remains a critical challenge. Here, we have fabricated an amorphous Al2O3 coating with an ultra-dense structure by continuous high-power magnetron sputtering (C-HPMS). After LBE corrosion at 550 °C for 2000 h, nanocavities induced by the phase transformation from amorphous to γ-Al2O3 provide the diffusion path for Fe, O, Pb, and Bi in which the corrosion products, such as Fe3O4, PbO2, or their mixed oxides, form. Furthermore, the diffusion of Pb to the substrate and Cr segregation at the interface between the coating and substrate are observed for the sample exposed to LBE at 550 °C for 4000 h. Additionally, the hardness and interface bonding strength are enhanced after LBE corrosion. Moreover, pit corrosion was found to be the main failure mode of coating, and pits that merged with each other induced large area failure at a temperature of 650 °C. The corrosion mechanism of Al2O3 includes element diffusion, phase transformation, and chemical reaction. This work not only provides a deep understanding of the corrosion mechanism of amorphous Al2O3 coatings, but also shows the optimization method on the corrosion resistance of Al2O3 coating.

1. Introduction

With merits of reliable safety, fuel cycle efficiency, and thermal efficiency, the new generation nuclear system was proposed by the Generation IV International Forum (GIF) in 2002 [1,2,3]. Specifically, lead or lead-based reactors are the most promising candidates for commercialization due to their intrinsic safety, high power density, and easy miniaturization [4]. However, the commercial development of lead fast reactors highly depends on the properties of available materials in severe service condition [5,6].
Current structural materials, such as ferritic/martensitic (F/M) steel [7] and austenitic steel [8], are unable to satisfy the demands of high temperature and the dose of irradiation in the core, according to the current research. For thin-walled fuel cladding, the consumption of tube thickness caused by the oxidation corrosion of liquid lead-bismuth eutectic (LBE) coolant represents a considerable challenge for the development of a lead-based fast reactor [9,10,11]. During the last decades, many efforts have been devoted to understanding the corrosion mechanism of the structural material in Pb or LBE at elevated temperatures [12]. Generally, the corrosion process is controlled by the dissolved oxygen content in LBE (lead-bismuth eutectic) and the diffusion of Fe, Cr, Pb, Bi, and O. In the presence of high oxygen potential, duplex oxide films are formed on the surfaces of F/M (ferritic/martensitic) and austenitic steel. These oxide films consist of an outer layer with an Fe-Cr spinel structure and an inner layer with a dense structure rich in Cr and O [7,13,14]. Nevertheless, this passive film is only beneficial for the cladding tubes at temperatures below 500 °C [15]. With low oxygen potential, dissolution corrosion is characterized by the transfer of alloying elements, such as Fe, Cr, and Ni, to liquid metal. The depletion of structural material is the main issue for the development of lead-based reactors. Therefore, the above two corrosion modes should be avoided or mitigated before practical application.
Currently, numerous surface treatment techniques are being explored to provide effective protection for structural materials at temperatures exceeding 500 °C. These techniques include laser cladding [16], magnetron sputtering [17,18,19], and thermal spraying [20]. Taking advantage of dense structure, excellent adhesion, and low temperature process, coatings deposited by magnetron sputtering exhibit potential applications as protective layers at elevated temperatures in liquid metal [17]. Meanwhile, many sputtering modes, such as radio frequency (RF) [21], direct current (DC) [22], middle frequency (MF) [23], and high-power pulse magnetron sputtering (HiPPMS) [24], are used as the source of sputtered metal. However, the low deposition rates of the coatings hinder its large-scale application. For example, γ-Al2O3 coatings were obtained via HiPPMS at the temperature of 350 °C due to high energy metal ions [25]. The low deposition rate of HiPPMS is only half that of common magnetron sputtering [26]. Recently, a continuous high-power direct current magnetron sputtering (C-HPMS) was proposed, which can achieve a high ionization (90% for Al) and deposition rate (112 nm/min) [27].
In this work, the corrosion behavior of Al/Al2O3 composite coatings with ultra-dense structures grown by C-HPMS were investigated under different bias voltages from 50 to 150 V. Taking advantage of high deposition rate and heat treatment, the amorphous phase structure for the as-deposited sample changed to γ-Al2O3. Their corrosion behavior in the temperature range of 450 to 650 °C are explored for 2000 h. The effect of bias voltage on the microstructure, mechanical properties, and LBE corrosion resistance of Al2O3 coatings were systemically investigated.

2. Experimental

2.1. Coating Deposition

All coatings investigated in this work were synthesized via a self-design magnetron sputtering system using a 60 kW DC power supply (Ascent 60, Advanced Energy, Denver, CO, USA), which provides an ultra-high deposition rate up to 150 nm/min. The detailed configurations of the deposition system are referred to in a previous report [27]. The F/M steel with a size of Φ 10 mm × 1 mm was ultrasonically cleaned in acetone and then ethanol for 10 min. Subsequently, the samples were mounted in a substrate holder with a function of self-rotation (4 r/min). Before the deposition, the vacuum of the system was evacuated to a base pressure of 1 × 10⁻³ Pa while maintaining a stable temperature of 200 °C in the deposition chamber. For the next cleaning stage in the chamber, a pure Ar atmosphere was introduced to keep a constant pressure of 2 Pa in which the bias voltage of −1000 V was used to clean the surface of the sample. During the deposition stage, the Al target was applied with a power of 100 W under the Ar/O2 mixed gas with a flow rate of 100 sccm and 120 sccm, respectively, and the discharge pressure was approximately 0.3 Pa. Different bias voltages of −50, −100, and −150 V were applied to the samples to investigate the effect of bias voltages on the corrosion resistance in LBE. The deposition rate reached 150 nm/min while controlling the deposition time to realize the total thickness between 1.5 and 2 μm.

2.2. Material Characterization

X-ray diffraction (XRD) measurements were performed on coatings before and after heat treatment with a Bruker AXS D8 with Cu Kα radiation. A grazing incidence scan with an incident angle of 1° was completed, with the scanning angle ranging from 20 to 80°, and the scan step size was 0.02°. The surface and cross-sectional morphologies of coatings and the corresponding element composition before and after LBE corrosion were studied using a field emission scanning electron microscope (SEM, FEI sicos) equipped with an energy dispersive spectrometer (EDS). The bonding energy of Al2p and O1s were probed using X-ray photoelectron spectroscopy (XPS, ESCALAB Xi+). The X-ray was excited by monochromatic Al Kα radiation with a spot size of 500 μm. The element composition of the as-deposited coating was measured via the sensitivity factors provided by Thermos Fisher Scientific. The microstructure and composition of Al2O3 coatings after LBE corrosion were investigated via FEI Talos F200X field emission microscope (200 kV), which was equipped with energy dispersive X-ray spectroscopy (EDS). The TEM samples were prepared by focused ion beam (FIB) performed on ZEISS Crossbeam 540 with a standard process, including grinding, polishing, dimpling, and ion-milling. Atomic-resolution images were obtained from high-angle annular dark-field scanning transmission electron microscopy (HADDF).

2.3. Mechanical Properties

The hardness H and elastic modulus E of the coatings before and after heat treatment were performed using Agilent G200 with a diamond Berkovich tip. Continuous stiffness measurement (CSM) was applied with 12 indentations of 3 × 4 arrays. The maximum depth was set at 100 nm, which is less than 1/10 thickness of coatings. All the data were collected before the calibration of standard SiO2 sample. The H and E were obtained from the loading and depth curve, following the Oliver and Pharr approach [28,29]. Nanoscratch tests were performed with a cube corner tip before and after the corrosion test. The scratch length was set to 400 μm. The load of the tip was increased to the maximum value of 400 mN at velocity of 2 μm s−1. Four scratch lines were performed on each sample.

2.4. Corrosion Properties in LBE

The static LBE corrosion test was conducted in a high temperature furnace, where the temperature fluctuation was limited to 5 °C. The sample with 10 mm × 10 mm × 1 mm was fixed on 316 steel and then immersed in the molten LBE. The whole corrosion test lasted for 2000 h at 350, 450, 550, and 650 °C. The coating deposited at the bias voltage of −150 V was further exposed to LBE at 550 °C for 4000 h to evaluate its long-time corrosion resistance. Extreme conditions with saturated oxygen in LBE were applied for all samples. The oxygen concentration of LBE was calculated by the following equation [30]:
l o g C o , s ( wt . % ) = 2.62 4416 / T ( K )
where Co,s is the saturated concentration of oxygen in LBE and T (K) is the temperature of LBE. The objective of lead-bismuth corrosion research in high-temperature and saturated oxygen environments is to investigate and understand the limits of coating corrosion resistance.

3. Results

3.1. Microstructure and Composition

The as-deposited Al2O3 coating is smooth and about 1.6~1.9 μm thick; there is no obvious porosity or cracking, as shown in Figure 1. Generally, the Al2O3 coatings exhibit amorphous structure deposited by magnetron, especially at a high deposition rate of ~150 nm/min, approximately 10 times that of conventional magnetron sputtering technology. No obvious structure changes were observed under different bias voltages. Two peaks of Al2p are presented in Figure 2b in which the binding energy of 75.6 eV and 72 eV can be ascribed to Al in an oxide state and Al in metal, respectively [31,32]. Based on the binding energy, the coating is composed of amorphous Al2O3 and crystal Al metal phases in which the Al metal may be introduced by the sputtering process without enough time to react with O. No obvious effect of bias voltage, located at 532.6 eV, on the core level of O1s was observed [33].
Figure 3 shows the hardness and Young’s modulus of Al2O3 coatings deposited with the bias voltages of −50, −100, and −150 V. The hardness of as-deposited coatings is 6.4, 8.6, and 6.35 GPa with different bias voltages, with a corresponding Young’s modulus of 114.8, 140.2, and 115.8 GPa. After the heat treatment at 600 °C for 10 h, the hardness is 6.2, 13.8, and 5.14, with a corresponding Young’s modulus of 113.4, 194.1, and 83.5 GPa. Generally, the hardness of Al2O3 coatings is approximately 9 GPa. Because of the presence of Al metal in the coatings, all hardness below 9 GPa can be expected.

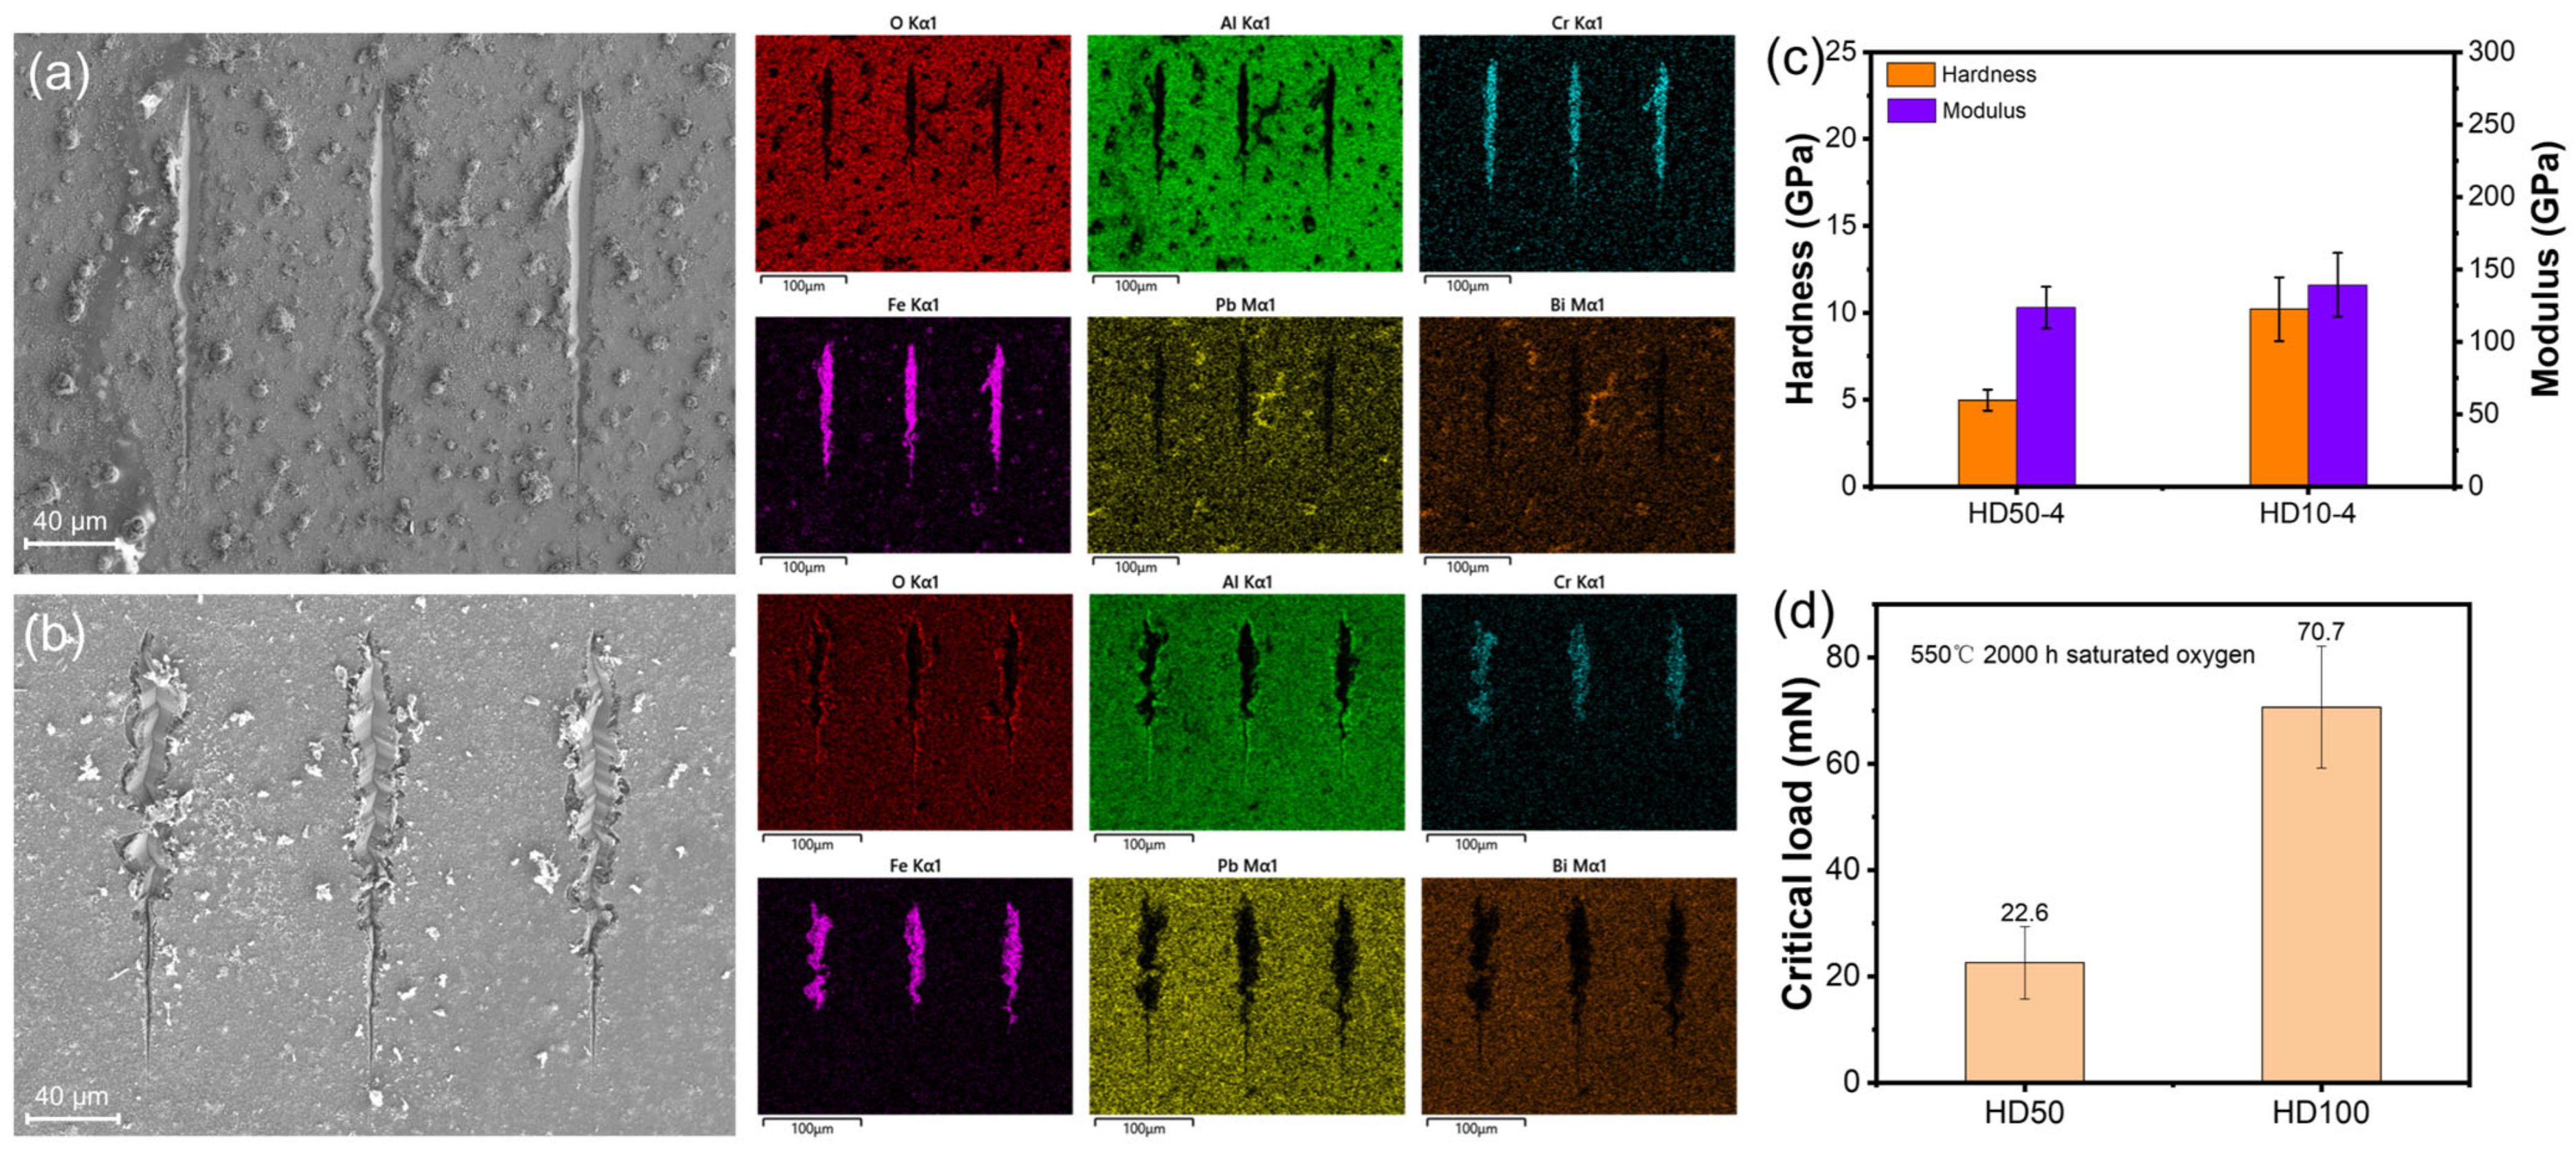
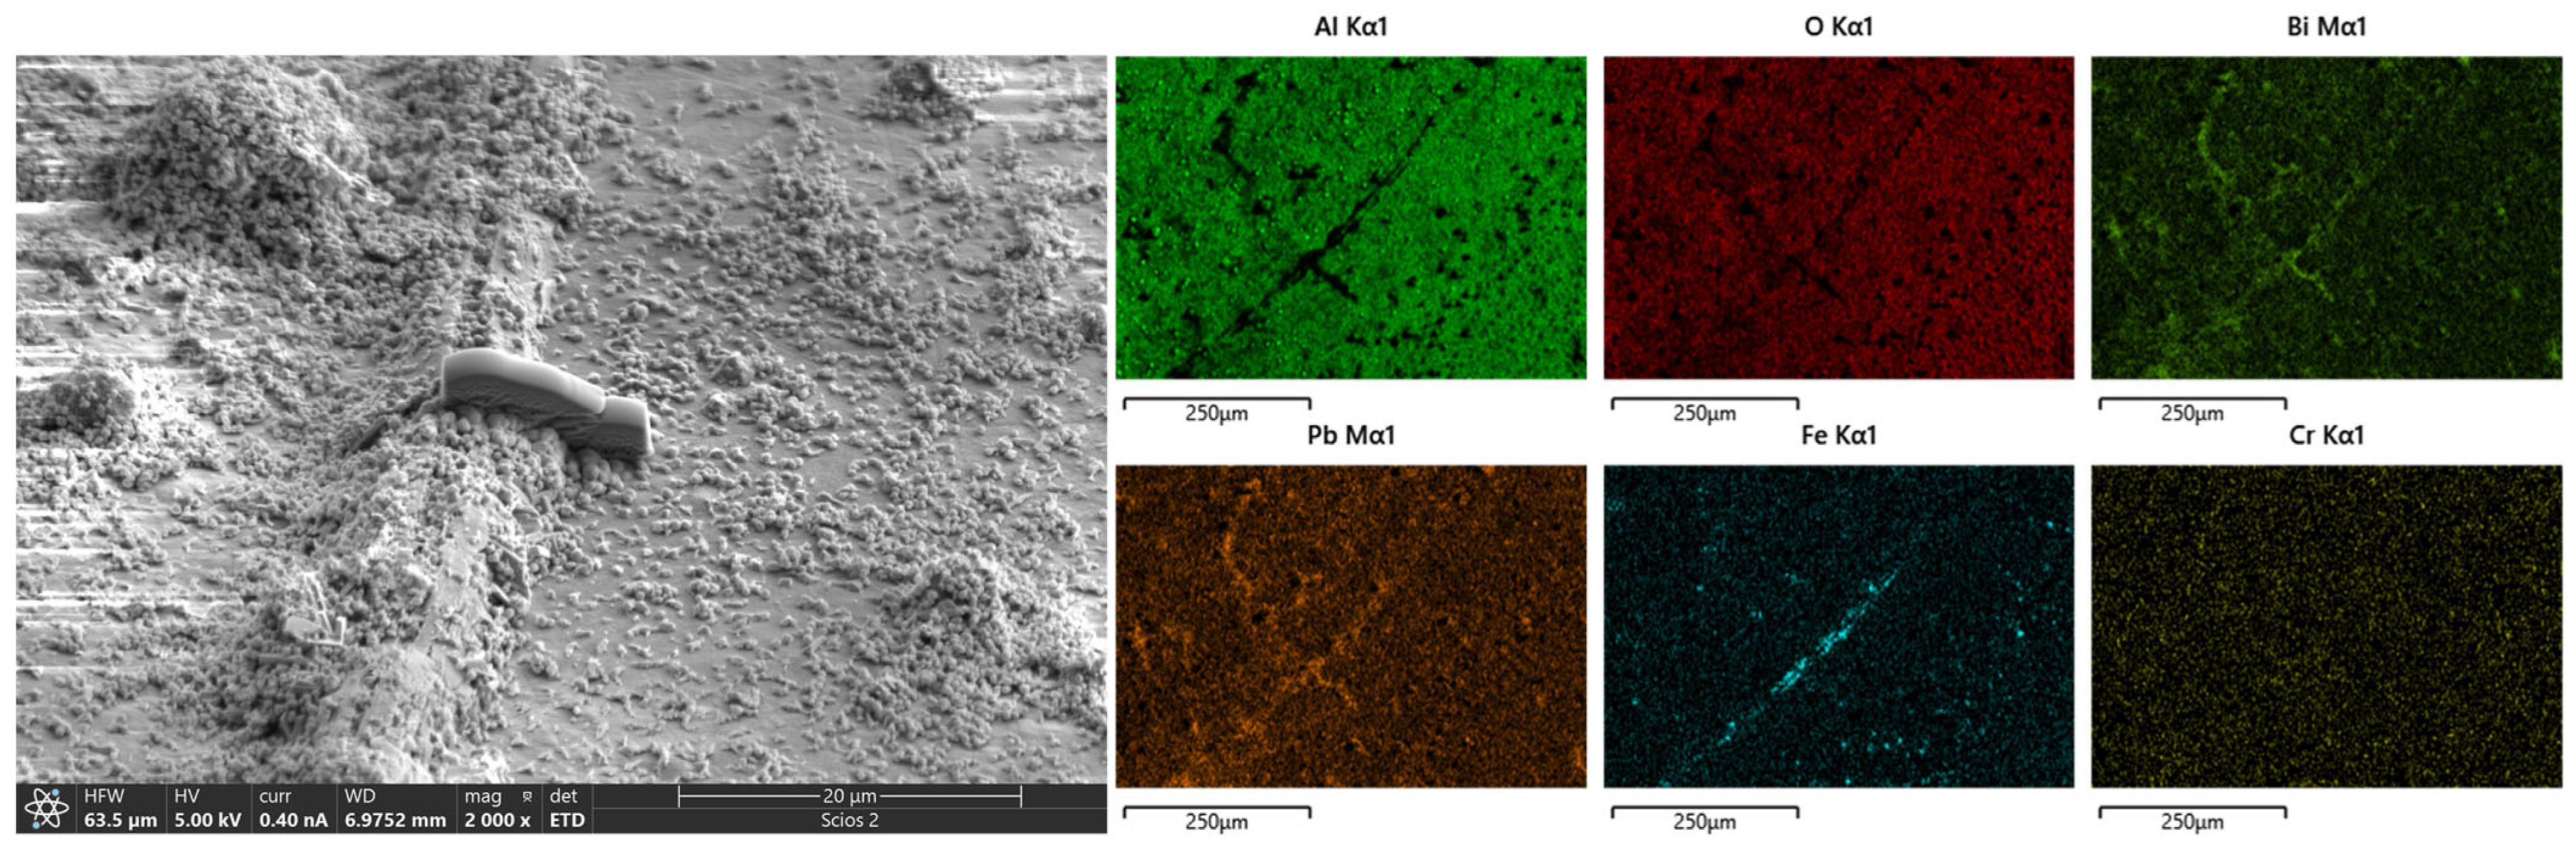
3.2. Morphology, Structure, Mechanical Properties after LBE Corrosion

Figure 4 shows the morphology and EDS mapping of Al2O3 coatings deposited at a bias voltage of −50 V after LBE corrosion at 450 °C, 550 °C, and 650 °C for 2000 h. Pitting corrosion has been observed as the main failure mode at different corrosion temperatures, which has four stages: Fe, O element diffusion, pit growth, pit merging. The SEM shows that the corrosion has been accelerated with increasing corrosion temperatures. At the corrosion temperature of 450 °C, the sample shows the structure integrity without cracks or spallation. With an increasing temperature, the coatings present typical pit corrosion with nodule shape. For 650 °C, the coating delaminated from the substrate with the pits reaching to the substrate. For high temperatures above 550 °C, the inward diffusion of O and outward diffusion of Fe accelerated greatly, and the formation of Fe3O4 with volume expansion in coating will induce the cracks. Therefore, increasing corrosion temperature is an effective way to reduce corrosion time.
For the samples deposited at a bias voltage of −100 V, the morphology of the coatings after the same corrosion conditions are shown in Figure 5. Similar to the sample (−50 V), it shows structure integrity without coating spallation after corrosion at 450 °C (Figure 5a). However, the samples show unchanged morphology without corrosion pits even after corrosion at 550 °C, as shown in Figure 5b, which is due to the dense structure under the higher bias voltage. Additionally, spallation of the coating at 650 °C was observed in Figure 5c. Under the higher bias voltage of −150 V, the morphology of samples is shown in Figure 6. Only the sample at 450 °C shows its structure integrity, and other samples peeled off from the substrate. Generally, a high bias voltage will induce high stress in the coating during the deposition, and stress induced cracking is a disaster for the coating during the service in high temperatures [34]. Moreover, the brittle nature of the Al2O3 coating should be mitigated in practical application. At a corrosion temperature of 450 °C, the surface iron (Fe) content reaches 4.1 at.%. However, when the corrosion temperature rises to 550 °C, the surface Fe content drops to only 1.6 at.%, despite the absence of coating failure caused by surface scratches. Interestingly, Fe enrichment has been observed within the scratches. Increasing the corrosion temperature to 650 °C leads to the formation of surface corrosion products consisting of Fe, Cr, and O. Concurrently, there is a phenomenon of oxide film detachment.
X-ray diffraction was used to evaluate the phase of the coating after LBE corrosion. At 450 °C, γ-Al2O3, Pb oxides, and ferritic (from the substrate) are the main phases for all samples deposited at different voltages. The sample phase composition at 550 °C is shown in Figure 7b. There was an increase in the crystallinity compared with Figure 7a. At 650 °C, no obvious Al2O3 peaks were detected on the samples except for some residual Pb oxides. The above results indicate that the Al2O3 coatings with amorphous structure will encounter a severe considerable challenge when service temperatures exceed 550 °C, which will be further investigated by TEM.
The XPS depth analysis of Al2O3 coatings after LBE corrosion at 550 °C for 2000 h are presented in Figure 8. Pb oxides can be found on the surface of all samples. Al oxides are the main phase in the surface of coatings with O/Al atomic rates of 4, 3, and 1.5 for HD50, HD100, and HD150, respectively. This value is composed of O atoms in Pb oxides. Figure 9 shows the nanoscratch morphology after LBE corrosion. No large spallation of the coating after nanoscratch has been observed from the surface morphology. Furthermore, the interface bonding strength has been enhanced to 100.7 mN due to the interdiffusion at the interface.

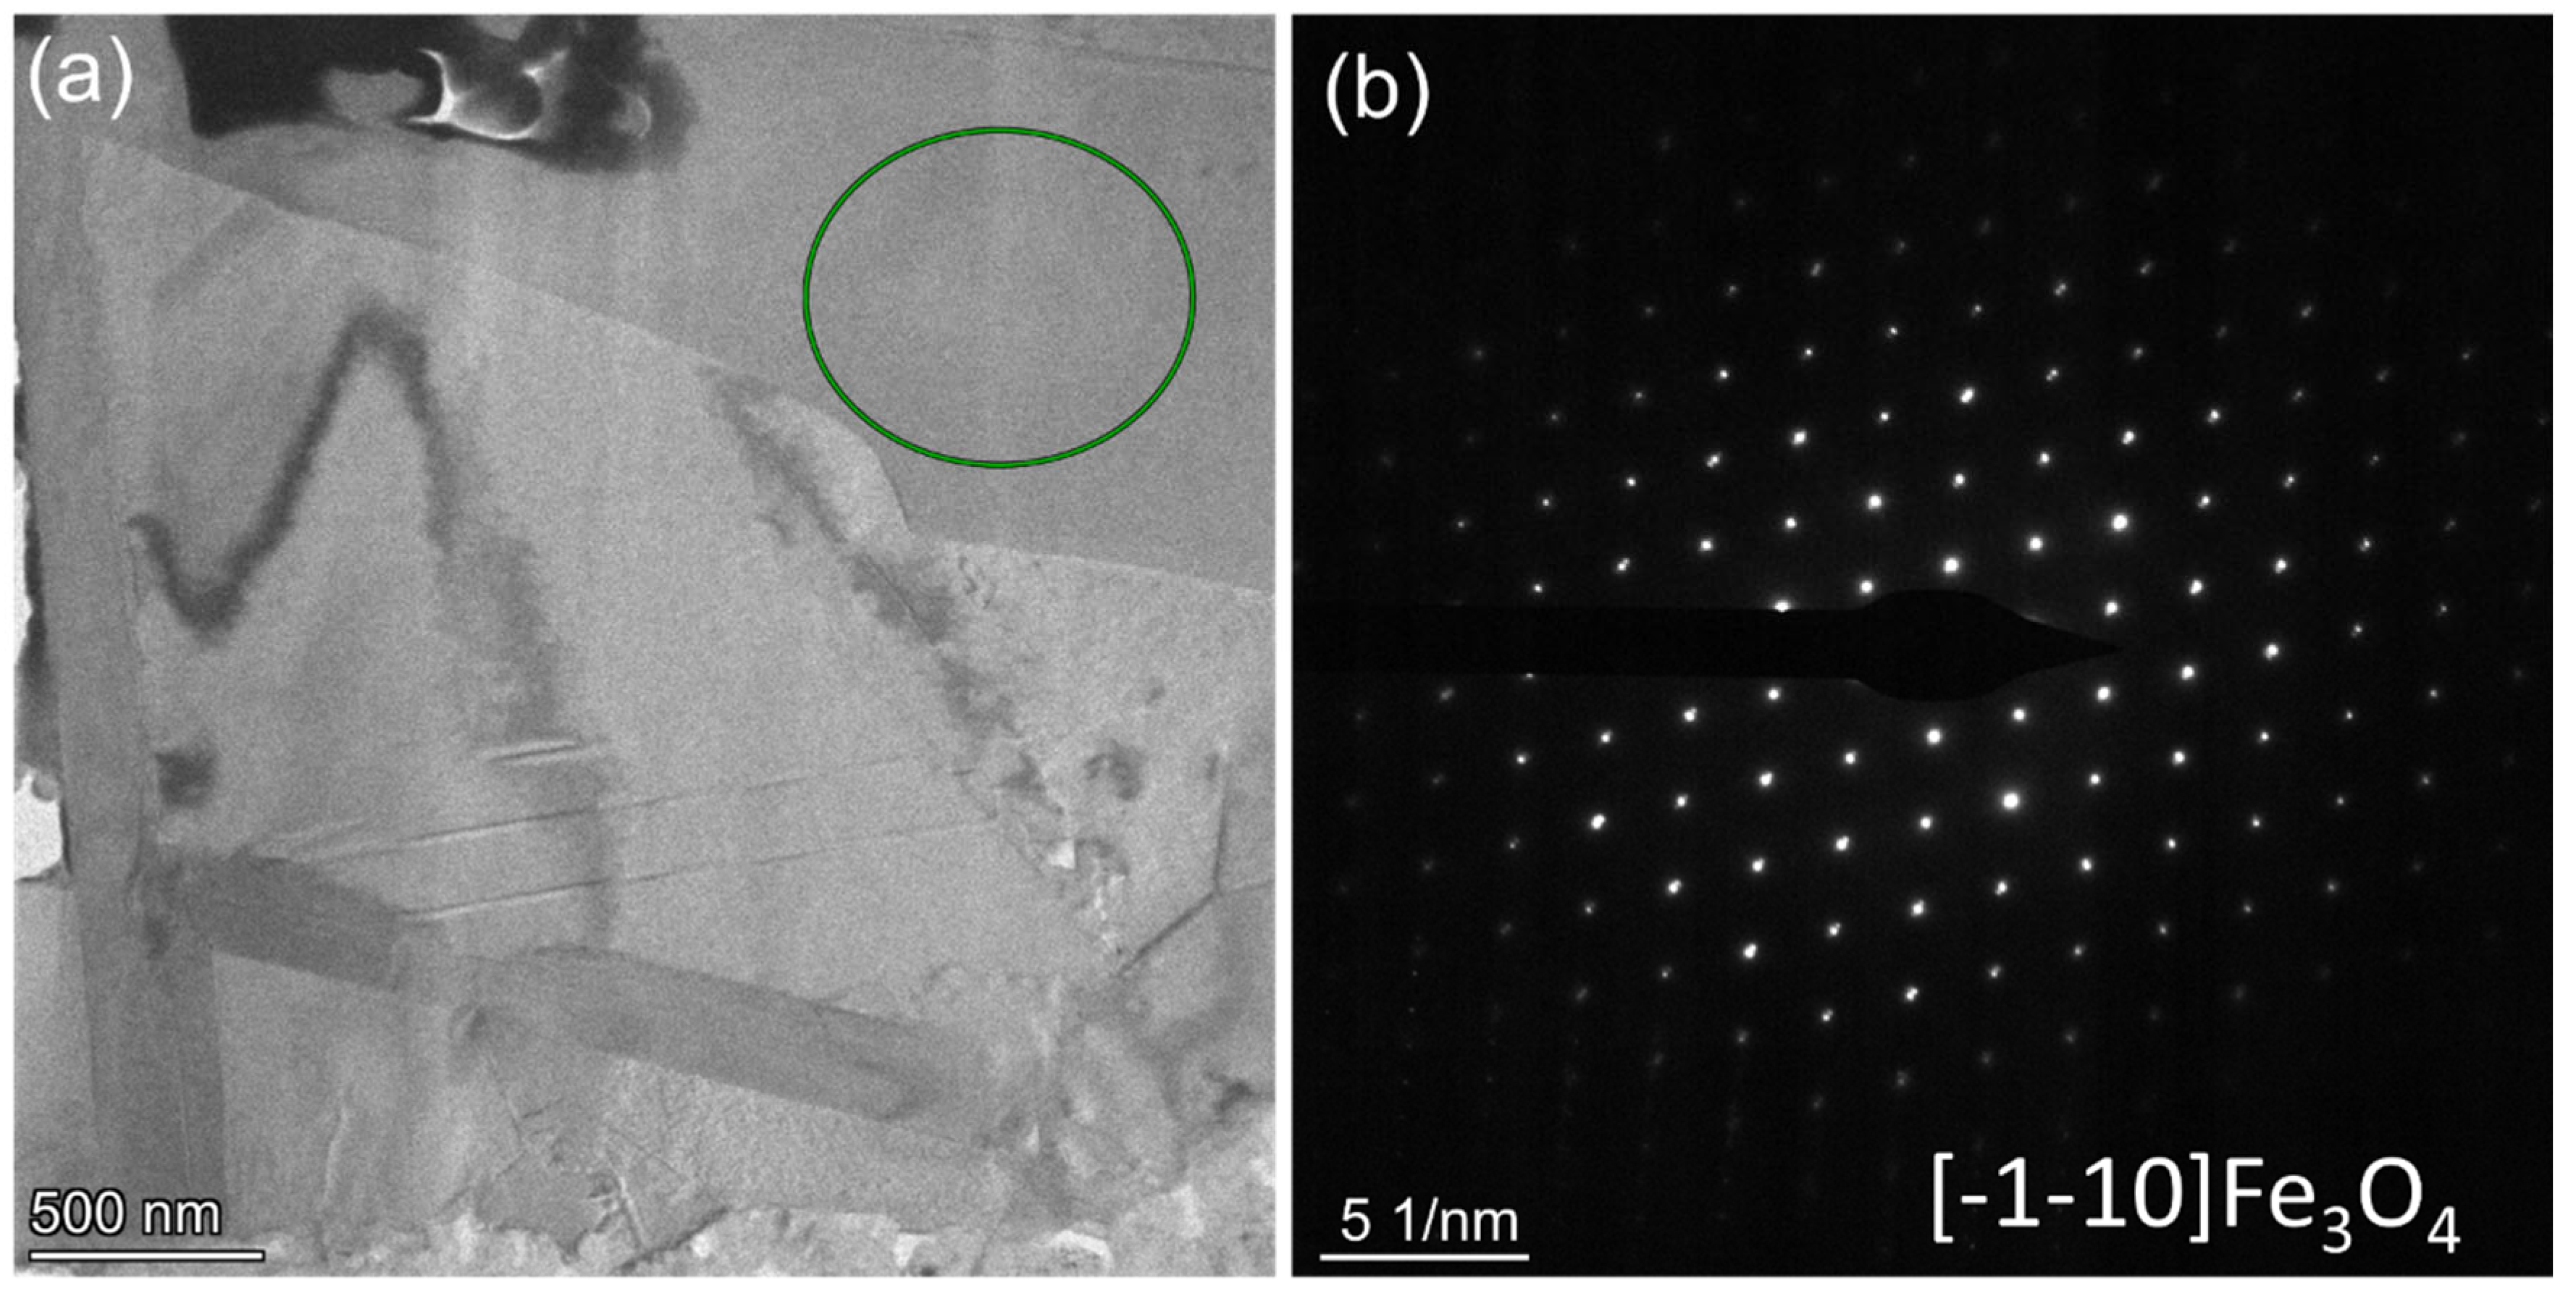
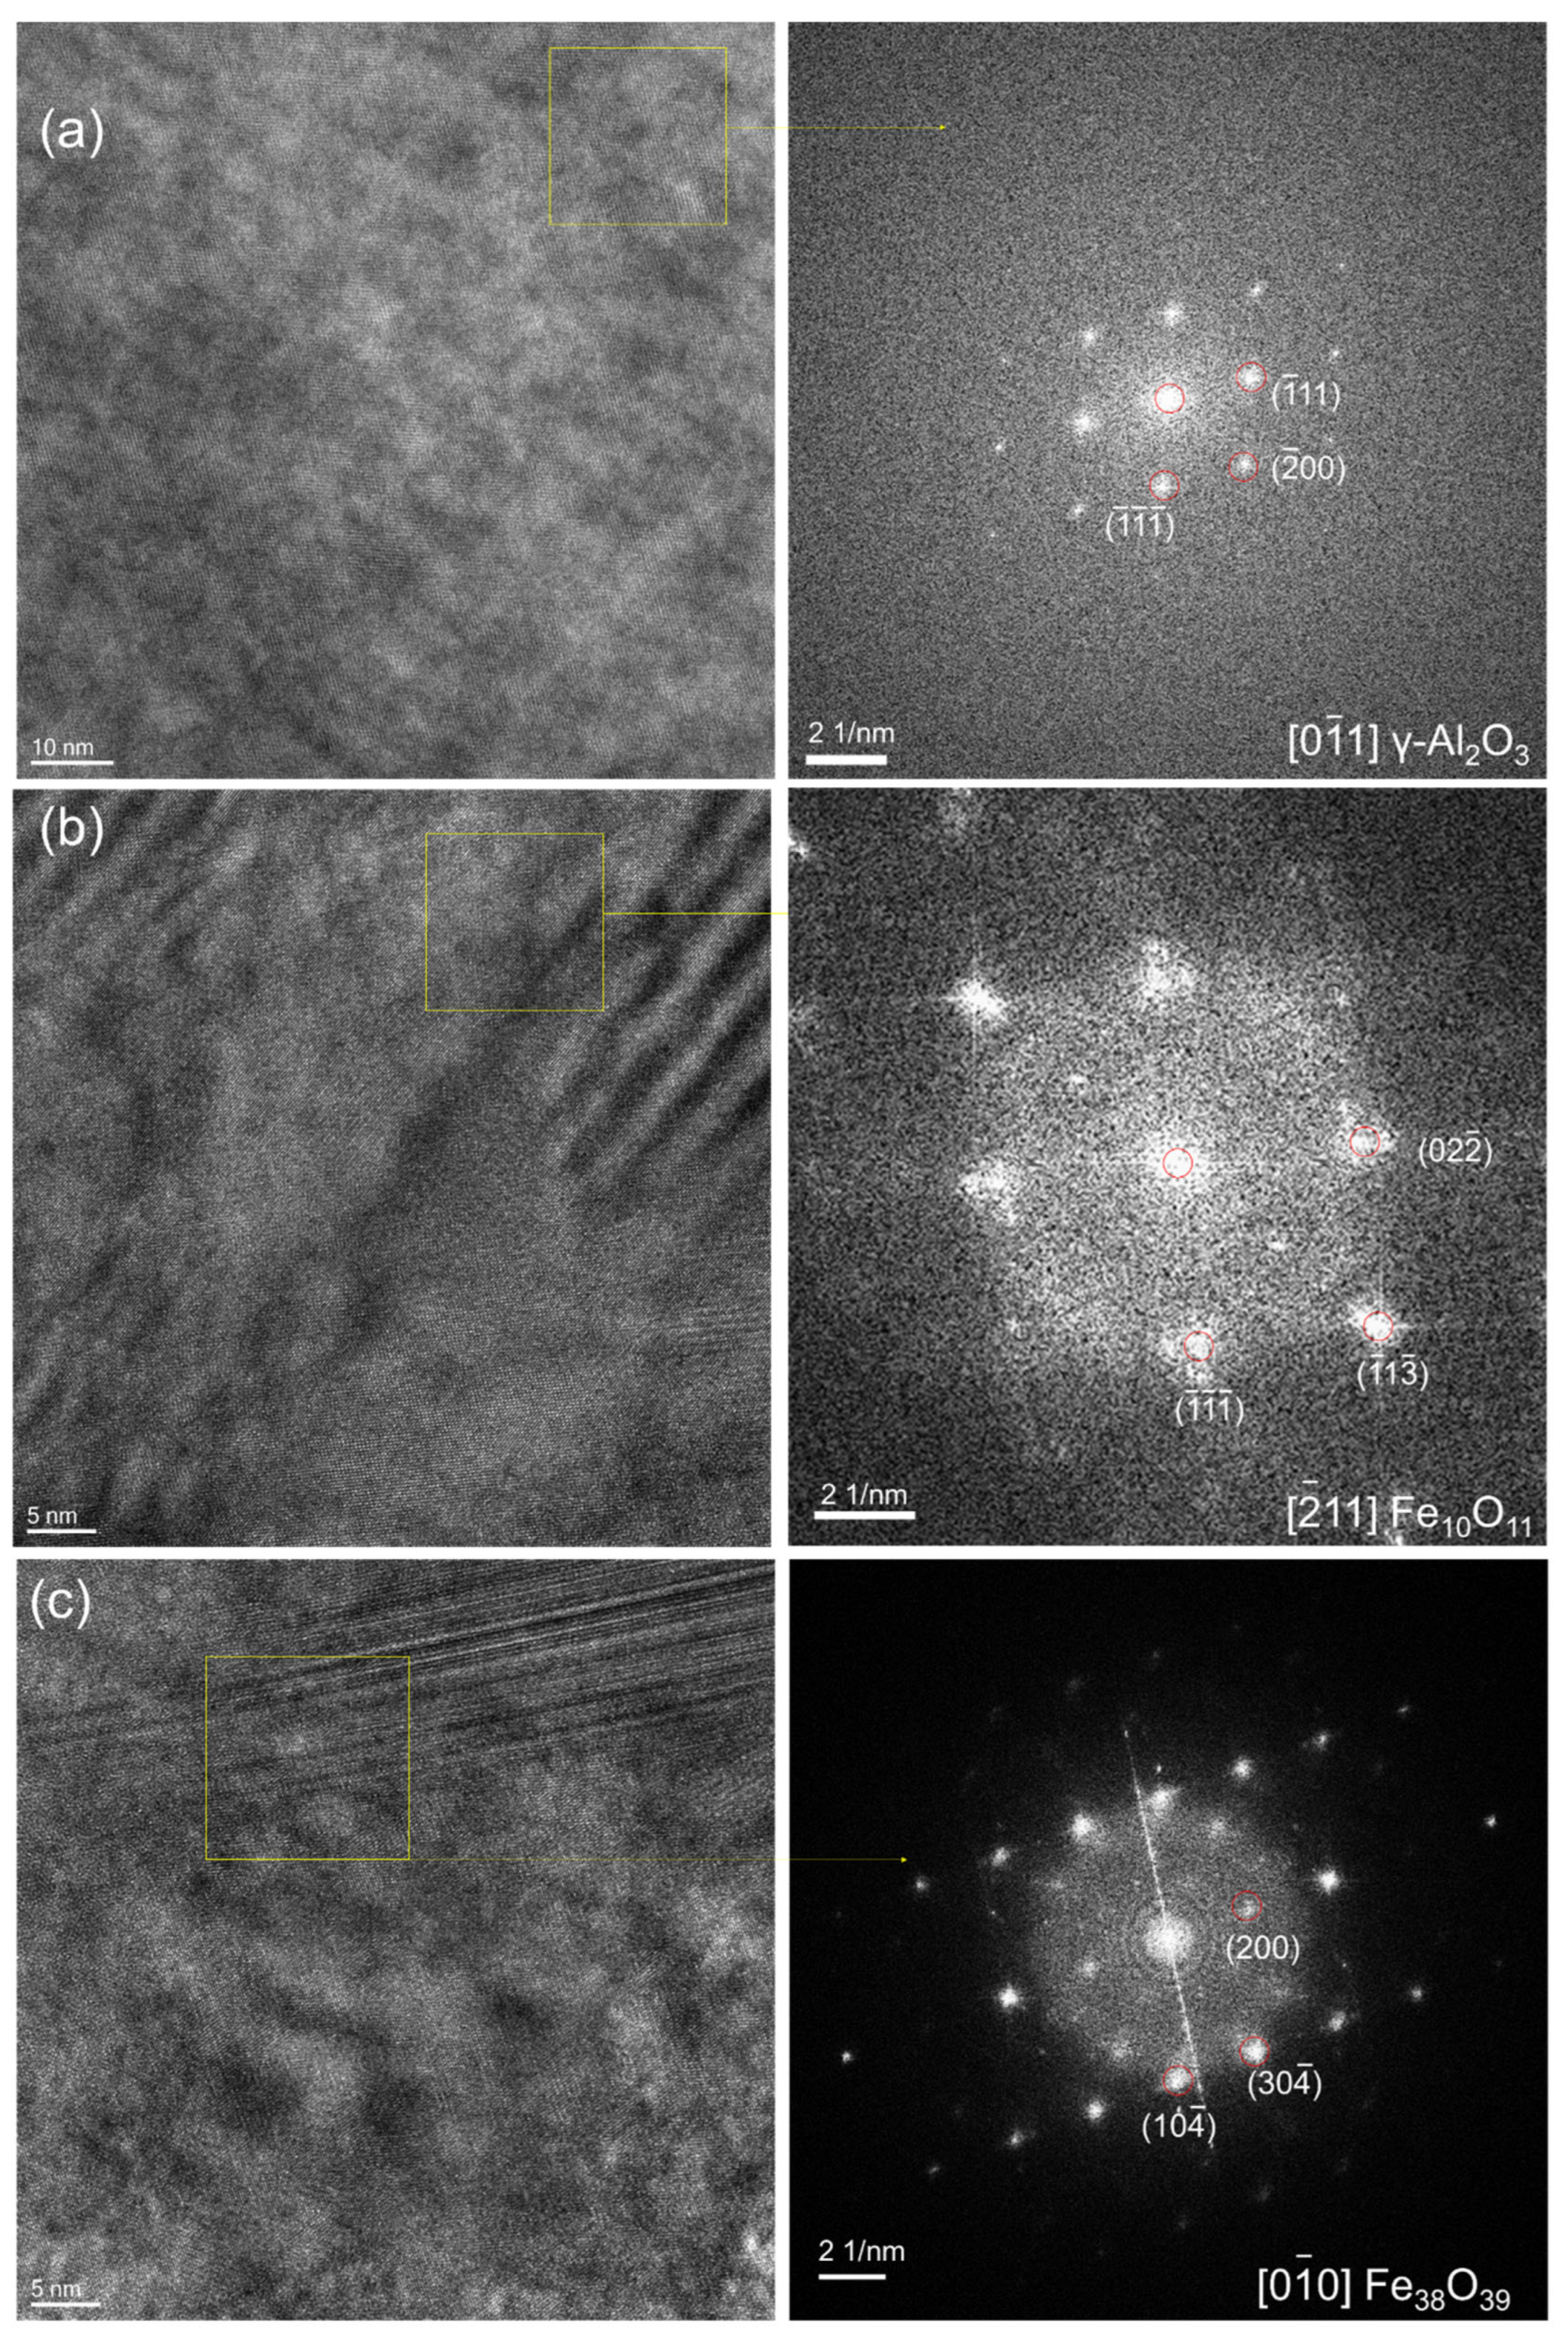
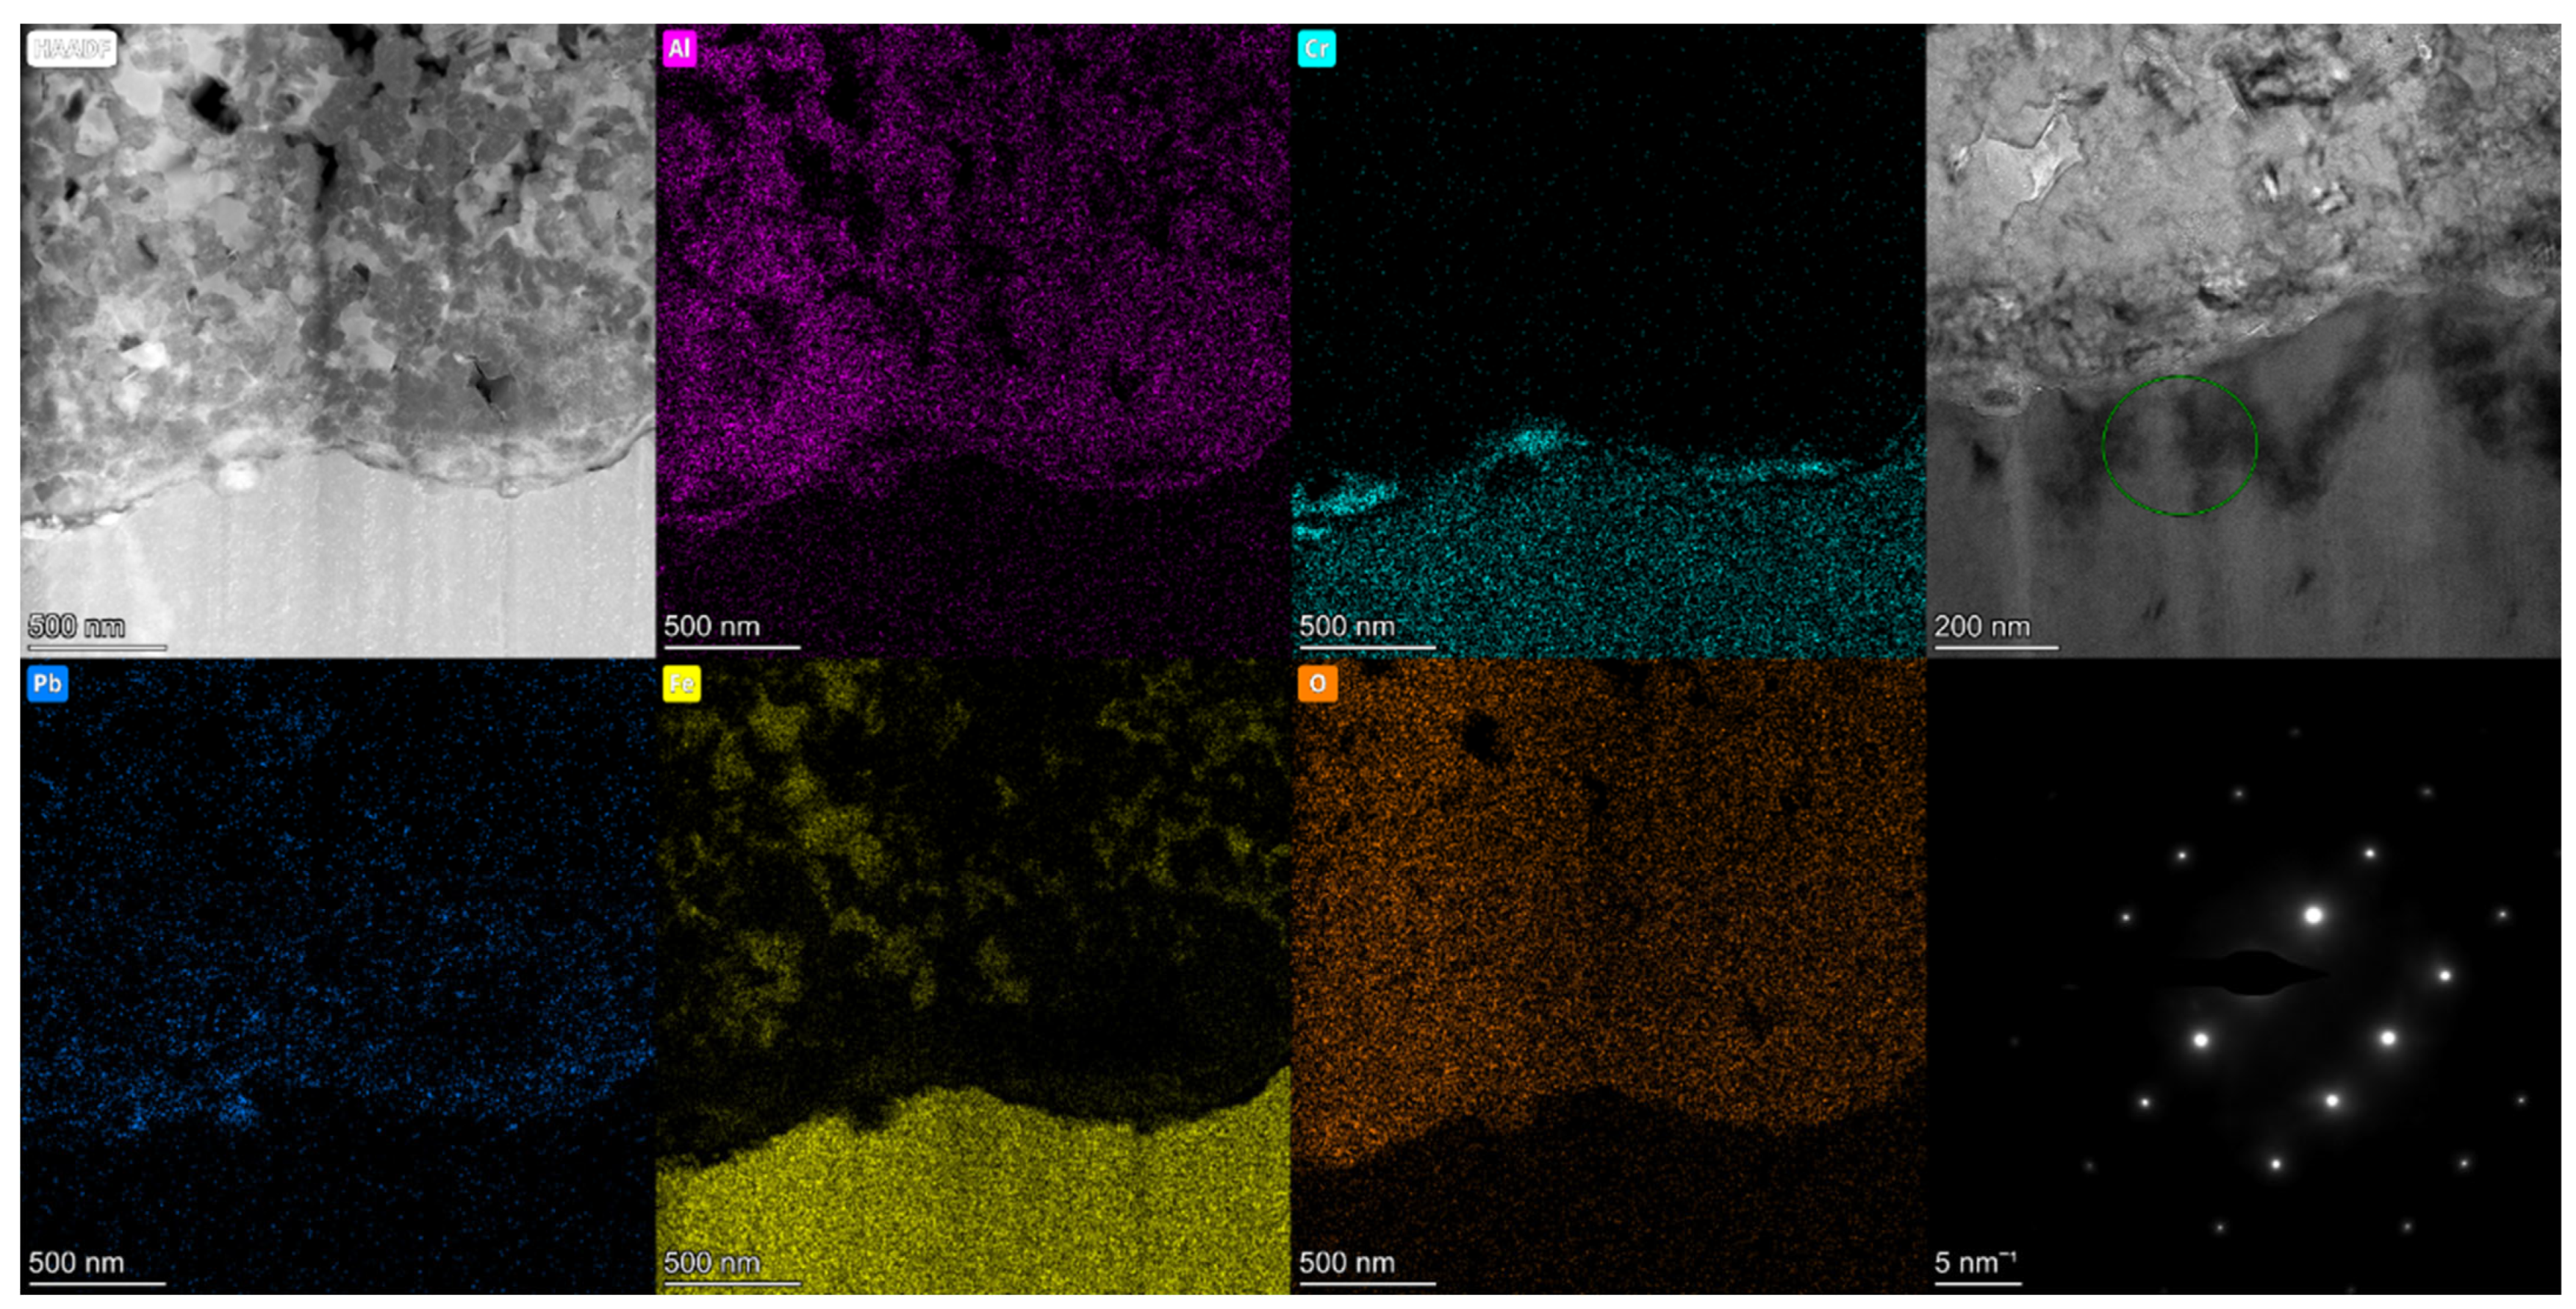
3.3. TEM Analysis of Corrosion Resistance of Al2O3 for 2000 h

The presence of Fe on the coating surface indicates the initiation of failure. A TEM sample (−150 V) with Fe on the surface was selected after corrosion at 550 °C for 2000 h. Volume expansion in the interest area is shown in Figure 10. Furthermore, an Fe-rich corrosion pit can be seen from the EDS mapping.
The microstructure of the Al2O3 coating after LBE corrosion at 550 °C for 2000 h is shown in Figure 11. After the corrosion process, the coating exhibits a distinctive three-layer structure, comprising a protective layer of tungsten (W), an Al2O3 layer, and the substrate. This layered arrangement is the result of the corrosion interaction between the coating and the corrosive environment. The Al2O3 layer, which is the primary coating material, provides additional protection and acts as a barrier against corrosive elements. Finally, the substrate forms the base layer, providing structural support to the coating system. This two-layer structure is crucial for maintaining the integrity and durability of the coated material. In contrast to the as-deposited coatings, the pole-free, dense structure changed to a dispersed particles structure filled with Pb and Bi oxides. More importantly, the thickness of the Al2O3 coatings increased to 1.94 μm, a 5% volume expansion compared to the original coating. When considering the corrosion products, the thickness of the coating is 4.86 μm, approximately 2.6 times that of the as-deposited coatings. Large Al particles with a diameter of 560 nm were observed in EDS Al mapping, which has a good consistency with XPS results (Figure 11). The microstructure of this sample can be divided into three layers: (i) surface corrosion layer, (ii) loose Al2O3 coatings, (iii) dense Al2O3 coatings, (iv) substrate. The detailed analysis of different layers has been shown as follows: The nature of the surrounding environment (LBE) plays a crucial role in SCC. Corrosive environments, such as high temperatures, the presence of corrosion pits, and the porous structure of Al2O3 coating, can promote SCC.
For the surface corrosion layer, high-angle annular dark field (HAADF) images from transmission electron microscopy (TEM) and corresponding EDS mapping are shown in Figure 12. The HAADF image has been known to be sensitive to atomic number (Z) in which a bright region corresponds to a higher Z that consists of Pb 7.1 at.%. According to the Ellingham diagram, Fe oxides and Pb oxides are predominant under sufficient O dissolute in LBE. Therefore, preventing O in LBE from contacting the substrate remains a challenge for the amorphous Al2O3 coatings. Furthermore, FCC Al particles are verified by the selective area electron diffraction (SAED) pattern with < 2 31> zone axis, as shown in Figure 13b. The clear lattice fringes can be found from the HRTEM, as shown in Figure 13c, where the d-spacing value is 0.229 nm, corresponding to (11 1 ) planes. Importantly, two large cracks formed in the coating; the right one stopped at the Al particles, indicating that ductile Al material is a desirable candidate to prevent crack propagation, although its melting point is 660 °C. No Pb signs were found in the inner Al particles due to the formation of an Al2O3 protective layer.
The high-resolution transmission electron microscopy (HRTEM) image and lattice image of the interest area in Figure 14a are shown in Figure 14b and 14c, respectively. The FFT pattern acquired from Figure 14b confirms the amorphous to cubic crystal ([1 1 2] γ-Al2O3) phase transformation. This phase transformation is accompanied by changes in density [35]. However, the whole sample exhibits a combination of a high proportion of amorphous and crystal in general, as shown in Figure 14e, in which the corresponding structure was verified via FFT, as shown in Figure 14g and 14f, respectively. The d-spacing of the κ-Al2O3 (1 2 1 ) plane is 0.139 nm, which matched the value reported previously [36].
The interface behavior between coatings and F/M steel is a major concern for long time service in reactors. The microstructure near the substructure is shown in Figure 15a in which no cracks or spallation were found. The coating retains its dense structure, although a little Pb reaches the substrate (Figure 11). The strong spots in the SAED pattern correspond to κ-Al2O3 with [2 1 3] zone axis (Figure 15b). A Cr-rich layer can be seen from the HRTEM, as shown in Figure 15c, which is further verified as an amorphous structure (Figure 15d). The substrate remains an unchanged α-Fe after LBE corrosion, indicating the protective function of the coating, lasting for 2000 h.

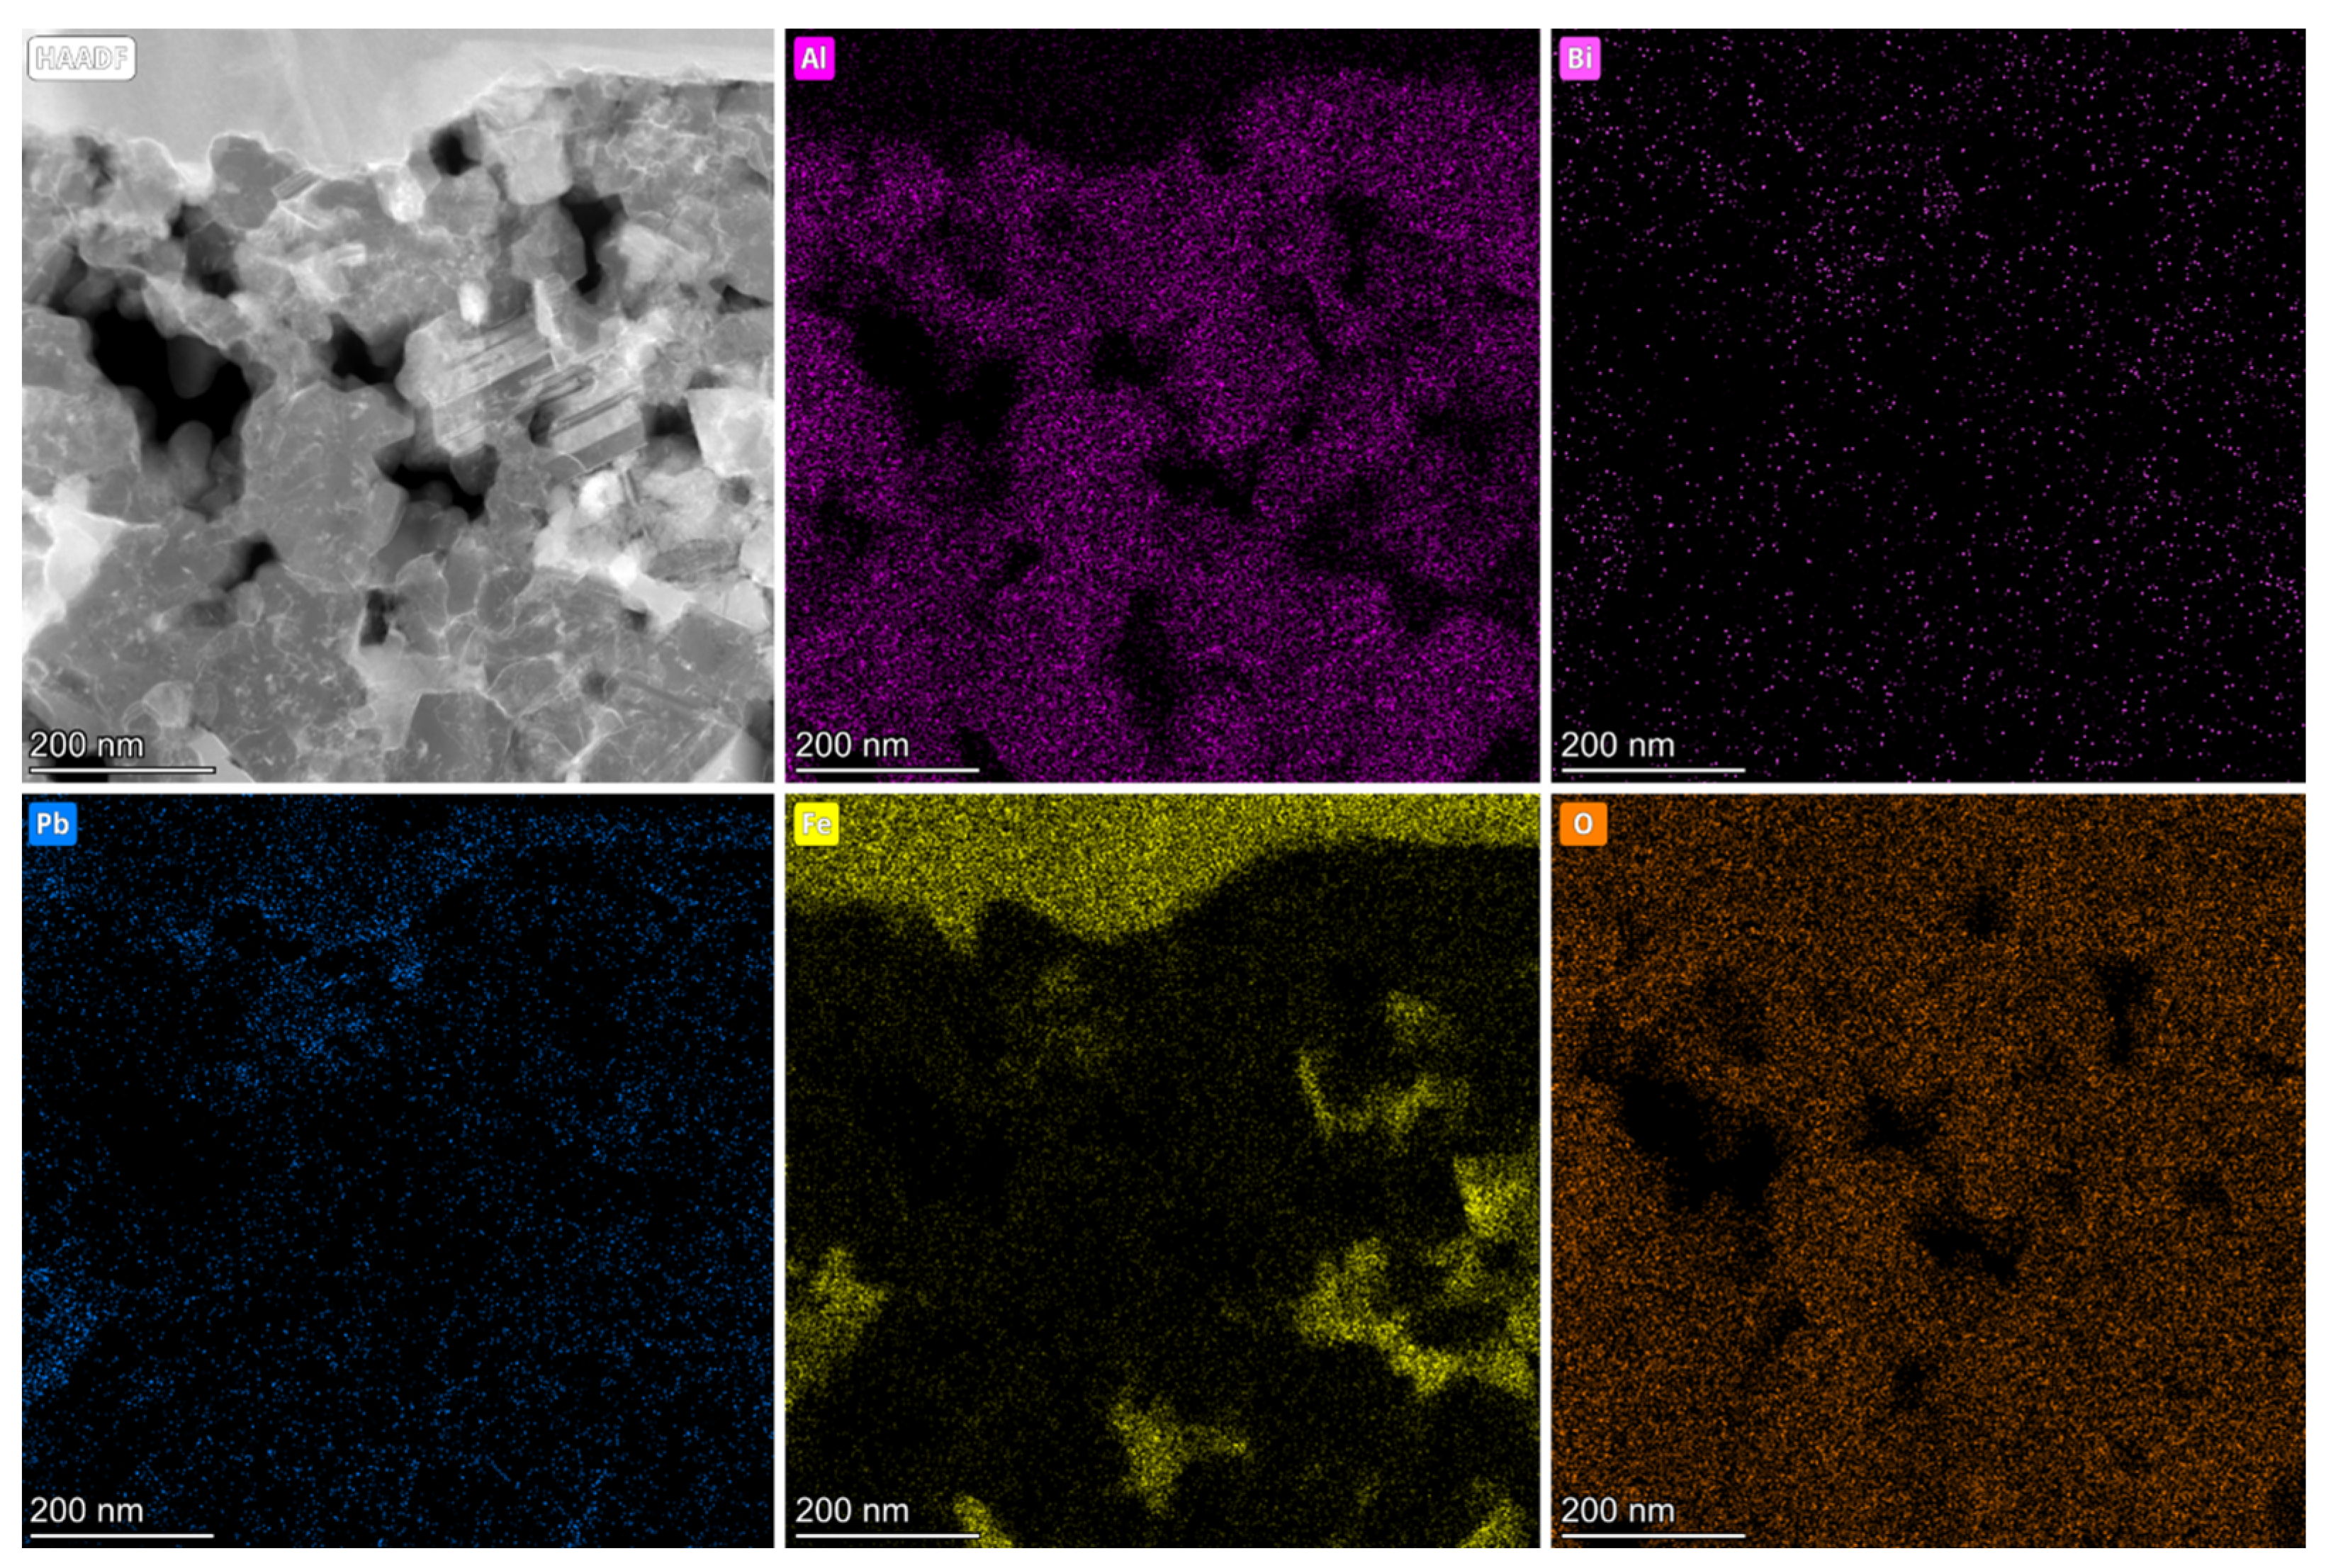
3.4. TEM Analysis of Al2O3 Coatings after LBE Corrosion for 4000 h

For the longer corrosion time of 4000 h, the surface morphology is shown in Figure 16a; mounts of particles were formed on the surface in which the interest area on a particle is shown in Figure 17b. A TEM sample for analyzing is shown in Figure 16c.
The microstructure and corresponding EDS mapping are shown in Figure 17. The composition of particles is Fe, O, and Pb with compact structure. Pb is concentrated in the cracks and surface of corrosion products. There is a sharp interface for preventing the Pb diffusion, and its enlarged EDS mapping is shown in Figure 17. The diffusion of Pb was prevented by Fe oxides, which shows dense structure. O mapping shows a uniform distribution, and Pb is concentrated on the upper region. The strong spots of the SAED pattern in Figure 18 were indexed as Fe3O4//[ 1 1 0].
The microstructure of the Al2O3 coating after exposure to LBE at 550 °C for 4000 is shown in Figure 19a. The total thickness of the Al2O3 coating is 1.63 μm, resulting in a 10% decrease in the thickness. The dispersed Al2O3 grains are filled with Fe oxides because of the amorphous to crystal phase transformation, accompanied by a shrinking in volume [37]. In order to verify this explanation, further HRTEM and corresponding FFT patterns are investigated at this layer, as shown in Figure 19. The main composition of the coating is Al and O, where the Fe oxides are distributed between the Al2O3 particles. The clear lattice fringes can be found in Figure 19a, and the spots in the FFT pattern were indexed as γ-Al2O3 with [0 1 1] zone axis. For the Fe-rich area, the FFT patterns showed two types of diffraction spots corresponding to triclinic (a = 6.81 Å, b = 6.89 Å, c = 10.67 Å) Fe10O11 (Figure 20c) and triclinic (a = 10.25 Å, b = 10.25 Å, c = 10.26 Å) Fe38O39 (Figure 20c).
Figure 21 depicts the microstructure and corresponding EDS mapping at the interface between the coatings and substrate. Similar to Figure 13, no spallation or cracks are observed at the interface. The diffusion of Pb is halted at the interface, and no signs of Pb are detected in the substrate. However, Fe oxides are distributed throughout the entire coating. The periodic diffraction spots originating from the substrate have been identified as α-Fe, indicating that the substructure’s structure remains unchanged after 4000 h of LBE corrosion.

4. Discussion

From the above results, the complicated LBE corrosion process is composed of element diffusion, phase transformation, and chemical reaction. Here, an Ellingham diagram is introduced to understand the formation of a compound in LBE, which is defined as the standard Gibbs energy change (ΔG) of formation of corrosion products when consuming one mole O2 (Figure 22). For the Al2O3 coating, ΔG exhibits the maximum negative value, −945.4 kJ/mol, demonstrating the most thermal stability in LBE. Therefore, Al2O3 was chosen as the protective material facing high temperature LBE. LBE corrosion includes three stages: (a) The initial stage where the coating keeps its structure integrity with amorphous (Figure 22a); (b) when the corrosion time increases, the phase transformation from amorphous to γ-occurred, accompanied by an incensement in density, and thus, the volume reduction of Al2O3 particles. Therefore, the nanocavities between particles merged with each other, and the complete diffusion path was formed, as shown in Figure 22b, in which Fe began to dissolve in LBE. (c) When the chemical reaction between Fe, Pb, and O occurred at the nanocavities, the volume expansion of corrosion products Fe3O4 and PbO2 will induce stress on the adjacent Al2O3 coating (Figure 22c). On the other hand, the element of Fe and Cr will diffuse to the coating. The coating will be peeled off as the corrosion time increases. Overall, the growth of the Al2O3 coating filled with corrosion products is limited by element diffusion. Furthermore, the whole corrosion process can be presented as the variation of film thickness with the corrosion time (Figure 23) [38,39,40]. During the lead-bismuth corrosion process, a high temperature of 550 °C can induce phase transformation in amorphous alumina coatings. This phase transformation is accompanied by a volume shrinkage, which in turn leads to the development of cracks within the coating. The presence of cracks provides pathways for the diffusion of PbFeO, which undergoes oxidation reactions. This diffusion of PbFeO along the cracks contributes to stress concentration within the coating, accelerating the formation and propagation of cracks (as shown in Figure 11, Figure 13 and Figure 14). Ultimately, these factors contribute to the failure of the coating system. It is important to address these issues in order to improve the corrosion resistance and durability of the coatings under such high-temperature environments.

5. Conclusions

The present study offers a comprehensive analysis of the corrosion behavior of Al2O3 coatings deposited via reactive sputtering with a fast deposition rate. Despite the brittle nature of Al2O3 coatings making them susceptible to temperature fluctuations, the coatings exhibited exceptional corrosion resistance to LBE at temperatures up to 550 °C for 2000 h. However, beyond 550 °C, phase transformation and the diffusion of O and Fe become critical factors leading to coating failure. Based on the findings of this study, the following conclusions can be drawn:
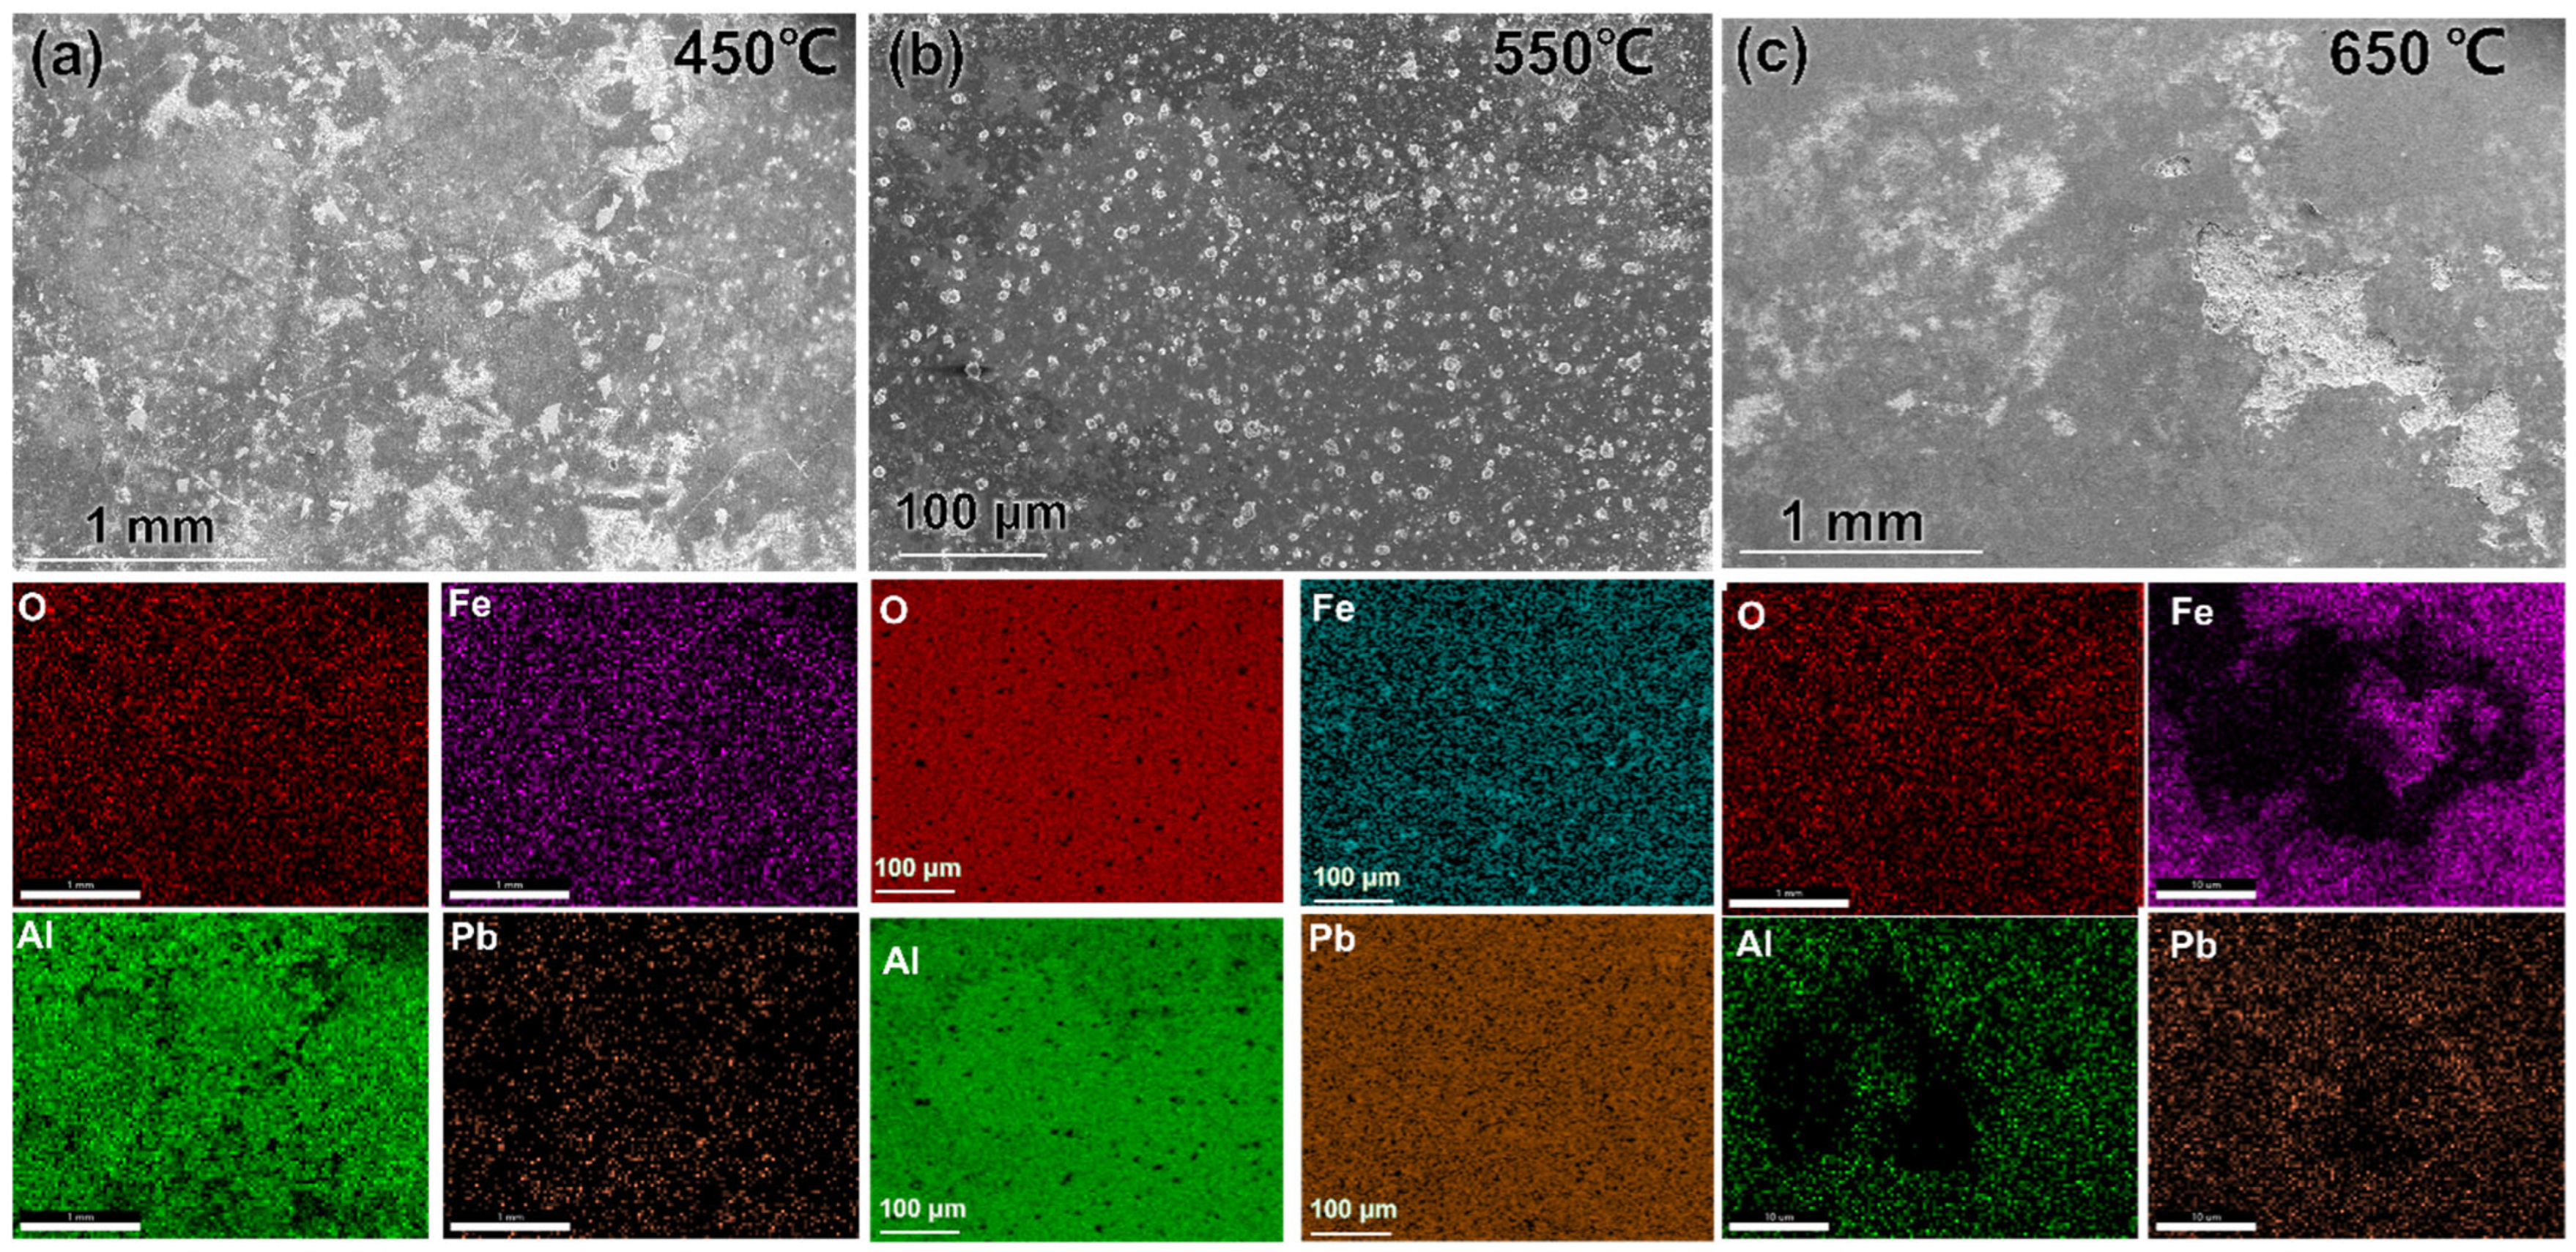
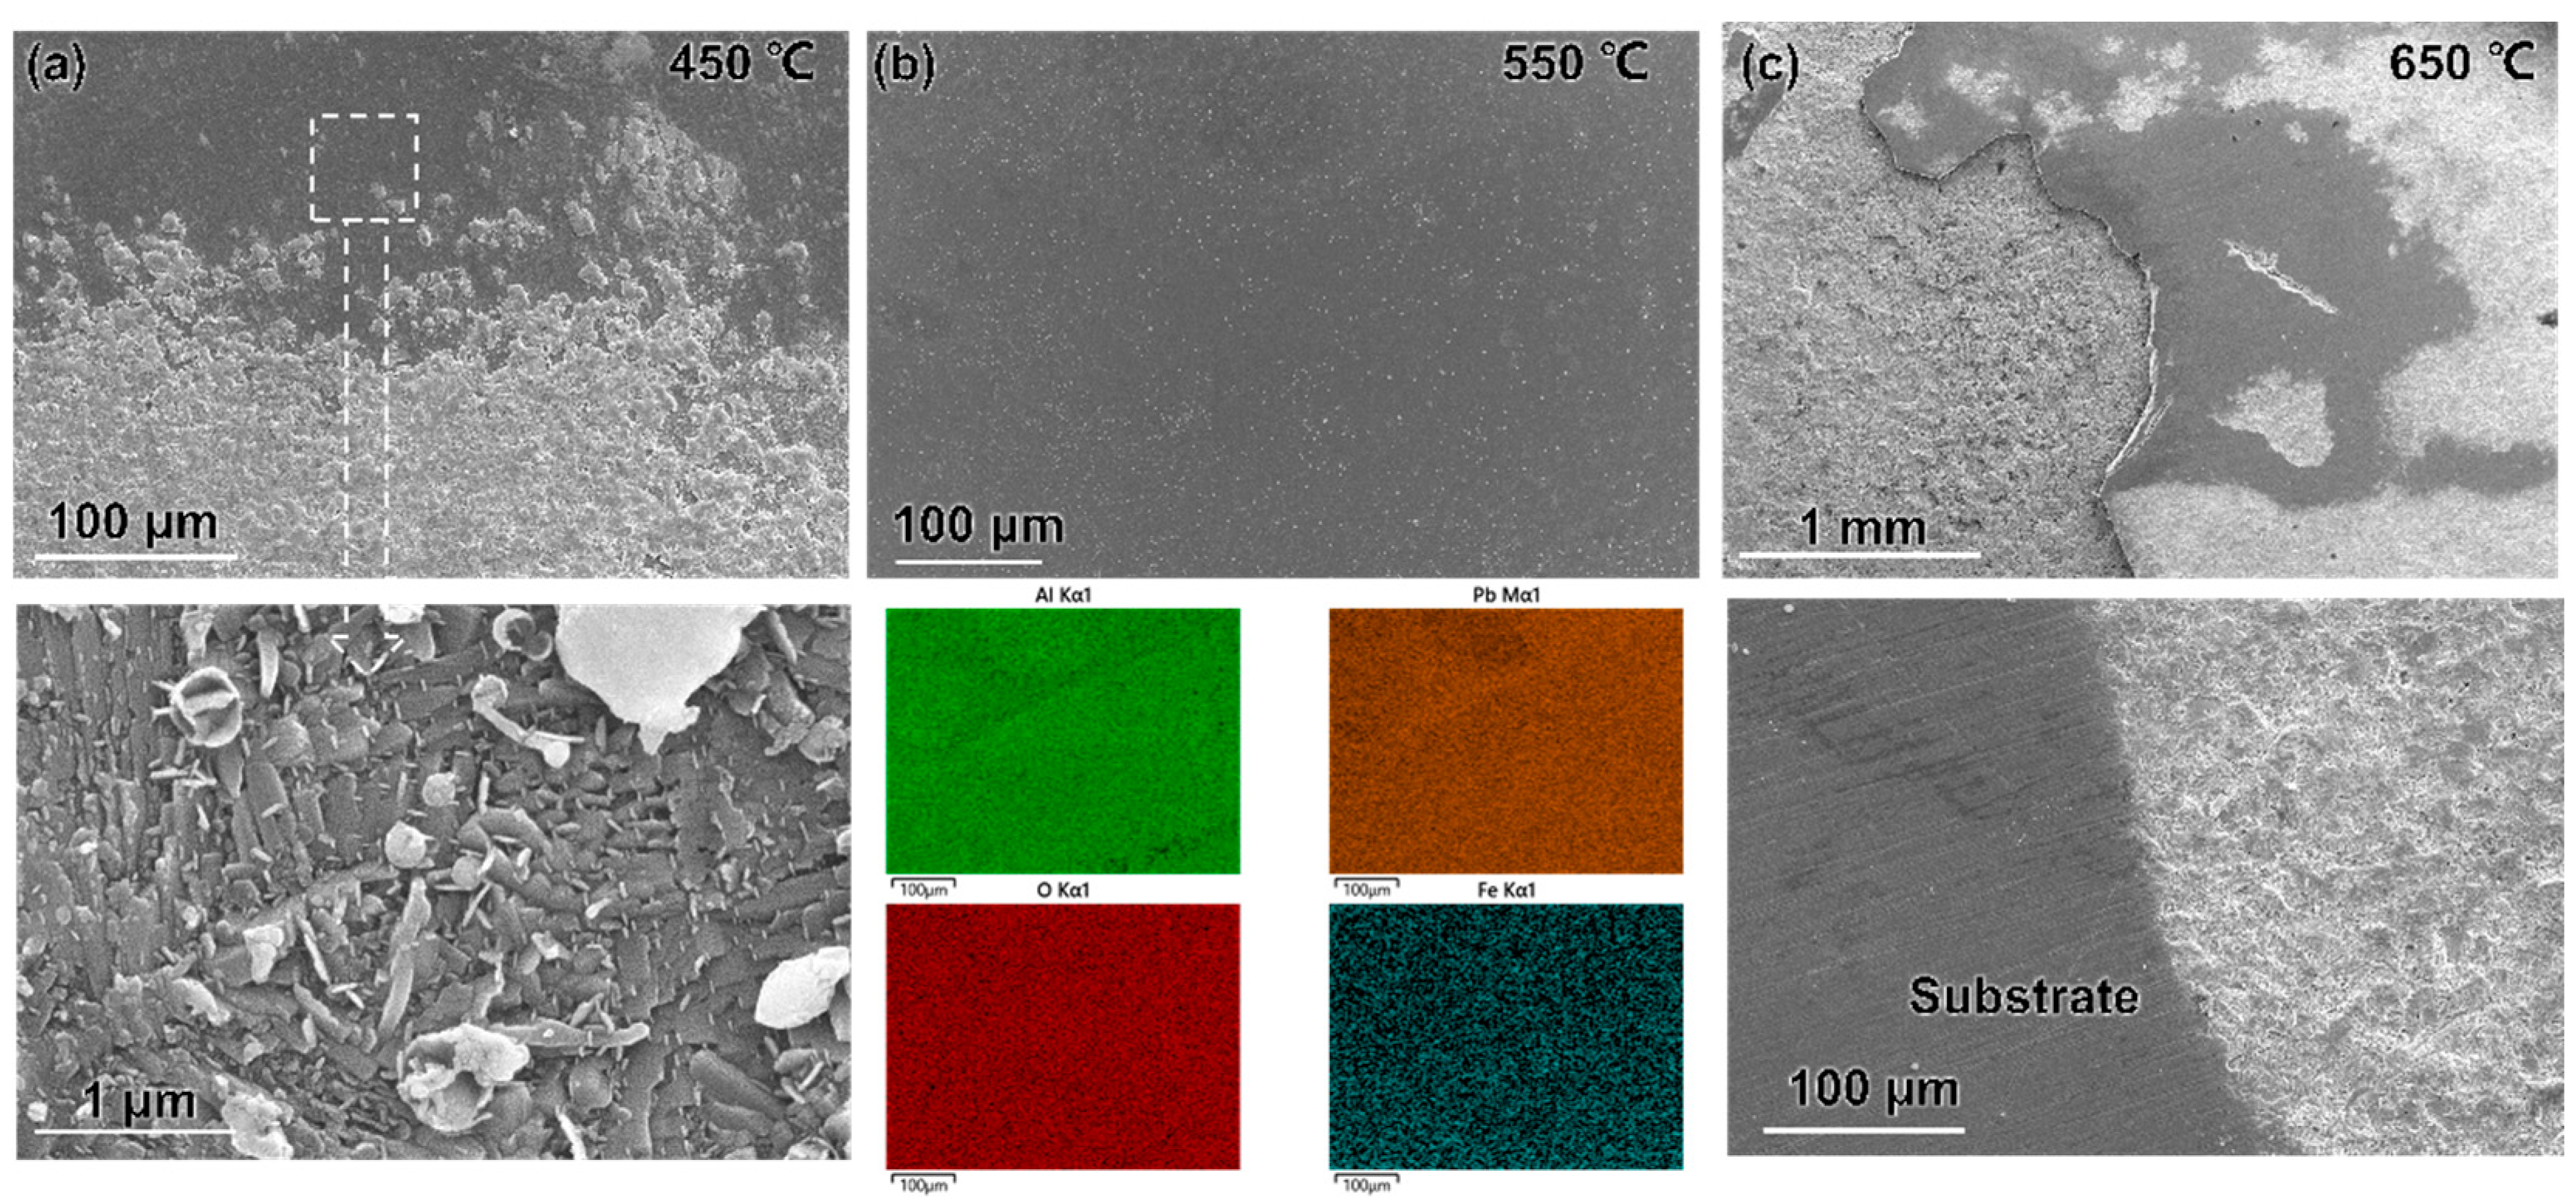
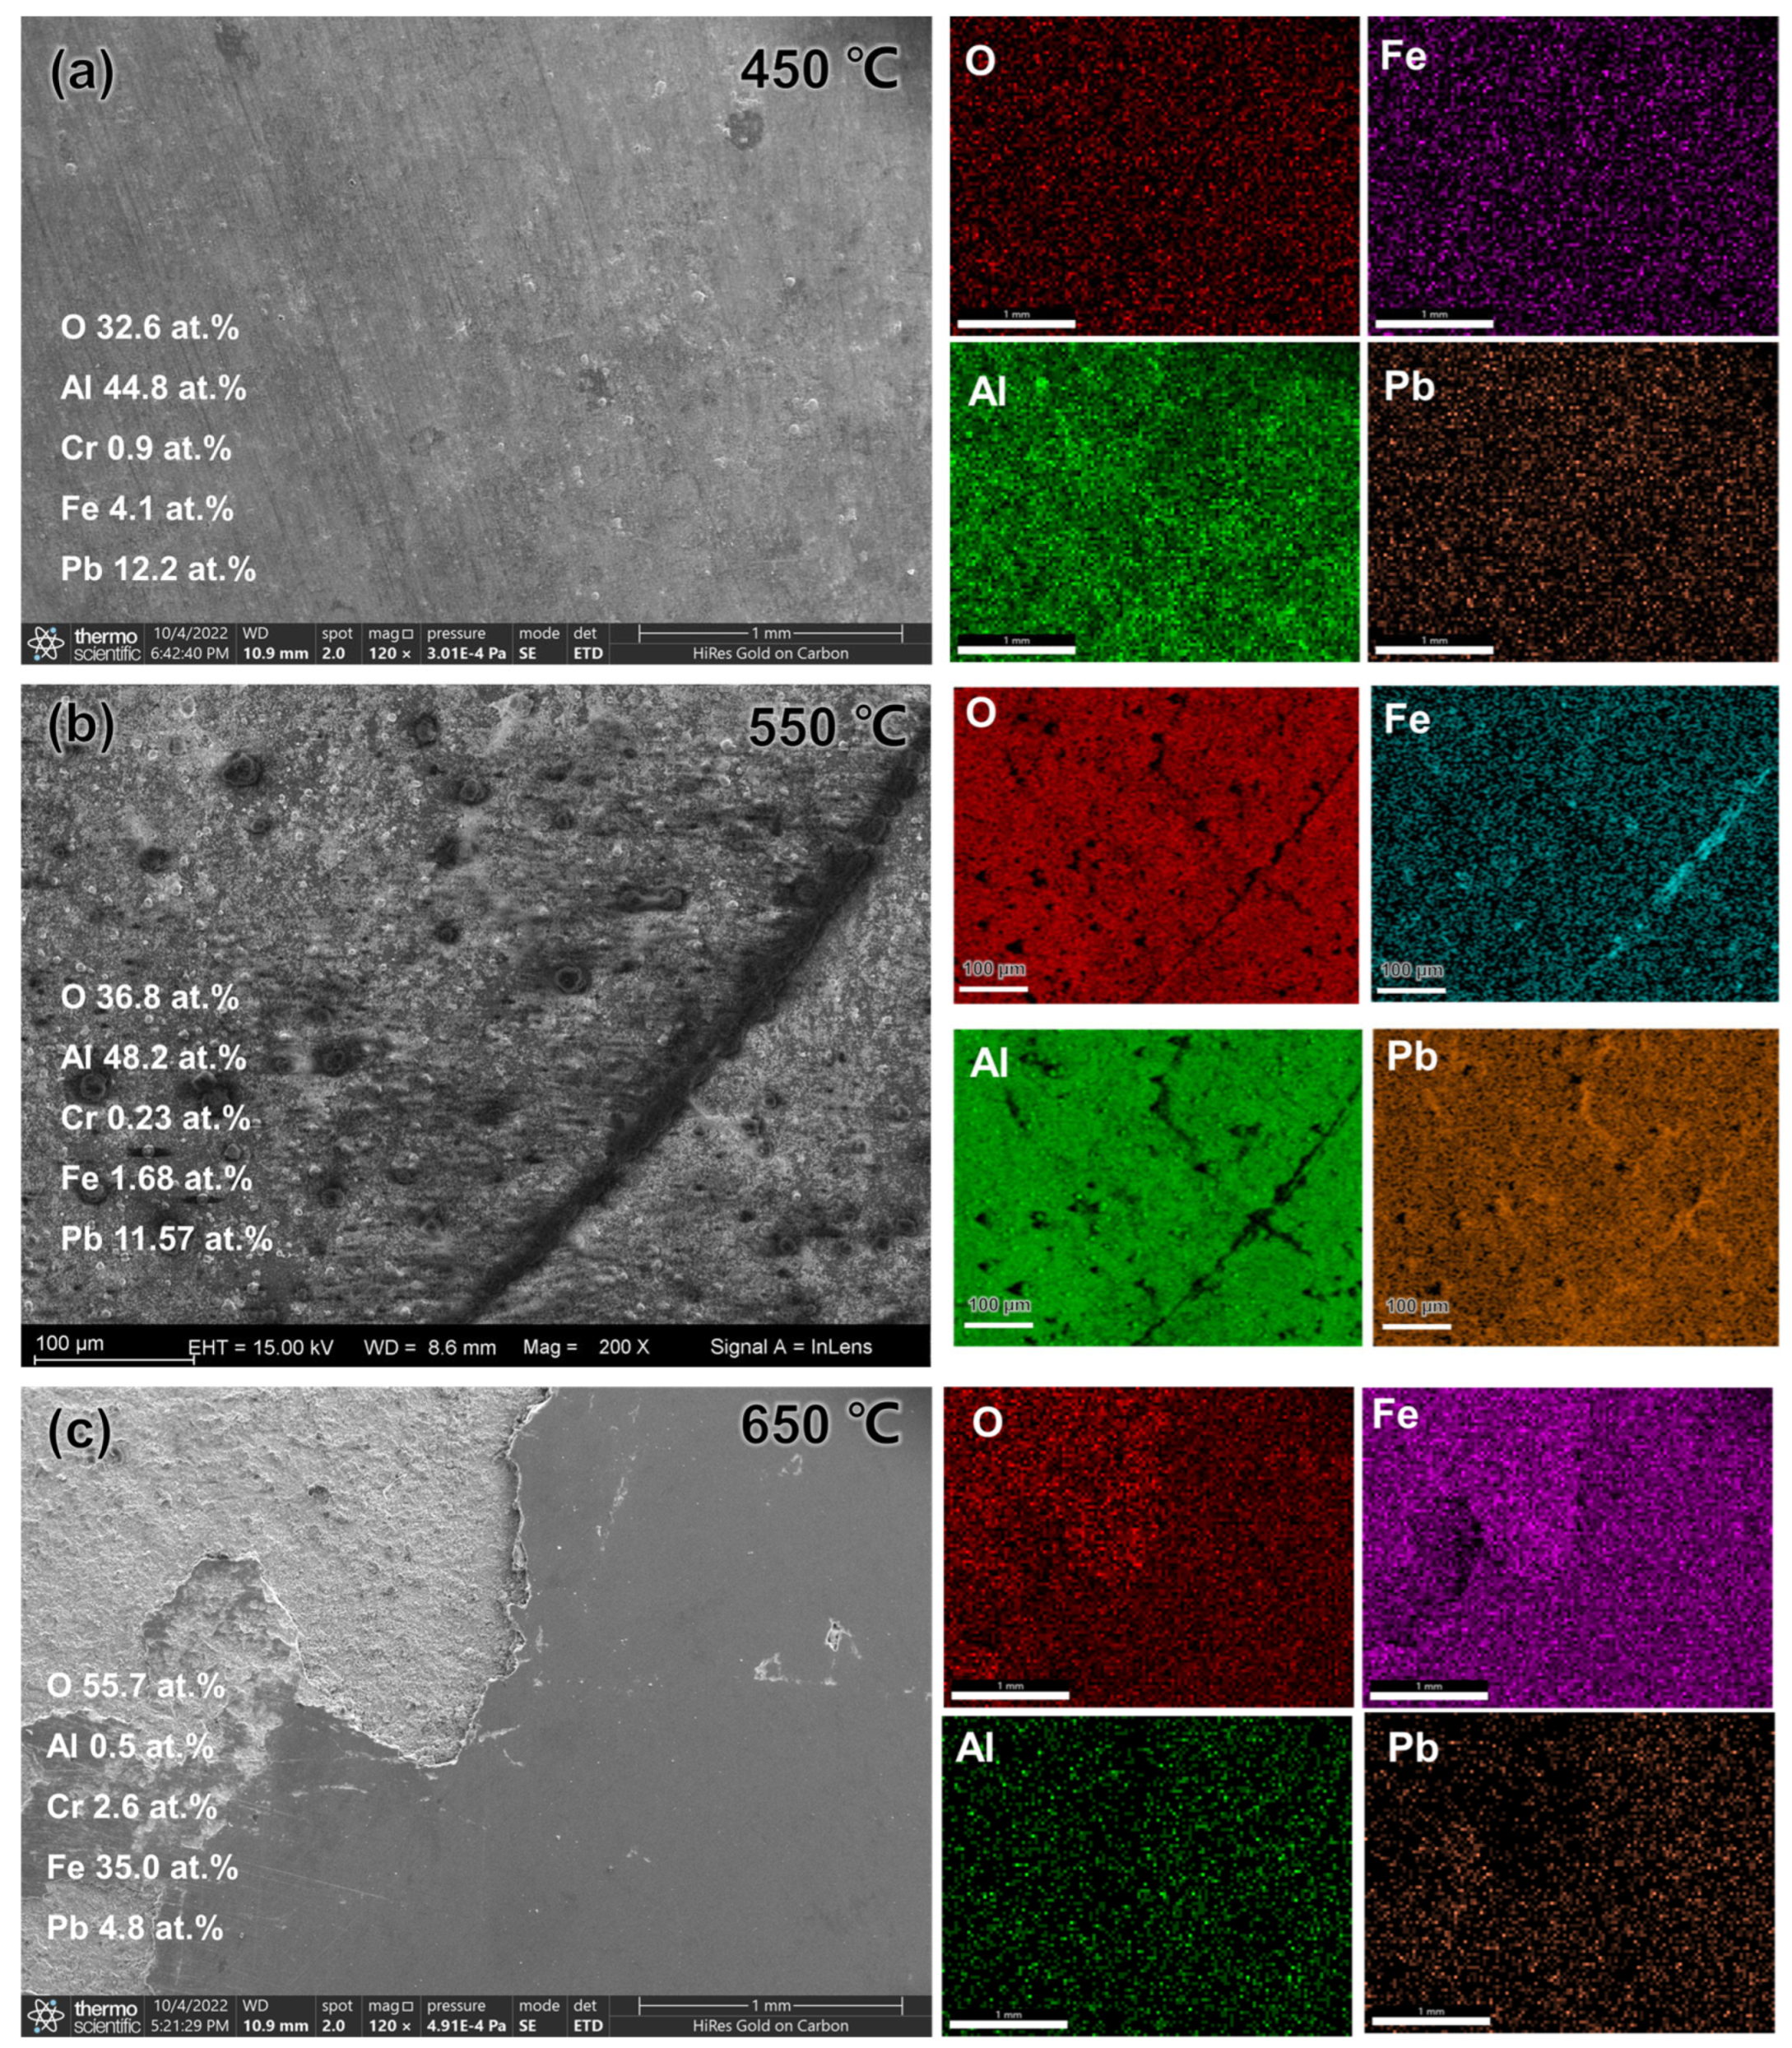
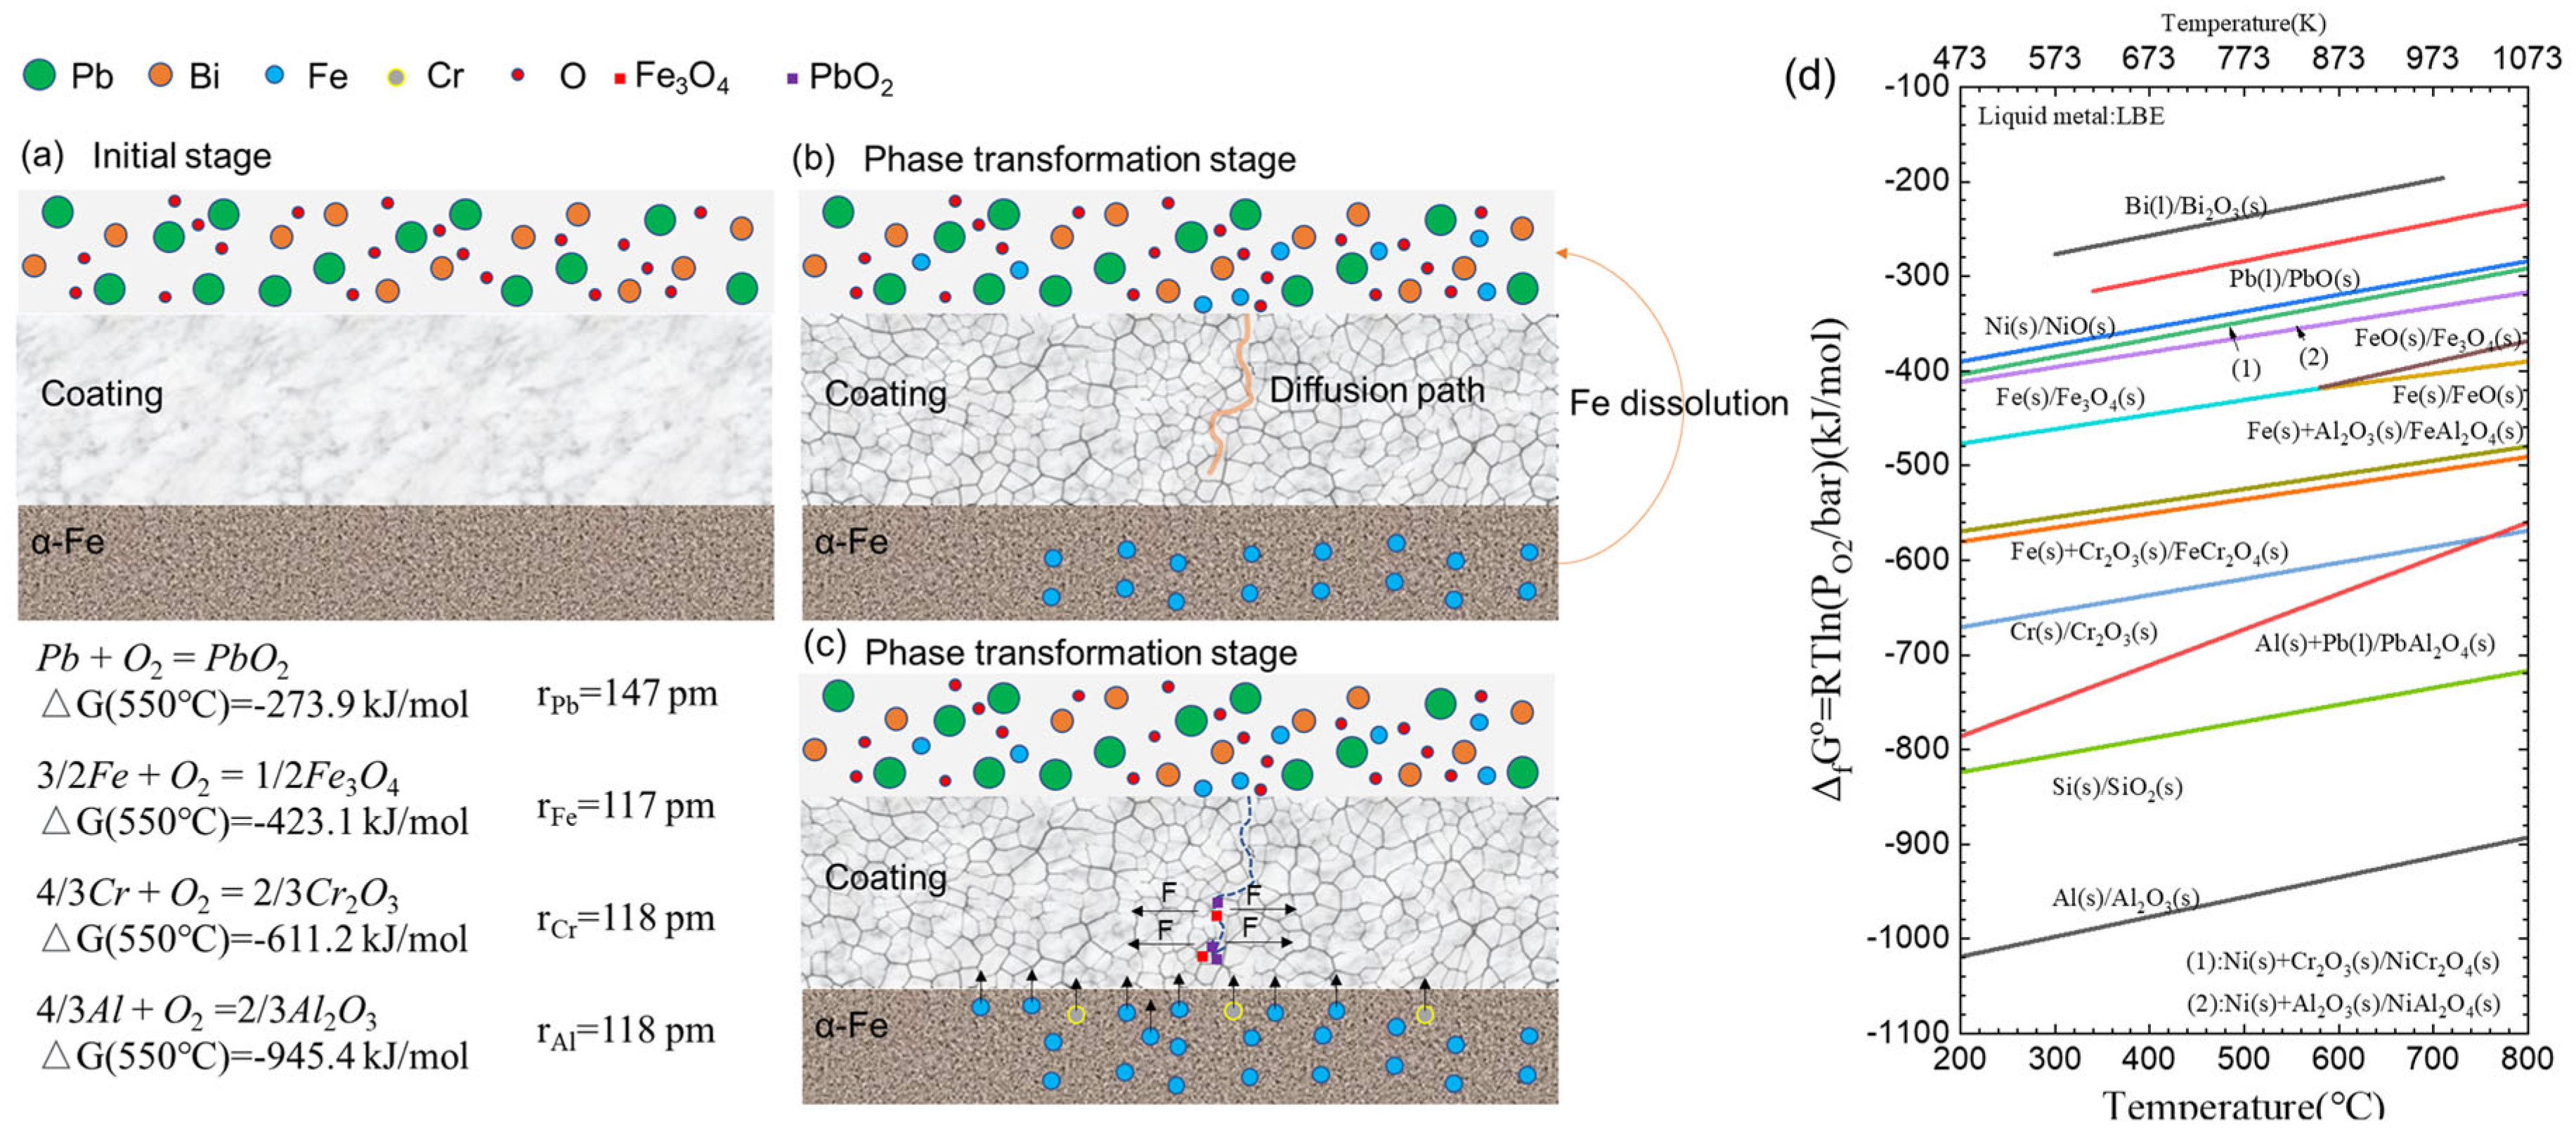
  • Amorphous Al2O3 coatings with an ultra-dense structure were successfully deposited at bias voltages of −50 V, −100 V, and 150 V. As the temperature increased from 450 to 650 °C, the coatings experienced severe LBE corrosion, resulting in the formation of nodule-shaped corrosion products during the initial stage of corrosion.
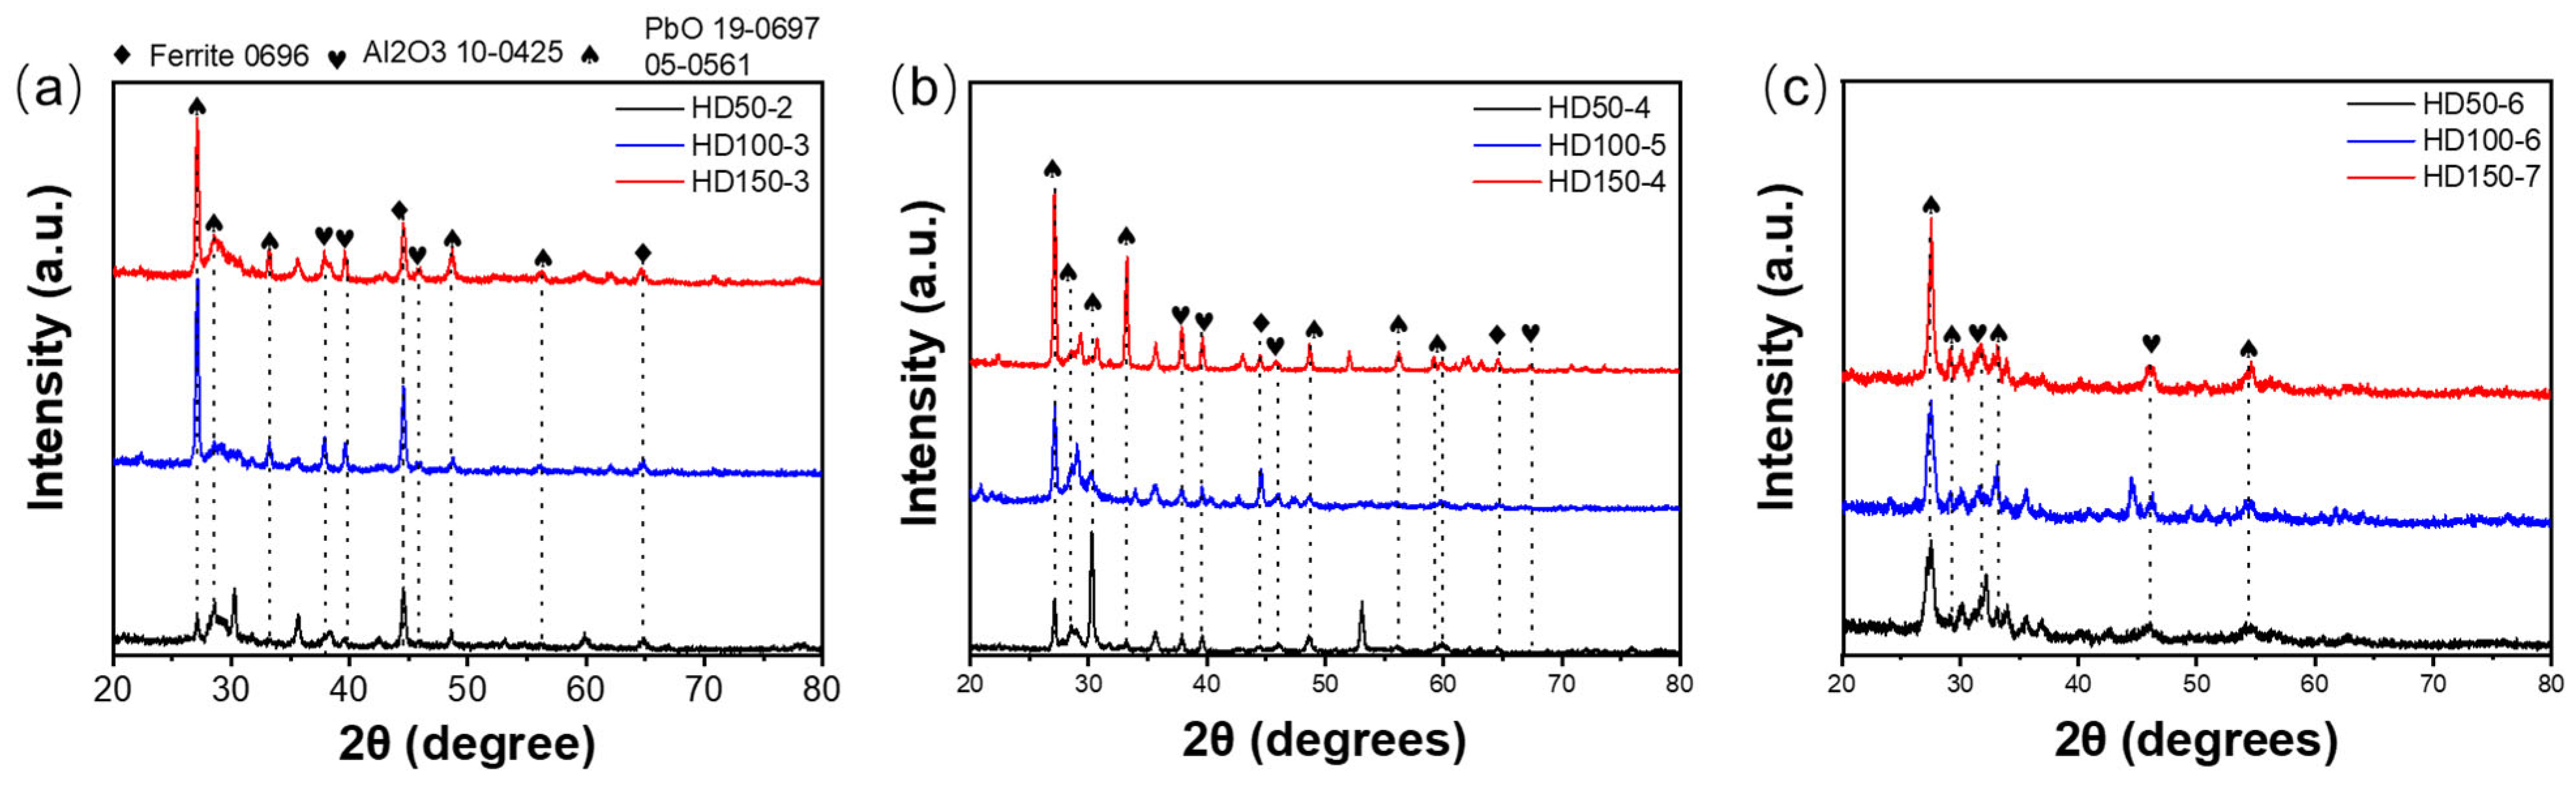
  • The samples tested at 550 °C exhibited phase transformation from amorphous to γ- and κ-Al2O3 coatings, leading to a reduction in the volume of small grains and the presence of pores between grains. However, the formation of corrosion products consisting of Fe and Pb caused volume expansion, resulting in stress corrosion cracking.
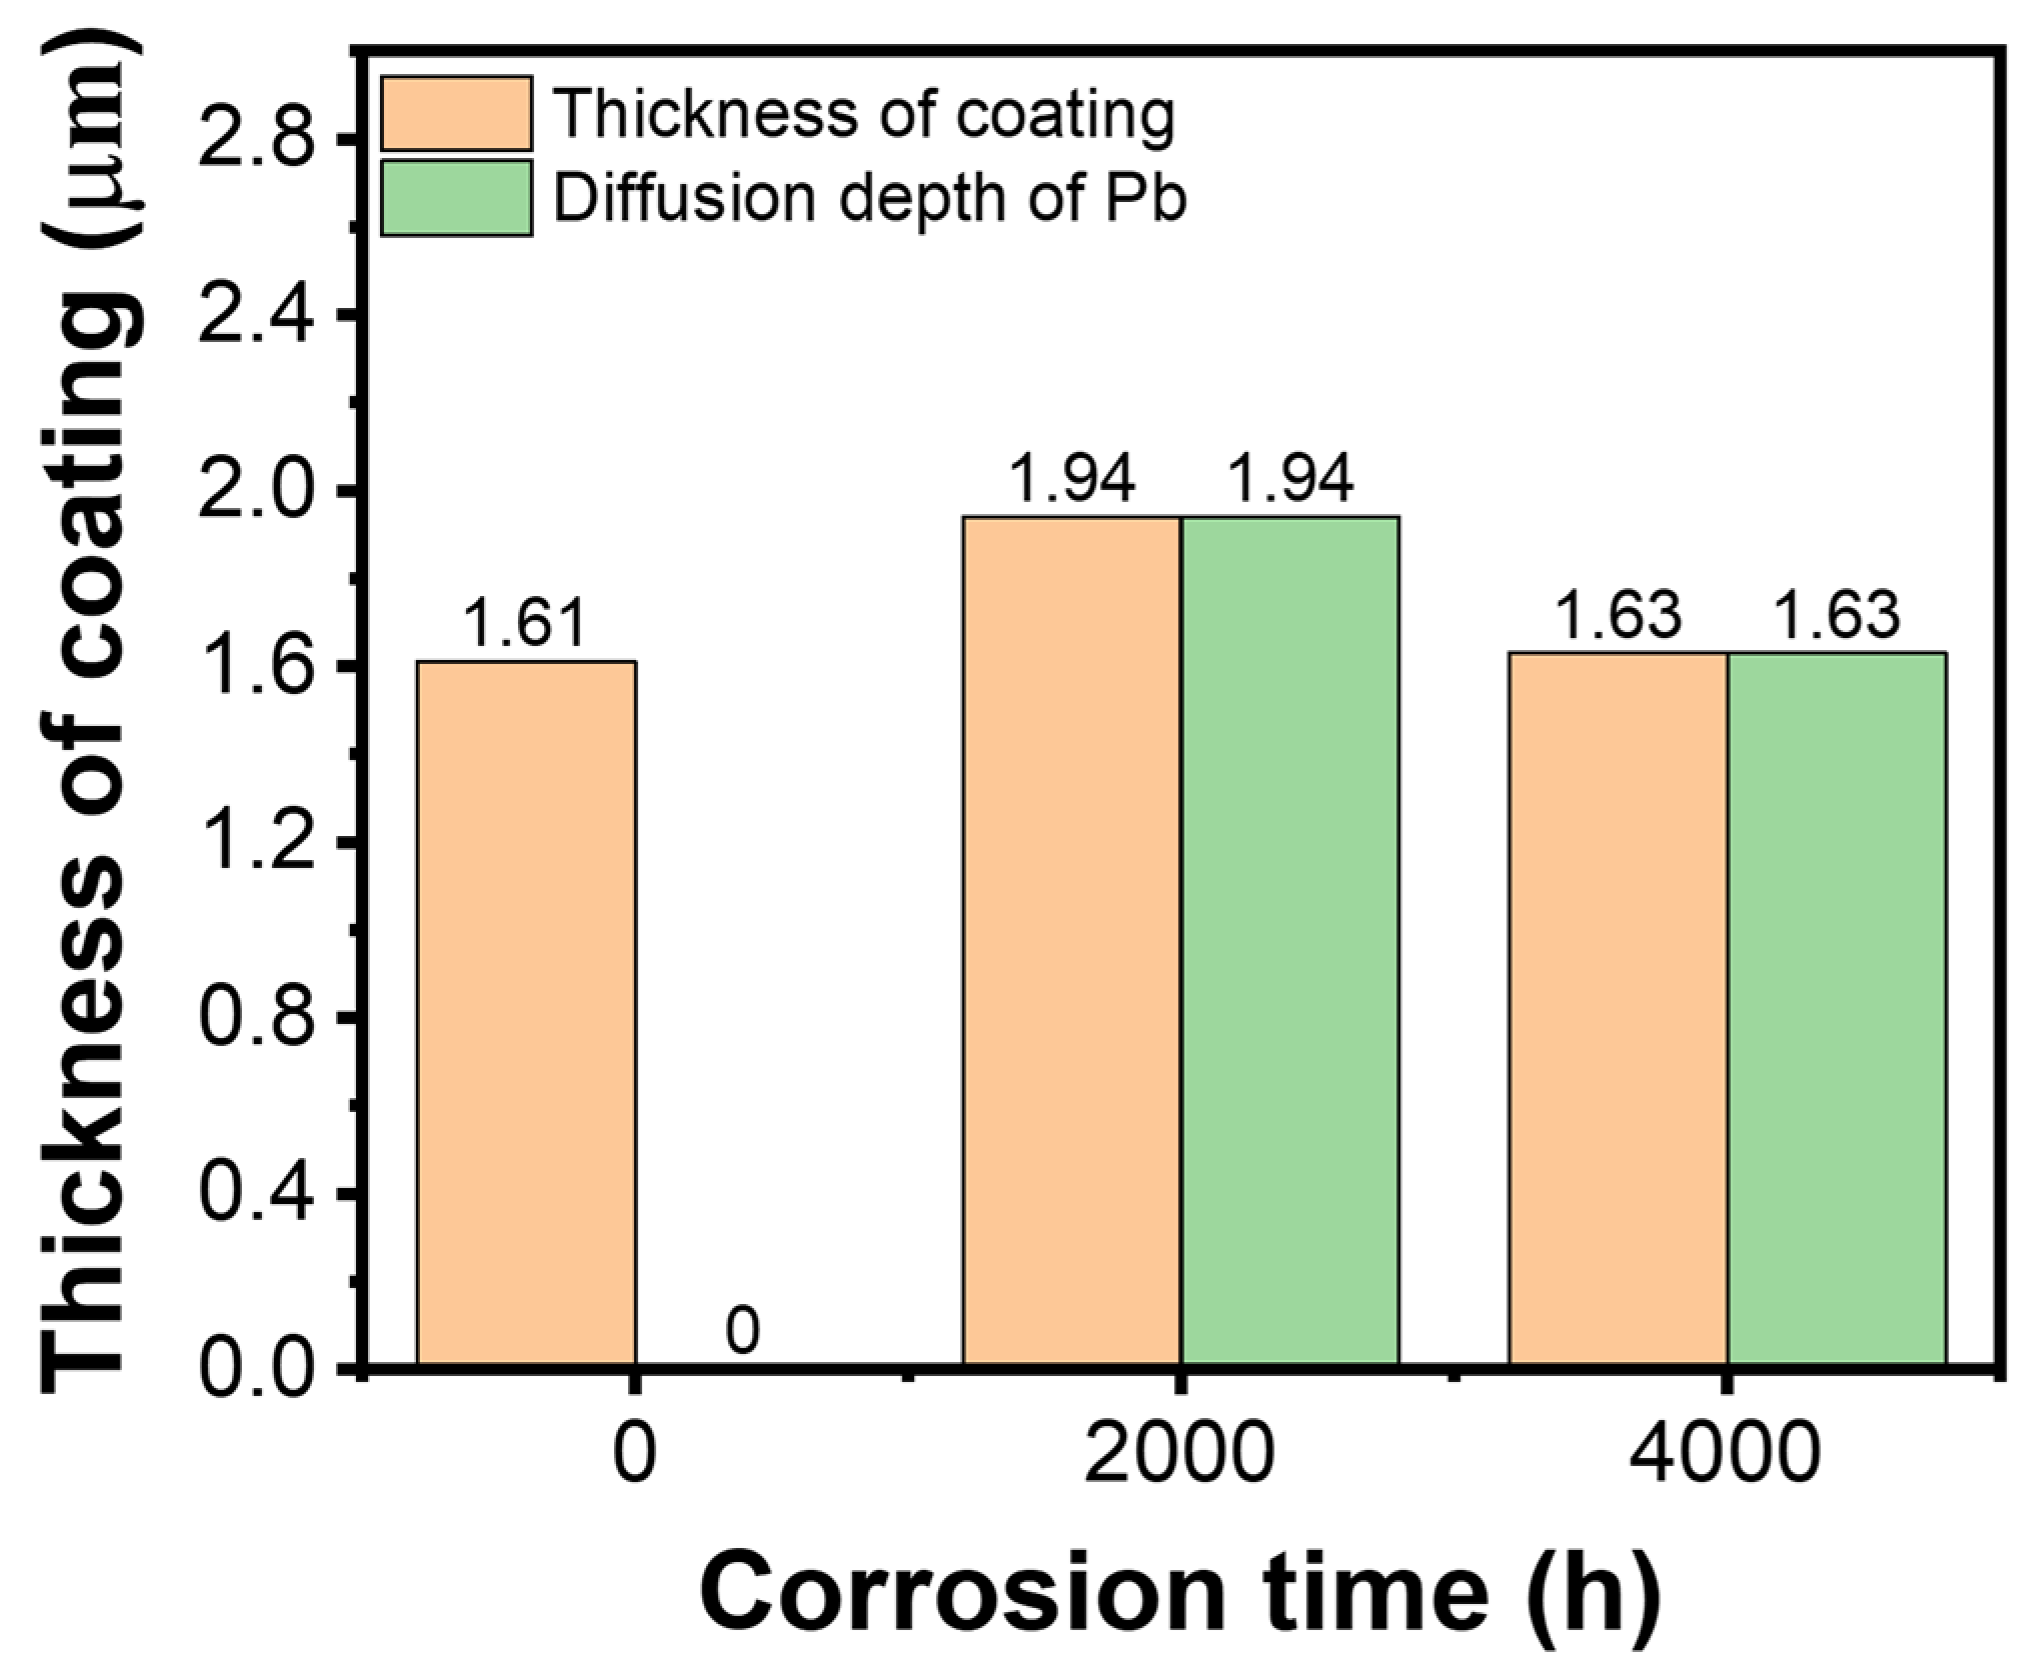
  • During the corrosion time of up to 4000 h, the corrosion products of Fe and Pb permeated throughout the entire coating matrix. No phase changes were observed in the α-Fe substrate. Importantly, no corrosion products were detected within the inner regions of γ-Al2O3 small grains, indicating the significant potential of this material for practical applications.
The findings of this study shed light on the corrosion behavior of amorphous Al2O3 coatings obtained through common magnetron sputtering technology. It is worth noting that phase transformation and the presence of corrosion products are undesirable during the service life of coatings. Additionally, the presence of tiny diffusion paths at the nanoscale can contribute to coating failures.

Author Contributions

Conceptualization, X.Y. and X.L.; methodology, H.W.; validation, K.Z. and L.C.; formal analysis, J.W. and Z.W.; writing—original draft preparation, J.W.; writing—review and editing, X.L. and X.Y.; project administration, Y.C.; funding acquisition, H.W. All authors have read and agreed to the published version of the manuscript.

Funding

The authors acknowledge the support Scientific Research Program for Young Talents of China National Nuclear Corporation (K301007022).

Institutional Review Board Statement

Not applicable.

Informed Consent Statement

Not applicable.

Data Availability Statement

There are available data when request.

Conflicts of Interest

The authors declare that they have no known competing financial interest or personal relationships that could have appeared to influence the work reported in this paper.

References

  1. Cinotti, L.; Smith, C.F.; Sekimoto, H.; Mansani, L.; Reale, M.; Sienicki, J.J. Lead-cooled system design and challenges in the frame of Generation IV International Forum. J. Nucl. Mater. 2011, 415, 245–253. [Google Scholar] [CrossRef]
  2. Kelly, J.E. Generation IV International Forum: A decade of progress through international cooperation. Prog. Nucl. Energy 2014, 77, 240–246. [Google Scholar] [CrossRef]
  3. Locatelli, G.; Mancini, M.; Todeschini, N. Generation IV nuclear reactors: Current status and future prospects. Energy Policy 2013, 61, 1503–1520. [Google Scholar] [CrossRef]
  4. Abu-Khader, M.M. Recent advances in nuclear power: A review. Prog. Nucl. Energy 2009, 51, 225–235. [Google Scholar] [CrossRef]
  5. Lorusso, P.; Bassini, S.; Del Nevo, A.; Di Piazza, I.; Giannetti, F.; Tarantino, M.; Utili, M. GEN-IV LFR development: Status & perspectives. Prog. Nucl. Energy 2018, 105, 318–331. [Google Scholar]
  6. Alemberti, A.; Smirnov, V.; Smith, C.F.; Takahashi, M. Overview of lead-cooled fast reactor activities. Prog. Nucl. Energy 2014, 77, 300–307. [Google Scholar] [CrossRef]
  7. Shi, Q.; Liu, J.; Luan, H.; Yang, Z.; Wang, W.; Yan, W.; Shan, Y.; Yang, K. Oxidation behavior of ferritic/martensitic steels in stagnant liquid LBE saturated by oxygen at 600 °C. J. Nucl. Mater. 2015, 457, 135–141. [Google Scholar] [CrossRef]
  8. Yvon, P.; Carré, F. Structural materials challenges for advanced reactor systems. J. Nucl. Mater. 2009, 385, 217–222. [Google Scholar] [CrossRef]
  9. Shi, H.; Wang, H.; Fetzer, R.; Heinzel, A.; Weisenburger, A.; Wang, K.; Jianu, A.; Müller, G. Influence of Si addition on the corrosion behavior of 9 wt% Cr ferritic/martensitic steels exposed to oxygen-controlled molten Pb-Bi eutectic at 550 and 600 °C. Corros. Sci. 2021, 193, 109871. [Google Scholar] [CrossRef]
  10. Chen, Y.; Long, Y.; Luo, H.; Xie, Z.; Lin, W.; Guo, L.; Wang, H.; An, X.; Kong, Q.; Zhang, W. Effects of different silicon content on irradiation defects and hardening in 9Cr ferritic/martensitic steel. J. Nucl. Mater. 2022, 571, 154026. [Google Scholar] [CrossRef]
  11. Wang, H.; Xiao, J.; Wang, H.; Chen, Y.; Yin, X.; Guo, N. Corrosion behavior and surface treatment of cladding materials used in high-temperature lead-bismuth eutectic alloy: A review. Coatings 2021, 11, 364. [Google Scholar] [CrossRef]
  12. Zhang, J.; Li, N. Review of the studies on fundamental issues in LBE corrosion. J. Nucl. Mater. 2008, 373, 351–377. [Google Scholar] [CrossRef]
  13. Shi, K.; Yang, J.; Chen, Q.; Sun, Y.; Zhang, W.; He, K.; Tang, R.; Ning, Z.; Liao, J.; Yang, Y. Corrosion behavior of ion-irradiated 12Cr2W2Mn F/M steel in liquid LBE. Nucl. Mater. Energy 2021, 28, 101033. [Google Scholar] [CrossRef]
  14. Chen, Q.; Bai, F.; Wang, P.; Yang, J.; Zhu, C.; Zhang, W.; Liu, H.; Zhong, Y.; Deng, J.; Liu, N. Microstructure response and lead-bismuth eutectic corrosion behavior of 11Cr1Si ferritic/martensitic steel after Au-ion irradiation. Corros. Sci. 2022, 198, 110101. [Google Scholar] [CrossRef]
  15. Schroer, C.; Voß, Z.; Wedemeyer, O.; Novotny, J.; Konys, J. Oxidation of steel T91 in flowing lead–bismuth eutectic (LBE) at 550 °C. J. Nucl. Mater. 2006, 356, 189–197. [Google Scholar] [CrossRef]
  16. Jiang, H.; Zhao, X.; Cao, S.; Wang, D.; Zhu, Q.; Lei, Y. Improvement of the mechanical properties and LBE cavitation erosion resistance of laser cladded FeCrAlTiC coating by Y2O3 addition. Mater. Lett. 2022, 326, 132882. [Google Scholar] [CrossRef]
  17. Zhong, Y.; Zhang, W.; Chen, Q.; Yang, J.; Zhu, C.; Li, Q.; Yang, J.; Liu, N.; Yang, J. Effect of LBE corrosion on microstructure of amorphous Al2O3 coating by magnetron sputtering. J. Surf. Coat. Technol. 2022, 443, 128598. [Google Scholar] [CrossRef]
  18. Yang, J.; Shi, K.; Zhang, W.; Chen, Q.; Ning, Z.; Zhu, C.; Liao, J.; Yang, Y.; Liu, N.; Yang, J. A novel AlCrFeMoTi high-entropy alloy coating with a high corrosion-resistance in lead-bismuth eutectic alloy. J. Corros. Sci. 2021, 187, 109524. [Google Scholar] [CrossRef]
  19. Zhao, S.; Liu, C.; Yang, J.; Zhang, W.; He, L.; Zhang, R.; Yang, H.; Wang, J.; Long, J.; Chang, H. Mechanical and high-temperature corrosion properties of AlTiCrNiTa high entropy alloy coating prepared by magnetron sputtering for accident-tolerant fuel cladding. Surf. Coat. Technol. 2021, 417, 127228. [Google Scholar] [CrossRef]
  20. Vogt, J.-B.; Serre, I.P. A review of the surface modifications for corrosion mitigation of steels in lead and LBE. Coatings 2021, 11, 53. [Google Scholar] [CrossRef]
  21. Jeong, S.-H.; Kim, J.-K.; Kim, B.-S.; Shim, S.-H.; Lee, B.-T. Characterization of SiO2 and TiO2 films prepared using rf magnetron sputtering and their application to anti-reflection coating. Vacuum 2004, 76, 507–515. [Google Scholar] [CrossRef]
  22. Lin, J.; Wu, Z.; Zhang, X.; Mishra, B.; Moore, J.; Sproul, W. A comparative study of CrNx coatings Synthesized by dc and pulsed dc magnetron sputtering. Thin Solid Films 2009, 517, 1887–1894. [Google Scholar] [CrossRef]
  23. Hong, R.; Jiang, X.; Szyszka, B.; Sittinger, V.; Pflug, A. Studies on ZnO: Al thin films deposited by in-line reactive mid-frequency magnetron sputtering. Appl. Surf. Sci. 2003, 207, 341–350. [Google Scholar] [CrossRef]
  24. Zhang, T.; Liao, H.; Huang, W.; Ruan, H.; Su, Y.; Yang, X.; Xu, Z.; Yin, S.; Wang, J. High temperature steam oxidation behavior of textured Cr coatings with different grain structures. J. Surf. Coat. Technol. 2023, 459, 129358. [Google Scholar] [CrossRef]
  25. Riedl, H.; Kagerer, S.; Zauner, L.; Wojcik, T.; Kolozsvári, S.; Capek, J.; Kozák, T.; Zeman, P.; Mayrhofer, P.H. Influence of transition metal dopants on the reactive HiPIMS deposition of γ-Al2O3 thin films. In Proceedings of the PLATHINIUM (Plasma Thin film International Union Meeting), Antibes, France, 13–17 September 2019. [Google Scholar]
  26. Ghailane, A.; Makha, M.; Larhlimi, H.J.; Alami, J. Design of hard coatings deposited by HiPIMS and dcMS. Mater. Lett. 2020, 280, 128540. [Google Scholar] [CrossRef]
  27. Cui, S.; Liu, L.; Jin, Z.; Zhou, L.; Ruan, Q.; Wu, Z.; Fu, R.K.; Tian, X.; Chu, P.K.; Wu, Z. Characteristics of continuous high power magnetron sputtering (C-HPMS) in reactive O2/Ar atmospheres. J. Appl. Phys. 2021, 129, 243301. [Google Scholar] [CrossRef]
  28. Oliver, W.C.; Pharr, G.M. An improved technique for determining hardness and elastic modulus using load and displacement sensing indentation experiments. J. Mater. Res. 1992, 7, 1564–1583. [Google Scholar] [CrossRef]
  29. Bhushan, B.; Li, X. Nanomechanical characterisation of solid surfaces and thin films. Int. Mater. Rev. 2003, 48, 125–164. [Google Scholar] [CrossRef]
  30. Ferré, F.G.; Bertarelli, E.; Chiodoni, A.; Carnelli, D.; Gastaldi, D.; Vena, P.; Beghi, M.G.; Di Fonzo, F. The mechanical properties of a nanocrystalline Al2O3/a-Al2O3 composite coating measured by nanoindentation and Brillouin spectroscopy. Acta Mater. 2013, 61, 2662–2670. [Google Scholar] [CrossRef]
  31. Ma, H.; Gong, X.; Zhu, J.; Chen, H.; Li, J.; Liu, Y.; Ren, Q.; Zhang, F.; Pang, Z. Liquid metal embrittlement susceptibility of an oxide-dispersion strengthened FeCrAl alloy in contact with liquid lead-bismuth eutectic at 350 °C. Corros. Sci. 2022, 207, 110603. [Google Scholar] [CrossRef]
  32. Iatsunskyi, I.; Kempiński, M.; Jancelewicz, M.; Załęski, K.; Jurga, S.; Smyntyna, V. Structural and XPS characterization of ALD Al2O3 coated porous silicon. Vacuum 2015, 113, 52–58. [Google Scholar] [CrossRef]
  33. Brajpuriya, R.; Shripathi, T. Investigation of Fe/Al interface as a function of annealing temperature using XPS. Appl. Surf. Sci. 2009, 255, 6149–6154. [Google Scholar] [CrossRef]
  34. Wan, X.; Zhao, S.; Yang, Y.; Gong, J.; Sun, C. Effects of nitrogen pressure and pulse bias voltage on the properties of Cr–N coatings deposited by arc ion plating. Surf. Coat. Technol. 2010, 204, 1800–1810. [Google Scholar] [CrossRef]
  35. Nordahl, C.S.; Messing, G.L. Thermal analysis of phase transformation kinetics in α-Al2O3 seeded boehmite and γ-Al2O3. Thermochim. Acta 1998, 318, 187–199. [Google Scholar] [CrossRef]
  36. Landälv, L.; Carlström, C.-F.; Lu, J.; Primetzhofer, D.; Jõesaar, M.; Ahlgren, M.; Göthelid, E.; Alling, B.; Hultman, L.; Eklund, P. Phase composition and transformations in magnetron-sputtered (Al,V)2O3 coatings. Thin Solid Films 2019, 688, 137369. [Google Scholar] [CrossRef]
  37. Yin, X.; Wang, Y.; Wang, H.; Zhao, K.; Sun, Y.; Xiao, J.; Zhao, Y.; Gong, F.; Chen, Y. Corrosion behavior and failure mechanism of amorphous Al2O3 coating at high-temperature LBE. Vacuum 2023, 215, 112251. [Google Scholar] [CrossRef]
  38. Sahu, B.P.; Dutta, A.; Mitra, R. Influence of substrate bias voltage on structure and properties of DC magnetron sputtered Ni–Zr alloy thin films. J. Mater. Res. 2020, 35, 1543–1555. [Google Scholar] [CrossRef]
  39. Murdzek, J.A.; Rajashekhar, A.; Makala, R.S.; George, S.M. Thermal atomic layer etching of amorphous and crystalline Al2O3 films. J. Vac. Sci. Technol. A 2021, 39, 042602. [Google Scholar] [CrossRef]
  40. Bakulin, A.V.; Kulkov, S.S.; Kulkova, S.E. Adhesion properties of clean and doped Ti3Al/Al2O3 interface. Appl. Surf. Sci. 2021, 536, 147639. [Google Scholar] [CrossRef]
Figure 1. Surface and cross-sectional morphology of as-deposited Al2O3 coating at a bias voltage of −50 V for (a,b), −100 V for (c,d), −150 V for (e,f), respectively.
Coatings 13 01274 g001
Figure 2. XPS spectra of the as-deposited coatings deposited at different bias voltages.(a) high resolution of spectrum of O1s and (b) high resolution of spectrum of Al2p.
Coatings 13 01274 g002
Figure 3. Nanoscratch and nanoindentation of Al2O3. (ac) Nanoscratch of Al2O3 coatings deposited at −50 V, −100 V, and −150 V. (d) Critical load of the coating before and after heat treatment at 700 °C for 20 h. Hardness and Young’s modulus before (e) and after heat treatment (f).
Coatings 13 01274 g003
Figure 4. Corrosion behavior of Al2O3 coatings deposited at a bias voltage of −50 V after LBE corrosion for 2000 h at 450 °C (a), 550 °C (b), and 650 °C (c), respectively. The corresponding EDS mapping is shown below (ac).
Coatings 13 01274 g004
Figure 5. Corrosion behavior of Al2O3 coatings deposited at a bias voltage of −100 V after LBE corrosion for 2000 h at 450 °C (a), 550 °C (b), and 650 °C (c), respectively. Enlarged images are displayed under (a,c), and the corresponding EDS mapping is shown below (b).
Coatings 13 01274 g005
Figure 6. Corrosion behavior of Al2O3 coatings deposited at a bias voltage of −150 V after LBE corrosion for 2000 h at (a) 450 °C, (b) 550 °C, and (c) 650 °C, respectively.
Coatings 13 01274 g006
Figure 7. XRD patterns of Al2O3 coatings after exposure to saturated oxygen LBE (a) at 450 °C, (b) 550 °C, and (c) 650 °C.
Coatings 13 01274 g007
Figure 8. The XPS spectra of Al2O3 coatings after LBE corrosion at 550 °C for 2000 h. (a) −50 V, (b) −100 V, (c) −150 V.
Coatings 13 01274 g008
Figure 9. Nanoscratch test of Al2O3 coatings before and after LBE corrosion at 550 °C for 2000 h. Nanoscratch of the coating with bias voltages of −50 V (a) and −100 V (b). (c) Hardness and Young’s modulus of the coating. (d) Critical load of the coating after LBE corrosion.
Coatings 13 01274 g009
Figure 10. Interest region for FIB process.
Coatings 13 01274 g010
Figure 11. The cross-sectional HADDF image of Al2O3 coatings and corresponding EDS mapping.
Coatings 13 01274 g011
Figure 12. Microstructure of outer layer after corrosion at 550 °C for 2000 h and corresponding EDS mapping.
Coatings 13 01274 g012
Figure 13. TEM analysis of Al2O3 coatings after LBE corrosion. (a) Cross-sectional image of the Al2O3 coating; (b) SAED patterns of Al particle in (a); (c) HRTEM micrographs of Al particles.
Coatings 13 01274 g013
Figure 14. TEM analysis of Al2O3 coatings deposited at the bias voltage of −150 V after LBE corrosion at 550 °C for 2000 h. (a) microstructure of Al2O3 coating; (b) HRTEM image from (a); (c) HRTEM image of Al2O3; (d) FFT patterns of (c); (e) HRTEM image of Al2O3 coating; (f,g) the corresponding FFT patterns with amorphous and crystal structure; (h) one-dimensional lattice image.
Coatings 13 01274 g014
Figure 15. TEM analysis of interface Al2O3 coatings. (a,d) the HAADF image of interface near substrate and corresponding SAED; (b,e) HRTEM image of Cr layer and corresponding FFT pattern. (c,f) the HAADF image of substrate and corresponding SAED pattern.
Coatings 13 01274 g015
Figure 16. FIB process of Al2O3 coatings. (a) Surface morphology of Al2O3 coatings after corrosion at 550 °C for 4000 h. (b) Interest area for FIB. (c) Morphology of FIB sample.
Coatings 13 01274 g016
Figure 17. Microstructure of Pb diffusion cut-off interface and corresponding EDS mapping.
Coatings 13 01274 g017
Figure 18. Cross-sectional bright field TEM micrographs of corrosion products and corresponding SAED patterns. (a) the HRTEM image of corrosion products and (b) the SAED pattern of Fe3O4.
Coatings 13 01274 g018
Figure 19. Cross-sectional bright field TEM micrographs of Al2O3 with porous structure and corresponding EDS mapping.
Coatings 13 01274 g019
Figure 20. HAADF images and corresponding FFT patterns at the Al2O3 layer after corrosion for 4000 h. (a) the HRTEM image of Al2O3 and corresponding FFT pattern; (b) the HRTEM image of corrosion products and corresponding FFT pattern; (c) the HRTEM image of corrosion products and corresponding FFT pattern.
Coatings 13 01274 g020
Figure 21. Interface microstructure of the Al2O3 coating and substrate and corresponding EDS mapping. The SAED pattern of substrate from the green ring.
Coatings 13 01274 g021
Figure 22. Schematic diagram of LBE corrosion contacting with Al2O3 coating and a corresponding Ellingham diagram. (a) Initial stage of corrosion; (b) phase transformation stage during LBEcorrosion; (c) coating cracking stage (d) Ellingham diagram.
Coatings 13 01274 g022
Figure 23. The thickness variation of Al2O3 coating with the corrosion time.
Coatings 13 01274 g023
Disclaimer/Publisher’s Note: The statements, opinions and data contained in all publications are solely those of the individual author(s) and contributor(s) and not of MDPI and/or the editor(s). MDPI and/or the editor(s) disclaim responsibility for any injury to people or property resulting from any ideas, methods, instructions or products referred to in the content.

