Article

Influence of NaCl Solution External Erosion on Corrosion Resistance of RPC Reinforced with Straw Fiber

1
School of Civil Engineering and Geographic Environment, Ningbo University, Ningbo 315000, China
2
School of Civil Transportation Engineering, Ningbo University of Technology, Ningbo 315211, China
3
Engineering Research Center of Industrial Construction in Civil Engineering of Zhejiang, Ningbo University of Technology, Ningbo 315048, China
*
Authors to whom correspondence should be addressed.
Coatings 2023, 13(8), 1308; https://doi.org/10.3390/coatings13081308
Submission received: 26 June 2023 / Revised: 21 July 2023 / Accepted: 24 July 2023 / Published: 26 July 2023

Abstract

:
Straw fiber, as a kind of waste if not properly treated, will pollute the environment. It can be used in cement-based materials as a plant fiber material. Agricultural solid-waste straw fiber has good tensile properties and is expected to be used as a fiber-reinforced material for reactive powder concrete (RPC) and to improve the corrosion resistance of RPC. In this paper, the ultrasonic velocity through specimens, the electrical resistance, the AC impedance spectroscopy and tafel curve were analyzed. The corrosion resistance of the steel bar under the chloride salt freeze–thaw cycles and dry–wet alternations was systematically studied. The result shows that adding a certain content of straw fiber can improve its corrosion resistance. Under the action of two chloride salt environments, the lowest mass loss rate was 0.82% for the sample with 3% straw fiber content and the mass growth rate of the specimens with 4% straw fiber is the highest aqt 0.9%. In terms of ultrasonic velocity, the lowest loss rate was 5.68% for specimens with fiber content of 2%. The specimens were subjected to 0 dry–wet alternations and freeze–thaw cycles; the highest electrical resistance is 19.96 kΩ when the fiber content is 1% and the lowest electrical resistance is 11.105 kΩ when the fiber content is 2%. Under the dry–wet alternations, the content of straw fiber and its corrosion resistance are: 1% > 4% > 0% > 3% > 2%. Under freeze–thaw cycles, the content of straw fiber and its corrosion resistance were as follows: 1% > 0% > 4% > 3% > 2%.

1. Introduction

With the exploration and development of the ocean all over the world, reinforced concrete buildings are widely used in marine engineering [1,2,3]. Due to the long-term exposure of coastal reinforced concrete buildings to extreme working conditions, such as seawater immersion, seawater freezing and thawing, reinforcement corrosion and concrete spalling corrosion occur frequently [4,5,6]. According to some statistical information, more than 80% of coastal bridges in the world have different degrees of reinforcement corrosion after 7~25 years of service [6]. The rapid corrosion of coastal concrete buildings not only increases the economic cost of repair but also challenges the safety and durability of coastal concrete buildings. Therefore, the search for new concrete materials is crucial.
The earliest research on corrosion resistance of coastal concrete was by Bouygues Company [7] and proposed reactive powder concrete (RPC), also known as ultra-high-performance concrete [8,9]. This concrete is produced according to the theory of maximum compactness and is formed by adding cement, quartz sand and active mineral composition. The properties of RPC (reactive powder concrete) are small particle size, high compactness and very low porosity [10]. In extreme environments, the corrosion of RPC is better than that of the corrosive medium. Meanwhile, the service life of Marine buildings has been extended due to RPC’s superior durability and mechanical properties; it is feasible to reduce the influence of chloride ion penetration [11,12,13,14].
Another kind of research on the corrosion resistance of coastal concrete focuses on straw fiber. The straw fiber resources of China are rich and widely distributed [15], and the kinds of straw fiber in different regions differ. However, the main chemical composition of straw fiber was similar, mainly composed of cellulose, hemifibrin and lignin [15,16,17]. Research on straw fiber concrete was started systematically in China around 2010. The researchers carried out the exploration of it and obtained some relevant conclusions. Fan Jun et al. [18] used straw fibers to prepare concrete hollow blocks and found that the addition of straw fiber effectively improved the mechanical properties of fiber concrete hollow blocks and increased strength and toughness. Researchers have been deepening research on the mechanical performance and insulation of straw fiber concrete since 2017. At the same time, other researchers have also carried out a lot of research on the mechanics, thermal performance and physical properties of straw fiber concrete. Joseph et al. [19]. proved that rapeseed straw has certain effects on the mechanical properties, thermal properties and transportation properties of concrete.
Currently, straw fiber has a stable source. The goal of economic and environmental protection can be achieved if it can be used reasonably [20]. However, no one has conducted a systematic study on the performance of RPC with the straw fiber, in particular, its working performance and its reinforced corrosion resistance. The research on the corrosion resistance of reinforced RPC with straw fiber is still blank. Considering that coastal structures have been hit by dry–wet alternation and the freeze–thaw cycle of chlorine salt for a long time, a study on the working performance of straw fiber RPC and the reinforced corrosion resistance under the alternation of dry–wet and freeze–thaw cycles of chlorine salt was conducted innovatively.
The last type of research, that is, the advanced research direction of the study of corrosion-resistance of reinforced concrete is focused on multi-factor coupling because the chlorine-salt environment, the dry–wet alternations and freeze–thaw cycles are the most common. Bao et al. [21] summarize the research achievements of concrete against chlorine ion erosion in the marine environment and provide a reference basis for the theory and practical applications of concrete durability by theoretical analysis, numerical simulation, and studies. Banthia et al. [22] obtain the conclusions through experiment; the chlorine ion transitivity of ordinary concrete increases rapidly when the compressive stress exceeds 30% of the limit compressive stress. After the dry and wet action of tides, chloride crystals will also generate expansion stress similar to sulfate corrosion inside the concrete, causing concrete spalling [23]. Li et al. [24] found that the icing rate and chloride ion concentration of concrete increased with the increase in the number of freeze–thaw cycles, which accelerated the deterioration of the durability of concrete. However, no research has been conducted on the combination of reactive powder concrete and reinforced concrete, so the corrosion resistance of the reinforced concrete with straw fiber RPC has been studied in this thesis.
Groups of RPC specimens with different straw fiber content (0%, 1%, 2%, 3%, 4%) were designed in this thesis. The complex marine region environment will be simulated by the dry–wet alternations and freeze–thaw cycles of the NaCl solution. The basic parameters (electrical resistance, ultrasonic velocity), AC impedance spectrum and the tafel curve were measured for each group specimen. Then, groups of RPC specimens were placed in dry–wet alternating environment and freeze–thaw cycle environment for parallel study. The corrosive condition of the specimens were judged by analyzing the basic parameters, the mass loss, the changing curve of the relationship between the AC impedance spectrum and the tafel curve and cycle times, thereby the relationship between the corrosion resistance of reinforced RPC with the straw fiber under the chlorine-salt freeze–thaw cycle and chlorine-salt dry–wet alternations and the content of straw fiber was studied.

2. Experimental

2.1. Raw Materials and Mix Proportion

Ordinary Portland cement P·O42.5 produced by Xiangshan Conch Cement Co., Ltd. Ningbo, China, with a specific surface area of 350 m2/kg, was used for this study. The water-reducing agent used in this study is polycarboxylated superplasticizer (SP) produced by Shanghai Yingshan New Material Technology Co., Ltd. Shanghai, China., which is a kind of tawny microemulsion solution, with a water-reduction rate reaching 40%. The specific surface area of silica fume is 15 m2/g, the content of SiO2 is greater than 98% and the density is 2.2 g/cm3. Quartz sand with three particle sizes of 1~0.71 mm, 0.59~0.35 mm and 0.15~0.297 mm was used as aggregate, with the ratio of the coarse, medium, and fine sand being 1:1.5:0.8. The anti-foaming agent is LDS-800, produced by Lujie Chemical Technology Co., Ltd., Guangdong, China, which is a milky white liquid compounded from organosilicon, polyether, hydrophobic silica and foam inhibitor. A steel bar with a diameter of 6.5 mm was used in this study, and the steel mesh was stainless steel. The straw fiber is prepared in groups according to the volume percentage of 0%–4%. Table 1 shows the chemical composition of raw materials (%). Table 2 shows the mixing mass proportion of fresh cement paste. (The mixing mass proportion of fresh cement paste was the same in each group)

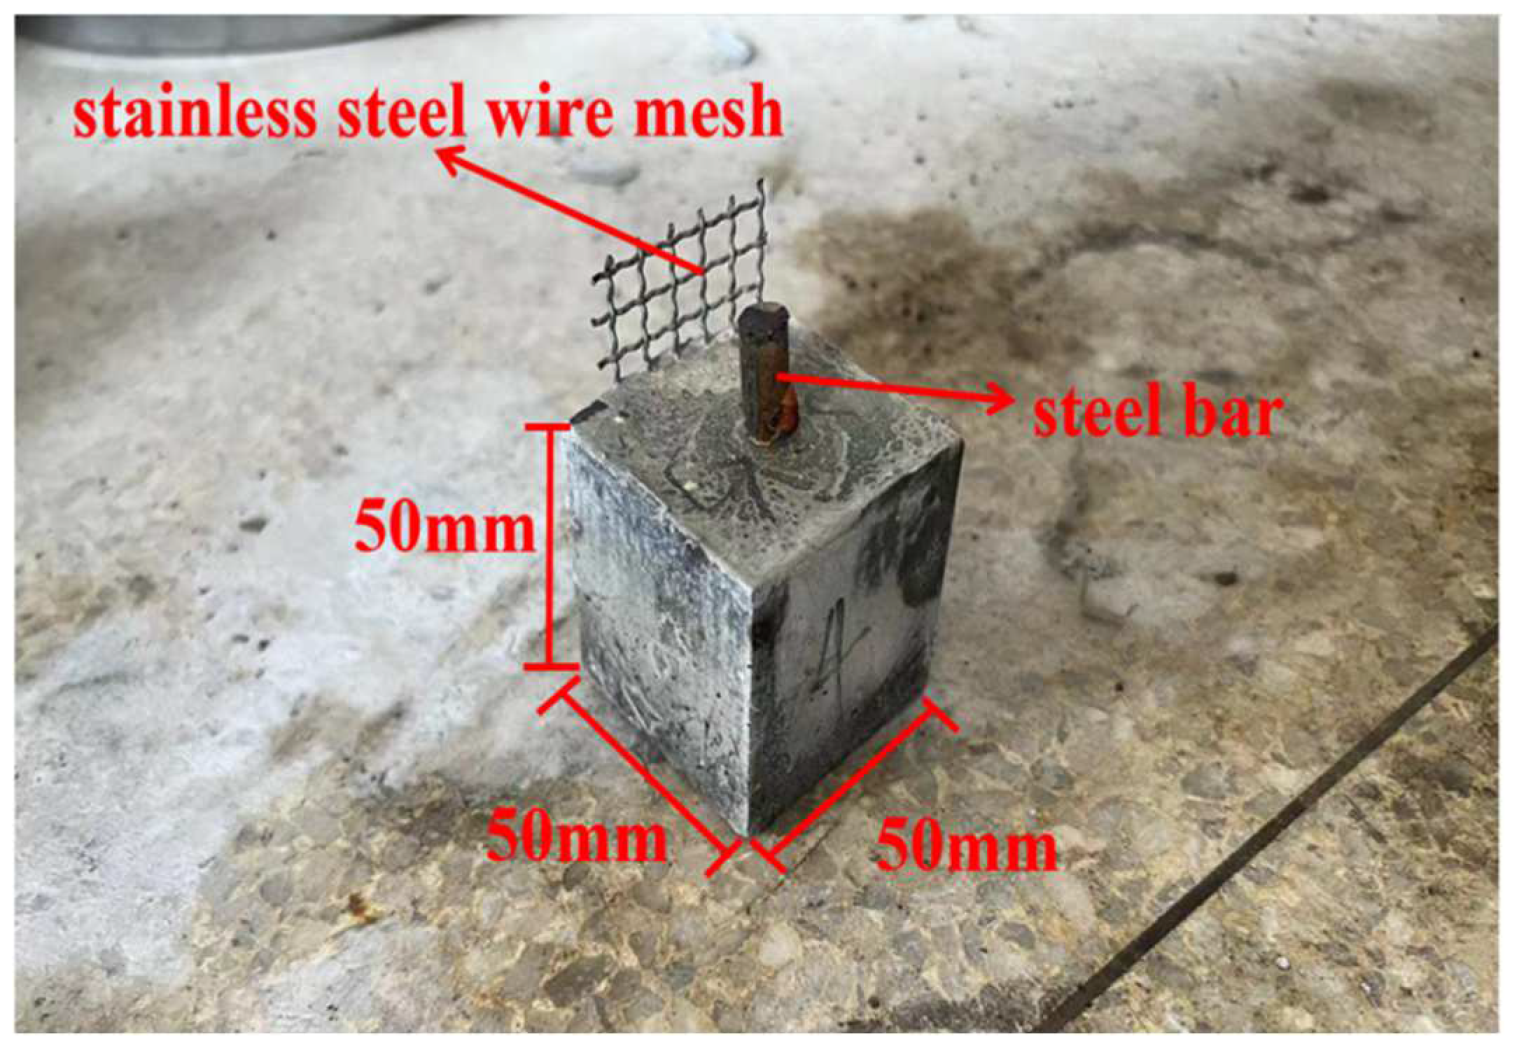
2.2. Specimens Preparation

The water-binder ratio of 0.25 in this study. The UJZ-15 mixer (produced by Shijiazhuang City Road Hang Technology Co., Ltd. Shijiazhuang, China), with 1500 W operating power and a running diameter of mixing blade at 200 mm, is used to prepare the specimens. The reactive powder concrete (RPC) specimens can be manufactured following these steps:
Firstly, the cement and other raw materials are added to the mixer and mixed for 480 s, and then the mixed solution of water and the water-reducing agent is slowly injected after the machine starts for 30 s. Secondly, the newly mixed RPC slurry was poured into the mold with the release agent to prepare the test specimens. The specimens studied were 50 mm × 50 mm × 50 mm cubic specimens, a total of 30 specimens in five groups. The bottom of the mold is lined with paper to prevent the concrete from seeping. Finally, stainless steel meshes of 45 × 65 mm2 are inserted at a distance of 5 mm from the edge of each specimen and put a steel bar with a length of 65 mm and a diameter of 6 mm in the center of the specimens as shown in Figure 1. The specimens are covered with plastic wrap. Moreover, the specimens are cured at room temperature for 48 h until hardened, and then the specimens are cured in the standard curing room (with a temperature of 20 ± 2 °C and relative humidity of above 95%) for 28 days after removing the molds. Figure 1 shows the specimen diagram of reinforced RPC. Figure 2 shows the RPC production process.

2.3. Dry–Wet Alternations and Freeze–Thaw Cycles

The specimens were divided into group A and group B. Group A was used for the dry–wet alternations with 3.0% NaCl solution. Group B was subjected to freeze–thaw cycles of chlorine salt. The NaCl solution on the surface of the RPC specimens is wiped with a wet cloth before each freeze–thaw cycle and dry–wet alternation.
In this study, the dry–wet alternation is to be divided into two stages, with a total of 10 dry–wet alternations, 5 times per stage. During each time dry–wet alternation, specimens are immersed in NaCl solution for 12 h, and then put in a dryer for 36 h at 80 °C, and a total of 48 h to complete the first cycle. After completing each stage (5 cycles), the basic parameters of the block in Group A are tested. In total, 0 dry–wet alternation refers to the standard curing 24 days, soaking specimens in NaCl solution for 4 days. At the same time, the mass loss and ultrasonic and other properties of the specimens were used as blank control groups for comparison.
In this study, the freeze–thaw cycle is planned to be divided into four stages. Specimens are immersed in NaCl solution to perform freeze–thaw, and a total of 100 freeze–thaw cycles are performed. The basic parameters of specimens were tested every 50 freeze–thaw cycles, and the AC impedance spectrum and tafel curve are measured after 100 freeze–thaw cycles are completed.

2.4. Measurement Method

2.4.1. Measurement of Ultrasonic Velocity

The ultrasonic measurement instrument of this study is the non-metallic ultrasonic detector HC-U81 (produced by Beijing Haichuang High-tech Technology Co., Ltd., Beijing, China), as shown in Figure 3. Vaseline is evenly daubed with the test ends on both sides of the RPC specimens, the probes are pressed against the test ends on both sides, and the sound velocity values are obtained by starting the instrument. The specific process and method of measurement was shown in Figure 3, and it can be found in Wang et al. [25].

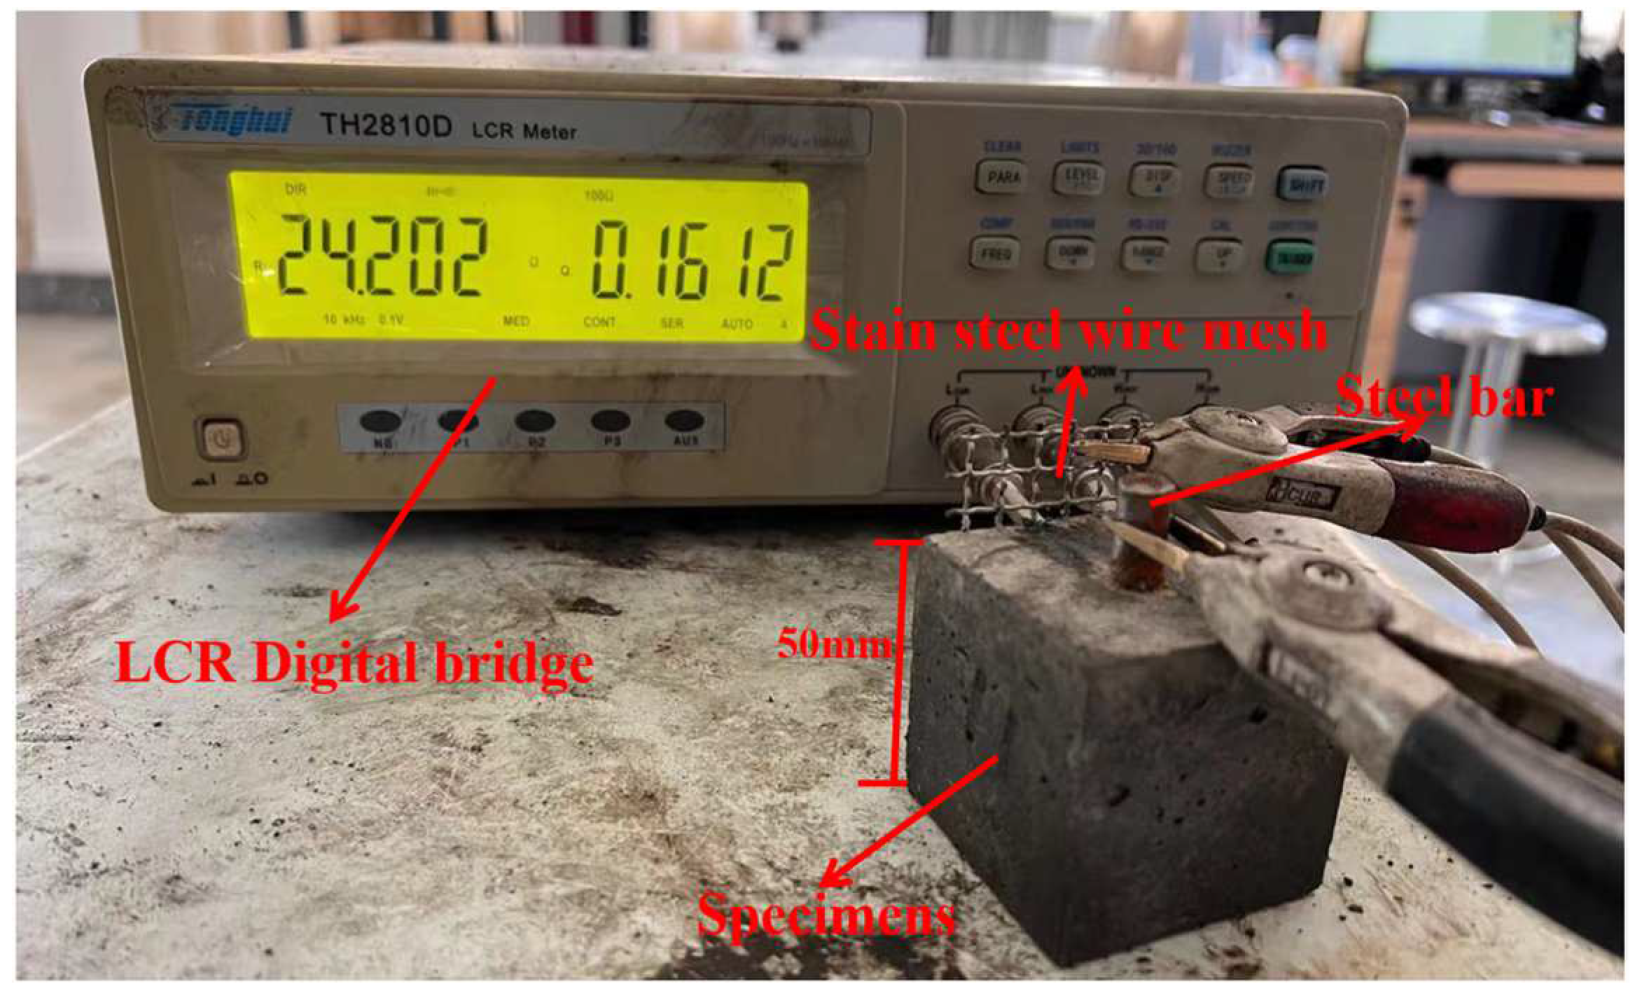
2.4.2. Measurement of Mass Loss and Electrical Parameter Measurement

When testing the mass loss of the specimens, the steel bar is first rust-cleaned and polished, then dried and weighed, and finally, the mass loss is calculated.
TH2810D LCR digital bridge provided by Changzhou Tonghui Co., Ltd., Changzhou, China, with testing voltage and frequency of 1 V and 104 Hz, respectively, was used in the AC electrical resistance test. The metal clips of the energized contacts are clamped with the wire mesh and steel bar (no corroded part of the steel bar), respectively, and the resistance values are recorded.
Parstat3000 electrochemical workstation, produced by Shanghai Princeton Instrument Co., Ltd., Shanghai, China, is used for electrochemical impedance spectroscopy and potentiodynamic polarization which produces tafel curves. The tafel curve is the tafel segment of the potentiodynamic polarization curve. The test frequency of the electrochemical impedance spectrum is 1 Hz to 100,000 Hz and the test voltage is −10 mV ~ 10 mV. Tafel curve test voltage is −0.25 V~0.25 V, step height is 5 mV, and step time is 0.5 s. The embedded reinforcement mesh and reinforcement in the specimens are connected with the electrical measuring instrument through wires. Figure 4 is a picture of the TH2810D LCR digital bridge and resistance measurement process. Figure 5 shows the tafel curve test process and parameters.

3. Results and Discussions

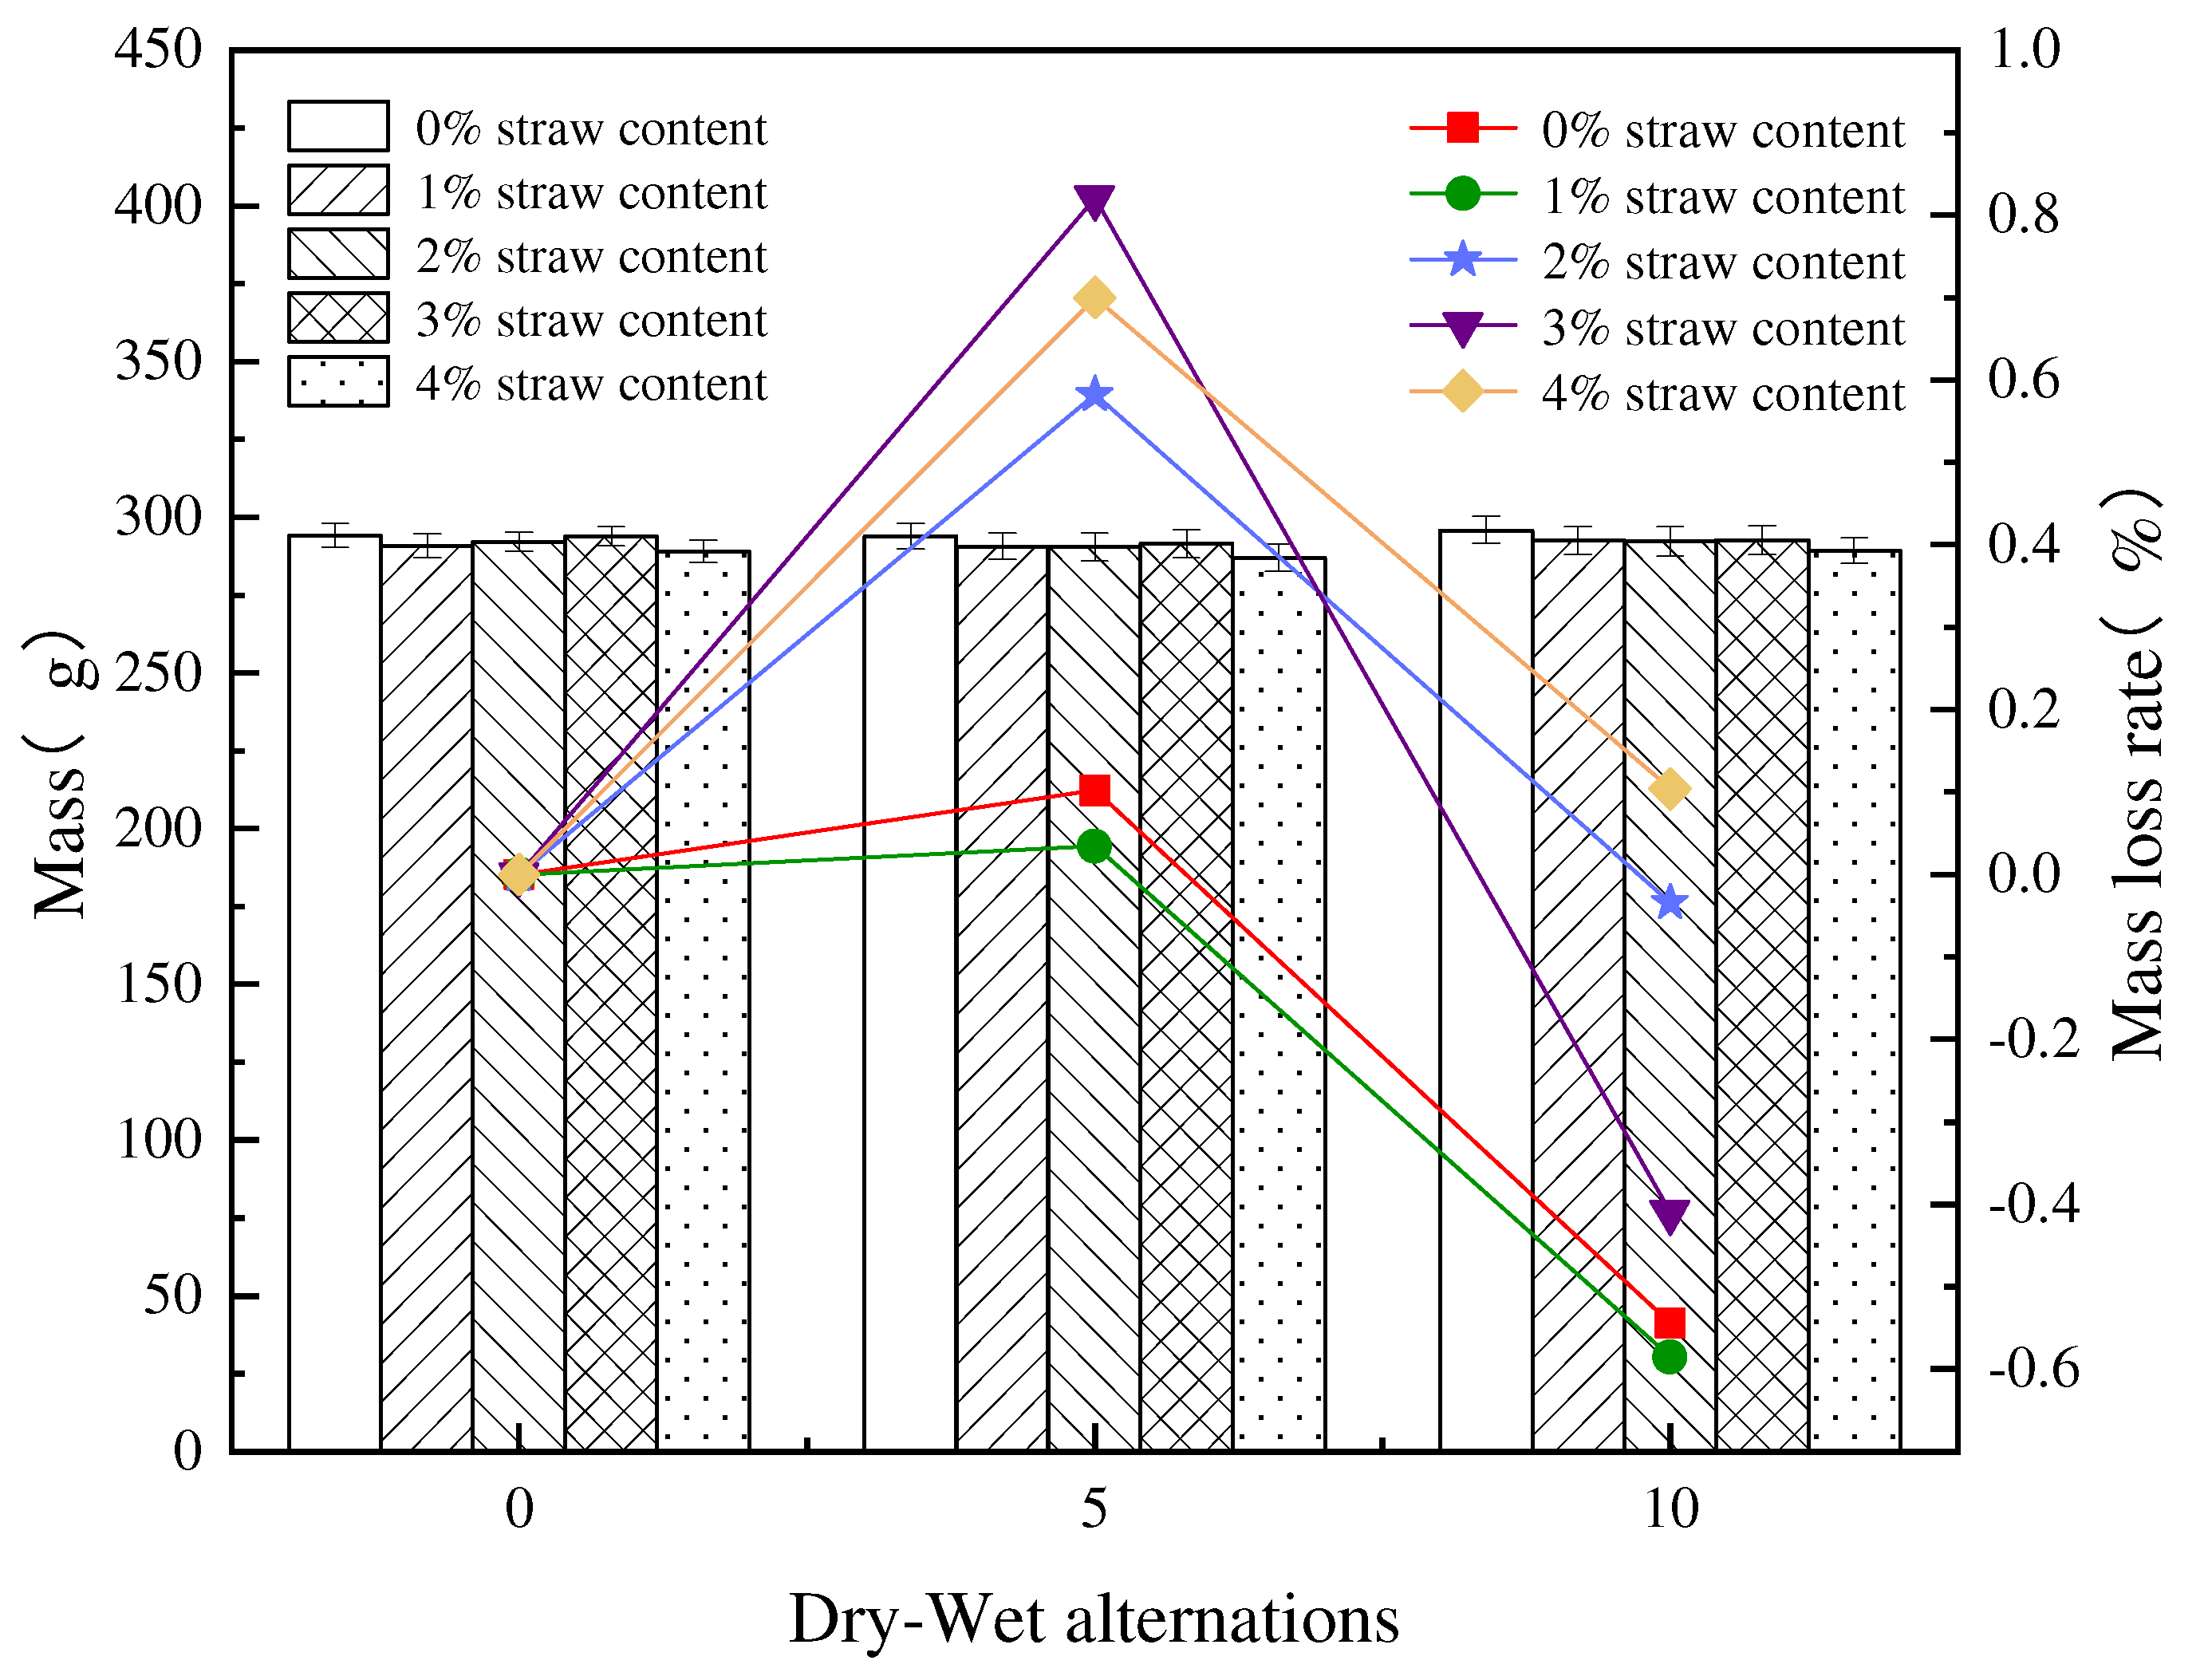
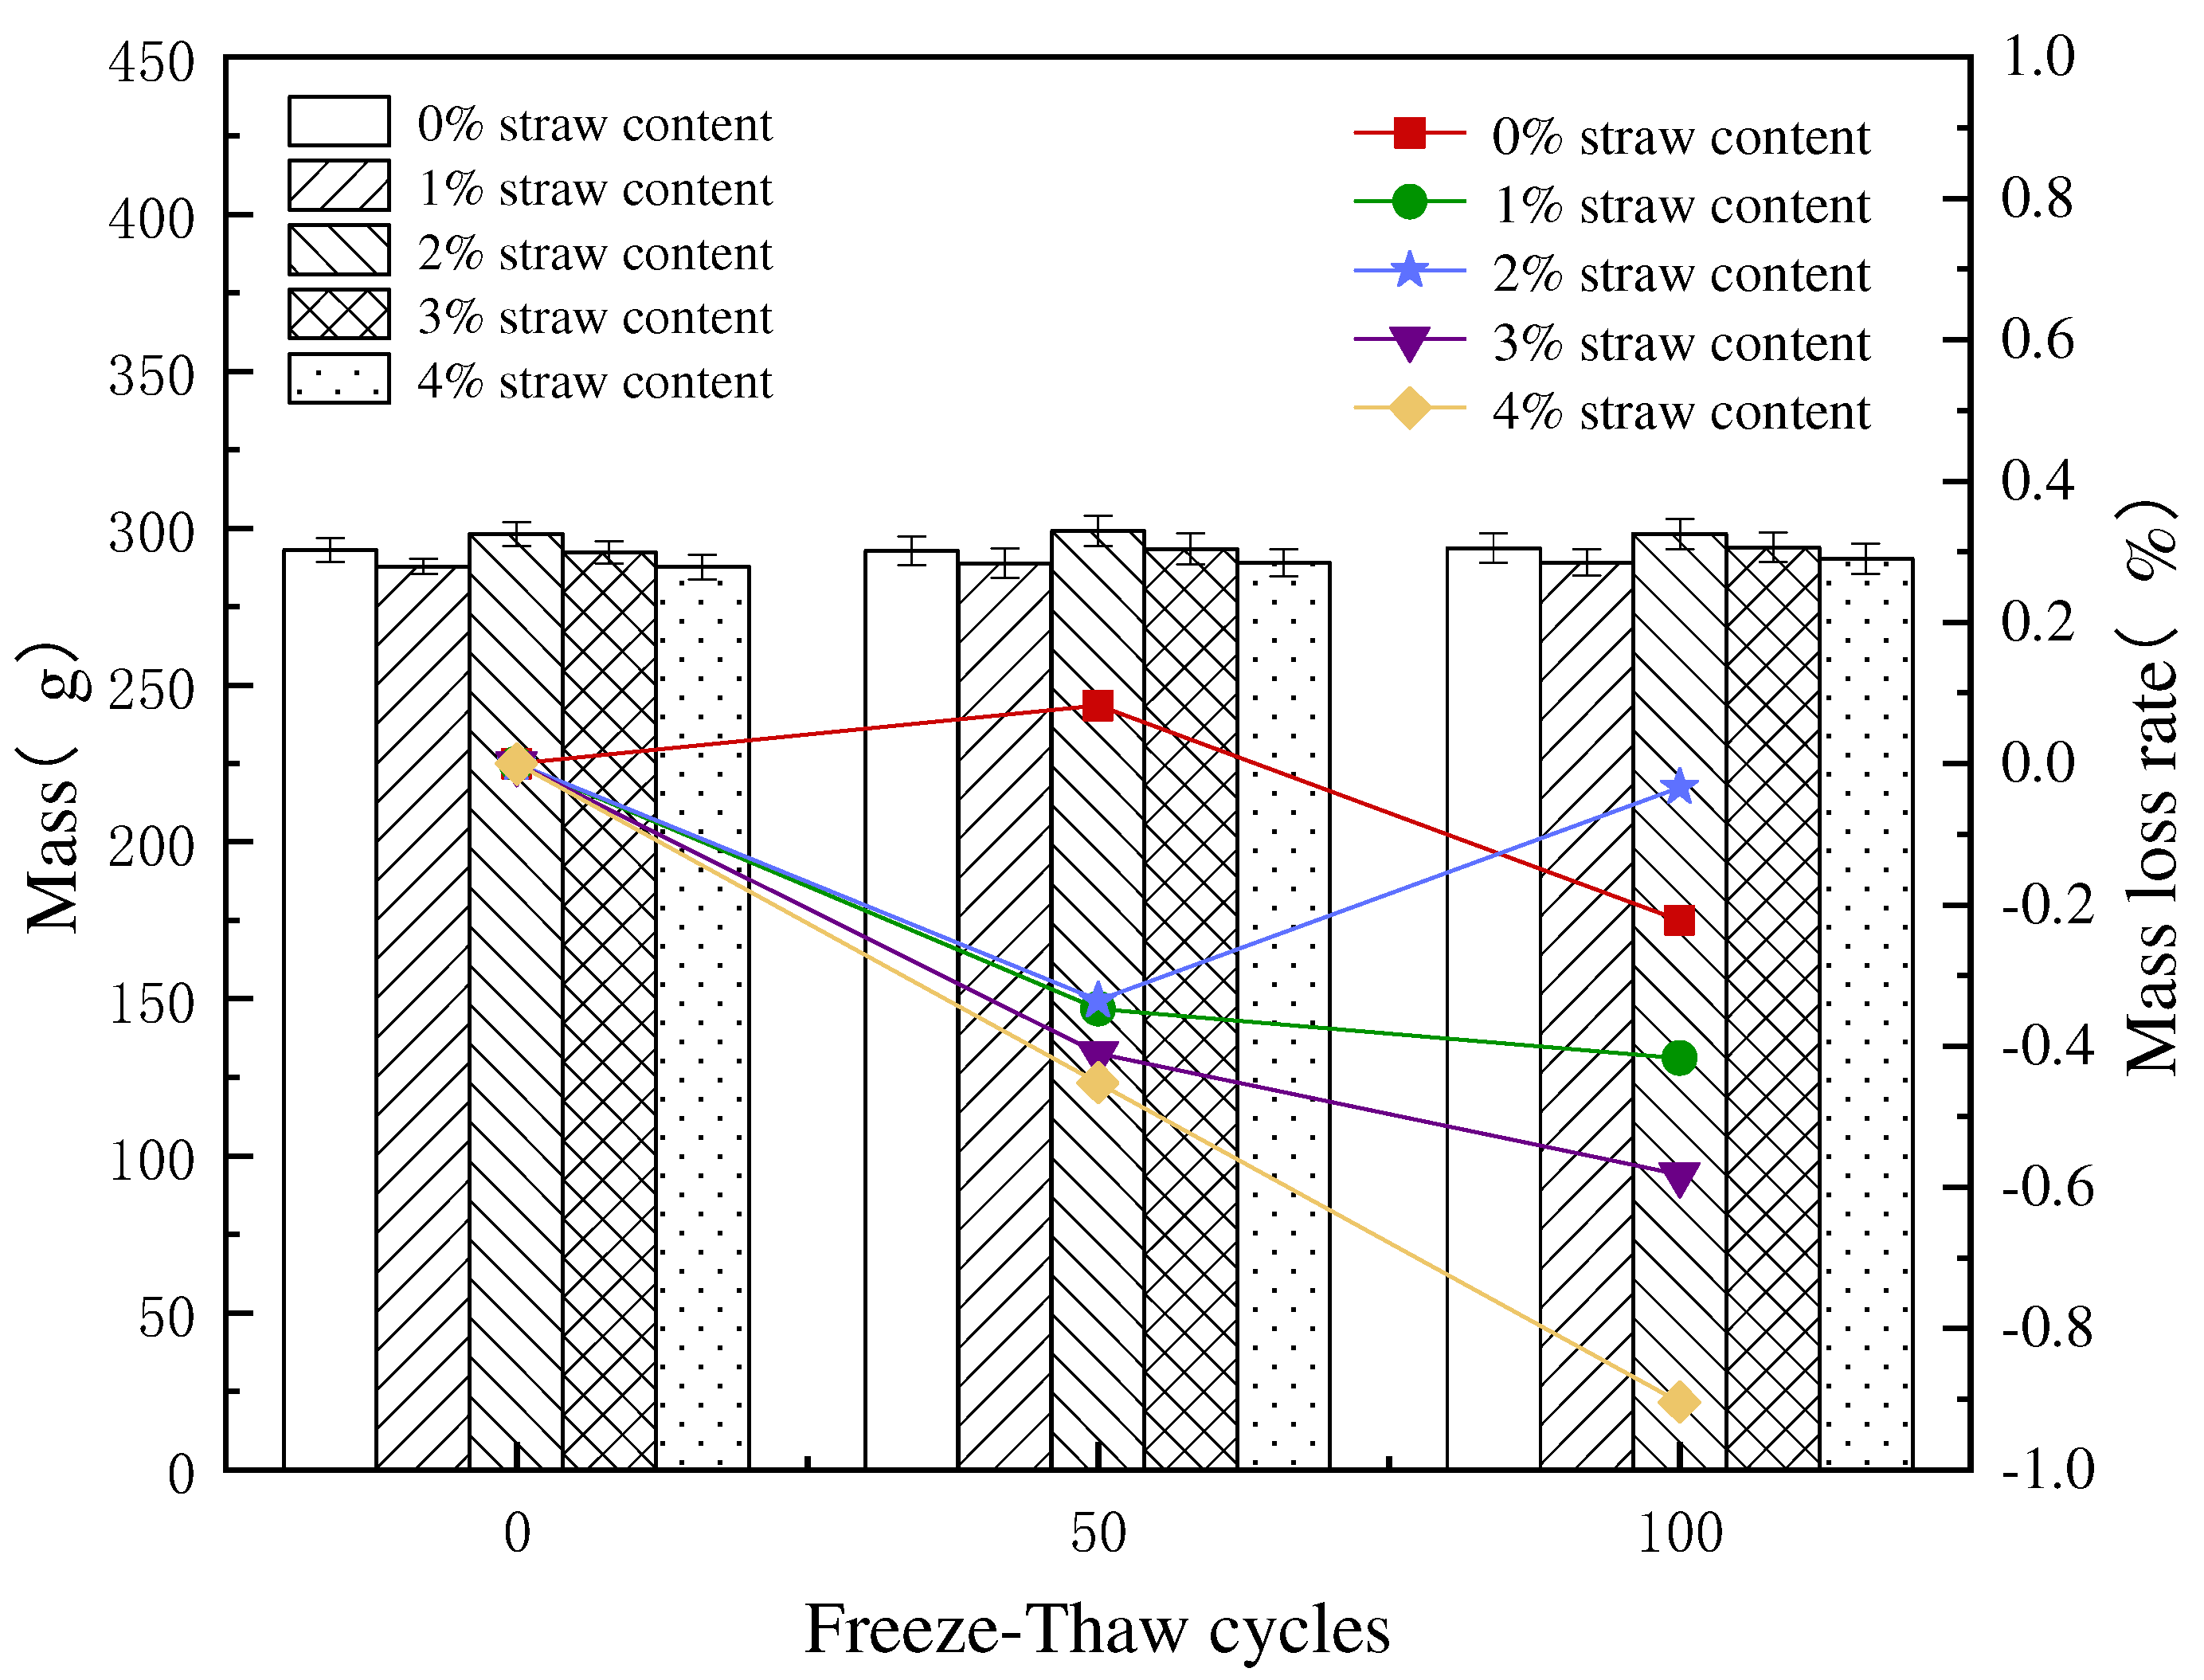
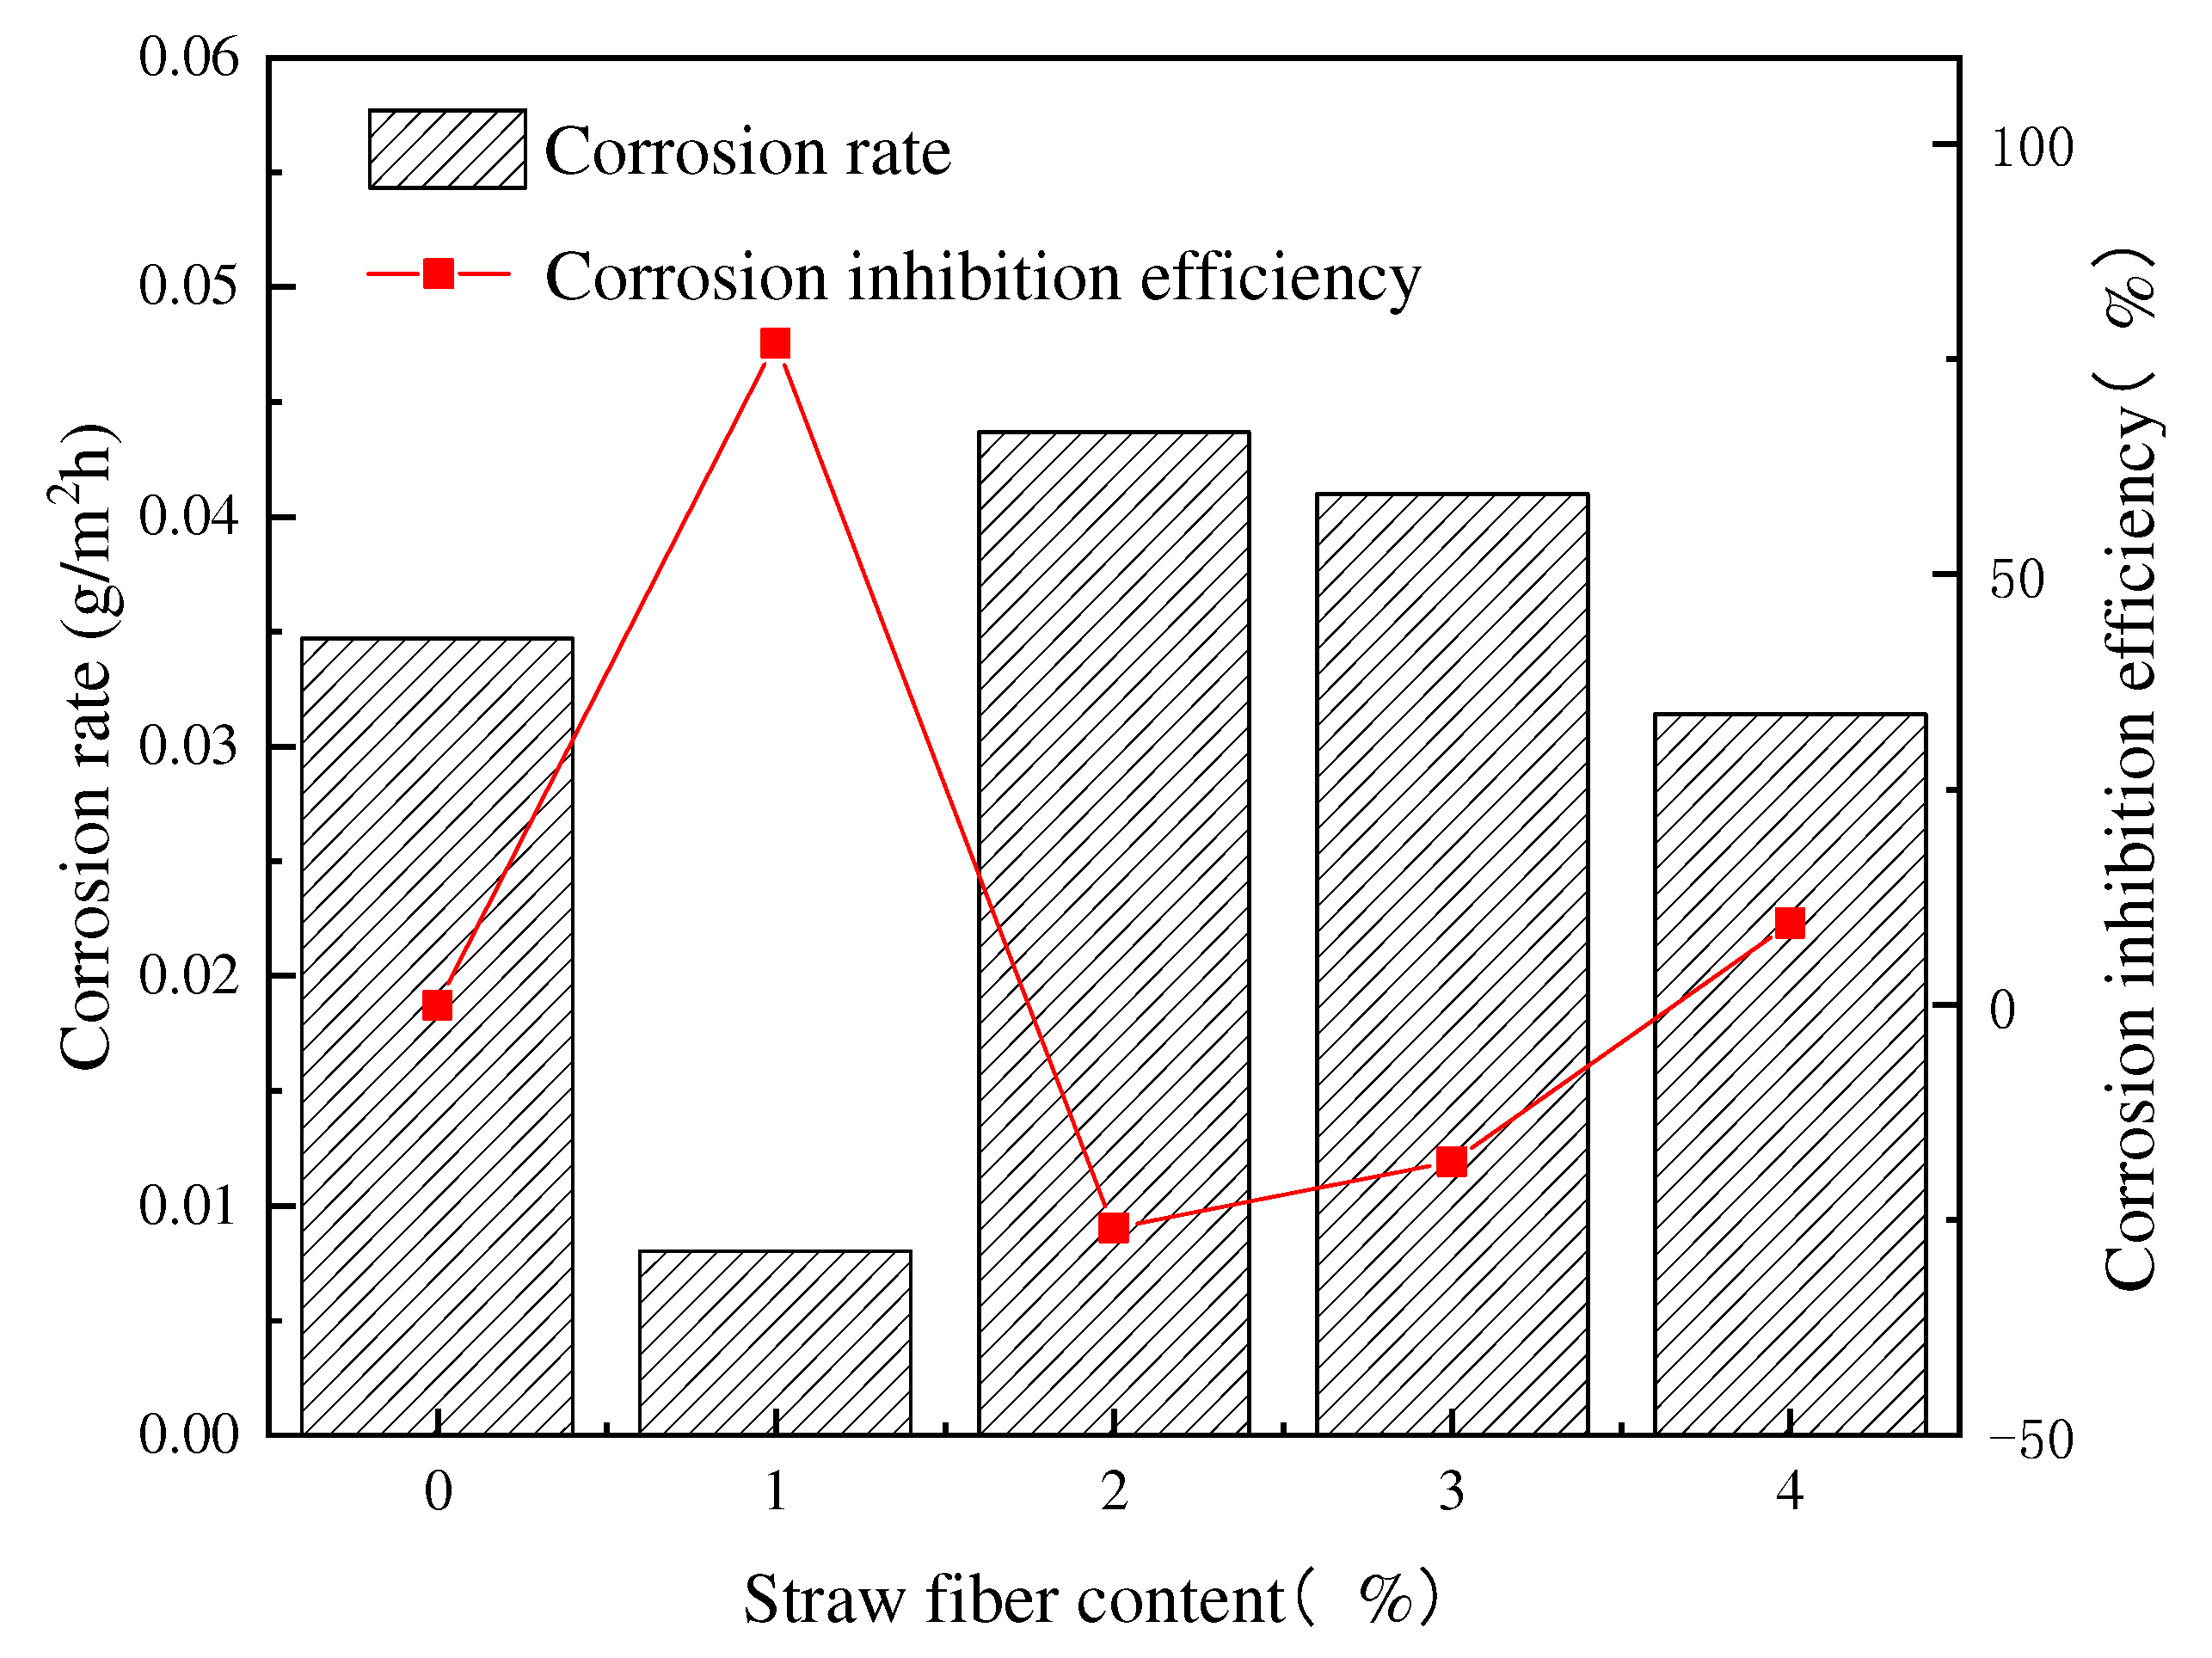
3.1. Mass Change of RPC Reinforced with Straw Fiber

Figure 6 shows the histogram of mass under dry–wet alternations and the corresponding quality loss rate with different straw fiber contents. As shown in Figure 6 below, the mass of the specimens always decreases first and then exceeds the original mass in the dry–wet alternations. The specimens with only 1% straw fiber content had almost no change in quality from 0 to 5 times of dry and wet alternations. When the specimens produce such a phenomenon, it can be concluded that the dry–wet alternations process causes specimens to shrink and swell, and the corrosion of saltwater causes the surface concrete to fall off and create small pores or cracks [26]. Moreover, the early products are wrapped on the surface of cement particles due to hydration, which restricts the contact between water and internal cement particles. Therefore, the resulting product mass is much smaller than the spalling mass, which eventually shows a decrease in mass [27,28]. While the concrete spalling caused by dry shrink and humidity expansion still occurs during the 5 to 10 times of dry–wet alternations, the mass shows a pick-up. It can be inferred that as specimens are immersed in salt water for a long time, the salt moves inside the specimens and reacts with the tricalcium aluminate, which generates crystals of calcium chloroaluminate polyhydrate, which causes the mass to gradually rise; the chemical reaction generates the product mass, which is greater than spalling quality of concrete, and eventually shows an increase in mass [29,30,31]. The reason why the mass of the specimens with 1% straw fiber content almost did not change under 0 to 5 dry–wet alternations is that straw is a kind of hollow and porous plant fiber. With the increase in content, it will lead to the augment of internal voids and defects in concrete [20]. And the dispersity of straw fiber in the cementitious matrices decreases with the increase in content [32]. From Figure 6, it can be found that with the increase in fiber content, the mass loss rate gradually increases, while the mass loss rate of 1% fiber does not change much. Therefore, it can be inferred that the 1% is the critical point for affecting the internal voids and dispersity of concrete.
Figure 7 is a chart of the relationship between mass, mass loss rate and the number of cycles under different straw fiber content during freeze–thaw cycles. It can be seen in Figure 7 that only 0% straw fiber content of the specimens in the 0 to 50 freeze–thaw cycles show a significant decrease in mass, and the rest of the specimens' mass all show an increase. It can be inferred that the content of straw fiber enables the specimens to be resistant to freeze–thaw and that the specimens’ spalling mass is significantly reduced. The reason for the curves increase may be that the oxide generated by the oxidation of the reinforcement bar causes an increase in mass. During the 50 to 100 freeze–thaw cycles, a mass drop occurs for specimens with 2% straw fiber content, and the rest of the specimens turn into an increase [33].

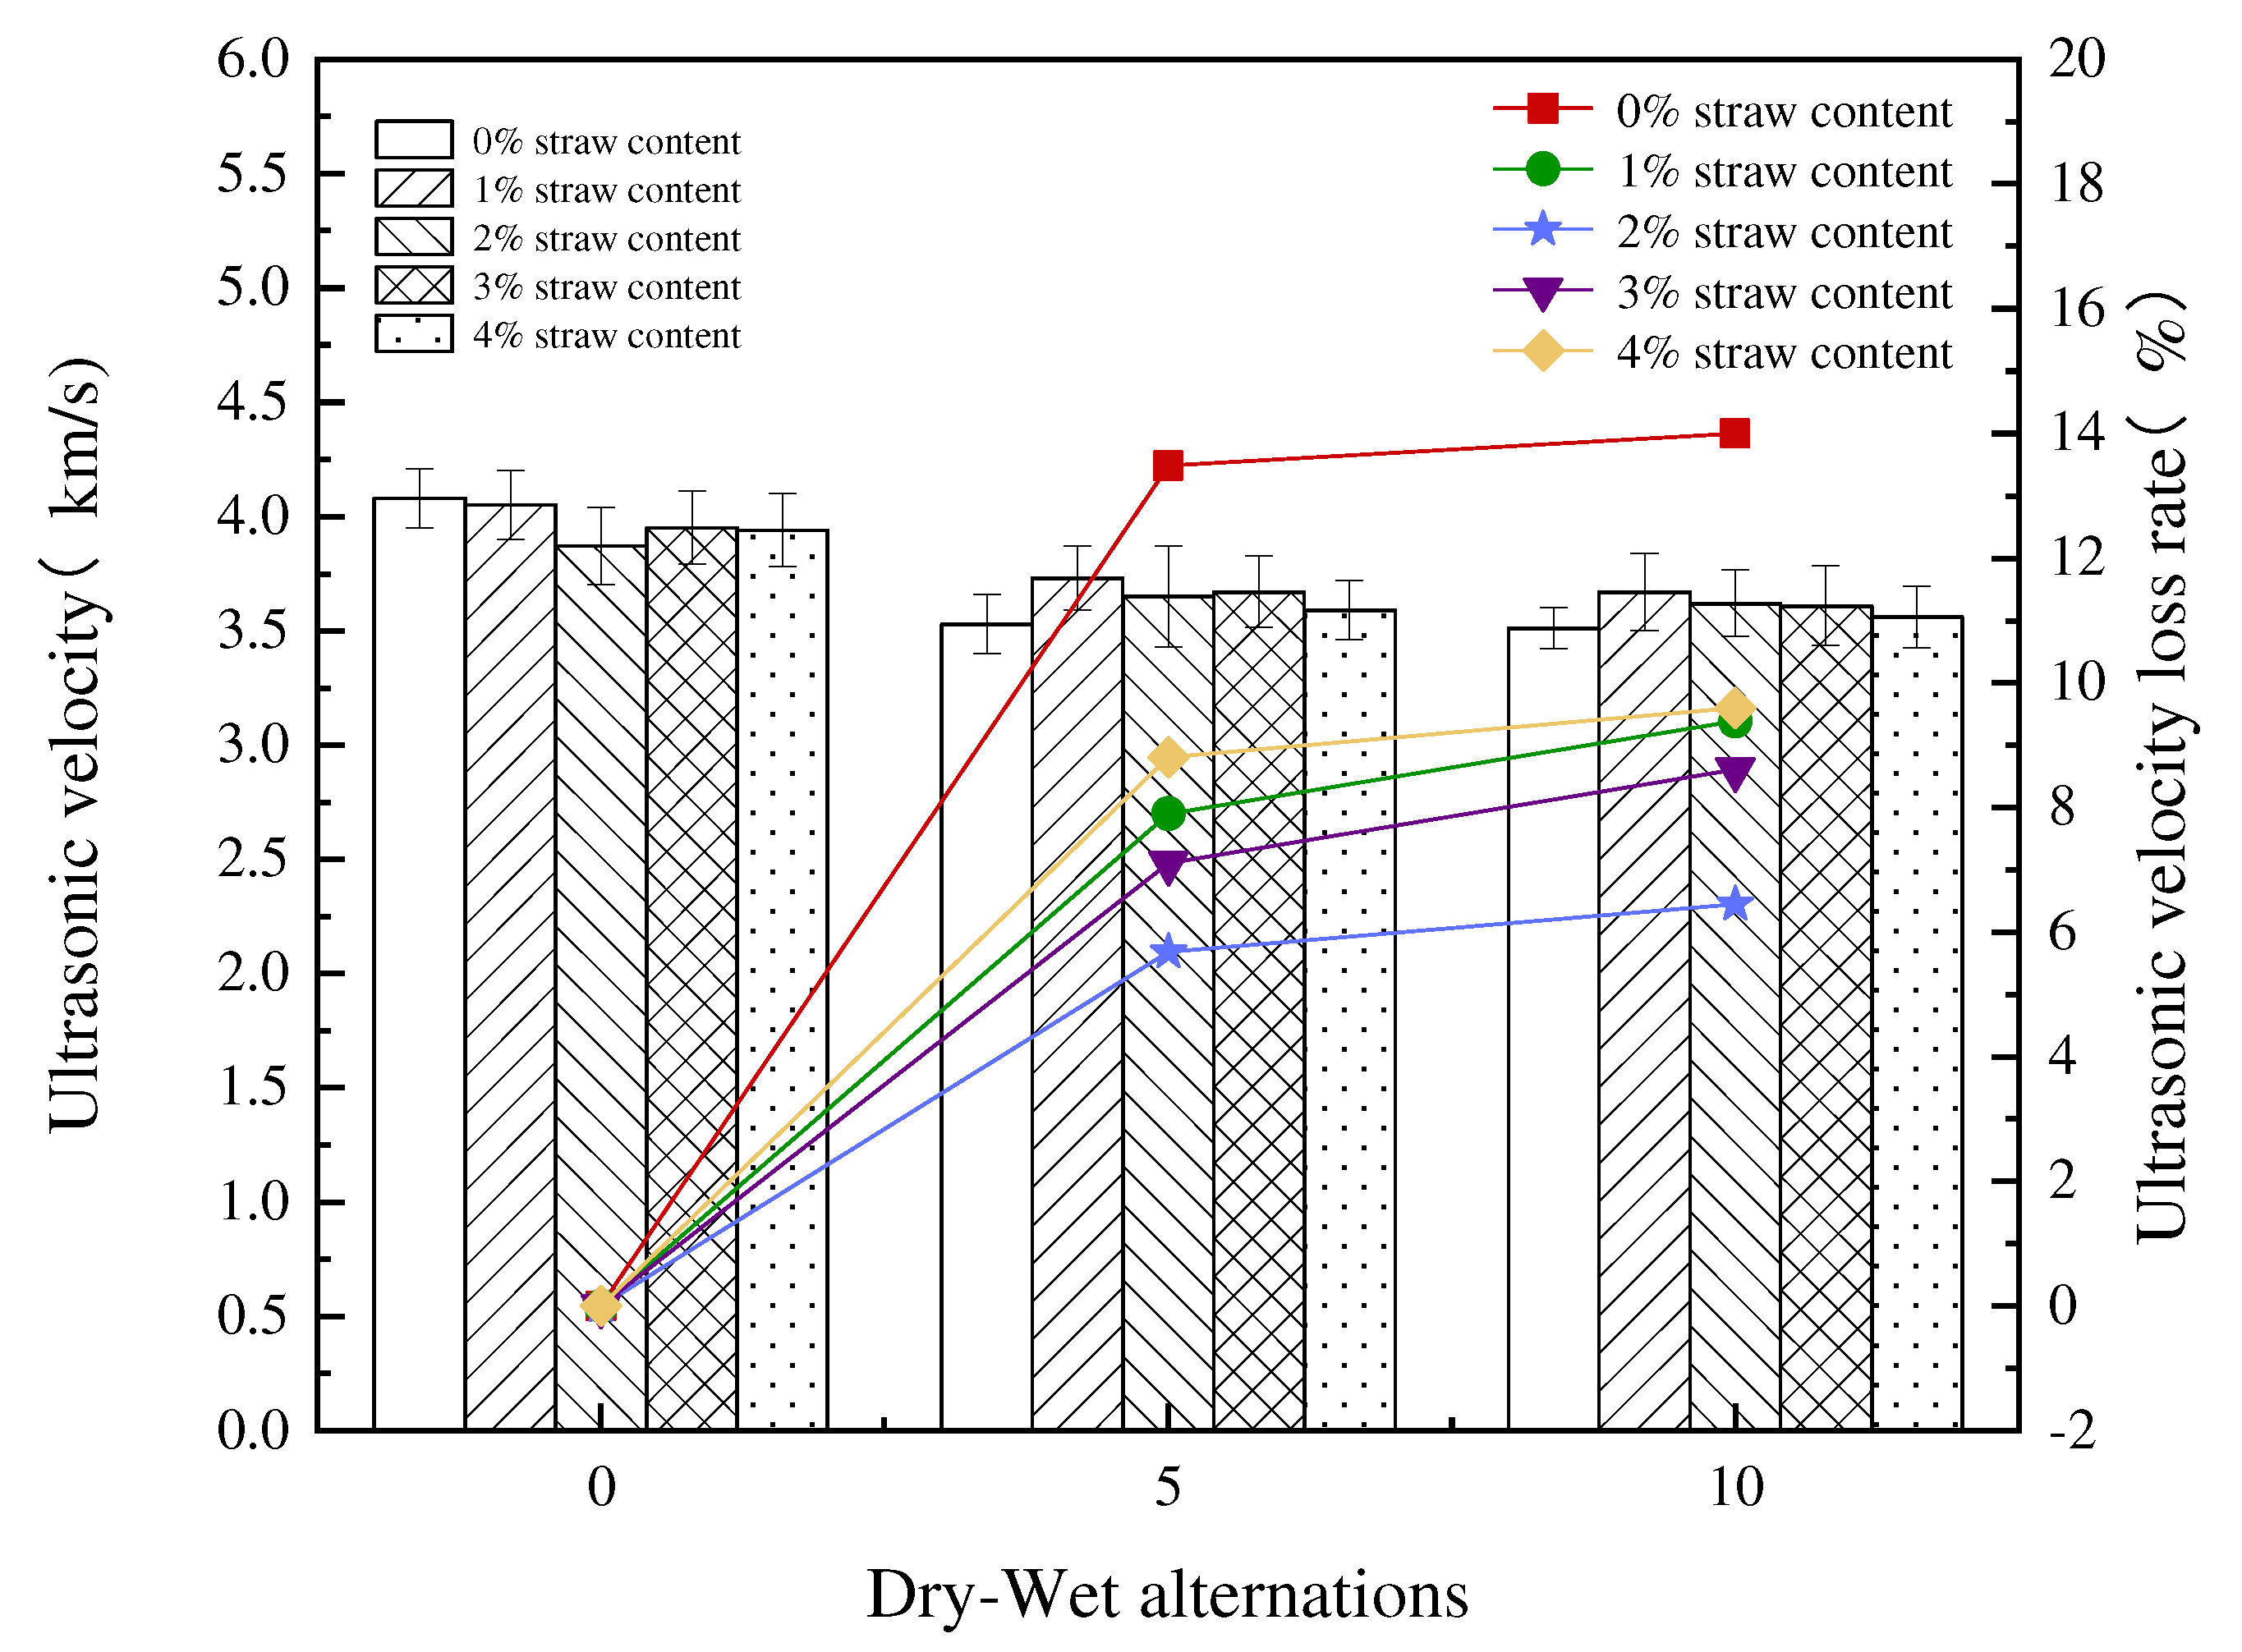
3.2. Ultrasonic Velocity of RPC Reinforced with Straw Fiber

Figure 8 shows the ultrasonic velocity and loss rate of RPC reinforced under a different content straw fiber dosage during dry–wet alternations. It can be seen in Figure 8 that in the 0 dry–wet cycles, the relationship between content and ultrasonic velocity is 0% > 1% > 3% > 4% > 2%. The analysis of the relationship between straw fiber content and ultrasonic velocity rate loss rate showed that 0% > 4% > 1% > 3% > 2% during the 0 to 5 dry–wet alternations. It represents the degree of influence of the dry–wet alternations on ultrasonic velocity. The larger the rate, the greater the influence of the dry–wet alternations [34]. It can be concluded that when straw fiber content is 0%, it is most affected by the dry–wet alternations and its internal damage is the largest [35]. Among the specimens with straw fiber content, those with 4% straw fiber content are most affected by the dry–wet alternations and the internal compactness variation is the largest. The specimens with 2% straw fiber content are least influenced by the dry–wet alternations with the smallest change of internal compactness [36,37]. Out of the 5 to 10 dry cycles, the interior is still being damaged, the damage is no longer intense but tends to be alleviated. Therefore, the loss rate of the specimens gradually decreases in this period of dry–wet alternations.
Figure 9 shows the ultrasonic velocity and loss rate of RPC Reinforced with different content straw fiber during freeze–thaw cycles. As shown by Figure 9, the ultrasonic velocity loss rate shows a sharp downward trend during 0 to 50 freeze–thaw cycles, with only a small decline in those with 4% of straw fiber content. During the 50 to 100 freeze–thaw cycles, specimens’ ultrasonic velocity loss rates all turn into a gradual growth trend, but they were still lower than the original velocity. It can be inferred that the internal voids and cracks are filled by the chemical reaction between saltwater and concrete during the 50 freeze–thaw cycles. The filling rate of products is greater than the rate of new pores and cracks, thus transforming into an increase in compaction and a decrease in ultrasonic loss rate. However, the damage to freeze–thaw progresses further during the 50 to 100 freeze–thaw cycles and the fracture damage gradually extend from the inside to the surface. Some of the internal voids are filled with chemical products, but the surface concrete cracks, and pore chemical products cannot be filled [38,39]. Therefore, there will be more negative effects of the freeze–thaw destruction than positive influences of chemical products filling voids and cracks.

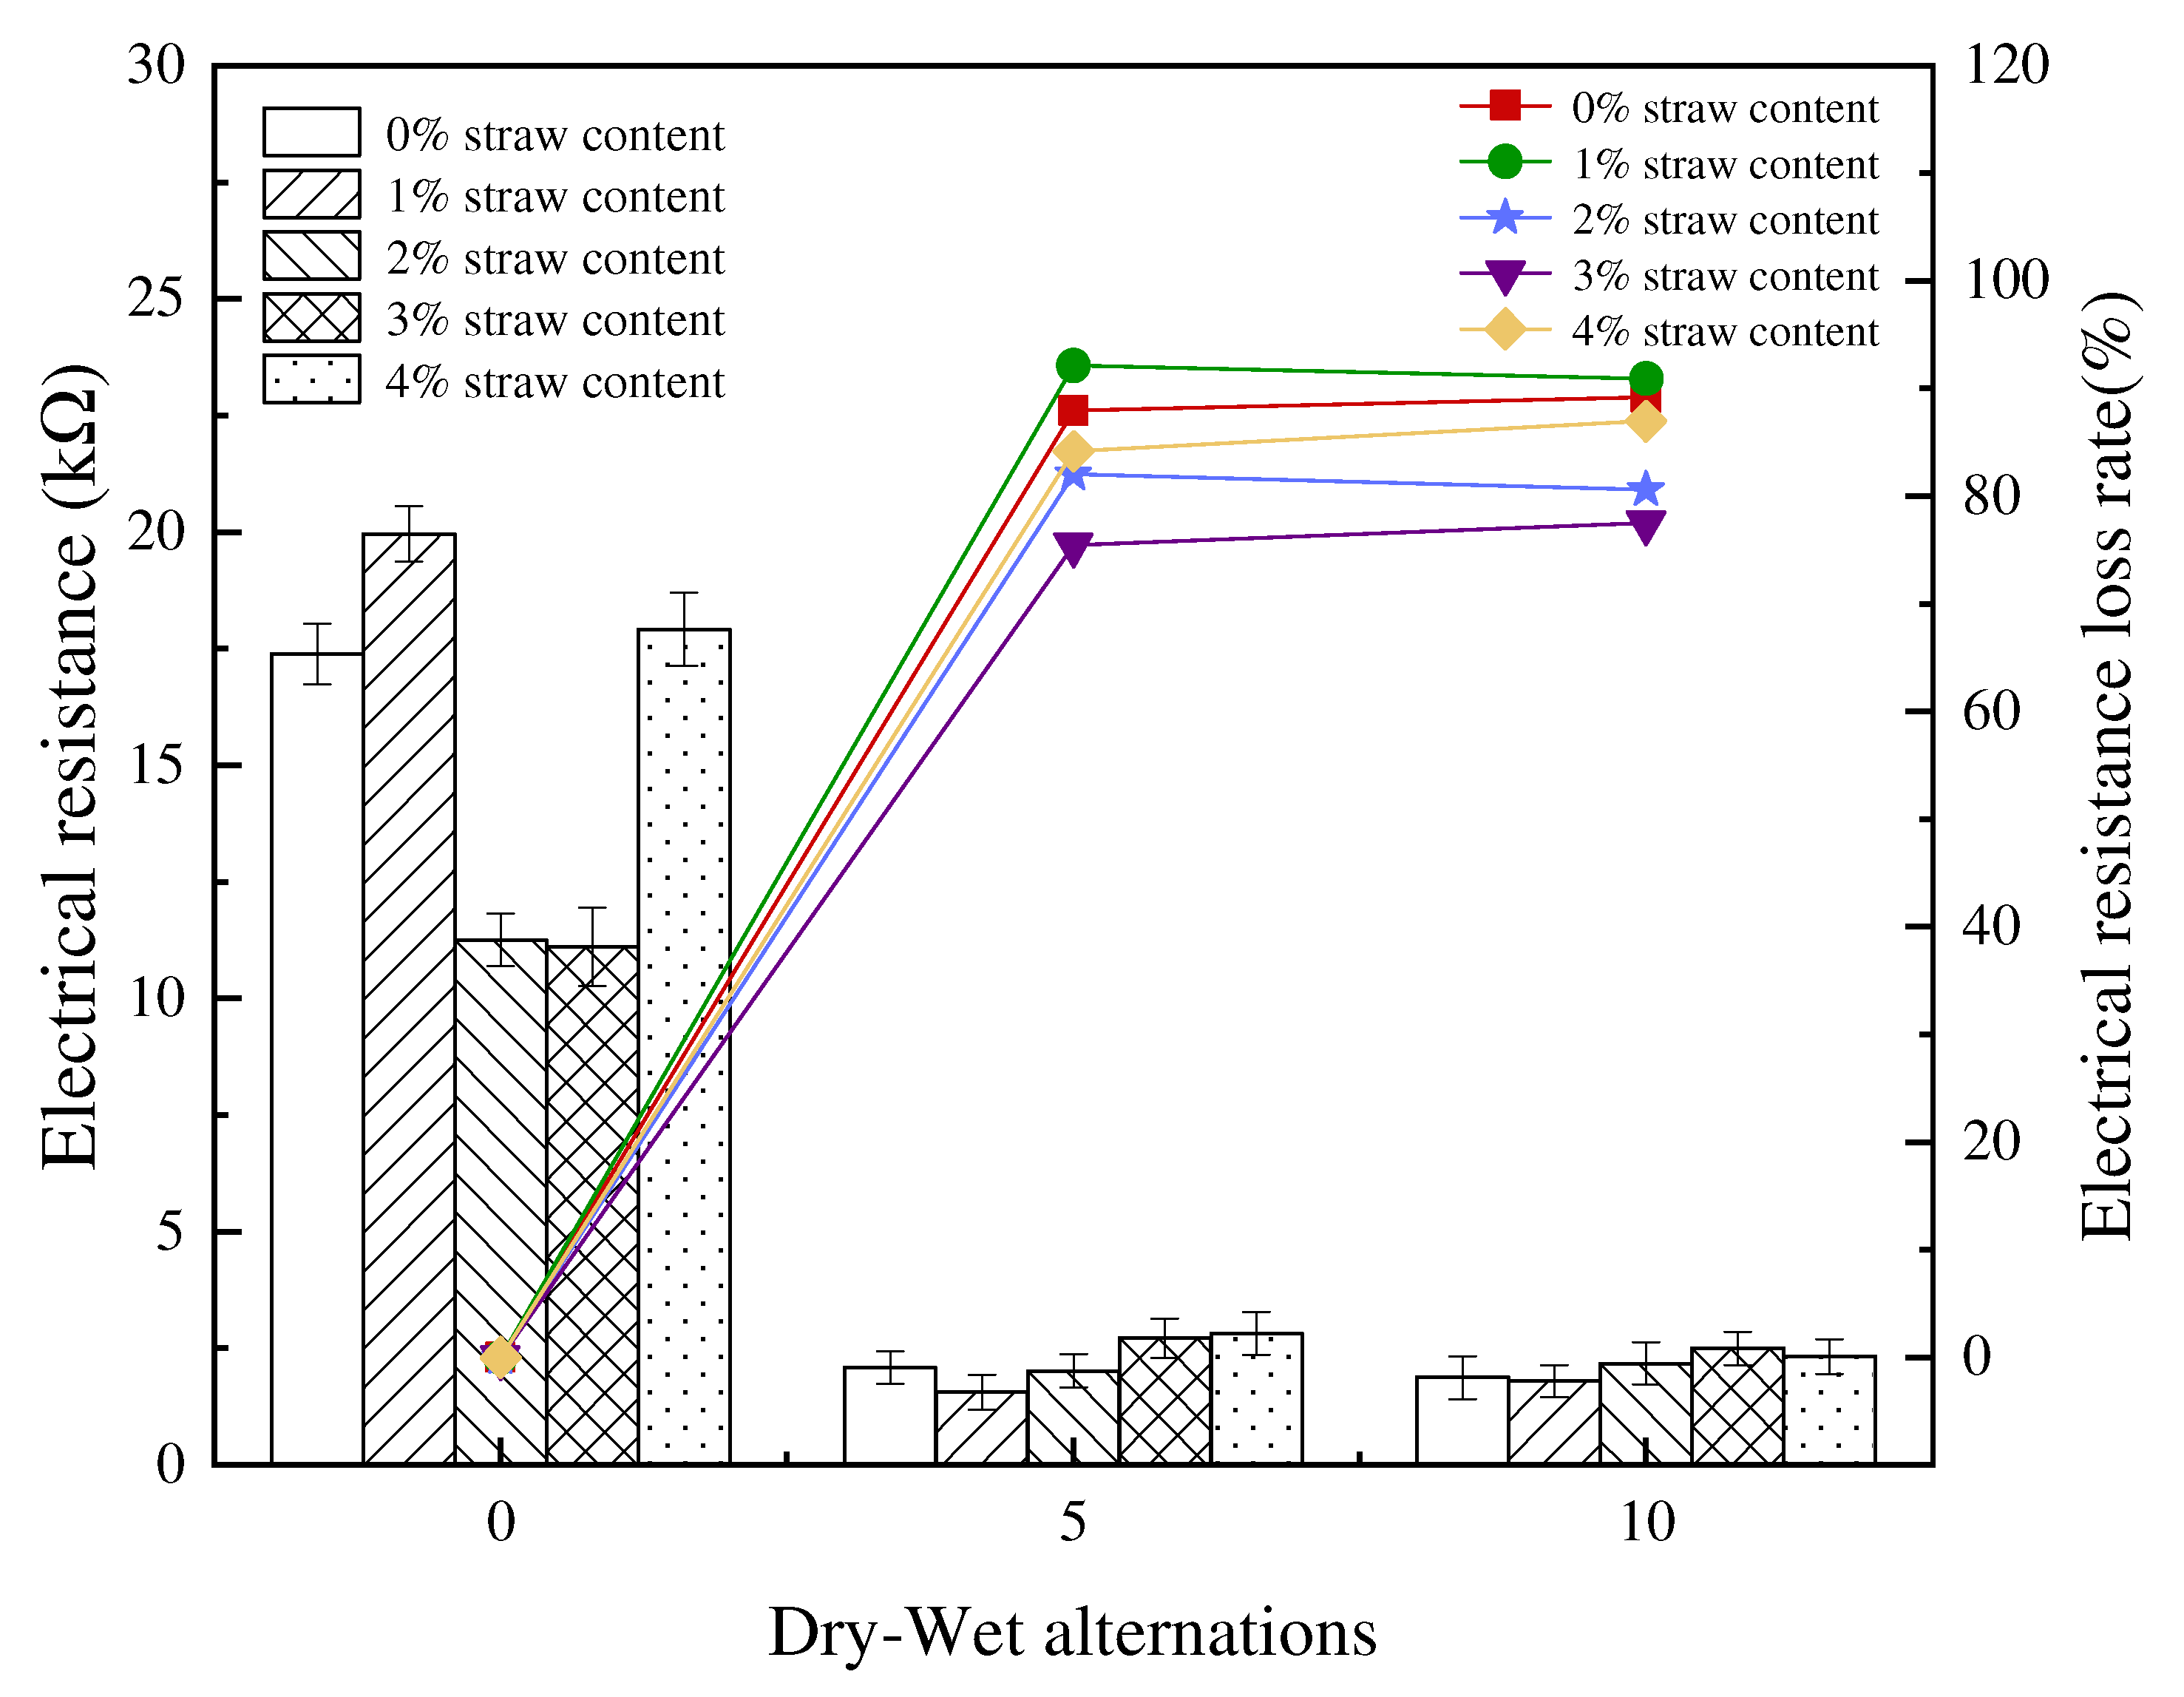
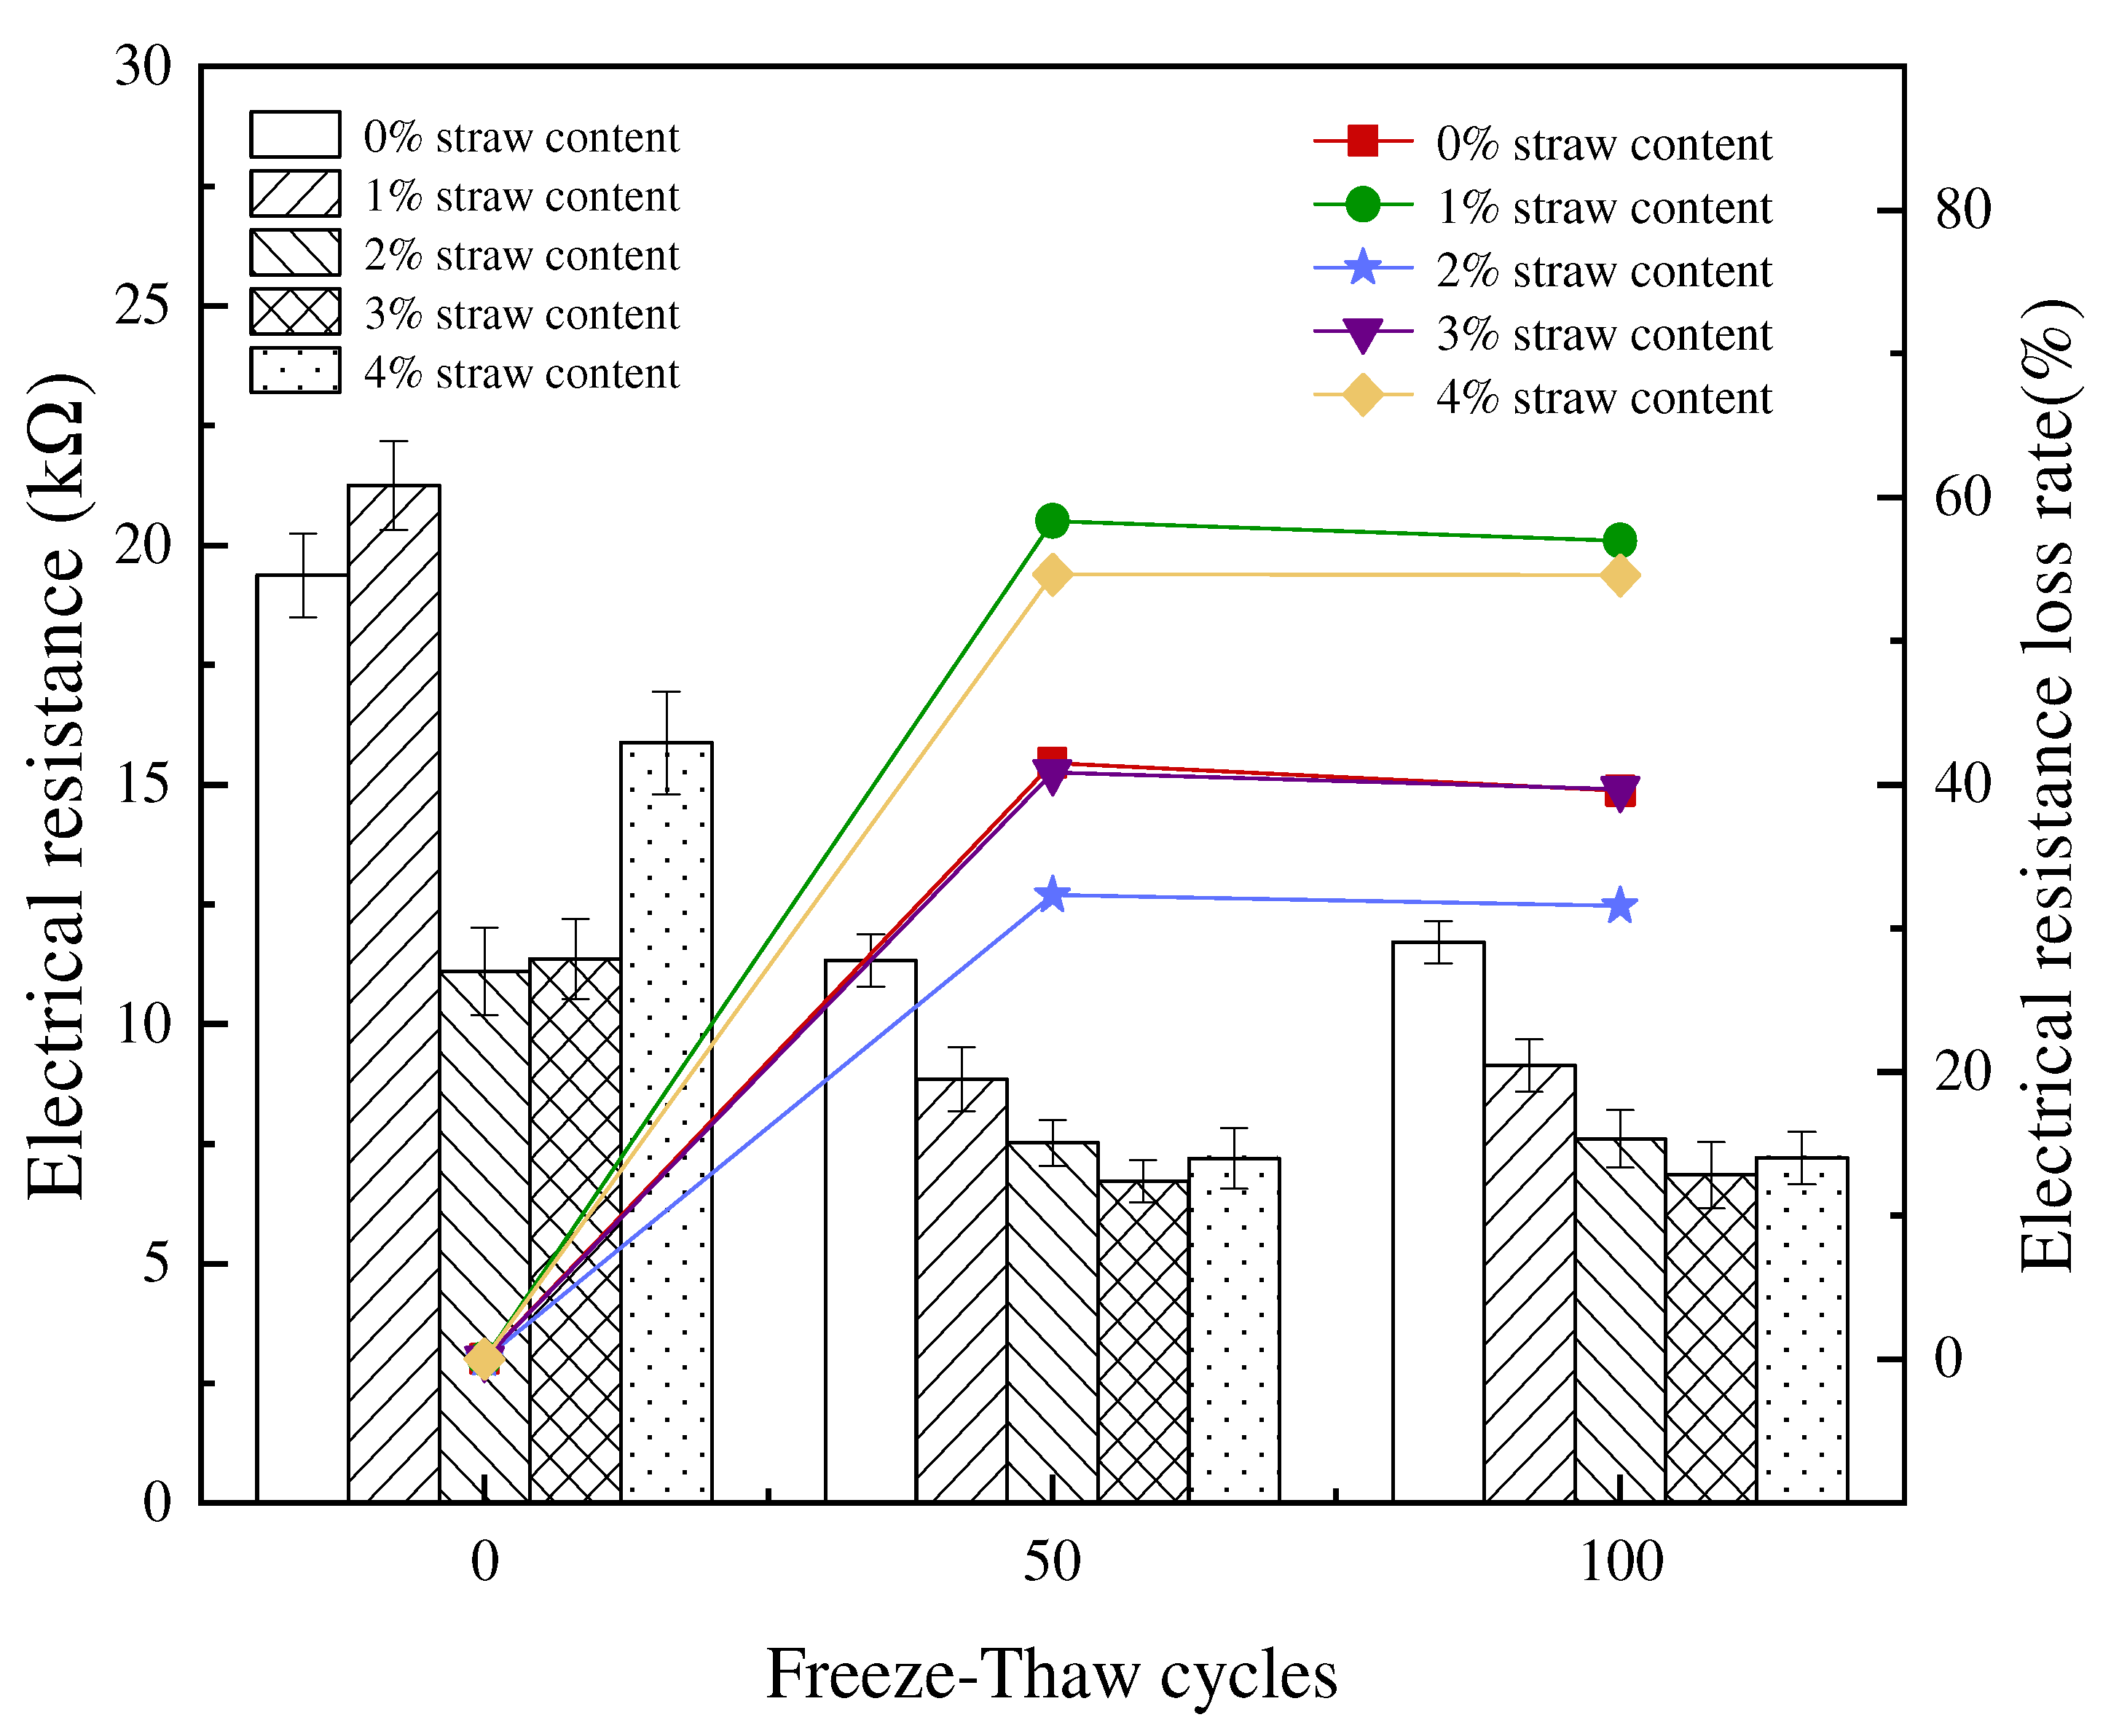
3.3. Electrical Resistance of RPC Reinforced with Straw Fiber

Figure 10 shows the electrical resistance and loss rate of RPC reinforced with different contents of straw fiber under dry–wet alternations. As shown in the following Figure 10, the electrical resistance of cement paste declined linearly as the number of cycles ranged from 0 to 5 dry–wet alternations. This was attributed to the fact that chlorine ions enter the interior of concrete and respond with the tricalcium aluminate. Inside that, aluminate polyhydrate crystals are formed and a variety of crystals are generated by hydrate [30,31]. It fills the internal gap and enhances its electrical conductivity which leads to a large reduction in the electrical resistance of the specimens [40]. For five groups of specimens with different amounts of straw fiber content, the loss rate of electrical resistance reaches almost 80%–90%, and electrical resistance is only 10%–20% of the original scale. Moreover, with the increase in the number of dry–wet alternations, the generated various crystals gradually filled the internal voids and tended to be stable, so the electrical resistance did not change significantly during the process of 5 to 10 dry–wet alternations.
Figure 11 shows the electrical resistance of RPC reinforced with different straw fiber content during freeze–thaw cycles. Electrical resistance is associated with the number, micro size, and degree of the hole communication of cement paste [41]. And the higher the internal compactness, the higher the electrical resistance [40]. Therefore, it is shown in Figure 11 that the internal compactness of specimens with 1% straw fiber is the highest. The electrical resistance loss of all specimens shows a significant drop of 50%–70% from the 0 to 50 freeze–thaw cycles; it can be inferred that in the early stage of the entire freeze–thaw cycle, fewer products are generated by the chemical reaction of salt water with cement paste, and the number of cracks and pores generated by the freeze–thaw cycles is rising [42,43,44]. As a result, its internal compactness decreases, so does its electrical resistance. However, from the process of 50 to 100 freeze–thaw cycles, the electrical resistance changes little and is almost similar to the 50 freeze–thaw cycles. In the late stage of the freeze–thaw cycles, the growth rate of the cracks and pores generated is steadily slowed down, and the products generated due to chemical reactions will fill the pores and cracks, stopping the solution from penetrating again. The internal compaction stabilizes and the internal chemical reaction lags behind, the product generated increases slowly, the new electrolytic solution increases less, and the conductivity changes little [45]. So, the electrical resistance is almost the same.

3.4. Electrochemical Corrosion of RPC Reinforced with Straw Fiber

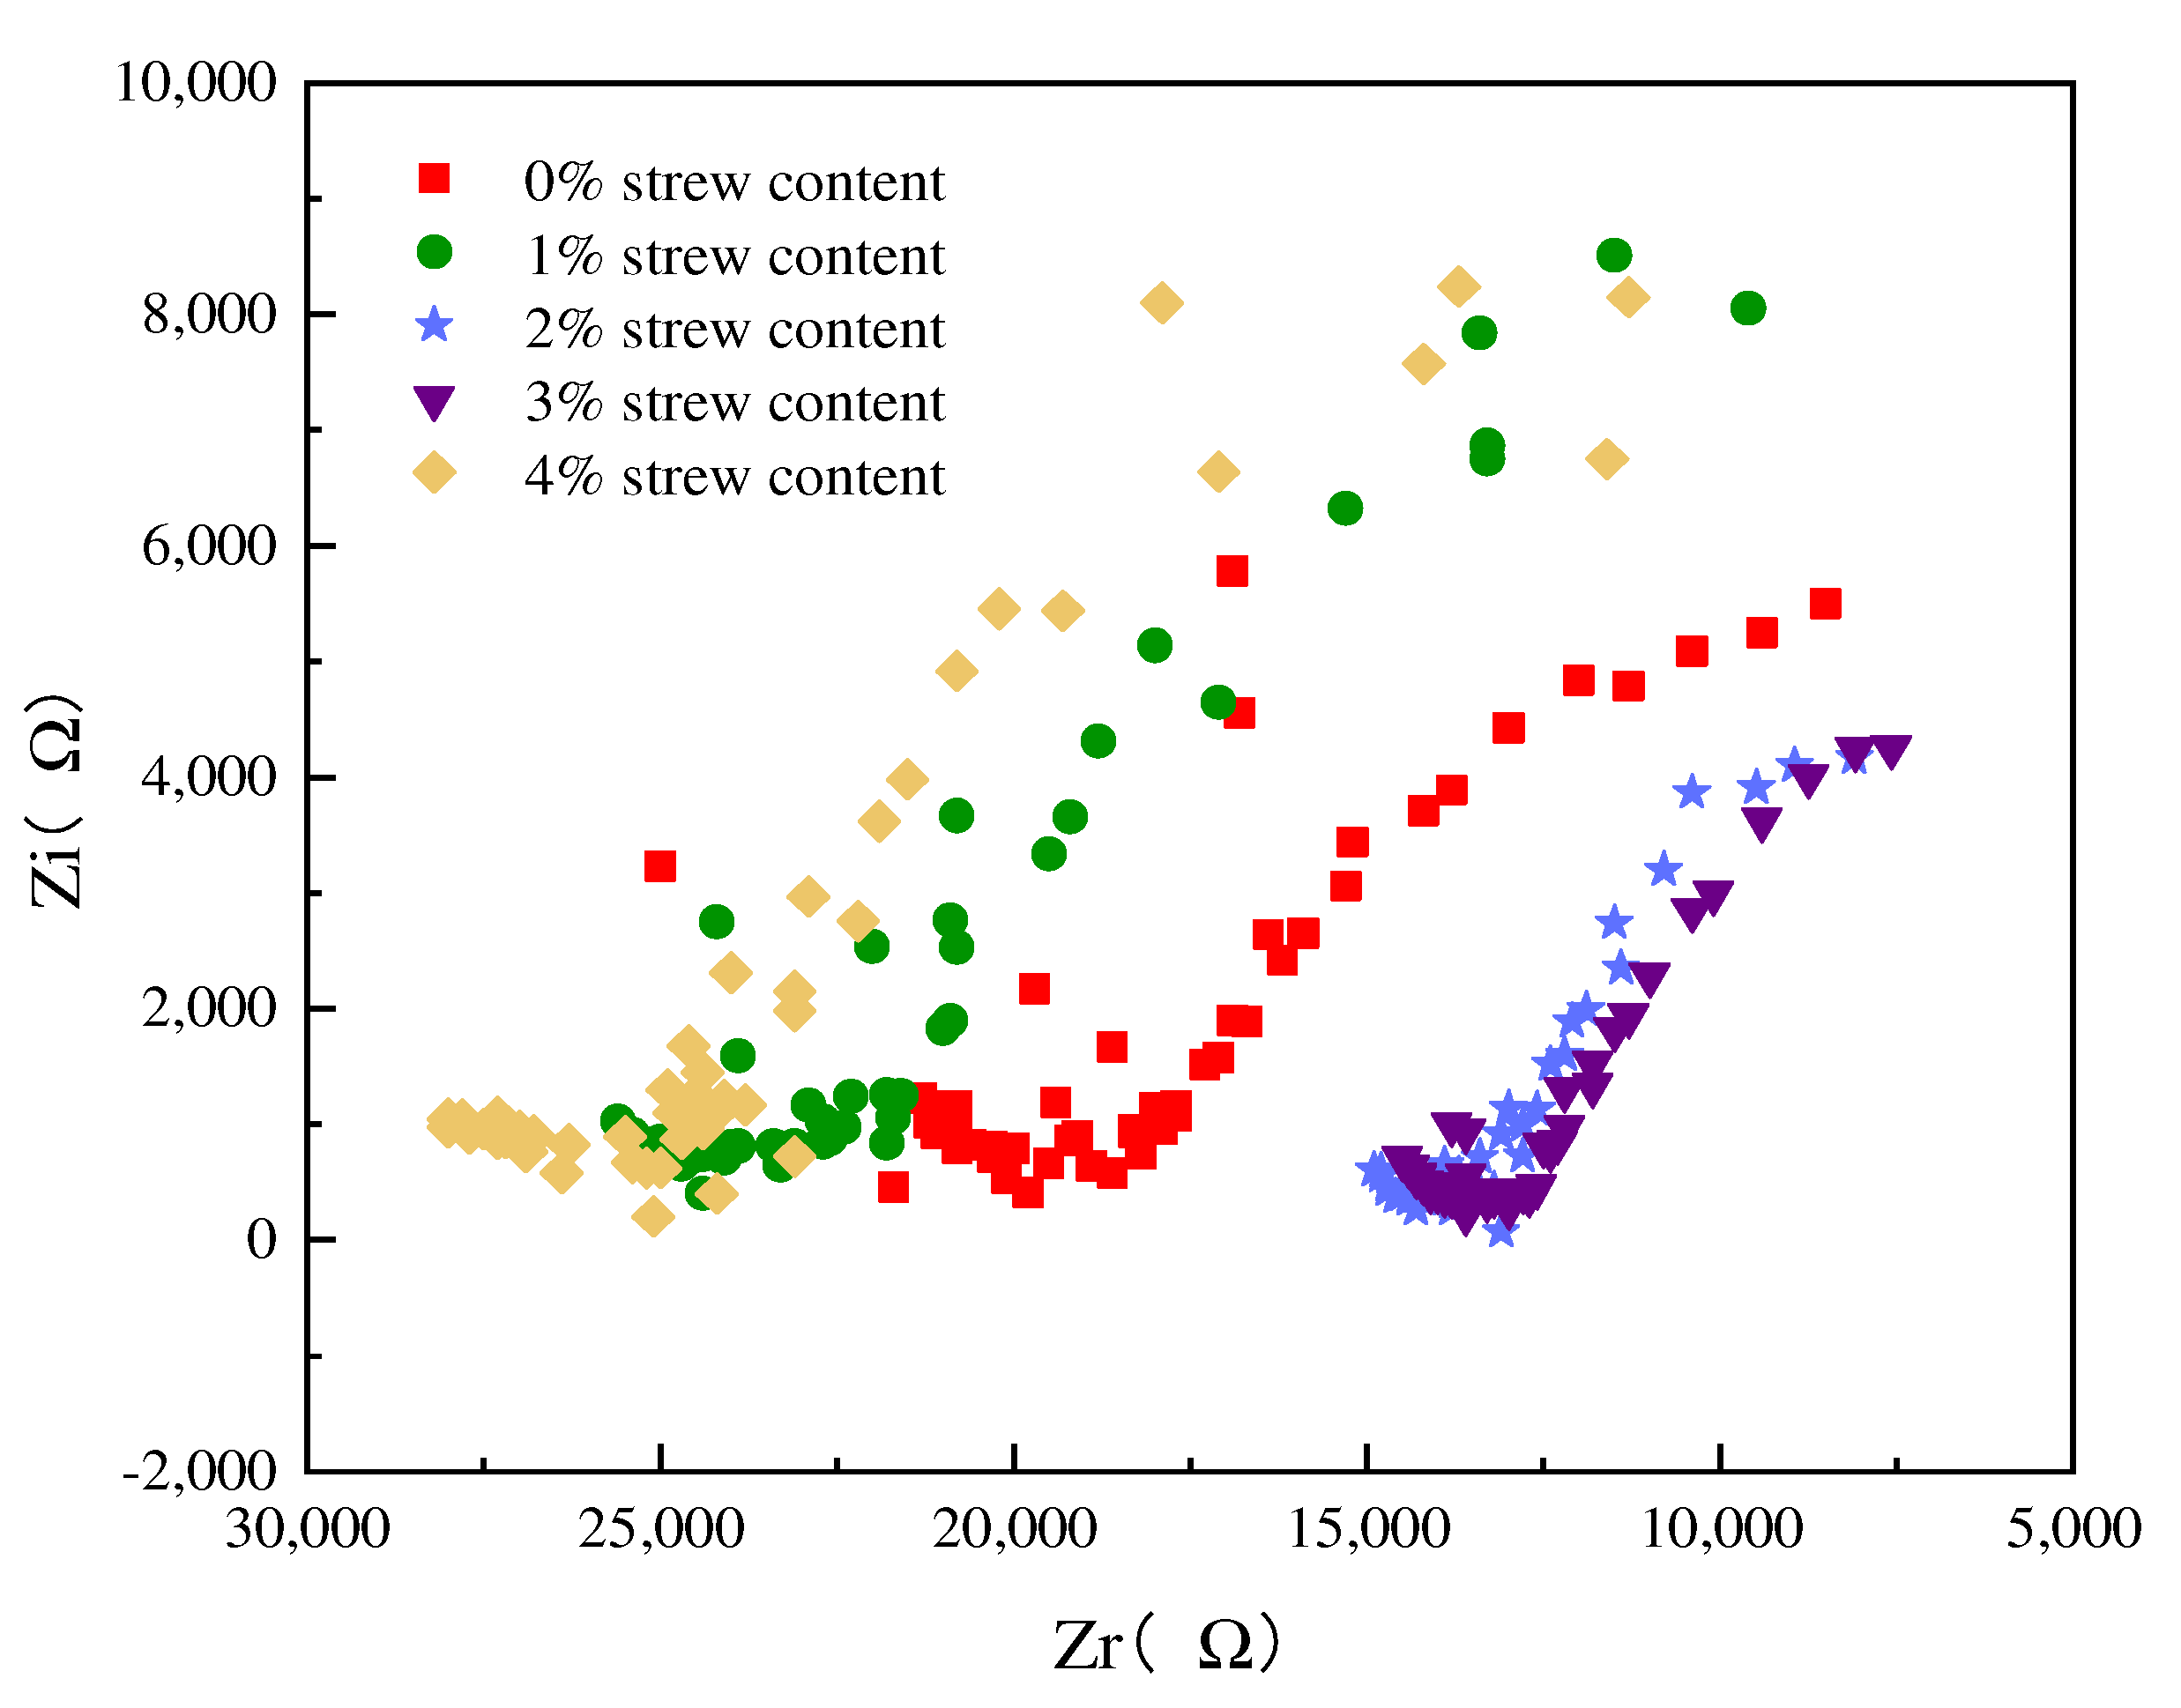
3.4.1. AC Impedance Spectrum
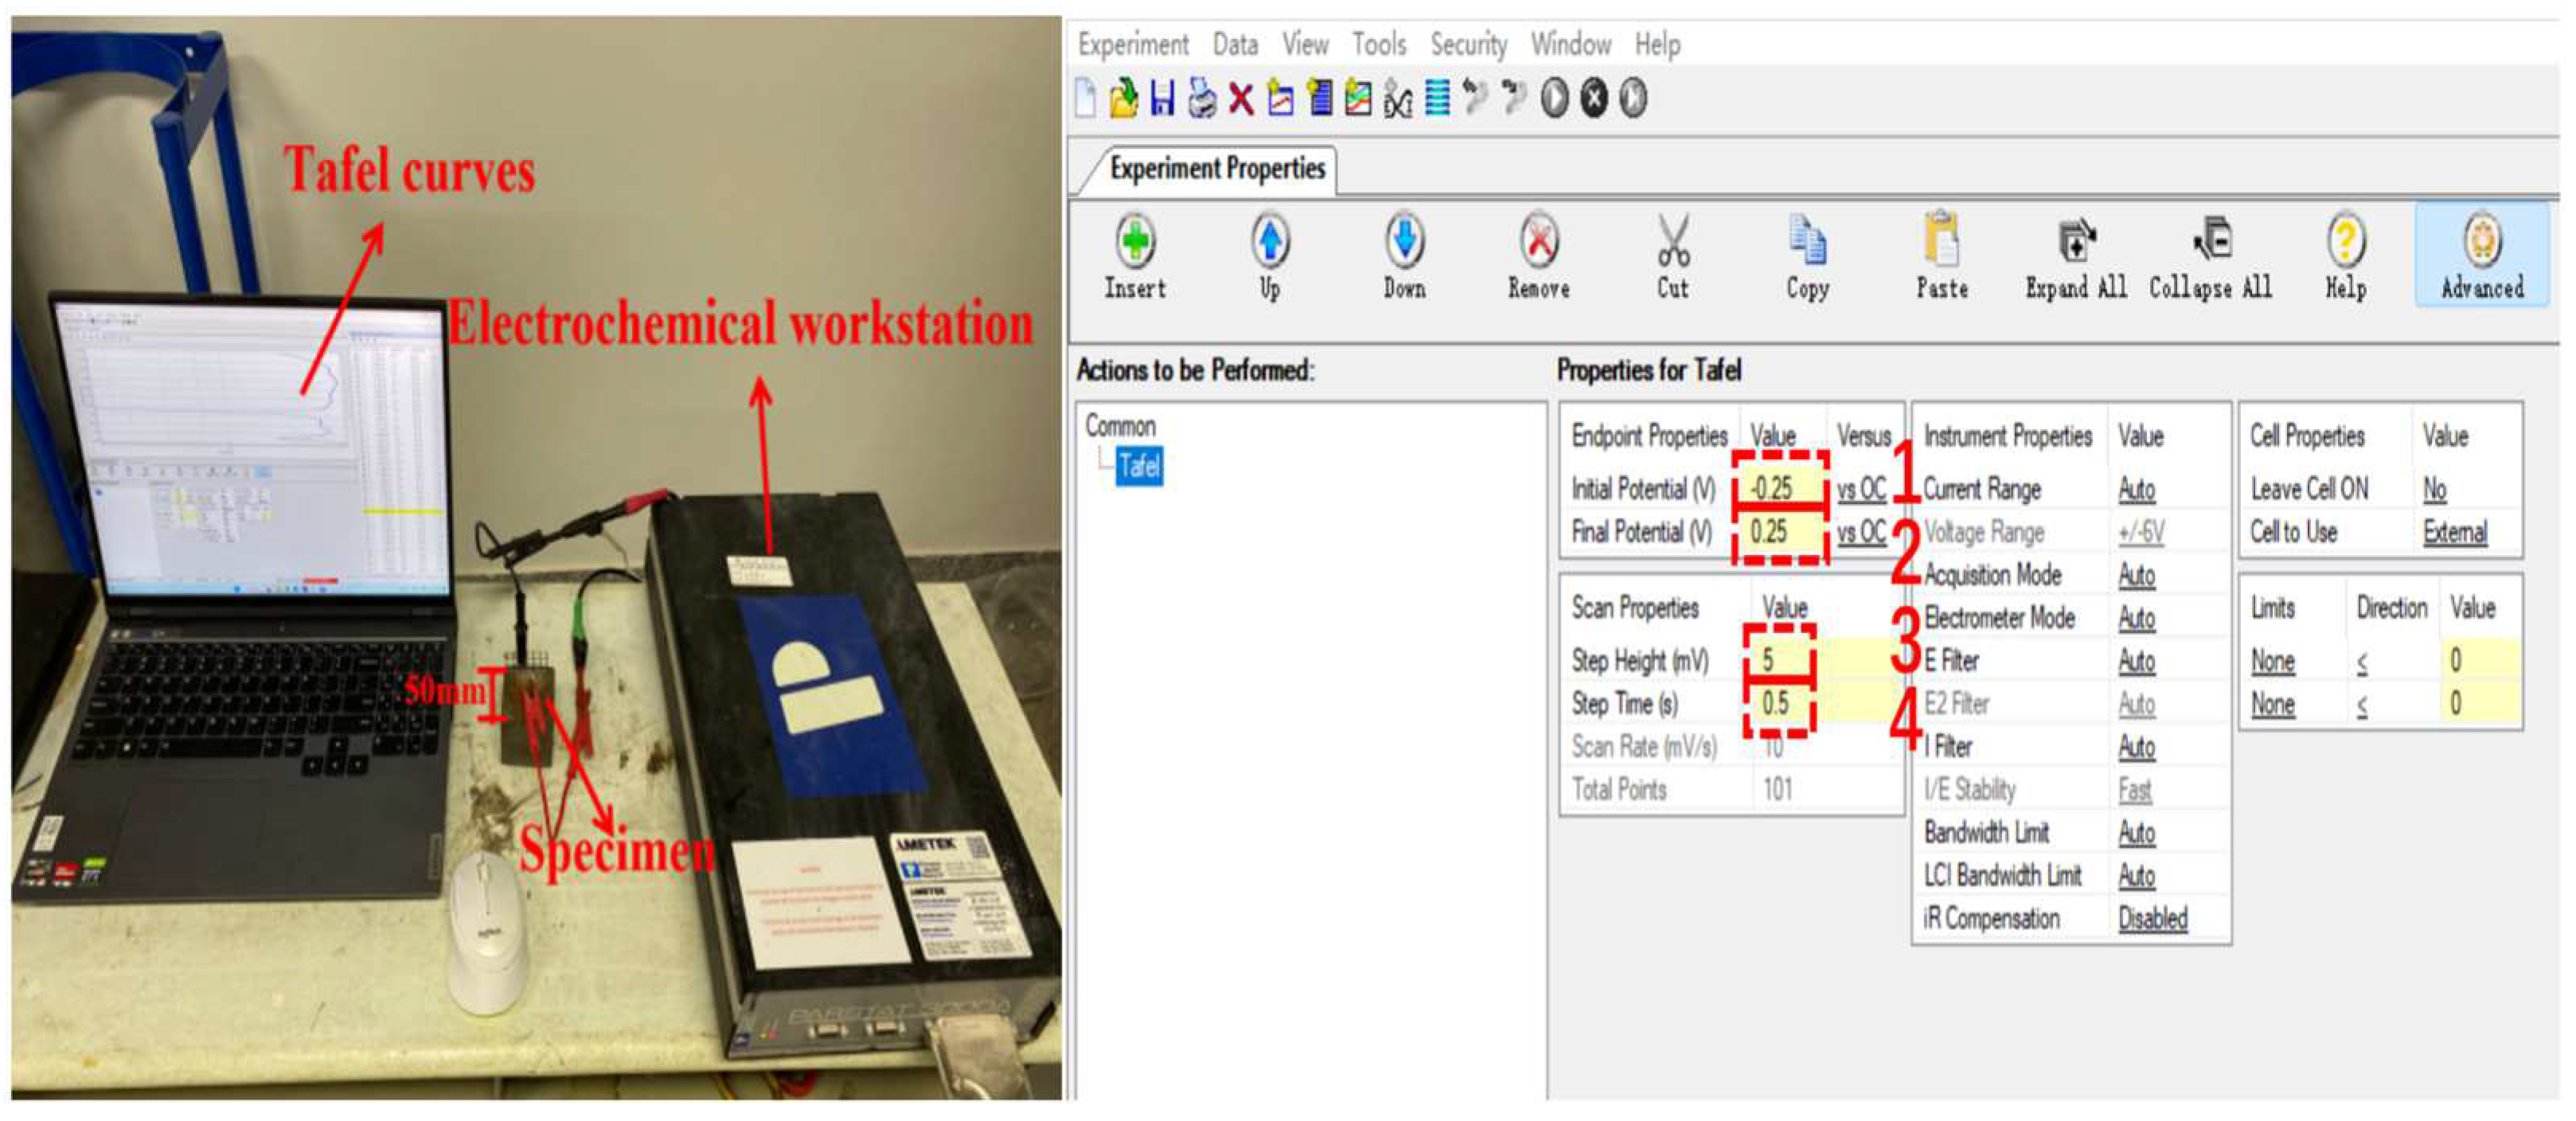
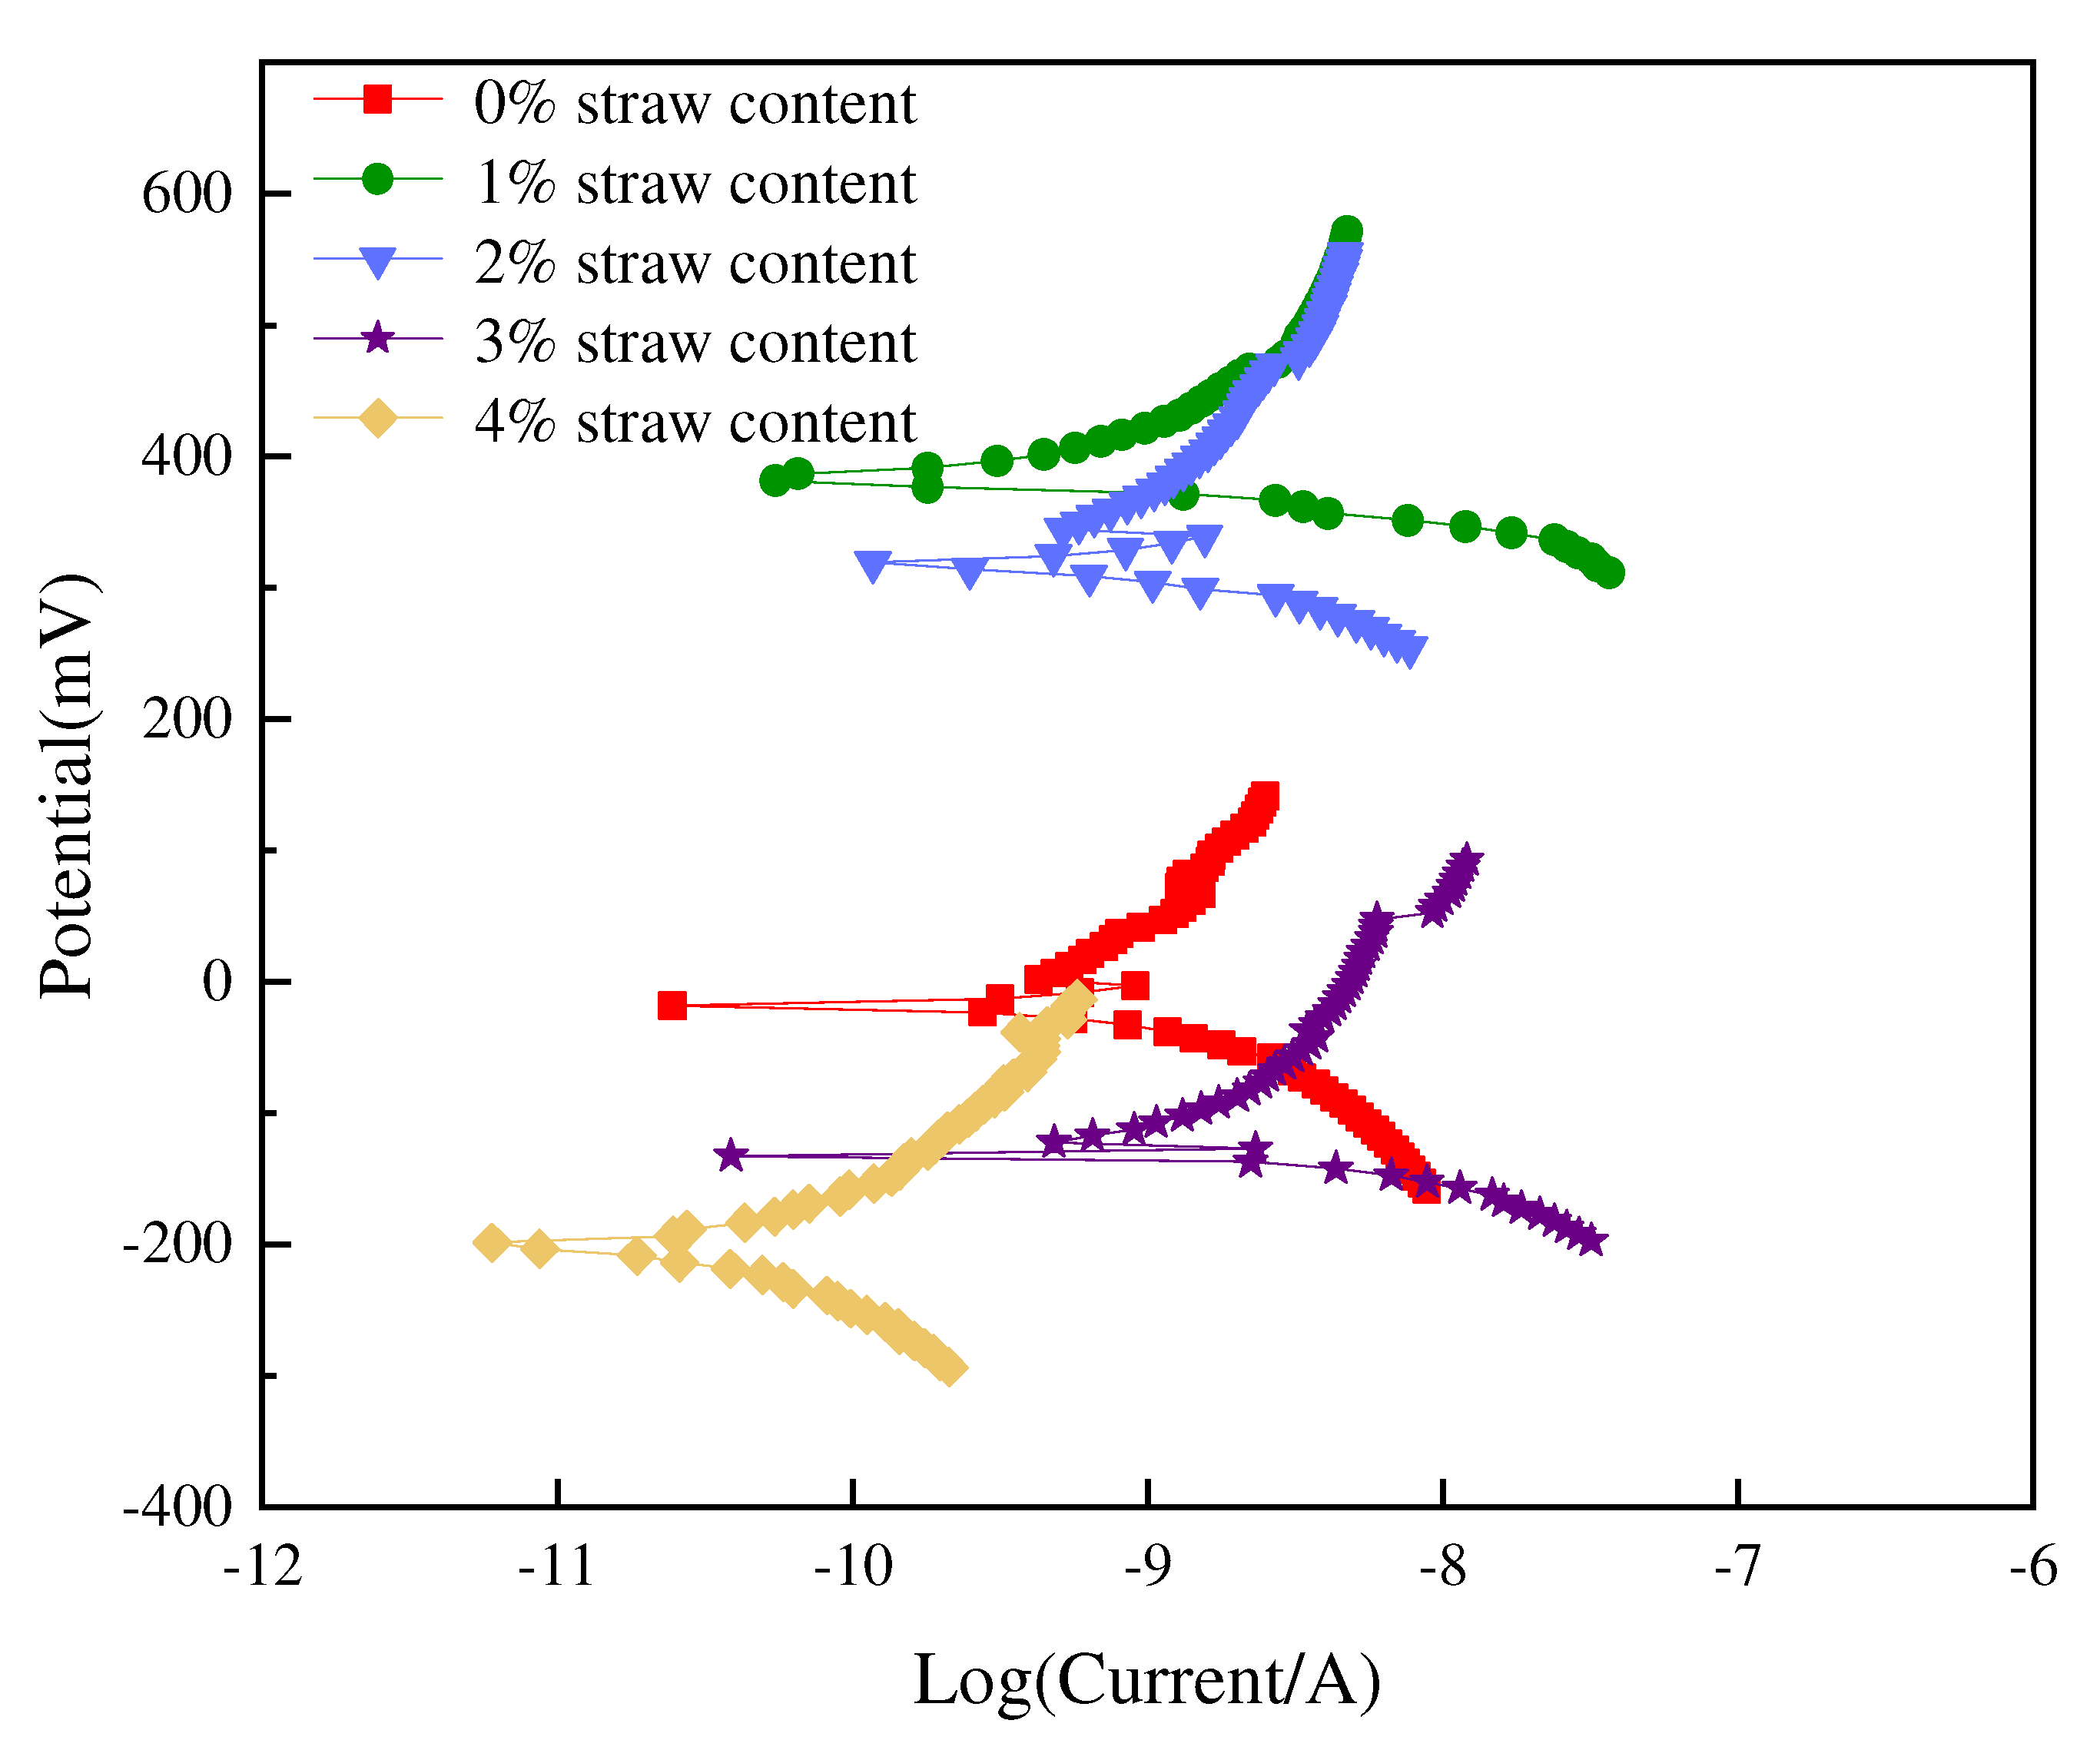
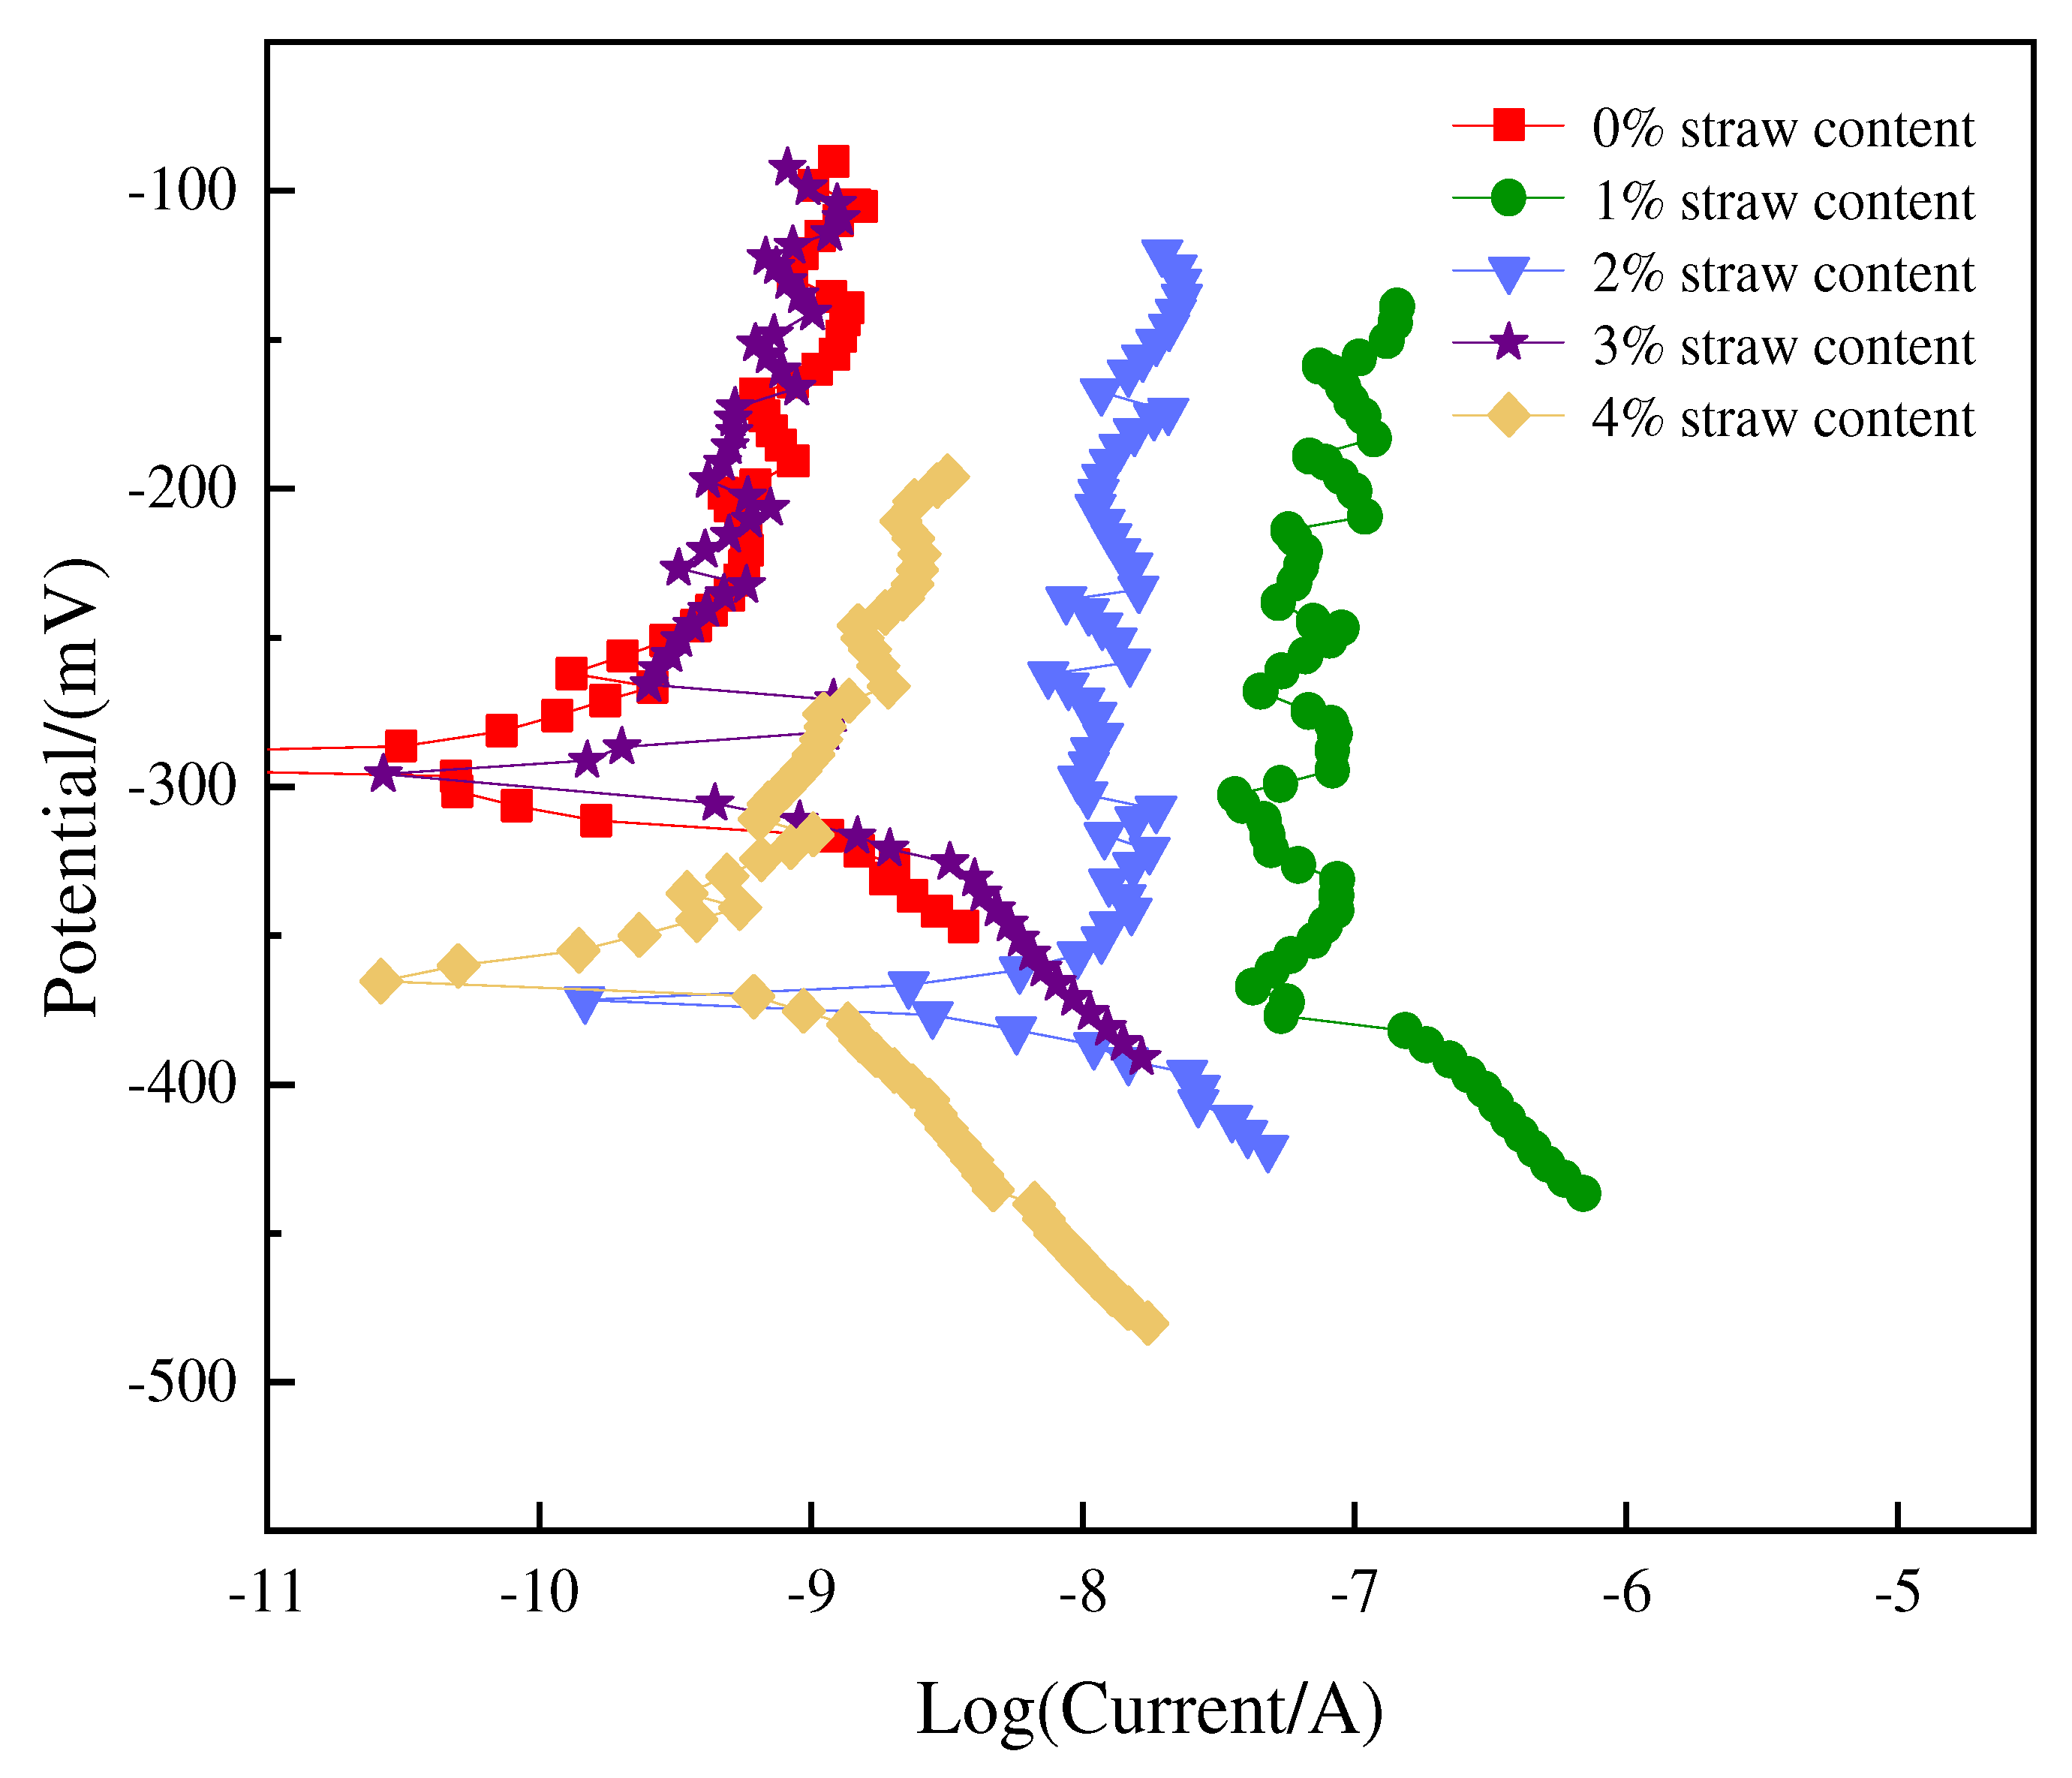
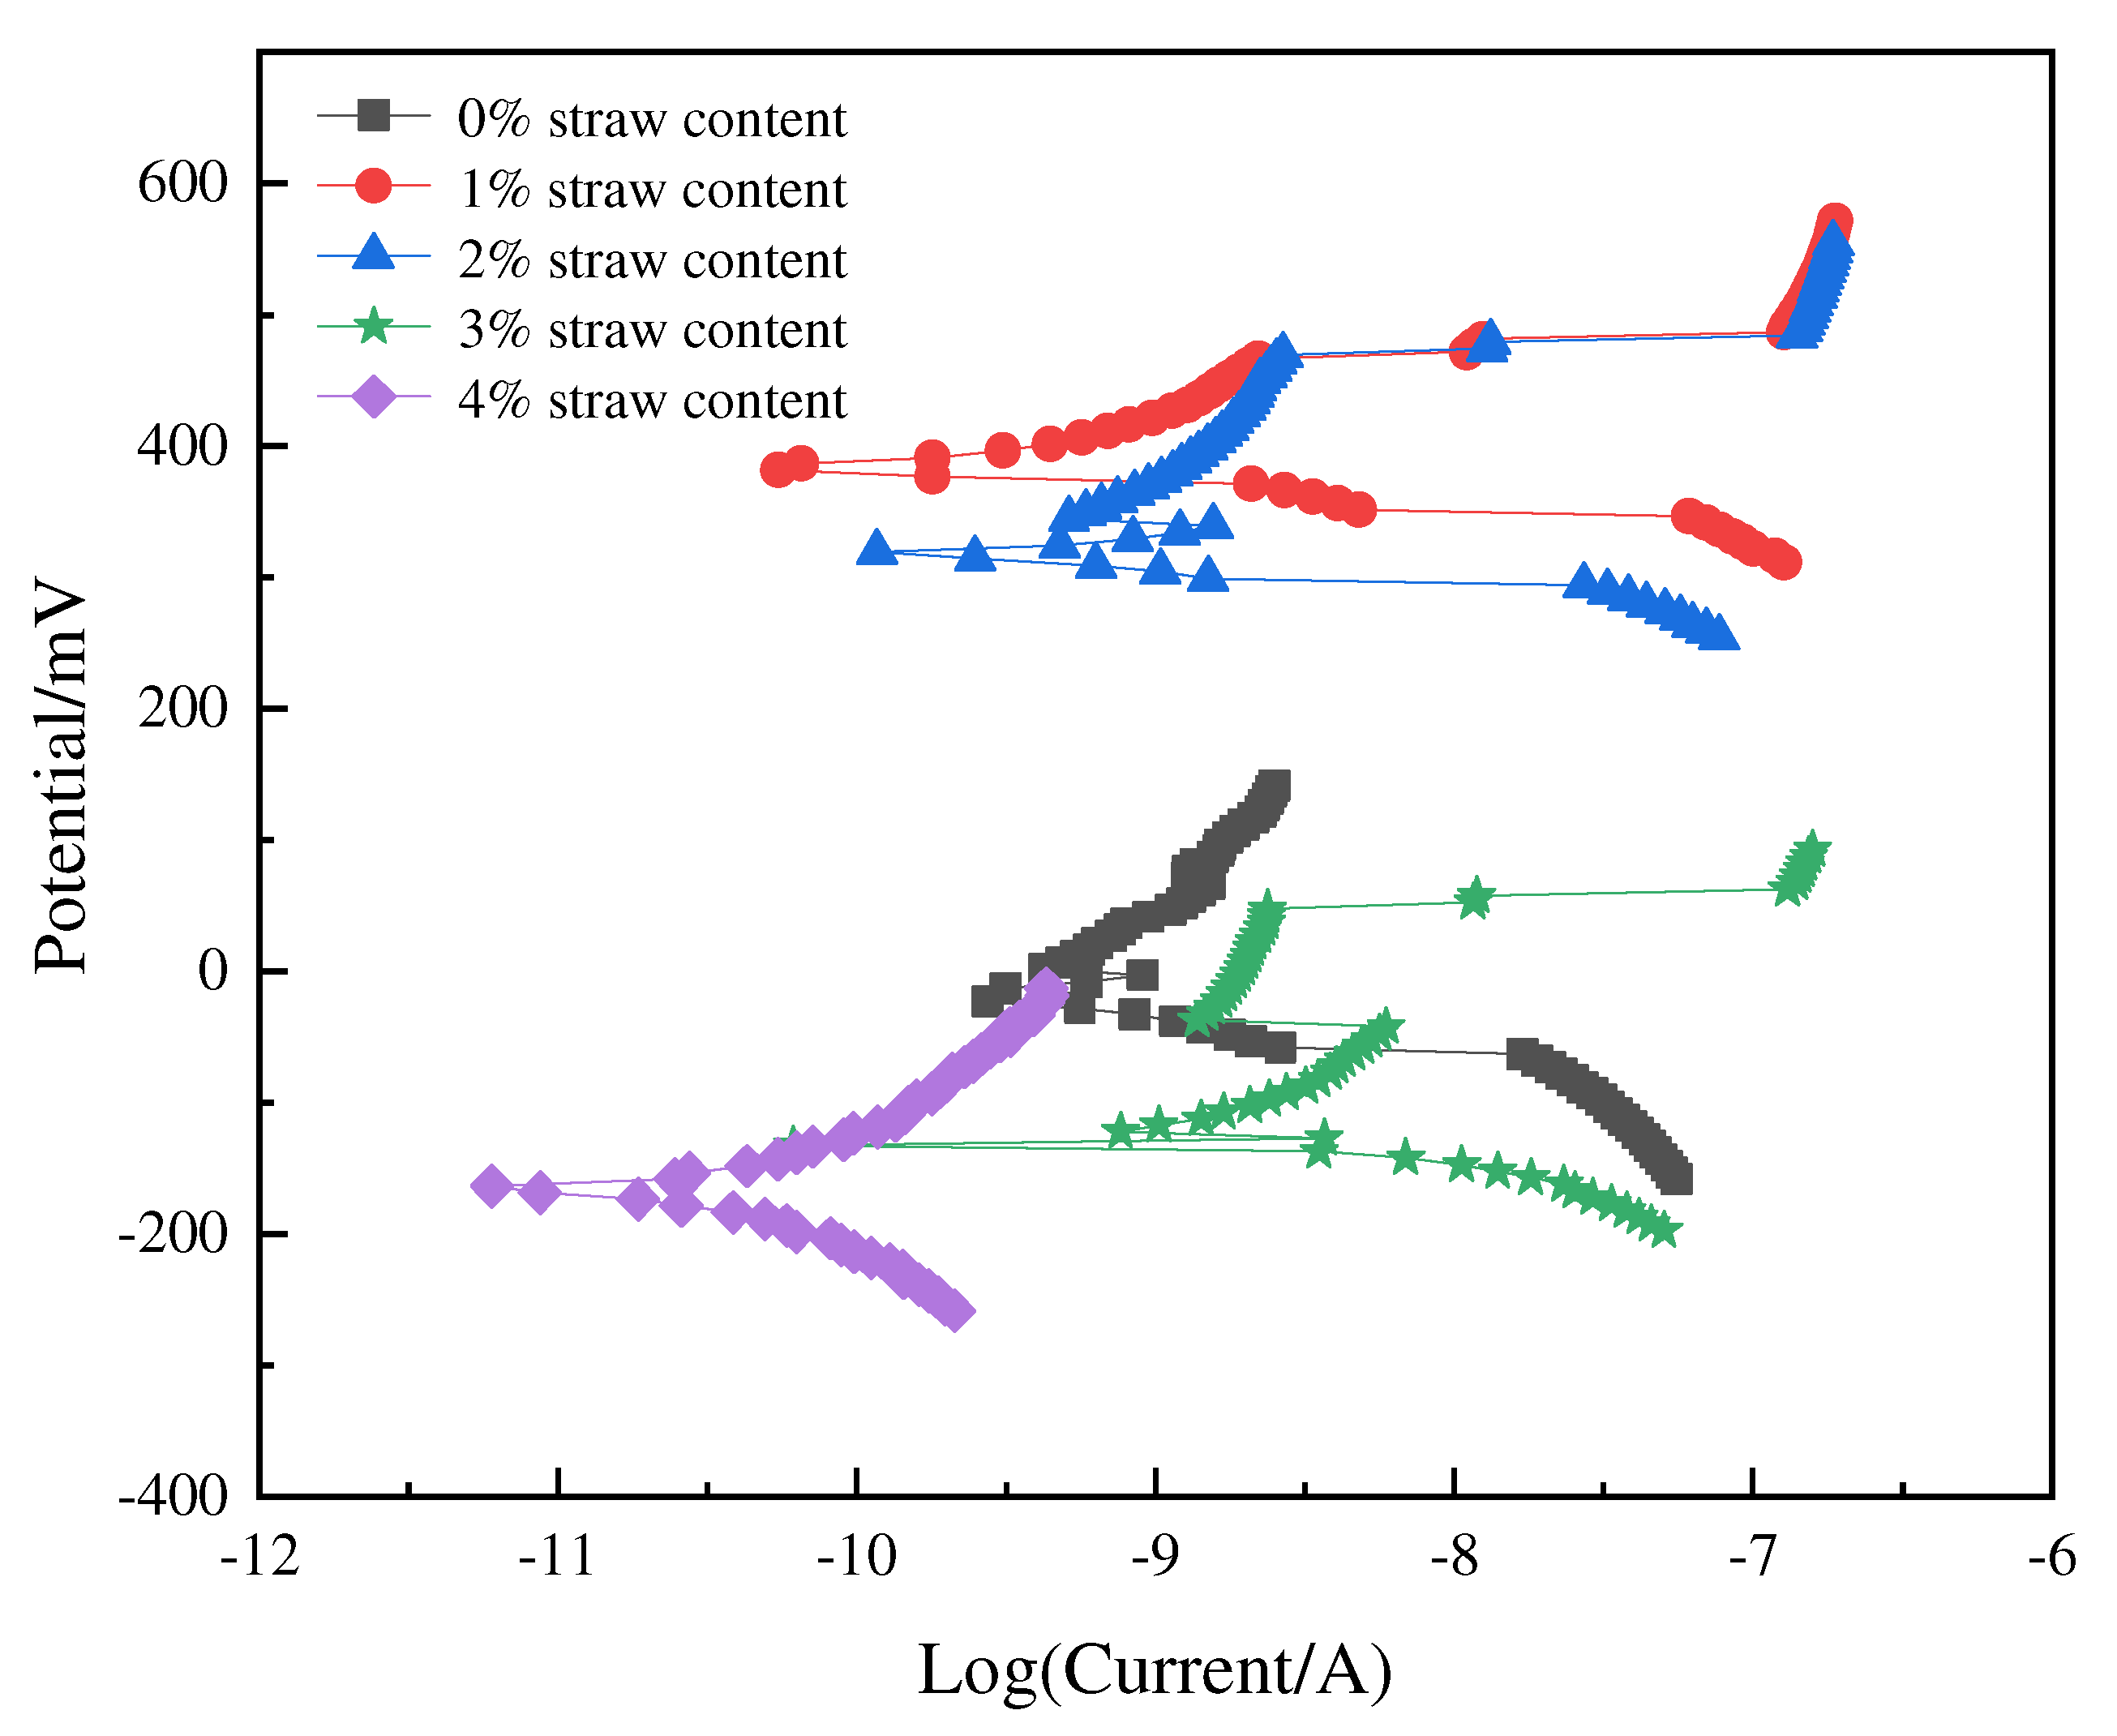
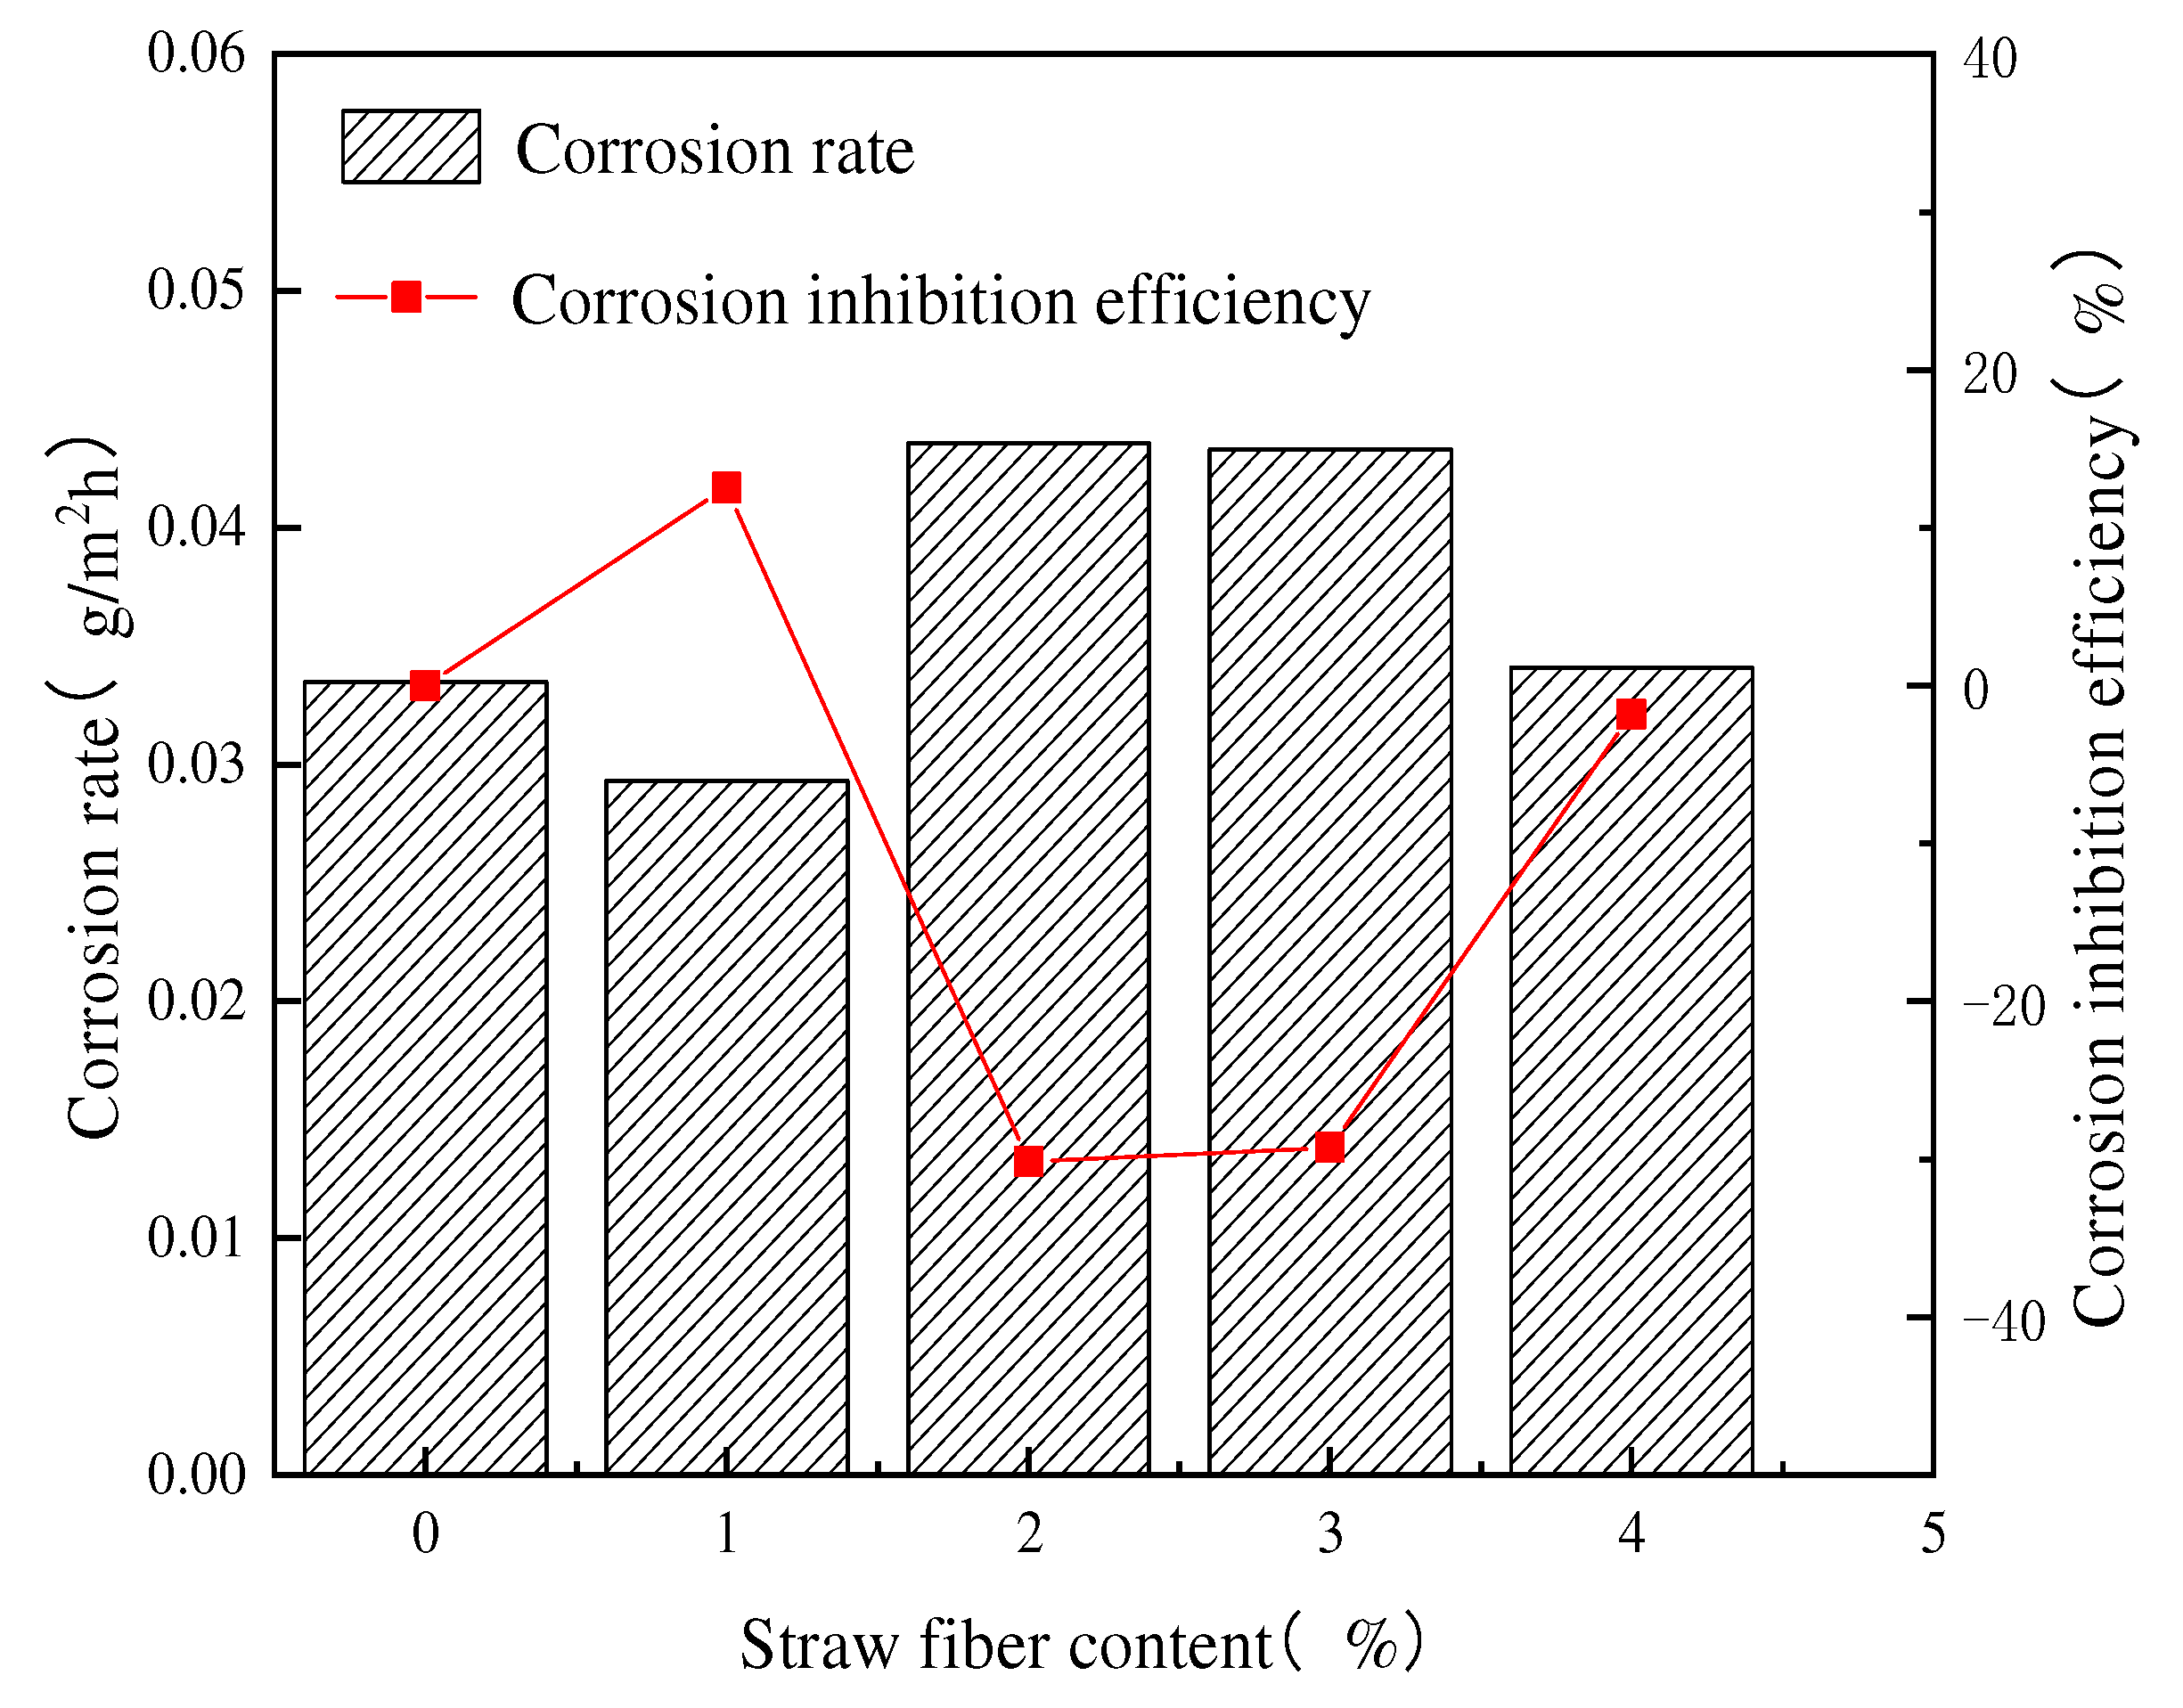
According to the AC impedance spectrum, the electrochemical equivalent circuit diagram of RPC can be simplified to Figure 12 and the equivalent circuit consists of four parts in series. The first part is the contact electrical resistance RS between concrete and wire mesh and steel bar. The dielectric RPC forms the contact electrical resistance RS under the action of electrode steel wire gauze and steel bar. The second part is the electrical resistance R1 and capacitance C1 generated by the pore solution, which are connected in parallel. The third part is the electrical resistance R2 and capacitance C2 generated by RPC, which are also connected in parallel. The last part is the electrical resistance R3 and capacitance C3 produced by the straw fiber electrical resistance, which is connected in parallel [46]. Figure 12 shows the electrochemical equivalent circuit diagram of RPC reinforced with straw fiber.
Figure 13 and Figure 14 show AC impedance spectrum curves under 0 and 10 dry–wet alternations. The imaginary component (Zi) represents the electrical capacitance and the real component (Zr) represents electrical resistance.
As shown in Figure 13, the resistance distribution was irregular, and the magnitude was large under the 0 dry–wet alternations. This indicates the concrete has a good protective layer to protect the cementitious matrices and has a strong charge storage capacity [47].
It can be seen from Figure 14 that the curve of the AC impedance spectrum is distributed in a hook shape under the condition of 10 dry–wet alternations. When the straw fiber content is the same, as the frequency decreases from left to right, the electrical resistance increases, but the capacitance decreases. After the inflection point, the capacitance increases with the electrical resistance, and the increase rate is relatively fast. Each curve of RPC has an inflection point, and the electrical resistance value at the inflection point can reflect the corrosion of RPC to a certain extent. Furthermore, the greater the electrical resistance value at the inflection point of the curve, the better the corrosion resistance of RPC [48,49].
The results showed that the corrosion resistance of different content straw fiber to steel bar was different. The best corrosion resistance was obtained when the fiber content was 4%. However, when the fiber content was 2% and 3%, the electrical resistance of the sample is lower than that of the blank control group.
Figure 15 is the AC impedance spectrum of the 0 freeze–thaw cycle. As shown in Figure 15, the electrical resistance increases as the frequency decreases from left to right, but the capacitance is also decreasing with a higher decline rate. After the inflection point, the electrical resistance increases and the capacitance increases, but the increasing rate is lower. Therefore, without freeze–thaw cycle, the specimens with 1% straw fiber content had the highest corrosion resistance, while 2%, 3% and 4% were lower than the blank control group.

3.4.2. Tafel Curve

Figure 16 is the tafel curve for the 0 dry–wet alternations, and Figure 17 is for the 10 dry–wet alternations. The tafel curve is segmented at the inflection point, the upper part of the curve is the anode tafel region, and the lower part of the curve is the cathode tafel region [50]. Tangents are made in the anode tafel region and the cathode tafel region, respectively. The abscissa and ordinate of the intersection of two tangent lines are the logarithm of corrosion potential and corrosion current density, respectively. The calculation formula of metal corrosion rate can be expressed as:
V = M nF i c o r r = 3 . 73   ×   10 - 4 M n i c o r r g m 2 h
V is the corrosion rate, and the unit is g/m2h. M represents the atomic weight of a metal, which is expressed in g. And n is the valence of a metal. F stands for Faraday’s constant and icorr indicates the corrosion current density.
A column diagram of the corrosion rate and the corrosion inhibition efficiency can be calculated according to the corrosion rate of reinforcement before and after the cycles are drawn after the software calculation, as shown in Figure 18. The study focuses on the analysis of tafel curve after 10 dry–wet alternations. The tafel curve of the 0 dry–wet cycle acts as a blank comparison. It is obvious that the 1% fiber content has the highest corrosion inhibition efficiency. However, the corrosion inhibition efficiency is not linearly related to the increase in fiber. As can be seen from Figure 18, when the fiber content is 1%, the minimum corrosion rate is 0.00804 g/m2h and the highest corrosion inhibition efficiency is 76.83%.
Figure 19 is the tafel curve for the 0 freeze–thaw cycle. Sorting out Figure 19 and the results obtained by substituting the formula calculation can be used to draw the column plots of corrosion rates and the corrosion inhibition efficiency with different straw fiber contents. As shown in Figure 20 below, the left Y axis is the corrosion rate, and the right Y axis is corrosion inhibition efficiency.
It is obvious from Figure 20 that the specimens with 1% straw fiber content had the smallest corrosion rate of 0.0293 g/m2h and the highest corrosion inhibition efficiency 12.54%, so it is the most resistant to corrosion. The straw fiber content with the highest corrosion rate is for the specimens in the group of 2% and its resistance to corrosion is the weakest. Moreover, a conclusion can be drawn that the relationship between straw fiber content and corrosion resistance to 1% > 0% > 4% > 3% > 2% under the 0 freeze–thaw cycle.

4. Conclusions

Through the analysis of resistance, ultrasonic speed and other charts, the corrosion resistance of RPC reinforced with straw fiber was studied. The results of the study concluded as follows.
Under the dry–wet alternations, the mass rate of RPC reinforced with different straw fiber content increased first, then decreased. Among the four groups of fiber content, only the mass loss rate of 1% RPC was less than that of the blank control group. This may be because the 1% fiber content is the critical point that affects the quality loss of concrete. In the freeze–thaw cycle environment, the mass loss rate of all specimens decreased except for 0% straw fiber content.
The electrical resistance and ultrasonic velocity reflect the corrosion resistance of the cementitious matrices. With the increase in the number of cycles, the electrical resistance loss rate increases sharply at first and then becomes stable. Ultrasonic velocity loss rate first increased, with the increase in dry–wet alternations, and the growth is relatively slow. Under the freeze–thaw cycles, the loss rate goes down first, then goes up. When the fiber content is 2%, the lowest resistance loss rate is 6.45%, and the lowest ultrasonic loss rate is -3.44%. The results indicated that the resistance and ultrasonic velocity of straw fiber could be improved by adding an appropriate amount of straw fiber.
AC impedance spectrum and tafel curve reflect the corrosion resistance of the built-in steel bar. Through the analysis of the curves, 1% RPC reinforced with straw fiber has good corrosion resistance in both dry–wet alternations and freeze–thaw cycles.
According to various data and experimental results, we concluded that in the four groups of fiber content, when the fiber content is 1% and 2%, the RPC reinforced with straw fiber has the best corrosion resistance under the influence of NaCl solution external erosion. Considering the utilization rate of straw fiber and corrosion resistance comprehensively, RPC reinforced with 1% straw fiber content is most suitable for practical engineering, especially for coastal bridge construction, because of its low mass loss rate, proper resistance and ultrasonic, and high corrosion resistance. Meanwhile, the reinforced RPC of 3% and 4% straw fiber should be avoided as far as possible in engineering.

Author Contributions

Conceptualization, H.W. and X.P.; Software, R.H.; Validation, R.H. and H.W.; Formal analysis, Z.C. and H.W.; Investigation, Z.C., K.W. and R.H.; Resources, X.P.; Data curation, H.W. and Z.C.; Writing—original draft preparation, H.W. and Z.C.; Writing—review and editing, H.W., Z.C., R.H., K.W. and X.P.; Visualization, Z.C.; Supervision, X.P.; Project administration, H.W. and X.P.; Funding acquisition, H.W. and X.P. All authors have read and agreed to the published version of the manuscript.

Funding

The Natural Science Foundation of Zhejiang Province, China (No. LY22E080005), Ningbo Natural Science Foundation Project (2023J086), and the National Natural Science Foundation of China (52008215), and the Major Special Science and Technology Project (2019B10076) of "Ningbo Science and Technology Innovation 2025".

Institutional Review Board Statement

Not applicable.

Informed Consent Statement

Not applicable.

Data Availability Statement

The data used to support the findings of this study are available upon request.

Conflicts of Interest

The authors declare that there are no conflicts of interest regarding the publication of this paper.

References

  1. Ling, L. Corrosion rate control method of concrete filled steel tubes structure of coastal highway bridges. J. Coast. Res. 2019, 93, 929–934. [Google Scholar] [CrossRef]
  2. Yusuke, K.; Masaki, M.; Ryuji, N. Verification test of restoration effect of offshore concrete structure using permanent formwork panels and underwater inseparable mortar. Int. J. Civ. Eng. 2021, 19, 1111–1124. [Google Scholar] [CrossRef]
  3. Peng, R.; Qiu, W.; Teng, F. Investigation on seawater freeze-thaw damage deterioration of marine concrete structures in cold regions from multi-scale. Ocean Eng. 2022, 248, 110867. [Google Scholar] [CrossRef]
  4. Guo, A.; Yuan, W.; Li, H.; Li, H. Structural strength deterioration of coastal bridge piers considering non-uniform corrosion in marine environments. Earthq. Eng. Eng. Vib. 2018, 17, 429–444. [Google Scholar] [CrossRef]
  5. Yokota, H.; Kato, E.; Iwanami, M. Chloride-induced corrosion of reinforcement and its effect on performance of structures. Int. J. Model. Ident. Control. 2009, 7, 179–184. [Google Scholar] [CrossRef]
  6. Wang, H.; Jin, K.; Zhang, A.; Zhang, L.; Han, Y.; Liu, J.; Shi, F.; Feng, L. External erosion of sodium chloride on the degradation of self-sensing and mechanical properties of aligned stainless steel fiber reinforced reactive powder concrete. Constr. Build. Mater. 2021, 287, 123028. [Google Scholar] [CrossRef]
  7. Liu, X.; Song, R.; Liu, J. Mix Proportion Design and Experimental Study of Reactive Powder Concretes. Railw. Constr. Technol. 2022, 355, 78–82. [Google Scholar]
  8. Ambika, D.; Nandhini, V.; Santha Rubini, V.; Poovizhi, D.; Dhinu Priya, S. An exploration on the durability properties of reactive powder concrete. Mater. Today Proc. 2021, 45, 529–534. [Google Scholar] [CrossRef]
  9. Peng, X.; Yang, Q.; Cao, H.; Wang, H. Mathematical Model for Early-Aged UHPFRC Compressive Strength Changes. Coatings 2023, 13, 525. [Google Scholar] [CrossRef]
  10. Hao, X.; Li, H.; Li, H.; Liu, Y.; Qiao, Q. Mix proportion experimental research and calculation of reactive powder concrete. Concrete 2018, 3, 156–160. [Google Scholar] [CrossRef]
  11. Wang, Y.; An, M.; Yu, Y.; Han, S.; Ji, W. Durability of reactive powder concrete under chloride-salt freeze–thaw cycling. Mater. Struct. 2017, 50, 18. [Google Scholar] [CrossRef]
  12. Mao, X.; Qu, W.; Zhu, P.; Xiao, J. Influence of recycled powder on chloride penetration resistance of green reactive powder concrete. Constr. Build. Mater. 2020, 251, 119049. [Google Scholar] [CrossRef]
  13. Peng, X.; Shi, F.; Yang, J.; Yang, Q.; Wang, H.; Zhang, J. Modification of construction waste derived recycled aggregate via CO2 curing to enhance corrosive freeze-thaw durability of concrete. J. Cleaner. Prod. 2023, 405, 137016. [Google Scholar] [CrossRef]
  14. Liu, J.; Song, S.; Wang, L. Durability and micro-structure of reactive powder concrete. J. Wuhan Univ. Technol. Mater. Sci. Ed. 2009, 24, 1000–2413. [Google Scholar] [CrossRef]
  15. Xiao, L.; Lei, T. Research status of straw fiber reinforced cement-based composites. Mod. Chem. Ind. 2022, 42, 106466. [Google Scholar] [CrossRef]
  16. Liu, Q.; Zhao, Z.; Shi, J. Present Status of Application of Straw Resources in Concrete. North Archit. 2018, 3, 71–73. [Google Scholar]
  17. Li, L.; Chen, H.; Ji, W.; Zhou, C. Study on the Physical and Chemical Properties of Several Straw Fiber. Soybean Sci. 2014, 33, 691–696. [Google Scholar]
  18. Fan, J.; Liu, F.; Liu, Y.; Hu, Y. Experimental Study on Intension and Thermal Insulation Performance of Stalk Fibre Concrete Block. Build. Sci. 2010, 26, 45–47. [Google Scholar] [CrossRef]
  19. Joseph, S.; Mohammed, S.; Su, T.; Sofiane, A. The effect of a polyacrylic acid viscosity modifying agent on the mechanical, thermal and transport properties of hemp and rapeseed straw concrete. Constr. Build. Mater. 2020, 235, 117536. [Google Scholar] [CrossRef]
  20. Deng, H.; Tian, Y.; Zhang, Z.; Li, C. Research and Application Progress of Straw Fiber Concrete. China Concr. Cem. Prod. 2023, 4, 59–62. [Google Scholar] [CrossRef]
  21. Bao, J.; Wei, J.; Zhang, P.; Li, S.; Zhao, T. Research Progress of Similarity of Resistance to Chloride Ingress into Concrete Exposed to Marine Environment. J. Chin. Ceram. Soc. 2020, 48, 689–704. [Google Scholar] [CrossRef]
  22. Bahari, I.; Sumarni, S.; Murtiono, E.S. Mechanical property of straw concrete brick with additives viscocrete. AIP Conf. Proc. 2019, 2114, 030017. [Google Scholar] [CrossRef]
  23. Sun, D.; Cao, Z.; Huang, C.; Wu, K.; Schutter, G.D.; Zhang, L. Degradation of concrete in marine environment under coupled chloride and sulfate attack: A numerical and experimental study. Case Stud. Constr. Mater. 2022, 17, e01218. [Google Scholar] [CrossRef]
  24. Li, L.; Liu, Q. Numerical Analysis on Freezing Rate and Chloride Transport in Concrete Subjected to Freeze–Thaw Cycles. J. Chin. Ceram. Soc. 2022, 50, 2245–2256. [Google Scholar] [CrossRef]
  25. Wang, H.; Shi, F.; Shen, J.; Zhang, A.; Zhang, L.; Huang, H.; Liu, J.; Jin, K.; Feng, L.; Tang, Z. Research on the self-sensing and mechanical properties of aligned stainless steel fiber reinforced reactive powder concrete. Cem. Concr. Compos. 2021, 119, 104001. [Google Scholar] [CrossRef]
  26. Li, J.; Xu, Y.; Tian, Z.; Ma, J.; Jing, P.; Song, Z. Study on leaching damage mechanism of calcium ions of reactive powder concrete (RPC) under ion corrosion. Constr. Build. Mater. 2021, 269, 121303. [Google Scholar] [CrossRef]
  27. Yang, W.; Pu, Y.; Zhou, Y.; Liu, K.; Chen, K. The application of density measurement method in the analysis of silicate cement hydration process. Phys. Test. Chem. Anal. A Phys. Test. 2022, 58, 22–26. [Google Scholar] [CrossRef]
  28. Wang, D.; Ma, Y.; Kang, M.; Ju, Y.; Zeng, C. Durability of reactive powder concrete containing mineral admixtures in seawater erosion environment. Constr. Build. Mater. 2021, 306, 124863. [Google Scholar] [CrossRef]
  29. Mehta, P.K. Mechanism of sulfate attack on portland cement concrete—Another look. Cem. Concr. Res. 1983, 13, 401–406. [Google Scholar] [CrossRef]
  30. Ming, X.; Li, Y.; Liu, Q.; Wang, M.; Cai, Y.; Chen, B.; Li, Z. Chloride binding behaviors and early age hydration of tricalcium aluminate in chloride-containing solutions. Cem. Concr. Compos. 2023, 137, 104928. [Google Scholar] [CrossRef]
  31. Yan, Z.; Liu, L.; Sun, J.; Lu, B.; Zu, H.; Zang, J.; Li, D.; Hou, G. Synergistic Effect of Tricalcium Aluminate and Calcium Carbonate on Early Mechanical Strength and Setting Time of Portland Cement. Bull. Chin. Ceram. Soc. 2021, 40, 1470–1476. [Google Scholar] [CrossRef]
  32. Lu, X.; Dai, Y.; Chen, J. The description model of fiber dispersion for wheat straw high density polyethylene (HDPE) composites. Biot. Resour. 2020, 42, 109–116. [Google Scholar] [CrossRef]
  33. Wang, Z.; Yao, Y.; Wang, L. Deformation and Deterioration Analysis of Concrete Exposed to Freeze-Thaw Cycles and Chloride Salt Attack. J. Chin. Ceram. Soc. 2012, 40, 1133–1138. [Google Scholar] [CrossRef]
  34. Yim, H.J.; Bae, Y.H.; Jun, Y. Hydration and microstructural characterization of early-age cement paste with ultrasonic wave velocity and electrical resistance measurements. Constr. Build. Mater. 2021, 303, 124508. [Google Scholar] [CrossRef]
  35. Chen, T.; Wang, W.; Wang, H. Mechanical properties and ultrasonic velocity of lightweight aggregate concrete containing mineral powder materials. Constr. Build. Mater. 2020, 258, 119550. [Google Scholar] [CrossRef]
  36. Liu, M. Application of the ultrasonic method to detect the compactness of concrete. China Build. Mater. Technol. 2015, 24, 20–22. [Google Scholar] [CrossRef]
  37. Yan, W.; Wu, Z.; Niu, F.; Wan, T.; Zheng, H. Study on the service life prediction of freeze–thaw damaged concrete with high permeability and inorganic crystal waterproof agent additions based on ultrasonic velocity. Constr. Build. Mater. 2020, 259, 120405. [Google Scholar] [CrossRef]
  38. Qiu, W.; Teng, F.; Pan, S. Damage constitutive model of concrete under repeated load after seawater freeze-thaw cycles. Constr. Build. Mater. 2020, 236, 117560. [Google Scholar] [CrossRef]
  39. Cheng, X.; Tian, W.; Gao, J.; Guo, J.; Wang, X. Grey entropy analysis of strength and void structure of carbon nanotubes concrete under the coupling of sulfate attack and freeze-thaw cycles. Constr. Build. Mater. 2022, 358, 129462. [Google Scholar] [CrossRef]
  40. Li, H.; Xie, Y.; Yi, Z.; Tan, Y.; Feng, Z.; Fang, B.; Yang, L. Advance in research on electrical resistivity of concrete. Concrete 2011, 260, 35–40. [Google Scholar]
  41. Niu, W.; Xu, Q.; Zhang, K.; Ma, R.; Peng, D. Experimental research on the influencing factors of concrete surface resistivity. New Build. Mater. 2021, 48, 22–26. [Google Scholar] [CrossRef]
  42. Shi, S.; Xu, F.; Li, Q. Experimental Study on Mechanical Properties of Ultra high Ductility Fiber-reinforced Cementitious Composites under Freeze-thaw Cycling. Sci. Technol. Eng. 2023, 23, 4745–4754. [Google Scholar] [CrossRef]
  43. Yang, Q.; Sun, Y.; Peng, X. Experimental Study on Mechanical Properties of Concrete at Super-Early Age. Materials. 2022, 15, 7582. [Google Scholar] [CrossRef]
  44. Liu, X.; Yan, Z.; Wang, D.; Zhao, R.; Niu, D.; Wang, Y. Corrosion cracking behavior of reinforced concrete under freeze-thaw cycles. J. Build. Eng. 2023, 64, 105610. [Google Scholar] [CrossRef]
  45. Wang, H.; Zhang, B.; Wang, Q. Study on the durability of recycled concrete under the coupling action of freeze-thaw cycles and compound salt erosion. Concrete 2023, 402, 40–44+50. [Google Scholar] [CrossRef]
  46. He, B.; Chen, Q.; He, L.; Song, F.; Jiang, Z. Alternating Current Impedance Characteristics and Its Equivalent Circuit Model of High-Impedance and Ultra-High Performance Concrete. J. Chin. Ceram. Soc. 2022, 50, 492–502. [Google Scholar] [CrossRef]
  47. Liang, Z.; Peng, X.; Wang, H. The Influence of Aspect Ratio of Steel Fibers on the Conductive and Mechanical Properties of Compound Cement Reactive Powder Concrete. Coatings 2023, 13, 331. [Google Scholar] [CrossRef]
  48. Wang, R.; He, F.; Shi, C.; Zhang, D.; Chen, C.; Dai, L. AC impedance spectroscopy of cement-based materials: Measurement and interpretation. Cem. Concr. Compos. 2022, 131, 104591. [Google Scholar] [CrossRef]
  49. Hu, X.; Shi, C.; Liu, X.; Zhang, J.; Schutter, G.D. A review on microstructural characterization of cement-based materials by AC impedance spectroscopy. Cem. Concr. Compos. 2019, 100, 1–14. [Google Scholar] [CrossRef]
  50. Rocchini, G. The evaluation of corrosion rates with the generalised inflection point method. Corros. Sci. 1999, 41, 2129. [Google Scholar] [CrossRef]
Figure 1. Schematic diagram of specimen.
Coatings 13 01308 g001
Figure 2. The production process of RPC.
Coatings 13 01308 g002
Figure 3. Measurement of ultrasonic velocity.
Coatings 13 01308 g003
Figure 4. Measurement of electrical resistance.
Coatings 13 01308 g004
Figure 5. Tafel curve test process and parameters.
Coatings 13 01308 g005
Figure 6. Mass of RPC reinforced with straw fiber under dry–wet alternations.
Coatings 13 01308 g006
Figure 7. Mass of RPC reinforced with straw fiber under freeze–thaw cycles.
Coatings 13 01308 g007
Figure 8. Ultrasonic velocity of RPC reinforced with straw fiber under dry–wet alternations.
Coatings 13 01308 g008
Figure 9. Ultrasonic velocity of RPC reinforced with straw fiber under freeze–thaw cycles.
Coatings 13 01308 g009
Figure 10. Electrical resistance of RPC reinforced with straw fiber under dry–wet alternations.
Coatings 13 01308 g010
Figure 11. Electrical resistance of RPC reinforced with straw fiber under freeze–thaw cycles.
Coatings 13 01308 g011
Figure 12. The electrochemical equivalent circuit diagram of RPC.
Coatings 13 01308 g012
Figure 13. AC impedance spectrum curves under the 0 dry–wet alternations.
Coatings 13 01308 g013
Figure 14. AC impedance spectrum curves under the 10 dry–wet alternations.
Coatings 13 01308 g014
Figure 15. AC impedance spectrum curves under the 0 freeze–thaw cycle.
Coatings 13 01308 g015
Figure 16. Tafel curve under the 0 dry–wet alternation.
Coatings 13 01308 g016
Figure 17. Tafel curve under the 10 dry–wet alternations.
Coatings 13 01308 g017
Figure 18. Corrosion rate of RPC reinforced with different straw fiber content under 10 dry–wet alternations.
Coatings 13 01308 g018
Figure 19. Tafel Curve under the 0 freeze–thaw cycle.
Coatings 13 01308 g019
Figure 20. Corrosion rate of RPC reinforced with different straw fiber content under 0 freeze–thaw cycle.
Coatings 13 01308 g020
Table 1. Chemical composition of raw materials (%).
VarietySiO2Al2O3Fe2O3MgOCaOK2OR2OSO3
Cement20.865.473.941.7362.2300.482.66
Silica fume900.80.60.80.407.40
Table 2. Mixing mass proportion of fresh cement paste.
Fiber
Content (%)
Water/kgCement/kgQuartz Sand/kgWater-Reducing Agent/kgThe Anti-Foaming Agent/kgSilica Fume/kg
0, 1, 2, 3, 40.93752.81251.8750.03750.003750.9375
Disclaimer/Publisher’s Note: The statements, opinions and data contained in all publications are solely those of the individual author(s) and contributor(s) and not of MDPI and/or the editor(s). MDPI and/or the editor(s) disclaim responsibility for any injury to people or property resulting from any ideas, methods, instructions or products referred to in the content.

