Article

Surface Analyses of Thin Multiple Layer Barrier Coatings of Poly(vinyl alcohol) for Paperboard

1
Department of Engineering and Chemical Sciences, Karlstad University, 65188 Karlstad, Sweden
2
UMV Coating Systems, 66124 Säffle, Sweden
*
Author to whom correspondence should be addressed.
Current address: VTT, 02044 Espoo, Finland.
Current address: Billerud Gruvön, 66428 Grums, Sweden.
Coatings 2023, 13(9), 1489; https://doi.org/10.3390/coatings13091489
Submission received: 25 July 2023 / Revised: 16 August 2023 / Accepted: 17 August 2023 / Published: 23 August 2023

Abstract

:
The hypothesis of the present study is that thin multiple layer coatings on paperboard from the aqueous solutions of poly(vinyl alcohol) (PVOH) at high machine speeds is more effective in terms of barrier properties than one or two thick layers. The objectives included attempts to use surface roughness parameters to understand the coating process and mechanisms behind coating defects. The present study is focused on pilot-scaled PVOH coating onto uncoated paperboard at machine speeds of 400 m/min. The multiple coating operation was carried out in six passes with a dry coat weight of about 1 g/m2 in each layer. The concept of thin multiple coatings resulted in coated surfaces without detected pinholes and with Kit rating 12 after only two thin layers. However, the oxygen transmission rates were still fairly high (100 ± 89 cm3/m2 day atm) after six layers, and some coating defects (such as craters and cracks) could be identified. The analyses of surface structure indicated that the surface properties are affected by water uptake during the coating processes. The compression of paperboard beneath the metering element seemed to be required to achieve homogeneous thin layers. However, an analysis of defects revealed flaws and inhomogeneities near objects protruding from the surface, such as surface fibers and craters, caused by blistering. For rough paperboard substrates, the desired barrier properties may require a careful balance between sufficient compression for fiber coverage and gentle compression in order to avoid defects near craters and surface fibers.

1. Introduction

Cellulose-based materials, such as paper and paperboard, have been used as packaging materials for a very long time. Cellulose-based materials have attracted increasing attention during recent years as an environmentally friendly alternative to petroleum-based plastics. In order to meet requirements in food packaging applications but also in other business sectors, paper and paperboard materials are usually coated before the final steps in the packaging production. The two most common groups of coating methods for paper and paperboard are (i) extrusion or lamination and (ii) the application of water-borne dispersions or polymer solutions. Conventional blade or rod coating processes [1] and surface sizing [2] are the two main industrial methods to apply a coating onto paper and paperboard from aqueous suspensions or solutions. In the present study, the term “coating” includes surface sizing. Both methods represent mature technologies. In general, the blade and rod coaters were developed for pigment-containing coating dispersions (coating colors) of high solids level. During a rather long period of time, the dominating conventional paper coater has been the so-called inverted blade coater, introduced about 70 years ago [3]. During the last 30 years, some other paper coating methods have come to gain industrial importance. This is especially true for the metered size press (MSP) and the curtain coater [4,5,6]. The different coating techniques result in different coat weight uniformity and surface roughness. Extrusion coating is a water- and solvent-free process. The most common materials for extrusion coating are polyolefin resins. Melt viscosity (melt index) is an extremely important property. Extrusion coating can be used to achieve a wide range of coating thicknesses [7,8].
One advantage of water-soluble polymers and water-borne dispersions is that conventional online or offline paper coating equipment at the paper mill can be used. In addition, the use of water soluble and dispersible polymers may enable the recirculation of materials [9] and the repulpability of coated broke [10].
The barrier properties of the packaging materials is of very high importance in several packaging applications. The barrier properties often concern the permeation of water vapor, gases, organic liquids, and inorganic liquids and grease resistance. Water-soluble or dispersible polymers are frequently used in order to reduce porosity, and thereby increase the barrier properties of paper and paperboard. Poly(vinyl alcohol) (PVOH) is a very common water-soluble polymer in industrial paper coating operations due to its good film-forming properties and insolubility to non-polar penetrants [11]. Several other water-soluble polymers are potential candidates for water-borne barrier coating applications. Starch, chitosan, and lignin fractions are water-soluble biopolymers that have been studied as barrier polymers for paper and paperboard in high-speed coating trials [12,13,14], just to mention a few examples. The common drawback for all water-soluble polymers is the high oxygen transmission rate (OTR) at high relative humidity (RH). This is a consequence of the high water solubility in the solid film, since diffusivity is proportional to the solubility of the penetrant. A top coating may reduce the OTR at humid conditions. Hamdani et al. [15] used dissolved zein protein in aqueous ethanol solutions as top coating for improvement of the barrier properties. The barrier properties of PVOH-based films and coatings with and without fillers have been extensively studied. The barrier properties of coatings of PVOH and PVOH/starch blends draw-down at low speeds onto flexible packaging paper were studied by Christophliemk et al. [16]. Both conventional PVOH and ethylene-modified PVOH were studied and the coated papers possessed an oxygen transmission rate (OTR) around 1 cm3/m2 d bar at 50% RH, almost irrespectively of PVOH grade. Several other studies have focused on different aspects of PVOH-based nanocomposite coatings. Free-standing films containing halloysite nanotubes prepared through solution casting were studied by Abdullah et al. [17]. Yu et al. [18] studied the coatings of nanocomposites based on PVOH and lamellar anionic synthetic clay draw-down onto plastic substrate. Montmorillonite is another type of nano filler that has been shown to reduce oxygen transmission through PVOH films [19]. The mechanical and optical properties of montmorillonite–PVOH coatings were studied by Johansson and Clegg [20]. Ogunsona and Mekonnen [21] prepared free standing films consisting of PVOH and cellulose nanocrystals (CNC) through layer-by-layer assembly of the two components. A very substantial reduction in OTR was observed after three layers (one CNC layer sandwiched between two PVOH layers). However, a single layer based on CNC dispersed in PVOH of similar composition as the three-layer assembly possessed a similar OTR as a pure PVOH film. Effects of randomly dispersed fibers have been outlined by Wolf and Strieder [22]. Even if PVOH coatings in the paper and paperboard industrial sector are almost always performed as applications of water-borne dispersions or aqueous solutions, the hot-melt extrusion of PVOH barriers has been reported [23,24]. One relatively early design of an extrusion apparatus suitable for PVOH was presented by Jack [25]. However, for the foreseeable future, application from water-borne dispersions or aqueous solutions is expected to be the standard method for applying PVOH barrier coatings to paper and paperboard. Most extant research papers focus on laboratory-scaled studies where free-standing films, casting, or draw-down coatings at low speeds have been used to produce PVOH films or PVOH coatings. Almost all unit processes in paper coatings are affected by scaling up. Increased machine speeds may cause runnability problems and flaws in the barrier layer leading to a loss of barrier properties. Only a few publications have studied material volumes and machine speeds of relevance to industrial PVOH barrier coatings on paper or paperboard [26,27,28,29].
The present study addresses the application of PVOH coatings from aqueous solution onto uncoated paperboard at high machine speeds using an integrated short-dwell type application/metering apparatus equipped with a resilient metering tip. The design of the coater has been presented elsewhere [29,30]. The possibility of improving the barrier properties of linerboard by multilayer coating with aqueous latex-based dispersions has been described elsewhere [31]. The aim of the present study is to analyze the barrier properties and surface structures of PVOH coatings produced at high machine speeds via thin multilayered coatings and thick single and double coatings. Attempts to link the coating process to barrier properties, surface structures, and coating defects are presented. Of course, the results are strictly valid only for the type of paperboard used in the trials, but some general conclusions were still possible. The results showed that the thin multilayered coating approach yielded a lower number of pinholes and superior grease resistance compared to thick single or double coating. However, gas barrier properties developed differently to grease resistance. Moreover, after six thin layers, the surface analyses revealed some cracks and voids adjacent to surface fibers and other objects protruding from the surface that may affect OTR. Moreover, the results clearly indicated that the compression of the substrate underneath the metering element has to be taken into account in order to optimize coating coverage and to minimize defects.

2. Materials and Methods

2.1. Materials

Poly(vinyl alcohol) (PVOH) (Kuraray Poval 6-98) was manufactured by Kuraray Europe GmbH, Hattersheim am Main, Germany, and was used without further purification. The molecular weight was about 47,000, the degree of hydrolysis was 98.4 ± 0.4, and the viscosity of a 4% aqueous solution at 20 °C was 6 ± 1 mPas (DIN 53015), according to information provided by the supplier.
Uncoated Duplex triple-ply board with bleached top layer from BillerudKorsnäs AB, Frövi, Sweden (grammage 270 g/m2) was used as substrate. The barrier coatings were applied to the brown unbleached side. The water absorptiveness on the unbleached side was measured as 23.3 ± 0.8 g/m2 according to Cobb60 tests (ISO 535:1991).

2.2. Preparation of Barrier Solution

The barrier coating solution was a pure aqueous solution of PVOH, and no additive other than sodium hydroxide was added. The solution was prepared by dispersing PVOH in solid form in water under stirring while heating this dispersion to 95 °C. The mixture of PVOH and water was kept at this temperature under continuous stirring for 30 min to obtain the physical solution of PVOH in water. The pH of the PVOH solution was adjusted through sodium hydroxide to pH = 8.5. The selected pH value was chosen arbitrarily within a range that is typical for coating colors. The concentration of the final PVOH solution was 18.0 wt%. The viscosity of the final barrier solution used in all coating trials was 0.35 Pas (Brookfield 100 rpm at 35 °C). The temperature of the barrier solution in the pilot trials was 35 °C.

2.3. Pilot Coating

The pilot scale coating of the paperboard with a web width of ca. 0.55 m was carried out at UMV Coating Systems AB, Säffle, Sweden. The pilot coater is shown in Figure 1. The machine speed was 400 m/min at all trials.
In all trials, the barrier solution was applied to the brown backside of the paperboard substrates by means of the coating unit (Invo Coater, UMV Coating Systems, Säffle, Sweden). This coater represents a type of excess coating method that enables a very short dwell time between application and metering. The coater can be equipped with several different types of metering elements. The selected metering element was located immediately behind the point of application of the coating color. The machine speed of 400 m/min resulted in a dwell time of 0.005 s between application and metering. The coater is a zero dwell coater, which is a type of short dwell time applicator (STDA). SDTA units are generally equipped with steel blade metering element [1]. In contrast to most STDA units, the metering element used in the present study consisted of a curved, soft resilient metering tip (Invo Tip, UMV Coating Systems, Sweden) or wire-wound rods. The curved, soft resilient metering tip was used when thin layers of PVOH were produced (denoted as Series ML). The coating and drying strategy in Series ML were selected in order to enable a gentle but still sufficient drying. In Series ML, the metering tip angle was kept constant at 25° and the coat weight of each individual layer was ca. 1 g/m2. As reference points, pilot trials with one very thick PVOH layer and two thick PVOH layers were performed, denoted as Reference S and Reference Series D, respectively. The coater was equipped with volumetric rod metering elements with a diameter of 14 mm for the reference trials. A rod denoted “30 gsm” was used for Reference S with one thick layer (coat weight 4.7 g/m2). A rod denoted “15 gsm” was used for Reference Series D with two thick layers (coat weights 3.7 and 3.0 g/m2 for first and second layer, respectively). The designations on the two rods refer to the approximate nominal wet coat weight in the unit g/m2 for a mineral-pigmented coating color. In the case of thin multiple coating and thick double coating, the coated board was analyzed after each individual layer. All samples were stored at 25 °C and 50% RH prior to analyzing barrier properties and surface topography/morphology.
The drying strategies are summarized in Table 1. In general, the higher the amount of applied PVOH in each step, the higher the drying power needed to avoid blocking. The online drying system consisted of:
  • One electric infrared (IR) dryer containing 12 individual IR elements, distributed as 6 elements on each side of the web. The total installed power was 1036 kW, i.e., 86.3 kW per individual IR element. The total length of the electric IR dryer was 3.6 m. The used IR power stated in Table 1 is given in the percentage of the installed power of each active IR element. In the thin multiple layer trials (Series ML) and the double coating trials (Reference Series D), only the six IR elements placed on the uncoated side of the web were active. Gentle drying was achieved by keeping all IR elements on the coated side inactive. In Reference S, one thick single layer (sample S1), all 12 IR elements were active in order to ensure sufficient drying.
  • One air turn with a radius 0.4 m was located between the IR dryer and the airfloat dryers. Formally, an air turn is not a dryer, but has some (minimal) impact on the drying process.
  • Three airfloat drying hoods, with maximum temperatures of 300 °C.
The experimental design of the thin multilayer approach was that each of the six thin layers was applied and dried before the next layer was applied. The coated reel was moved from the winder to the unwinding position in the front of the pilot machine for application of the next layer. The same method was used for the double-coated reference samples (Reference Series D).

2.4. Analyses of Coated Paperboard

2.4.1. Pinholes

Pinholes were measured according to SS-EN 13676. A coloring solution prepared by dissolving 0.5 g of dyestuff, Crossing Scarlet MOO (CAS 5413-75-2), in 100 mL of ethanol, was used. The coated side of the sample was in contact with the coloring solution for 5 min, after which the surplus was removed and any colored spots were counted. The results are expressed as the number of pinholes/dm2. The upper detection limit was set to 30 pinholes/dm2, since overlapping colored spots were frequently observed at a higher number of pinholes. No distinction was made between samples with more than 30 pinholes/dm2. The experiments were performed in five replicates within 1 week after the coating trials. For the pinhole measurements and all other analyses mentioned below, the samples were stored at 23 °C and 50% RH prior to measurements.

2.4.2. Grease Resistance

Grease resistance was measured via the so-called Kit Test according to TAPPI test method T559 (five replicates). In this test, 12 different mixtures of castor oil, toluene, and heptane (Kit solutions), varying in surface tension and viscosity, were prepared. The solutions were numbered from 1 to 12. The higher the Kit number of the Kit solution, the higher the tendency to penetrate the specimen. A drop of each Kit solution was applied to the surface of the specimen. The Kit rating of the specimen is defined as the highest numbered Kit solution that does not cause penetration in a period of 15 s. This means that a high Kit rating number indicates high grease resistance. The maximum Kit rating number is 12. The grease resistance measurements were performed 2 months after the coating trials.

2.4.3. Oxygen Transmission

The oxygen transmission rate (OTR) was measured according to the ASTM D 3985-05 standard using a Mocon Ox-Tran oxygen transmission rate tester, Model 2/21 MH from MOCON, Inc., Minneapolis, MN, USA. The test area was 5 cm2 and the OTR measurements were performed with air as permeant (oxygen concentration 20.9 vol%) and 50% RH in two or four replicates. All OTR measurements were completed within 3 months after the coating trials.
Ambient oxygen ingress rate (AOIR) was used to detect the dynamics of oxygen permeation during a period of time (t) for at least 30 h. Identical sample cells for an analyses of flat films as used by Nyflött et al. [32] were connected to a gas permeation analyzer (PermMate, Systech, Johnsburg, IL, USA). The volume of oxygen (Voxygen) was measured vs. t. Before each experiment, the sample cell was flushed on the inside with nitrogen to lower the oxygen concentration to about 1% (by vol.). The temperature and RH were 23 °C and 50%, respectively. Experimental details are described elsewhere [32]. The AOIR defined as (dVoxygen)/(dt) was calculated from the initial linear part of the curve Voxygen vs. t, at conditions where the oxygen pressure at the inside of the cell is small in comparison to the oxygen pressure at the outside of the cell, according to Larsen et al. [33]:
[ d V oxygen d t ] lin = V cell ( p f p i ) p atm ( t f t i ) ,
where (Vcell) is volume of the cell (330 mL), patm the atmospheric pressure, pi the oxygen pressure in the cell measured at the initial time ti, and pf is the oxygen pressure in the cell measured at the final time tf. The AOIR experiments were ceased after ca. 28 h. Only experimental points up to a maximum of 5% (by vol.) oxygen were used for the linear curve fit of the initial part of the curve Voxygen vs. t. However, experimental points at higher oxygen content had to be included for the uncoated paperboard due to the very rapid increase in oxygen concertation. All AOIR measurements were performed in two replicates and error limits indicate +/− half of the range.

2.4.4. Surface Structure

A Bendtsen apparatus (Bendtsen Tester, Model 58-27, Messmer Buchel, Veenendaal, The Netherlands) was used to test surface roughness according to ISO 8791-2. This method was based on air flow and the test pressure was 1.47 kPa. Measurements were repeated 21 and 42 times on coated samples and on uncoated brown unbleached side of the paperboard, respectively.
An optical surface profiler (ContourGT-K, Bruker Nano Inc., Tucson, AZ, USA) and the Vision 64 software program (Bruker Nano Inc., Tucson, AZ, USA) (version 5.60) were used in VSI mode in order to measure and calculate surface roughness parameters stated in Table 2. The total surface volume (Vs) was calculated as the sum of Sc and Sv. Stitched images (rectangular stitch) were used. Different combinations of objectives and field-of-view (FOV) lenses were used in order to obtain different image sizes, as shown in Table 3. Before analyzing the captured surface profiles, the images were optimized by applying 3 pixels median statistic filter, followed by data restore (data interpolated from vailed pixels around eventually occurring missing pixels), and finally by gentle tilt removal (plane fit). It was carefully controlled that natural volume equals negative volume and that positive volume = 0 nm3 after the removal of any tilt impact.
Profilometry roughness parameters of the two smallest image areas indicated in Table 3 were merged together as one population denoted as SMALL when mean values and standard deviation were calculated. A similar procedure was performed for the two largest image areas and the corresponding merged population was denoted as BIG. In total, six stitched images were analyzed for each of the two merged groups when mean values and standard deviations were calculated for sample Series ML. For uncoated paperboard (BASE), 18 and 14 stitched images were analyzed in the calculation of mean values and standard deviations for the merged groups SMALL and BIG, respectively.
The surface profiler was also used to detect flaws. The images were captured without stitching and at higher magnification than shown in Table 3. These measurements were performed using a Mirau 50x objective (Bruker Nano Inc., Tucson, AZ, USA) with optical resolution 0.55 µm and 1.0x FOV lens (Bruker Nano Inc., Tucson, AZ, USA), resulting in image area 124 µm × 95 µm and pixel size 0.20 µm. In the case of the detection of flaws, only tilt removal (plane fit) was used in order to optimize raw images.
All measurements of surface structure were completed within 22 months after the coating trials.

3. Results and Discussion

3.1. Analyses of Coated Paperboard

The number of detected pinholes per dm3, Kit rating number, and AOIR for the samples uncoated paperboard (BASE), Series ML, Reference S, and Reference Series D are shown in Table 4. The absence of pinholes from the second layer in Series ML indicates homogenous coatings without pinholes after only two thin layers at a cumulative coat weight of 2.4 g/m2. The reference samples S1 and D1 suffered from a very high number of pinholes. In the Reference Series D, sample D2 of total coat weight 6.7 g/m2 still showed a high number of pinholes. This clearly indicates that thin multiple coating of around 1 g/m2 in each layer is beneficial for creating a homogeneous layer without defects such as pinholes. This is valid at least for rough paperboard without any pre-coating at the selected coating configurations and drying strategy.
However, a very slight tendency toward blocking was observed for sample D2. This probably indicates that the number of active IR elements was too low for this particular run. It cannot be excluded that the weak blocking affected the results for sample D2 shown in Table 4. No tendency toward blocking was observed for the other runs. It should be noted that different metering tools were used in the comparison between thin multilayer coating and thick single and double coating. However, attempts to reach the desired high coat weight through the use of the soft tip failed, which was the reason for the change to a metering rod for samples S1, D1, and D2. This means the experimental design ensured that well-functioning metering geometries were used at each coat weight. Guezennec [27] concluded that it was difficult to find the appropriate drying strategy for PVOH barrier coatings, since the limit between blocking and blistering was very narrow.
For samples in Series ML (Table 2), Kit rating number 12 was observed already after two layers, in agreement with the observed pinhole density. Thus, two independent measurement methods (pinhole test and Kit test) did not indicate any surface defects, such as pores and pinholes, for samples in the series from ML2 to ML6. It is not surprising that the pinhole test and the Kit test both indicated similar variations in barrier properties, since both tests measure the penetration of non-aqueous test solutions. The used test solutions in the pinhole and Kit tests were ethanol with dissolved dye and a series of castor oil/toluene/n-heptane blends, respectively.
In addition to thin multilayer coatings consisting of pure PVOH, as reported in the present study, the use of additives to produce relatively defect-free barrier PVOH-based coatings at high machine speeds have been reported elsewhere. Guezennec [27] applied thick PVOH layers to pre-coated paperboard by the use of a pilot coater equipped with a soft-tip bent blade metering system at a speed of 70 m/min. Blistering defects, a phenomena assumed to occur during drying, were substantially reduced by the addition of micro-fibrillated cellulose (MFC) to the coating formulation. Three MFC grades were used in the pilot trials. All grades were based on spruce/pine dissolving pulp. One grade was produced by a combination of refining and enzymatic pretreatment followed by six passes through a high shear homogenizer. Two grades were produced by tempo oxidation followed by six passes through the high shear homogenizer or ultra-fine grinding in a grinder based on the rotor/stator concept. The amount of MFC ranged from 5 to 9% of the dry coatings. In the line with the reduced blistering, oxygen transmission rates were substantially reduced as a result of the addition of MFC. Morris et al. [28] pointed out the possibility of using the blends of ionomer dispersions and PVOH solutions in order to increase the grease resistance of PVOH-coated paper and paperboard. Both rod coating and reverse gravure coating stations were used in the pilot trials. High Kit rating numbers were observed, especially for substrates pre-coated with a clay/latex-containing coating color. Kit rating numbers of 12 were achieved at coating speed up to 600 m/min at coat weights of a few g/m2. The pre-coating of the substrate prior to PVOH application will result in the closure of surface pores, less sorption of applied fluids, increased coating hold out, and a more homogeneous layer [27]. All these effects are supposed to promote barrier properties. The methods described by Guezennec [27] and Morris et al. [28] show that a thin multilayer coating may not be the only way to minimize surface defects and achieve high Kit rating numbers. The further improvement of the barrier properties of PVOH-based coatings may be possible if the thin multilayer coating presented in the present study was to be combined with the formulation strategies of dispersions of suitable resins or nanomaterials and then added to the PVOH solution. It has also been reported elsewhere that hot calendering prior to PVOH coating may affect the homogeneity of the coated layer (i.e., number of pinholes and thickness variation), and thus the barrier properties of PVOH-coated papers [26]. A smoother base paper reduced inhomogeneities in the PVOH layer. However, it is beyond the scope of this paper to investigate the effects of additives, such as resins and nanomaterials, and the effects of pre-calendering and pre-coating.
Oxygen transmission was analyzed by the AOIR and OTR techniques. AOIR for uncoated paperboard (BASE), Series ML, and Reference Series D are shown in Table 4. All samples in Series ML showed a significantly lower AOIR, i.e., a slower increase in oxygen concentration, than the uncoated paperboard. Samples ML2, ML3, and ML6 showed very low AOIR in good accordance with homogeneous PVOH coatings, as indicated by the absence of pinholes and high Kit rating. However, the relatively high AOIR value of sample ML5 deviated from the trend shown by the measurements of pinholes and Kit rating. Sample ML4 also showed unexpectedly high AOIR, even if one of the repeated experiments showed AOIR in accordance with ML2, ML3, and ML6. Two possible reasons for the deviations of samples ML4 and ML5 are the local variations in the degree of homogeneity of the coatings and leakage during measurements. Nevertheless, since the measurements of oxygen transport are very susceptible to local defects and air leakage, focus should be on the lowest values since the lowest values may indicate what is possible. Despite the two outliers, the AOIR values of Series ML in Table 4 show that the thin multilayer approach makes it possible to reduce oxygen transport through the coated paperboard. The Reference Series D also showed lower AOIR than the uncoated paperboard, but no values were as low as those observed in Series ML.
A great variation in oxygen transmission from one spot to another spot on the same sample is, to some extent, expected, since oxygen transmission through a barrier-coated paper or paperboard is strongly affected by local variations in defect density and structural inhomogeneity in the barrier layer. OTR measurements following the ASTM D 3985-05 standard were performed in order to verify the general AOIR trend presented in Table 4. OTR for samples ML3, ML6, and D2 are shown in Table 5. As in almost all oxygen transmission tests of coated rough paperboard, substantial variations between different spots of the same sample were observed. The difference between sample ML3 and ML6 was within the experimental error, even if the results gave some indication that six thin layers resulted in lower OTR than three thin layers. Sample D2 showed substantially higher OTR than ML3 and ML6, in agreement with the AOIR shown in Table 4. This difference was also expected from the variation in pinhole density presented in Table 4. The OTR values for ML3 and ML6 are lower than presented elsewhere for PVOH coatings at high machine speed. Guezennec [27] presented OTR above 600 cm3/m2 day at 23 °C, 0% RH for PVOH-coated paperboard produced in the pilot coater trials at 70 m/min (mineral pre-coated substrate and PVOH coat weight 9.6 g/m2).
It is well-known that gas and water vapor transmission is very susceptible to minor defects in the coating layer, variations in the coat weight/density/structure and the degree of crystallinity of polymer [34], to mention only some of the most important parameters. The degree of crystallinity is affected by heat treatment (drying conditions) and increased crystallinity in the PVOH coatings is expected to result in lower water solubility [35] and lower oxygen permeation [36]. Local variations in coat weight, structure, and crystallinity may explain the variations in AOIR and OTR shown in Table 4 and Table 5. The overall interpretation of AOIR and OTR shown in these two tables is that it is possible to reduce oxygen transmission through thin multilayer PVOH coatings and that this effect is already considerable after two thin layers.

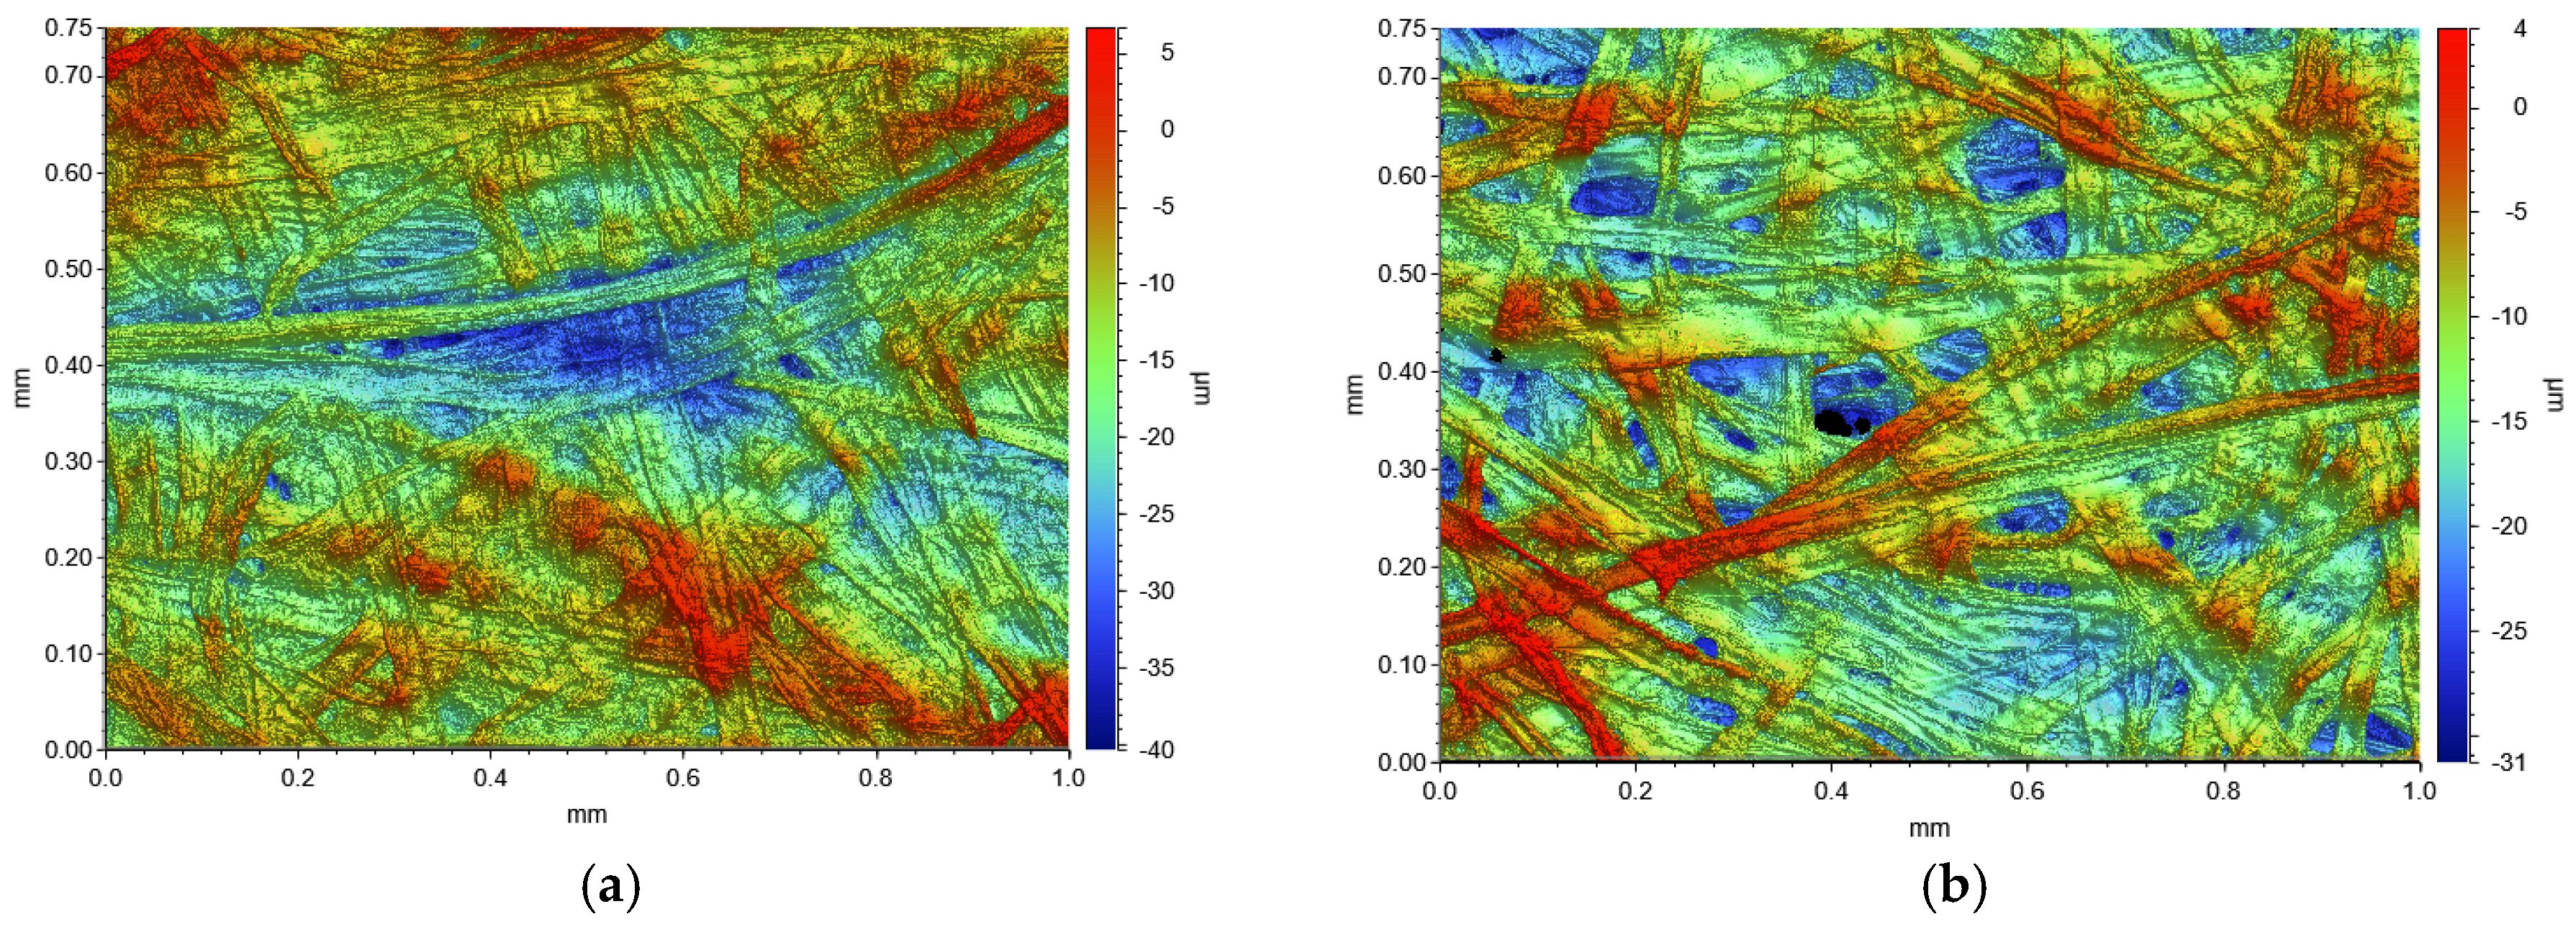
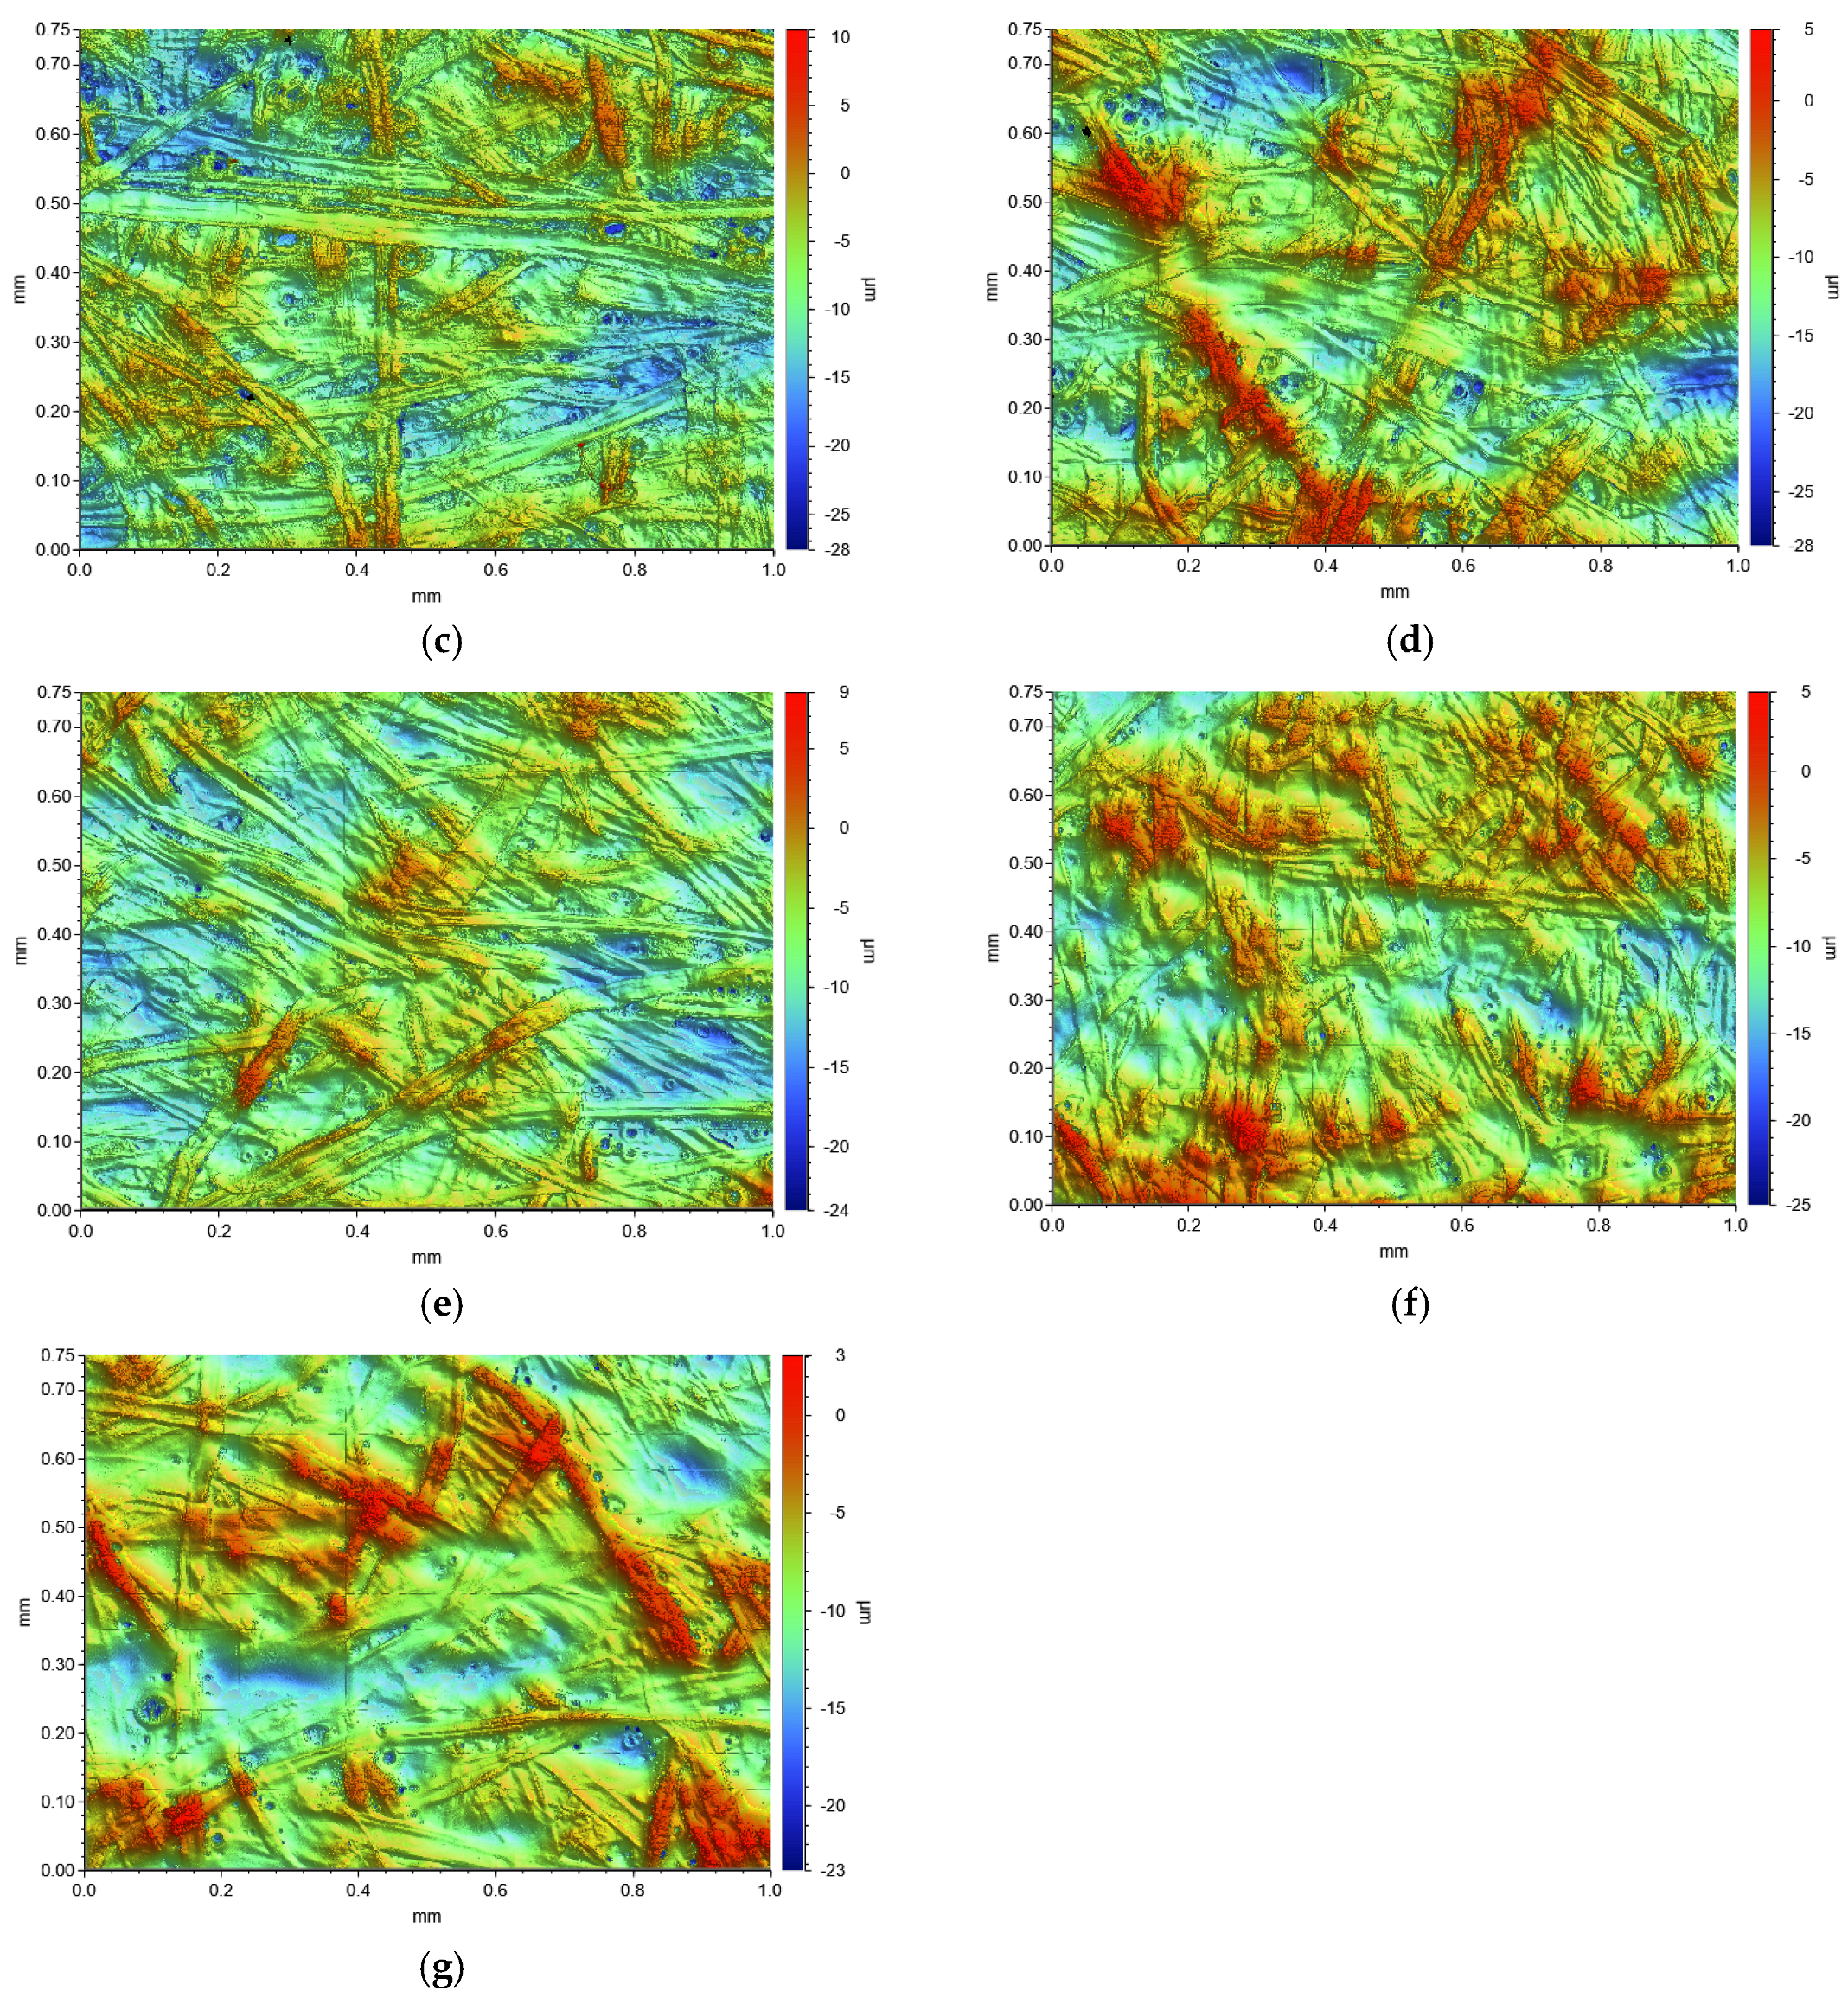
3.2. Surface Structure

Bendtsen surface roughness for the uncoated paperboard samples (BASE), Series ML, Reference S, and Reference Series D are shown in Table 6. All coated samples possessed lower Bendtsen roughness than the uncoated paperboard. As expected, the surface roughness decreased with the increasing number of layers in the multilayer coating series (Series ML). The rapid decrease in roughness between subsequent layers levelled off after the second layer. This may be a consequence of the reduced uptake of water into the substrate after the first pass, since water sorption may promote fiber swelling and induce subsequent and fiber movement (fiber rising) during the drying process. All coated samples possessed a lower Bendtsen roughness than the uncoated paperboard. A comparison of the Bendtsen roughness after the first pass indicated that one thick layer smoothed out the surface unevenness to a greater extent than one thin layer. Comparing the Bendtsen roughness at similar coat weights, no significant difference between single, double, and multiple coatings was observed. However, a comparison of the Bendtsen mean values for samples ML5, ML6, S1, and D2 indicated a possible lower surface roughness for the samples coated according to Series ML. Table 6 also includes average roughness (Sa) calculated from stitched optical profiler images of two different image size ranges, denoted as SMALL and BIG. The increase in Sa values after the first pass (ML1) can be explained from swelling after the first pass when the PVOH solution is in contact with the uncoated surface, in good agreement with Guezennec [27]. The coat weight of ML1 was 1.36 g/m2. Based on a density of PVOH of 1.3 g/cm3 [35], the average thickness of the coating corresponds to 1.0 µm. Due to the transparency of the coating, it is possible that the coatings 1 µm of thickness or smaller may only allow for a reflected signal from the surface of the underlying paperboard substrate. Nevertheless, regardless of whether the signal comes from the top layer or from the substrate below it, Table 6 clearly indicates the swelling of the surface after the first pass in Series ML. With the exception of ML1, the Bendtsen surface roughness and the profilometer measurements showed the same trend. The fact that the two methods for the characterization of surface roughness indicated slightly different trends for ML1 can be explained by the nature of the measurement techniques. The Bendtsen instrument measures the air flow between the paper and a reference plane, while optical profilometry is a non-contact method. The smaller Sa for the SMALL images compared to that of BIG can be explained through the difference in image size. The absolute value of deviations from the mean plane was expected to increase when the image size became large enough to, at least in part, capture height variations between two or more fiber flocs. Figure 2 shows examples of stitched profilometer images for uncoated paperboard and Series ML. It is clear from Figure 2 that the image sizes of 0.4 mm × 0.4 mm and 0.5 mm × 0.5 mm had lower probability of capturing the influence of fiber flocs than image sizes of 1.0 mm × 0.75 mm or larger.
Guezennec [27] measured roughness average as Ra for thick pilot-coated PVOH layers on pre-coated paperboard by atomic force microscopy. The Ra value for an area of 3 µm × 3 µm was reported to be 0.7 nm. The reason for this very smooth surface, in comparison with Sa values in Table 6, is probably the smooth surface of the substrate obtained via mineral pre-coating in combination with the small image size. The fact that the definitions of the roughness parameters Sa and Ra are dissimilar, and consequently do not give exactly the same value, can be disregarded in this comparison.
Optical profilometry was used for the measurement of the surface void volumes of the dry coated paperboard (Series ML) and the uncoated paperboard (BASE). The results of the analyses are shown in Table 7. As expected from the Sa analyses (Table 6), the SMALL group resulted in lower void volumes than the BIG group. The surface void volumes followed the same trend as observed for the Sa values. Sc and Sv represent the volume of the major part of the voids and of the deepest features, respectively. The contributions from the very top of the coatings such as single protruding objects are excluded from the calculation of the surface void volume.
In bearing analyses, the ratio between roughness parameters, such as Sc and Sv, provides important information about the morphology. Figure 3 shows the ratio Sc/Sv for BASE and Series ML. For the sample BASE, the error bars for the merged groups SMALL and BIG were based on 18 and 14 individual images. Thus, these error bars are of high confidence and reflect the true variation of the paperboard. The variations between the samples in Series ML probably reflect the natural variation of the baseboard. Figure 3 indicates that the ratio Sc/Sv was constant after all passes, which in turn, indicates a high degree of contour coating and fiber coverage.
The volume PVOH solution per unit area after metering (VPVOH) at each of the passes can be calculated from the coat weight in Table 2, assuming a density of the applied PVOH solution of 1.04 g/cm3 [37]. In order to obtain good fiber coverage, VPVOH should be larger than the surface voids at the passage of the metering element. The surface voids at the passage of the metering element in a high speed coating process are difficult to measure. Vs represents the surface volume before wetting and is supposed to be much larger than the real surface void volume underneath the metering element due to compression during metering, as outlined by Jäder and Engström in pilot trials equipped with a stiff steel blade metering device [38]. It has been reported elsewhere that a soft resilient metering tip resulted in a higher degree of contour coating, and thus more homogeneous fiber coverage, compared to a stiff steel blade metering device [30]. One reason for this difference between these two metering devices may be the possible deformation of the soft resilient metering tip during metering, which in turn indicates that less compression of the substrate would be required in order to achieve sufficient fiber coverage. As a very rough indication of surface voids at the metering stage, Vs can be used. VPVOH and Vs for each of the passes in Series ML are shown in Table 8, where the Vs values represent the mean value of captured SMALL and BIG images shown in Table 7. The numbers of pinholes and the Kit values (Table 2) and Figure 2 indicate good fiber coverage as from the second pass. Thus, the applied wet amount was sufficient to achieve good fiber coverage. Since the values of VPVOH and Vs were approximately the same, the compression of the surface at the metering tip was needed for the applied volume of PVOH solution to be sufficient to coat the highest fibers, and thus provide good coverage.

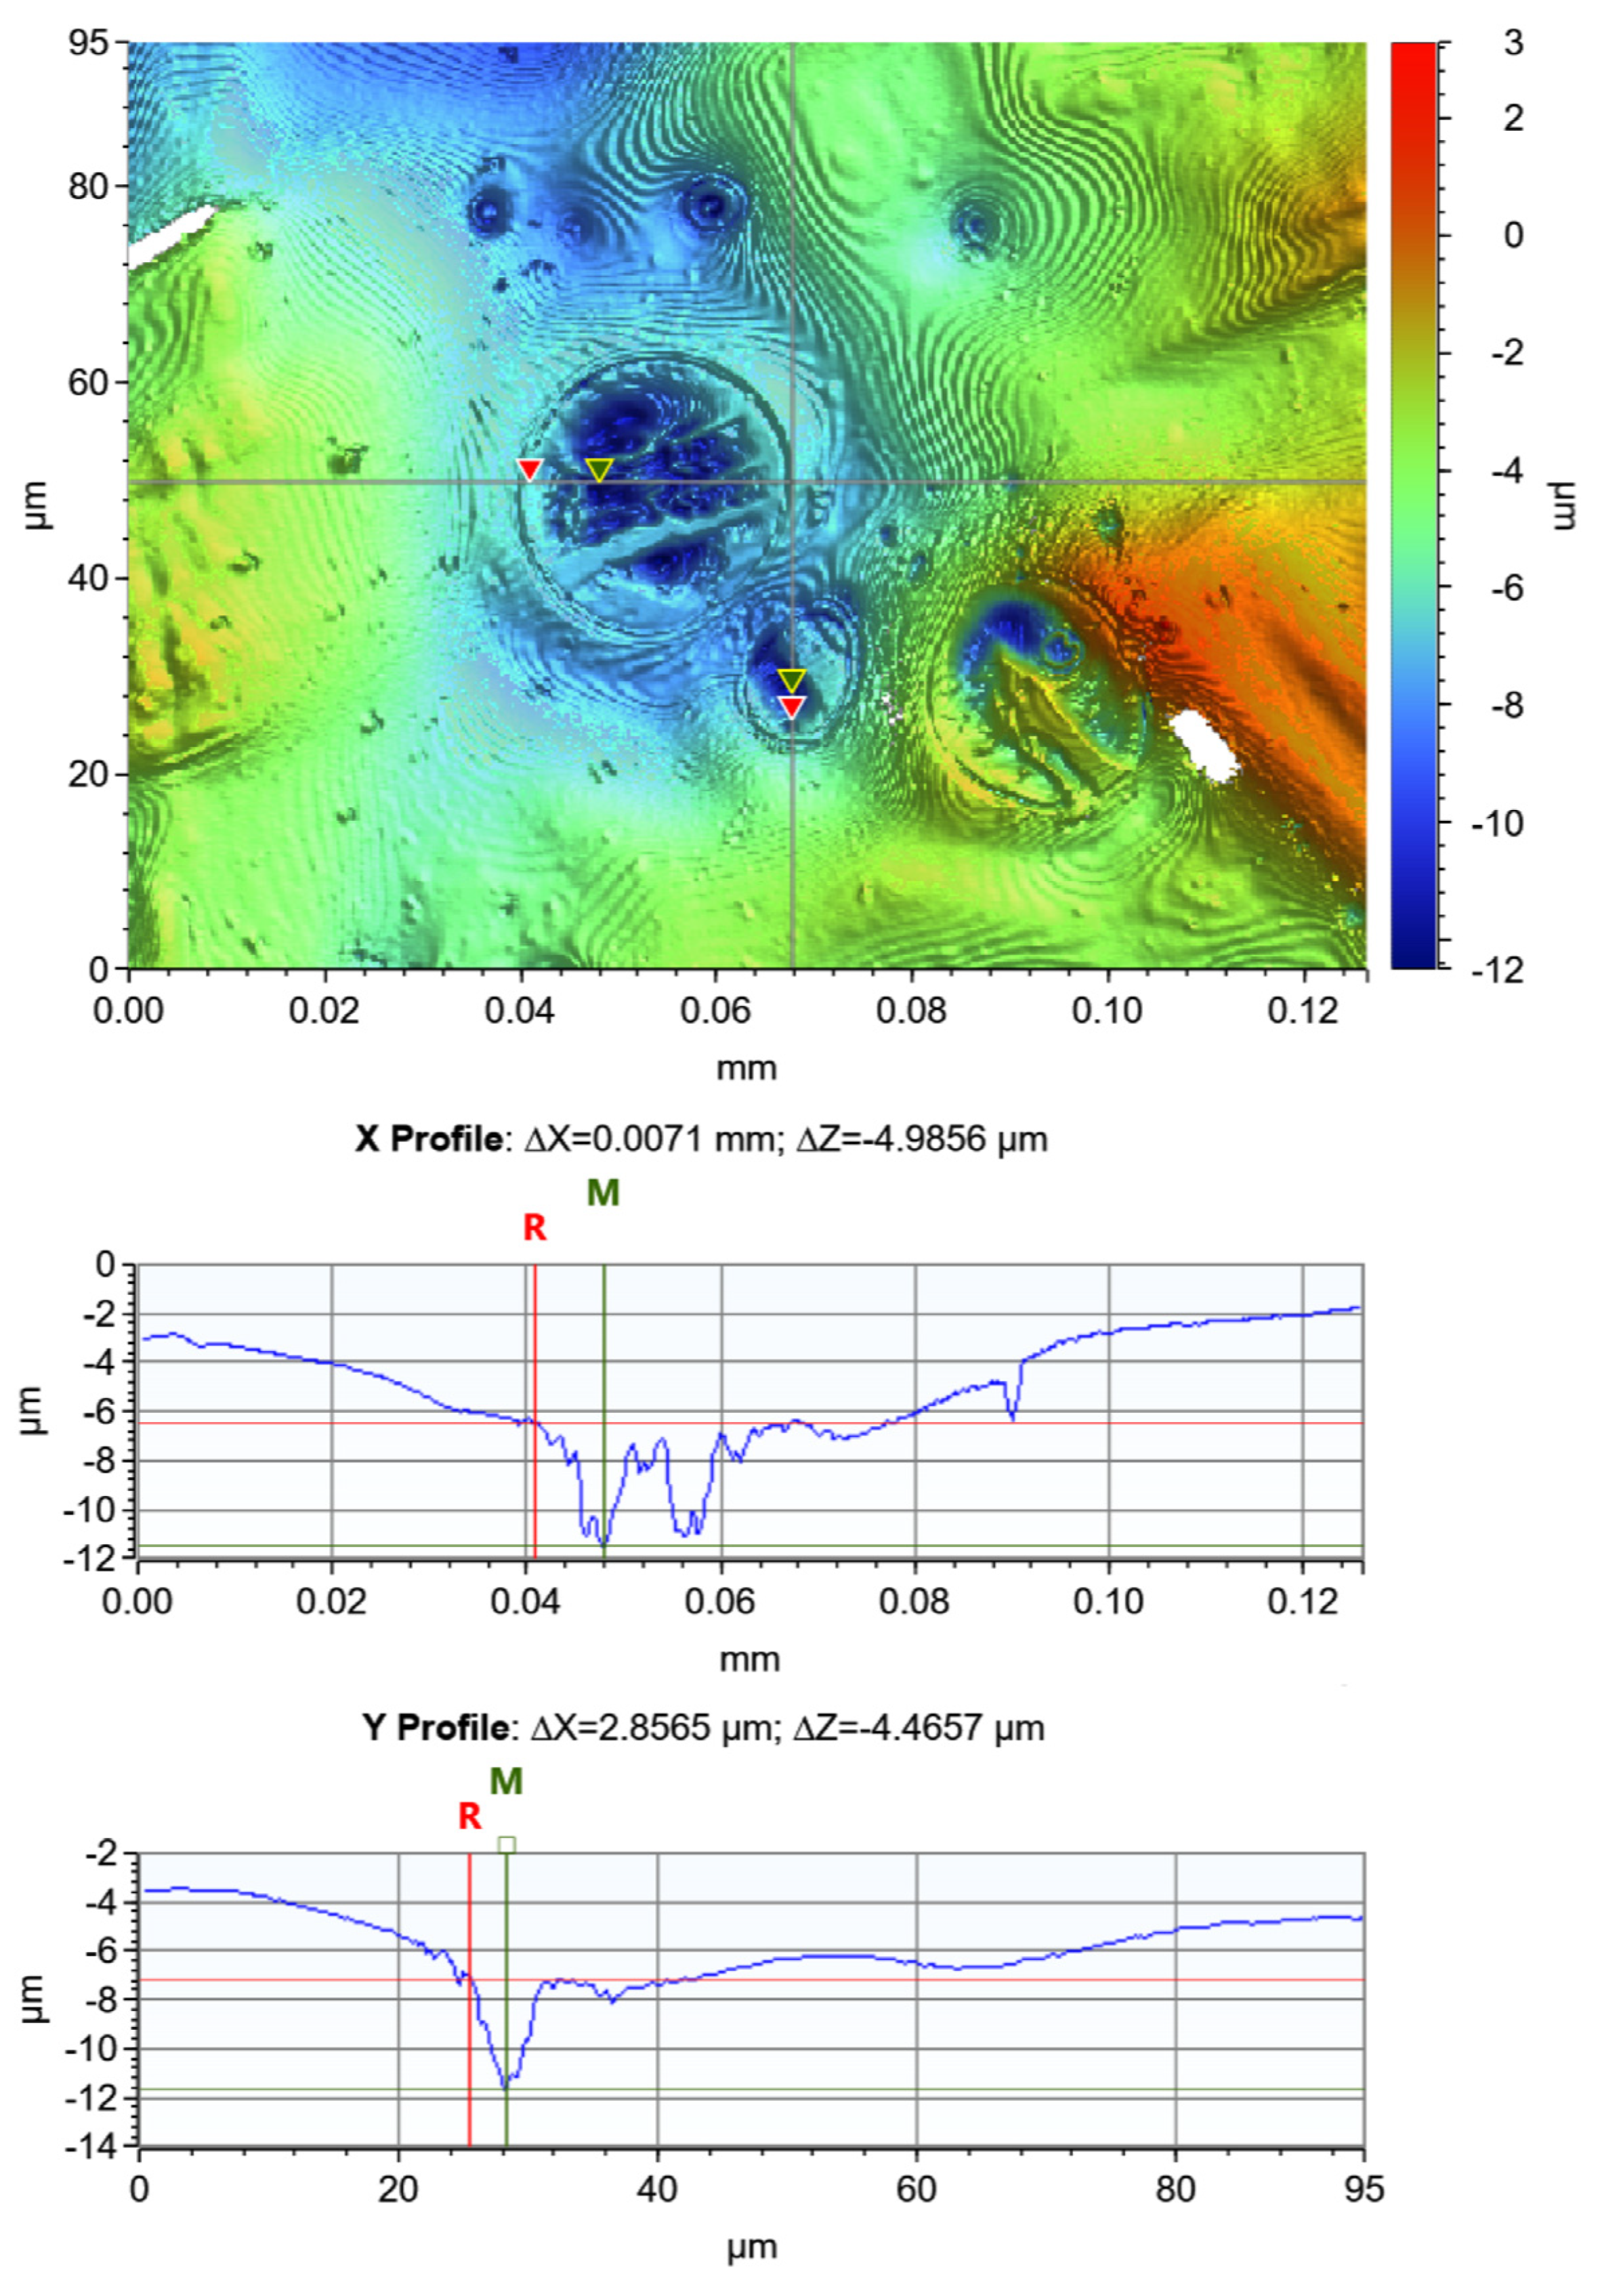
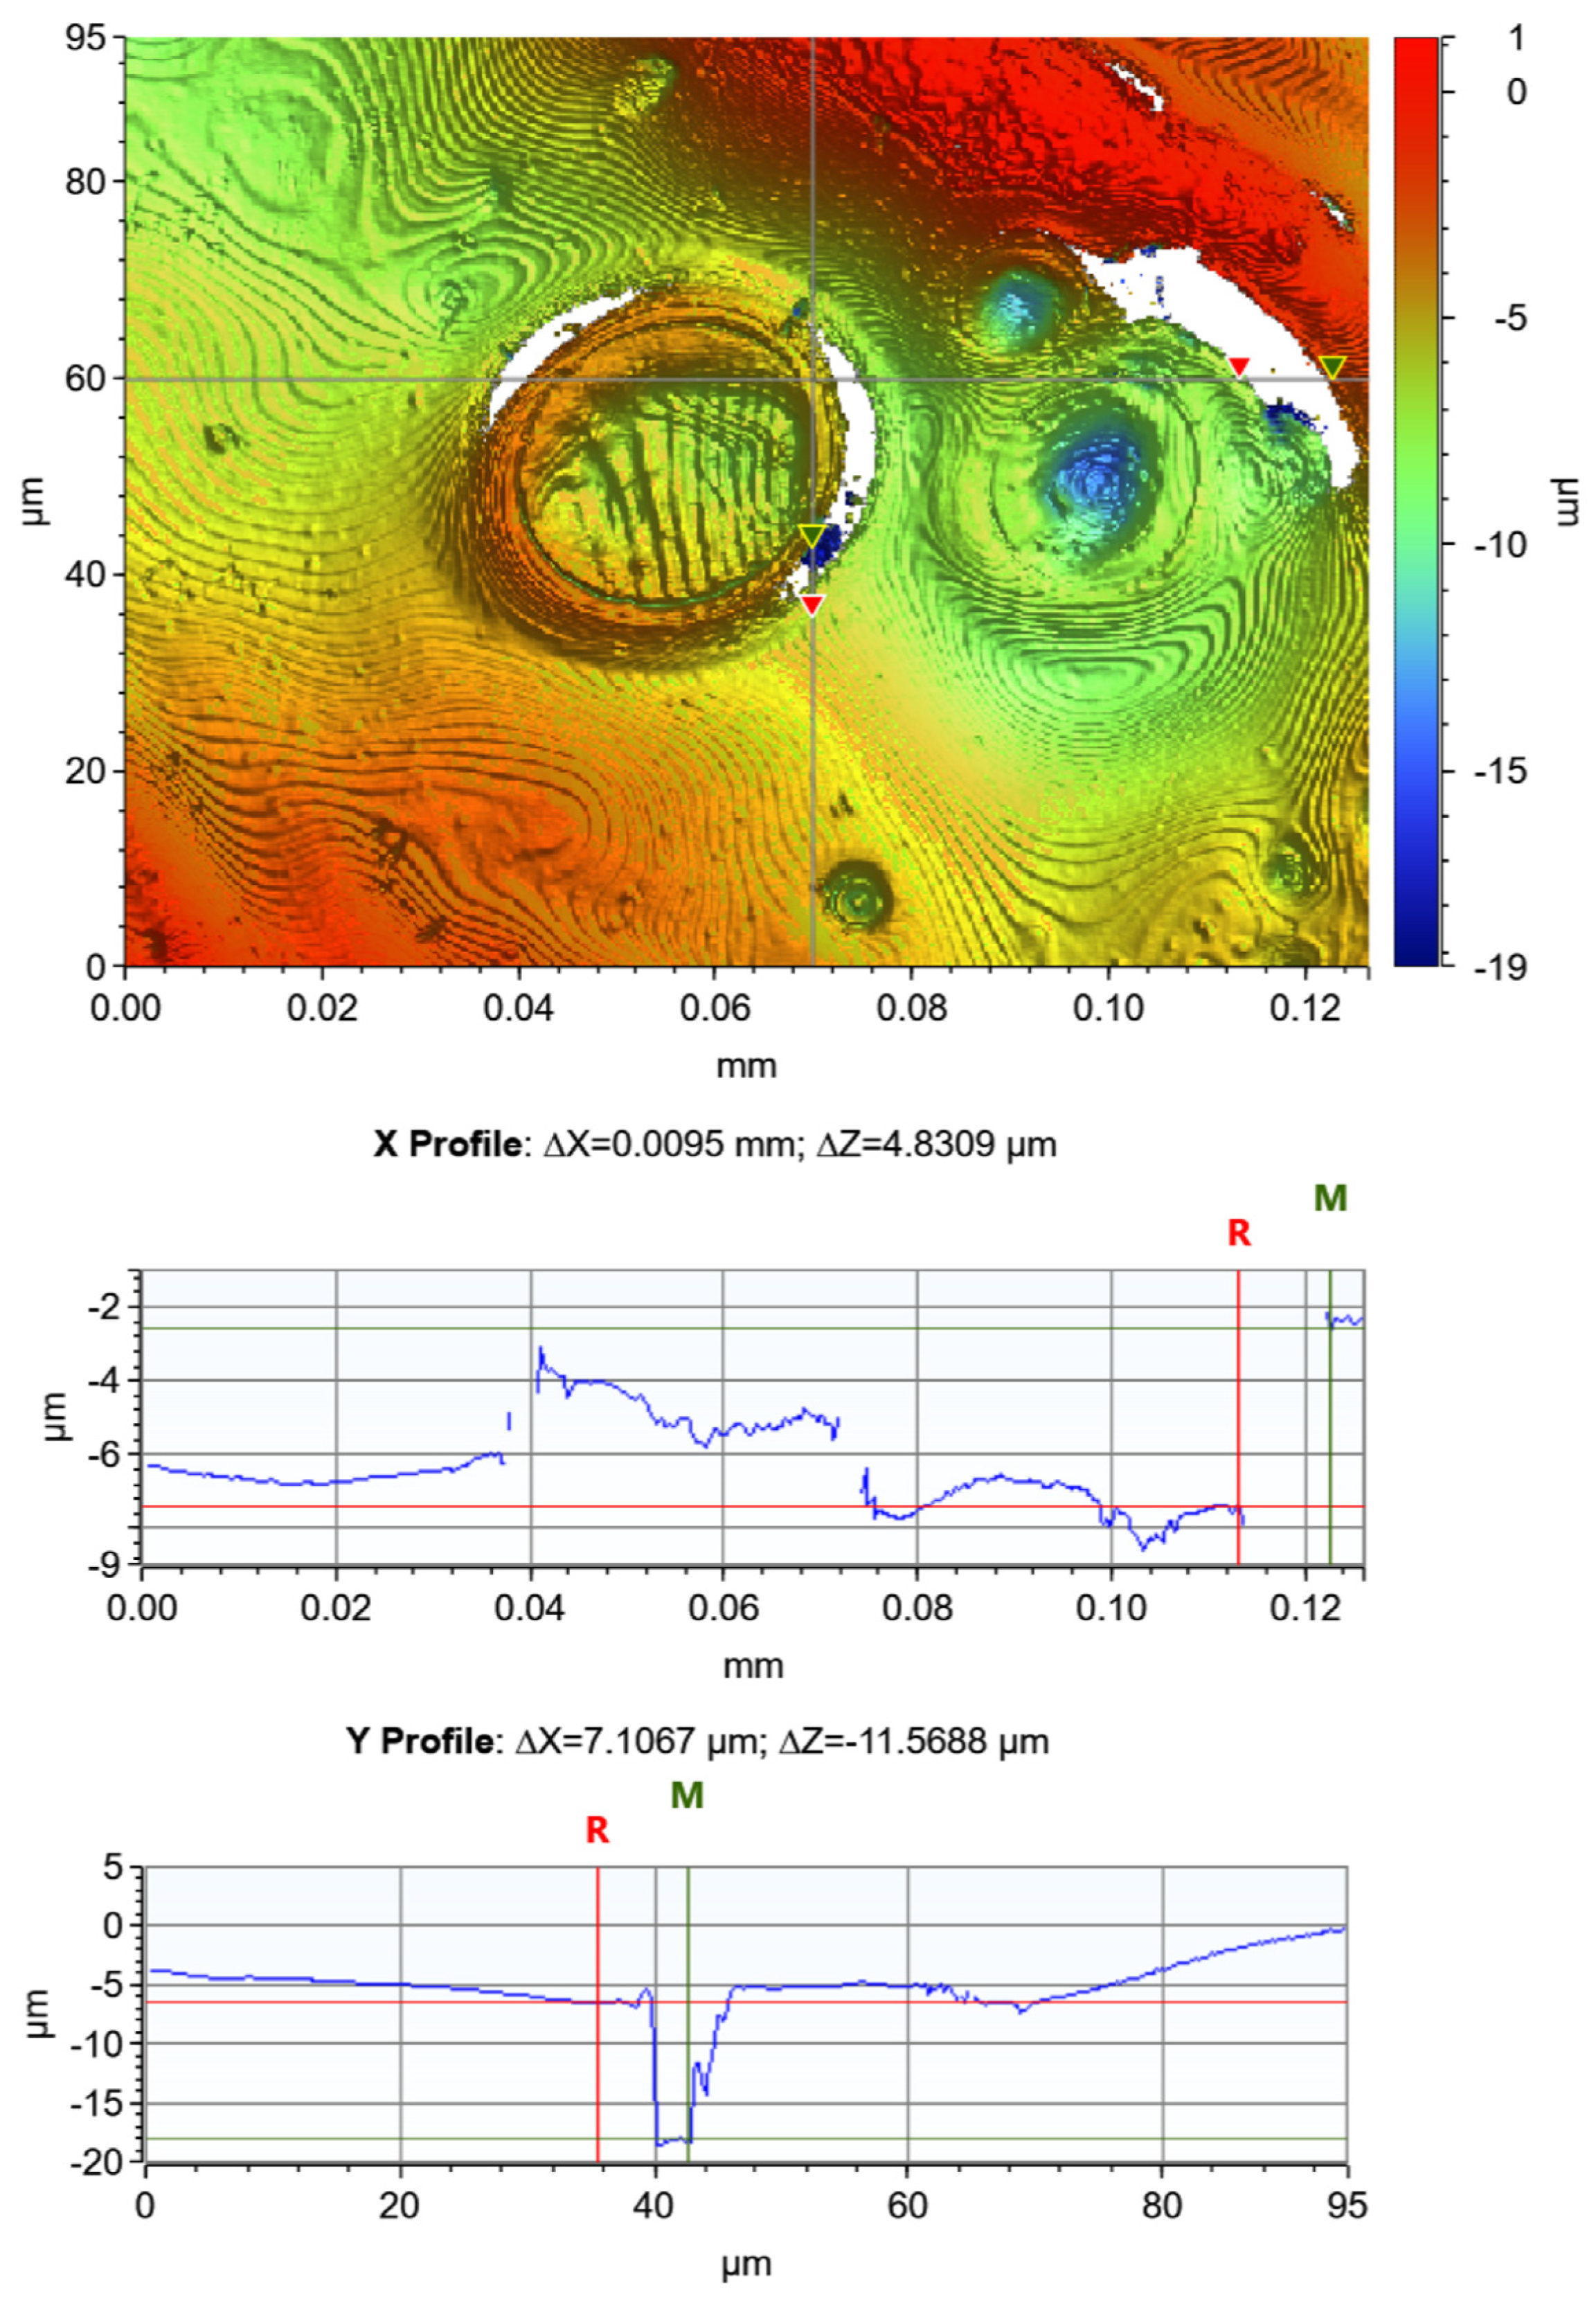
3.3. Surface Defects

The huge variation in AOIR and OTR values is likely to be explained in terms of variations in lateral distribution of surface defects not visible in the standardized pinhole test. Figure 4 shows an example of large crater (diameter ca. 20 µm) observed in sample ML6. Craters are most likely formed as a result of blistering. This crater may very well have been formed during previous passes. The X profile revealed that the maximum depth of the crater was about 5.0 µm compared to the surrounding area. The total coat weight for ML6 was 6.1 g/m2. Based on a density of solid PVOH of 1.3 g/cm3, the average thickness of the PVOH layer was estimated to be 4.7 µm. One has to keep in mind that Table 3 showed no pinholes and Kit rating number 12. Thus, it is likely that the craters of this type did not continue as pinholes through the entire PVOH layer, a conclusion supported by the fact that the bottom of the crater is visible. It is likely that a thin PVOH layer covers the bottom of the crater. Alternatively, the reflected signal origins from a cellulose fiber localized directly at the bottom of the crater. Even if craters of this type could not be identified as pinholes, they may contribute to increased oxygen transport through the coated paper due to the reduced thickness of the PVOH layer at the center of the crater. Other craters are also visible in Figure 4. The maximum depth of the crater next to the big crater in the center of the image is about 4.5 µm, according to the Y profile. The ripples visible in Figure 4 are mathematical artefacts from the calculation, probably caused by a large amount illumination, and can be ignored. In addition to craters, Figure 4 shows areas of missing pixels (drop-out pixels). In principle, there are two explanations for the missing pixels:
  • The slope is very high. The maximum slope for the Mirau 50x objective is 25.0° for a perfect smooth surface. A rough surface, such as paper and paperboard, contains small facets where the surface is almost horizontal even if the average slope is fairly high. This means that a reflected signal may be observed even at an average slope of much higher than 25°.
  • The surface contains very deep and narrow notches or similar defects. However, a reflected signal from the bottom may be seen on condition that the bottom is flat (horizontal). Only a small proportion of the light is reflected out from the inside of this notch.
It is difficult to conclude anything about the structure inside the areas of missing pixels in Figure 4, since these areas were completely free of any information. The shortest imaginary straight line between the homogenous areas next to the missing pixels in the lower right corner resulted in a slope of ca. 33°. A slope analysis also revealed real pixels at higher slopes, something that is expected from the fairly rough surface. Thus, the areas of missing pixels need to be given a further explanation than the slope alone. Possible interpretations include both steep slopes and deep defects such as cracks.
Two more examples on blisters and defects in the PVOH layer in sample ML6 are shown in Figure 5 and Figure 6. The X profile in Figure 5 reveals a crater of depth 6.3 µm, as measured from the elevated rim of the crater. All of the craters, with the exception of one, possessed no drop-out pixels. Figure 5 reveals that missing pixels are located in the vicinity of elevations. The missing pixels inside a crater were close to the ridge of the crater. The other areas of missing pixels were close to elevated areas that may be cellulose fibers. Contrary to Figure 4, a few low-lying points inside areas with missing pixels could be observed. The Y profile in Figure 5 shows lower lying surfaces inside an area of missed pixels. The depth of the surface is 12.6 µm or more. This distance is substantially greater than the calculated mean thickness of the PVOH coating. The presence of signals from lower lying surfaces indicates a crack or some other kind of cavity. As with Figure 4, the ripples visible in Figure 5 and Figure 6 can be ignored.
Figure 6 reveals more examples on surfaces located quite far down inside or adjacent to areas of missed pixels. The most evident example is the surroundings to the ridge of the crater in the center. In the left and right hand sides of the crater, 2 to 4 µm wide areas of missing pixels are observed. The Y profile indicates a continuous low-lying dark blue surface that runs across the surface with missing pixels. The most plausible explanation for this is that the dark blue area shows the bottom of a crack or other type of cavity located 11 to 12 µm below the homogeneous adjacent area just outside of the crater. For a crack or notch that is 4 µm wide and 10 µm deep, one cannot observe any outcoming signals unless the bottom is flat (horizontal). The slope is about 32° for an imaginary straight line over the area of missing pixels from the edge of the crater to the homogenous area on the right hand side of the crater. Thus, the reason for missing pixels may be cracks that are very narrow or slopes that are very high. It is also possible that the PVOH coating has formed an ultra-thin film (thickness of about 1 µm or less) covering all white areas in Figure 4, Figure 5 and Figure 6 with a cavity beneath. This thin film covering the defects may also be partly broken or may be very thin to reflect light from the top surface. It cannot be excluded that a cavity exists near more of the elevated objects, even in the case where no deep cracks or voids were detected. Even though there is more than one possible interpretation of the drop-out pixels, the contour images in Figure 5 and Figure 6 clearly support the idea that at least some areas of missing pixels represent coating defects (crack, void, ultra-thin film, etc.). The observed cracks or voids in Figure 5 and Figure 6 (deep blue regions) are much deeper than the average thickness of the PVOH coating and may impair gas barrier properties. Possible defects behind drop-out pixels may result in high oxygen transmission. The uneven distribution of these flaws may also (partly) explain the experimental variation in observed OTR and AOIR.
Figure 6 also reveals another fairly large area of missing pixels on the right in the image. The shortest distance between the left cursor in the X profile and the elevated area on the right hand side of missing pixels is 6.8 µm, resulting in a slope of 35°. In this case, it is also likely that the missing area represents a crack or a void, since a very small dark blue contiguous region can be observed at some points near the edge. The height difference from the bottom to the homogeneous adjacent area to the left is ca. 11 µm.
The height level at the center of the big crater in Figure 6 is roughly the same as in the surrounding area. It is likely that this blistering occurred during the drying of previous layers, and subsequently filled in when the top layers were applied. Just to the right of the large crater in Figure 6, a smaller crater is visible. This second crater has a depth of approximately 5 µm and resembles to some extent the craters shown in Figure 4 and Figure 5. Similar to most other craters shown in Figure 4 and Figure 5, it is likely that the crater to the right was created during the first applied layers. In contrast to the big crater in the center of Figure 6, the greater depth of the smaller crater to the right may indicate that the crater remained open after the first pass (or passes), promoting evaporation during the drying of subsequent layers.
At least some of the areas of missing pixels near protruding objects, such as fibers and craters, may represent cracks or cavities. Reflected signals from cracks or cavities near fibers and craters were detected in good accordance with this assumption. Since the application of an aqueous PVOH solution causes swelling and fiber movements, protruding objects may be more compressed during metering than lower lying objects, followed by subsequent spring back when the load is removed. It is not impossible that these movements in the substrate can cause stresses that lead to cracks and similar defects. The elongation caused by the tensile stress may also contribute to a thinning of the PVOH layer. On the other hand, the compression of the surface seems to be needed in order to ensure good fiber coverage and a contour type of coating. Optimum barrier properties seem to require a carefully balanced compression. A resilient metering tip was used in the present study, which may reduce density variations in the substrate after compression, similar to deformable backing rolls which are used in soft calendering operations [39]. It is not impossible that the material properties of the resilient soft tip enable new ways to optimize the compression. However, it was beyond the scope of the present study to optimize the pressure and compression beneath the metering tip.

4. Conclusions

Several of the well-known problems concerning the high-speed barrier PVOH coating from aqueous solutions onto paperboard without pre-coating could be avoided by thin multiple coatings. In addition, a soft resilient metering element and a technique enabling a short dwell time between application and metering were used in all trials, which resulted in high grease resistance and low pinhole density. A consequence of the relatively low polymer concentration in aqueous solutions is that a high amount of coating solutions will be needed even at low coat weights. A high volume of applied wet coating is helpful in filling the surface voids and valleys between fibers and fiber flocs. The surface analyses showed that the wet volume in the multilayer approach was generally quite similar to the volume of surface voids and valleys. The high wet volume promoted fiber coverage but cannot alone explain the good fiber coverage as indicated by an absence of pinholes. In addition, good fiber coverage seemed to be promoted by the compression of the substrate beneath the metering element and the use of a resilient material of the metering element. In the present study, the effects of different shapes and the mechanical properties of the used resilient soft metering element were not investigated.
Grease barriers corresponding to Kit rating 12 and no detection of pinholes were obtained after only two thin layers (total coat weight 2.4 g/m2). The analyses of the roughness parameters obtained via profilometry revealed good fiber coverage and a distribution of the coatings that very much resembles contour coating. However, an OTR of 100 ± 89 cm3/m2 day atm was observed after six passes, which is higher than reported elsewhere for low-speed laboratory-coated samples. Profilometer images revealed certain coating defects even after the application of six thin layers, which may explain the differences in OTR between the pilot coatings presented here and low-speed laboratory coatings. The observed defects consisted of blistering (big craters), small craters, and defects that resemble cracks and voids. Most of the blistering seemed to occur during the initial passes and the big craters were closed in subsequent passes. The cracks and voids seemed to be more severe for oxygen barrier properties than the big craters. One likely process for the formation of the cracks and voids is the compression of protruding objects, such as fibers and craters. However, a level of compression of the substrate was needed for good fiber coverage. The optimal pressure beneath the metering element is a balance between sufficient compression required to obtain fiber coverage and the avoidance of excessive compression that may introduce defects in the barrier layer. The proposed mechanism for defect formation is of course only valid for substrates without pre-coating and highlights some of the challenges in high-speed PVOH barrier coating operations on paperboards without pre-coating.

Author Contributions

Conceptualization, P.E. and L.J.; methodology, H.C., E.B., P.E. and L.J.; formal analysis, H.C. and L.J.; investigation, H.C., E.B. and L.J.; resources, P.E.; writing—original draft preparation, H.C. and L.J.; writing—review and editing, H.C., E.B., P.E. and L.J.; supervision, L.J.; project administration, P.E. and L.J.; funding acquisition, P.E. and L.J. All authors have read and agreed to the published version of the manuscript.

Funding

This research was funded by the SWEDISH GOVERMENTAL AGENCY FOR INNOVATION SYSTEMS (VINNOVA), file reference number 2014-00319; STIFTELSEN NILS OCH DORTHI TROЁDSSONS FORSKNINGSFOND, Sweden, grant application number 866/15; and the KNOWLEDGE FOUNDATION, Sweden, file reference number 20180036.

Institutional Review Board Statement

Not applicable.

Informed Consent Statement

Not applicable.

Data Availability Statement

Not applicable.

Acknowledgments

The authors thank Billerud Frövi, Frövi, Sweden, for performing the Kit rating analyses. Johan Larsson, Billerud Gävle, Gävle, Sweden, is gratefully acknowledged for valuable discussions.

Conflicts of Interest

The authors declare no conflict of interest.

References

  1. Engström, G. Pigment Coating. In Volume 3 Paper Chemistry and Technology; Ek, M., Gellerstedt, G., Henriksson, G., Eds.; De Gruyter: Berlin, Germany, 2009; pp. 341–384. [Google Scholar] [CrossRef]
  2. Åkesson, R. Development of the metering size press: A historical perspective. In Proceedings of the TAPPI Metered Size Press Forum, Nashville, TN, USA, 16–18 May 1996; pp. 1–12. [Google Scholar]
  3. Åkesson, R. Fifty years of Swedish coating technology development. In Proceedings of the TAPPI Coating Conference, Toronto, ON, Canada, 2–5 May 1999. [Google Scholar]
  4. Dickson, R.; Forsström, U.; Grön, J. Blade versus metering-size-press coating. Nordic Pulp Pap. Res. J. 2002, 17, 434–439. [Google Scholar] [CrossRef]
  5. Balzereit, B.; Drechsel, J.; Burri, P.; Naydowski, C. Blade versus metering-size-press coating. Tappi J. 1995, 78, 182–188. [Google Scholar]
  6. Endres, I.; Tietz, M. Blade, film and curtain coating techniques and their influence on paper surface characteristics. Tappi J. 2007, 6, 24–32. [Google Scholar]
  7. Kuusipalo, J.; Savolainen, A.; Laiho, E.; Penttinen, T. Extrusion coating and products. In Paper and Paperboard Converting (Papermaking Science and Technology Series; Volume 12), 2nd ed.; Kuusipalo, J., Ed.; Finnish Paper Engineers’ Assosiation/Paperi ja Puu Oy: Helsinki, Finland, 2008; pp. 106–166. [Google Scholar]
  8. Tuominen, M.; Lahtinen, K. Conventional and novel coating methods. In Paper and Paperboard Converting (Papermaking Science and Technology Series; Volume 12), 2nd ed.; Kuusipalo, J., Ed.; Finnish Paper Engineers’ Assosiation/Paperi ja Puu Oy: Helsinki, Finland, 2008; pp. 167–185. [Google Scholar]
  9. Larsson, T.; Emilsson, P. Impact of cupstock coated with multilayer WBBC’s process & product performance. In Proceedings of the TAPPI PaperCon Live, Atlanta, GA, USA, 3–6 October 2021; Volume 1, pp. 152–162. [Google Scholar]
  10. Vähä-Nissi, M.; Taskinen, S.-M.; Savolainen, A. Repulpability of dispersion-coated substrates. In Proceedings of the TAPPI Coating Conference and Trade Fair, Washington, DC, USA, 1–4 May 2000; pp. 151–161. [Google Scholar]
  11. Kumaki, Y.; Kawagoe, M.; Takada, S.; Garcia, P.J.; Neufeld, L.C. Enhanced polyvinyl alcohol as a barrier paper coating for food packaging. In Proceedings of the TAPPI Paper Conference and Trade Show PaperCon, Nashville, TN, USA, 27–30 April 2014; Volume 2, pp. 910–921. [Google Scholar]
  12. Olsson, E.; Johansson, C.; Larsson, J.; Järnström, L. Montmorillonite for starch-based barrier dispersion coating—Part 2: Pilot trials and PE-lamination. Appl. Clay Sci. 2014, 97–98, 167–173. [Google Scholar] [CrossRef]
  13. Kjellgren, H.; Gällstedt, M.; Engström, G.; Järnström, L. Barrier and surface properties of chitosan-coated greaseproof paper. Carbohydr. Polym. 2006, 65, 453–460. [Google Scholar] [CrossRef]
  14. Javed, A.; Rättö, P.; Järnström, L.; Ullsten, H. Lignin-Containing Coatings for Packaging Materials—Pilot Trials. Polymers 2021, 13, 1595. [Google Scholar] [CrossRef]
  15. Hamdani, S.S.; Li, Z.; Rolland, E.; Mohiuddin, M.; Rabnawaz, M. Barrier and mechanical properties of biodegradable paper bilayer-coated with plasticized starch and zein. J. Appl. Polym. Sci. 2023, 140, e53440. [Google Scholar] [CrossRef]
  16. Christophliemk, H.; Johansson, C.; Ullsten, H.; Järnström, L. Oxygen and water vapor transmission rates of starch-poly(vinyl alcohol) barrier coatings for flexible packaging paper. Prog. Org. Coat. 2017, 113, 218–224. [Google Scholar] [CrossRef]
  17. Abdullah, Z.W.; Dong, Y.; Han, N.; Liu, S. Water and gas barrier properties of polyvinyl alcohol (PVA)/starch (ST)/glycerol (GL)/halloysite nanotube (HNT) bionanocomposite films: Experimental characterisation and modelling approach. Compos. Part B 2019, 174, 107033. [Google Scholar] [CrossRef]
  18. Yu, J.; Ruengkajorn, K.; Crivoi, D.-G.; Chen, C.; Buffet, J.-C.; O’Hare, D. High gas barrier coating using non-toxic nanosheet dispersions for flexible food packaging film. Nat. Commun. 2019, 10, 2398. [Google Scholar] [CrossRef]
  19. Song, Y.; Gerringer, J.; Qin, S.; Grunlan, J.C. High oxygen barrier thin film from aqueous polymer/clay slurry. Ind. Eng. Chem. Res. 2018, 57, 6904–6909. [Google Scholar] [CrossRef]
  20. Johansson, C.; Clegg, F. Hydrophobically modified poly(vinyl alcohol) and bentonite nanocomposites thereof: Barrier, mechanical, and aesthetic properties. J. Appl. Polym. Sci. 2015, 132, 41737. [Google Scholar] [CrossRef]
  21. Ogunsona, E.O.; Mekonnen, T.H. Multilayer assemblies of cellulose nanocrystal—Polyvinyl alcohol films featuring excellent physical integrity and multi-functional properties. J. Colloid Interface Sci. 2020, 580, 56–67. [Google Scholar] [CrossRef]
  22. Wolf, J.R.; Strieder, W. Surface and void tortuosities for a random fiber bed: Overlapping, parallel cylinders of several radii. J. Membr. Sci. 1990, 49, 103–115. [Google Scholar] [CrossRef]
  23. Thellen, C.; Cheney, S.; Ratto, J.A. Melt processing and characterization of polyvinyl alcohol and polyhydroxyalkanoate multilayer films. J. Appl. Polym. Sci. 2013, 127, 2314–2324. [Google Scholar] [CrossRef]
  24. Salmas, C.; Giannakas, A.; Katapodis, P.; Leontiou, A.; Moschovas, D.; Karydis-Messinis, A. Development of ZnO/Na-montmorillonite hybrid nanostructures used for PVOH/ZnO/Na-montmorillonite active packaging films preparation via a melt-extrusion process. Nanomaterials 2020, 10, 1079. [Google Scholar] [CrossRef]
  25. Jack, L.J. Extrusion Apparatus and Method and Extruded Thermoplastic Polymer. U.S. Patent 6080346, 27 June 2000. [Google Scholar]
  26. Schuman, T.; Wikström, M.; Rigdahl, M. The effect of hot calendering of the substrate on the barrier properties of poly(vinyl alcohol)-coated papers. Nordic Pulp Pap. Res. J. 2003, 18, 81–89. [Google Scholar] [CrossRef]
  27. Guezennec, C. Development of New Packaging Materials Based on Micro- and Nano-Fibrillated Cellulose. Ph.D. Thesis, Université de Grenoble, Grenoble, France, 2012; pp. 81–232. [Google Scholar]
  28. Morris, B.; Wang, H.; Zhang, D.; Green, J.; Glick, W. Scale-up study of Ionomer-PVOH grease barrier coating. In Proceedings of the TAPPI Paper Conference and Trade Show PaperCon, Atlanta, GA, USA, 19–22 April 2015; Volume 1, pp. 166–175. [Google Scholar]
  29. Emilsson, P.; Larsson, T.; Järnström, L. Multiple barrier application for improved overall efficiency. In Proceedings of the PTS Coating Symposium, Munich, Germany, 16–17 September 2015; pp. 343–359. [Google Scholar]
  30. Larson, T.; Emilsson, P. Optimization of coating with water-based barriers. Tappi J. 2019, 18, 111–118. [Google Scholar] [CrossRef]
  31. Mesic, B.; Järnström, L.; Johnston, J. Latex-based barrier dispersion coating on linerboard: Flexographic multilayering versus single step conventional coating technology. Nordic Pulp Pap. Res. J. 2015, 30, 350–360. [Google Scholar] [CrossRef]
  32. Nyflött, Å.; Axrup, L.; Carlsson, G.; Järnström, L.; Lestelius, M.; Moons, E.; Wahlström, T. Influence of kaolin addition on the dynamics of oxygen mass transport in polyvinyl alcohol dispersion coatings. Nordic Pulp Pap. Res. J. 2015, 30, 385–392. [Google Scholar] [CrossRef]
  33. Larsen, H.; Kohler, A.; Magnus, E.M. Ambient oxygen ingress rate method—An alternative method to Ox-Tran for measuring oxygen transmission rate of whole packages. Packag. Technol. Sci. 2000, 13, 233–241. [Google Scholar] [CrossRef]
  34. Miller, K.S.; Krochta, J.M. Oxygen and aroma barrier properties of edible films: A review. Trends Food Sci. Technol. 1997, 8, 228–237. [Google Scholar] [CrossRef]
  35. Marten, F.L. Vinyl Alcohol Polymers. In Encyclopedia of Polymer Science and Technology, 4th ed.; Wiley Online Library: Hoboken, NJ, USA, 2002. [Google Scholar] [CrossRef]
  36. Nyflött, Å.; Petkova-Olsson, Y.; Moons, E.; Bonnerup, C.; Järnström, L.; Carlsson, G.; Lestelius, M.; Minelli, M. Modeling of oxygen permeation through filled polymeric layers for barrier coatings. J. Appl. Polym. Sci. 2017, 134, 44834. [Google Scholar] [CrossRef]
  37. Rošic, R.; Pelipenko, J.; Kristl, J.; Kocbek, P.; Bešter-Rogač, M.; Baumgartner, S. Physical characteristics of poly (vinyl alcohol) solutions in relation to electrospun nanofiber formation. Eur. Polym. J. 2013, 49, 290–298. [Google Scholar] [CrossRef]
  38. Jäder, J.; Engström, G. Frequency analysis evaluation of base sheet structure in a pilot coating trial using different thickener systems. Nordic Pulp Pap. Res. J. 2004, 19, 360–365. [Google Scholar] [CrossRef]
  39. Wikström, M. Calendering. In Volume 3 Paper Chemistry and Technology; Ek, M., Gellerstedt, G., Henriksson, G., Eds.; De Gruyter: Berlin, Germany, 2009; pp. 319–340. [Google Scholar] [CrossRef]
Figure 1. The pilot coater used in the trials. The insertion shows an enlargement of the application/metering unit.
Coatings 13 01489 g001
Figure 2. Contour images of (a) BASE; (b) ML1; (c) ML2; (d) ML3; (e) ML4; (f) ML5; and (g) ML6. Image size of 1.0 mm × 0.75 mm. The bar to the right indicates the z-axis.
Coatings 13 01489 g002aCoatings 13 01489 g002b
Figure 3. Ratio between Sc and Sv for Series ML and uncoated paperboard. Error bars indicate standard deviation.
Coatings 13 01489 g003
Figure 4. Contour image, X profile, and Y profile of sample ML6. Drop-out pixels indicated by white coloring. The bar on the right side of the image indicates the z-axis. The locations of the red (R) and green (M) cursors are shown in the contour image.
Coatings 13 01489 g004
Figure 5. Contour image, X profile, and Y profile of sample ML6. Drop-out pixels indicated by white coloring. The bar on the right side of the image indicates the z-axis. The locations of the red (R) and green (M) cursors are shown in the contour image.
Coatings 13 01489 g005
Figure 6. Contour image, X profile, and Y profile of sample ML6. Drop-out pixels indicated by white coloring. The bar on the right side of the image indicates the z-axis. The locations of the red (R) and green (M) cursors are shown in the contour image.
Coatings 13 01489 g006
Table 1. Summary of the coat weight drying strategies at the pilot trials indicating number of layers (passes), total (cumulative) coat weight, IR power, and IR element and temperature (T) numbers in each of the three drying hoods. Coat weights were calculated from the measured consumption of the barrier solution.
Sample NameNumber of LayersTotal Coat Weight (g/m2)IR Power
(%)
Number of Active IR ElementsT Drying Hood #1 (°C)T Drying Hood #2 (°C)T Drying Hood #3 (°C)
Uncoated paperboard
BASE00N/AN/AN/AN/AN/A
Series ML—IR 30%
ML111.4306606060
ML222.4306606060
ML333.4306606060
ML444.3306606060
ML555.2306606060
ML666.1306606060
Reference S thick single coating—IR 80%
S114.7801225025060
Reference Series D thick double coating—IR 80%
D113.780625025060
D226.780625025060
Table 2. List of selected roughness parameters that were obtained from analyses of surface profiler images.
SymbolNameDescription
SaAverage roughness over a measurement areaArithmetic mean of the absolute values of the surface departures from the mean plane.
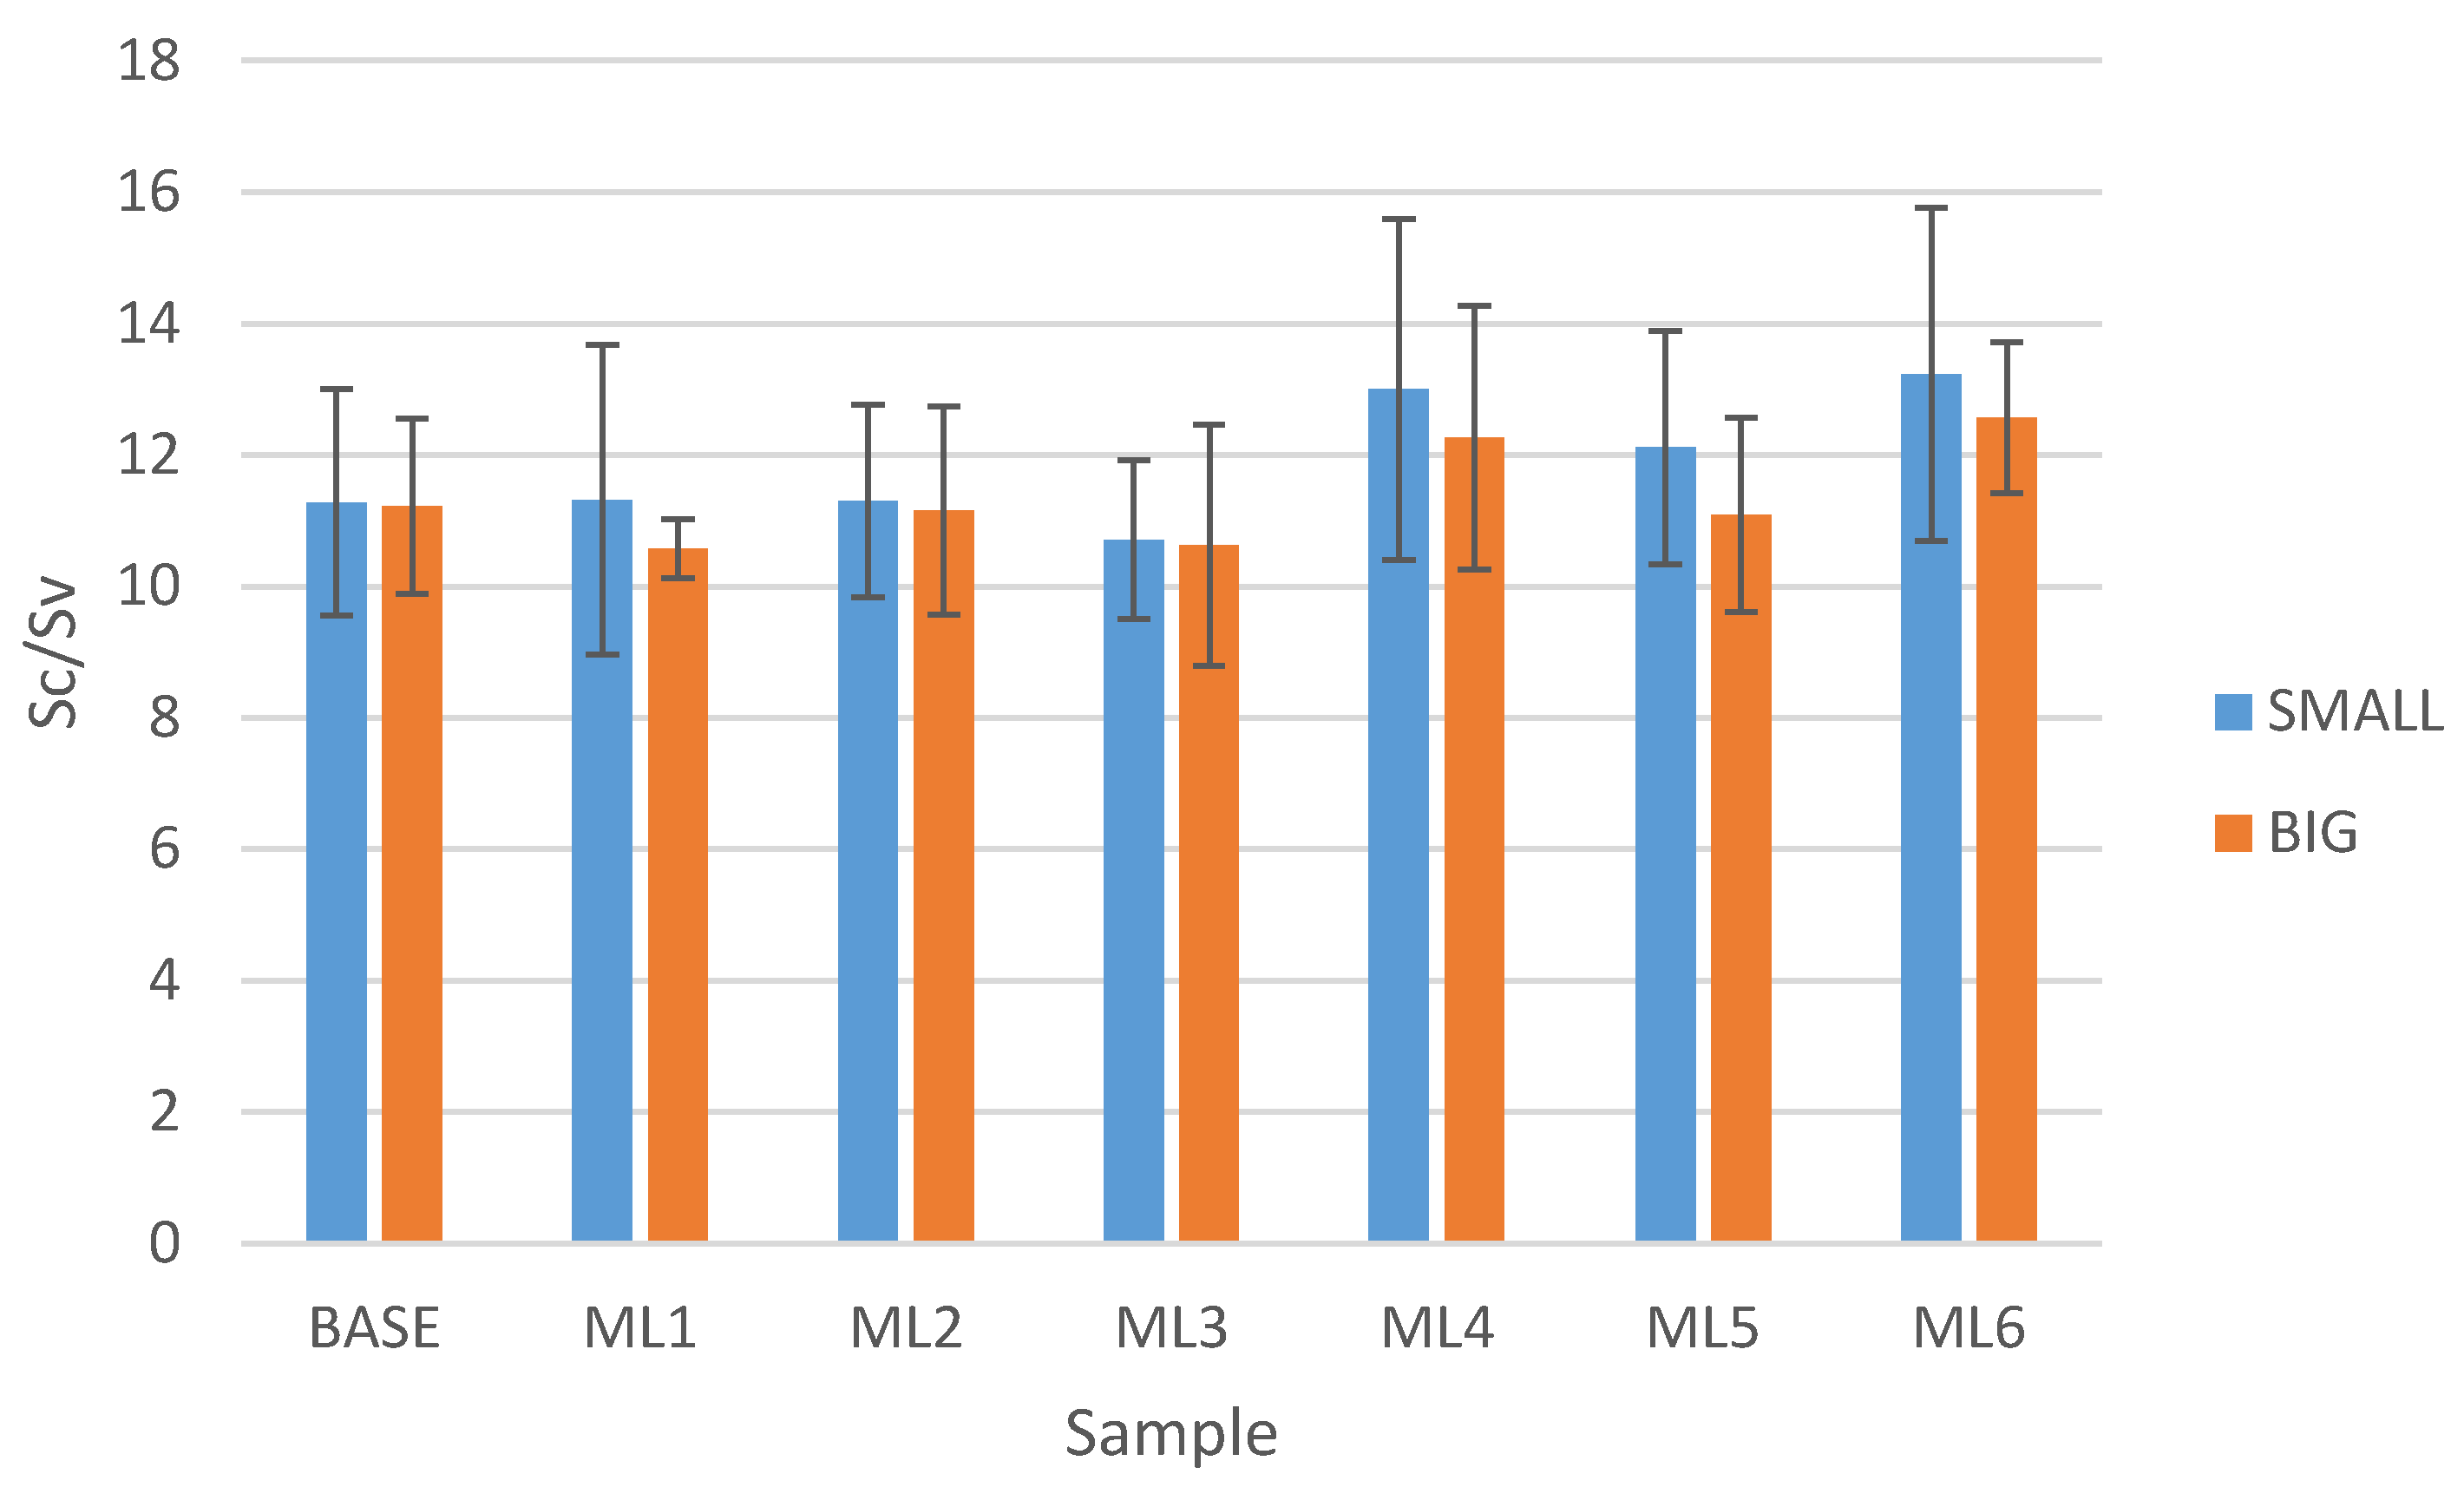
ScCore void volumeThis parameter is derived from bearing analyses and expresses the volume (e.g., of a fluid filling the core surface) that the surface would support from 10% to 80% of the bearing area ratio.
SvSurface void volumeThis parameter is derived from bearing analyses and expresses the volume (e.g., of a fluid filling the valleys) that the surface would support from 80% to 100% of the bearing area ratio.
Table 3. List of surface profiler objective, field-of-view lens, and pixel size for the stitched images.
Image AreaObjectiveFOVPixel Size
(mm × mm)TypeOptical Resolution (µm)-(µm)
0.4 × 0.4Mirau 50x0.550.55x0.35
0.5 × 0.5Mirau 20x0.752.0x0.26
1.0 × 0.75Mirau 50x0.550.55x0.35
2.0 × 2.0Mirau 20x0.750.55x0.92
Table 4. Number of pinholes, Kit rating numbers, and AOIR for multiple-coated paperboard and thick single- and double-coated paperboard. AOIR error limits indicate the range. All other error limits indicate standard deviation.
Sample NamePinholes 1 (Number/dm2)Kit Rating NumberAOIR
(mL/day)
Uncoated paperboard
BASE>30Not measured663 ± 15
Series ML IR 30%
ML1>30534.4 ± 0.4
ML20.0 ± 0.0125.8 ± 4.5
ML30.0 ± 0.0121.9 ± 1.3
ML40.0 ± 0.01254.9 ± 45.7
ML50.0 ± 0.01251.3 ± 7.1
ML60.0 ± 0.0124.2 ± 3.8
Reference S thick single coating—IR 80%
S1>30Not measuredNot measured
Reference Series D thick double coating—IR 80%
D1>30Not measured77.8 ± 0.1
D29.8 ± 1.9Not measured13.6 ± 5.2
1 Parts of the pinhole and Kit rating results are based on Emilsson et al. [29].
Table 5. OTR values for three of the samples. Upper detection limit was 1000 cm3/m2 day atm. Error limits indicate standard deviation.
SampleOTR (cm3/m2 day atm) 1
Test 1Test 2Test 3Test 4Mean
ML317750134322259 ± 173
ML6514122627100 ± 89
D2>1000>1000-->1000
1 Partly based on Emilsson et al. [29].
Table 6. Bendtsen roughness for BASE, Series ML, Reference S, and Reference Series D and profilometry average roughness (Sa) for BASE and Series ML. Sa values calculated from stitched images of two different sizes. Error limits indicate standard deviation.
Sample NameBendtsen Roughness
(mL/min)
Sa
SMALL
(µm)
Sa
BIG
(µm)
Uncoated paperboard
BASE1119 ± 1393.88 ± 0.664.62 ± 0.53
Series ML IR 30%
ML1869 ± 1424.39 ± 0.595.24 ± 0.68
ML2644 ± 1112.90 ± 0.153.93 ± 0.90
ML3631 ± 842.82 ± 0.503.51 ± 0.45
ML4623 ± 902.76 ± 0.643.67 ± 0.66
ML5546 ± 702.61 ± 0.533.18 ± 0.37
ML6536 ± 771.89 ± 0.542.72 ± 0.63
Reference S thick single coating—IR 80%
S1644 ± 124Not measuredNot measured
Reference Series D thick double coating—IR 80%
D1641 ± 167Not measuredNot measured
D2602 ± 90Not measuredNot measured
Table 7. Core void volume (Sc), surface void volume (Sv), and total surface volume (Vs) for BASE and Series ML calculated from stitched images of two different sizes. Error limits indicate standard deviation.
Sample NameSc
SMALL
(µm3/µm2)
Sc
BIG
(µm3/µm2)
Sv
SMALL
(µm3/µm2)
Sv
BIG
(µm3/µm2)
Vs
SMALL
(µm3/µm2)
Vs
BIG
(µm3/µm2)
Uncoated paperboard
BASE5.91 ± 1.057.10 ± 0.090.53 ± 0.120.63 ± 0.096.44 ± 1.137.84 ± 0.90
Series ML—IR 30%
ML16.82 ± 1.107.90 ± 0.950.62 ± 0.080.75 ± 0.097.44 ± 1.098.63 ± 1.04
ML24.54 ± 0.345.82 ± 1.220.41 ± 0.050.54 ± 0.154.94 ± 0.356.36 ± 1.36
ML34.38 ± 0.685.67 ± 0.610.41 ± 0.060.56 ± 0.144.79 ± 0.736.23 ± 0.71
ML44.31 ± 1.115.62 ± 0.980.33 ± 0.060.47 ± 0.104.65 ± 1.156.09 ± 1.06
ML54.05 ± 0.844.77 ± 0.510.34 ± 0.090.44 ± 0.914.39 ± 0.915.21 ± 0.58
ML62.97 ± 0.904.25 ± 0.980.23 ± 0.060.34 ± 0.073.20 ± 0.944.59 ± 1.05
Table 8. Volume applied PVOH solution after metering (VPVOH) at each of the consecutive passes and total surface volume of the substrate entering the coating unit (Vs), calculated as mean value of the two image classes shown in Table 7.
Sample NameNumber of PassesVPVOH
(cm3/m2)
Vs
(cm3/m2)
ML117.57.1
ML225.37.9
ML335.35.7
ML444.85.5
ML554.85.4
ML664.84.8
Disclaimer/Publisher’s Note: The statements, opinions and data contained in all publications are solely those of the individual author(s) and contributor(s) and not of MDPI and/or the editor(s). MDPI and/or the editor(s) disclaim responsibility for any injury to people or property resulting from any ideas, methods, instructions or products referred to in the content.

