Article

Effect of High-Temperature Thermal Shock on Solar Absorption Rate of Alumina Coating

Key Laboratory of Pressure System and Safety, Ministry of Education, School of Mechanical and Power Engineering, East China University of Science and Technology, No. 130 Meilong Road, Shanghai 200237, China
*
Author to whom correspondence should be addressed.
Coatings 2023, 13(9), 1527; https://doi.org/10.3390/coatings13091527
Submission received: 21 July 2023 / Revised: 28 August 2023 / Accepted: 28 August 2023 / Published: 31 August 2023

Abstract

:
With the development of the aerospace industry, the close exploration of the Sun has become a human demand. However, close-range exploration means that the detection satellite needs to accept the test of high temperatures above 1400 °C, so a thermal protective coating is a necessary part of the detection satellite to isolate heat and reflected light. Al2O3 coating has the characteristics of high emissivity and low absorptivity, and it is the best choice for thermal protection coating. However, the coating is subjected to thermal cycles, including heating and cooling, as the satellite rotates around the Sun, which could result in a change in the structure and properties of the coating. Therefore, thermal shock experiments were carried out, and the influence of microstructure on the absorption rate of the Al2O3 coating was investigated. In this study, an Al2O3 coating was prepared by atmospheric plasma spraying (APS). The coating was subjected to a thermal shock (TS) test at 1400 °C using a self-made flame shock device, and coating samples under different thermal shock degrees were obtained. A scanning electron microscope (SEM) was used to characterize the coating pores, and the effects of the coating pore size, aspect ratio (A/R) and cracks in the coating on the optical properties of the coating under different thermal shock degrees were analyzed. In order to clarify the influence of coating microstructure changes on the optical properties of the coating under different thermal shock degrees, not only relevant experiments were carried out, but also the solar reflectivity of Al2O3 coatings with different pore structures was analyzed by the finite element method using finite-difference time-domain (FDTD). The results show that increasing the porosity and aspect ratio of the pores can improve the partial solar absorption of the coating. It was also found that the transverse crack propagation improves the solar reflectance of the coating.

1. Introduction

With the rapid development of the aerospace industry, people are no longer limited to observing the Sun from afar, and closer observation has become a human demand. However, a closer exploration means that the detector will have to withstand higher temperatures. The U.S. Parker Solar Probe is the first aircraft to fly into the solar corona [1]. It is only located at eight solar radii on the solar surface and is used to study the heat transfer of the solar corona and detect high-speed solar wind and equatorial low-speed flow. At the same time, in order to resist high temperatures, the detector has a layer of insulation board made of carbon composite material, which can reflect light and insulate heat, effectively isolating external heat and maintaining the internal temperature of the detector suitable for electronic instrument operation [2,3,4].
The ceramic coating on the Parker Solar Detector is the key to the temperature control of the detector. It needs to have low solar light absorption and high infrared emissivity to make the detector stable in long-term high-temperature operation [5]. Research [6,7,8] shows that many compounds, such as ceramic polymers, nitrides and metal oxides, are high-emissivity materials and are commonly used materials for preparing coatings.
In the aerospace industry, the use of thermal protective coatings is very common. The spraying of ablative thermal protective coatings (ATPCs) on aircraft, the high-entropy rare-earth aluminate coatings prepared on the surface of nickel-based alloys, and the inorganic zirconium sol coatings prepared on the surface of aluminum alloys can play a good thermal protection role on the substrate [9,10,11,12]. However, the surface of a solar probe needs to withstand a high temperature of more than 1400 °C for a long time, and the stability of ordinary coating performance is difficult to ensure under the environment of a long time at 1400 °C. Research shows that alumina coatings can withstand the high temperature of 1400 °C and are one of the most suitable thermal protection coatings [13,14].
Al2O3 coatings are widely used in fields such as aerospace and engineering machinery manufacturing due to their excellent high-temperature resistance, corrosion resistance, wear resistance, electrical insulation [15,16,17,18], etc. In particular, aluminum oxide coatings have the characteristics of low solar absorption and high infrared emissivity and have become the main material for thermal protection coatings [19]. In order to improve the optical properties of alumina coatings, researchers use doping methods [19,20,21]. However, the optical properties of alumina coatings are closely related to their microstructure. Marthe et al. [22] pointed out that the optical properties of coatings can be changed by adjusting the porosity, but only in a certain band. Denis pointed out that the optical properties of alumina coatings are related to the porosity of the coatings; however, the key factor affecting the porosity is the pore structure, which has not been studied [23].
However, the optical properties of alumina coatings are closely related to their internal microstructure [24]. The influence mechanism of the microstructure on the optical properties of coatings can be analyzed by performing experiments. At the same time, finite element analysis can also be used to simulate coatings with different microstructures and predict their properties, which has guiding significance for the preparation of coatings with better optical properties.
The finite-difference time-domain (FDTD) method is often used to simulate the absorption and reflection of light by coatings. Callahan et al. [25] used the FDTD method to study the reflectivity of Si plates with different wavelength-scale textures. It was found that the alternating photonic crystal texture can significantly enhance the absorption of planar plates with optimized antireflective coatings. Bai et al. [26] numerically studied two coating materials with different properties using the FDTD method. The absorption and reflection mechanisms of the structure in the low-frequency band and the high-frequency band were discussed, and the relationship between the coating material properties and the total reflectance was determined. He et al. [27] used the FDTD method to simulate solar absorption in high-entropy ceramic models to understand the nature of light absorption, including intrinsic absorption and extinction absorption. The wide application of the FDTD method plays an important guiding role in improving the optical properties of coatings.
However, researchers are committed to analyzing the performance of prepared coatings, and there is a lack of research on the mechanism of performance changes caused by changes in the coating’s microstructure during use in high-temperature environments.
In this study, the aluminum oxide coating was subjected to a 1400 °C high-temperature thermal shock at different times by self-made flame impact equipment to accelerate the simulation of the service process of aluminum oxide coating in a high-temperature environment. SEM was used to characterize the microstructure of the coatings with different thermal shock degrees, and Image-J was used to characterize the characteristics of the pores and cracks of the coatings. The influence mechanisms of pore number, size, aspect ratio, crack appearance and propagation on solar absorption rate in Al2O3 coatings were analyzed. The solar reflectance changes in Al2O3 under different pore sizes, aspect ratios and crack widths were simulated by the finite-difference time-domain (FDTD) method, and the effects of microscopic pore characteristics on the optical properties of Al2O3 were qualitatively analyzed.

2. Experiment and Simulation

2.1. Preparation of Experimental Samples

In this experiment, a nickel-base superalloy disc with a thickness of 3 mm and a diameter of 25 mm is used as the sample substrate. The substrate is sandblasted, cleaned with alcohol and dried. A layer of NiGrAlY (Beijing Sunspraying New Material Co., Ltd., Beijing, China) coating with a thickness of 0.1 mm is prepared on the nickel-base superalloy substrate by atmospheric plasma spraying as the transition layer to eliminate the high-temperature thermal expansion mismatch between the substrate and the uppermost Al2O3 coating. The atmospheric plasma spraying is used to prepare an Al2O3 coating with a thickness of 0.16–0.19 mm on the transition layer. The Al2O3 powder (Beikuang New Materials Co., Ltd., Beijing, China) size distribution range is 15–45 μm. Figure 1 shows the morphology and particle size distribution of the Al2O3 powder.

2.2. Thermal Shock Test Process

The high-temperature impact test of the coating was carried out with the self-made flame thermal shock equipment, which consists of a control system, a clamping system, a heating system and a cooling system. The clamping system is a rotatable wheel disc, where the sample is clamped onto the wheel disc. Temperature control can be achieved by controlling the impact time and combustion gas flow rate. The cooling system is provided with compressed air by an air compressor to cool the sample. The self-made flame thermal shock equipment uses propane and oxygen as gases, with flow rates of 2.4 and 12 L/min, respectively. The heating time is 60 s, allowing the surface temperature of the coating to reach about 1400 °C. The cooling is carried out with compressed air in about 120 s. The temperature after cooling is around 200 °C. It should be noted that the samples used to withstand different thermal shock times are not the same sample but the same batch of samples prepared by the same process parameters. When the number of thermal shocks reaches five, the coating begins to peel off and bulge, while when the number of coating shocks reaches seven, the coating peeling area reaches 10% and the coating is judged to be invalid. The samples are grouped after thermal shock according to the number of shocks, with thermal shocks zero to seven denoted as TS0 to TS7, respectively.

2.3. Performance Testing

The IRE-2 infrared radiation tester (Shanghai Institute of Technical Physics, Chinese Academy of Sciences, Shanghai, China) and the Lambda 950 spectrophotometer (Perkin Elmer Instruments Co., Ltd., Boston, MA, USA) were used to measure the infrared emissivity and solar absorption of the Al2O3 coating. The microstructure of the sample was observed using S-3400N (Hitachi Analytical Instruments Co., Ltd., Tokyo, Japan) scanning electron microscopy (SEM). The scanning electron microscope (SEM) was used to collect images at different horizontal positions on the cross-section of the coating, and the magnification was 450 to 700 times. Four images were obtained for each sample to ensure that the characteristics of the alumina coating in each picture were as complete as possible, so that the pore characteristics of the alumina coating in the subsequent pore extraction stage were more accurate. The Image-J V1.8.0 software was used to extract the pore characteristics of the coating, including overall porosity, pore size, pore aspect ratio, pore spacing and crack structure.

2.4. Finite Element Model Establishment

Figure 2 shows the finite element simulation model constructed by the Lumerical 2020 R2 software, with perfectly matched layer (PML) boundary conditions (BCs) at the top and bottom and simulation regions defined by periodic BCs on both sides. The FDTD solver directly solves Maxwell’s equations, and the geometry of the coating is fully represented in 2D, which can represent Fresnel reflections and the interaction of multiple reflections in a wider wavelength range and more complete angular details [28].
The area in the orange box of the model is the FDTD simulation area. The yellow boxes from inside to outside are the refractive index monitor, the movie monitor and the frequency-domain field profile monitor, and the red circle is the time monitor. The yellow lines at the upper and lower ends of the simulation area represent the reflectivity monitor and the transmittance monitor, respectively, and the purple lines in the middle represent the light source. The light source is set as a plane wave with a wavelength range of 300–1500 nm, simulating the irradiation conditions of sunlight. In the simulation region, the refractive index of the environment is 1, the medium is air, the rectangular gray area is alumina material, the length in the horizontal direction is 20 μm and the length in the vertical direction is 10 μm. The light-colored part in the middle of the rectangular region is the pores in the coating, the material is air and the refractive index is 1. Blanchard, F. et al. [29] demonstrated the reliability of models in this setting. The reflectance monitor set above the model monitors the reflectance of sunlight in different models and then characterizes the difference in sunlight absorption between different pore structure models.

3. Results and Analysis

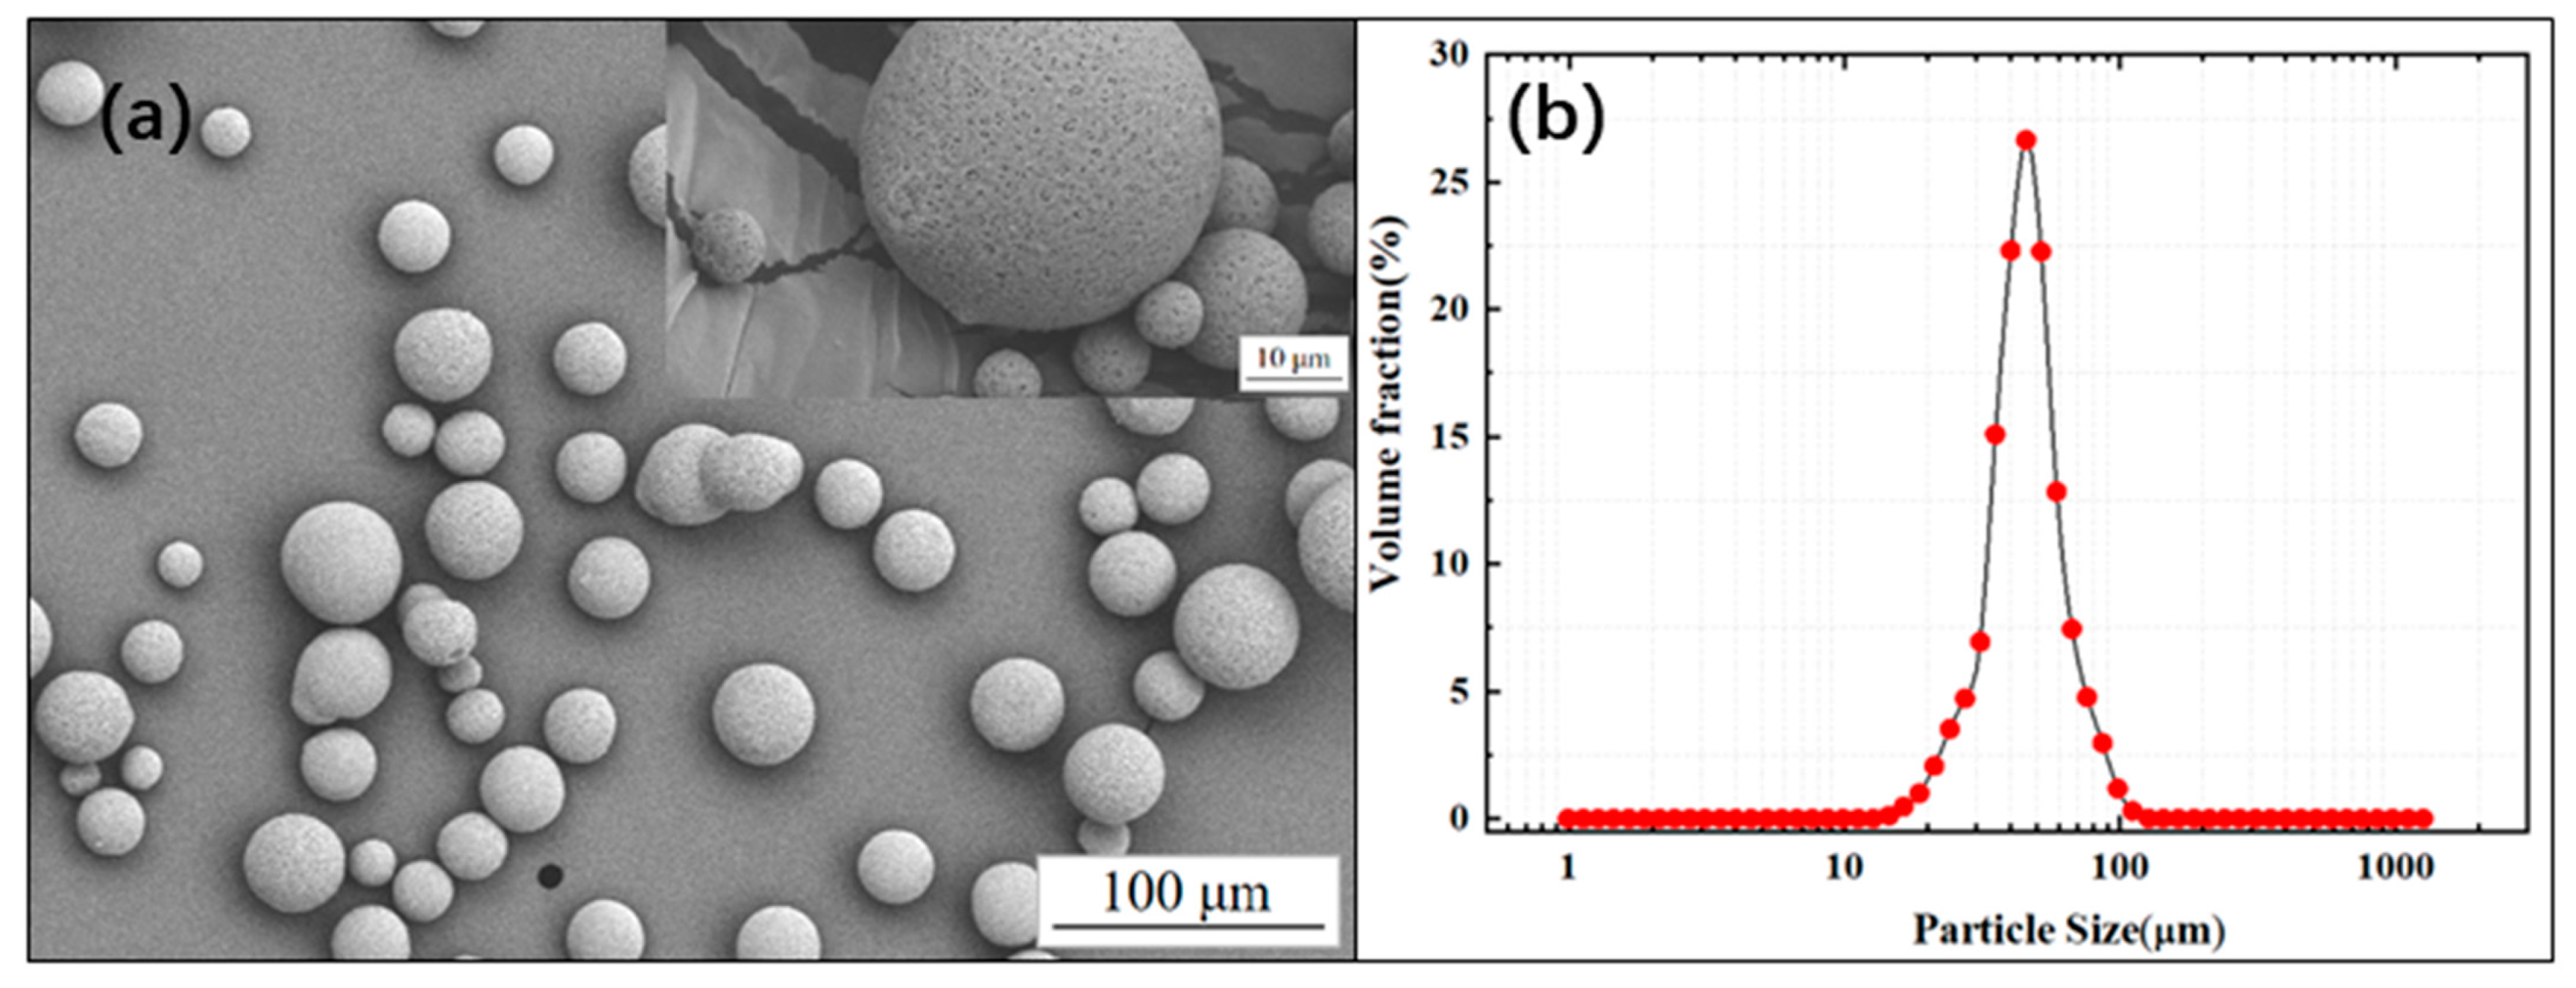
3.1. Microstructure of Al2O3 Coating

Figure 3 shows the microstructure of the coating after different thermal shocks taken by SEM, where Figure 3a–h represent the microstructure of Al2O3 with zero to seven thermal shocks, respectively. The results show that the main components in the alumina coating after plasma spraying are α-Al2O3 and γ-Al2O3, and the nucleation rate of γ-Al2O3 is higher in the spraying process [30,31,32].
It can be seen from Figure 3a that when the Al2O3 coating is not subjected to thermal shock, it is tightly bound with a small number of pores, and the shape is mainly elliptical. It can be seen from Figure 3b that after one thermal shock of the coating, fine cracks appear at the pore edge, and the pore structure changes from elliptical to irregular. It can be seen from Figure 3c that after two thermal shocks, the cracks at the edges of the pores of the coating become more obvious, and the pores that are close to each other appear to converge, forming pore concentration areas in some areas of the coating. With the thermal shock number of times increasing to three, the pore structure in the coating no longer presents an elliptical shape but is dominated by scattered strip cracks. After four thermal shocks, the crack length at the pore edges increases, and the adjacent cracks combine, resulting in the formation of a crack concentration in the coating. In particular, the bottom of the alumina coating begins to separate to form transverse penetration cracks. After six thermal shocks, large transverse cracks able to separate the coating begin to form inside the coating; the coating is close to failure at this time. At the end, after seven thermal shocks, large transverse cracks can be found in the middle and bottom of the coating, accompanied by large vertical cracks. The coating structure is seriously damaged, the bonding strength is reduced and the coating begins to peel off. At this time, the coating has reached the failure standard.

3.2. Porosity Variation in Al2O3 Coating

Figure 4 shows the average porosity distribution curve of the coating obtained from 40 SEM photos processed by the image-J V1.8.0 software with magnification ranging from 450 to 750 times. The porosity measurement generally uses SEM to take two-dimensional photos of the coating, which are then analyzed and processed by the Image-J V1.8.0 software to calculate the porosity of the coating plane. The scale of the electron microscope is used to set the scale of the software, and the image is converted to binary pictures. The image part to be observed is selected in the box, and the appropriate threshold is manually adjusted until the pore distribution is basically consistent with the original comparison. Then, the software is used for automatic calculation, and the porosity of the coating section is the ratio of the pore area to the selected area of the box, and multiple data acquisitions are performed on multiple SEM pictures to reduce the error.
It can be seen from the figure that the average porosity of the coating increases with the number of thermal shocks. Among them, the first two thermal shocks have a greater impact on the porosity of the coating, and the first two thermal shocks increase the average porosity of the coating from 13.44% to 16.12% and then to 18.69%. However, the porosity of the coating increases slowly, in the range of 18% to 20%, with three to five thermal shocks. The sixth thermal shock again significantly increases the porosity of the coating, with an average porosity of 22.99%. After the seventh thermal shock, the average porosity of the coating increases again to 23.67%.
The reason for the change in the porosity of the coating was analyzed. Before the thermal shock of the Al2O3 coating, the pore distribution was relatively dispersed and the pore edges were relatively smooth. During the first five thermal shocks, the number of cracks followed a threshold pattern of first increasing and then decreasing [33]. Firstly, in the first two thermal shocks, cracks gradually began to form at the edges of the pores in the coating; the number and length of the cracks showed an increasing trend, and the porosity increased significantly. Secondly, in the process of going from three thermal shocks to five thermal shocks, the number of cracks began to decrease, and the adjacent cracks began to connect. The connection of cracks reduced the number of cracks and increased their length, but had little effect on porosity. However, when the thermal shock was repeated six and seven times, the life of the coating reached its limit, and the cracks began to expand violently. The length and width of the cracks continued to increase, which led to a rapid increase in the porosity of the coating and also caused warping and peeling of the coating and, finally, failure.
The thermal cycle of the coating includes the heating, insulation and cooling stages. The heating stage will cause sintering of the original small pores inside the coating, and the cooling rate will lead to stress concentration, thus affecting the pore structure. At the same time, the inherent brittleness of ceramic materials and the mismatch of Young’s modulus and thermal expansion coefficient between a ceramic coating and a matrix lead to large residual stresses in the coating system, which also cause the structure of cracks to change during thermal cycling. Zhai et al. studied the microstructure change mechanism of TBCs (Thermal Barrier Coatings) in the process of cooling and reheating by calculating the stress intensity factor, which provided an idea for studying the change mechanism of cooling on pore and crack growth [34].

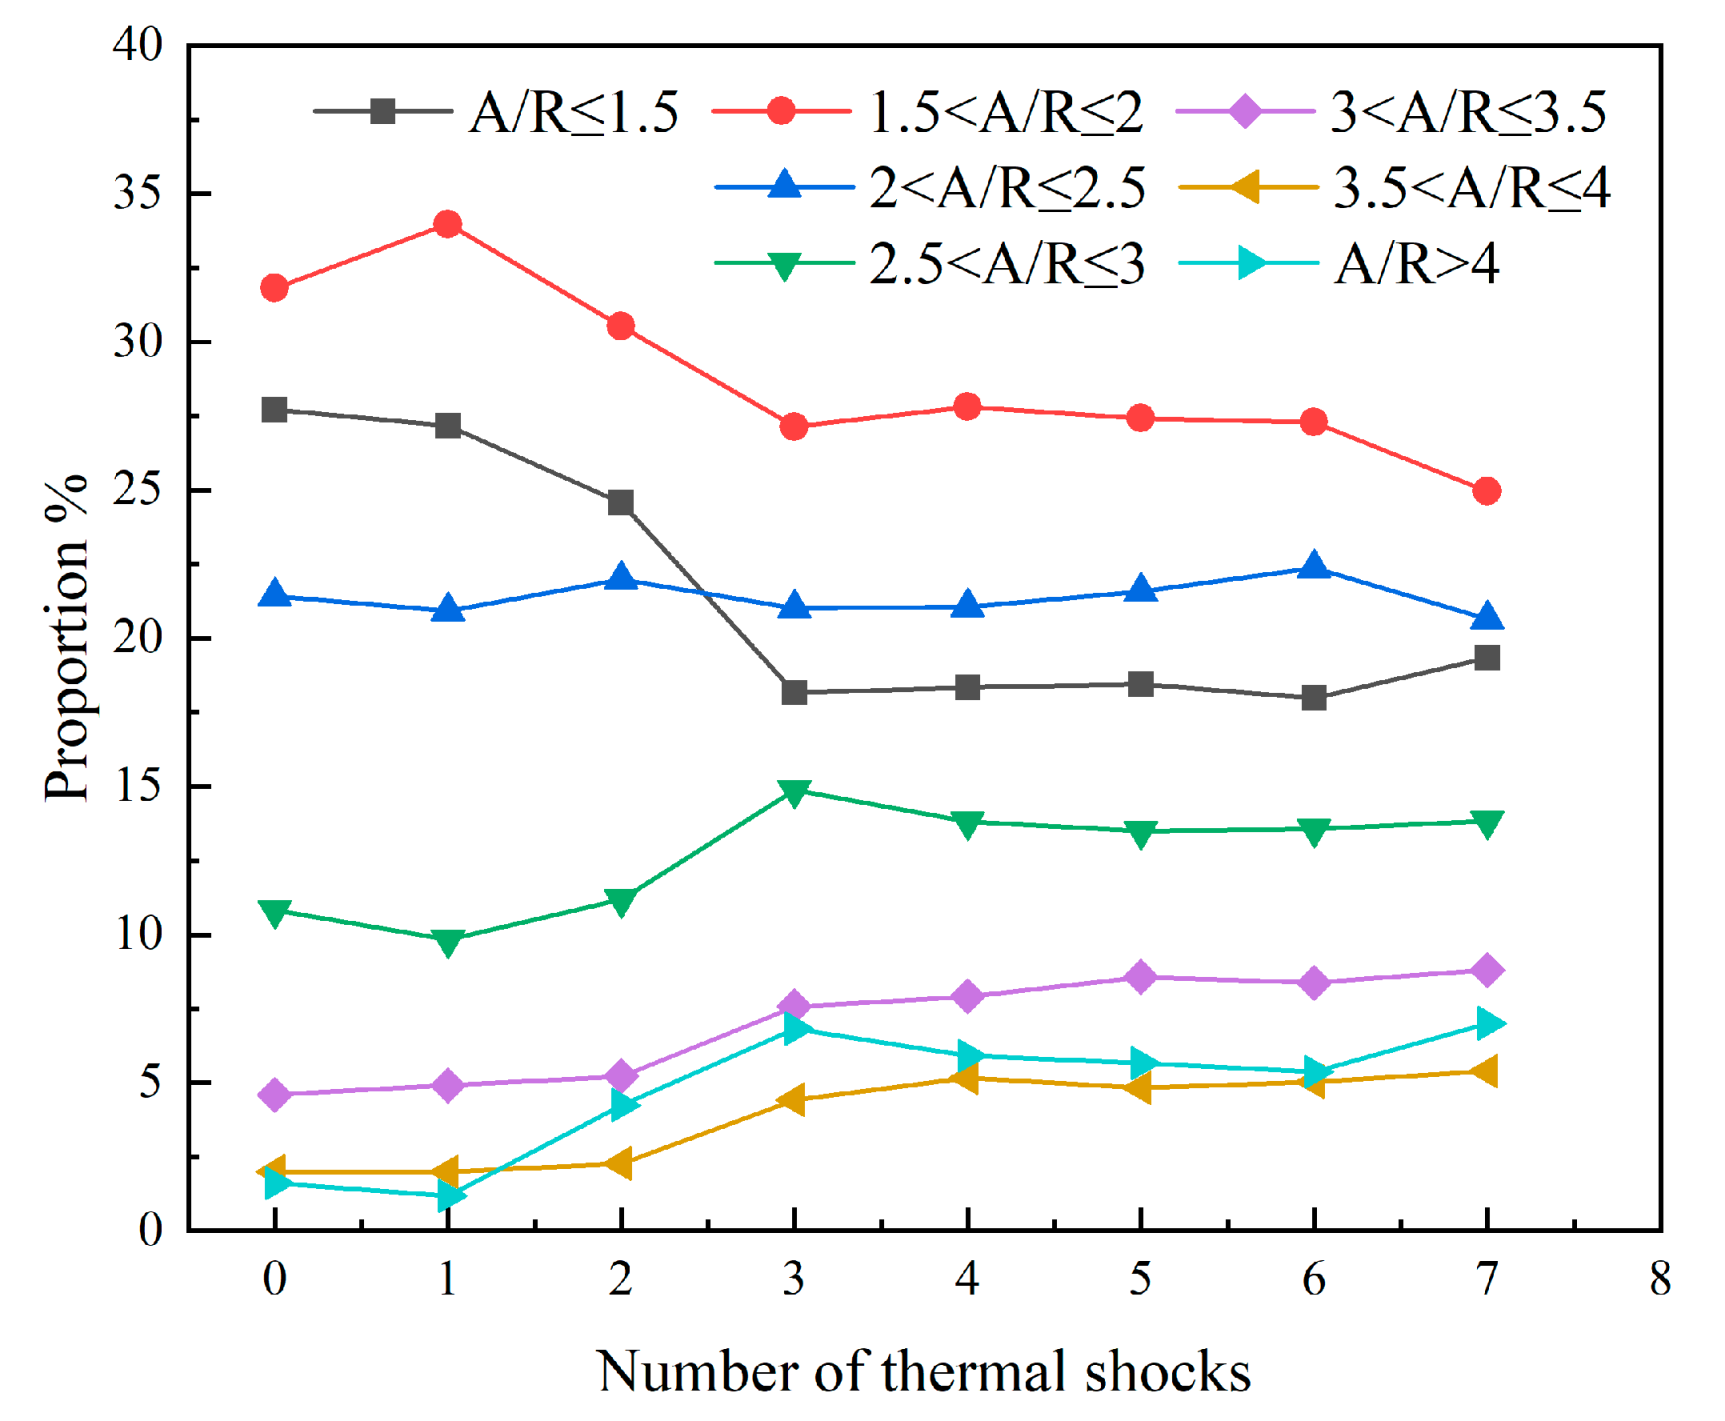
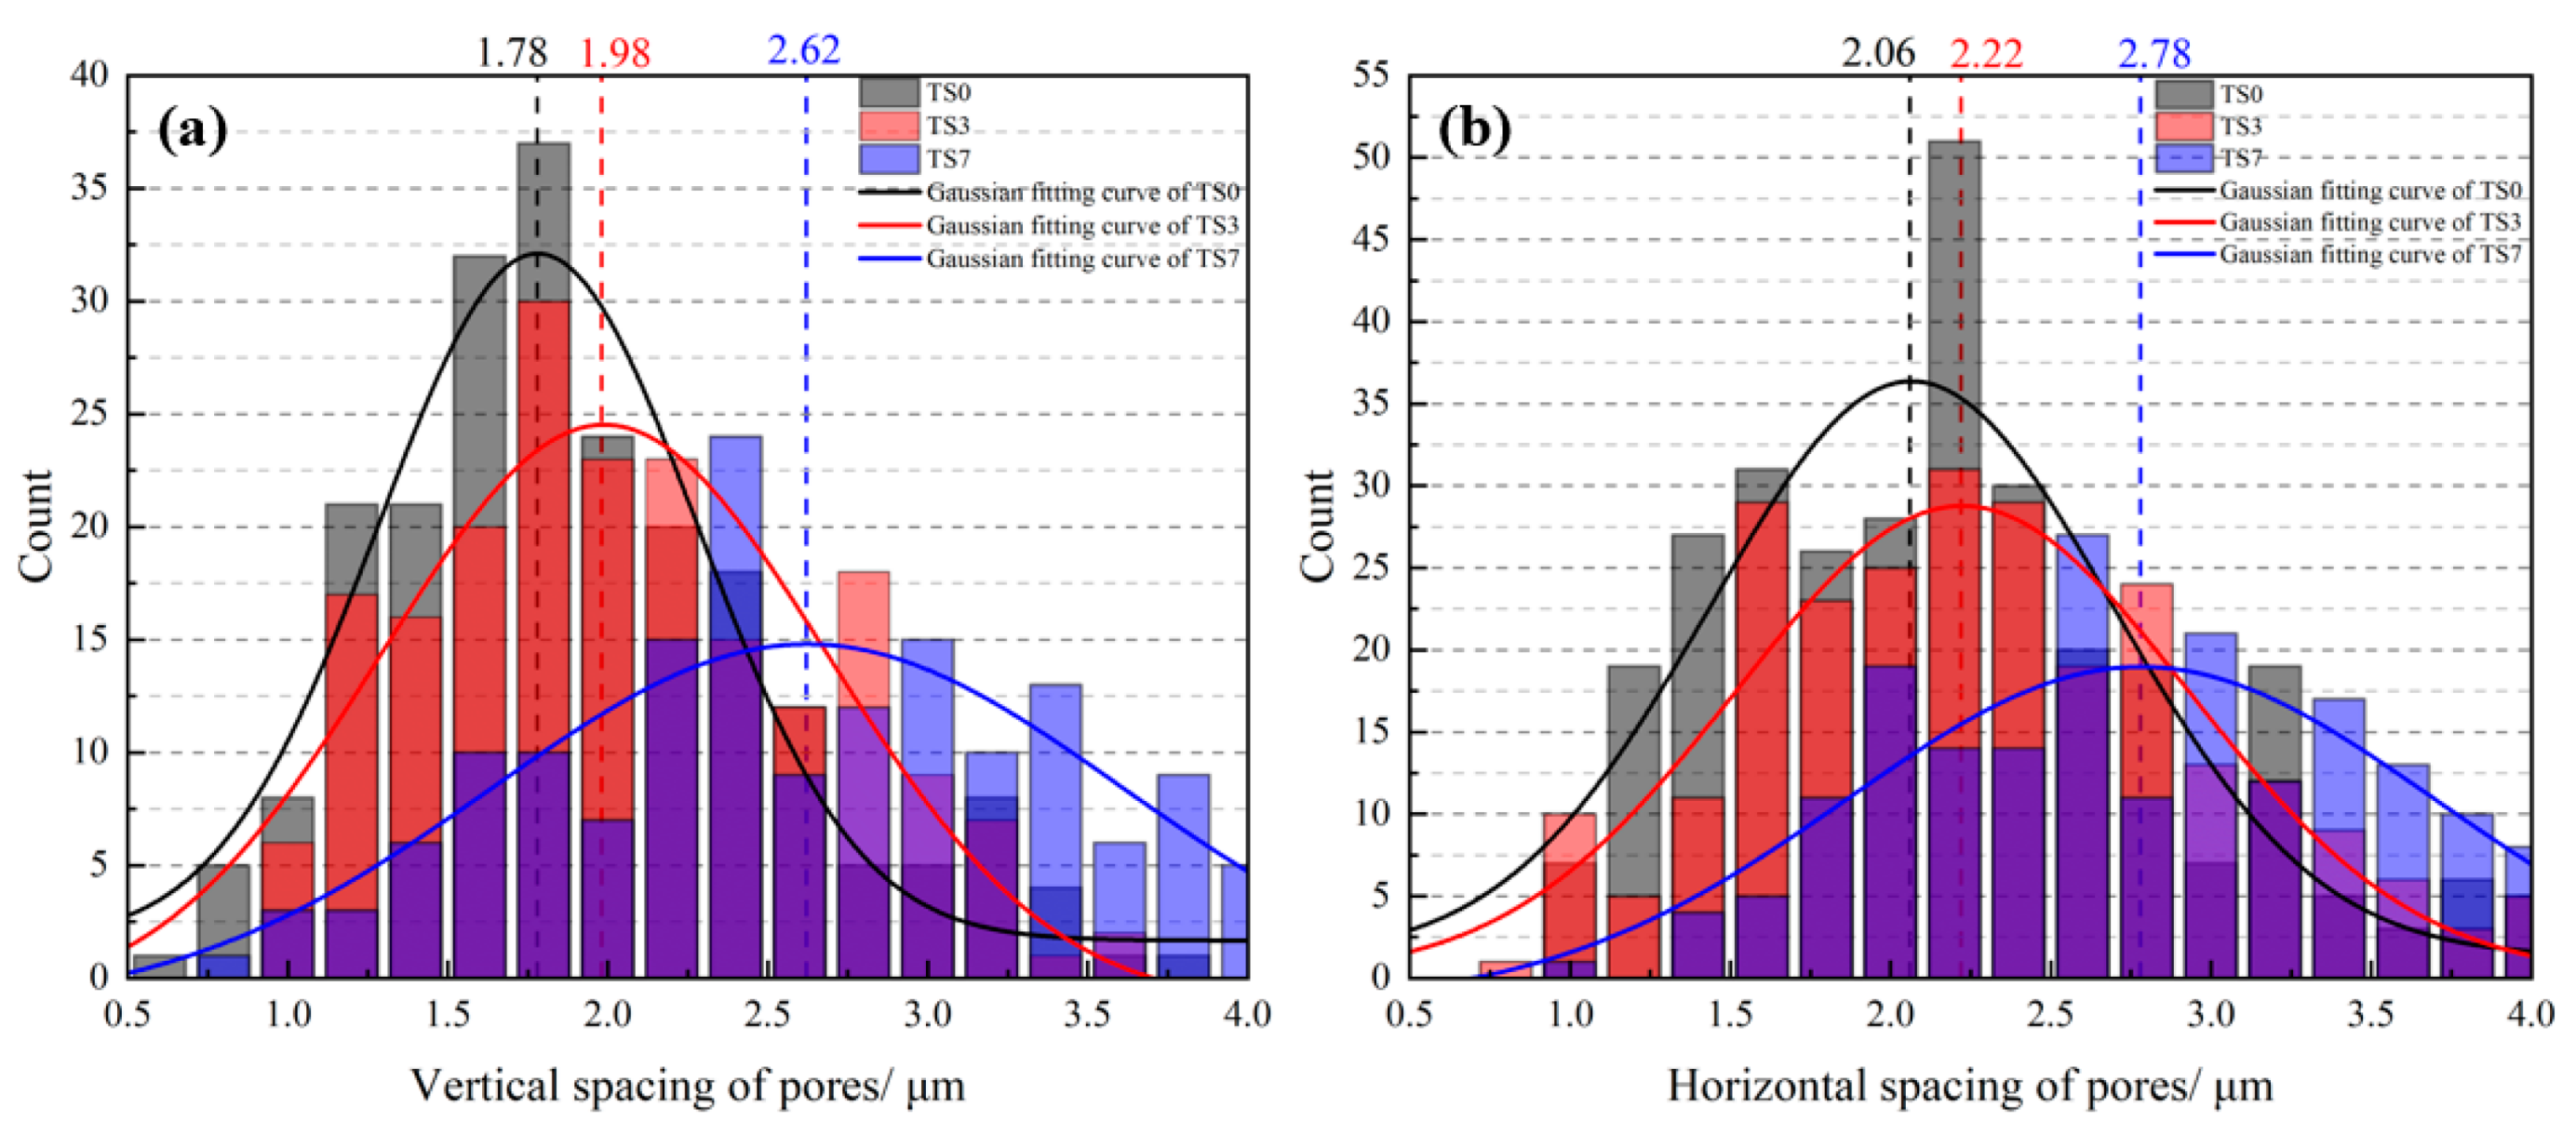
3.3. Pore Characteristics of Al2O3 Coating

Figure 5 shows the individual pore area size distribution of the Al2O3 coating under different thermal shock times. According to the classification of pore area size, it can be divided into 10 segments, in which the pore area of 0–2 μm2 is set as an S < 2 interval, and in the area of 2–10 μm2, it is evenly divided into 8 intervals. According to the statistical results, when the area is 10–20 μm2 and the span is 1 μm2, the proportion of pores in most intervals is less than 1%, so pores larger than 10 μm2 are divided into a large class and named S > 10. Figure 5 shows that the proportion of pores with pore areas between 3 and 10 μm2 remains relatively stable as the number of thermal shocks increases. In the first five shocks, the proportion of small-area pores, that is, pores with an area of 1 to 3 μm2, decreases with the number of shocks and then remains stable. However, the proportion of large-area pores increases with the number of thermal shocks. From the microstructure analysis, it can be seen that in the first two thermal shocks, the fine pores in the coating become compacted by heating, and the proportion of small pores shows a downward trend. When three to five thermal shocks occurred, the formation and disappearance of the remaining tiny pores in the coating reached an equilibrium state, and at this time, the expansion and connection of cracks led to an increase in the proportion of large pores.
In the process of six to seven thermal shocks, the crack connection formed large cracks, resulting in a reduction in the number of large-area pore structures, a decrease in the overall proportion and a slight increase in the proportion of small pores, but the fluctuation was not very large. At the same time, it can be seen from Figure 6 that the crack area shows a large growth trend during the sixth to seventh thermal shocks, which was mainly due to the appearance of superlarge pores (or large cracks).
In the pore characteristic distribution curves (Figure 4, Figure 5 and Figure 6), the curves remain stable after three (or four) thermal shocks. The reason for the analysis is that in the first five thermal shocks, the connection of cracks is mainly the connection of adjacent cracks. After the adjacent cracks are connected, the distant cracks begin to connect, which requires greater thermal stress, that is, more thermal shocks, so the changes in pore characteristics have a certain stability interval.
Figure 7 shows the distribution diagram of the transverse aspect ratio—use the image-J software to binarize the obtained SEM images, extract pore structures and use the concept of particle aspect ratio to perform aspect ratio statistics on the binarized images—of the pores of the Al2O3 coating with different thermal shock iterations. The transverse aspect ratio of the pores is divided into six intervals between the length-diameter ratios 1 to 4, and each interval is 0.5. In addition, all pores with an aspect ratio greater than 4 will be counted in the A/R > 4 interval. Pores with an aspect ratio less than 2 account for over 80% in the coating without thermal shocks and after one thermal shock. The proportion of pores with a transverse aspect ratio between 1.5 and 2 slightly increases after one thermal shock. However, during the second to third thermal shocks, the proportion of pores with a transverse aspect ratio between 1 and 2.5 shows a decreasing trend, while the pores of coatings with a transverse aspect ratio greater than 2.5 show an increasing trend. This indicates that during the second and third thermal shocks, the tiny cracks at the pore edge extend outward, accompanied by the expansion of the length and width directions, resulting in the gradual increase in pore structures with a large aspect ratio. However, after three shocks, the pore structure is basically stable, the aspect ratio of the pore is not affected by the number of thermal shocks and the pore aspect ratio distribution is basically stable.

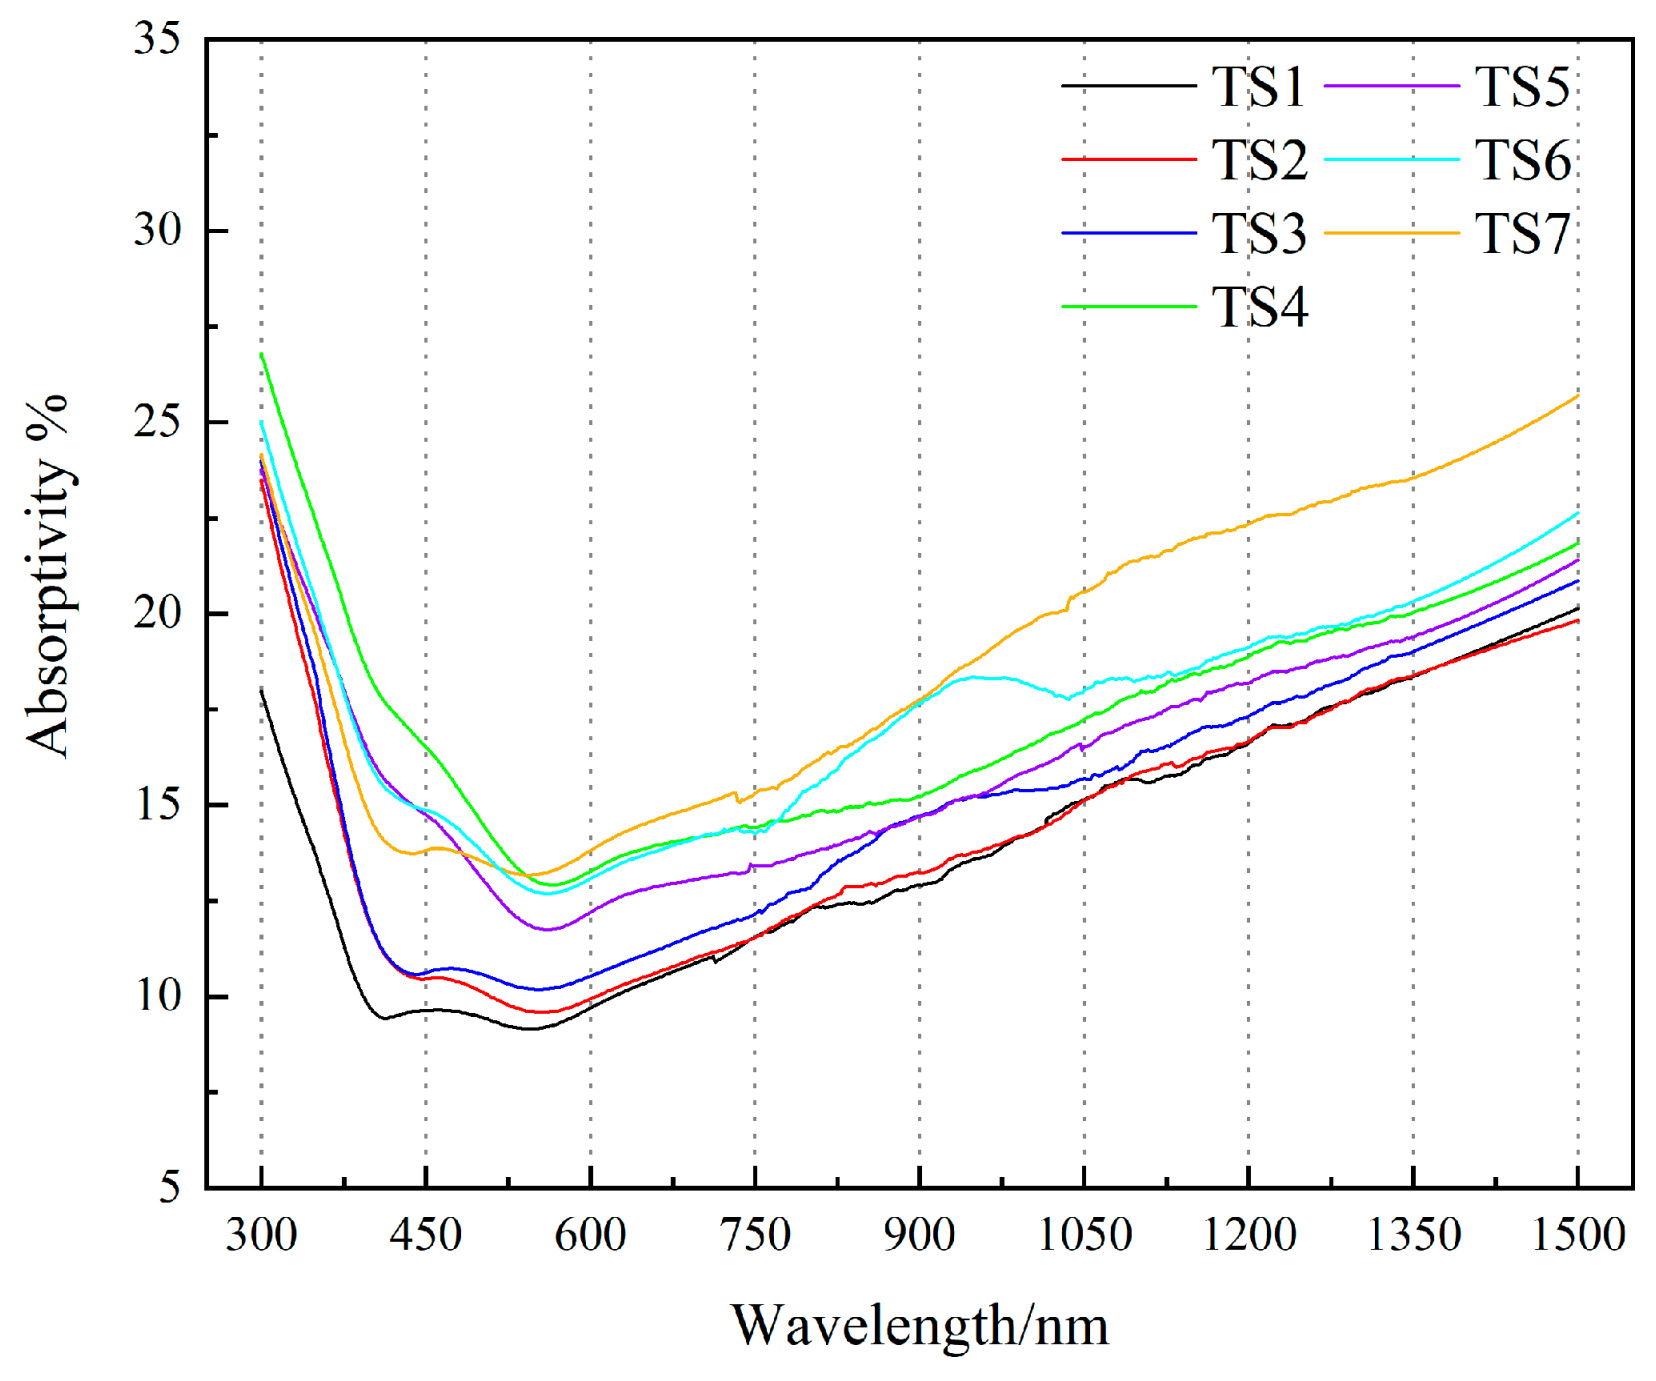
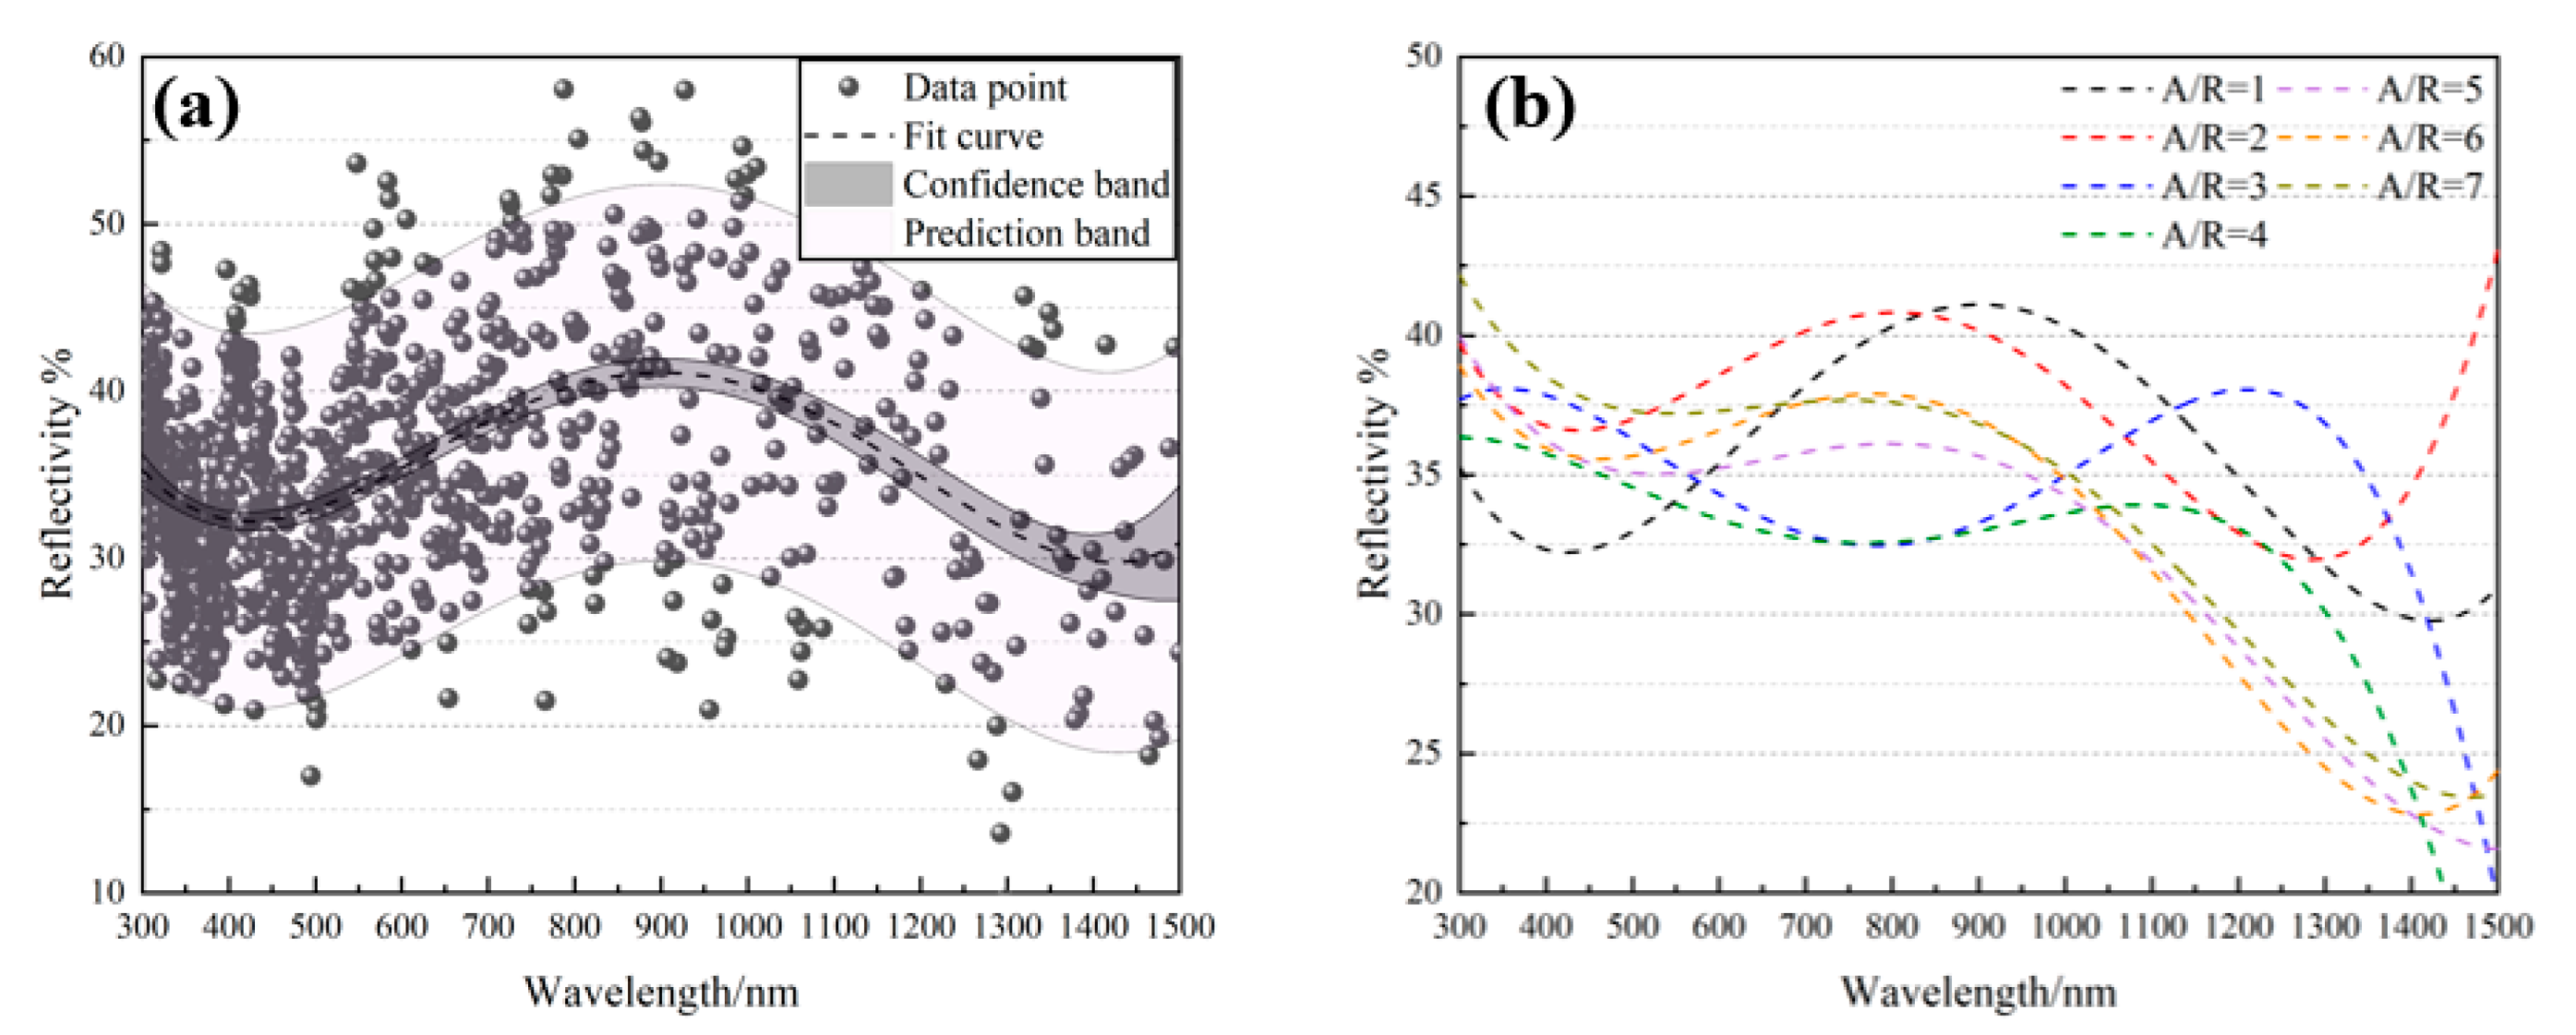
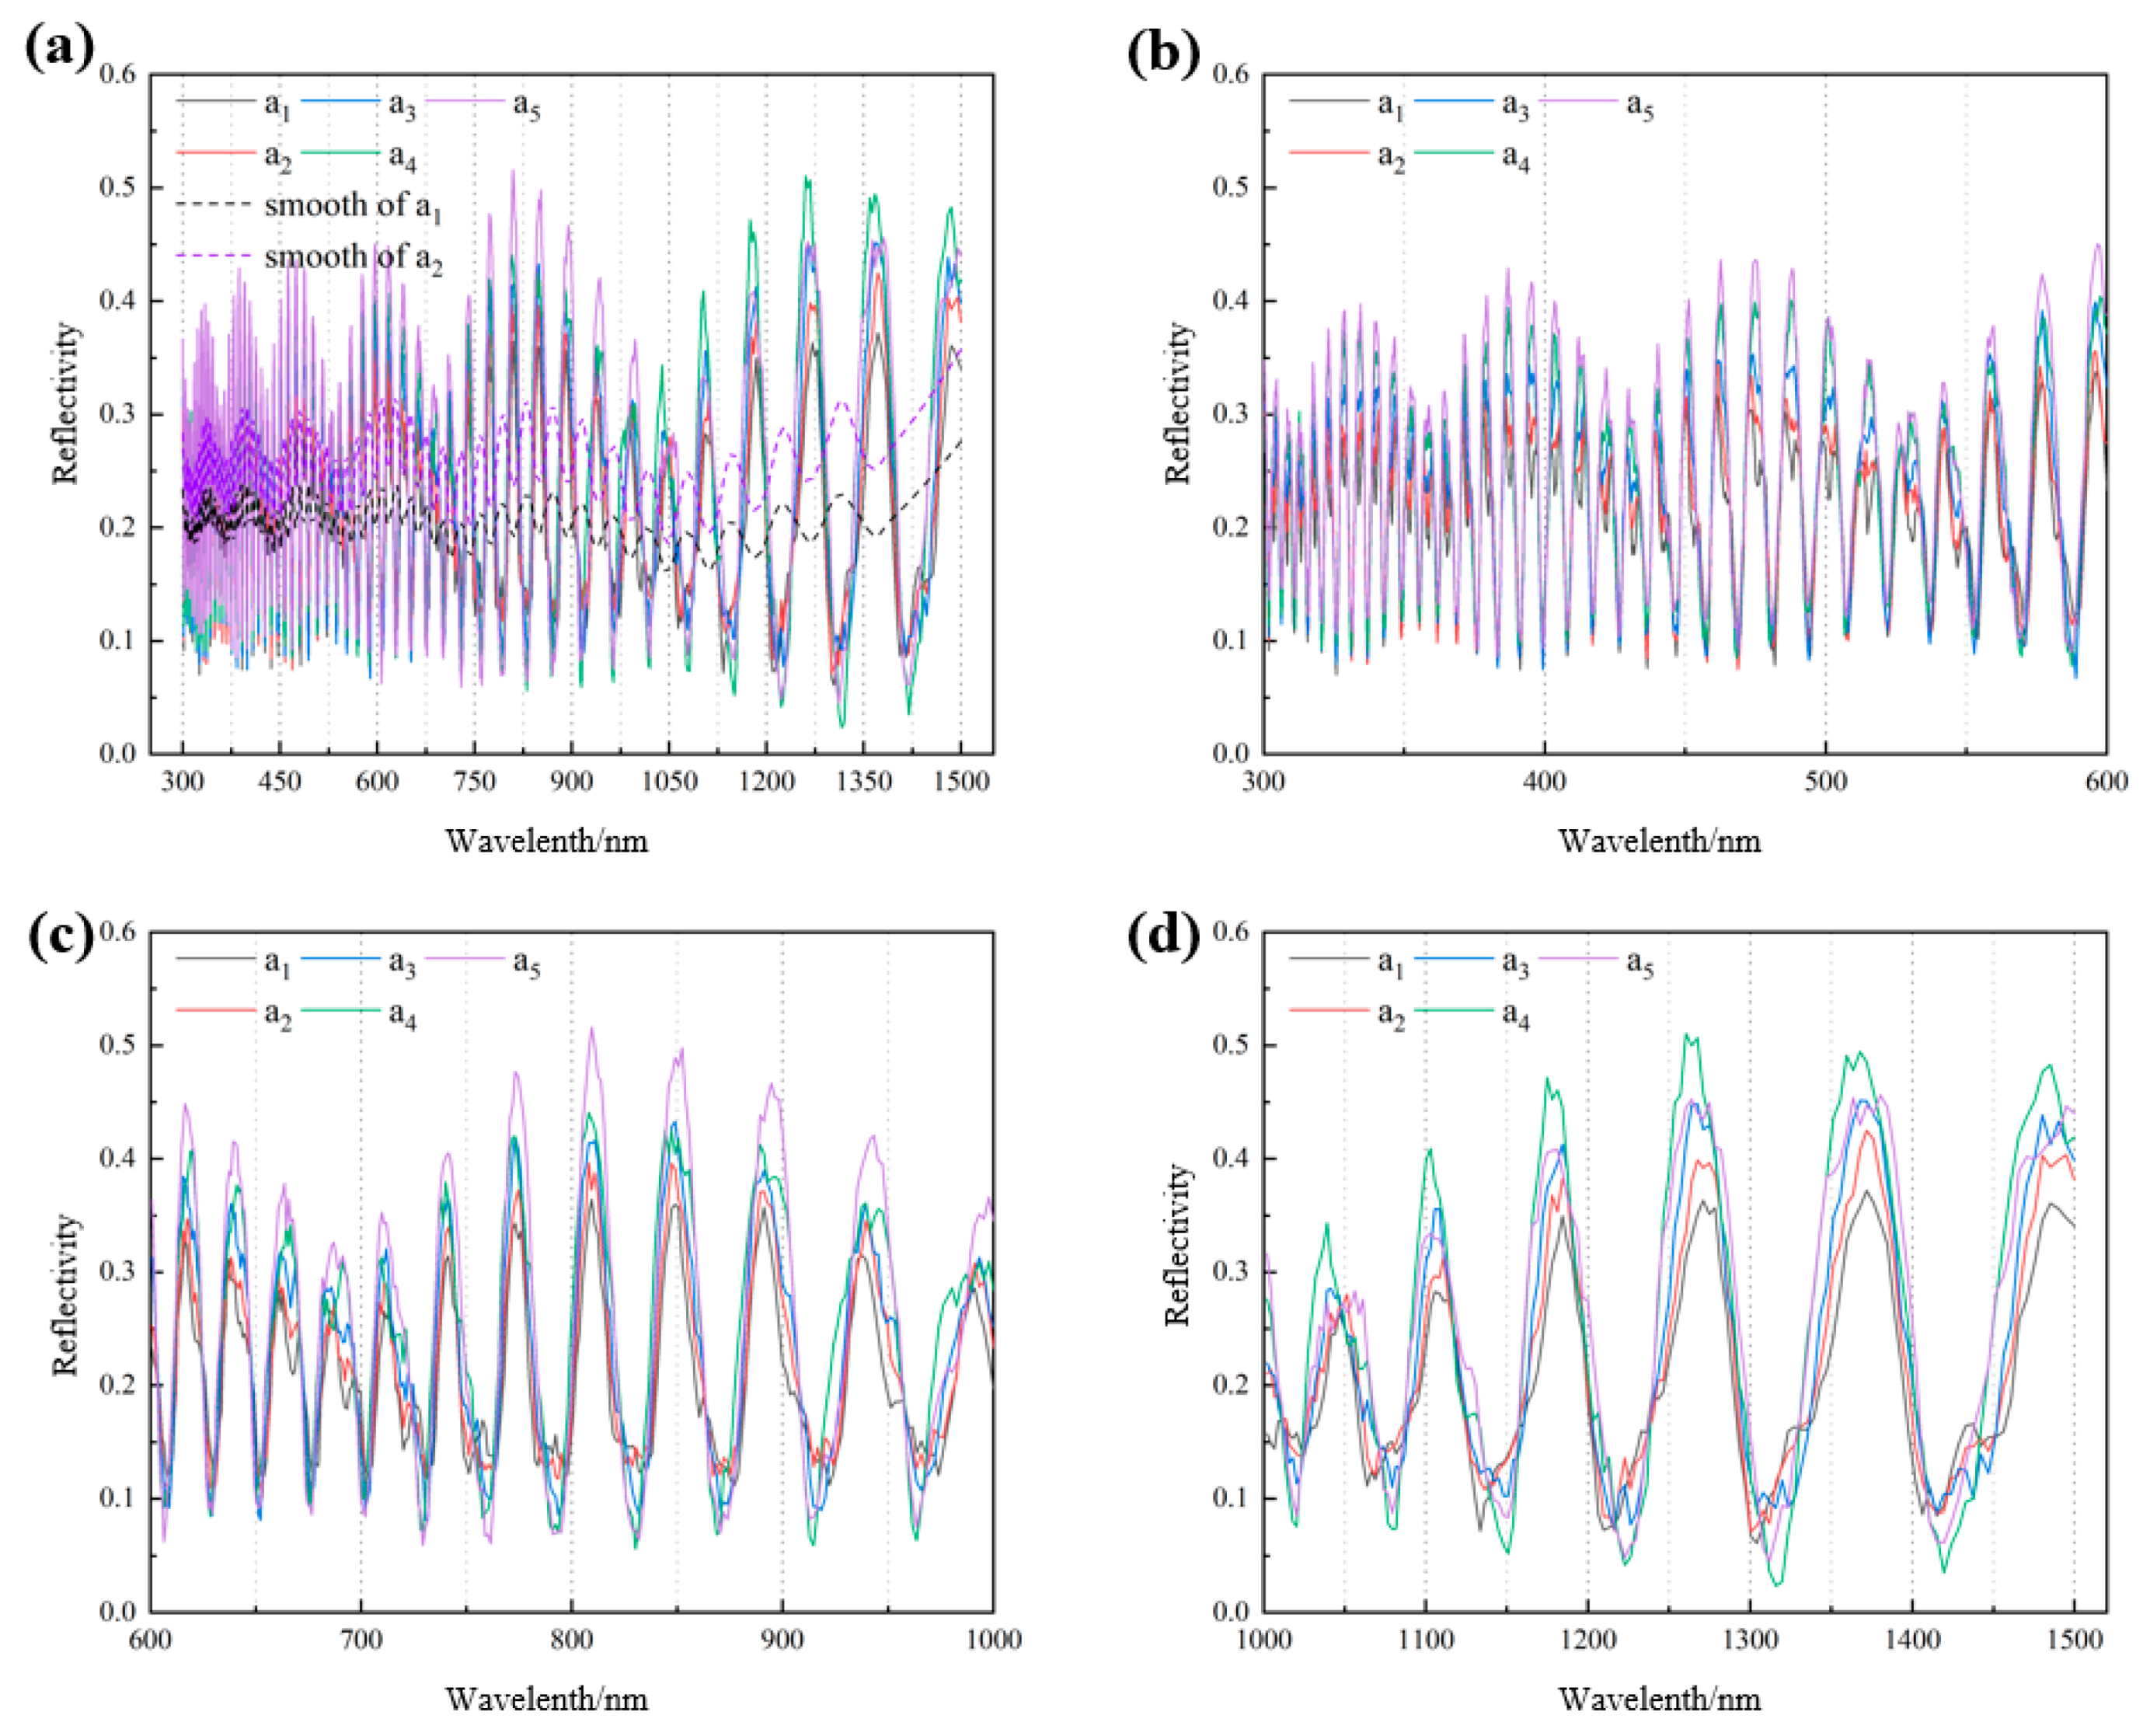
3.4. Solar Absorption Rate of Al2O3 Coating

Figure 8 shows the change curve of the absorption rate of the Al2O3 coating under different thermal shock iterations. In the first three thermal shocks, the absorption rate of the Al2O3 coating increases with the increase in thermal shocks. Combined with the change in pore characteristics, it is found that the increase in porosity after the first three thermal shocks is followed by an increase in pore area and an increase in pore aspect ratio. As a result, the light propagation path becomes longer after entering the coating, the volume scattering increases and the light absorption rate of the coating increases. After four thermal shocks, it can be observed that the absorption rate of the coating increases again, and the absorption rate of the coating is higher than that of the coating after five thermal shocks. At the same time, the porosity of the coating is almost unchanged, but it should be noted that the crack structure separated from the transition layer appears at the bottom of the coating after the fourth shock. After six and seven thermal shocks, the absorptivity of the coating at this time shows an increasing trend in most bands except for the band with a wavelength between 300 and 500 nm.
According to the scattering law of light, light will scatter when it meets the inhomogeneous medium after entering the coating, and the pore structure is regarded as the main scattering medium because its refractive index is different from that of the alumina coating (the pore refractive index is 1.00, while the alumina refractive index is 1.63). This study points out that in the band of 250–1500 nm, the scattering of the medium is mainly forward scattering. When the porosity of the coating increases, the interface between the Al2O3 coating and its internal pores will increase, and the increase in the scattering interface will lead to an increase in the scattering area inside the coating and the internal volume scattering effect. However, the existence of large cracks will complicate the internal volume scattering of light, and the propagation path inside the crack will become longer, so that the reflected light reflected outside the crack will be attenuated again, showing the higher absorption rate of the coating.

3.5. Simulation Results

In order to compare the specific characteristics of different evolution stages of the coating, Image J is used to binarize the coating without thermal shocks and the coating after three and seven thermal shocks, and the pore distribution characteristics are counted.
Figure 9 shows the morphology of the binarized alumina coating. In order to facilitate the statistics of pore spacing distribution, representative regions were selected for statistics in the figure. As shown in Figure 9, both the blue and orange boxes are statistical intervals, which are used to estimate horizontal spacing and vertical spacing, respectively, and the short-side width is about 8 μm. In our study, it was found that the 8 μm region contains three to five layers of pore structure, which is sufficient to contain the required data after multiple random samplings. By randomly selecting four orange intervals and four blue intervals in each picture, the total amount of data obtained is more than 400, which improves the accuracy of the data. Gaussian fitting is used to draw the curve of the spacing distribution (as shown in Figure 10).
The statistical results show that the vertical spacing between the voids is between 1.78 and 2.62 μm, and the horizontal spacing between them is between 2.06 and 2.78 μm. However, the vertical spacing of the pores in the coatings after thermal shock is generally smaller than the horizontal spacing. During the statistical process, it was found that the length of most pores in the horizontal direction is larger than that in the vertical direction, which makes the horizontal spacing longer than the vertical spacing. The main reason is that plasma spraying makes it easy to form unbonded pores between layers, which are macroscopic flat pores [35]. Based on the statistical results, the commercial finite element software Lumerical 2020 R2 was used for the finite element simulation, and a simple two-dimensional axisymmetric model was established.
As shown in Figure 11a, it uses a staggered five-layer structure to model the different pore aspect ratios of the coating. Research [24] shows that when the thickness of an alumina coating reaches more than 150 μm, the reflectance is only related to the pore structure of the coating itself, and the boundary layer has little effect on it. Therefore, a single-layer alumina model can be established for simulation calculations. Based on the statistical results and for ease of calculation, V = 1.8 μm and H = 2 μm were selected (V is the spacing between layers, and H is the distance between the two pores with the closest horizontal spacing between adjacent layers). According to the pore data calculated after the thermal shock experiment, the porosity of the coating is between 13% and 19%. In order to control the rationality of the porosity and meet the distribution law of pores in the coating, the pore area was fixed to 2 μm2, so that the porosity is 17%. The aspect ratio of the pores in the figure was changed to obtain pore simulation models with aspect ratios of 1 to 7.
Figure 11b simulates the existence of cracks using an elliptical structure with a transverse-to-longitudinal ratio greater than 10, where a is the transverse length of the crack and b is the longitudinal width of the crack. In order to obtain enough data within the limited model range, a shorter length of the minor axis should be selected. The statistics in Figure 5 show that pores with an area between 0 μm2 and 2 μm2 account for the largest proportion. The radius of a circular pore with a hole area of 1 μm2 is selected as the short half-axis of the crack model, that is, b = 0.56 μm, and by changing the length of a, cracks of different lengths (aspect ratio) are obtained, as shown in Table 1.
Figure 12a shows the scatterplot of the reflectance of the model with an aspect ratio equal to 1 (A/R = 1) under light irradiation with wavelengths ranging from 300 to 1500 nm. The curves were drawn by fitting a polynomial with 90% confidence and prediction intervals. Figure 12b shows that when the pore aspect ratio in the coating increases, the solar reflectance of the coating shows a trend of fluctuation in different bands.
The statistical results in Figure 8 show that the pores with an aspect ratio less than 2 and an aspect ratio greater than 4 have obvious change trends. The results in Figure 12b show that in the band of 300–600 nm, the reflectivity of the model with a pore aspect ratio greater than 4 is higher than that of the model with a pore aspect ratio of 1. Compared with the model with a pore aspect ratio of 2, the reflectivity of the model with a pore aspect ratio equal to 5 and a pore aspect ratio equal to 6 is lower, and the reflectivity of the model with a pore aspect ratio equal to 7 is higher as a whole. In the process of thermal shock, the proportion of pores with an aspect ratio less than 2 decreases and the proportion of pores with an aspect ratio greater than 4 increases, which will lead to a non-monotonic change in the reflectivity of the coating. That is, the change trend of the absorption rate has turned. In the band greater than 700 nm, the reflectivity of the model with a pore aspect ratio greater than 4 is lower than that of the model with a pore aspect ratio less than 2, which means that the absorption rate of the coating will increase with an increase in the number of thermal shocks. According to Kirchhoff’s law, the reflectance of the coating is the only factor that affects the absorption rate of the coating on opaque objects. In Figure 9, the absorptivity data measured by us show a trend of first increasing and then decreasing with an increase in the number of thermal shocks in the 300–600 nm band, while the absorptivity basically shows a trend of monotonic growth in the band greater than 700 nm. The experimental results are basically consistent with the predicted results, which verifies the reliability of the model.
Figure 12a shows the reflectance simulation curves of models with different crack lengths in each band of sunlight. The results show that with the increase in crack length in the coating, that is, with the expansion of the crack, the reflectance of the crack has different change rules in different bands. Figure 12b shows the reflectance of different coatings with a wavelength of 300–600 nm. It can be seen that the trough of the reflectance curve of coatings with different crack lengths almost coincides, while the peak of the reflectance curve rises obviously, and the reflectance increases with the crack length. In the range of 600–1500 nm, with the growth of the cracks, the reflectance crest still presents a rising trend, and the maximum difference in reflectance reaches more than 15%. The trough of the reflectance curve decreases with the increase in crack length, but the maximum difference in reflectance is only about 5%. The figure shows that when the crack length is 2a4 and 2a5, the reflectance curve crest of the coating is still above the reflectance curve crest of other width models. The dashed line in Figure 13a shows the smoothing effect of the reflection curve when the crack width is 2a1 and 2a4. The curves show that an increase in crack length leads to an overall increase in the solar reflectance of the coating.

4. Conclusions

In this study, the changes in microstructure and the corresponding optical properties of alumina coatings with different heat shock iterations at temperatures of about 1400 °C were analyzed. The finite-difference time-domain (FDTD) method was used to simulate the optical properties of Al2O3 coatings with different pore characteristics.
It was shown that with the increase in the number of thermal shocks, the porosity of the Al2O3 coating shows an increasing trend, but between three and five thermal shocks, the growth rate of porosity is relatively flat, and the porosity is maintained at about 19%. With the number of thermal shocks increasing, the proportion of small-area pores (pore area lower than 2 μm2) decreases, the proportion of large-area pores (pore area greater than 10 μm2) increases, and the proportion of intermediate-area pores (pore area greater than 2 μm2 but less than 10 μm2) basically remains unchanged. At the same time, before three thermal shocks, with the increase in the number of thermal shocks, the proportion of pores in Al2O3 coatings with an aspect ratio greater than 4 (A/R > 4) increases, while the proportion of pores with an aspect ratio less than 2 (A/R < 2) decreases. These results show that the two-dimensional pores in the coating gradually change into spherical pores with an increase in thermal shock frequency. The absorption rate of the Al2O3 coating after thermal shock to middle- and high-band (wavelength > 700 nm) sunlight shows an increasing trend with the increase in the number of thermal shocks. However, when the wavelength is less than 600 nm, the absorption rate of sunlight increases first and then decreases.
A finite-difference time-domain (FDTD) model based on the pore characteristics of the alumina coating was established, and reflectance results were obtained that were in good agreement with the experimental data. The model was sensitive enough to the changes in the optical properties of the coating caused by pore structure changes to simulate the optical properties of the coating in practical applications. Such models can be used to predict the optical properties of coatings under different pore structures without having to perform lengthy experiments. In actual production, as long as the coating with a specific pore structure is prepared by adjusting the preparation parameters, the coating can have better optical properties, which has guiding significance for its preparation.
Therefore, in the preparation process of the coating, adjusting the preparation parameters (the current preparation technology has matured) and controlling the microstructure of the pores can prepare the alumina coating with lower absorption and improve the thermal protection performance of the coating.

Author Contributions

Conceived and designed the experiments, C.L. and W.W.; performed the experiments, C.L., T.Y., Y.L., Z.T. and W.L.; analyzed the data and wrote the paper, C.L.; completed finite element simulation, C.L. and S.L. All authors have read and agreed to the published version of the manuscript.

Funding

This research is sponsored by the National Natural Science Foundation of China (52175136, 52130511), the Science Center for Gas Turbine Project (P2021-A-IV-002), the National High Technology Research and Development Program of China (2021YFB3702202) and the Key Research and Development Projects in Anhui Province (2022a05020004).

Institutional Review Board Statement

Not applicable.

Informed Consent Statement

Not applicable.

Data Availability Statement

Not applicable.

Conflicts of Interest

The authors declare no conflict of interest.

References

  1. Bale, S.D.; Goetz, K.; Harvey, P.R.; Turin, P.; Bonnell, J.W.; Dudok, D.; Wit, T.; Ergun, R.E.; MacDowall, R.J.; Pulupa, M.; et al. The FIELDS Instrument Suite for Solar Probe Plus. Space Sci. Rev. 2016, 204, 49–82. [Google Scholar] [CrossRef] [PubMed]
  2. Hassler, D.M. Solar Probe: Mission to the sun (overview and status report). In Proceedings of the Innovative Telescopes and Instrumentation for Solar Astrophysics, Waikoloa, HI, USA, 11 February 2003. [Google Scholar]
  3. McComas, D.J.; Velli, M.; Lewis, W.S.; Acton, L.W.; Balat-Pichelin, M.; Bothmer, V.; Dirling, R.B.; Eng, D.A.; Feldman, W.C.; Gloeckler, G.; et al. Solar probe: Humanity’s first visit to a star. In Proceedings of the Solar Wind 11—SOHO 16 Conference, Whistler, BC, Canada, 12–17 June 2005. [Google Scholar]
  4. Potocki, K.A.; Bedini, P.D. Solar probe—The first flight into the Sun’s corona. In Proceedings of the 10th International Solar Wind Conference, Pisa, Italy, 17–21 June 2002. [Google Scholar]
  5. Mehoke, D.; Congdon, E.; Drewry, D., Jr.; Eddins, C.; Deacon, R.; Wolf, T.; Hahn, D.; King, D.; Nagle, D.; Buchta, M.; et al. Ceramic Coatings for the Solar Probe Plus Mission. Johns Hopkins APL Tech. Dig. 2010, 28, 246–247. [Google Scholar]
  6. Li, J.; Luo, Z. Fabrication and performances of preceramic polymer-based high-temperature High emissivity coating. J. Eur. Ceram. Soc. 2020, 40, 5217–5225. [Google Scholar] [CrossRef]
  7. Wang, W.; Mu, W.; Ye, F.; Trevisan, S.; Dutta, J.; Laumert, B. Solar selective reflector materials: Another option for enhancing the efficiency of the high-temperature solar receivers/reactors. Sol. Energy Mater. Sol. Cells 2021, 224, 110995. [Google Scholar] [CrossRef]
  8. Zhu, Z.Q.; Cheng, X.D.; Ye, W.P.; Min, J. Synthesis of NiCr2O4 spinel coatings with high emissivity by plasma spraying. Int. J. Miner. Metall. Mater. 2012, 19, 266–270. [Google Scholar] [CrossRef]
  9. He, D.; Jiao, F.; Ou, D.; Gao, H.; Wu, J. Ablation and anti-vibration properties of modified epoxy resin-based ablation thermal protection coatings (ATPCs) in arc-jet. J. Braz. Soc. Mech. Sci. Eng. 2023, 45, 71. [Google Scholar] [CrossRef]
  10. He, D.L.; Jiao, F.K.; Ou, D.B.; Wu, J.Y. Investigation on the Reliability of an Ablation Thermal Protection Coating with Adjustable Thickness under Aerothermal-Vibration Coupling Environment. Adv. Eng. Mater. 2022, 24, 2200667. [Google Scholar] [CrossRef]
  11. Xu, F.; Zhu, S.Z.; Ma, Z.; Qian, Y.; He, D.D. Preparation of Inorganic Coating by Sol-Gel Method and Its Thermal Protection Performance. Rare Met. Mater. Eng. 2020, 49, 1261–1267. [Google Scholar]
  12. Wang, K.; Zhu, J.; Wang, H.; Yang, K.; Zhu, Y.; Qing, Y.; Ma, Z.; Gao, L.; Liu, Y.; Wei, S.; et al. Air plasma-sprayed high-entropy (Y0.2Yb0.2Lu0.2Eu0.2Er0.2)3Al5O12 coating with high thermal protection performance. J. Adv. Ceram. 2022, 11, 1571–1582. [Google Scholar] [CrossRef]
  13. Elizabeth, C.; Douglas, M.; Mark, B.; Dennis, N.; Zhang, D.J. Development of High-Temperature Optical Coating for Thermal Management on Solar Probe Plus. In Proceedings of the 10th AIAA/ASME Joint Thermophysics and Heat Transfer Conference, Chicago, IL, USA, 28 June–1 July 2010. [Google Scholar]
  14. Huang, S.J.; Zhong, X.Y.; Lin, J.; Jin, Z.Y.; Xu, F.Y. Study on Design Scheme of Thermal Protection of Probe for In Situ Measurements of Solar Eruption. Astron. Res. Technol. 2021, 18, 87–100. [Google Scholar] [CrossRef]
  15. Aruna, S.T.; Srinivas, G. Wear and corrosion resistant properties of electrodeposited Ni composite coating containing Al2O3-TiO2 composite powder. Surf. Eng. 2015, 31, 708–713. [Google Scholar] [CrossRef]
  16. Shao, F.; Zhuang, Y.; Ni, J.; Sheng, J.; Zhao, H.; Tao, S.; Yang, K. Comparison of the microstructural characteristics and electrical properties of plasma sprayed Al2O3 and Al2O3-Ca2SiO4 coatings immersed in deionized water. Surf. Coat. Technol. 2021, 422, 127530. [Google Scholar] [CrossRef]
  17. Szczygiel, B.; Kolodziej, M. Composite Ni/Al2O3 coatings and their corrosion resistance. Electrochim. Acta 2005, 50, 4188–4195. [Google Scholar] [CrossRef]
  18. Yang, K.; Rong, J.; Liu, C.G.; Zhao, H.Y.; Tao, S.Y.; Ding, C.X. Study on erosion-wear behavior and mechanism of plasma-sprayed alumina-based coatings by a novel slurry injection method. Tribol. Int. 2016, 93, 29–35. [Google Scholar] [CrossRef]
  19. Zhu, H.; Wang, W.Z.; Ye, D.D.; Yang, T.; Li, D.P.; Yang, M.; Yuan, B.H.; Wang, W. Effect of Doping Content of MgO on Solar Absorptivity to IR Emissivity Ratio of Al2O3 Coatings. Coatings 2022, 12, 1891. [Google Scholar] [CrossRef]
  20. Zhu, Z.; Cheng, X.; Li, G. Synthesis of Cr-Al2O3 Cermet Selective Surfaces Coated by SnO2 Thin Film by Air Plasma Spraying. In Proceedings of the TMS (The Minerals, Metals & Materials Society) 2013 142nd Annual Meeting & Exhibition, San Antonio, TX, USA, 3–7 March 2013. [Google Scholar]
  21. Wazwaz, A.; Salmi, J.; Hallak, H.; Bes, R. Solar thermal performance of a nickelpigmented aluminium oxide selective absorber. Renew. Energy 2002, 27, 277–292. [Google Scholar] [CrossRef]
  22. Marthe, J.; Meillot, E.; Enguehard, F.; Jeandel, G.; Ilavsky, J. Enhancement of Scattering and Reflectance Properties of PlasmaSprayed Alumina Coatings by Controlling the Porosity. Surf. Coat. Technol. 2013, 220, 80–84. [Google Scholar] [CrossRef]
  23. Denis, T.; Aurelie, Q.; Domingos, D.S.; Leire, D.C.; Patrick, E. Influence of Microstructure and Composition on Optical Properties of Plasma Sprayed Al/Al2O3 Cermets. J. Phys. Chem. C 2015, 119, 5426–5433. [Google Scholar] [CrossRef]
  24. Zhu, H.; Wang, W.Z.; Yang, T.; Fang, H.J.; Ye, D.D.; Li, D.P. Study on Influencing Factors of Solar Absorptance to IR Emittance Ratio of Al2O3 Coating by Atmospheric Plasma Spraying. Hot Work. Technol. 2021, 16, 43. [Google Scholar] [CrossRef]
  25. Callahan, D.M.; Whitesell, K.A.; Atwater, H.A. Absorption Enhancement in Ultra-thin Film Si Slabs Using Novel Photonic Crystal Textures. In Proceedings of the 39th IEEE Photovoltaic Specialists Conference (PVSC), Tampa, FL, USA, 16–21 June 2013. [Google Scholar]
  26. Bai, M.; Xia, D.; Jin, M. Effects of Coating Material Properties on the Wideband Reflectivity Performance of Microwave Calibration Targets. IEEE Trans. Antennas Propag. 2017, 65, 4909–4913. [Google Scholar] [CrossRef]
  27. He, C.Y.; Gao, X.H.; Qiu, X.L.; Yu, D.M.; Guo, H.X.; Liu, G. Scalable and Ultrathin High-Temperature Solar Selective Absorbing Coatings Based on the High-Entropy Nanoceramic AlCrWTaNbTiN with High Photothermal Conversion Efficiency. Solar RRL 2021, 5, 2000790. [Google Scholar] [CrossRef]
  28. Blanchard, F.; Kadi, M.J.; Bousser, E.; Baloukas, B.; Azzi, M.; Klemberg-Sapieha, J.E.; Martinu, L. Effect of CMAS infiltration on the optical properties of thermal barrier coatings: Study of the mechanisms supported by FDTD simulations and ALD. Acta Mater. 2023, 249, 118830. [Google Scholar] [CrossRef]
  29. Blanchard, F.; Kadi, M.J.; Bousser, E.; Baloukas, B.; Azzi, M.; Klemberg-Sapieha, J.E.; Martinu, L. Effect of thermal ageing on the optical properties and pore structure of thermal barrier coatings. Surf. Coat. Technol. 2023, 452, 129080. [Google Scholar] [CrossRef]
  30. Gao, Y.; Jie, M.; Liu, Y. Mechanical properties of Al2O3 ceramic coatings prepared by plasma spraying on magnesium alloy. Surf. Coat. Technol. 2017, 315, 214–219. [Google Scholar] [CrossRef]
  31. Jia, S.K.; Zou, Y.; Xu, J.Y.; Jing, W.; Lei, Y. Effect of TiO2 content on properties of Al2O3 thermal barrier coatings by plasma spraying. Trans. Nonferrous Met. Soc. China 2015, 25, 175–183. [Google Scholar] [CrossRef]
  32. Ang, Y.; Wang, Y.; Tian, W.; Yan, D.; Zhang, J.; Wang, L. Influence of composite powders’ microstructure on the microstructure and properties of Al2O3–TiO2 coatings fabricated by plasma spraying. Mater. Des. 2015, 65, 814–822. [Google Scholar] [CrossRef]
  33. Ahmadian, S.; Jordan, E.H. Explanation of the effect of rapid cycling on oxidation, rumpling, microcracking and lifetime of air plasma sprayed thermal barrier coatings. Surf. Coat. Technol. 2014, 244, 109–116. [Google Scholar] [CrossRef]
  34. Fleck, N.A.; Cocks, A.C.; Lampenscherf, S. Thermal shock resistance of air plasma sprayed thermal barrier coatings. J. Eur. Ceram. Soc. 2014, 34, 2687–2694. [Google Scholar] [CrossRef]
  35. Qiao, X.; Wang, Y.M.; Weng, W.X.; Liu, B.L.; Li, Q. Influence of pores on mechanical properties of plasma sprayed coatings: Case study of YSZ thermal barrier coatings. Ceram. Int. 2018, 44, 21564–21577. [Google Scholar] [CrossRef]
Figure 1. (a) Morphology and (b) particle size distribution of alumina powder.
Coatings 13 01527 g001
Figure 2. FDTD simulation model.
Coatings 13 01527 g002
Figure 3. Microstructure of coatings with different number of thermal shocks: (a) TS0, (b) TS1, (c) TS2, (d) TS3, (e) TS4, (f) TS5, (g) TS6, (h) TS7.
Coatings 13 01527 g003
Figure 4. Average porosity of coatings with different thermal shock times.
Coatings 13 01527 g004
Figure 5. Percentage of pore area of Al2O3 with different thermal shock iterations. S < 2: pores with an area of 0 to 2 μm2; S2–3: pores with an area of 2–3 μm2, and so on for the next seven intervals; S > 10: pores with an area greater than 10 μm2.
Coatings 13 01527 g005
Figure 6. Average value of all pores with pore areas greater than 10 under different heat shock iterations.
Coatings 13 01527 g006
Figure 7. Length-diameter ratio distribution diagram of coatings with different thermal shock iterations.
Coatings 13 01527 g007
Figure 8. Absorption rate change curve.
Coatings 13 01527 g008
Figure 9. Binarized image of alumina coating: (a) TS0, (b) TS3, (c) TS7. The blue and orange boxes are statistical intervals, which are used to estimate horizontal spacing and vertical spacing.
Coatings 13 01527 g009
Figure 10. Gaussian distribution of pore spacing: (a) vertical spacing, (b) horizontal spacing. The dashed line marks the center position of the Gaussian fitting curve with the corresponding color.
Coatings 13 01527 g010
Figure 11. (a) Simulation model of pore coating with different aspect ratios: V = 1.8 μm, H = 2 μm. (b) Simulation models of coatings with different crack lengths.
Coatings 13 01527 g011
Figure 12. (a) Scatter plot and fitting curve of reflectance of a coating with pore aspect ratio equal to 1; (b) reflectance fitting curves of coatings with different pore aspect ratios.
Coatings 13 01527 g012
Figure 13. Reflectance of different crack length models to sunlight: (a) 300–1500 nm; (b) 300–600 nm; (c) 600–1000 nm; (d) 1000–1500 nm.
Coatings 13 01527 g013
Table 1. Cracks of different lengths (aspect ratio).
Samplea/Lengthb/LengthA/R
a15.6 μm0.56 μm10
a26.72 μm12
a37.84 μm14
a48.96 μm16
a510 μm (maximum model length)≈18
Disclaimer/Publisher’s Note: The statements, opinions and data contained in all publications are solely those of the individual author(s) and contributor(s) and not of MDPI and/or the editor(s). MDPI and/or the editor(s) disclaim responsibility for any injury to people or property resulting from any ideas, methods, instructions or products referred to in the content.

