Article

A Novel Magnetic Fluorescent Fe3O4@ZnS@MPS Nanosensor for Highly Sensitive Determination and Removal of Ag+

1
Center of Characterization and Analysis, Jilin Institute of Chemical Technology, Jilin 132013, China
2
School of Chemical and Pharmaceutical Engineering, Jilin Institute of Chemical Technology, Jilin 132013, China
*
Authors to whom correspondence should be addressed.
Coatings 2023, 13(9), 1557; https://doi.org/10.3390/coatings13091557
Submission received: 24 July 2023 / Revised: 23 August 2023 / Accepted: 29 August 2023 / Published: 6 September 2023

Abstract

:
A novel magnetic fluorescent nanoprobe (Fe3O4@ZnS@MPS(MFNPs)) was synthesized, which recognized and cooperated with Ag+ ions, and a rapid method for detecting Ag+ was established in solution. It was found by fluorescence spectroscopy analysis that the MFNPs could detect Ag+ in PBS solution and, upon addition of Ag+ ions, the fluorescence (FL) of MFNPs could be quenched significantly. The sensor has a low limit of detection (LOD) of 7.04 µM for Ag+. The results showed that MFNPs were extremely specific and sensitive for the quantitative detection of Ag+ over a wide pH range. Then, the recognition mechanism between MFNPs and guest Ag+ was explored via measures of infrared spectroscopy and electron microscopy. It was speculated that the oxygen atoms in the sulfonic acid group cooperated with Ag+ to form a synergistic complexation. The assay was successfully used to determine the content of Ag+ in real samples.

1. Introduction

Silver has always attracted attention due to its unique chemical properties of strong corrosion resistance and high antioxidant capacity. Because of its rarity and high gloss, silver is widely used in the production of daily necessities [1,2]. A large number of widespread uses have a relatively significant impact on the environment. Therefore, it is necessary to adopt appropriate detection methods to analyze it. Excessive human exposure to silver is likely to cause silver poisoning, growth retardation, etc., and too much silver hurts the eyes and skin [3,4]. Thus, it is of great significance to investigate an effective method for detection of Ag+.
Silver ions can be detected by a variety of methods, such as fast but unstable electrochemical detection and accurate but expensive flame atomic absorption spectrometry [5,6,7]. In addition to these techniques, the extraction method using molecular receptors or chelating ligands is also widely used in the detection of Ag(I). Compared with conventional assays, fluorescence detection has greater advantages, such as rapid reaction, simple operation, low cost, and high sensitivity [8,9,10].
However, these fluorescent probes also cause further pollution to the environment when they are used to detect Ag+. Compared with these fluorescent probes, ZnS QDs have unique advantages, such as a narrow and symmetric emission spectrum, excellent light stability, and resistance to photobleaching [11]. Therefore, the development of multifunctional fluorescence chemosensors for sensing of heavy metals, that are friendly to the environment, is increasingly attracting attention [12].
In recent years, magnetic nanomaterials have attracted significant attention in the academic field due to their excellent magnetic reaction ability, high biocompatibility, and good stability [13,14,15]. Among these, superparamagnetic iron oxide (Fe3O4) is particularly versatile due to its unique high coercivity, easily functional modification, excellent controllable magnetic responsiveness, which can be manipulated by external magnetic fields, and controllable size and surface [16,17,18]. This enables researchers in various fields, such as chemistry, biology, medicine, and materials science, to use MFNPs to construct multifunctional nanoprobes and conduct significant research in sewage treatment, biological imaging, drug delivery, and other fields [19,20].
However, due to the strong magnetic dipole attraction between the particles, Fe3O4 nanoparticles tend to aggregate. Therefore, stabilizers such as organic matter, semiconductors, and oxides with specific functional groups are often applied to the nanoparticles’ surface in order to improve stability. Using a variety of biocompatible polymers to functionalize and modify the surface of Fe3O4 nanoparticles to provide new functions is the focus of current research. When the stability of Fe3O4 nanoparticles is guaranteed, the introduction of fluorescent substances is conducive to the separation and transfer of detection substances, especially heavy metals in water, thus expanding the application field of fluorescent probes. Aggregation-induced sedimentation technology can efficiently and rapidly remove Ag+ from water samples and can avoid secondary pollution [21].
In this work, a novel environmentally friendly magnetic fluorescent nanosensor (Fe3O4@ZnS@MPS(MFNPs)) modified with 3-sulfhydryl-1-propane sodium for coinstantaneous detection and removal of Ag+ from water samples is reported (Scheme 1). The results showed that MFNPs achieved highly specific recognition and were extremely sensitive for the quantitative detection of Ag+ over a wide pH range. The sensor has a low limit of detection (LOD) of 7.04 µM for Ag+. The optimal adsorption capacity of MFNPs was calculated to be about 395.79 mg/g and the optimal adsorption rate capacity of MFNPs was calculated to be about 98%. This work provides a new method for the synthesis of magnetic fluorescent nanosensors, exploiting their application not only for the detection of Ag+, but also other heavy metal ions, with the multiple functions of enrichment, detection, and separation.

2. Materials and Methods

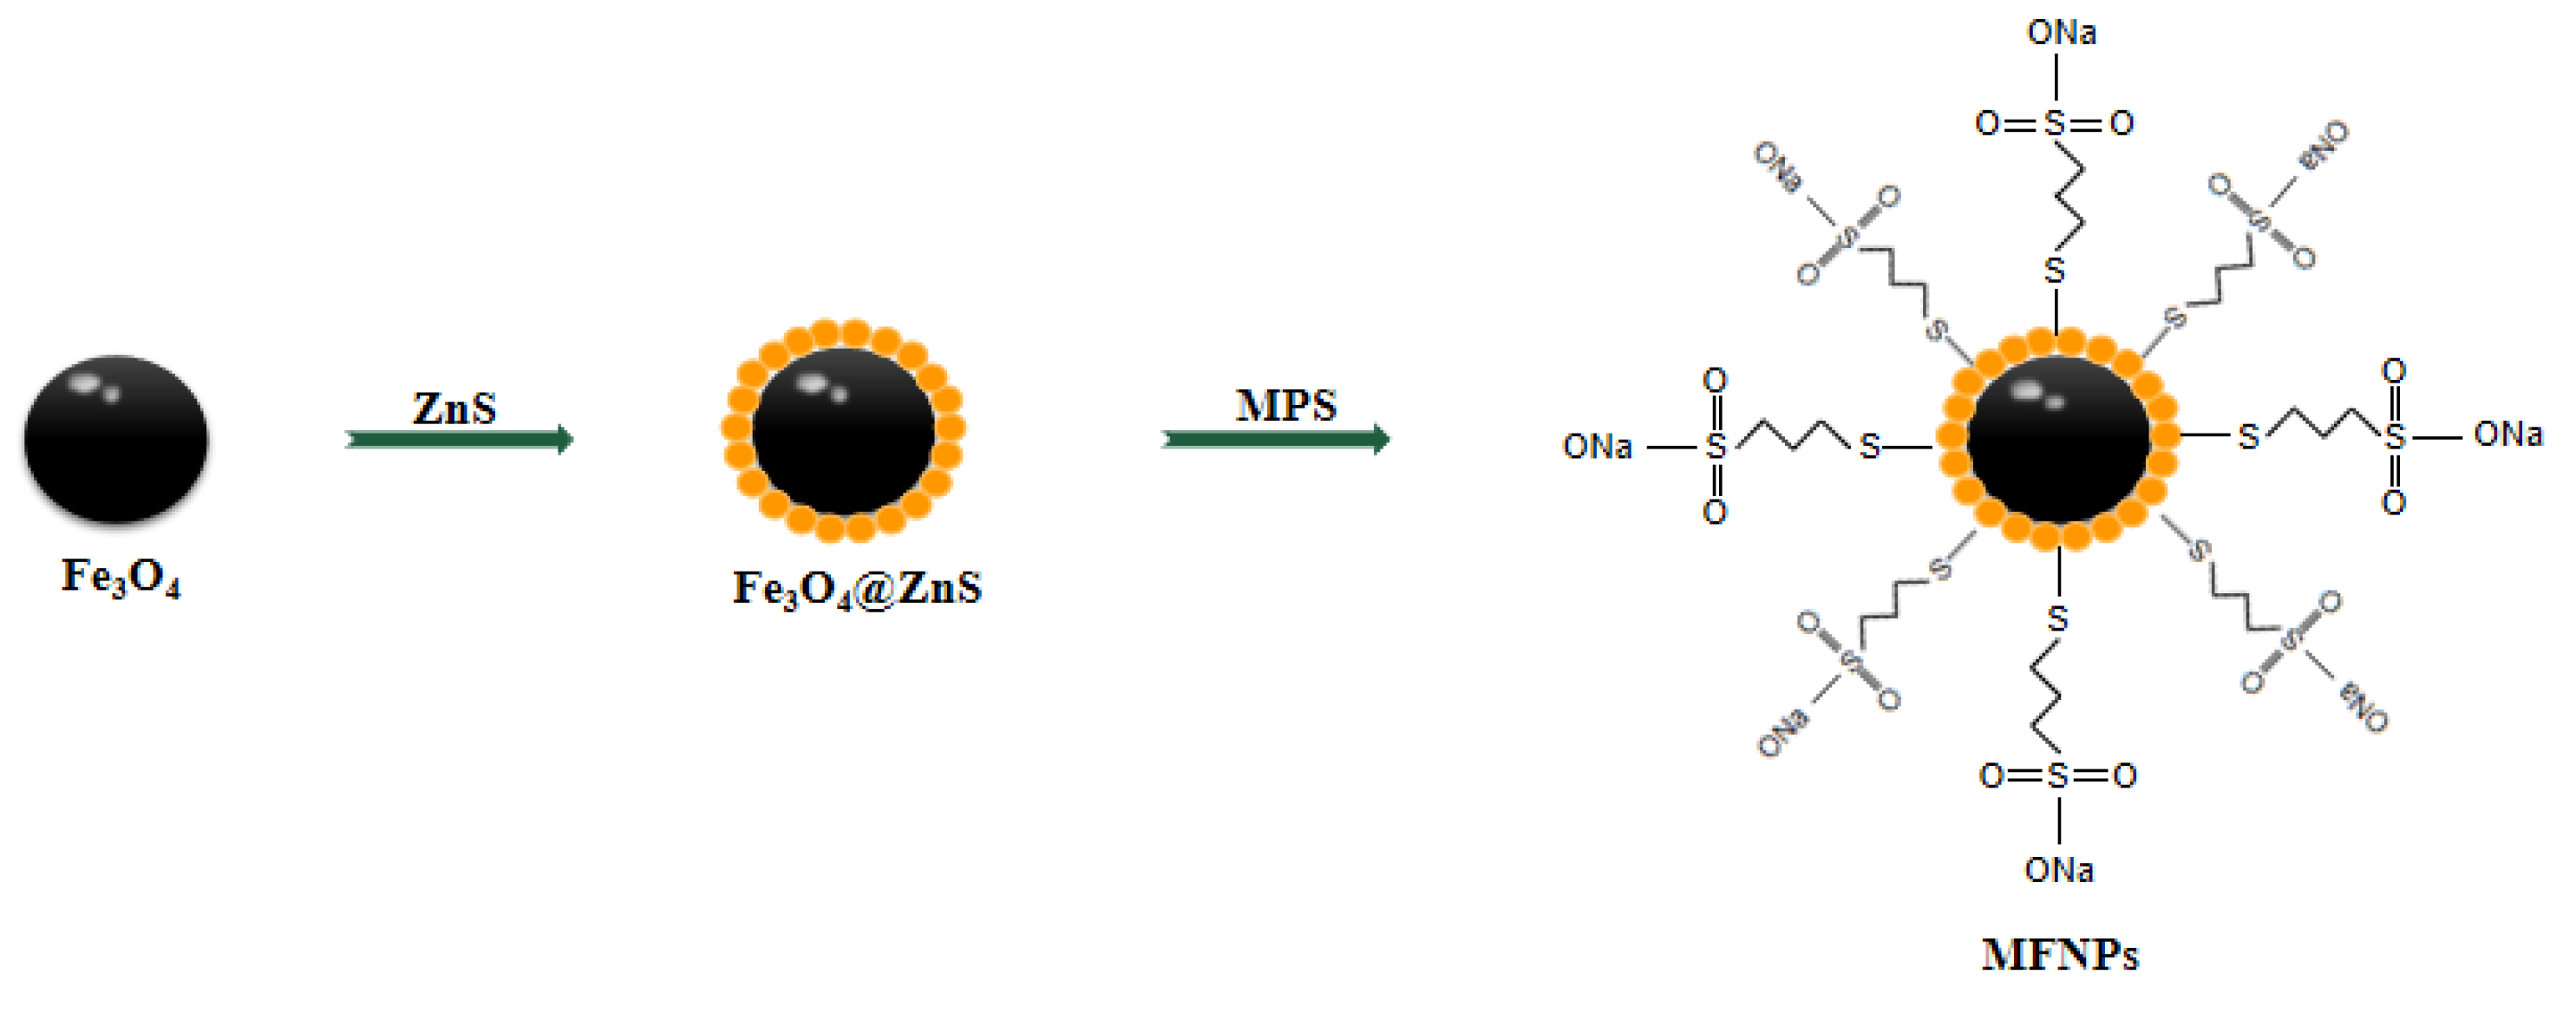
2.1. Preparation of Fe3O4 Magnetic Nanoparticle

The magnetic Fe3O4 nanoparticle was synthesized via the solvothermal method and prepared as follows: FeCl3·6H2O (2.7 g) was dissolved in 60 mL ethylene glycol in a water bath and stirred until fully dissolved. Sodium acetate (7.2 g) and surfactant (0.5 g) were added and stirred for 30 min. The solution was moved to a Polytetrafluoroethylene kettle, which was sealed tightly, and the hydrothermal reaction was carried out at high temperature. The reaction was then allowed to end and to cool naturally. The solution was moved to a Teflon kettle, which was sealed, followed by a hydrothermal reaction at a high temperature and natural cooling at the end of the reaction. The black precipitate was collected after washing several times, and the dispersive solution was prepared by adding water for further modification.

2.2. Preparation of Fe3O4@ZnS

The chemical coprecipitation method was employed to synthesize Fe3O4@ZnS core/shell nanocomposites. First, 10 mL of Fe3O4 was diluted to 100 mL and the solution was kept neutral. Then, 2.5 mmol of Zn(Ac)2·2H2O and Na2S·9H2O were dissolved in turn under the condition of water bath stirring, and were stirred for 6 h. The item was attracted by a magnetic force and then underwent a thorough cleansing process with ultrapure water and ethanol. The Fe3O4@ZnS nanoprobe was completed and water was added to make a dispersion for further modification [22].

2.3. Preparation of Fe3O4@ZnS@MPS

A quantity of 5 mL of Fe3O4@ZnS ethanol solution was placed in a round-bottom flask. Then, 5 mL 3-sulfhydryl-1-propane sodium (MPS) (89.105 mg, 0.1 mmol/L) ethanol solution was added. The mixture was then stirred in a water bath at 40 °C for 4 h in the dark. After the item was attracted by a magnetic force, it underwent a thorough cleansing process with ultrapure water and ethanol. Water was added to the prepared Fe3O4@ZnS@MPS microspheres to make a dispersion solution.

2.4. Instrumentation

The surface topography of the microspheres was observed via a scanning electron microscope (SEM) (Quanta 200, FEI, Hillsboro, OR, USA) (EHT = 5.00 kV) and a transmission electron microscope (TEM) (JEM 2100, JEOL, Tokyo, Japan) (Accelerating Voltage = 200 kV). Fourier transform-infrared (FTIR) spectra were obtained from a spectrometer (Thermo Scientific Nicolet IS50, Thermofisher, Waltham, MA, USA). X-ray diffraction (XRD) images were obtained using an X-ray diffractometer (D8FOCUS, Bruker, Berlin, German). The measurement was conducted using CuKα radiation (λ = 1.5406 Å) in the range of 2θ = 20°–80° at a scan speed of 2°/min. XPS spectra data were obtained on an X-ray photoelectron spectrometer (Krayos AXIS Ultra DLDX, Shimadzu, Tokyo, Japan) (Analyzer Mode: Constant Analyzer Energy: Pass Energy 30.0 eV; Energy Step Size: 0.100 eV). The magnetism (VSM) was measured using a vibrating sample magnetometer (7404 vibrating sample magnetometer, LakeShore, Carson, CA, USA). The thermogravimetric (TG) curves were obtained using a thermalgravimetric analyzer (Discovery SDT650 synchronous TGA-DTA Instrument, TA, Los Angeles, CA, USA). Fluorescence spectra were measured on a fluorescence spectrophotometer (FluoroMax-plus instrument, Horiba, Austin, TX, USA) with an excitation of (370) nm. The concentration of Ag+ in solution was determined by atomic absorption spectrometry (AAS) (ICP-OES:Thermo Fisher iCAP 7400, Thermofisher, USA).

2.5. Materials

Other chemicals used in this study, such as FeCl3·6H2O, CH3COONa·3H2O, Zn(ac)2, Na2S, polyethylene glycol 2000, 3-sulfhydryl-1-propane sodium, Co2+, Pb2+, Ni2+, Hg2+, Al3+, Cu2+, Zn2+, Cd2+, Fe3+, Fe2+, K+, Ca2+, and NaCl, were purchased from Shanghai Aladdin Bio-Chem Technology Co., Ltd. (Shanghai, China).

2.6. Procedure for the Fluorescent Detection of Ag+

Certain volumes of Ag+ solutions were added to 0.4 mg of the Fe3O4@ZnS@MPS suspension, whose final volume was tuned to 5 mL by PBS buffer solution. After a 5 min reaction, the emission spectra were measured at an excitation wavelength of 370 nm. The selectivity performance of Fe3O4@ZnS@MPS assay for the detection of Ag+ was carried out by measuring its fluorescence response in the presence of various common ions (Co2+, Pb2+, Ni2+, Hg2+, Al3+, Cu2+, Zn2+, Cd2+, Fe3+, Fe2+, K+, Ca2+, Na+).

2.7. Removal and Adoption Capacity Performance of Ag+

The removal and adoption capacity performance of Ag+ testing was determined in a centrifuge tube, for different concentrations of AgNO3, after shaking well.
The removal activities can be evaluated by the following equation:
R = C 0 C 1 C 0 × 100 %
C1 is the final concentration of Ag+, and C0 is the initial concentration of Ag+ ions. The concentration of Ag+ ions was analyzed via AAS.
The adsorption amount of Ag+ (Q mg/g) can be calculated according to the following equation:
Q e = ( C 0 C 1 ) V m
Qe is the adsorption capacity (mg·g−1), C0 and Ce are the initial and equilibrium concentrations of Ag+ (mg·L−1), respectively, V is the volume of the metal ion solution (L), and m is the Fe3O4@ZnS@MPS mass (g).

3. Results and Discussion

3.1. Characterization of MFNS

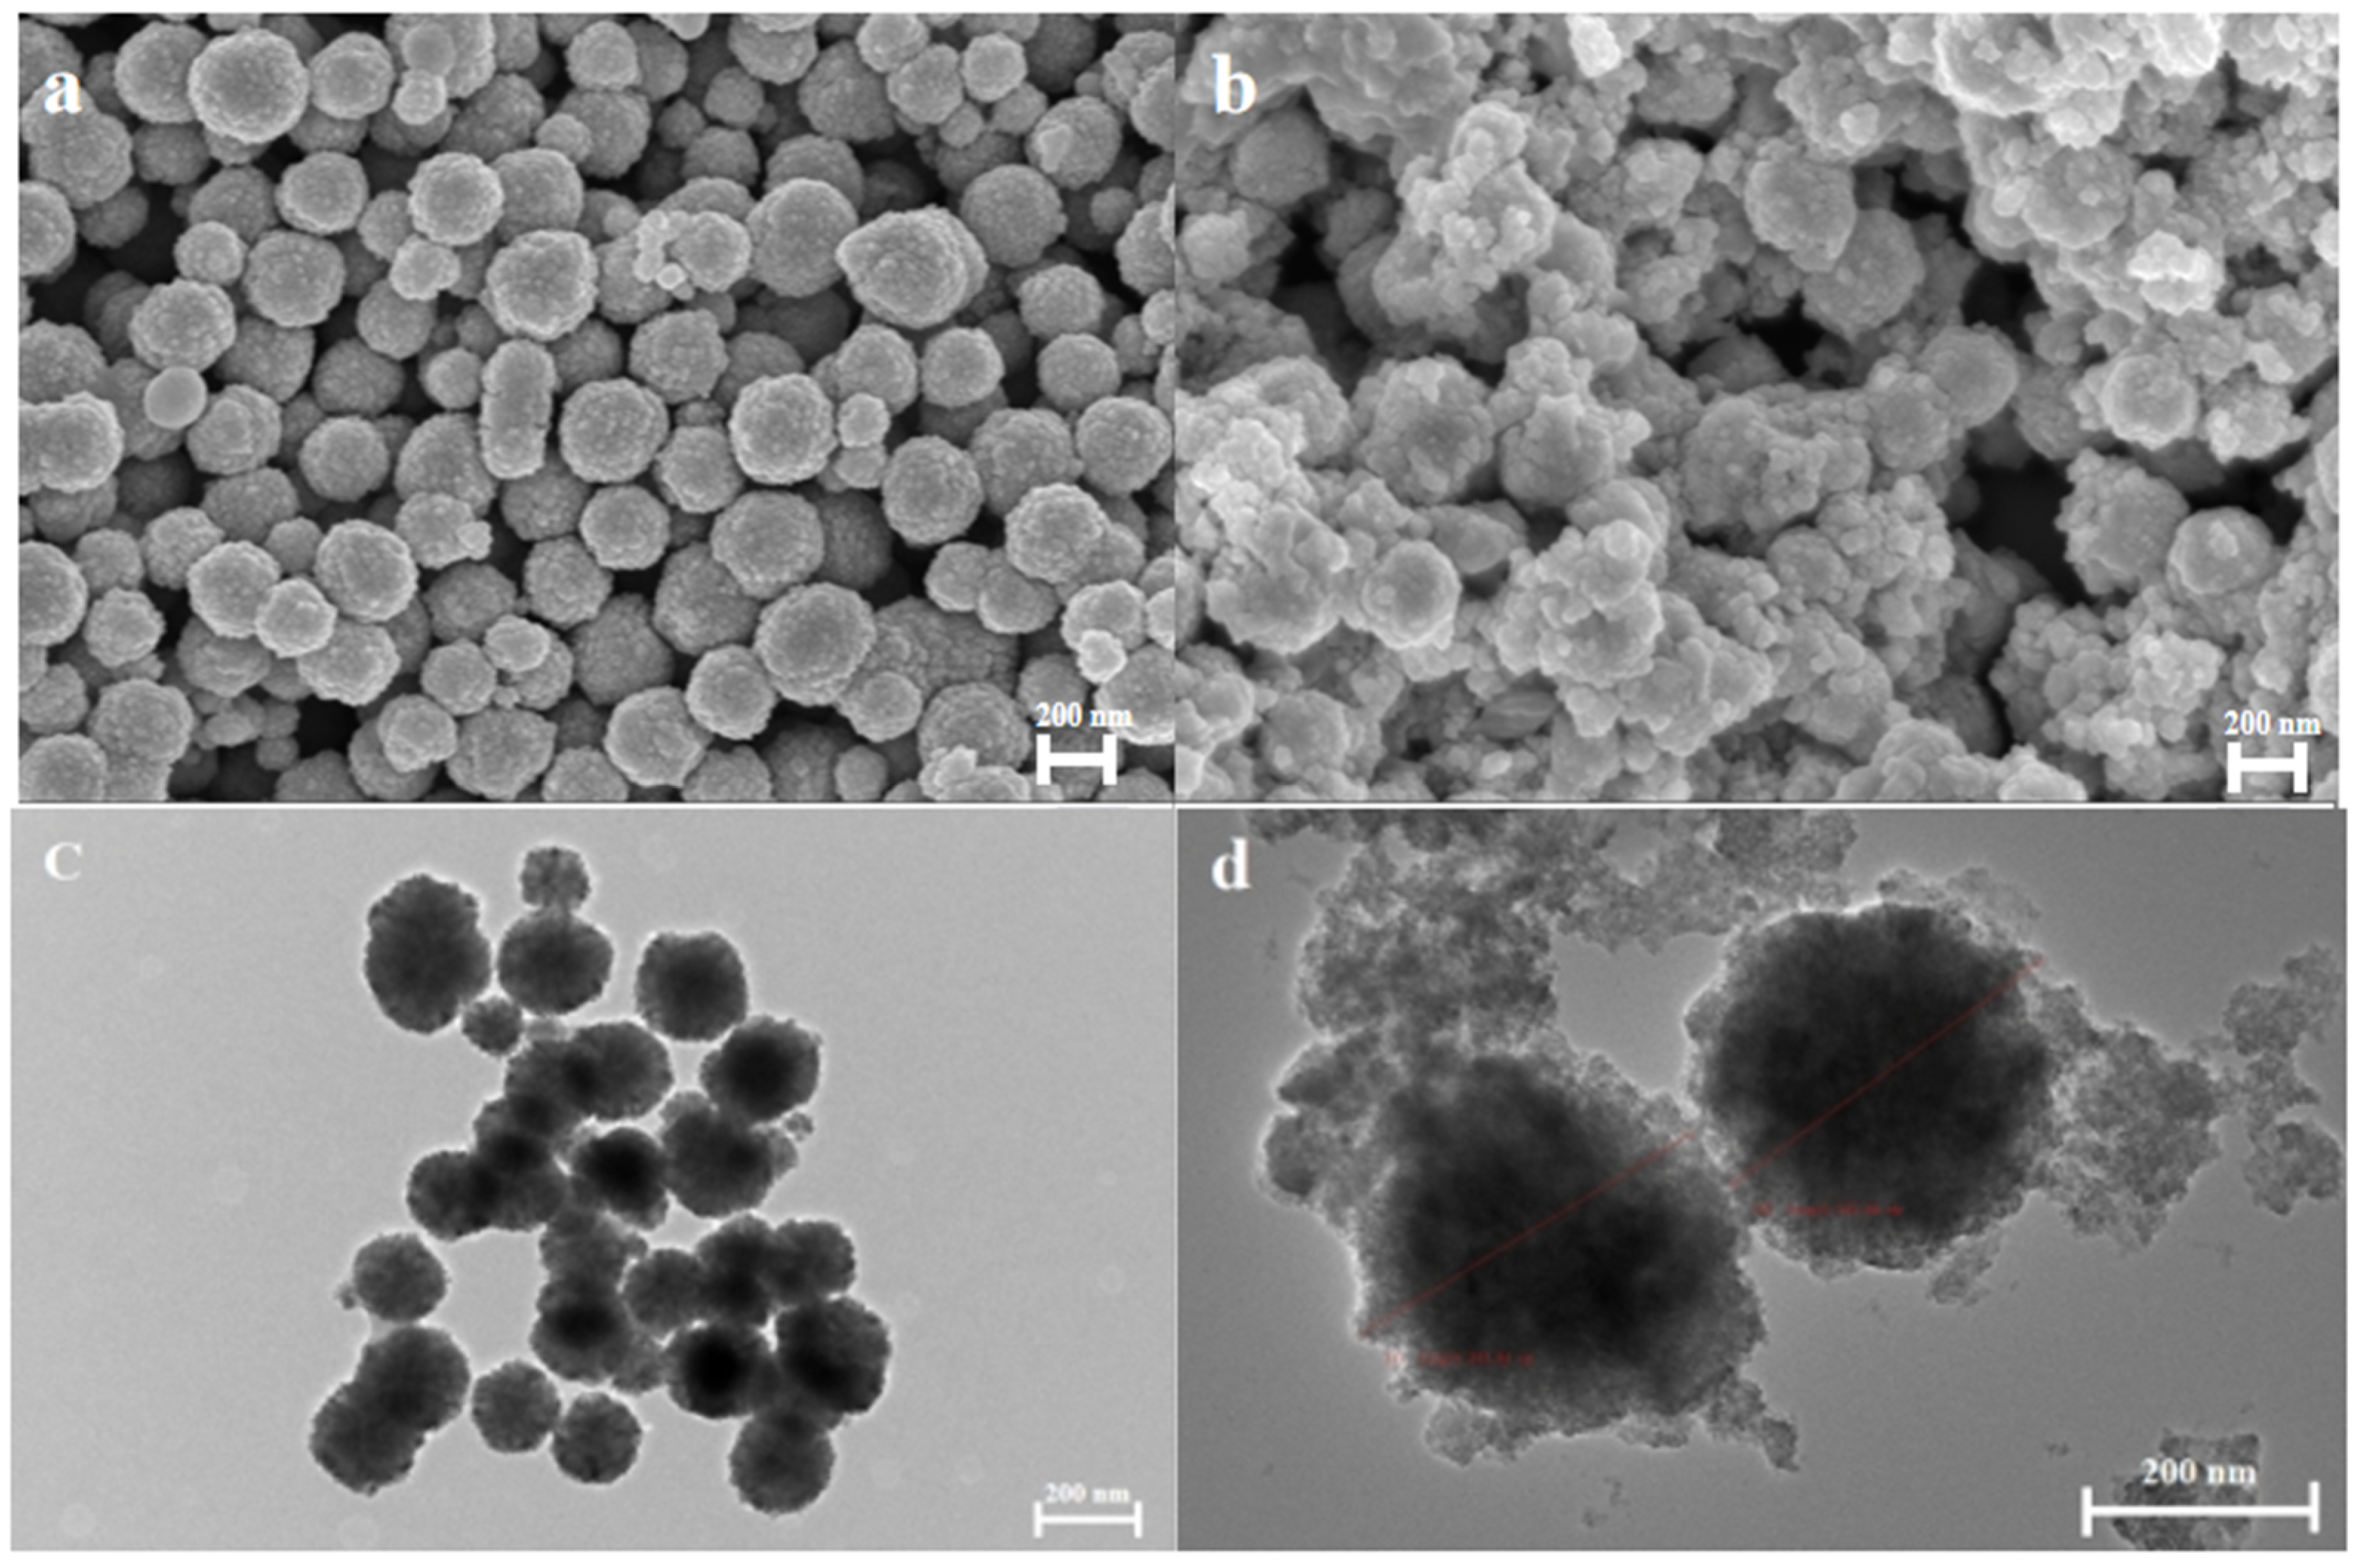
3.1.1. Morphology Analysis

The morphology and particle size of Fe3O4 MNPs and Fe3O4@ZnS@MPS core-shell nanocomposites were investigated using SEM and TEM.
Figure 1a,c show the SEM and TEM images of Fe3O4 MNPs, from the commercial Fe3O4 with a diameter distribution from 150 to 250 nm, which reveal that Fe3O4 MNPs have a regular and uniform distribution. In addition, the SEM image of Fe3O4@ZnS@MPS is shown in Figure 1b. Compared with Figure 1a,b, it can be seen that ZnS particles are accumulated on the surface of Fe3O4 after the modification of the thiol group, and the surface of Fe3O4 MNPs becomes irregular and rough. In addition, TEM images (Figure 1d) of Fe3O4@ZnS@MPS with a diameter distribution from 200 to 300 nm were obtained, which show that ZnS particles modified with sulfhydryl groups have been deposited on the surface of Fe3O4 MNPs [23].

3.1.2. XRD Analysis

Figure 2 shows the XRD patterns of Fe3O4, Fe3O4@ZnS, and MFNPs. In the XRD pattern, several diffraction peaks around 2θ = 30.1°, 35.6°, 43.1°, 53.7°, 57.1°, and 62.8° were observed for Fe3O4@ZnS@MPS, which could be assigned to the (220), (311), (400), (422), (511), and (440) planes of the cubic spinel crystal structure of Fe3O4, respectively. There were also three new diffraction peaks at around 2θ = 28.9°, 47.7°, and 57.0°, which could confirm the existence of ZnS crystals in the composites [24]. The position of the diffraction peak did not change when the quantum dots and sulfhydryl groups were modified, indicating that the Fe3O4 magnetic core did not undergo chemical or structural changes during the coating process. Figure 2 clearly shows that the spectral peaks are basically the same before and after functionalization, indicating that the crystal structure of Fe3O4 does not change during different functionalization processes [25,26].

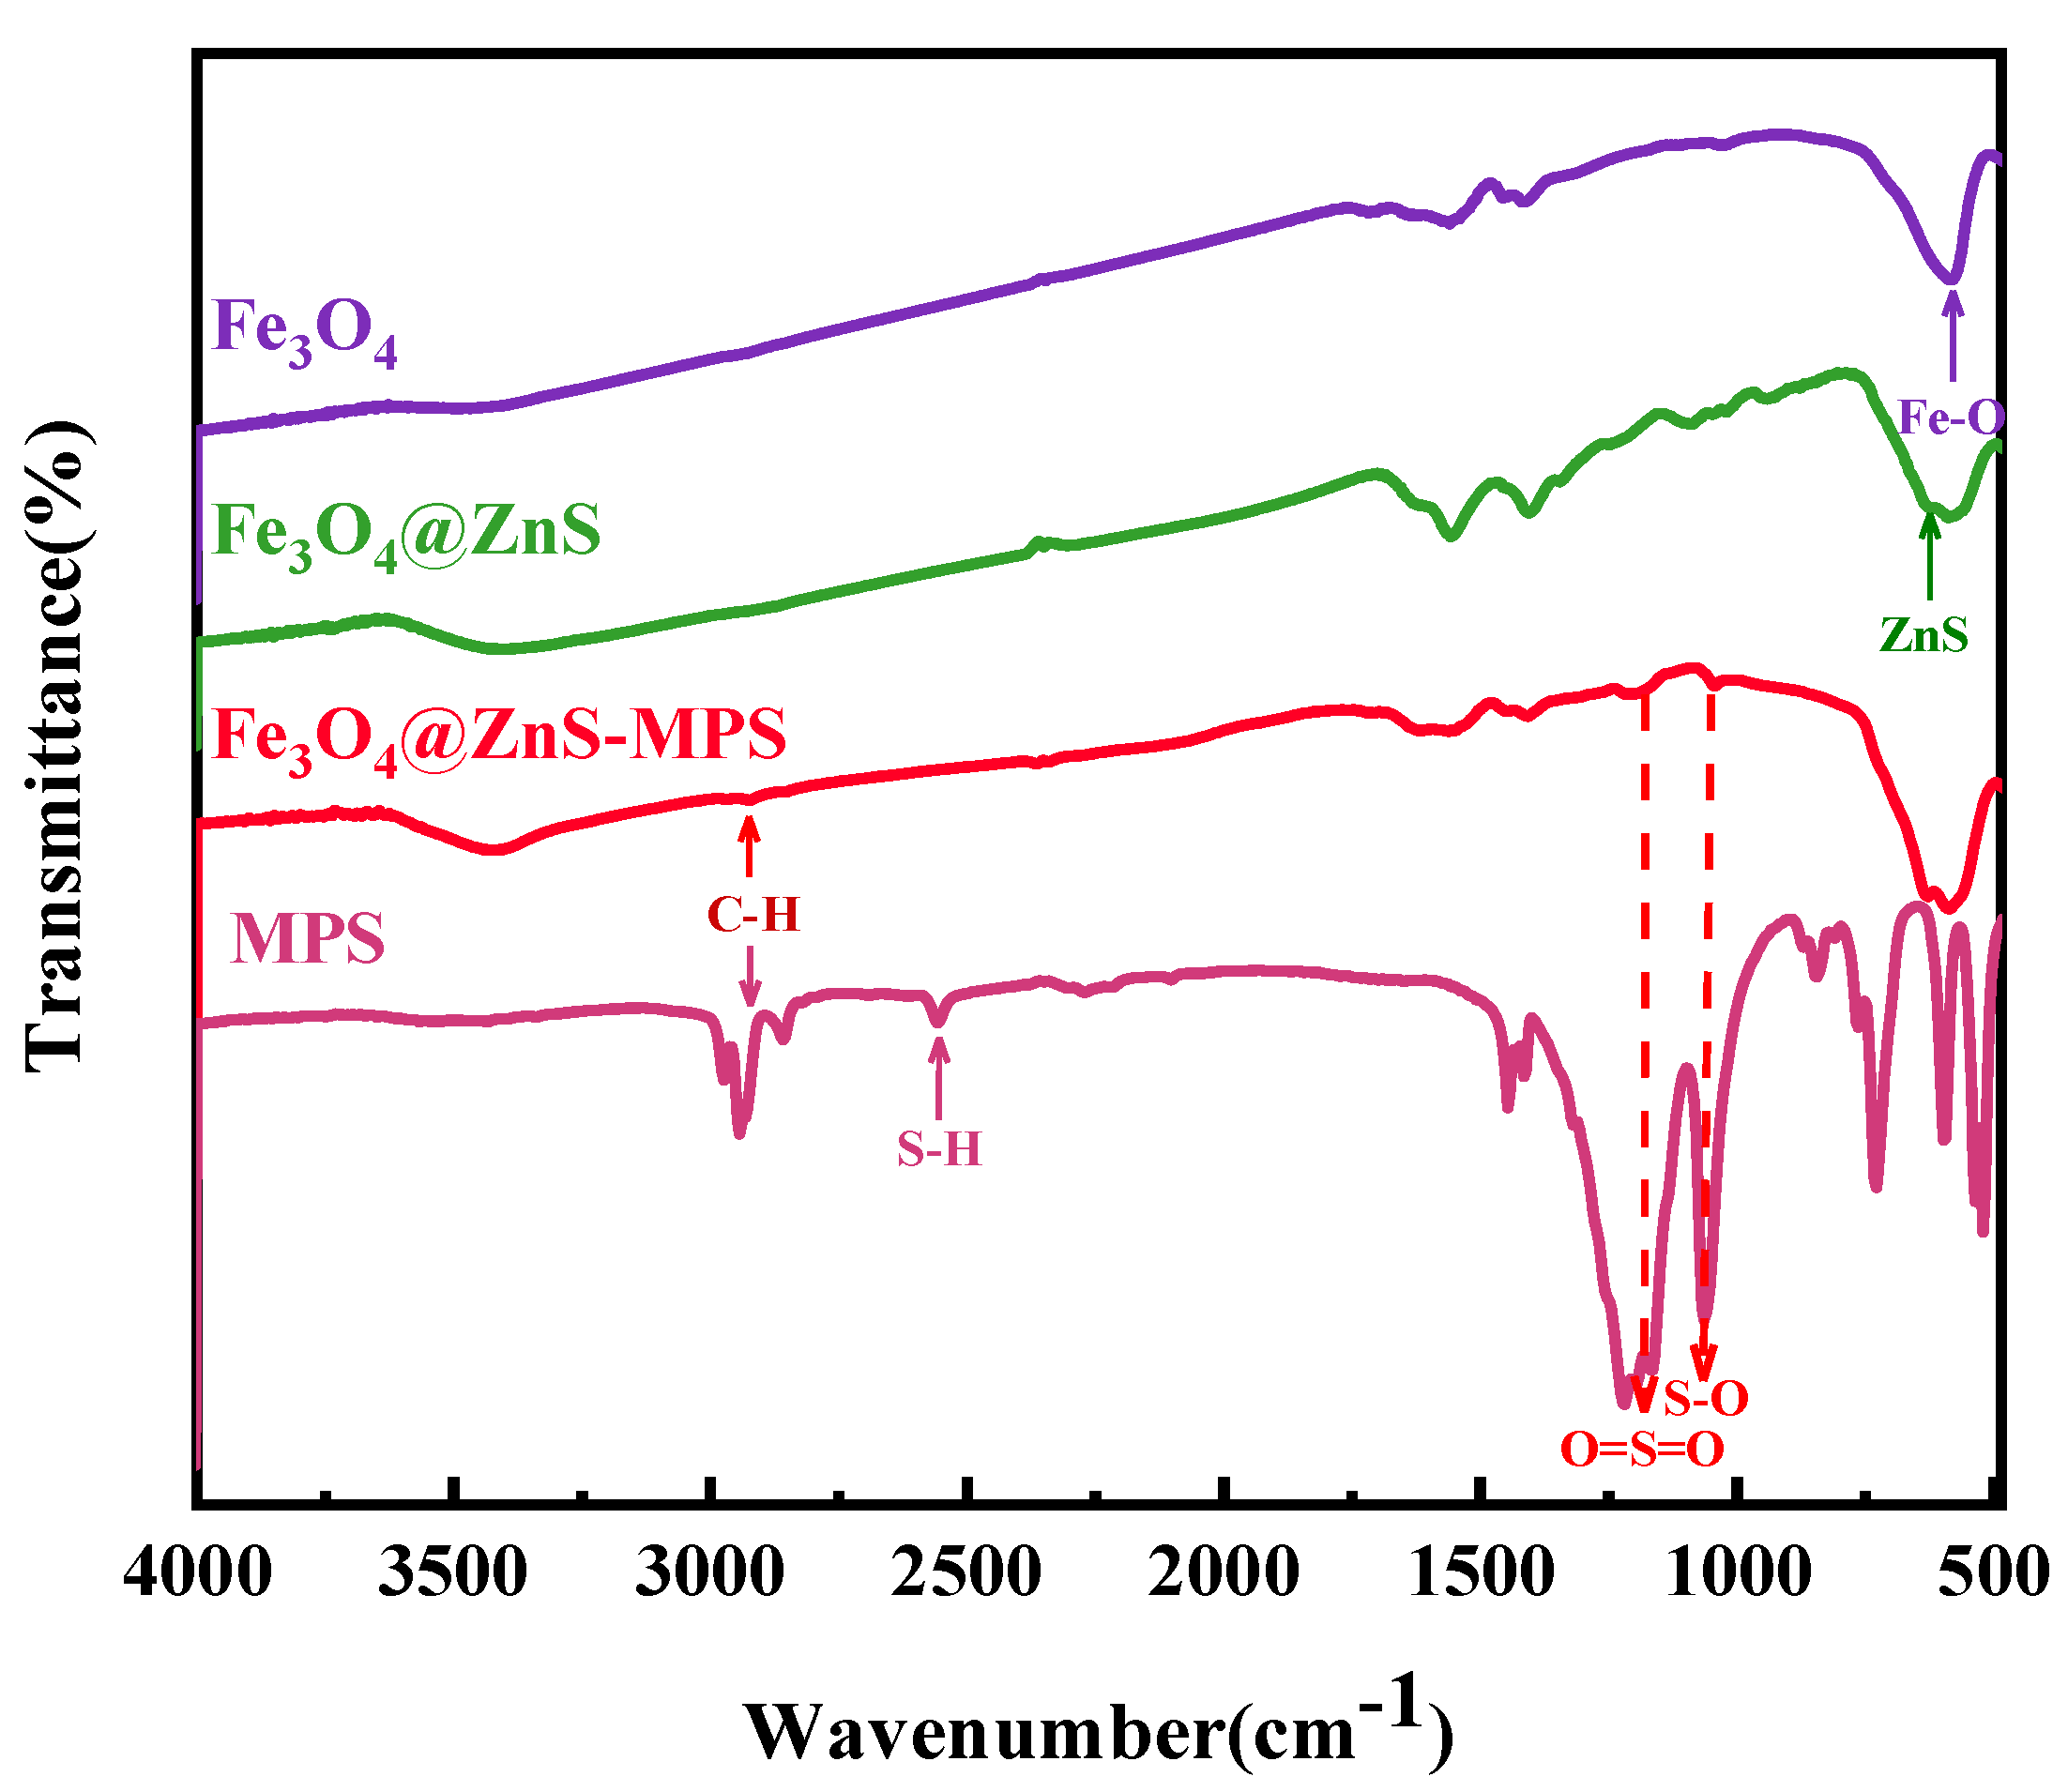
3.1.3. FT−IR Analysis

Figure 3 shows the infrared (IR) spectra of Fe3O4, Fe3O4@ZnS, Fe3O4@ZnS@MPS, and MPS. It can be seen from the infrared spectra of the magnetic microspheres that the strong absorption peak at 584 cm−1 is related to the stretching vibration of the Fe–O bond. For Fe3O4 @ZnS magnetic fluorescent nanoparticles, the peaks corresponding to the stretching vibration of Fe–O and Zn–S appeared at 580 cm−1 and 627 cm−1. The stretching vibration of -SH in MPS corresponds to a peak at 2555 cm−1. For MFNP nanoparticles, the Zn–S stretching vibration peak was obviously masked after sulfhydryl modification at 1018 cm−1, and a new C–H peak appeared at 2922 cm−1 [27]. The corresponding peak of the new S–O stretching vibration was 1042 cm−1, while the peak at 1178 cm−1 was assigned to the O=S=O symmetric stretching vibration. This can prove that the sulfhydryl group is bound to the surface of the microspheres and the ligand is successfully modified on the surface of the microspheres [28,29,30,31].

3.1.4. XPS Analysis

The elemental composition of the Fe3O4@ZnS@MPS nanoparticle was explored by XPS analysis (Figure 4), The five peaks at 1019.2 eV, 709.8 eV, 529.6 eV, 285.6 eV, and 159.2 eV are composed of Zn 2p, Fe 2p, O 1s, C 1s, and S 2p, respectively, confirming the successful synthesis of Fe3O4@ZnS@MPS nanoparticles. Figure 4b shows that the binding energies of Fe3+ 2p3/2 and Fe3+ 2p1/2 are 710.8 and 725.0 eV, respectively, and the bimodal fitting of Fe 2p can obtain the binding energies of Fe2+ 2p3/2 and Fe2+ 2p1/2 at 708.7 and 721.6 eV, respectively. The results indicate that Fe3O4 exists in the nanoparticle. According to Figure 4c, the difference in binding energy between Zn 2p3/2 and Zn 2p1/2 is 22.5 eV, indicating that metallic Zn supported by the MFNPs mainly exists in the Zn2+ valence state. Peaks at 159.5 eV and 160.7 eV (Figure 4d) are attributed to metal sulfides S2− (2p3/2 and S 2p1/2) from ZnS, respectively [32,33].

3.1.5. Hysteresis Curve

The magnetic properties of the Fe3O4 and Fe3O4@ZnS@MPS MFNPs were studied using a VSM in an external magnetic field from −20,000 to +20,000 Oe, and results are shown in Figure 5. The saturation magnetization of Fe3O4 MNPs was 64.52 emu/g, and that of Fe3O4@ZnS@MPS nanocomposites was 47.09 emu/g. The magnetization in the nanocomposites is reduced due to the diamagnetic effect of the thick sulfhydryl-modified ZnS layer around the Fe3O4 MNPs. Ion redistribution of Zn2+ may also have contributed to the decrease in the saturation magnetization of the composite. However, it still possesses typical superparamagnetism, which can meet the experimental requirements, and still shows excellent magnetic properties after removal of Ag+ (inset figure) [11,34].

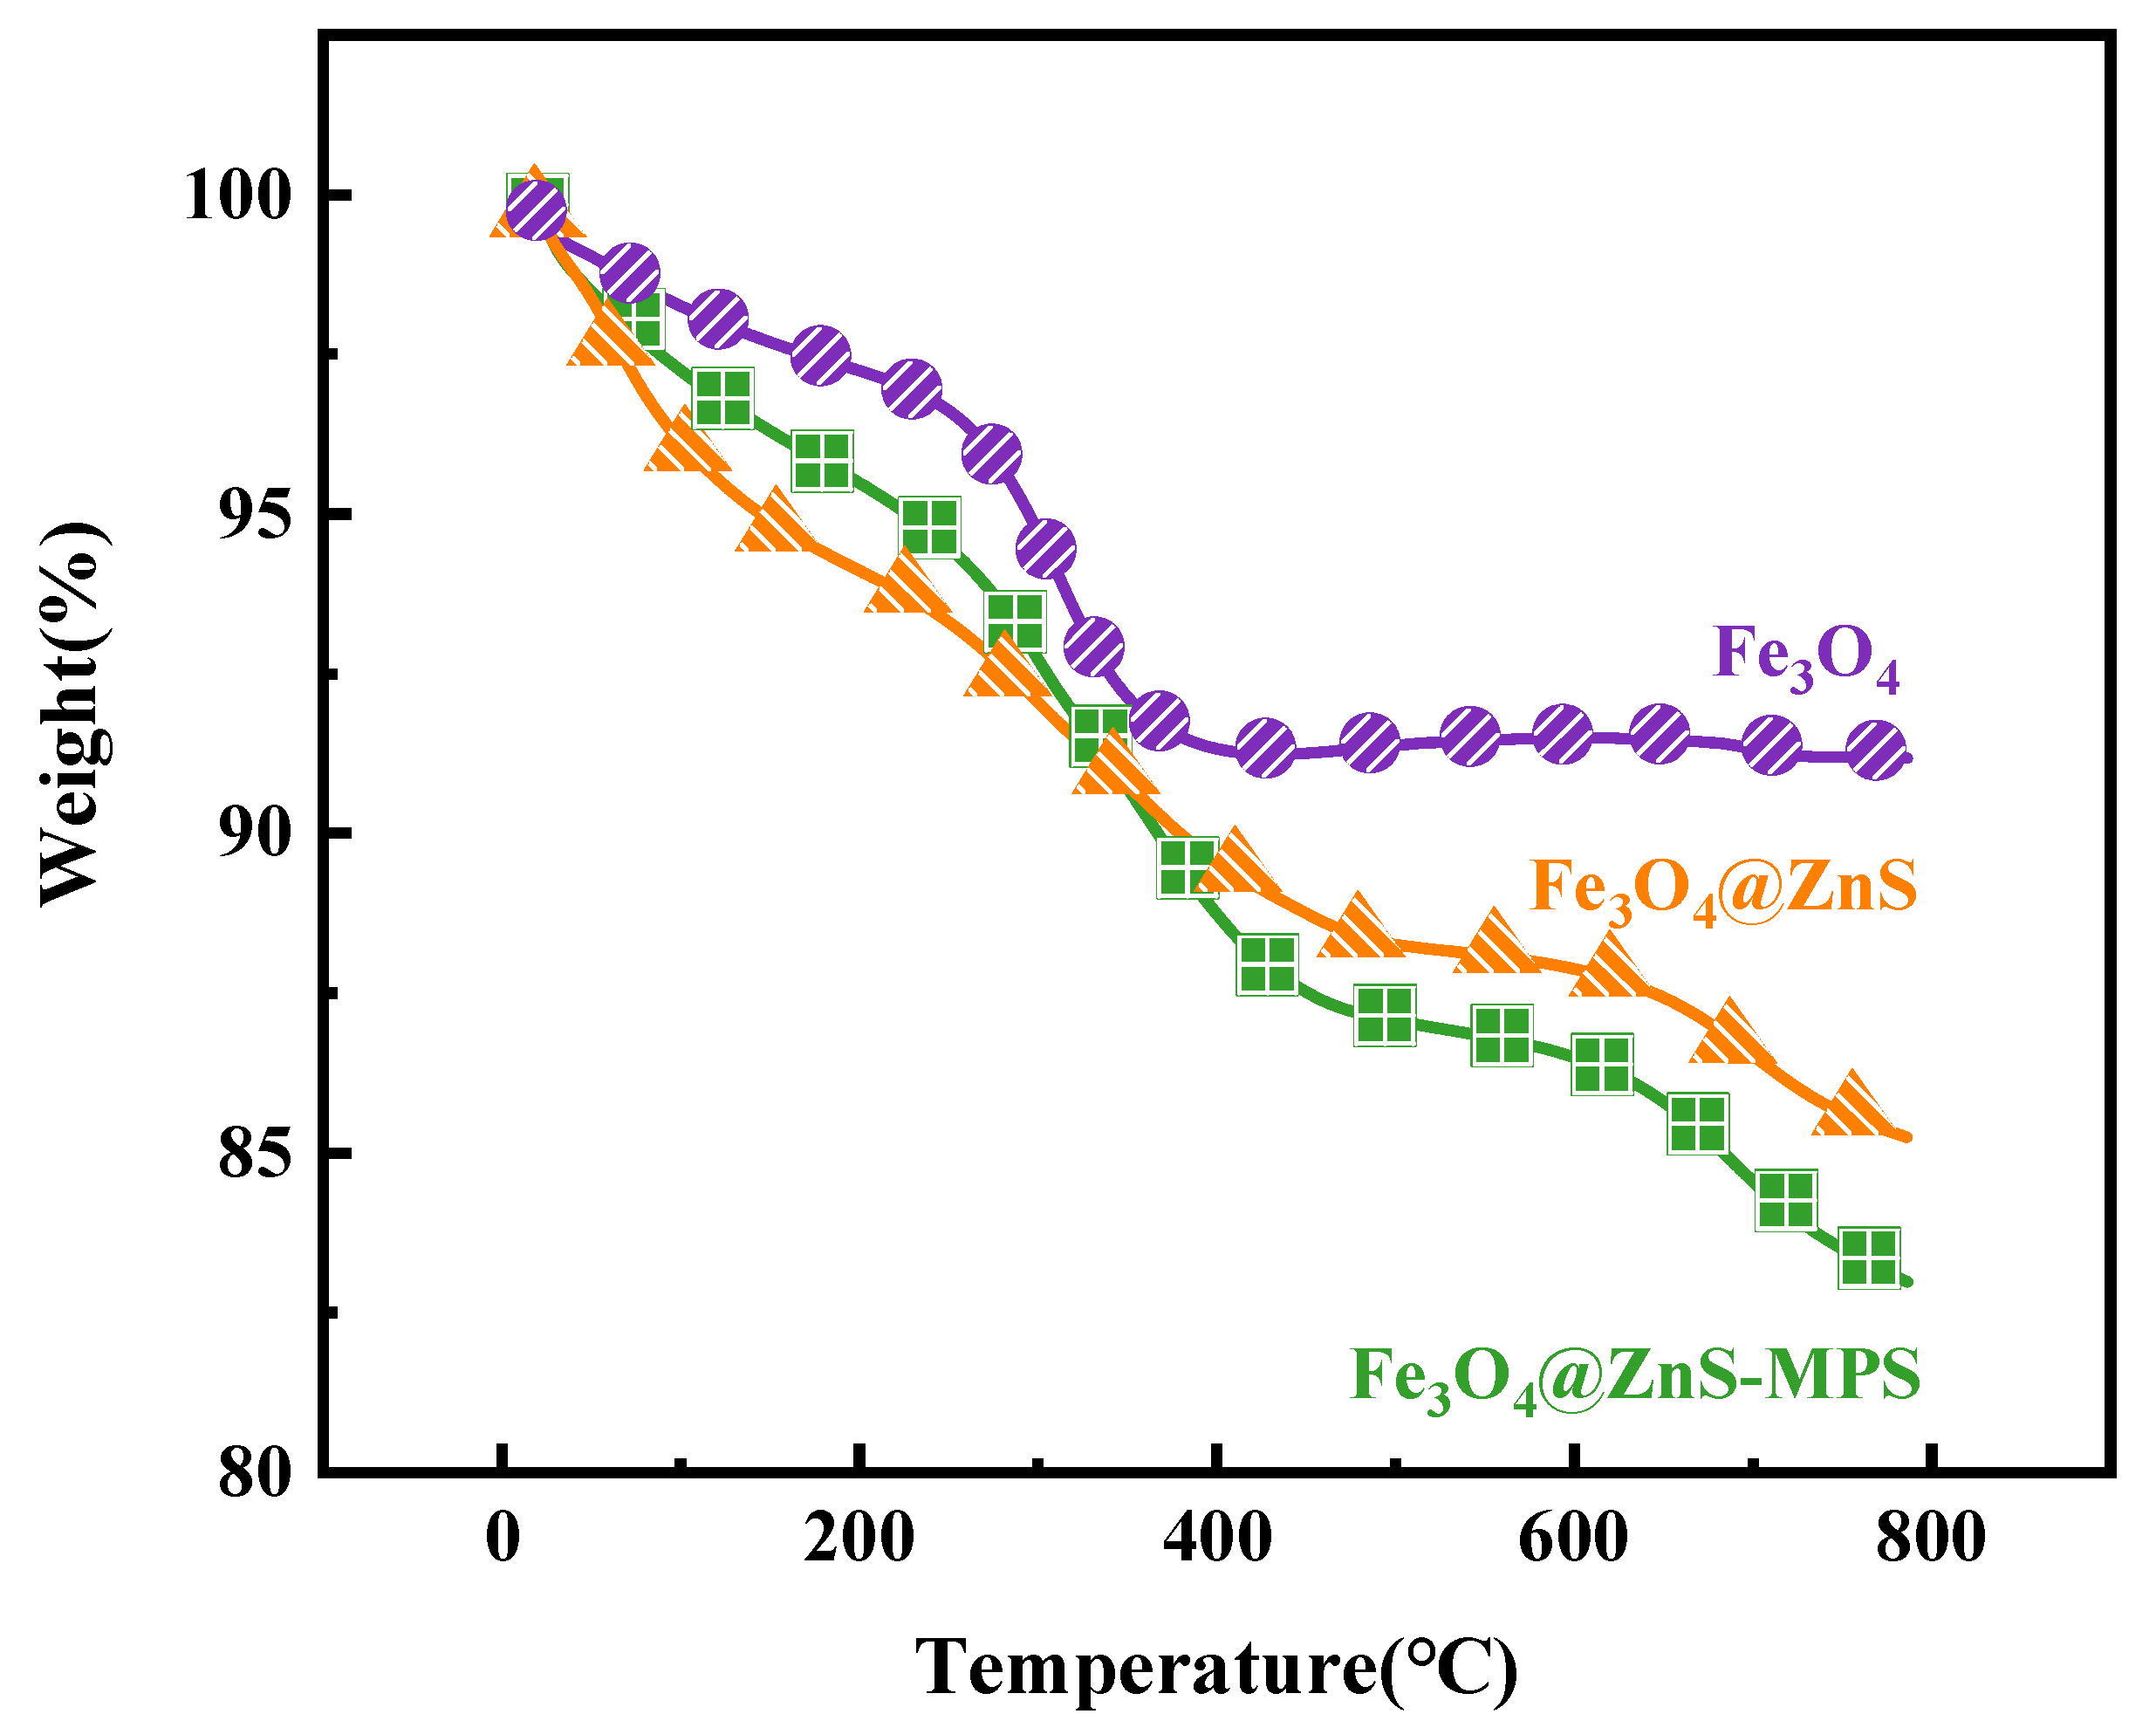
3.1.6. Thermogravimetric Analysis

In order to study the thermal properties of the samples, a thermal weight loss analyzer was used to analyze the samples. The thermal properties constitute an important index used to evaluate the hybrid materials, and differ with different synthesis methods. The TGA curves of MFNFs were measured at a heating rate of 10 °C/min under a nitrogen atmosphere, and the results are shown in Figure 6. As shown in Figure 6, the overall weight loss rate of the products is not very large, and the weight loss rate of Fe3O4 is only about 8%. After the modification of ZnS, its weight loss is reduced to 15%, and the extra weight loss is the water contained in ZnS. The weight loss rate reaches 18% after the modification of MPS, indicating that the polymer in the sample was removed. Therefore, the TGA analysis shows that the sulfhydryl group was modified on the surface of Fe3O4 magnetic microspheres.
Combined with the above data, it can be proven that the Fe3O4@ZnS@MPS magnetic fluorescent nanosensors (MFNPs) have been successfully synthesized.

3.2. Detection Performance Study of MFNPs

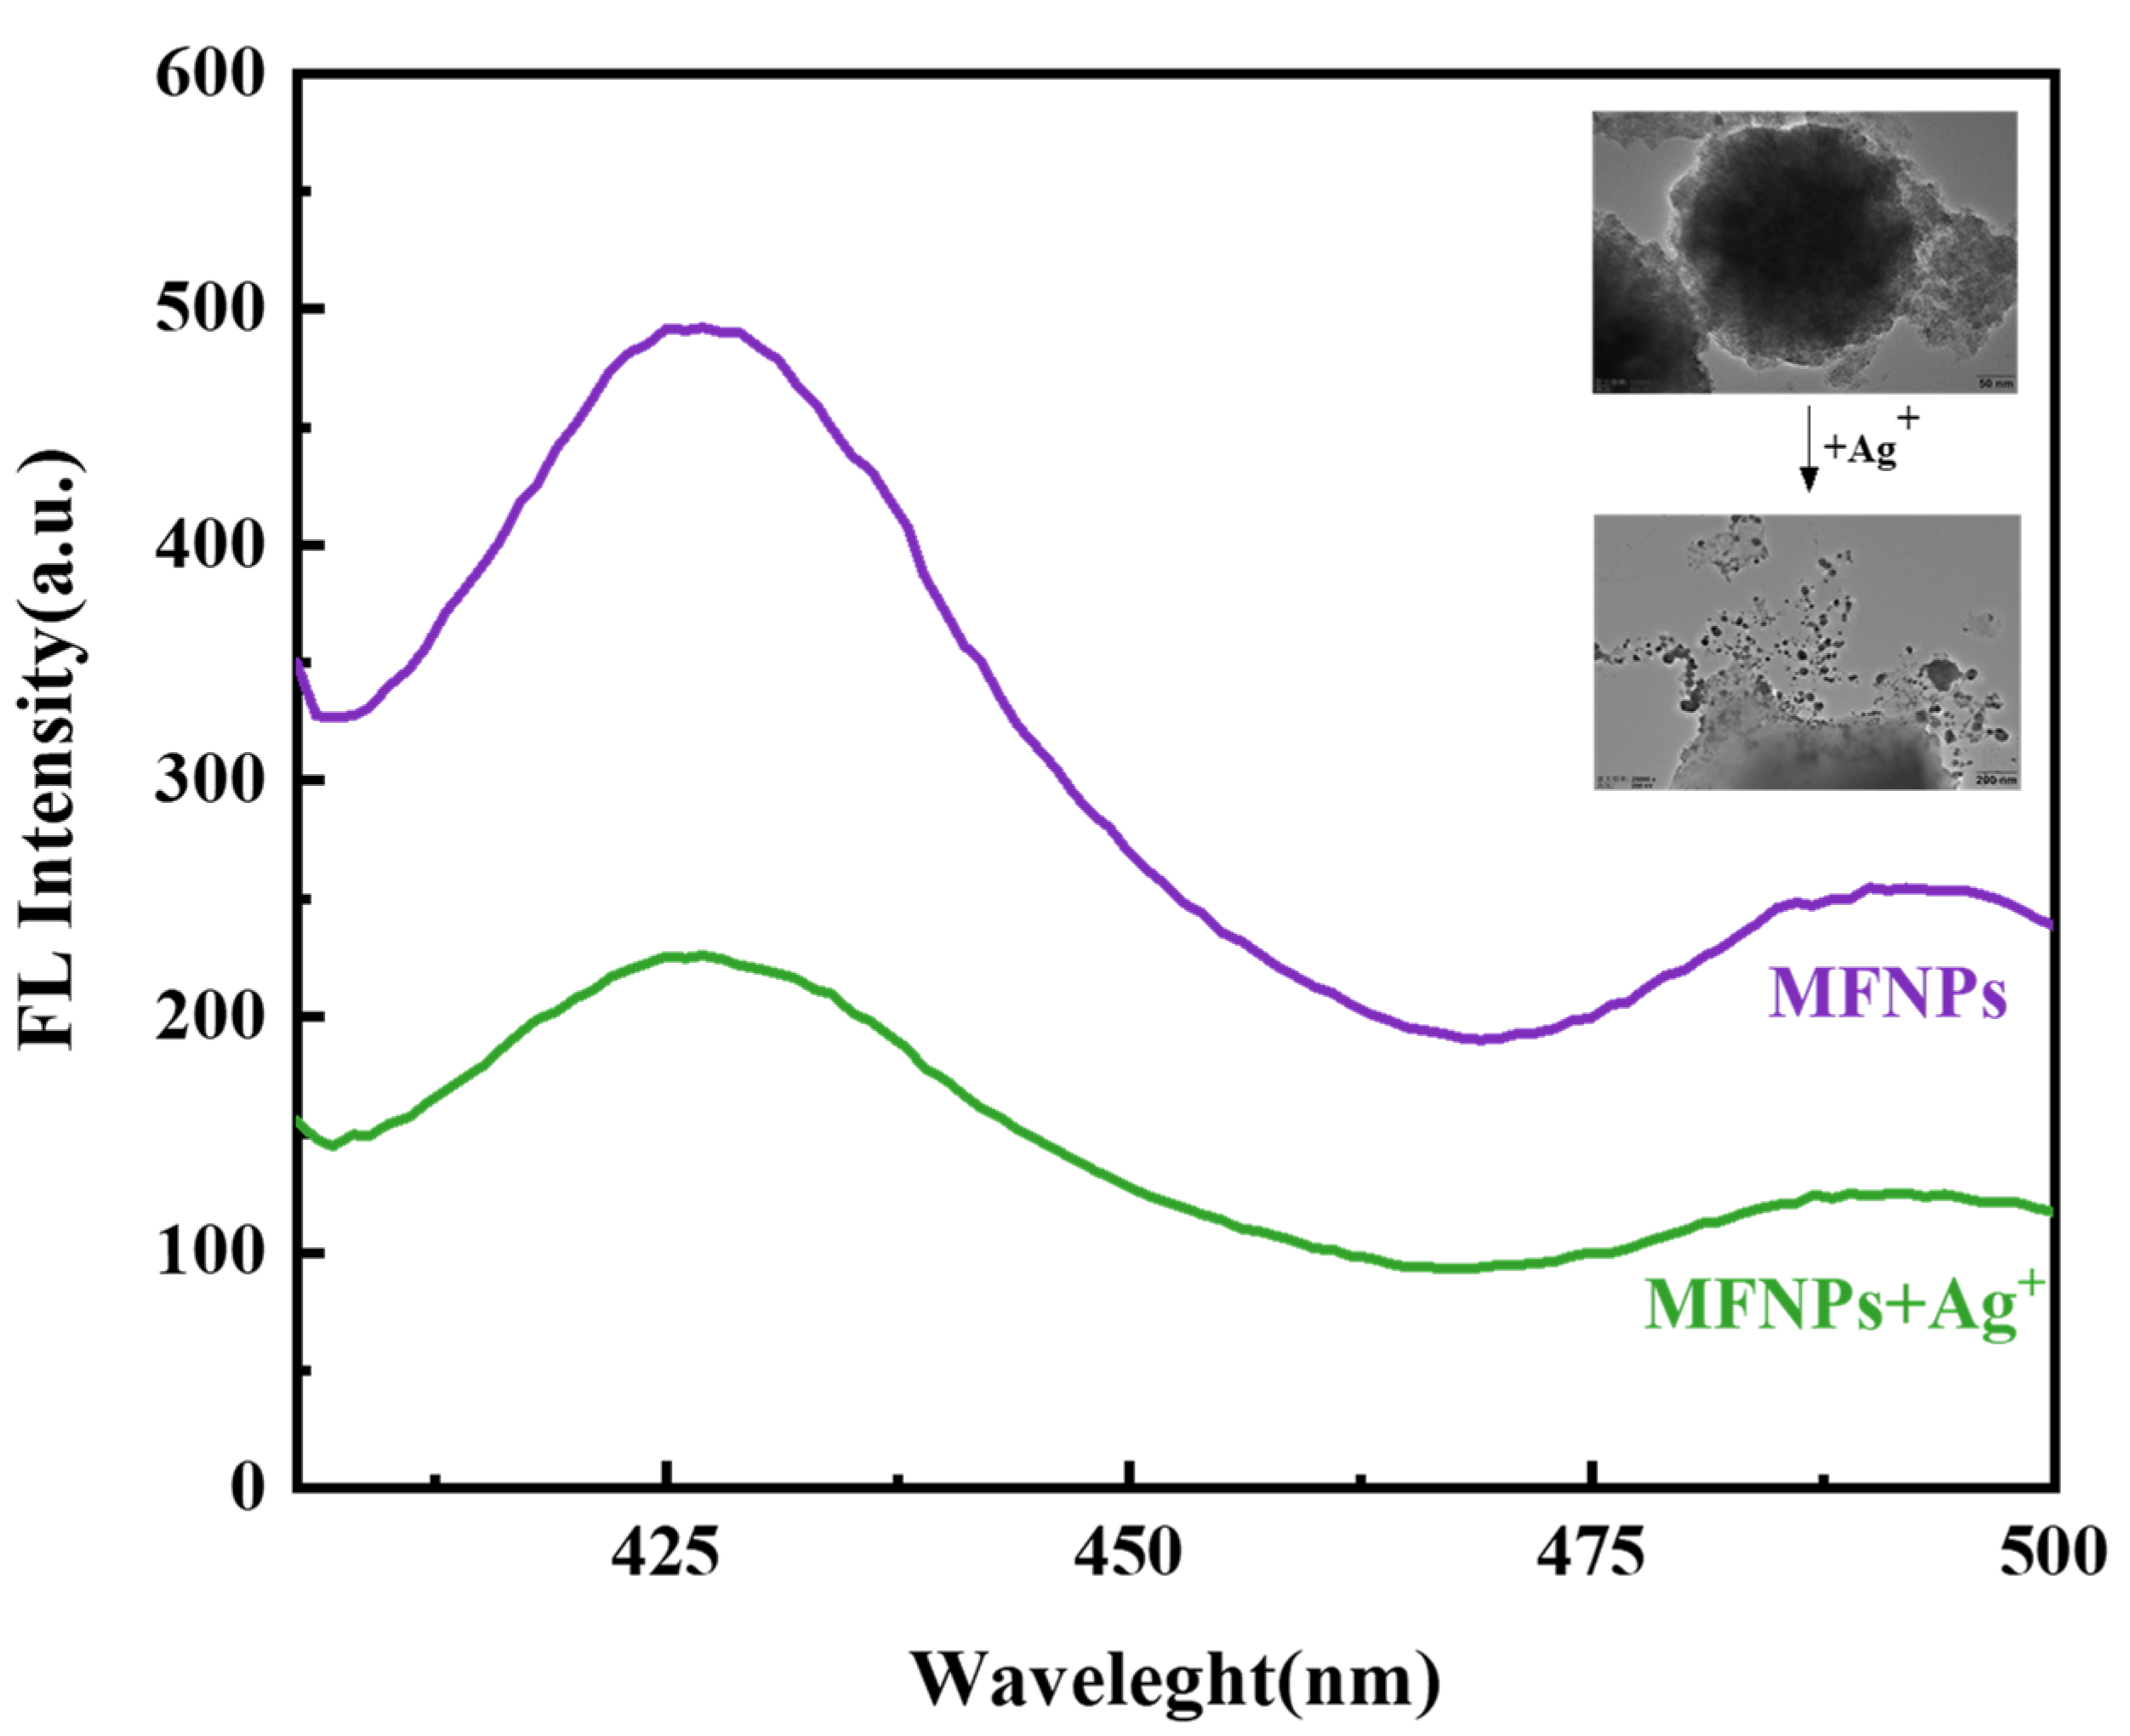
3.2.1. Performance Analysis of Magnetic Fluorescence Nanosensor MFNPs

Figure 7 shows the comparison of fluorescence characteristic spectra before and after the addition of Ag+ to MFNPs. Figure 7 shows that the addition of Ag+ can significantly quench the fluorescence intensity of MFNPs, and the inset shows the TEM images of MFNPs before and after the addition of Ag+. It can be clearly seen that Ag+ has been loaded and dispersed on the surface of the MFNPs. MFNPs have good dispersibility and are almost spherical. The complexation of Ag+ with sodium 3-sulfhydryl-1-propane sulfonate on the surface of MFNPs leads to Ag+ aggregation and obvious fluorescence quenching.

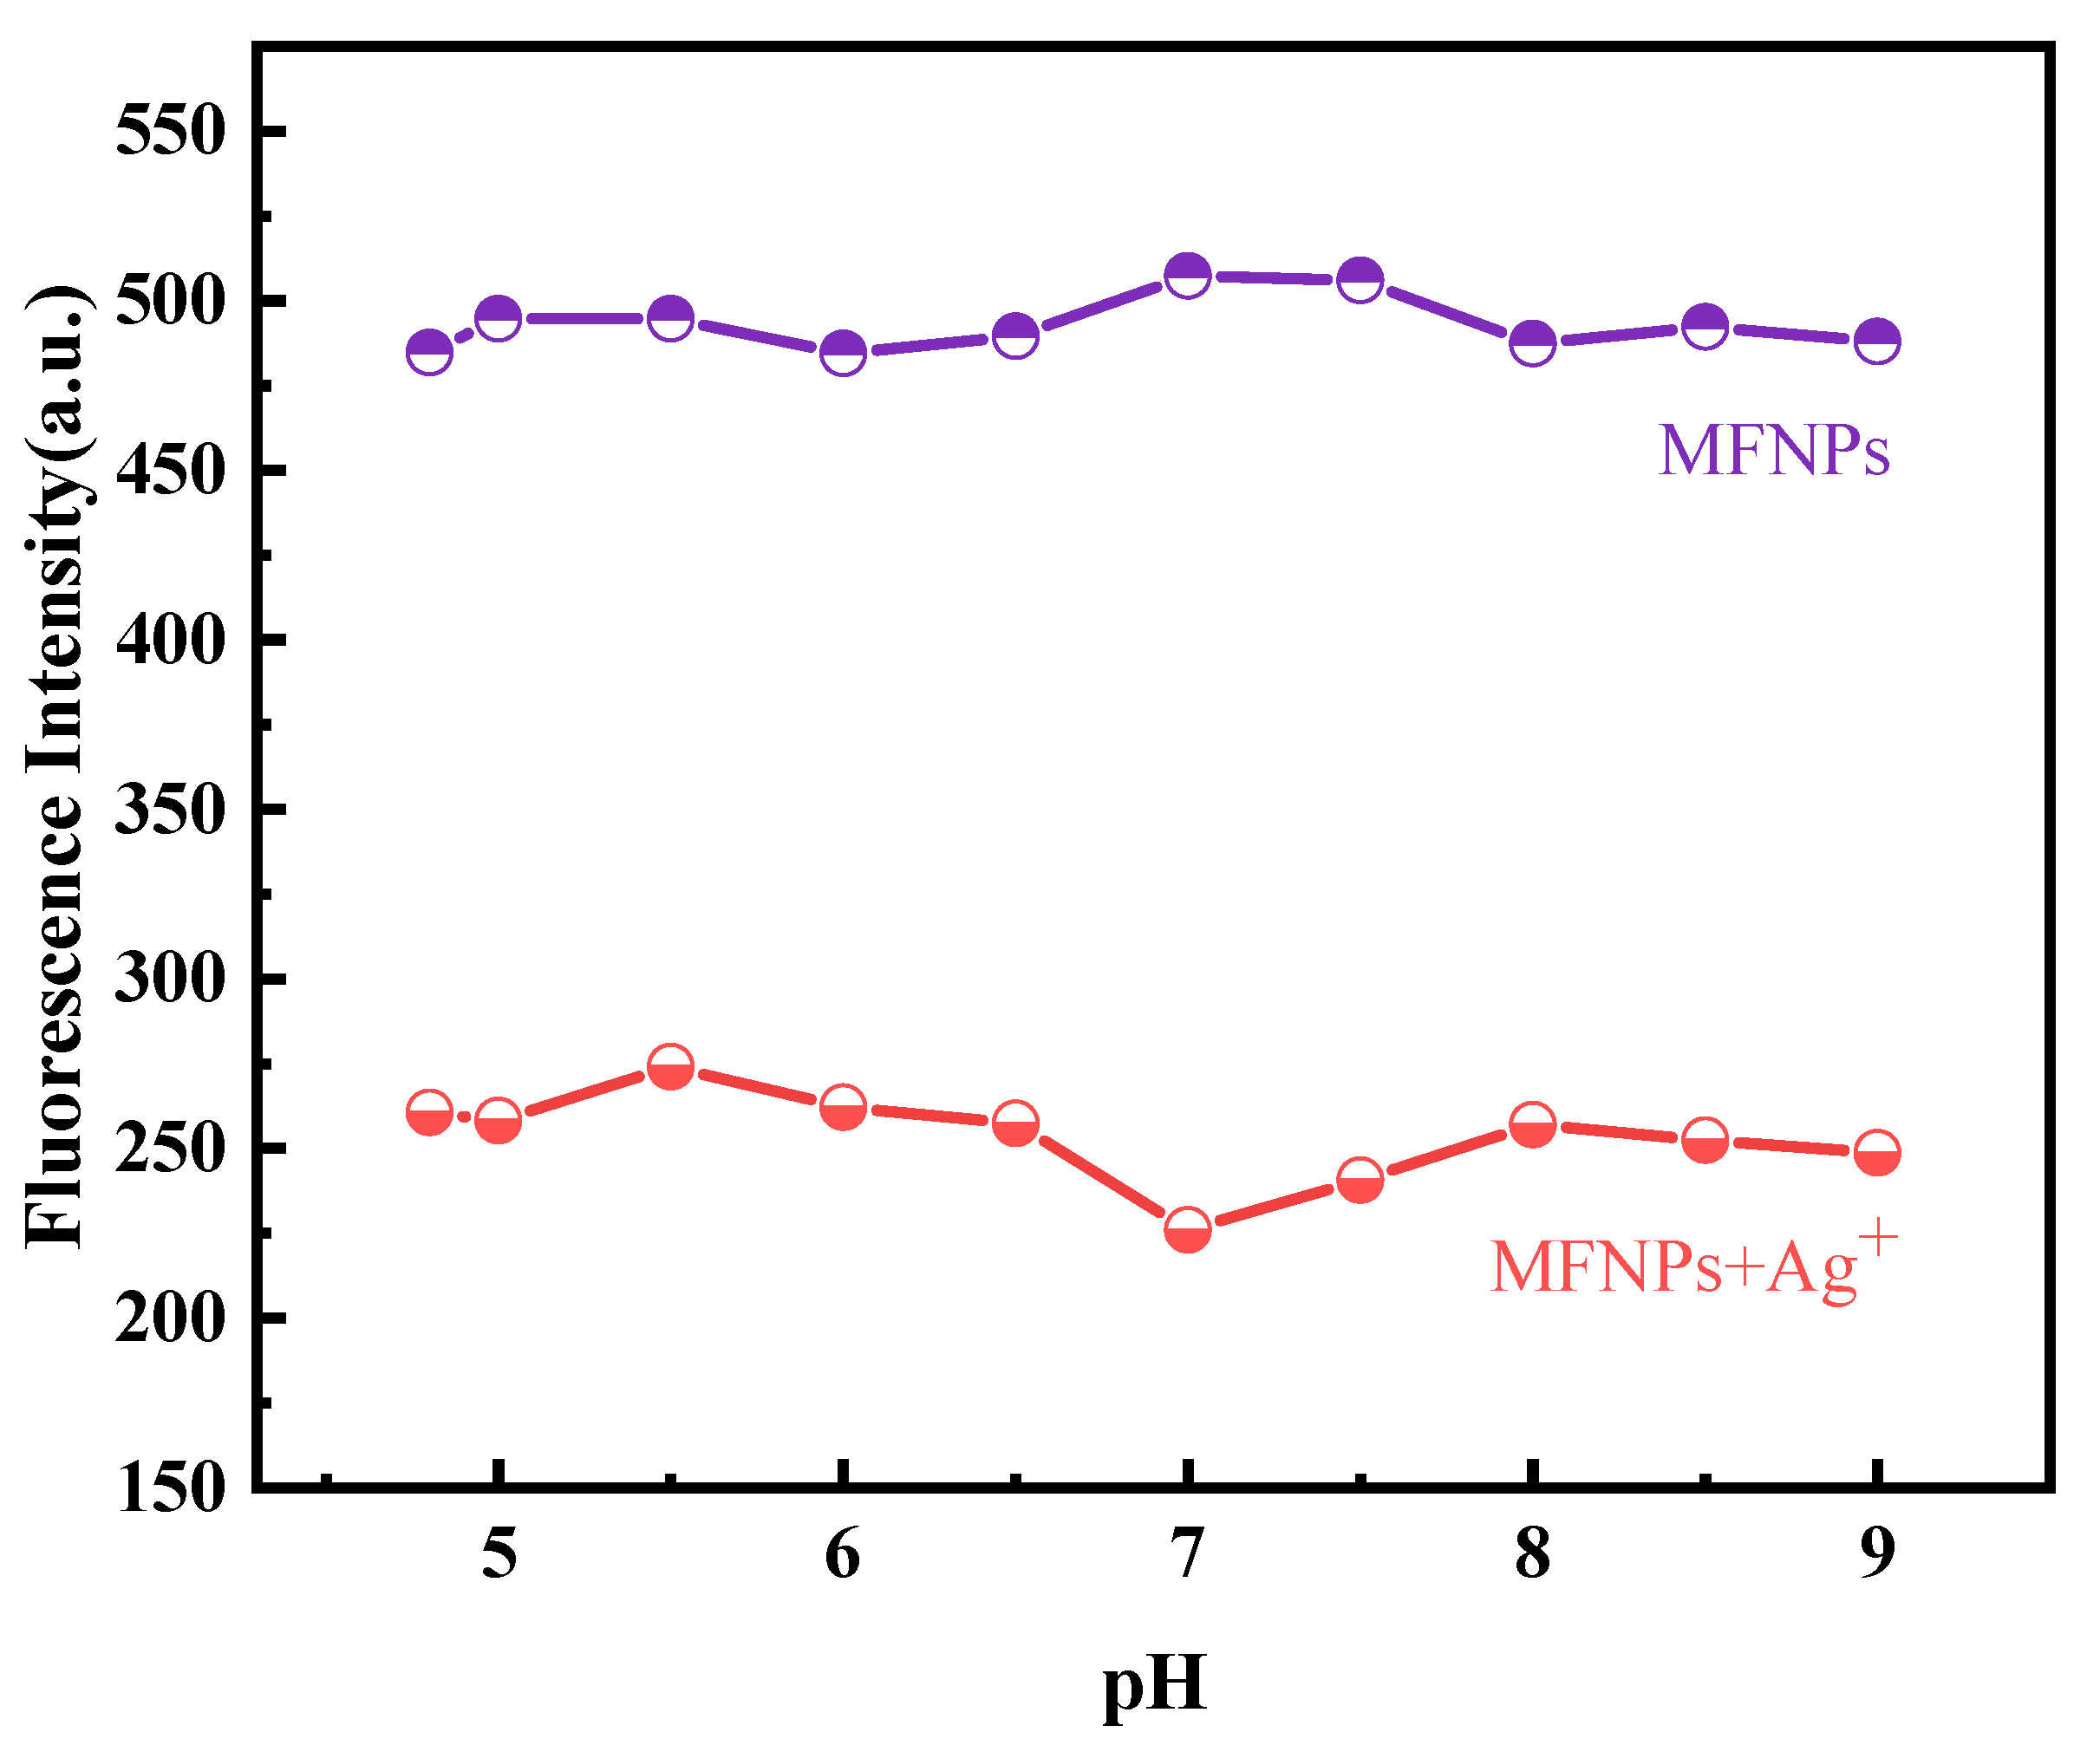
3.2.2. The Effect of pH on the Fluorescence of MFNPs

One of the crucial factors determining the sensor’s capacity for detection is the pH level of the solution. As can be seen from Figure 8, the fluorescence intensity of the probe itself does not change greatly within the range of 4.8–9.0, and the degree of fluorescence intensity quenched by the addition of silver ions was not affected by the pH value. Therefore, we chose the common neutral liquid pH value of 7.0 as the experimental standard.

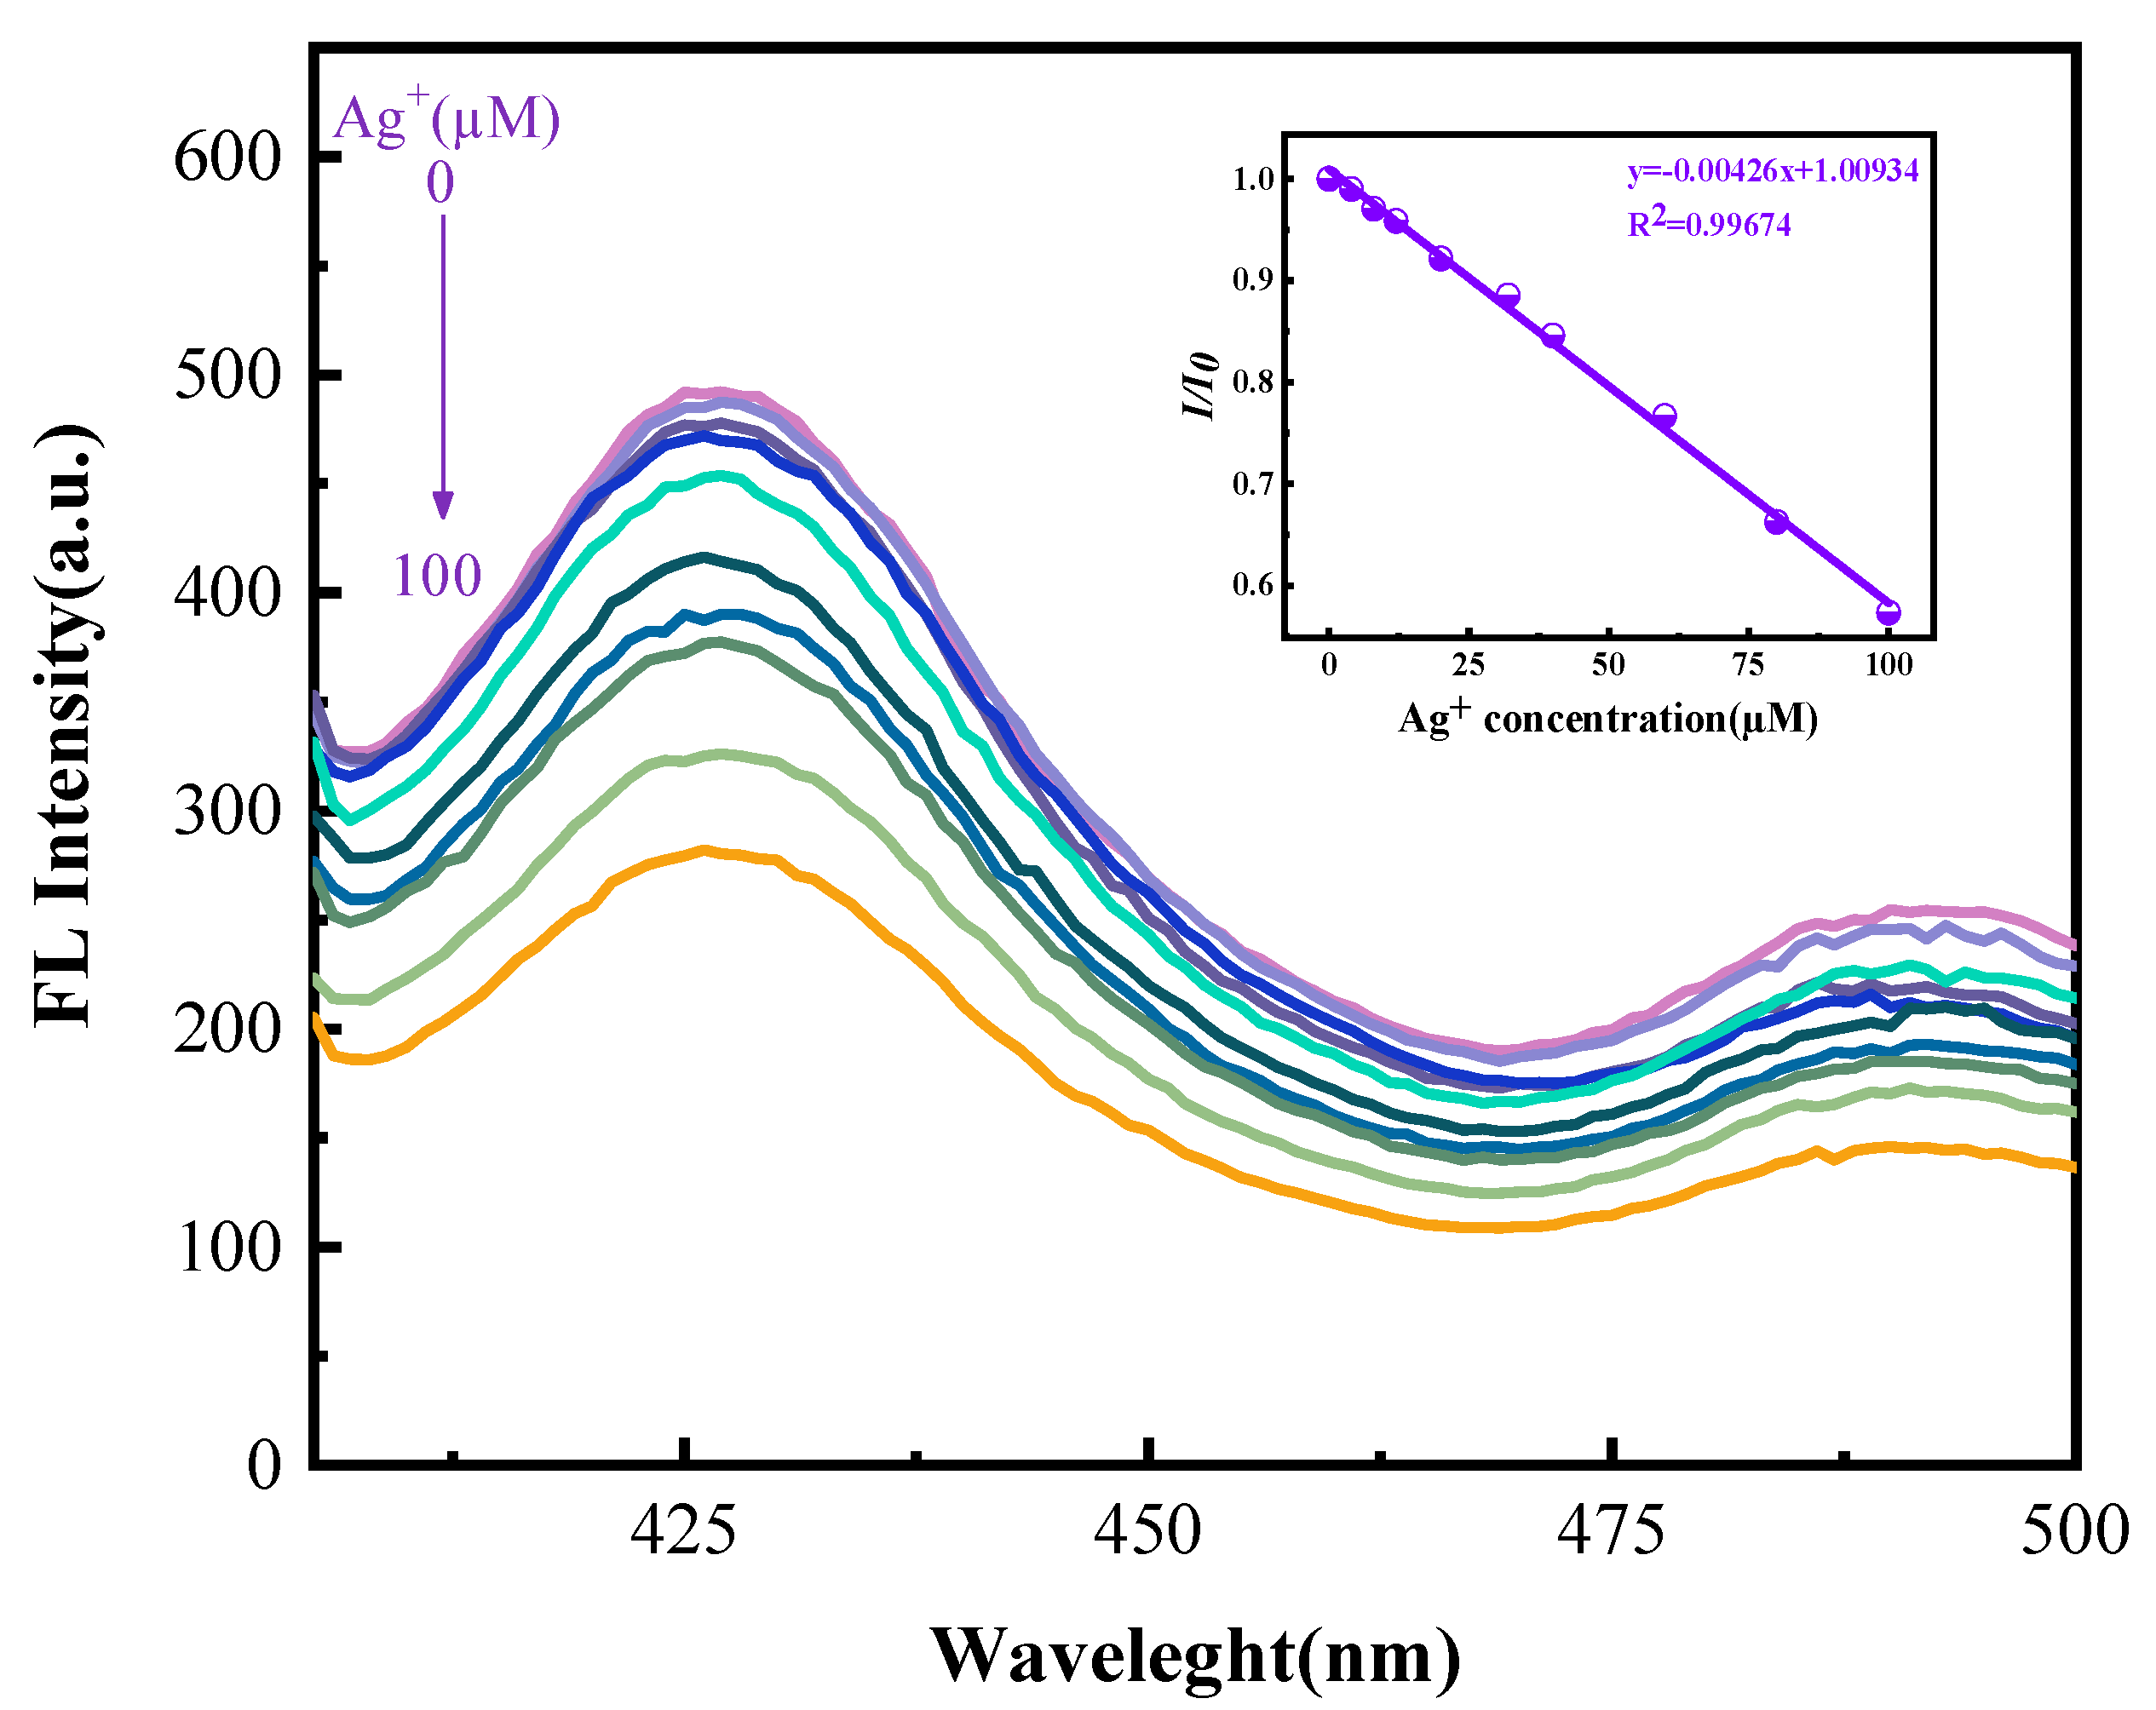
3.2.3. The Response Range and Relation Curve of MFNPs to Ag+

With the increase in the concentration of Ag+, the fluorescence intensity gradually weakens in the range of 0–100 µM (Figure 9). There was a linear relationship between the concentration of Ag+ and the fluorescence intensity I/I0 = −0.00426x + 1.00934 (R2 = 0.9967), where x is the concentrations of Ag+ (µM), with the LOD of 7.04 µM. Therefore, the sensor of the presented invention can more accurately determine the content of Ag+. Based on the data of the linear range and the detection limit, it can be seen that the probe showed good performance (Table 1).

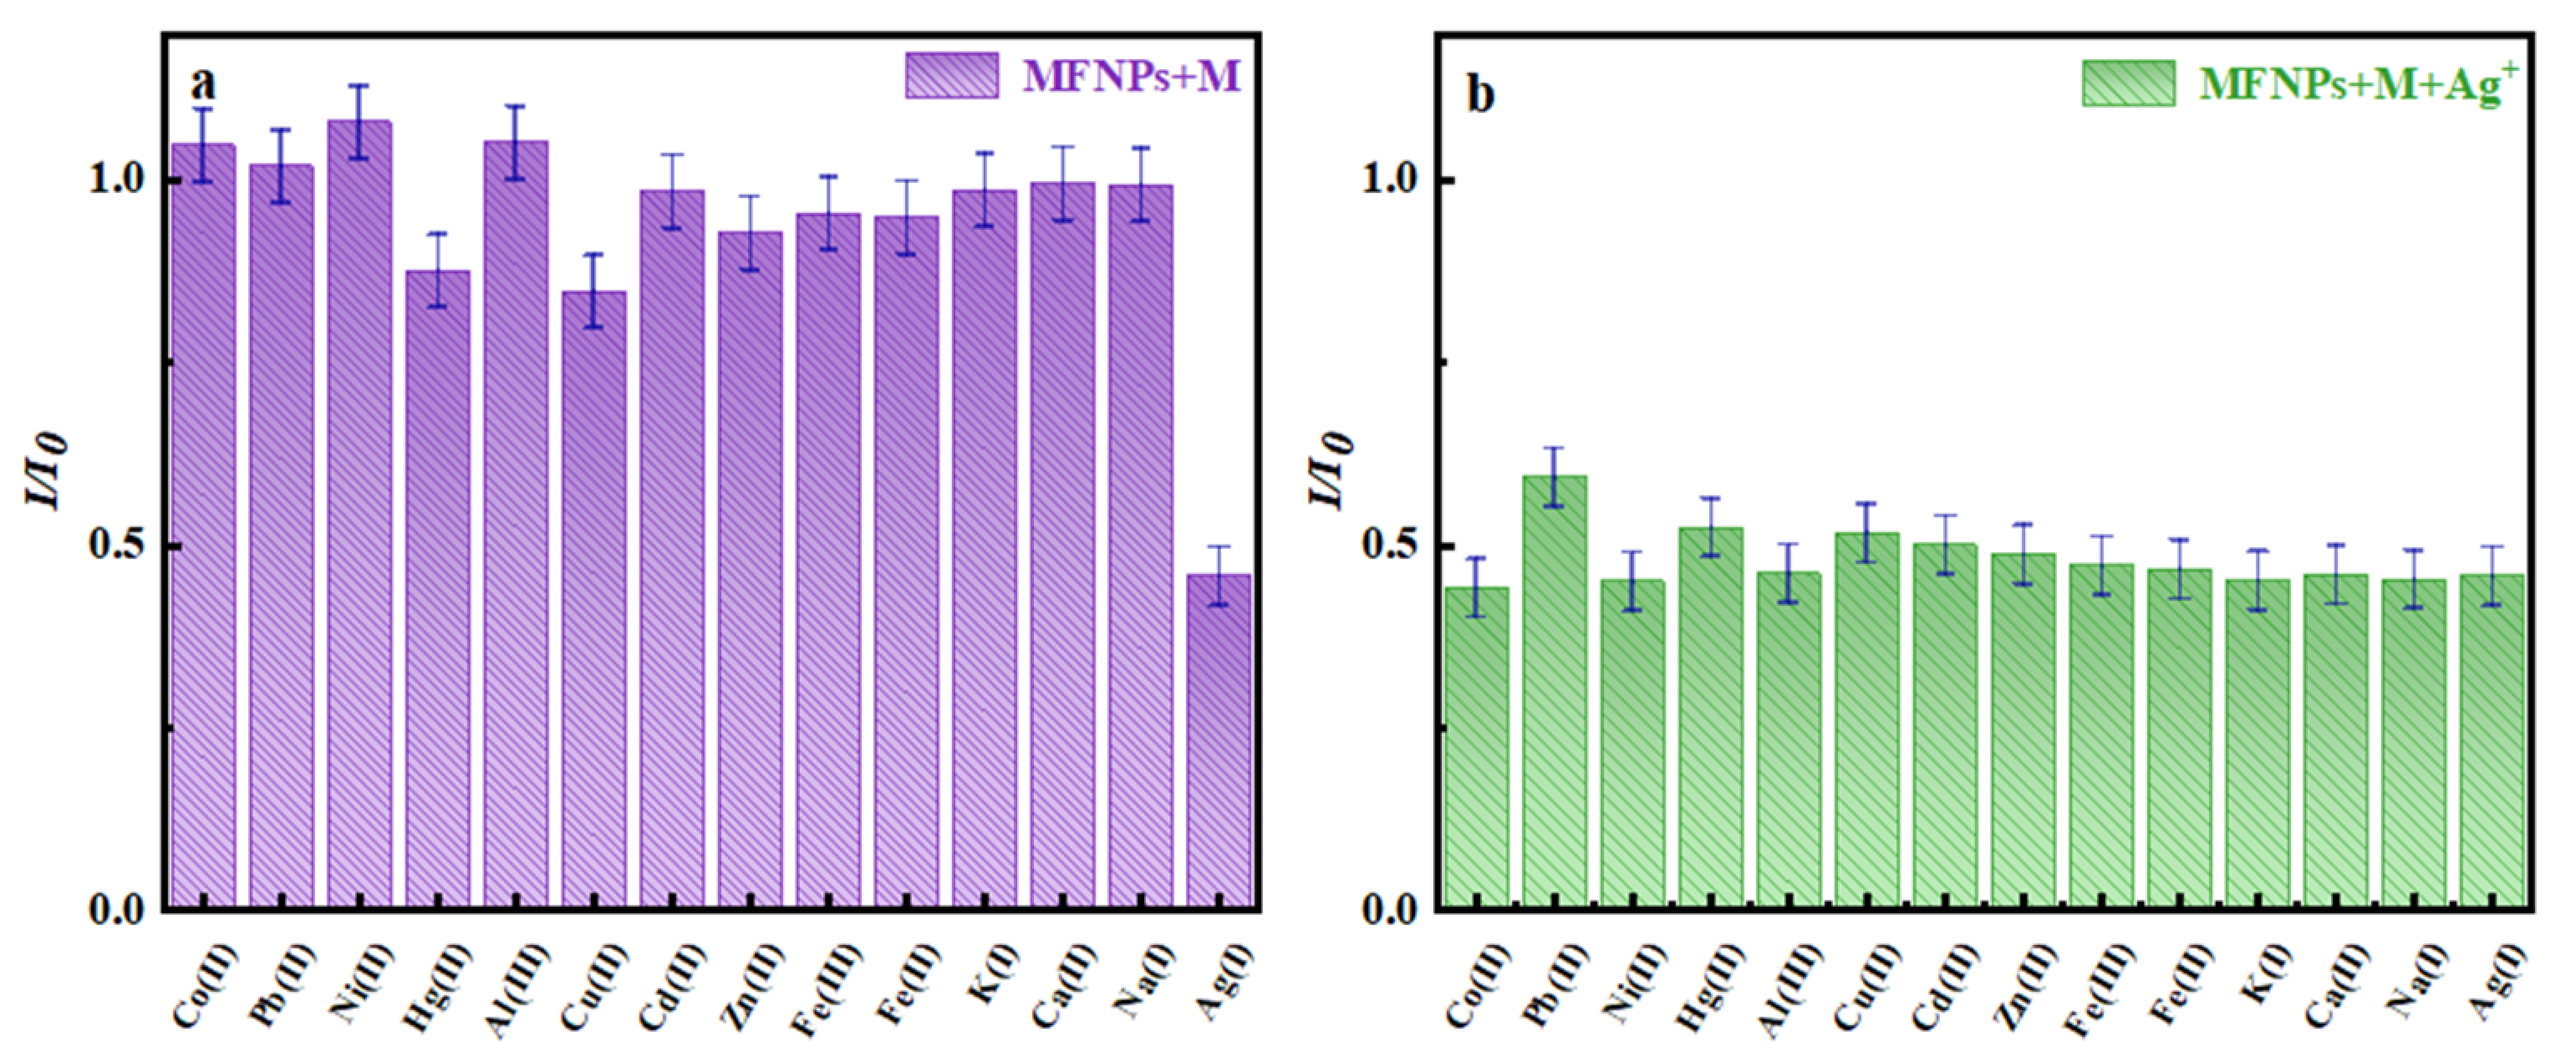
3.2.4. Particle Selectivity and Interference Ion Determination

High selectivity is a necessary condition for the sensor. Therefore, under the same conditions, the Ag+ selectivity of the prepared magnetic fluorescent sensor was investigated by detection of the reaction of the relevant analytes. The results show that the fluorescence quenching effect of Ag+ is the best. Although the other ions will experience weak quenching, this is obviously negligible compared with that of silver ions (Figure 10a). To further investigate the ability of the magnetic fluorescent sensor to recognize silver ions in the presence of other metal ions, the anti-interference ability of the sensor was also investigated. When an equal amount of silver ions was added to an equal amount of other metal ions (400 µM Ag+, Co2+, Ni2+, Al3+, Cu2+, Zn2+, Cd2+, Fe3+, Fe2+, K+, Ca2+, Na+, Pb2+, Hg2+), the other ions did not affect the detection of silver ions by the magnetic fluorescent sensor. The bar graph clearly proves this point (Figure 10b); it is obvious that the common metal ions in the environment do not interfere with the qualitative and quantitative detection of silver ions by the particles.

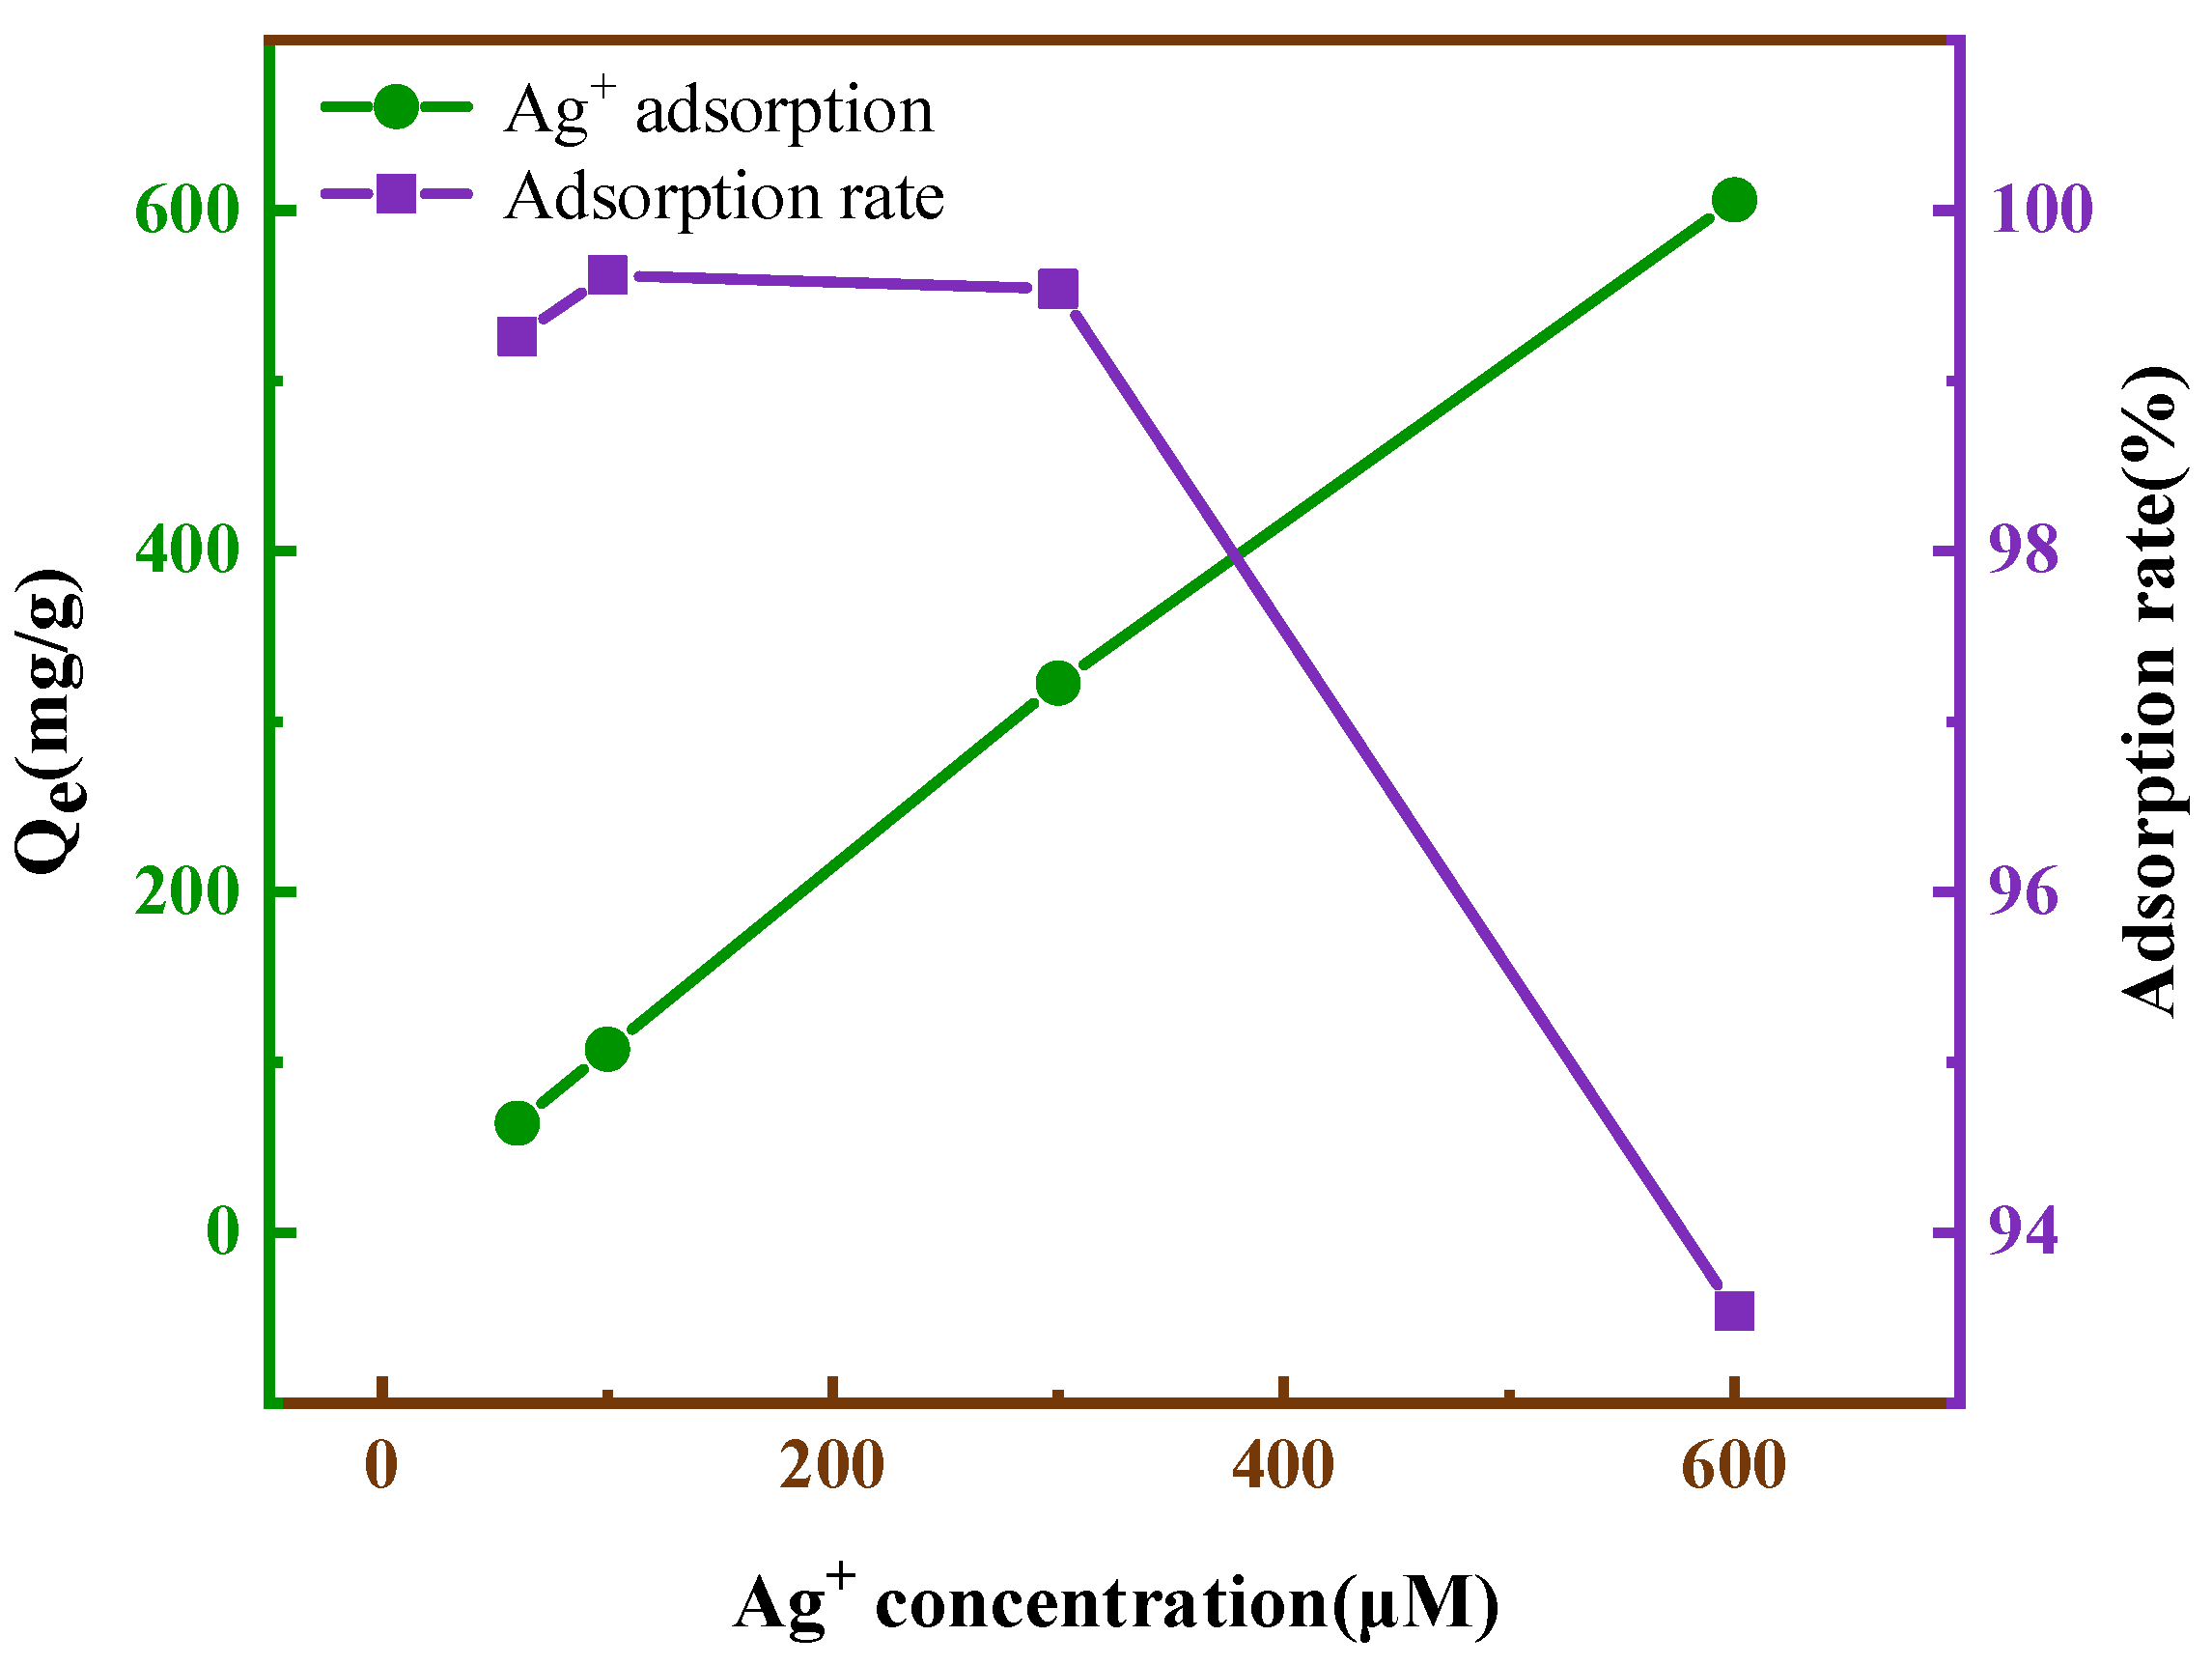
3.2.5. Removal of Ag+

Adsorption capacity is considered to be one of the most important properties of nanomaterials, so adsorption tests were performed in conical flasks (100 mL) to determine the adsorption amount of Ag+. The effect of the initial Ag+ concentration on the adsorption efficiency is shown in Figure 11. The adsorption analysis showed that with the increase in the initial Ag+ concentration, the adsorption capacity of MFNPs also gradually increased. This was due to the increase in the initial concentration, which improved the adsorption driving force and ion mass transfer rate, and the binding site on the adsorbents’ surface was gradually occupied by Ag+; thus, the adsorption capacity increased. The removal rate of Ag+ in the solution gradually decreased after 100 µM, reaching 99.62%, which is because the amount of adsorbent in the solution is finite, and the adsorption site provided for Ag+ is also finite. When the concentration of heavy metals is low, almost all Ag+ can be combined with the adsorption site to achieve a higher removal rate, and then the adsorption gradually reaches equilibrium. Therefore, the adsorption effect of the adsorbent on the free metal ions in the solution is reduced, resulting in a lower removal rate. When the Ag+ concentration changed from 300 µM to 600 µM, the removal rate decreased from 99.54% to 93.54%, and the adsorption capacity increased from 322.496 mg/g to 606.112 mg/g. In general, the optimal Ag+ concentration at the intersection point of 400 µM could be obtained. Compared with other materials, the adsorption and transfer rates of this material are relatively high (Table 2).

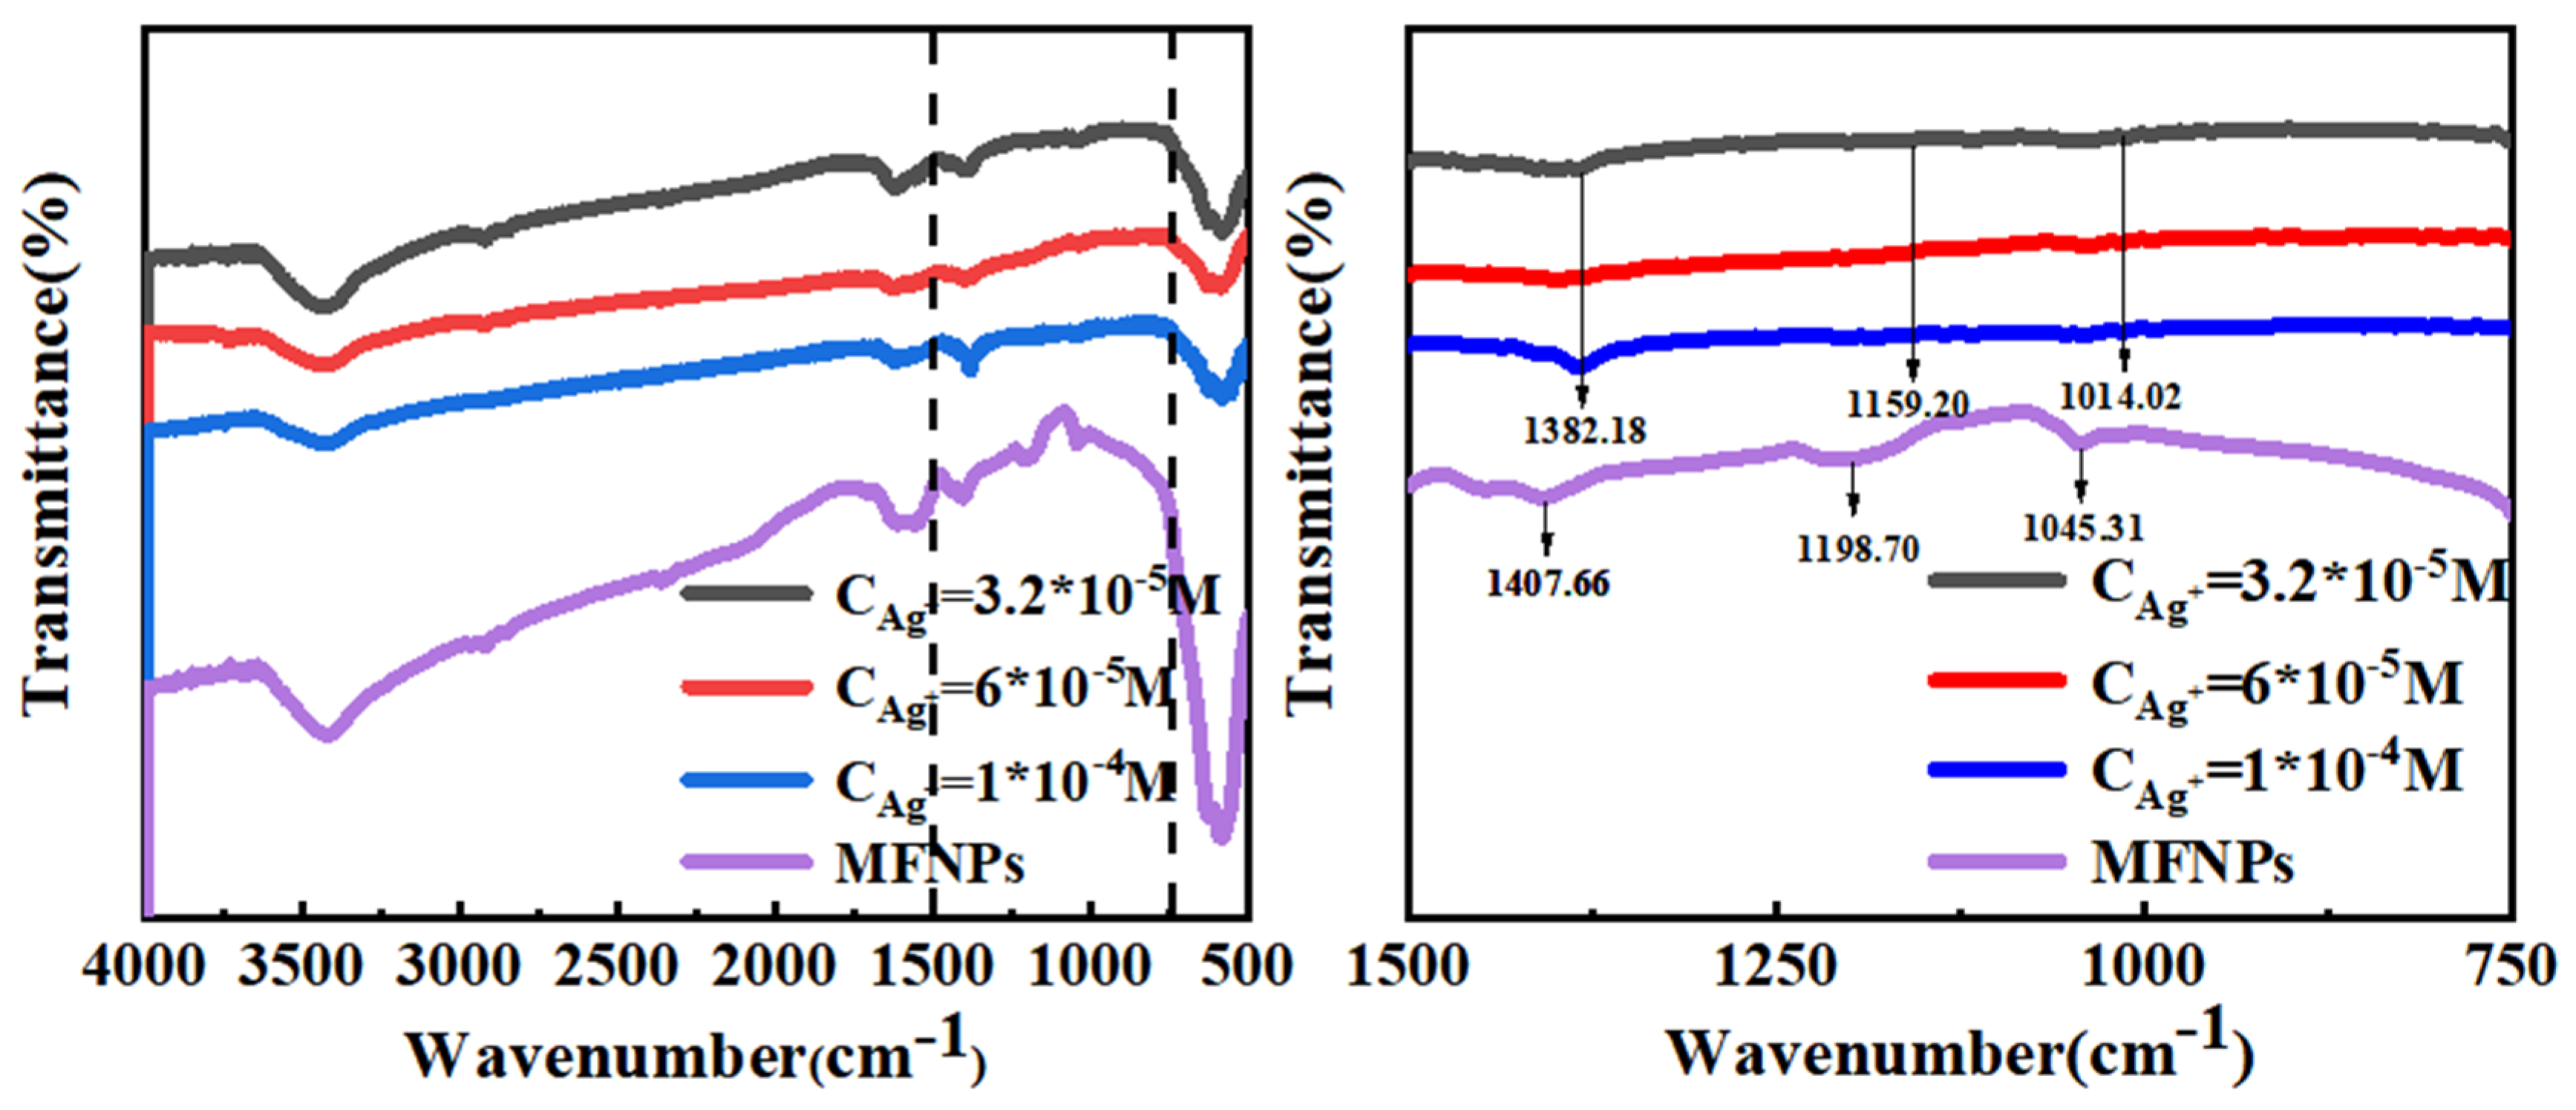
3.3. Infrared Spectroscopy Analysis before and after Complexation of MFNPs with Ag+

Infrared spectra of MFNPs before and after the addition of Ag+ were analyzed using FT-IR, and the FT-IR spectra of MFNPs and MFNPs + Ag+ complexes are shown in Figure 12. From the infrared spectra of MFNPs, the corresponding peaks of S = O telescopic vibration at 1042 cm−1 were observed.
The peak shape of the absorption peaks at 1045.31 cm−1, 1198.70 cm−1, and 1407.66 cm−1 changed, indicating that S–O, O=S=O, and C–O might play a key role in the synergistic effect with Ag+. The result can be clearly observed in Figure 8; when the Fe3O4@ZnS-MPS interacted with Ag+, the tensile peak of methoxy (S–O) was changed from 1045.31 cm−1 to 1014.02 cm−1, while the characteristic absorption peak of O=S=O moved from 1198.70 cm−1 to 1159.20 cm−1 and the characteristic absorption peak of C–O moved from 1407.66 cm−1 to 1382.18 cm−1. The reason for the change in the infrared absorption peak of the sulfonic acid group might be that the oxygen atoms in the sulfonic acid group cooperated with Ag+ to form a synergistic complexation. The oxygen atoms of the sulfonic acid group had a negative charge, indicating that the S–O and O=S=O group could adsorb Ag+ by electrostatic interaction as Ag+ laced electrons. Thus, it was speculated that the oxygen atom of the S–O and O=S=O group donated electrons to the Ag+, which led to the transfer of charge and resulted in changes in the infrared spectrum [43].

3.4. The Fluorescent Detection of Ag+ in Actual Samples

The practicability of the MFNPs for the detection of Ag+ was demonstrated by analyzing real water samples. The real samples were selected from tap water, water from Songhua River in Jilin, and electrolysis waste water. First, suspended particles were removed from these water samples using centrifugal separation. Then, the supernatant was analyzed according to the previous procedure of Ag+. Certain volumes of the supernatant and Ag+ solutions were added to 200 μL of the Fe3O4@ZnS@MPS suspension, and the final volume was tuned to 2 mL by PBS buffer solution. As shown in Table 3, Ag+ was not detected in the real water samples. The recovery of Ag+ detection was in the range of 85.20%–105.30%, with the RSD (relative standard deviation) in the range of 3.18%–5.32%. The result indicated that the MFNPs had great potential for the detection of Ag+ in real water samples.

4. Conclusions

In summary, we present the design, synthesis, and performance of a novel magnetic fluorescent nanoprobe (Fe3O4@ZnS@MPS(MFNPs)) modified with 3-sulfhydryl-1-propane sodium for simultaneous detection and removal of Ag+ from water solutions. Our proposed Fe3O4@ZnS@MPS sensor exhibits significant quenching fluorescence intensity ability and high selectivity for Ag+. It was shown that the Fe3O4@ZnS@MPS fluorescent sensor was a good adsorbent for the removal of Ag+, due to the aggregation and magnetic separation of the sensor. In addition, it could be applied over a wide pH range. The above results confirmed that this method is an inexpensive, simple, convenient, and extremely sensitive method that enables highly specific recognition for the simultaneous detection and removal of Ag+ from aqueous solutions. This study provided a new idea for the determination and removal of Ag+ and other heavy metals.

Author Contributions

Conceptualization, Y.G. and X.C.; methodology, X.Z.; software, X.C.; validation, Z.L., S.Y. and J.C.; formal analysis, P.X.; investigation, X.Z.; resources, Z.L.; data curation, X.C.; writing—original draft preparation, X.C.; writing—review and editing, X.Z.; visualization, X.Z.; supervision, X.Z.; project administration, X.Z.; funding acquisition, Z.L. All authors have read and agreed to the published version of the manuscript.

Funding

This research was funded by X.Z. grant number (20220203020SF) And The APC was funded by Jilin Provincial Department of Science and Technology. This research was funded by J.C. grant number (51902125) And The APC was funded by National Natural Science Foundation of China. This research was funded by S.Y. grant number (22106051) And The APC was funded by National Natural Science Foundation of China.

Data Availability Statement

Z.X. and G.Y. designed the work. C.X. performed the experiment and data analysis.

Acknowledgments

We gratefully acknowledge financial support from Jilin Provincial Department of Science and Technology (20220203020SF), the National Natural Science Foundation of China (51902125, 22106051).

Conflicts of Interest

The authors declare no conflict of interest.

References

  1. Singha, S.; Kim, D.; Seo, H.; Cho, S.W.; Ahn, K.H. Fluorescence sensing systems for gold and silver species. Chem. Soc. Rev. 2015, 44, 4367–4399. [Google Scholar] [CrossRef]
  2. Bahareh, R.; Hossein, R.M.; Mehdi, S.K. Colorimetric/fluorometric optical chemosensors based on oxazolidine for highly selective detection of Fe3+ and Ag+ in aqueous media: Development of ionochromic security papers. J. Mol. Struct. 2023, 1271, 134021. [Google Scholar]
  3. Pal, C.; Majumder, S. Label-free electrochemical biosensor for ultra-low level detection of Ag(I) using ssDNA functionalized multi-walled carbon nanotube. Colloids Surf. A Physicochem. Eng. Asp. 2022, 645, 128927. [Google Scholar] [CrossRef]
  4. Han, J.S.; Zhang, X.; Zhou, Y.B.; Ning, Y.; Wu, J.; Liang, S.; Sun, H.C.; Zhang, H.; Yang, B. Fabrication of CdTe nanoparticles-based superparticles for an improved detection of Cu2+ and Ag+. J. Mater. Chem. 2012, 22, 2679–2686. [Google Scholar] [CrossRef]
  5. Bian, J.; Xia, Y.X.; Sang, L.Y.; Zhu, C.X.; Li, Y.X.; Li, G.Y.; Liu, X.Y.; Wang, X.; Liu, Y. A recyclable colorimetric probe: In situ fabrication of highly stable HPEI–AuNPs for selective Ag+ detection. New J. Chem. 2020, 44, 5438–5447. [Google Scholar] [CrossRef]
  6. Gumpu, M.B.; Sethuraman, S.; Krishnan, U.M. A review on detection of heavy metal ions in water an electrochemical approach. Sens. Actuators B Chem. 2015, 213, 515–533. [Google Scholar] [CrossRef]
  7. Cai, C.; Cheng, H.Y.; Wang, Y.C.; Bao, H.F. Mercaptosuccinic acid modified CdTe quantum dots as a selective fluorescence sensor for Ag+ determination in aqueous solutions. RSC Adv. 2014, 4, 59157–59163. [Google Scholar] [CrossRef]
  8. Pandey, R.; Kumar, A.; Xu, Q.; Pandey, D.S. Zinc(II), copper(II) and cadmium(II) complexes as fluorescent chemosensors for cations. Dalton Trans. 2020, 49, 542–568. [Google Scholar] [CrossRef] [PubMed]
  9. Deng, P.Y.; Wang, W.; Liu, X.Q.; Wang, L.; Yan, Y.S. A hydrophobic polymer stabilized CsPbBr3 sensor for environmental pollutant detection. New J. Chem. 2021, 45, 930–938. [Google Scholar] [CrossRef]
  10. Wu, P.; Yan, X.P. Doped quantum dots for chemo/biosensing and bioimaging. Chem. Soc. Rev. 2013, 42, 5489–5521. [Google Scholar] [CrossRef]
  11. Stefan, M.; Leostean, C.; Pana, O.; Suciu, M.; Popa, A.; Toloman, D.; Macavei, S.; Bele, C.; Tabaran, F.; Barbu-Tudoran, L. Synthesis and characterization of Fe3O4–ZnS: Mn nanocomposites for biomedical applications. Mater. Chem. Phys. 2021, 264, 124474. [Google Scholar] [CrossRef]
  12. Arano-Martinez, J.A.; Martínez-González, C.L.; Salazar, M.L.; Torres-Torres, C. A Framework for Biosensors Assisted by Multiphoton Effects and Machine Learning. Biosensors 2022, 12, 710. [Google Scholar] [CrossRef]
  13. Wang, C.W.; Shen, W.Z.; Rong, Z.; Liu, X.X.; Gu, B.; Xiao, R.; Wang, S.Q. Layer-by-layer assembly of magnetic-core dual quantum dot-shell nanocomposites for fluorescence lateral flow detection of bacteria. Nanoscale 2020, 12, 795–807. [Google Scholar] [CrossRef]
  14. Shah, M.T.; Balouch, A.; Alveroglu, E. Sensitive Fluorescence Detection of Ni2+ ions Using Fluorescein Functionalized Fe3O4 Nanoparticles. J. Mater. Chem. C 2018, 6, 1105–1115. [Google Scholar] [CrossRef]
  15. Chen, M.; Shao, L.L.; Li, J.J.; Pei, W.J.; Chen, M.K.; Xie, X.H. One-step hydrothermal synthesis of hydrophilic Fe3O4/carbon composites and their application in removing toxic chemicals. RSC Adv. 2016, 6, 35228–35238. [Google Scholar] [CrossRef]
  16. Dulyasucharit, R.; Wongkasemjit, S.; Nanan, S.; Intharaksa, O.; Masingboon, C. Magnetic Fe3O4/Bi2O2(OH)(NO3) as a sunlight-driven photocatalyst for rhodamine B degradation. J. Solid State Chem. 2023, 319, 123784. [Google Scholar] [CrossRef]
  17. Zhu, Y.Z.; Wu, D.P.; Chen, J.H.; Ma, N.; Dai, W. Boosting highly capture of trace tetracycline with a novel water-resistant and magnetic (ZIF-8)-on-(Cu-BTC@Fe3O4) composite. J. Solid State Chem. 2023, 319, 123797. [Google Scholar] [CrossRef]
  18. Gao, F.; Gu, H.; Wang, H.; Wang, X.; Xiang, B. Magnetic amine-functionalized polyacrylic acid-nanomagnetite for hexavalent chromium removal from polluted water. RSC Adv. 2015, 5, 60208–60219. [Google Scholar] [CrossRef]
  19. Duan, M.; Xia, F.F.; Li, T.L.; Shapter, J.G.; Yang, S.; Li, Y.Y.; Gao, G.; Cui, D.X. Matrix metalloproteinase-2-targeted superparamagnetic Fe3O4-PEG-G5-MMP2@Ce6 nanoprobes for dual-mode imaging and photodynamic therapy. Nanoscale 2019, 11, 18426. [Google Scholar] [CrossRef]
  20. Li, G.Y.; Jiang, Y.R.; Huang, K.L.; Ding, P.D.; Chen, J. Preparation and properties of magnetic Fe3O4-chitosan nanoparticles. J. Alloys Compd. 2008, 466, 451–456. [Google Scholar] [CrossRef]
  21. Liu, M.; Tao, Z.; Wang, H.; Zhao, F.; Sun, Q. Study on the adsorption of Hg(II) by one-pot synthesis of amino-functionalized graphene oxide decorated with Fe3O4 microspheres nanocomposite. RSC Adv. 2016, 6, 84573–84586. [Google Scholar] [CrossRef]
  22. Chen, X.; Chen, J.; Ma, M.S.; Yu, S.H.; Liu, Z.G.; Zeng, X.D. An Ethyl-Thioglycolate-Functionalized Fe3O4@ZnS Magnetic Fluorescent Nanoprobe for the Detection of Ag+ and Its Applications in Real Water Solutions. Nanomaterials 2023, 13, 1992. [Google Scholar] [CrossRef] [PubMed]
  23. Dafeh, S.R.; Iranmanesh, P.; Salarizadeh, P. Fabrication, optimization, and characterization of ultra-small superparamagnetic Fe3O4 and biocompatible Fe3O4@ZnS core/shell magnetic nanoparticles: Ready for biomedicine applications. Mater. Sci. Eng. C 2019, 98, 205–212. [Google Scholar] [CrossRef] [PubMed]
  24. Khawla, M.; Zouhour, H.; Yves, C.; Souhaira, H.; Rym, M. ZnS quantum dots as fluorescence sensor for quantitative detection of tetracycline. Opt. Mater. 2022, 125, 112103. [Google Scholar] [CrossRef]
  25. Nawaz, T.; Zulfiqar, S.; Sarwar, M.I.; Iqbal, M. Synthesis of diglycolic acid functionalized core-shell silica coated Fe3O4 nanomaterials for magnetic extraction of pb(II) and cr(VI) ions. Sci. Rep. 2020, 10, 10076. [Google Scholar] [CrossRef]
  26. Stefan, M.; Leostean, C.; Pana, O.; Soran, M.; Suciu, R.; Gautron, E.; Chauvet, O.; Stefan, M. Synthesis and characterization of Fe3O4@ZnS and Fe3O4@Au@ZnS core–shell nanoparticles. Appl. Surf. Sci. 2014, 288, 180–192. [Google Scholar] [CrossRef]
  27. Zavidovskiy, I.A.; Streletskiy, O.A.; Nuriahmetov, I.F.; Nishchak, O.U.; Savchenko, N.F.; Tatarintsev, A.A.; Pavlikov, A.V. Highly Selective Polyene-Polyyne Resistive Gas Sensors: Response Tuning by Low-Energy Ion Irradiation. J. Compos. Sci. 2023, 7, 156. [Google Scholar] [CrossRef]
  28. Mondal, D.K.; Phukan, G.; Paul, N.; Borah, J.P. Improved self heating and optical properties of bifunctional Fe3O4/ZnS nanocomposites for magnetic hyperthermia application. J. Magn. Magn. Mater. 2021, 528, 167809. [Google Scholar] [CrossRef]
  29. Koc, K.; Karakus, B.; Rajar, K.; Alveroglu, E. Synthesis and Characterization of ZnS@Fe3O4 Fluorescent-Magnetic Bifunctional Nanospheres. Superlattices Microstruct. 2017, 110, 198–204. [Google Scholar] [CrossRef]
  30. Wen, A.; Li, G.L.; Wu, D.; Yu, Y.X.; Yang, Y.; Hu, N.; Wang, H.L.; Chen, J.; Wu, Y.N. Sulphonate functionalized covalent organic framework-based magnetic sorbent for effective solid phase extraction and determination of fluoroquinolones. J. Chromatogr. A 2020, 1612, 460651. [Google Scholar] [CrossRef]
  31. Liu, Q.; Yang, D.L.; Shi, Y.L.; Pan, Q.Q.; Wang, T. Shape-selective separation of copper nanowires and copper-based nanoparticles by a ligand exchange strategy. Appl. Surf. Sci. 2023, 611, 155597. [Google Scholar] [CrossRef]
  32. Masoud, H.Z.; Arjomand, M.Z. Photocatalytic activity of ZrO2/TiO2/Fe3O4 ternary nanocomposite for the degradation of naproxen: Characterization and optimization using response surface methodology. Sci. Rep. 2022, 12, 10388. [Google Scholar]
  33. Zangmeister, R.A.; Morris, T.A.; Tarlov, M.J. Characterization of Polydopamine Thin Films Deposited at Short Times by Autoxidation of Dopamine. Langmuir. 2013, 29, 8619–8628. [Google Scholar] [CrossRef]
  34. Chang, C.J.; Tsai, W.C. CuS-ZnS decorated Fe3O4 nanoparticles as magnetically separable composite photocatalysts with excellent hydrogen production activity. Int. J. Hydrog. Energy 2019, 44, 20872–20880. [Google Scholar] [CrossRef]
  35. Sun, N.N.; Yan, B. A reliable amplified fluorescence-enhanced chemosensor (Eu-MIL-61) for the directional detection of Ag+ in an aqueous solution. Dalton Trans. 2017, 46, 875–881. [Google Scholar] [CrossRef]
  36. Li, J.R.; Huang, H.; Zhang, C.; Chen, X.L.; Hu, Y.J.; Huang, X.H. Dual-key-and-lock AIE probe for thiosulfate and Ag+ detection in mitochondria. Talanta 2023, 255, 124222. [Google Scholar] [CrossRef] [PubMed]
  37. Zhu, J.T.; Shen, M.X.; Shen, J.W.; Wang, C.Z.; Wei, Y.M. Nitrogen and bromine co-doped carbon dots with red fluorescence for sensing of Ag+ and visual monitoring of glutathione in cells. Spectrochim. Acta A Mol. Biomol. Spectrosc 2023, 296, 122642. [Google Scholar] [CrossRef]
  38. Wang, Z.H.; Zhang, L.; Hao, Y.M.; Dong, W.J.; Liu, Y.; Song, S.M.; Shuang, S.M.; Dong, C.; Gong, X.J. Ratiometric fluorescent sensors for sequential on-off-on determination of riboflavin, Agt and L-cysteine based on NPCl-doped carbon quantum dots. Anal. Chim. Acta 2021, 1144, 1–13. [Google Scholar] [CrossRef]
  39. Luo, L.X.; Ye, Y.; Wang, H.; Liu, Z.; Li, J.Q. Rapid Detection of Ag+ in Food Using Cholesteric Chiral Artificial Receptor L5. Microchem. J. 2023, 190, 108633. [Google Scholar]
  40. Wang, B.X.; Wu, K.Y.; Liu, T.H.; Cheng, Z.K.; Liu, Y.; Liu, Y.F.; Niu, Y.Z. Feasible synthesis of bifunctional polysilsesquioxane microspheres for robust adsorption of Hg(II) and Ag(I): Behavior and mechanism. J. Hazard. Mater. 2023, 442, 130121. [Google Scholar] [CrossRef]
  41. Liu, X.Q.; Zhang, Y.Y.; Liu, Y.; Zhang, T.A. Removal of Cr(VI) and Ag(I) by grafted magnetic zeolite/chitosan for water purification: Synthesis and adsorption mechanism. Int. J. Biol. Macromol. 2022, 222, 2615–2627. [Google Scholar] [CrossRef] [PubMed]
  42. Zhang, S.J.; Lin, J.; Chen, S.L.; Xie, H.D.; Qi, Y.B. Selective recovery of Ag(I) from effluent using 2,5-dimercap-to-1,3,4-thiadiazole modified apple pomace. Sustain. Chem. Pharm. 2022, 26, 100621. [Google Scholar] [CrossRef]
  43. Ding, X.; Yu, W.J.; Sheng, X.; Shi, H.; You, D.; Peng, M.M.; Shao, P.H.; Yang, L.M.; Liu, L.M.; Luo, X.B. Feasible fabrication of o -phenanthroline-based polymer adsorbent for selective capture of aqueous Ag(I). Chin. Chem. Lett. 2023, 34, 107485. [Google Scholar] [CrossRef]
Scheme 1. Fabrication of MFNPs.
Coatings 13 01557 sch001
Figure 1. SEM and TEM images of Fe3O4 (a,c), Fe3O4@ZnS@MPS (b,d).
Coatings 13 01557 g001
Figure 2. XRD patterns of (a) Fe3O4, (b) Fe3O4@ZnS, and (c) Fe3O4@ZnS@MPS nanocomposites.
Coatings 13 01557 g002
Figure 3. FT−IR spectra of commercial Fe3O4, Fe3O4@ZnS, Fe3O4@ZnS@MPS, and MPS.
Coatings 13 01557 g003
Figure 4. XPS analysis of Fe3O4@ZnS@MPS (a), high-resolution XPS spectra of Fe 2p (b), Zn 2p (c), S 2p (d) of Fe3O4@ZnS@MPS.
Coatings 13 01557 g004
Figure 5. VSM measurements of Fe3O4 and Fe3O4@ZnS@MPS. Inset: The response of Fe3O4@ZnS@MPS to external magnetic field.
Coatings 13 01557 g005
Figure 6. TGA curves of Fe3O4, Fe3O4@ZnS, and Fe3O4@ZnS@MPS.
Coatings 13 01557 g006
Figure 7. Comparison of fluorescence spectra of MFNPs before and after Ag+ addition. Inset: TEM images of MFNPs before and after Ag+ addition.
Coatings 13 01557 g007
Figure 8. Fluorescence intensity of MFNPs at 425 nm in the absence and presence of Ag+ at different pH.
Coatings 13 01557 g008
Figure 9. Emission spectra of MFNPs in the presence of increasing amounts of Ag+ at room temperature. Inset: The curve of fluorescence intensity at 425 nm; the concentrations of Ag+ are 0, 4, 8, 12, 20, 32, 40, 60, 80, 100 μM, respectively.
Coatings 13 01557 g009
Figure 10. (a) Bar graph represents the ratio of fluorescence quenching of MFNPs in the presence of different metal ions (1, Co2+; 2, Pb2+; 3, Ni2+; 4, Hg2+; 5, Al3+; 6, Cu2+; 7, Zn2+; 8, Cd2+; 9, Fe3+; 10, Fe2+; 11, K+; 12, Ca2+; 13, Na+; 14, Ag+); (b) bar graph represents the ratio of fluorescence quenching of MFNPs upon the addition of Ag+ (400 µM) to the solution containing other metal ions (400 µM, 1, Co2+; 2, Pb2+; 3, Ni2+; 4, Hg2+; 5, Al3+; 6, Cu2+; 7, Zn2+; 8, Cd2+; 9, Fe3+; 10, Fe2+; 11, K+; 12, Ca2+; 13, Na+;14, Blank).
Coatings 13 01557 g010
Figure 11. Effect of the initial concentration of Ag+ on the adsorption capacity and removal efficiency of magnetic fluorescent nanoparticles.
Coatings 13 01557 g011
Figure 12. Infrared absorption spectra of MFNPs and inclusion complex MFNPs + Ag+.
Coatings 13 01557 g012
Table 1. Comparison of the present nanoprobe with other reported sensors for Ag+ detection.
Type of SensorDetection RangeLODReference
Eu-MIL-61(Ga(OH)(btec)·0.5H2O)0–1000 μM0.23 μMDalton Transactions, 46 (2017)875 [35]
Triphenylamine–thiophene-pyridinium5.0–9.0 μM3.6 μMTalanta, 255(2023)124222 [36]
Nitrogen and bromine co-doped carbon dots0–6.0 μM0.14 μMSpectrochimica Acta Part A: Molecular and Biomolecular Spectroscopy, 296(2023)122642 [37]
NPCl-doped
carbon quantum dots
15.89–27.66 μM26.38 μMAnalytica Chimica Acta, 1144 (2021) 1–13 [38]
Cholesteric chiral artificial receptor L52–20 μM0.13 μMMicrochemical Journal, 190(2023)108633 [39]
Fe3O4@ZnS@MPS0–100 μM7.04 μMThis work
Table 2. The adsorption capacity of reported adsorbents for Ag+.
Type of SensorAdsorption Capacity (mg/g)Reference
Bifunctional polysilsesquioxane microspheres416.88Journal of Hazardous Materials 442(2023) 130,121 [40]
ZMC-MAH-TEPA (grafted magnetic zeolite/chitosan)70.12International Journal of Biological Macromolecules 222 (2022) 2615–2627 [41]
DMTD-AP(2,5-dimercap-to-1,3,4-thiadiazole modified apple pomace)196.9Sustainable Chemistry and Pharmacy 26 (2022) 100,621 [42]
L-PRL(o -phenanthroline-based polymer)325.8Chinese Chemical Letters 34 (2023) 107,485 [43]
MFNPs395.79This work
Table 3. The performance of the MFNPs in real water samples.
SampleAdded (μM)Measured (μM)Recovery (%)RSD (%)
Tap water10.92692.603.18
5.04.85997.184.25
10.010.321103.213.86
River water11.053105.304.34
5.04.98799.743.89
10.09.84298.424.45
Electrolysis waste water10.85285.205.32
5.04.32086.404.96
10.08.62086.204.85
Disclaimer/Publisher’s Note: The statements, opinions and data contained in all publications are solely those of the individual author(s) and contributor(s) and not of MDPI and/or the editor(s). MDPI and/or the editor(s) disclaim responsibility for any injury to people or property resulting from any ideas, methods, instructions or products referred to in the content.

