Article

Study on the Relationship between Process Parameters and theFormation of GTAW Additive Manufacturing of TC4 Titanium Alloy Using the Response Surface Method

1
Institute of Modern Agricultural Equipment, Xihua University, Chengdu 610039, China
2
College of Mechanical and Electrical Engineering, Northeast Forestry University, Harbin 150040, China
3
School of Food and Bioengineering, Xihua University, Chengdu 610039, China
*
Author to whom correspondence should be addressed.
Coatings 2023, 13(9), 1578; https://doi.org/10.3390/coatings13091578
Submission received: 16 August 2023 / Revised: 6 September 2023 / Accepted: 8 September 2023 / Published: 10 September 2023
(This article belongs to the Special Issue Laser Surface Treatments and Additive Manufacturing)

Abstract

:
The geometric parameters of the deposited layer include the width, height, and penetration depth of the deposited layer. The welding current, wire feeding speed, and torch travel speed during the additive manufacturing process of TC4 titanium alloy have the greatest impact on the geometric parameters of the deposited layer. In order to study how the deposition layer width, deposition layer height, and penetration depth are affected by the welding current, wire feeding speed, and torch travel speed, this article uses Design Expert 8.0.6 software for Box−Behnken design response surface experiments. During the experimental design, the welding current, wire feeding speed, and torch travel speed are used as input variables. The deposition layer width, deposition layer height, and penetration depth are selected as the responses. We designed 17 response surface experiments that were conducted using GTAW-AM. The results show that as the welding current increases, the penetration depth and width of deposition layer gradually increase, and the deposition layer height gradually decreases. As the wire feeding speed increases, the deposition layer height and penetration depth gradually increase, and the wire feeding speed has a minimal effect on the deposition layer width. As the torch travel speed increases, the penetration depth, width and height of deposition layer gradually decrease. The response surface method experimental design can also optimize the matching of three process parameters: welding current, wire feeding speed, and torch travel speed, thereby obtaining the optimal matching range of process parameters. Within the optimized matching range of process parameters, a welding current of 90 A, a wire feeding speed of 900 mm/min, and a torch travel speed of 200.18 mm/min were selected to prepare TC4 titanium alloy thin-walled part. The microstructure of the top, middle and bottom are all basketweave structure. The α phase gradually becomes coarse from the top to the bottom. The microhardness of the top, middle, and bottom of the thin-walled parts is 362.7 HV, 352.7 HV, and 340.5 HV, respectively. The horizontal tensile strength is 926.1 MPa, with an elongation of 12.22%, and the vertical tensile strength is 938.1 MPa, with an elongation of 14.41%.

1. Introduction

TC4 titanium alloy belongs to α + β category of dual-phase titanium alloy, with excellent properties such as a high strength, low density, and good corrosion resistance. It is the most commonly used titanium alloy in the aerospace field [1,2]. Gas tungsten arc welding (GTAW) achieves additive manufacturing (AM) by adding a wire feeder. It has the advantages of a stable arc, high forming quality, no splashing, less pollution, and low cost [3,4]. The process parameters of GTAW-AM include the welding current, wire feeding speed, torch travel speed, wire feeding angle, tungsten electrode height, and flow rate of protective gas [5,6,7]. The process parameters have a significant influence on the macro shape of the thin-walled part. If the process parameters are not matched, the deposited metal will be discontinuous; this will affect the subsequent deposition work. The process parameters will also affect the width and height of the deposition layer and further affect the internal structure and mechanical properties of the thin-walled parts. The synergistic effect between the welding current, wire feeding speed, and torch travel speed has the biggest impact on the bead width, depth-to-width ratio, and forming appearance of the deposition layer. Thus, it is necessary to study the influence of the process parameters on the deposition layer width, deposition layer height, and penetration depth. The traditional orthogonal design method is a design method that uses linear mathematical models to identify the optimal combination of multiple factor levels. However, orthogonal design can only analyze discrete data, which has the drawbacks of a low accuracy and poor predictability. The response surface method adopts a nonlinear model, which can obtain high-precision regression equations and make reasonable predictions to find the optimal process conditions. Many scholars have used the response surface method (RSM) to study the relationship between process parameters and deposition layer width, deposition layer height, and penetration depth, and have obtained good results.
Geng et al. [8] designed a regression model considering the coupling effect of the main process parameters. The response surface method was used to predict the width and height of the single weld bead in the GTAW wire arc additive manufacturing process. The results showed that the maximum error of the weld bead width and height was 7.1% and 4.5%, respectively, which was relatively small, indicating that the prediction was very reliable. Vidyarthy et al. [9] studied the relationship between the welding current (I), welding speed (S), and flux coating density (F) on the weld bead width (BW), depth of penetration (DOP), weld fusion zone area (WA), and depth-to-width ratio (D/W) using the response surface method during A-TIG welding of the ferritic stainless steel. Sarathchandra et al. [10] used RSM to investigate the effect of the process parameters on the geometric dimension of a single weld bead made of the 304 stainless steel cold metal transfer process. It was found that the RSM regression model could predict the relevance between the process parameters and weld bead geometry. Jia et al. [11] optimized the ultra-high frequency pulsed (UHFP) GTAW using the response surface method. A GH4169 superalloy thin-walled part was deposited using the optimized process parameters. Liang et al. [12] designed the test scheme of GTAW cladding of Inconel 625 nickel base alloy using the response surface method, and obtained the relationship between the three welding parameters—welding speed, wire feeding speed, and welding current—and the two response values—deposition layer thickness and dilution rate. Vairamani et al. [13] established a mathematical model between the maximum tensile strength, minimum interface hardness, and parameters of friction welded dissimilar joints of AlSi 304 austenitic stainless steel and copper alloy using RSM. The accuracy when predicting the tensile strength and interfacial hardness of the friction welded dissimilar joints reached 95%. Mehrabi et al. [14] used response surface methodology to investigate the influence of laser power and scanning speed on the output parameters. The results indicate that an increase in laser power and a decrease in scanning speed increased the average width. The decrease in laser power and the increase in scanning speed reduced the standard deviation of height and width. Increasing the laser scanning speed and reducing the laser power reduced the surface roughness. As the scanning speed increased, the microhardness value significantly increased.
There are few studies on response surface methodology in TC4 titanium alloy GTAW-AM. Because RSM is scientific, the experimental design and the result analysis are intuitive, it is very suitable to optimize the GTAW-AM process of TC4 titanium alloy. In this article, RSM was used to study the process of GTAW-AM of TC4 titanium alloy. The objective of this investigation was to optimize the process parameters through response surface methodology experimental design, use the optimized process parameters for GTAW-AM of TC4 titanium alloy thin-walled parts, and study the microstructure and mechanical properties of TC4 titanium alloy thin-walled parts. The mathematical model between the three process parameters of the welding current, wire feeding speed, and torch travel speed, and the three response parameters of the deposition layer width, deposition layer height, and penetration depth was established. The regression model variance analysis of the deposition layer width, deposition layer height, and penetration depth was carried out to check the significance of the model and for an analysis of the normal probability distribution of the model residual. The relationship between welding current, wire feeding speed, torch travel speed and responses were analyzed using the perturbation diagrams of the deposition layer width, deposition layer height, and penetration depth. Finally, a TC4 titanium alloy thin-walled part was prepared by selecting a group of parameters within the range of optimized parameters, and the microstructure, microhardness and tensile mechanical properties were tested. When manufacturing thin-walled parts, in order to achieve better metallurgical bonding between the first layer of the deposition layer and the base metal, a higher dilution is preferred. A higher dilution can prevent subsequent layers from warping or peeling from the base metal. However, for the subsequent layers, the heat input can be minimized.

2. Materials and Methods

The welding machine used in the experiment was the MasterTig 335ACDC produced by KEMPPI in Finland. The GTAW welding torch was fixed on a manual cross slide. The manual cross slide facilitated Y and Z-axis coordinate movement. The stepping motor drove the ball screw slide, which, in turn, controlled the X-axis movement of the worktable. The wire feeding nozzle fed the wire at a fixed angle relative to the base plate at the front of the welding torch. In order to prevent the high-temperature oxidation of TC4 titanium alloy during deposition, a drag-type shielding gas cover was installed at the tail of the welding torch. During the deposition process, argon was introduced into the welding torch and the drag-type shielding gas cover. The schematic diagram of the experimental device is shown in Figure 1a,b, illustrating the cross-sectional geometry of the deposition layer and the measurement elements observed from the deposition layer.
A commercial TC4 titanium alloy welding wire with a diameter of 1.0 mm was used as the filler wire. A TC4 plate of size 60 mm × 10 mm × 10 mm was used as the deposition substrate. The composition of the TC4 wire and substrate is shown in Table 1. The 240# SiC metallographic sandpaper was used to remove the oxidation film on the substrate. The distance between the tungsten electrode of the welding torch and the surface of the deposition layer was 3 mm, the diameter of the tungsten electrode was 2.4 mm, and the taper angle of the tungsten electrode was 30°. The flow rate of argon gas into the welding torch was 15 L/min, and the drag type shielding gas cover was 25 L/min. The pre-ventilation was 4 s before arc starting, and the ventilation continued for 8 s after the arc was extinguished. The fan was used to accelerate the cooling of the new deposition layer to room temperature.
The Box−Behnken design experiment was carried out using Design Expert 8.0.6 software. The wire feeding speed (Vf), welding current (I), and torch travel speed (Vs) have a significant impact on the geometry of the deposition layer. The welding current (I), wire feeding speed (Vf) and torch travel speed (Vs) were used as input variables, and the working range of the process parameters was determined according to the forming quality and droplet transfer form of the single deposition layer through a large number of previous experiments, as shown in Table 2.
Based on the model of the response surface method, the designed experiments are shown in Table 3. According to Table 3, 17 groups of experiments were conducted and 17 samples of the single deposition layer were obtained. The macro picture is shown in Figure 2. The 5 mm × 10 mm metallographic specimen was extracted from the single deposition layer sample using WEDM. The cross-sectional images of the weld in Figure 3 were captured using the Olympus SZX7 stereoscopic microscope, with a magnification scale of 0.8×. Figure 3 shows the macro picture of 17 metallographic specimens from the single deposition layer. The deposition layer width (W), deposition layer height (H), and penetration depth (P) were measured and the results are shown in Table 3.
The tensile testing machine did not have an extensometer and had a strain rate of 1 mm/min at room temperature. It used a WDW-100 microcomputer-controlled electronic universal testing machine. An HVS-1000 digital microhardness tester was used to perform microhardness tests on the bottom, middle, and top areas of the sample. At room temperature, a pressure of 200 g was applied, held for 15 s, and the hardness was measured at 300 μm intervals. The average microhardness of the area was then calculated.

3. Results and Discussion

Analysis of variance (ANOVA) mainly tests the significance or not significance of the model and its Lack of Fit. According to Adeq Precision value judges the feasibility of the model. The functional relationship between the input variables and the responses can be uniformly expressed as y = f (I, Vf, Vs). If the response y is extended to the form of a second-order polynomial regression equation, as shown in Equation (1) [15], that is
y = b 0 + b i x i + b i i x i 2 + b i j x i x j
After the calculated coefficients, the functional relations between the deposition layer height (H), deposition layer width (W), and penetration depth (P), and the three input variables of the wire feeding speed (Vf), welding current (I), and torch travel speed (Vs) are shown in Equations (2)–(4), respectively. The coefficients in the equation have been reserved to two decimal places.
W = + 67.27 0.14 I 0.11 V f 0.11 V s + 3.33 × 1 0 4 I V f 4.40 × 1 0 4 I V s + 1.31 × 1 0 4 V f V s + 1.07 × 1 0 4 I 2 + 3.00 × 1 0 5 V f 2 + 6.77 × 1 0 5 V s 2
H = 7.45 + 0.02 I + 0.02 V f + 6.71 × 1 0 3 V s 7.95 × 1 0 5 I V f + 8.33 × 1 0 6 I V s 9.50 × 1 0 6 V f V s + 2.03 × 1 0 4 I 2 3.80 × 1 0 6 V f 2 3.06 × 1 0 6 V s 2
P = + 11.13 0.03 I 0.03 V f + 0.04 V s + 8.10 × 1 0 5 I V f 3.98 × 1 0 4 I V s 1.23 × 1 0 5 V f V s + 4.42 × 1 0 4 I 2 + 1.75 × 1 0 5 V f 2 + 1.02 × 1 0 5 V s 2
Table 4 indicates that the model F-value of the deposition layer width W was 6.74, indicating that this model was significant. As a result of noise, the probability of such a large “Model F-value” occurring was only 0.99%. A “Prob > F” value less than 0.0500 indicates that this model term is significant. Therefore, A and C were significant model terms. Compared with Pure Error, the Lack of Fit F-value of 0.72 means that the Lack of Fit was not significant, it means that the Lack of Fit was good. As a result of noise, there was a 58.99% chance that such a large Lack of Fit F-value would occur. The value of R-Squared was 0.8966 (greater than 0.80 can achieve a good fit of a model [16]), which was close to 1. The value of Adeq Precision of the model was 9.425; an Adeq Precision value greater than 4 is acceptable, indicating that the signal was sufficient and this model could be selected for prediction.
Table 5 indicates that the model F-value of the deposition layer height H was 22.41, indicating that this model was significant. As a result of noise, the probability of such a large “Model F-value” occurring was only 0.02%. A “Prob > F” value less than 0.0500 indicated that this model term was significant. Therefore, A, B, C, and AB were significant model terms. Compared with Pure Error, the Lack of Fit F-value of 5.26 means that the Lack of Fit was not significant; the Lack of Fit was good. As a result of noise, there was a 7.12% chance that such a large Lack of Fit F-value would occur. The value of R-Squared was 0.9665 (greater than 0.80 can achieve a good fit of a model [16]), which was close to 1. The value of Adeq Precision of the model was 16.863; an Adeq Precision value greater than 4 is acceptable, indicating that the signal was sufficient and this model could be selected for prediction.
Table 6 indicates that the model F-value of the penetration depth P was 11.38, indicating that this model was significant. As a result of noise, the probability of such a large “Model F-value” occurring was only 0.21%. A “Prob > F” value less than 0.0500 indicated that this model term was significant. Therefore, A, C, and AC were significant model terms. Compared with Pure Error, the Lack of Fit F-value of 0.49 means that the Lack of Fit was not significant; the Lack of Fit was good. As a result of noise, there was a 71.01% chance that such a large Lack of Fit F-value would occur. The value of R2 was 0.9360 (greater than 0.80 can achieve a good fit of a model [16]), which was close to 1. The value of the Adeq Precision of the model was 11.576; an Adeq Precision value greater than 4 is acceptable, indicating that the signal was sufficient and this model could be selected for prediction.
Figure 4a–c shows a normal plot of the residuals for the single deposition layer width, deposition layer height, and penetration model. The normal plots of the residuals for the three models in Figure 4a–c followed an approximately straight line, indicating that the error distribution was uniform, the regression model fit well, and there were no singular points with a large deviation. The model could accurately predict the response value.
In order to further analyze the influence of the three input variables of welding current, wire feeding speed, and torch travel speed, as well as their interaction terms on the responses, the perturbation diagrams of the width, height, and penetration depth of the deposition layer were carefully investigated, as shown in Figure 5a–c. Figure 5a indicates that the amount of perturbation for both the welding current (I) and the torch travel speed (Vs) had the greatest effect on the width of the deposition layer and showed an opposite trend. When the value of A was far from the central reference point, the width of the deposition layer gradually increased with the increase in welding current. The larger the welding current, the larger the size of the molten pool [17], which was more conducive to the lateral flow of the metal melt; so, the width of the deposition layer was increased. When the torch travel speed increased, the deposition layer width decreased gradually, because the higher the torch travel speed, the less metal was deposited per unit area [18]. As the travel speed of the welding torch increased, the interaction time between the arc and the substrate decreased, and the energy available for melting the substrate and feeding the welding wire decreased. The wire feeding speed (Vf) had a small influence on the width of the deposition layer; with the increase in the wire feeding speed, the deposition layer width decreased slightly at first and then increased slightly. Similarly, Figure 5b indicates that as the welding current and torch travel speed increased, the height of deposition layer gradually decreased. The greater the welding current, the better the fluidity of the molten pool, which was more conducive to the deposition layer width, but not conducive to the deposition layer height. As the wire feeding speed increased, the height of the deposition layer gradually increased, because the higher the wire feeding speed, the more metal deposits per unit area. The height of the deposition layer was related to the ratio of the wire feeding speed and the torch travel speed [8]. When the torch travel speed was constant, the higher the wire feeding speed, the higher the deposition layer height. Similarly, Figure 5c indicates that as the welding current and wire feeding speed increased, the penetration depth gradually increased. With the increase in torch travel speed, the penetration depth gradually decreased. This is because the larger the welding current, the more the heat input to the substrate. The larger the torch travel speed, the less the heat input to the substrate [19].
After analyzing and verifying the reliability of the model, the process parameters were optimized. In order to reduce the heat input during the construction of the deposition layer, the welding current needed to be as small as possible. However, if the welding current was too small, the deposition layer could be poorly formed and the transition form of metal droplets to the molten pool could be poor. Therefore, in the “Criteria” tab, the welding current I was set as target ≥90. In order to improve the deposition efficiency, the maximum wire feeding speed needed to be adopted, so the wire feeding speed Vf target was set as ≥900. The torch travel speed was selected within the optimized range to ensure the normal progress of the deposition work, so the torch travel speed was set to “in range”. The feasibility index distribution of the scheme under this condition is shown in Figure 6. The optimal parameters were obtained near the red area in the figure, and the feasibility value of the scheme was 1. The optimized results were as follows: the welding current was 90 A, the wire feeding speed was 900 mm/min, and the torch travel speed was 200.18 mm/min.
The optimized welding process parameters are as follows: I = 90 A, Vf = 900 mm/min, and Vs = 200.18 mm/min. A thin-walled part was formed using a reciprocating deposition path, as shown in Figure 7a. The structural characteristics of the thin-walled part can be clearly seen; the side wall was smooth and there was no obvious collapse at the start and end positions of the arc of the thin-walled part. After that, the metallographic structure analysis, microhardness, and tensile mechanical properties of the thin-walled part were tested. The metallographic structure of the top, middle, and bottom regions of the metallographic specimen was analyzed. Figure 7b indicates that the delamination of the thin-walled part was particularly obvious, and there was a light dark boundary between layers [20]; this was caused by multiple thermal cycles. However, there was no obvious delamination feature at the top, due to the lack of subsequent thermal cycles and good heat dissipation conditions at the top. There were two very obvious coarse β columnar grains, almost through the entire thin-walled part. The magnification of the OM microstructure shown in Figure 7c–e is 500×. It can be seen from Figure 7c–e that the metallographic structure displayed an obvious basketweave structure. The difference was that compared with Figure 7d,e, in Figure 7c, the α phase was smaller, because the top heat dissipation condition was good and there was no subsequent thermal cycle, which hindered α phase growth. Compared with Figure 7c, in Figure 7d, the α phase was relatively coarse, because the middle region underwent a subsequent thermal cycle. Compared with Figure 7c,d, Figure 7e displayed a courser α phase and the bottom region was composed of short columns of β grain with an equiaxed grain composition. Furthermore, more of the original β grain boundary could be seen, because the bottom region could transfer heat through the base metal [19]. Generally, during deposition, heat transfer takes place from the top layer to towards the substrate. Therefore, in the bottom layer, the grain size would generally be coarser due to continuous heat stagnation, which resembled continuous heat treatment. While the middle layer would undergo less heat stagnation, the top layer would experience faster heat dissipation. This is a possible reason the top layer had fine grains.
Microhardness tests were conducted on the top, middle, and bottom of the metallographic specimen and the distance between the microhardness test points was 300 μm; then, the average microhardness of the top, middle and bottom regions, respectively, was calculated as shown in Figure 8. The top average microhardness was 362.7 HV, the middle average microhardness was 352.7 HV, and the bottom average microhardness was 340.5 HV. This was consistent with the metallographic structure analysis in Figure 7c–e, because the structure determined the performance; the top region had a smaller α phase, and the phase resulted in the average microhardness value for the top region being the highest. The middle region displayed a relatively coarse α phase; the phase resulted in the average microhardness value of the middle region being second highest. The bottom region was coarser α phase; the phase resulted in the average microhardness value of the bottom region being the lowest. The top region had fine α phase and due to the classical Hall Petch phenomenon [21], and it exhibited a higher microhardness than the middle and bottom regions.
Finally, the tensile mechanical properties of the thin-walled parts were tested, and a tensile specimen was taken in the vertical direction and the horizontal direction of the thin-walled part, as shown in Figure 9a. Figure 9b indicates the dimensions of the tensile specimen. The tensile strength value in the vertical direction was 938.1 MPa, the elongation was 14.41%, the tensile strength value in the horizontal direction was 926.1 MPa, and the elongation was 12.22%. The thin-walled parts displayed obvious anisotropy. The stress−strain curve is shown in Figure 9c. Figure 9c indicates that the curve of the vertical specimens during the plastic deformation stage was relatively stable. However, the plastic deformation stage of the horizontal specimen showed a rapid decreasing trend [22]. According to the Chinese standard for titanium and titanium alloy plate, GB/T 3621-2007 [23], and the American aerospace titanium alloy standard, AMS-4928 [24], the static mechanical properties of the TC4 titanium alloy at room temperature met the tensile strength of 896 MPa. By comparing the experimental data with the standards of China and the United States, it can be determined that the mechanical properties of TC4 titanium alloy GTAW-WAAM thin-walled parts comply with the use standards of China and the United States.

4. Conclusions

In this paper, the response surface method was used to design the experimental scheme of TC4 titanium alloy GTAW additive manufacturing. Through an analysis of the experimental data, the following conclusions were drawn:
(1)
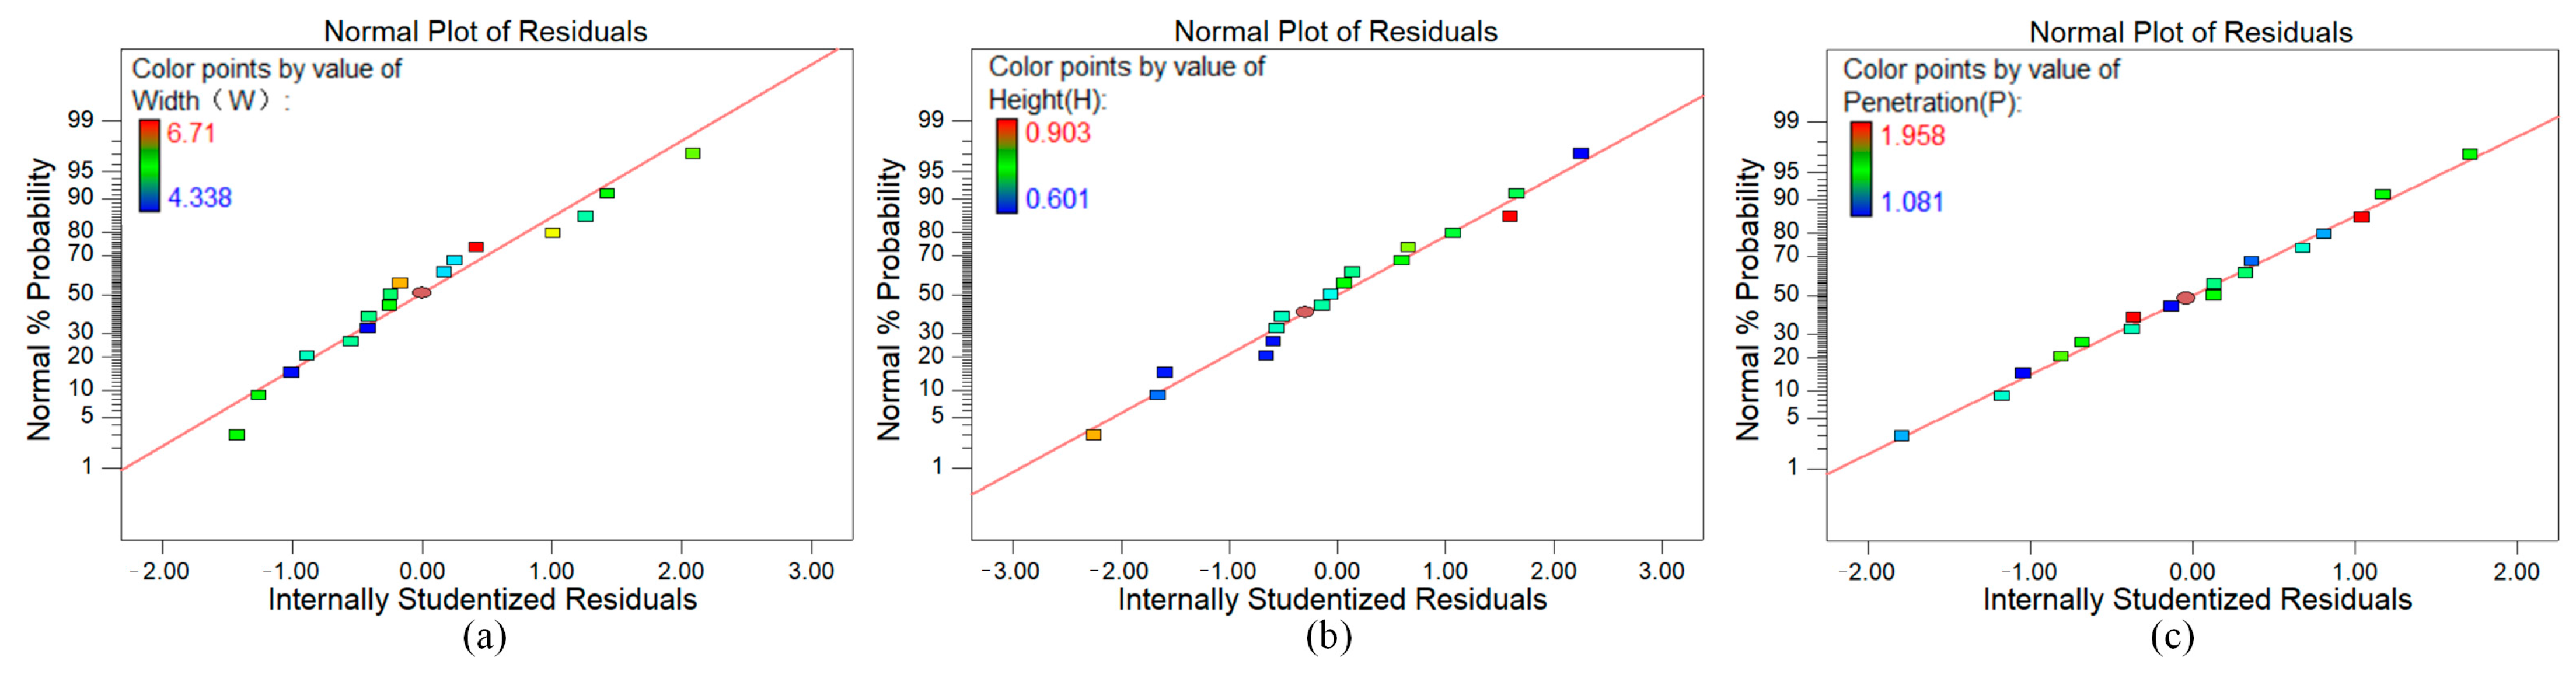
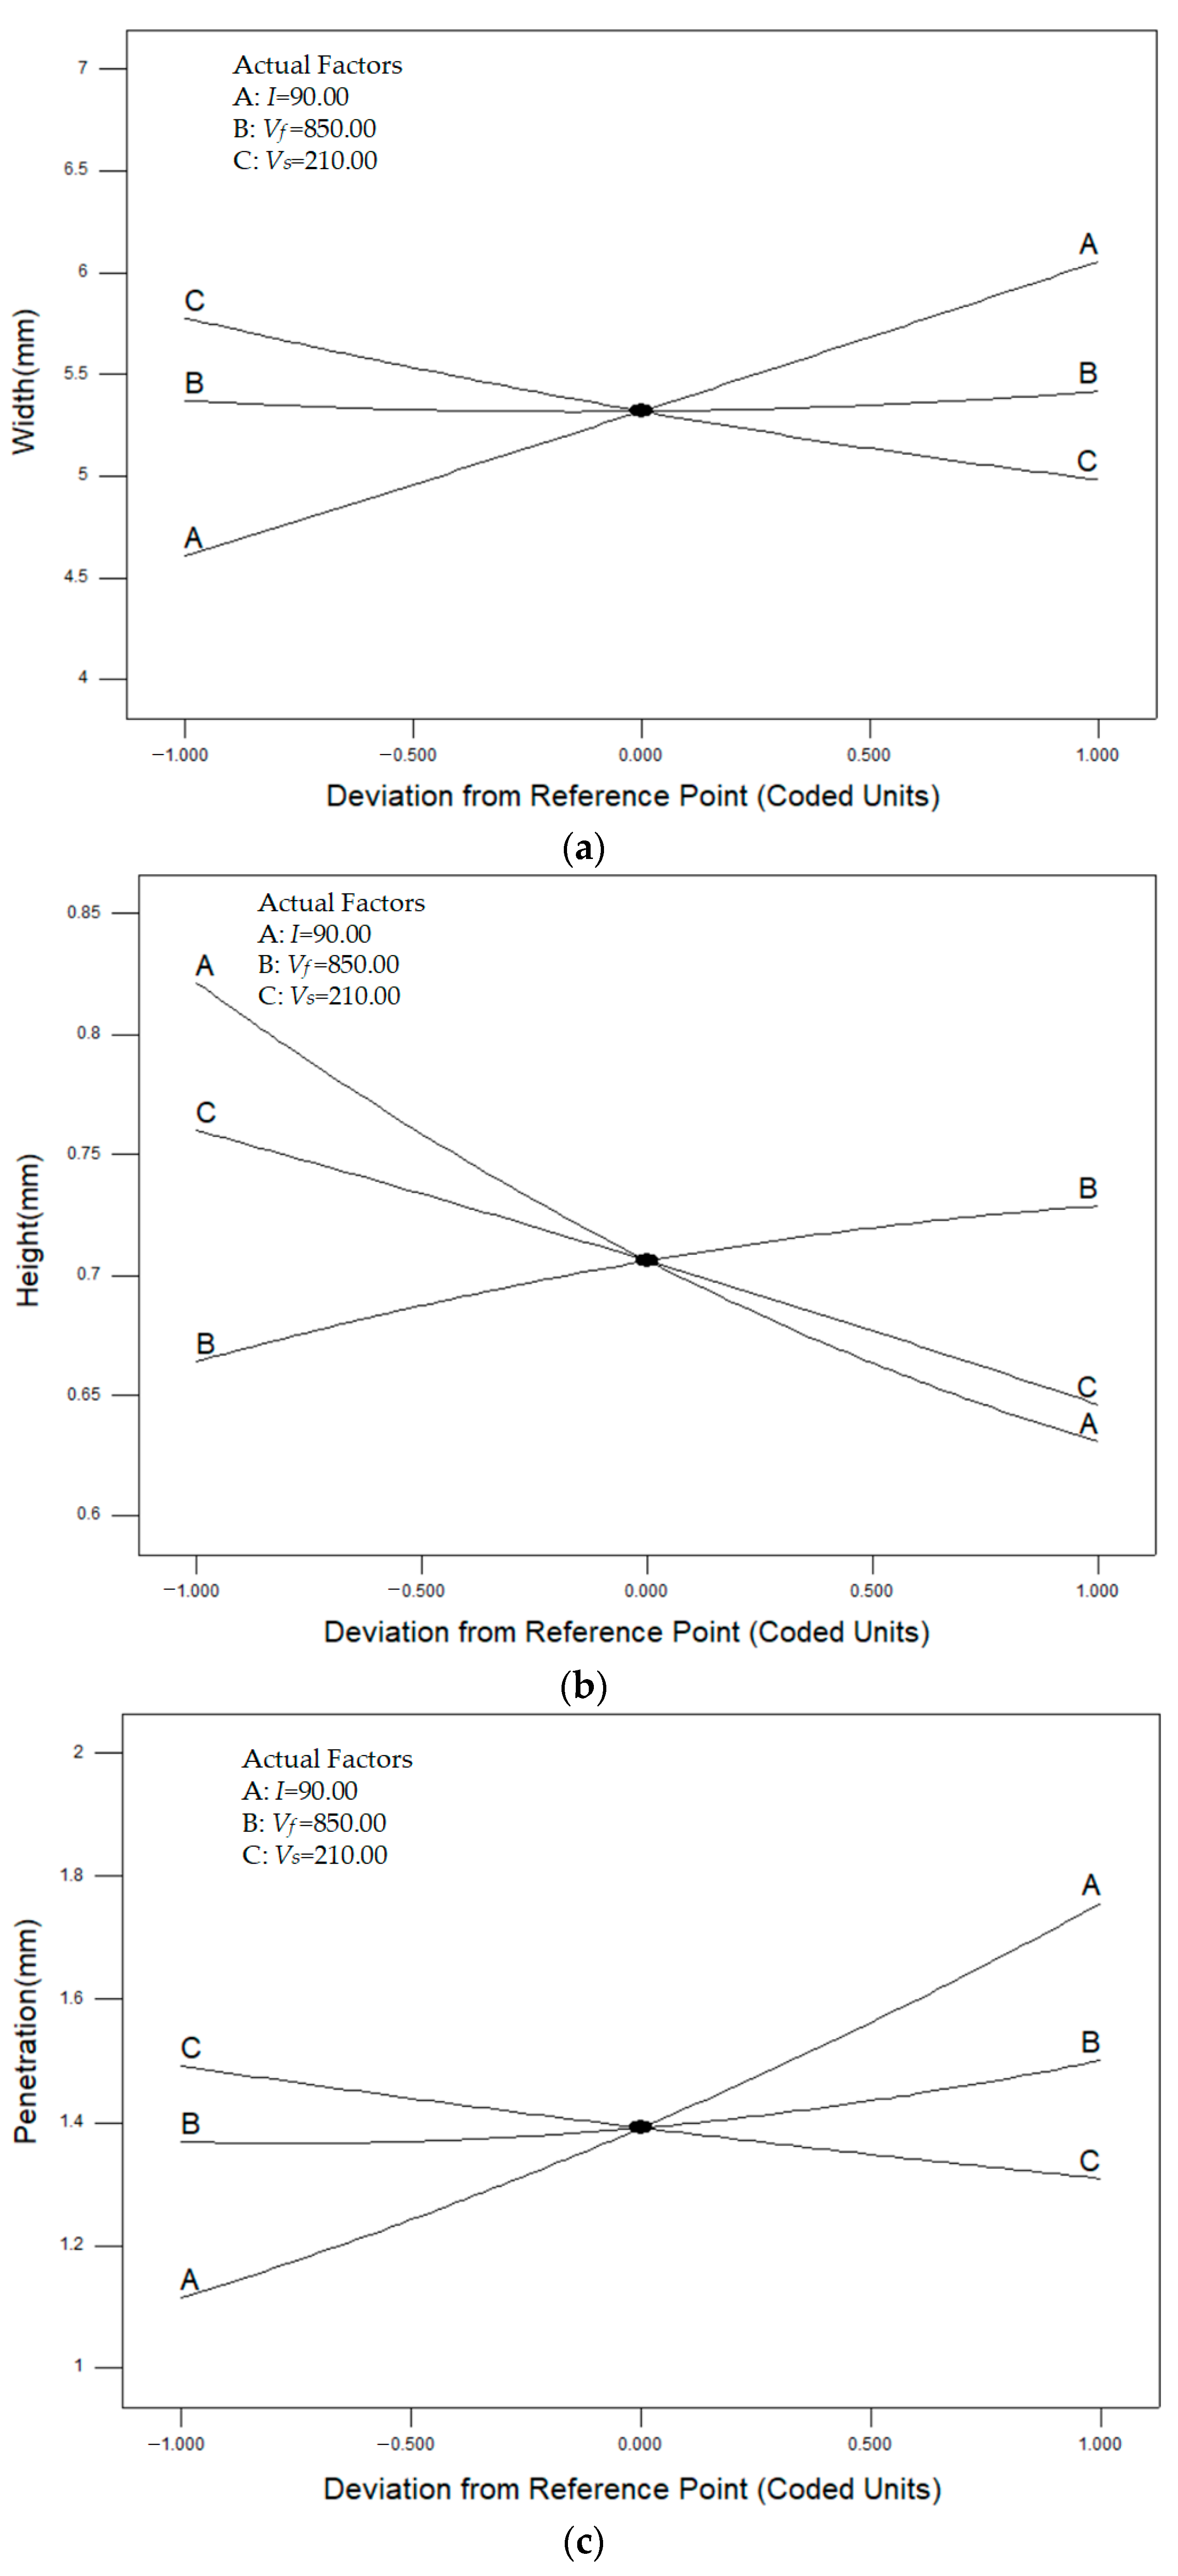
The ANOVA of the three regression models regarding the width, height, and penetration depth of the deposition layer showed that the three models were significant and could be predicted. The residuals of the three models exhibited a normal probability distribution. The perturbation diagrams of the three models showed that the welding current, wire feeding speed, and torch movement speed had significant effects on the width, height, and penetration depth of the deposition layer. Specifically, as the welding current increased, the width and penetration depth of deposition layer gradually increased, and the deposition layer height gradually decreased. As the wire feeding speed increased, the deposition layer height and penetration depth gradually increased, and the wire feeding speed had a minimal effect on the deposition layer width. As the torch travel speed increased, the deposition layer width, deposition layer height, and penetration depth gradually decreased.
(2)
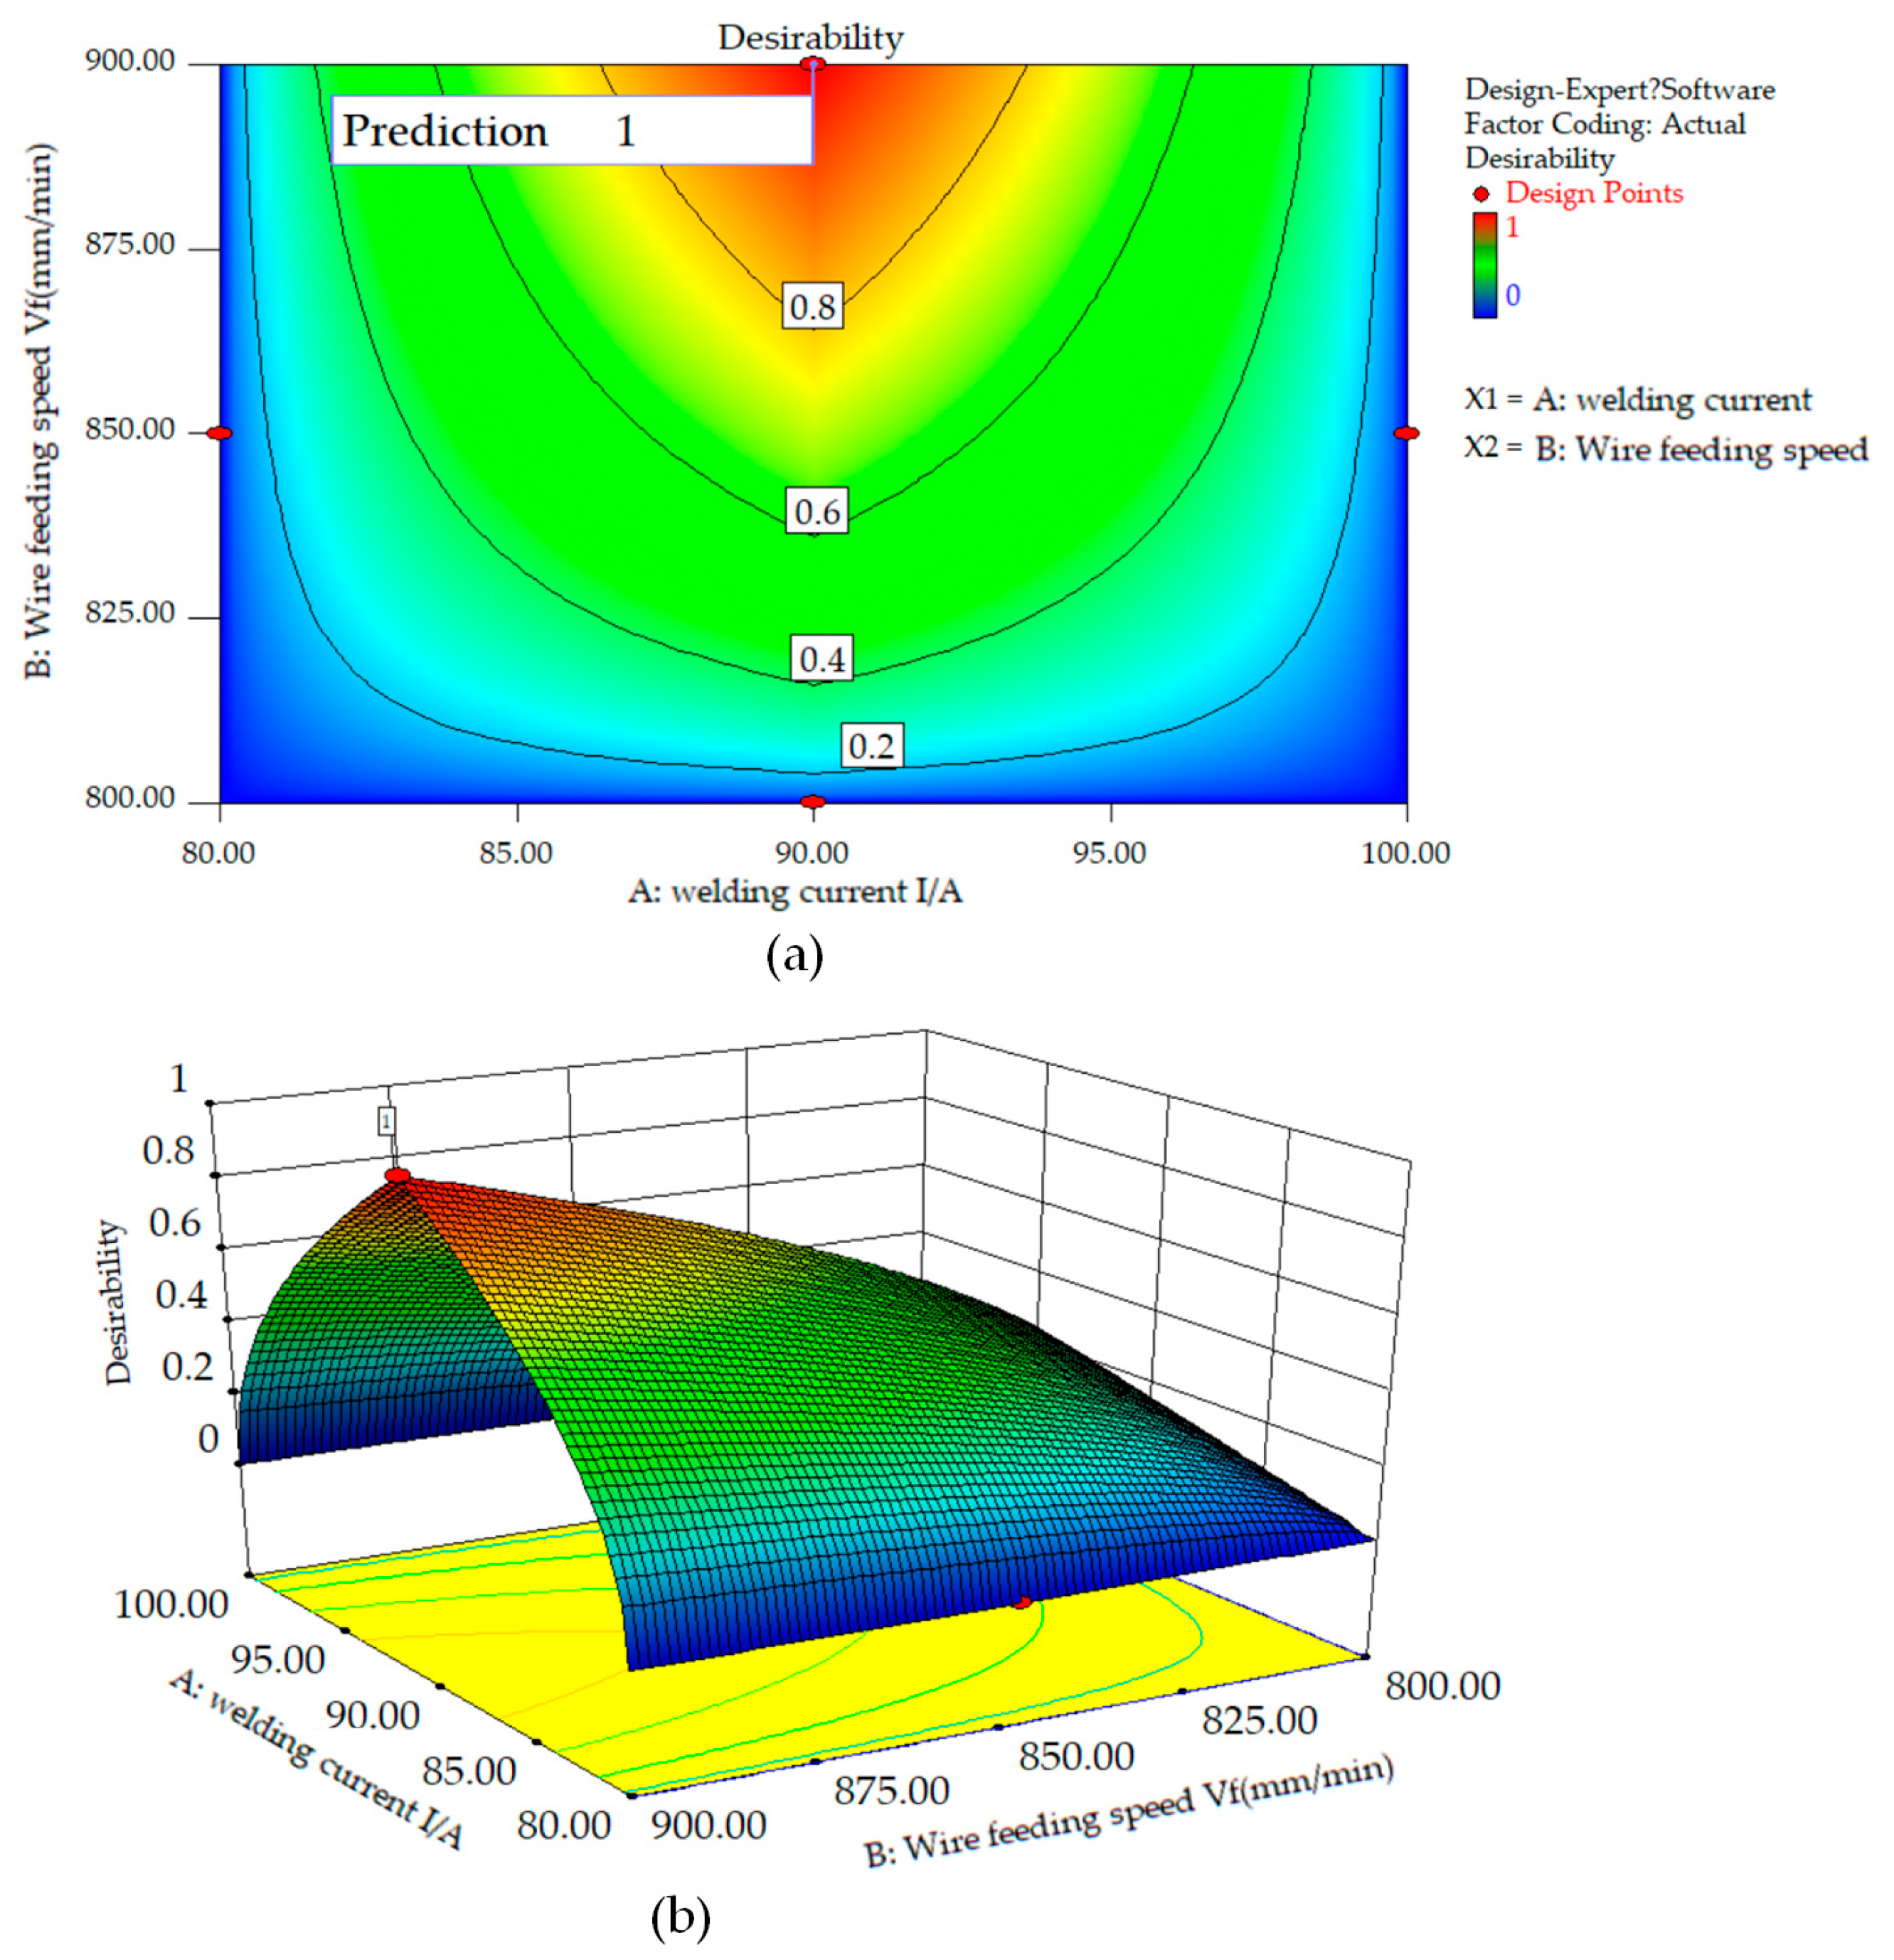
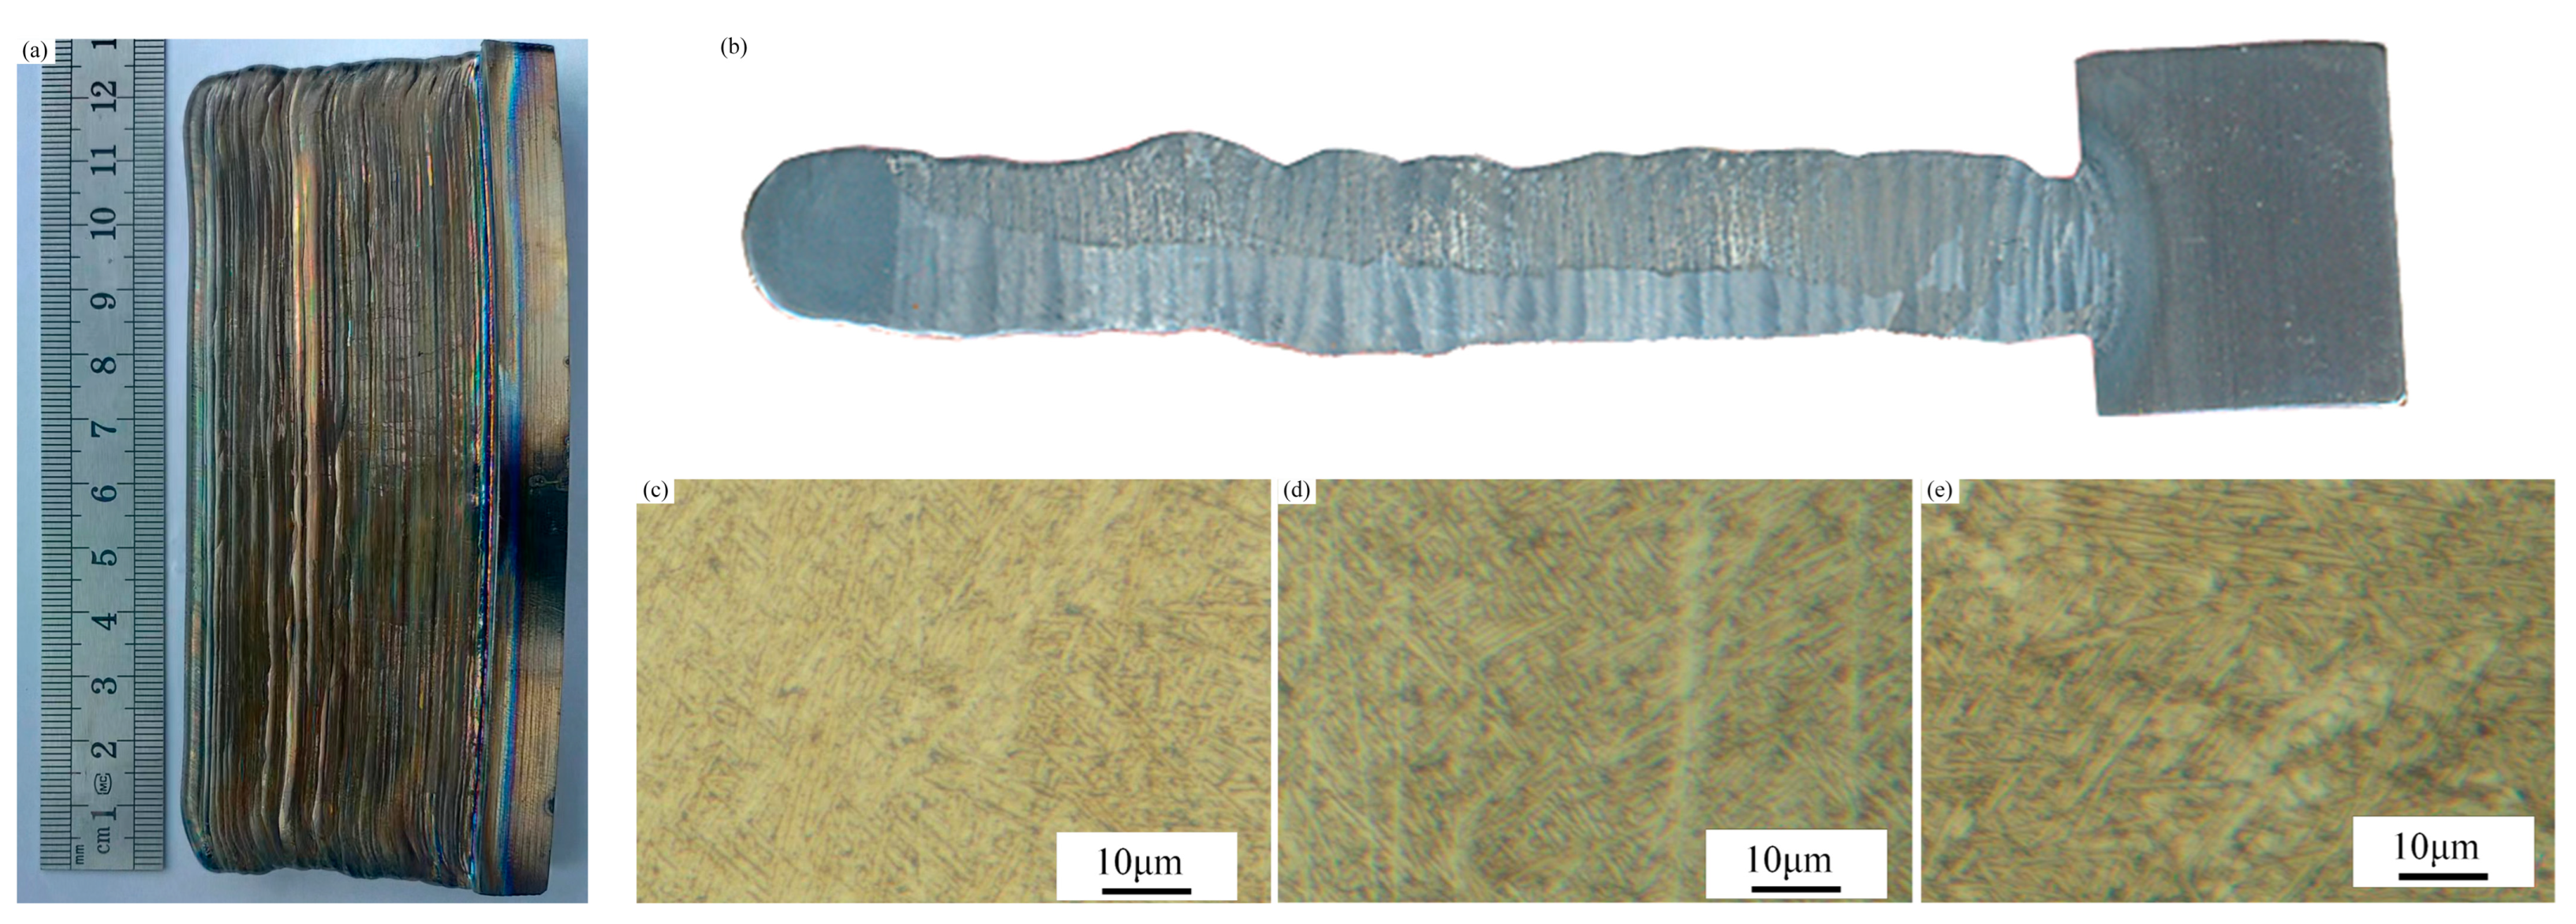
A set of process parameters were optimized: the welding current was 90 A, the wire feeding speed was 900 mm/min, and the torch travel speed was 200.18 mm/min. A thin-walled part was constructed using these parameters. Through the metallographic analysis of the thin-walled part, it was found that the different regions of the thin-walled part displayed a basketweave structure; from top to bottom, the α phase gradually become coarser.
(3)
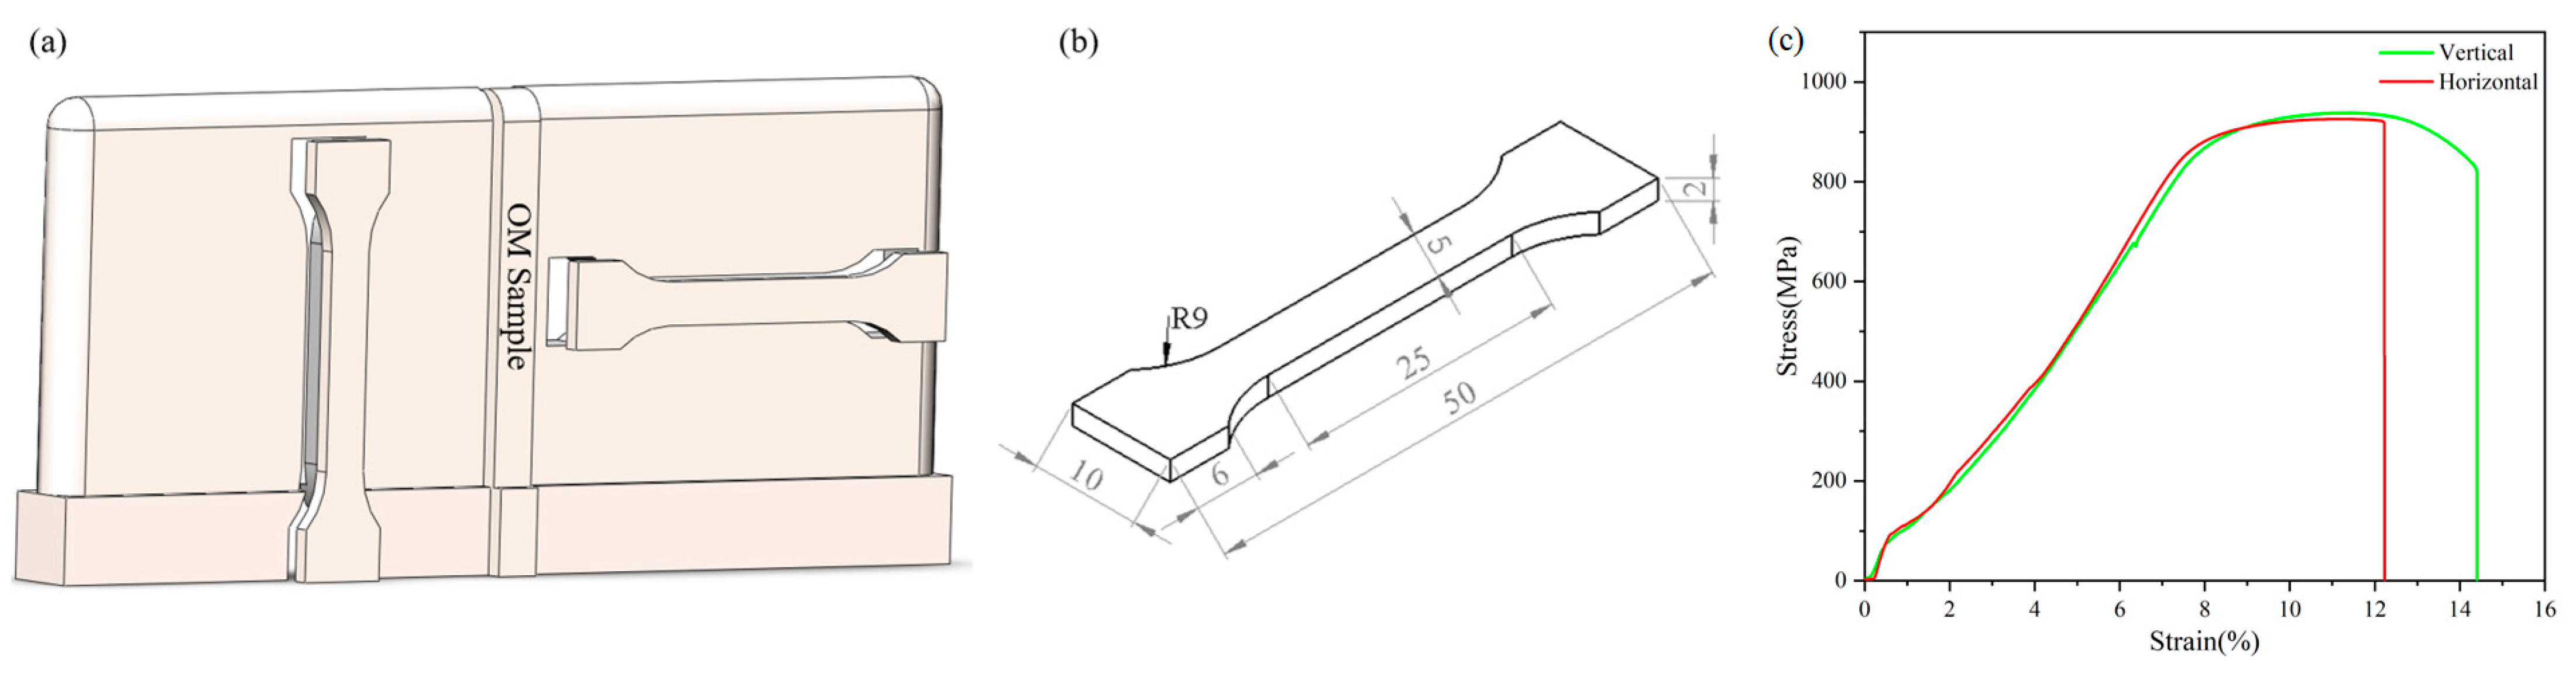
The microhardness tests of different regions of the thin-walled part showed that the microhardness of the thin-walled part was affected by the microstructure. The microhardness at the top was 362.7 HV, the middle was 352.7 HV, and the bottom was 340.5 HV. The microhardness gradually decreased from the top to the bottom. Through the tensile mechanical property tested, it was found that the horizontal tensile strength was 926.1 MPa, the elongation was 12.22%, the vertical tensile strength was 938.1 MPa, and the elongation was 14.41%. By comparing the experimental data with the standards of China and the United States, it can be determined that the mechanical properties of TC4 titanium alloy GTAW-WAAM thin-walled parts comply with the use standards of China and the United States.

Author Contributions

Conceptualization, C.C.; Methodology, H.L.; Software, H.L.; Formal analysis, T.F.; Investigation, T.F.; Data curation, C.C.; Writing—original draft, T.F.; Writing—review & editing, H.L.; Supervision, H.C. All authors have read and agreed to the published version of the manuscript.

Funding

This research received no external funding.

Institutional Review Board Statement

Not applicable.

Informed Consent Statement

Not applicable.

Data Availability Statement

Not applicable.

Conflicts of Interest

No conflicts of interest exist in the submission of this manuscript, and the manuscript has been approved by all of the authors for publication.

References

  1. Caballero, A.; Ding, J.; Bandari, Y.; Williams, S. Oxidation of Ti-6Al-4V During Wire and Arc Additive Manufacture. 3D Print Addit. Manuf. 2019, 6, 91–98. [Google Scholar] [CrossRef]
  2. Wu, B.; Pan, Z.; Ding, D.; Cuiuri, D.; Li, H. Effects of heat accumulation on microstructure and mechanical properties of Ti6Al4V alloy deposited by wire arc additive manufacturing. Addit. Manuf. 2018, 23, 151–160. [Google Scholar] [CrossRef]
  3. Wang, X.; Wang, A.; Wang, K.; Li, Y. Process stability for GTAW-based additive manufacturing. Rapid Prototyp. J. 2019, 25, 809–819. [Google Scholar] [CrossRef]
  4. Park, G.; Jo, H.; Park, M.; Shin, S.; Ko, W.; Park, N.; Kim, B.; Ahn, Y.; Jeon, J.B. Microstructure and Mechanical Properties of Gas Tungsten Arc Welded High Manganese Steel Sheet. Metals 2019, 9, 1167. [Google Scholar] [CrossRef]
  5. Gokhale, N.P.; Kala, P.; Sharma, V. Thin-walled metal deposition with GTAW welding-based additive manufacturing process. J. Braz. Soc. Mech. Sci. 2019, 41, 569. [Google Scholar] [CrossRef]
  6. Rios, S.; Colegrove, P.A.; Martina, F.; Williams, S.W. Analytical process model for wire plus arc additive manufacturing. Addit. Manuf. 2018, 21, 651–657. [Google Scholar]
  7. Kumar, A.; Maji, K. Selection of Process Parameters for Near-Net Shape Deposition in Wire Arc Additive Manufacturing by Genetic Algorithm. J. Mater. Eng. Perform. 2020, 29, 3334–3352. [Google Scholar] [CrossRef]
  8. Geng, H.; Xiong, J.; Huang, D.; Lin, X.; Li, J. A prediction model of layer geometrical size in wire and arc additive manufacture using response surface methodology. Int. J. Adv. Manuf. Tech. 2017, 93, 175–186. [Google Scholar] [CrossRef]
  9. Vidyarthy, R.S.; Dwivedi, D.K.; Muthukumaran, V. Optimization of A-TIG process parameters using response surface methodology. Mater. Manuf. Process 2018, 33, 709–717. [Google Scholar] [CrossRef]
  10. Sarathchandra, D.T.; Davidson, M.J.; Visvanathan, G. Parameters effect on SS304 beads deposited by wire arc additive manufacturing. Mater. Manuf. Process 2020, 35, 852–858. [Google Scholar] [CrossRef]
  11. Jia, Z.; Wan, X.; Guo, D. Optimization of UHFP-GTAW process based on response surface method. Trans. China Weld. Inst. 2020, 41, 90–96. [Google Scholar]
  12. Liang, E.; Hu, S.; Wang, Z. Optimization of GTAW cladding process of Inconel 625 on carbon steel using response surface methodology. Trans. China Weld. Inst. 2016, 37, 85–88. [Google Scholar]
  13. Vairamani, G.; Kumar, T.S.; Malarvizhi, S.; Balasubramanian, V. Application of response surface methodology to maximize tensile strength and minimize interface hardness of friction welded dissimilar joints of austenitic stainless steel and copper alloy. T. Nonferr. Metal. Soc. 2013, 23, 2250–2259. [Google Scholar] [CrossRef]
  14. Mehrabi, O.; Hossein Seyedkashi, S.M.; Moradi, M. Experimental and response surface study on additive manufacturing of functionally graded steel-inconel wall using direct laser metal deposition. Opt. Laser. Technol. 2023, 167, 109707. [Google Scholar] [CrossRef]
  15. Rao, S.; Sethi, A.; Das, A.K.; Mandal, N.; Kiran, P.; Ghosh, R.; Dixit, A.R.; Mandal, A. Fiber laser cutting of CFRP composites and process optimization through response surface methodology. Mater. Manuf. Process 2017, 32, 1612–1621. [Google Scholar] [CrossRef]
  16. Tian, H.; Lu, Z.; Chen, S. Predictive Modeling of Thermally Assisted Machining and Simulation Based on RSM after WAAM. Metals 2022, 12, 691. [Google Scholar] [CrossRef]
  17. Yadav, S.; Paul, C.P.; Rai, A.K.; Jinoop, A.N.; Nayak, S.K.; Singh, R.; Bindra, K.S. Parametric studies on laser additive manufacturing of copper on stainless steel. J. Micromanu. 2021, 5, 21–28. [Google Scholar] [CrossRef]
  18. Momin, A.G.; Khatri, B.C.; Chaudhari, M.; V. Shah, U.; Valaki, J. Parameters for cladding using plasma transfer arc welding—A critical. Mater. Today 2023, 77, 614–618. [Google Scholar] [CrossRef]
  19. Cheng, K.; Zhang, M.; Song, H.; Liu, X.; Fan, Z.; Wang, G.; Zhang, H. Additive manufacturing of Ti-6Al-4V alloy by hybrid plasma-arc deposition and microrolling: Grain morphology, microstructure, and tensile properties. Sci. China Technol. Sci. 2022, 65, 849–857. [Google Scholar] [CrossRef]
  20. Martina, F.; Colegrove, P.A.; Williams, S.W.; Meyer, J. Microstructure of Interpass Rolled Wire plus Arc Additive Manufacturing Ti-6Al-4V Components. Metall Mater. Trans. 2015, 46A, 6103–6118. [Google Scholar] [CrossRef]
  21. Xie, Y.; Gong, M.; Zhang, R.; Gao, M.; Zeng, X.; Wang, F. Grain boundary discontinuity and performance improvement mechanism of wire arc additive manufactured Ti–6Al–4V. J. Alloy Compd. 2021, 869, 159287. [Google Scholar] [CrossRef]
  22. Zhou, Y.; Qin, G.; Li, L.; Lu, X.; Jing, R.; Xing, X.; Yang, Q. Formability, microstructure and mechanical properties of Ti-6Al-4V deposited by wire and arc additive manufacturing with different deposition paths. Mat. Sci. Eng. Struct. 2020, 772, 138654. [Google Scholar] [CrossRef]
  23. Hai, L.; Ban, H.; Yang, X.; Shi, Y. Low-cycle fatigue behaviour of hot-rolled titanium-clad bimetallic steel. Int. J. Mech. Sci. 2023, 254, 108443. [Google Scholar] [CrossRef]
  24. Brandl, E.; Palm, F.; Michailov, V.; Viehweger, B.; Leyens, C. Mechanical properties of additive manufactured titanium (Ti–6Al–4V) blocks deposited by a solid-state laser and wire. Mater Design 2011, 32, 4665–4675. [Google Scholar] [CrossRef]
Figure 1. Schematic diagram of the experimental device: (a) cross-sectional geometry of the deposition layer and measurement elements (b).
Coatings 13 01578 g001
Figure 2. Appearance diagram of a single deposition layer with running order 1–17 in Table 3.
Coatings 13 01578 g002
Figure 3. Cross sectional diagram of a single deposition layer with running order 1–17 in Table 3.
Coatings 13 01578 g003
Figure 4. Normal plot of residuals for three models: (a) W, (b) H, and (c) P.
Coatings 13 01578 g004
Figure 5. Perturbation diagrams of the (a) deposition layer width, (b) deposition layer height, and (c) penetration depth as a function of deviation of the center reference point.
Coatings 13 01578 g005
Figure 6. Effect of welding current and wire feeding speed on the feasibility of the scheme while the torch travel speed Vs = 200.18 mm/min: (a) probability distribution contour plot of the scheme feasibility and (b) 3D surface plot of probability distribution of the scheme feasibility.
Coatings 13 01578 g006
Figure 7. OM microstructures and morphologies of the TC4 titanium alloy RSM thin-walled part: (a) morphologies of the TC4 titanium alloy RSM thin-walled part; (b) OM macrostructures of the TC4 titanium alloy RSM thin-walled part; and (ce) OM microstructure of the top, middle, and bottom of the TC4 titanium alloy RSM thin-walled part.
Coatings 13 01578 g007
Figure 8. Microhardness: (a) point location and (b) values at different regions.
Coatings 13 01578 g008
Figure 9. Tensile specimen: (a) sampling position of tensile specimen, (b) dimensions of tensile specimen, and (c) stress−strain curve.
Coatings 13 01578 g009
Table 1. Chemical composition of TC4 wire and substrate (wt.%).
MaterialTiAlVFeCNHOOther
Filler wireBal6.34.000.04<0.01<0.010.0010.15<0.1
SubstrateBal6.033.950.160.030.020.0050.10<0.1
Standard valueBal5.5–6.753.5–4.5≤0.25≤0.05≤0.05≤0.012≤0.18<0.4
Table 2. Input process parameters and working range.
Input Process Parameters (Symbol/Unit)Working Range
−101
welding current (I/A)8090100
wire feeding speed (Vf/(mm/min))800850900
torch travel speed (Vs/(mm/min))180210240
Table 3. Box−Behnken response surface design and corresponding responses.
Run OrderDesign MatrixInput VariablesResponses
A: Welding Current I/AB: Wire Feeding Speed Vf /(mm/min)C: Torch Travel Speed Vs/(mm/min)Deposition Layer Width W (mm)Deposition Layer Height H (mm)Penetration Depth
P (mm)
10.001.00−1.00909001805.6400.8051.586
2−1.000.001.00808502404.3380.7601.170
30.000.000.00908502105.0740.7091.420
41.00−1.000.001008002106.0980.6101.653
50.00−1.00−1.00908001805.8060.7241.509
6−1.000.00−1.00808501805.1280.8511.089
70.001.001.00909002405.50.6351.342
80.000.000.00908502105.90.6941.232
9−1.00−1.000.00808002104.8520.7471.081
100.00−1.001.00908002404.8790.6111.339
110.000.000.00908502105.1680.7031.358
120.000.000.00908502105.2070.7291.403
131.000.00−1.001008501806.7100.6821.958
14−1.001.000.00809002104.3810.9031.224
150.000.000.00908502105.2530.6951.543
161.000.001.001008502405.3920.6011.561
171.001.000.001009002106.2930.7601.958
Table 4. Resulting ANOVA table for the regression model of the deposition layer width.
SourceSum of SquaresdfMean SquareF Valuep-Value
Prob > F
Model5.8490.656.740.0099significant
A-I4.2014.2043.610.0003significant
B-Vf4.005 × 10−314.005 × 10−30.0420.8441
C-Vs1.2611.2613.090.0085significant
AB0.1110.111.150.3187
AC0.07010.0700.720.4229
BC0.1510.151.610.2452
A24.798 × 10−414.798 × 10−44.986 × 10−30.9457
B20.02410.0240.250.6353
C20.01610.0160.160.6990
Residual0.6770.096
Lack of Fit0.2430.0790.720.5899not significant
Pure Error0.4440.11
Cor Total6.5116
Std. Dev.0.31R-Squared0.8966
Mean5.39Adj R-Squared0.7636
C.V.%1.72Pred R-Squared0.3145
PRESS4.46Adeq Precision9.425
Table 5. Resulting ANOVA table for the regression model of the deposition layer height.
SourceSum of SquaresdfMean SquareF Valuep-Value
Prob > F
Model0.1290.01322.410.0002significant
A-I0.07210.072126.11<0.0001significant
B-Vf8.321 × 10−318.321 × 10−314.490.0067significant
C-Vs0.02610.02645.080.0003significant
AB6.320 × 10−316.320 × 10−311.010.0128significant
AC2.500 × 10−312.500 × 10−30.0440.8406
BC8.122 × 10−418.122 × 10−41.410.2730
A21.727 × 10−311.727×10−33.010.1265
B23.800 × 10−413.800 × 10−40.660.4427
C23.184 × 10−513.184 × 10−50.0550.8205
Residual4.018 × 10−375.740 × 10⁻⁴
Lack of Fit3.206 × 10−431.069 × 10−35.260.0712not significant
Pure Error8.120 × 10−442.030 × 10⁻⁴
Cor Total0.1216
Std. Dev.0.024R-Squared0.9665
Mean0.71Adj R-Squared0.9233
C.V.%3.38Pred R-Squared0.5612
PRESS0.053Adeq Precision16.863
Table 6. Resulting ANOVA table for the regression model of the penetration depth.
SourceSum of SquaresdfMean SquareF Valuep-Value
Prob > F
Model1.0190.1111.380.0021significant
A-I0.8210.8283.68<0.0001significant
B-Vf0.03510.0353.540.1018
C-Vs0.06710.0676.770.0353significant
AB6.561 × 10−316.561 × 10−30.670.4410
AC0.05710.0575.810.0468significant
BC1.369 × 10−311.369 × 10−30.140.7201
A28.207 × 10−318.207 × 10−30.830.3914
B28.022 × 10−318.022 ×10−30.820.3965
C23.525 × 10−413.525 × 10−40.0360.8552
Residual0.06979.836 × 10−3
Lack of Fit0.01836.131 × 10−30.490.7101not significant
Pure Error0.05040.013
Cor Total1.0816
Std. Dev.0.099R-Squared0.9360
Mean1.44Adj R-Squared0.8538
C.V.%6.90Pred R-Squared0.6533
PRESS0.37Adeq Precision11.576
Disclaimer/Publisher’s Note: The statements, opinions and data contained in all publications are solely those of the individual author(s) and contributor(s) and not of MDPI and/or the editor(s). MDPI and/or the editor(s) disclaim responsibility for any injury to people or property resulting from any ideas, methods, instructions or products referred to in the content.

