
Effect of Planting Rebars on the Shear Strength of Interface between Full Lightweight Ceramsite Concrete and Ordinary Concrete

Abstract
:1. Introduction
2. Experimental Materials and Specimen Production
2.1. Experimental Materials
- (1)
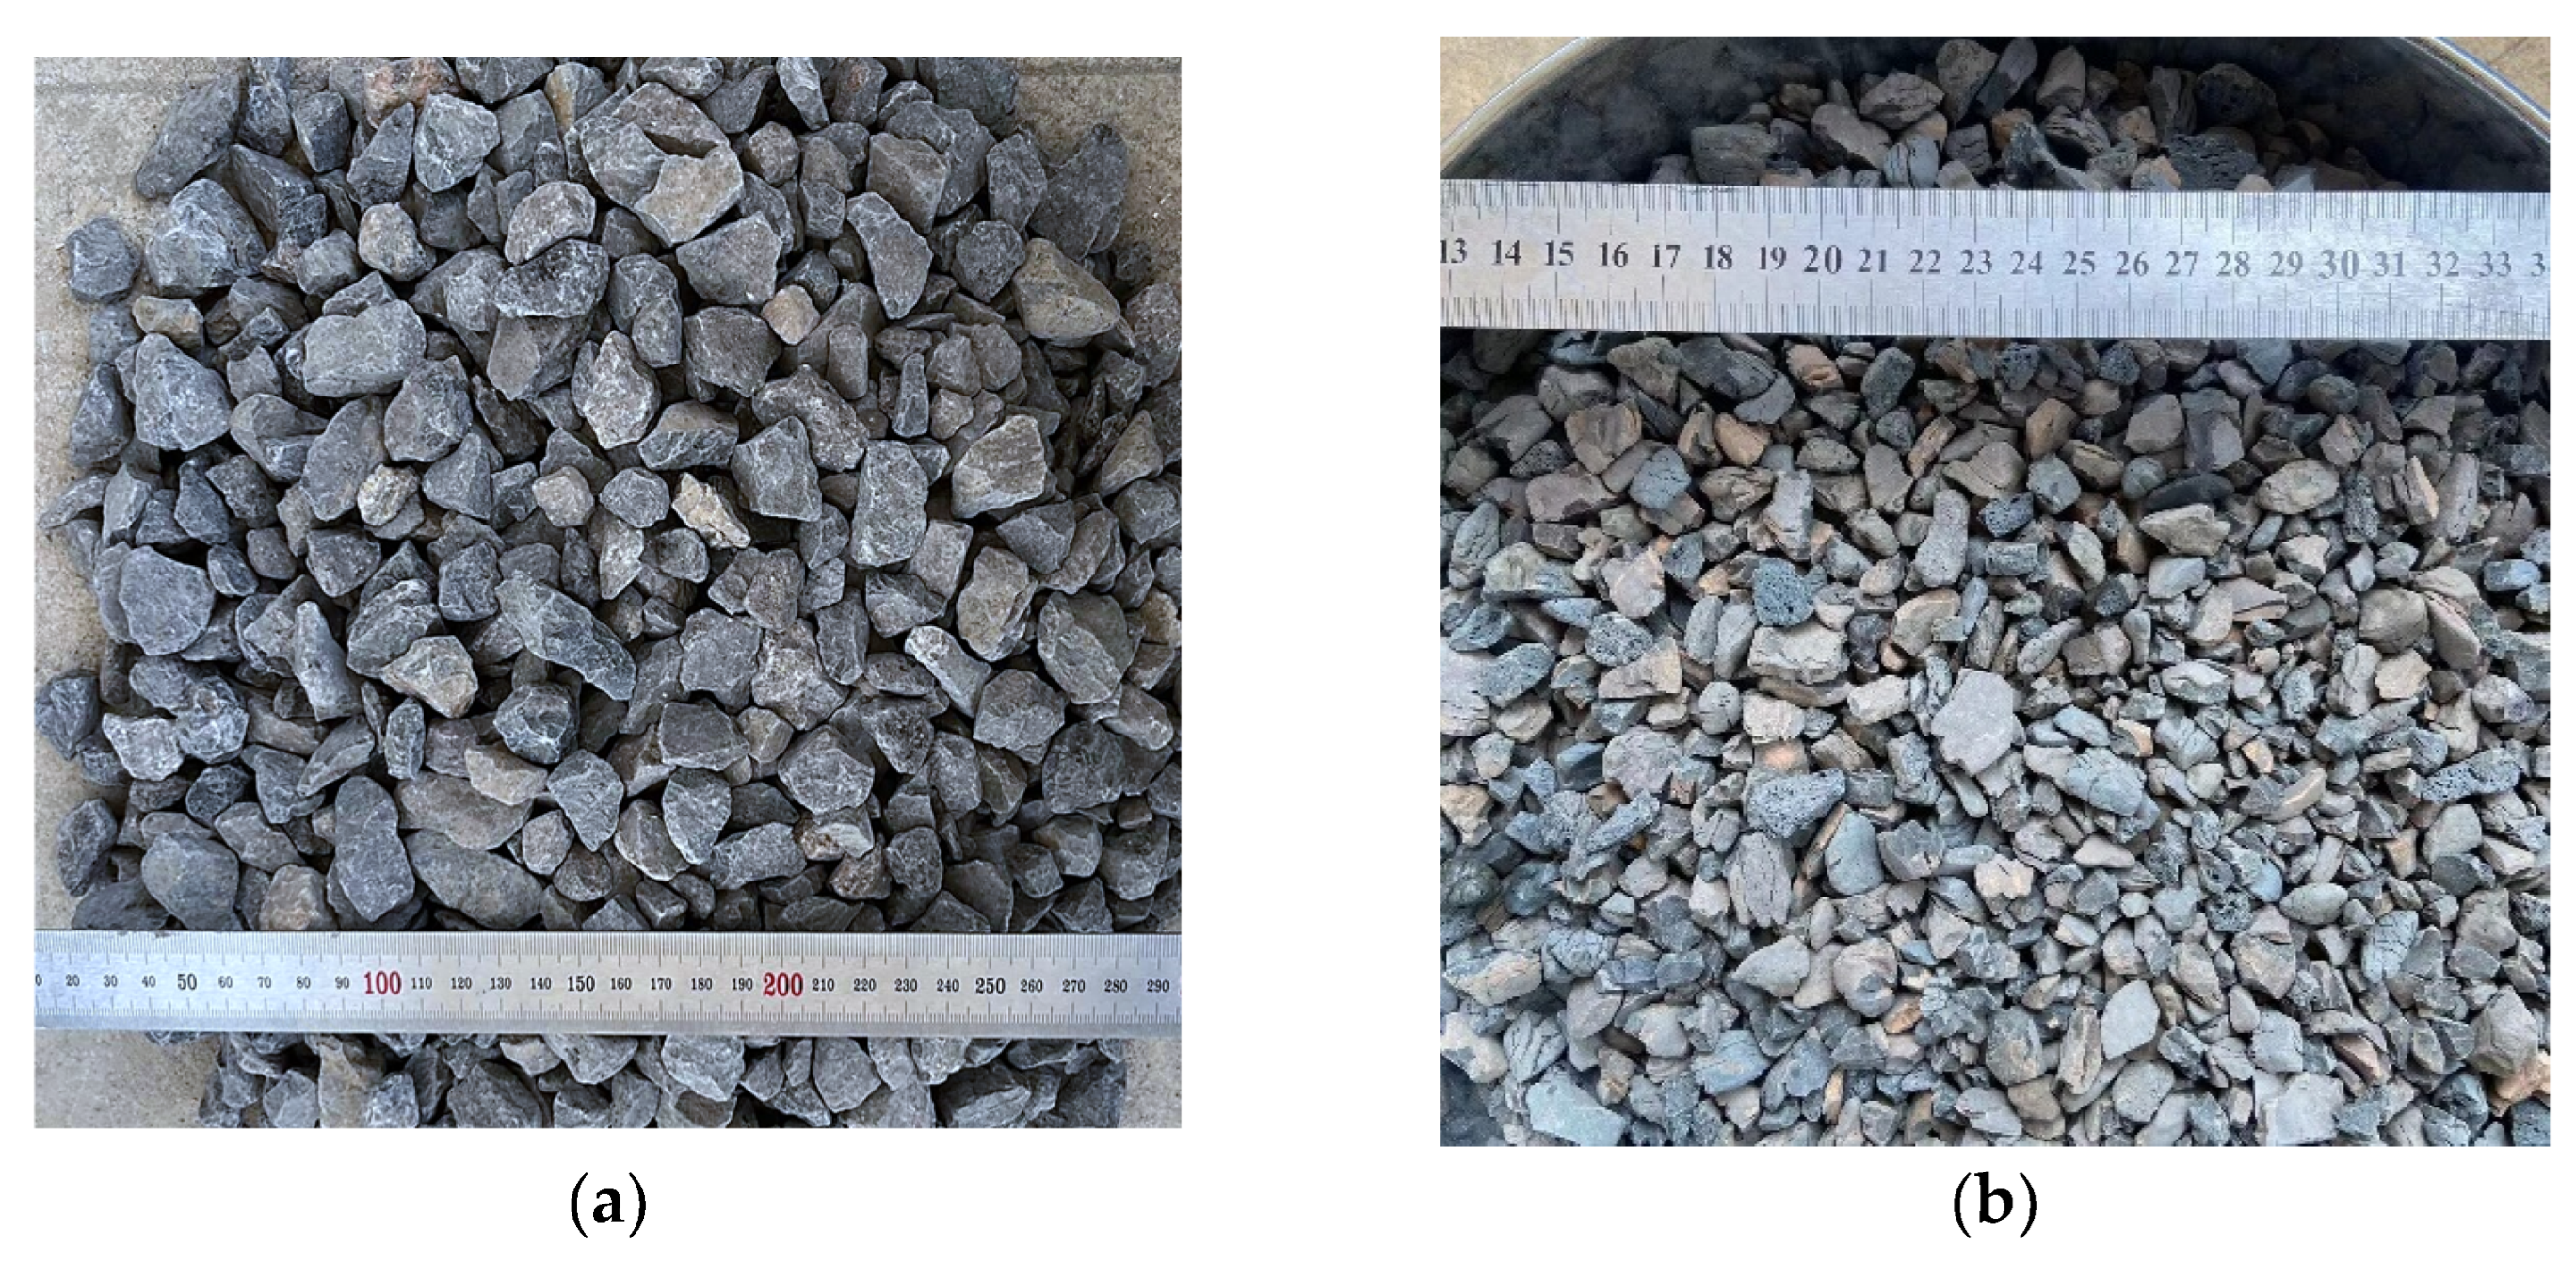
- Coarse aggregates
- (2)
- Fine aggregate
- (3)
- Cement
- (4)
- Water-reducing agent
- (5)
- Rebar
2.2. Mix Proportion
2.3. Physical and Mechanical Properties
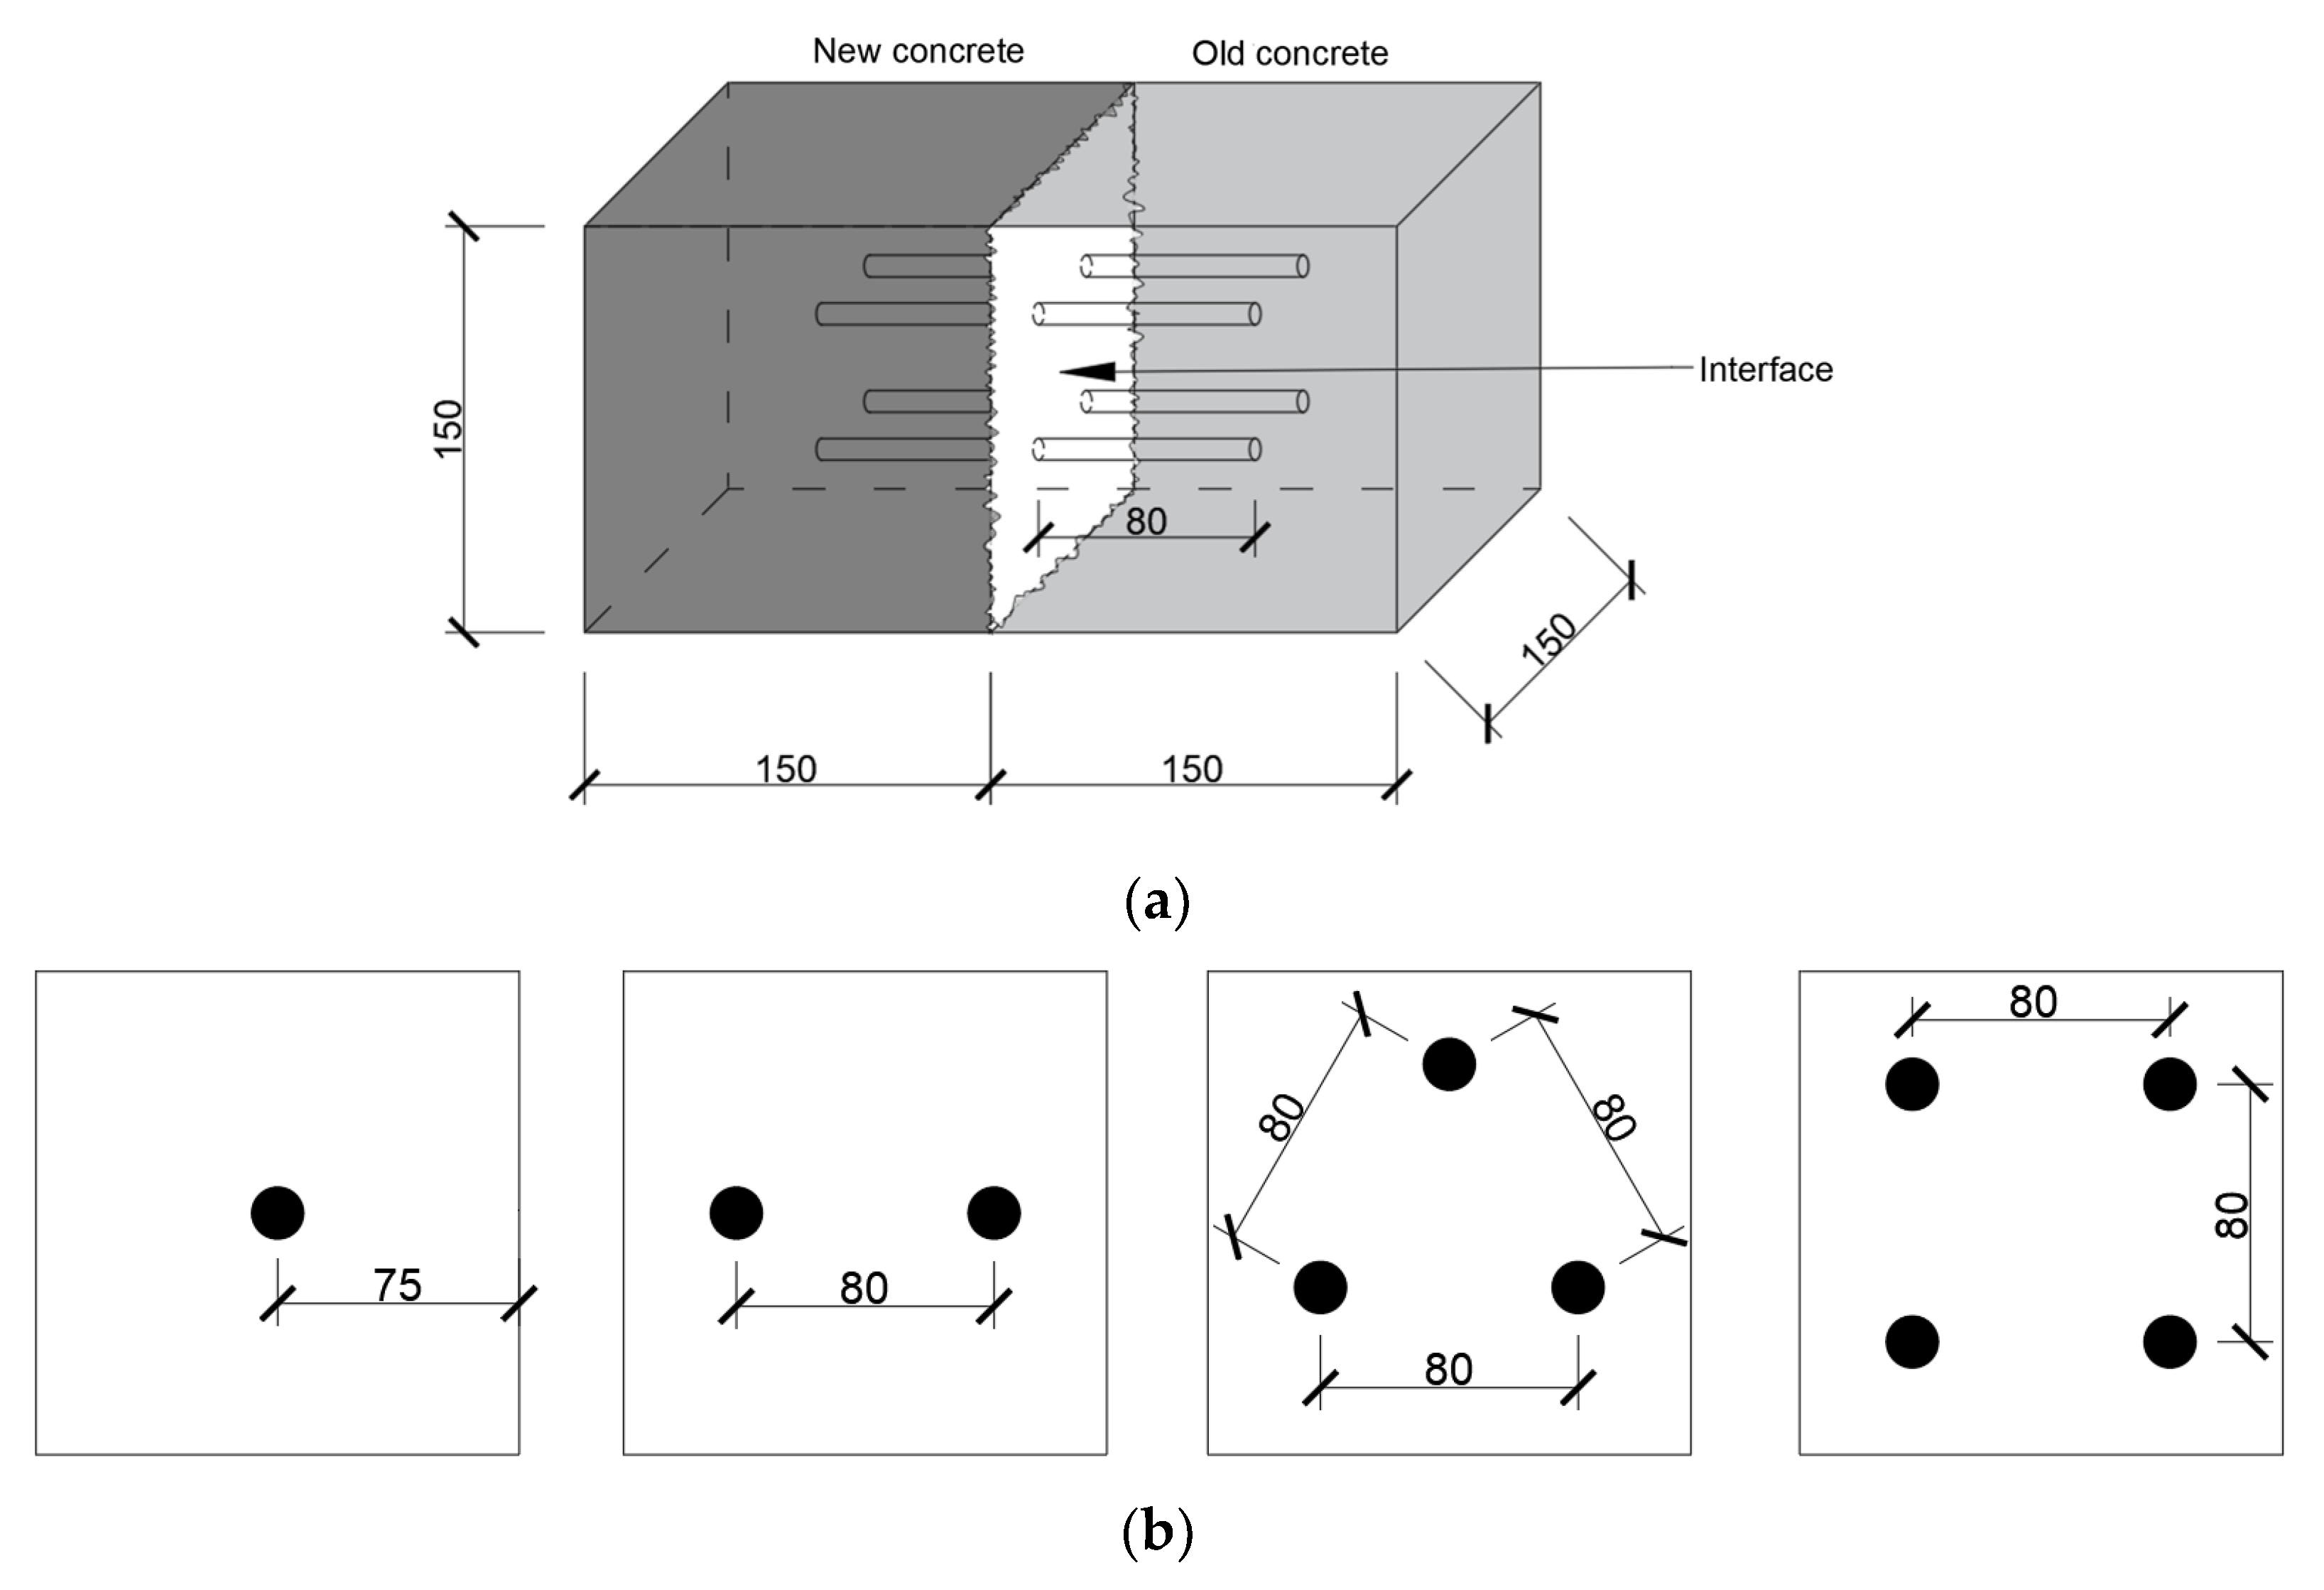
2.4. Specimen Design
2.5. Fabrication of Specimens
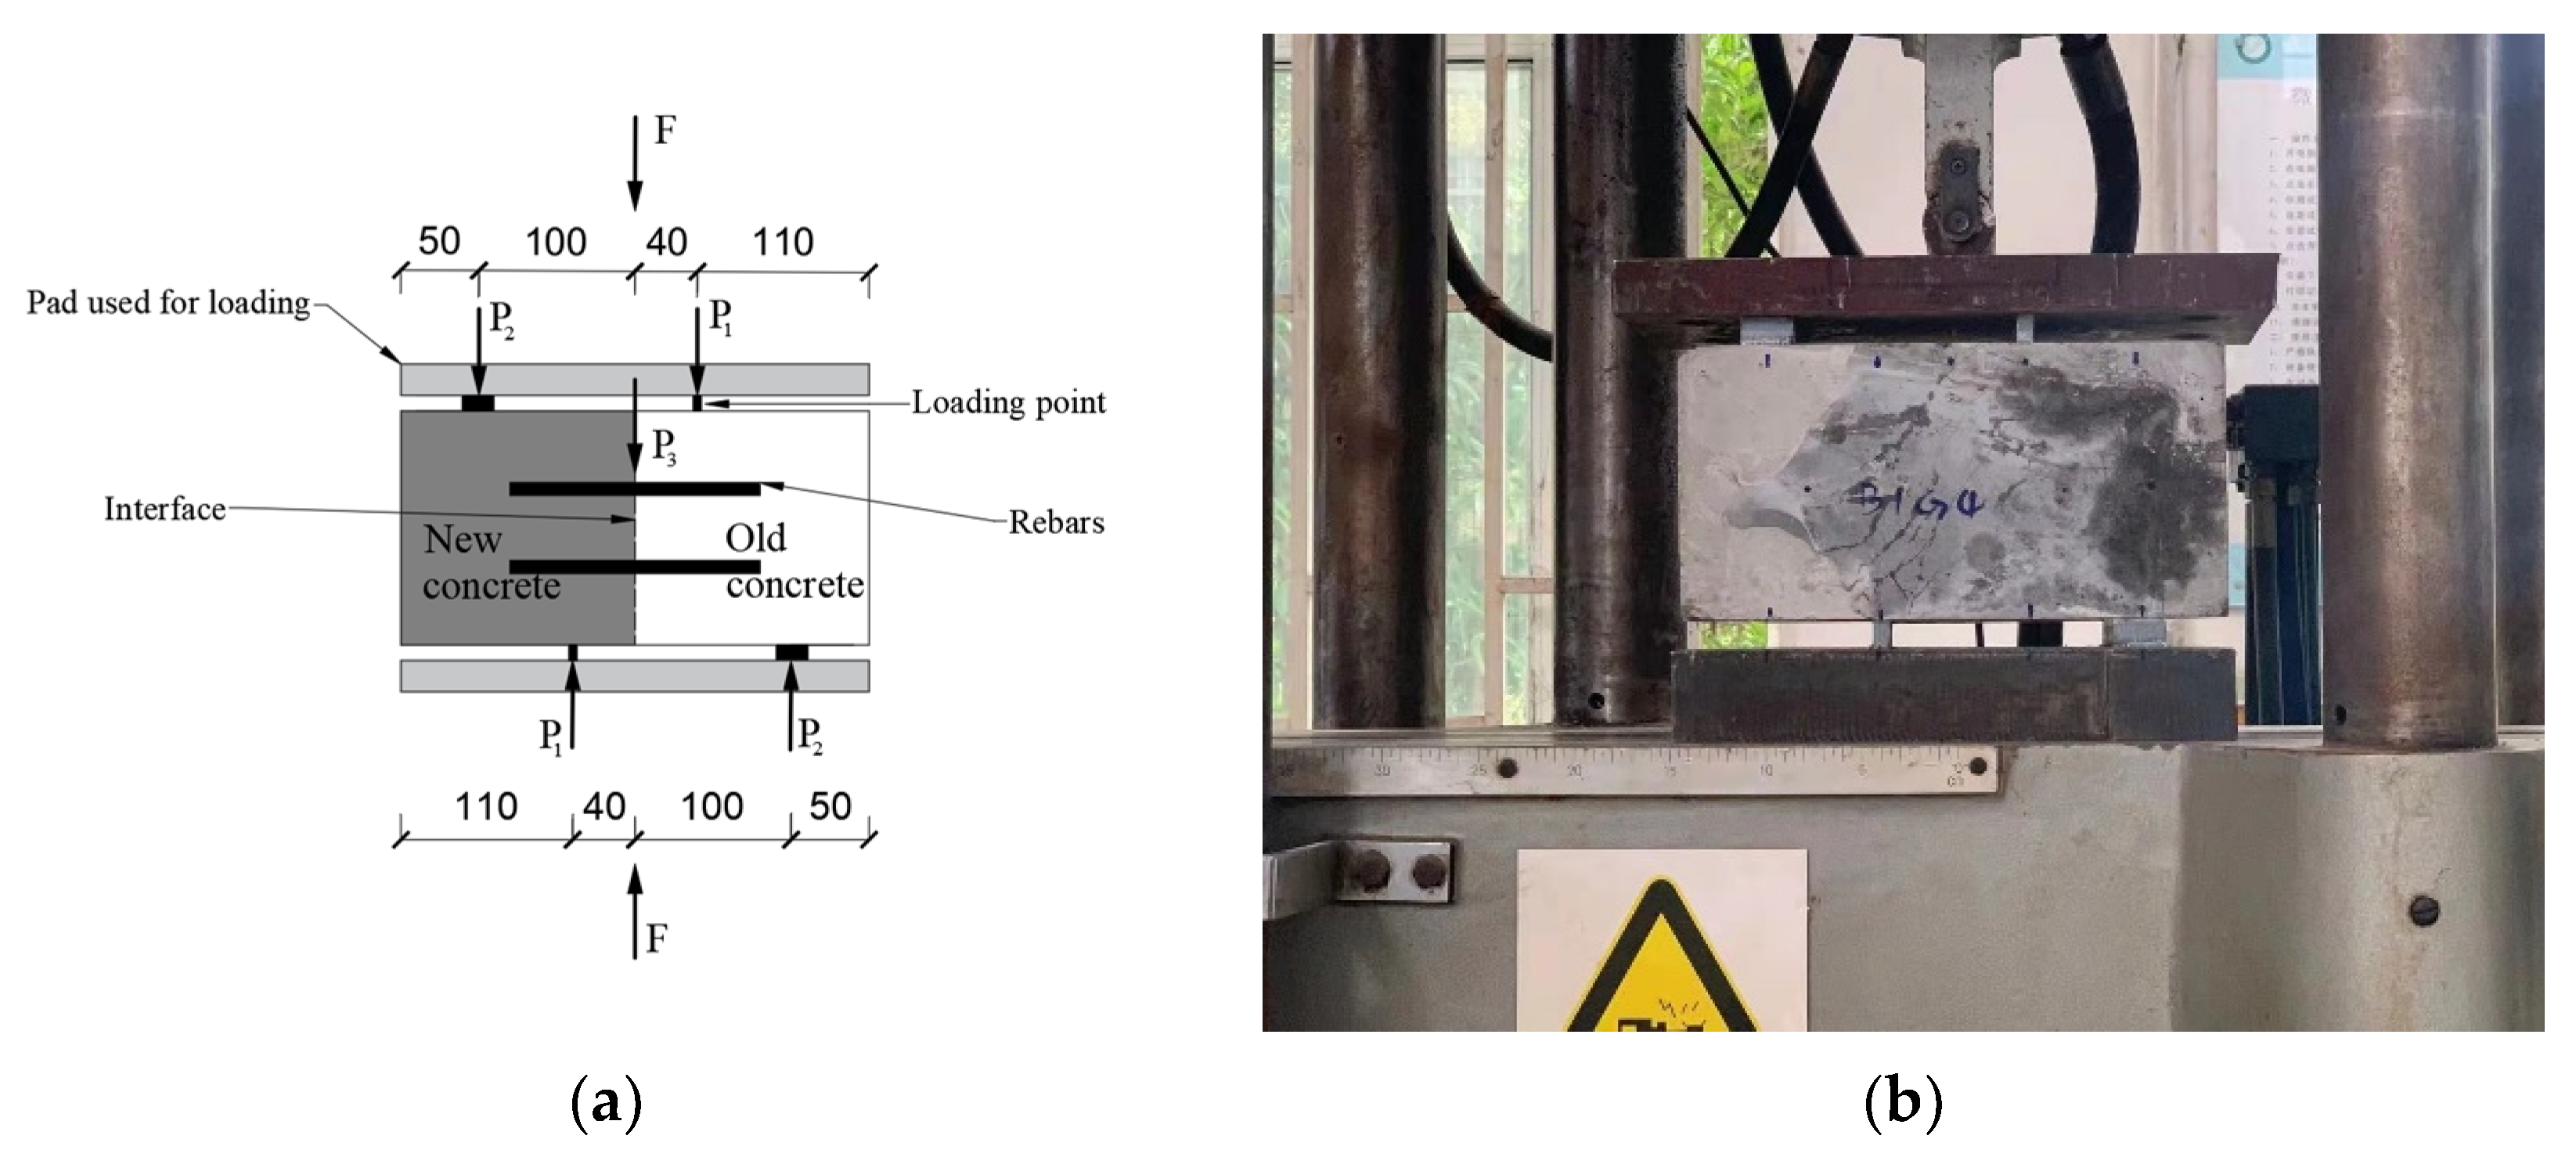
2.6. Test Device and Loading Method
3. Experimental Results
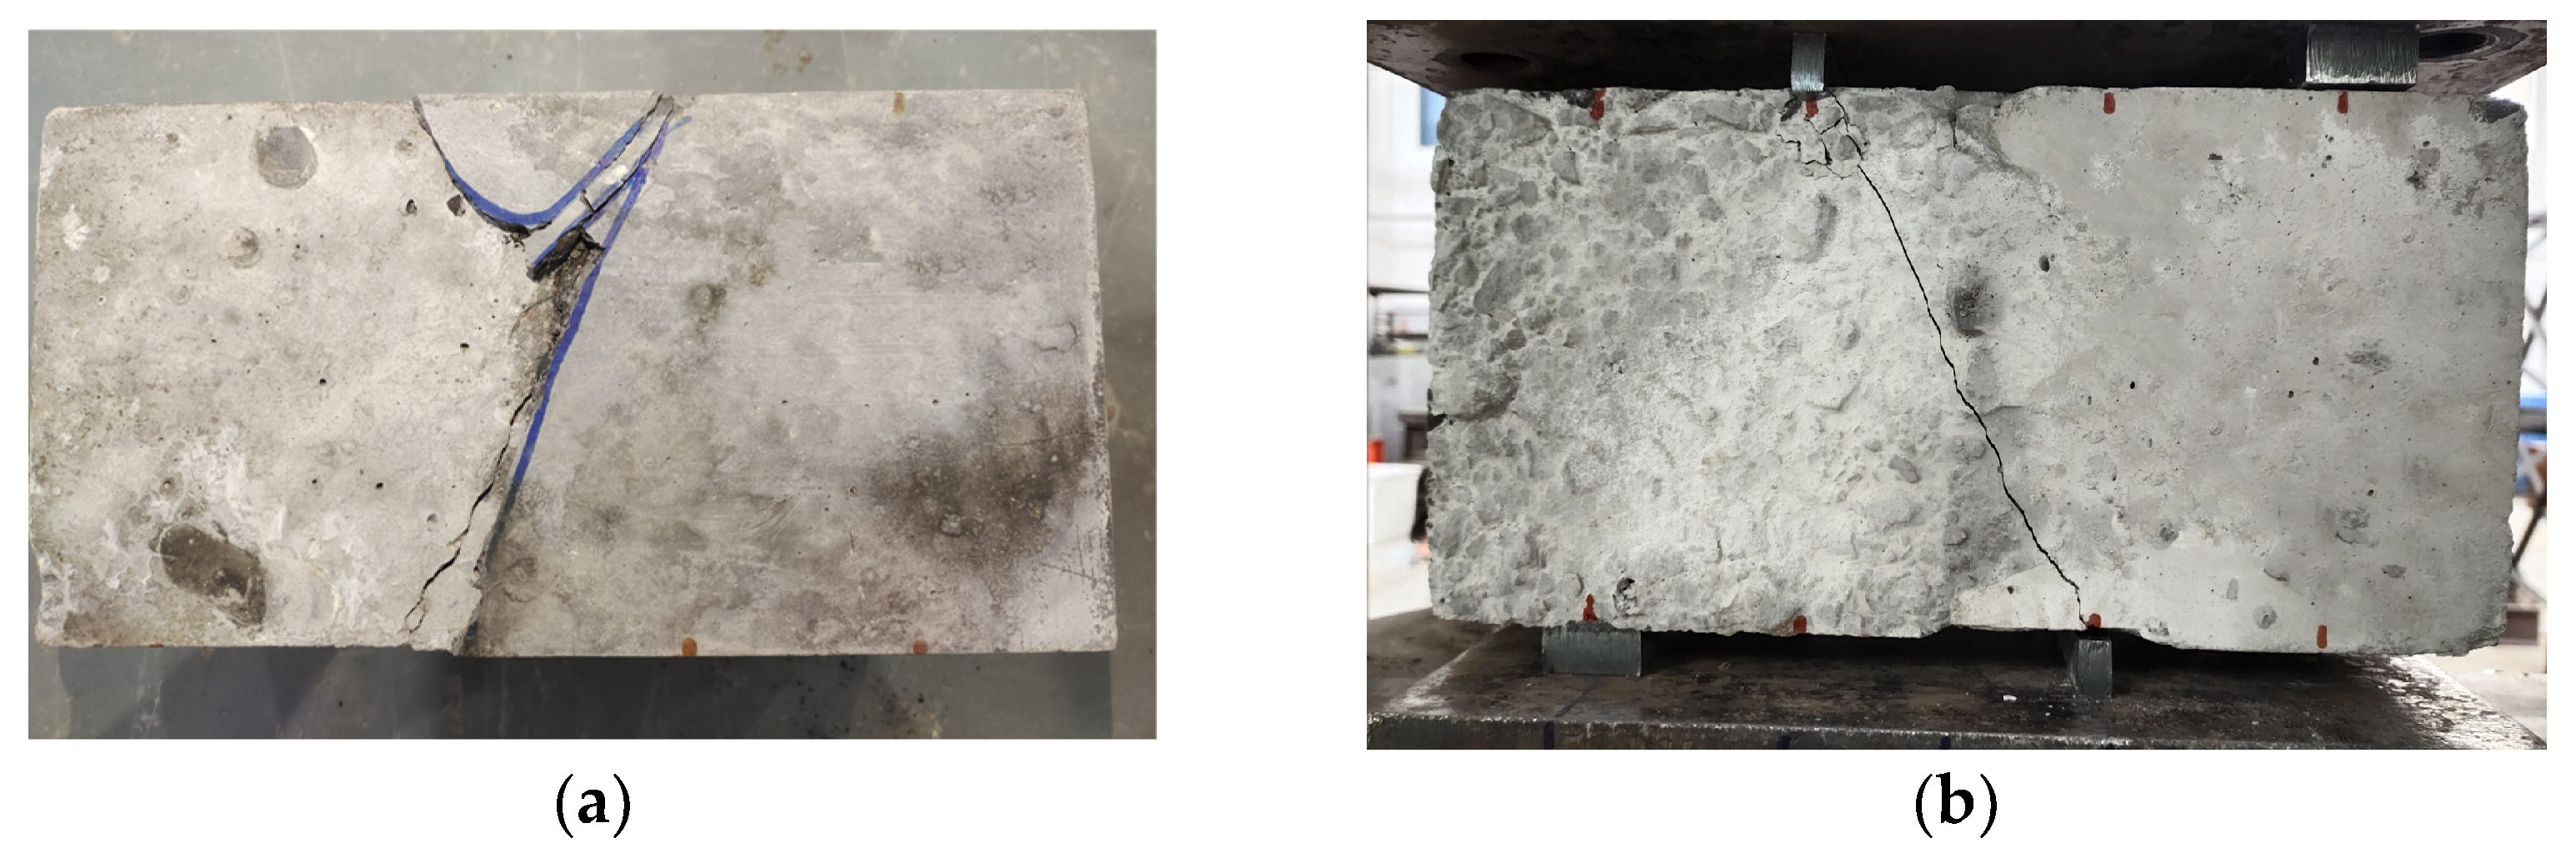
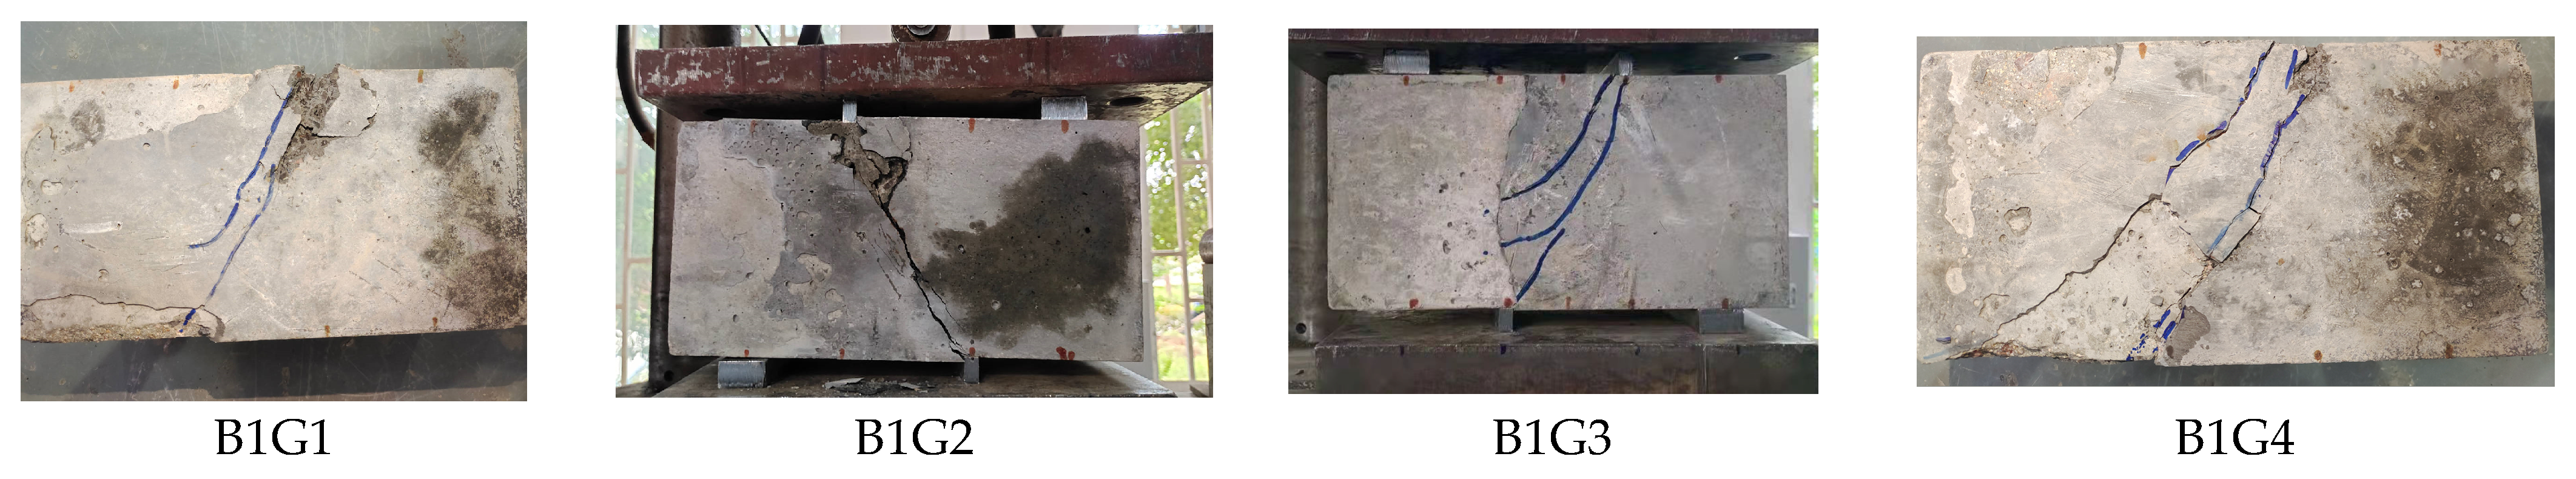
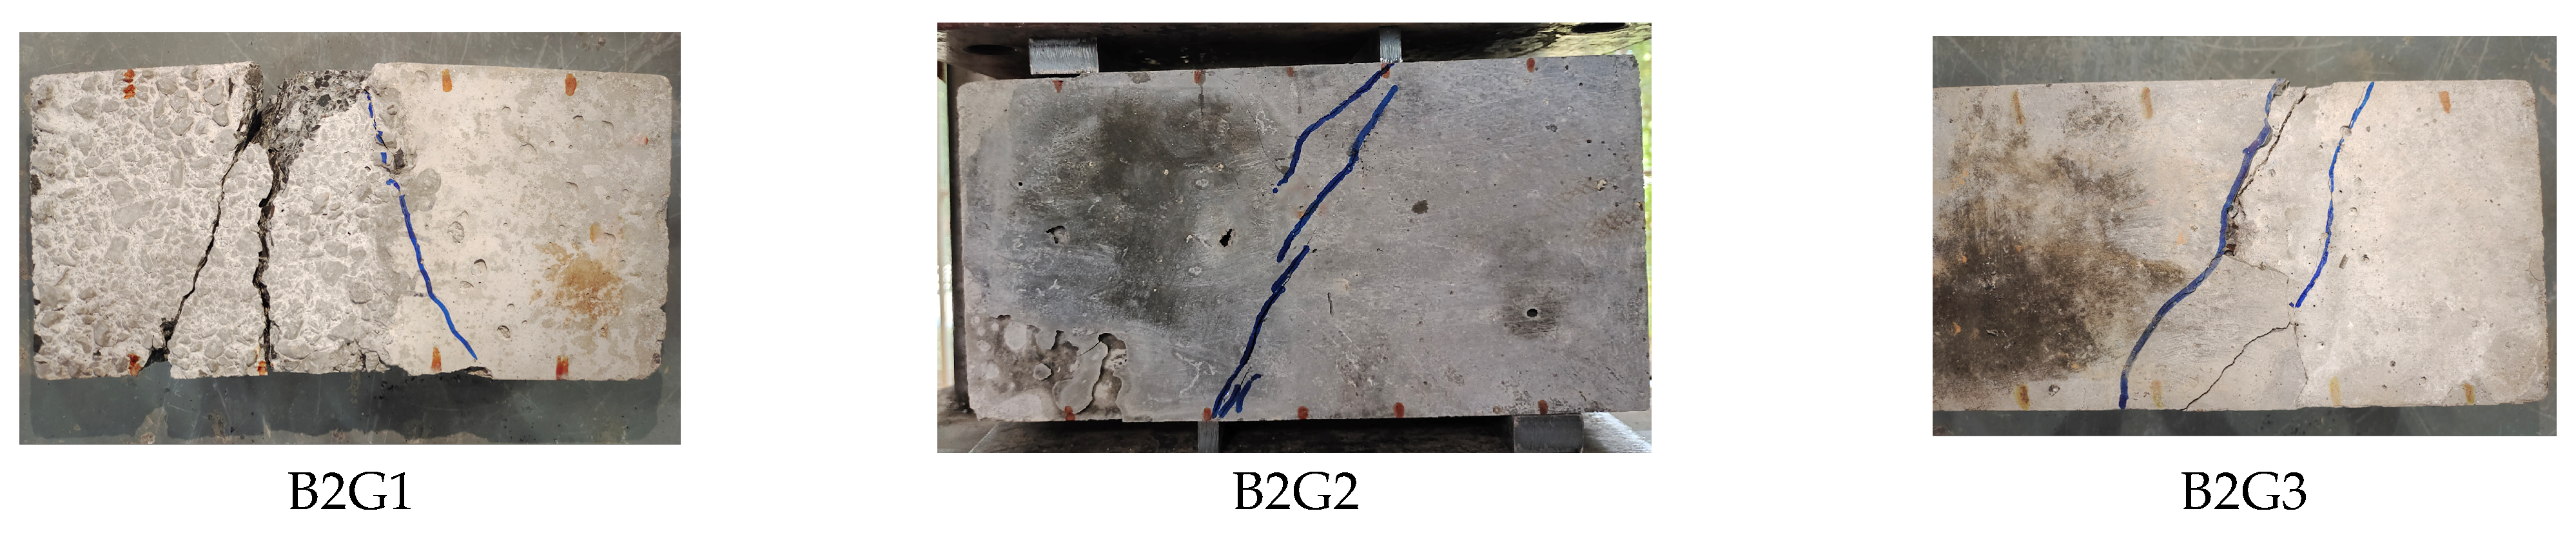
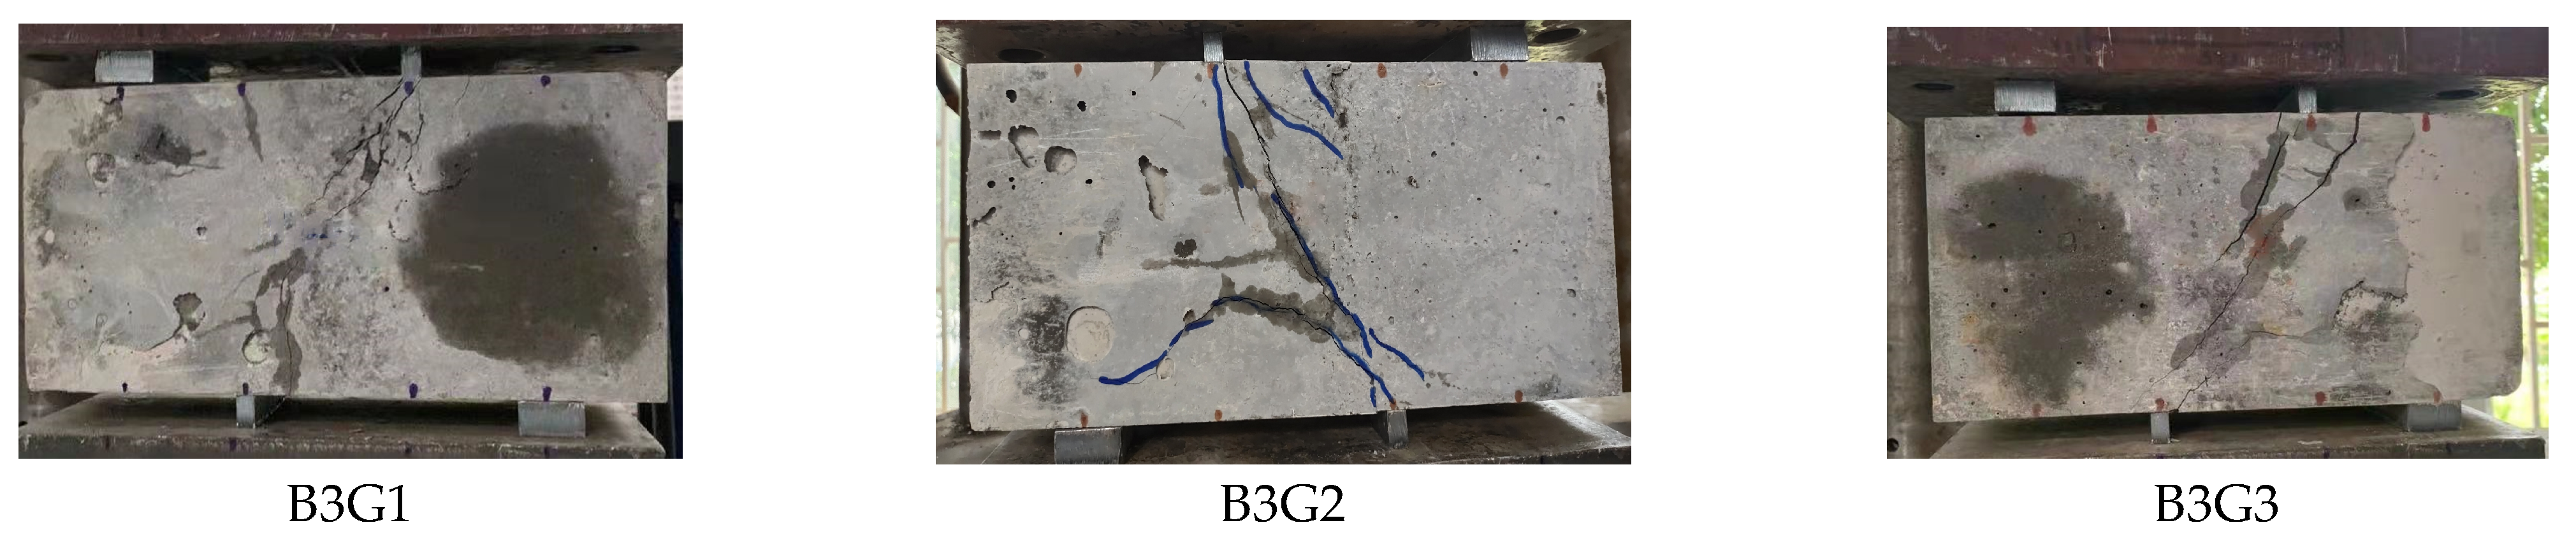
3.1. Destruction Form
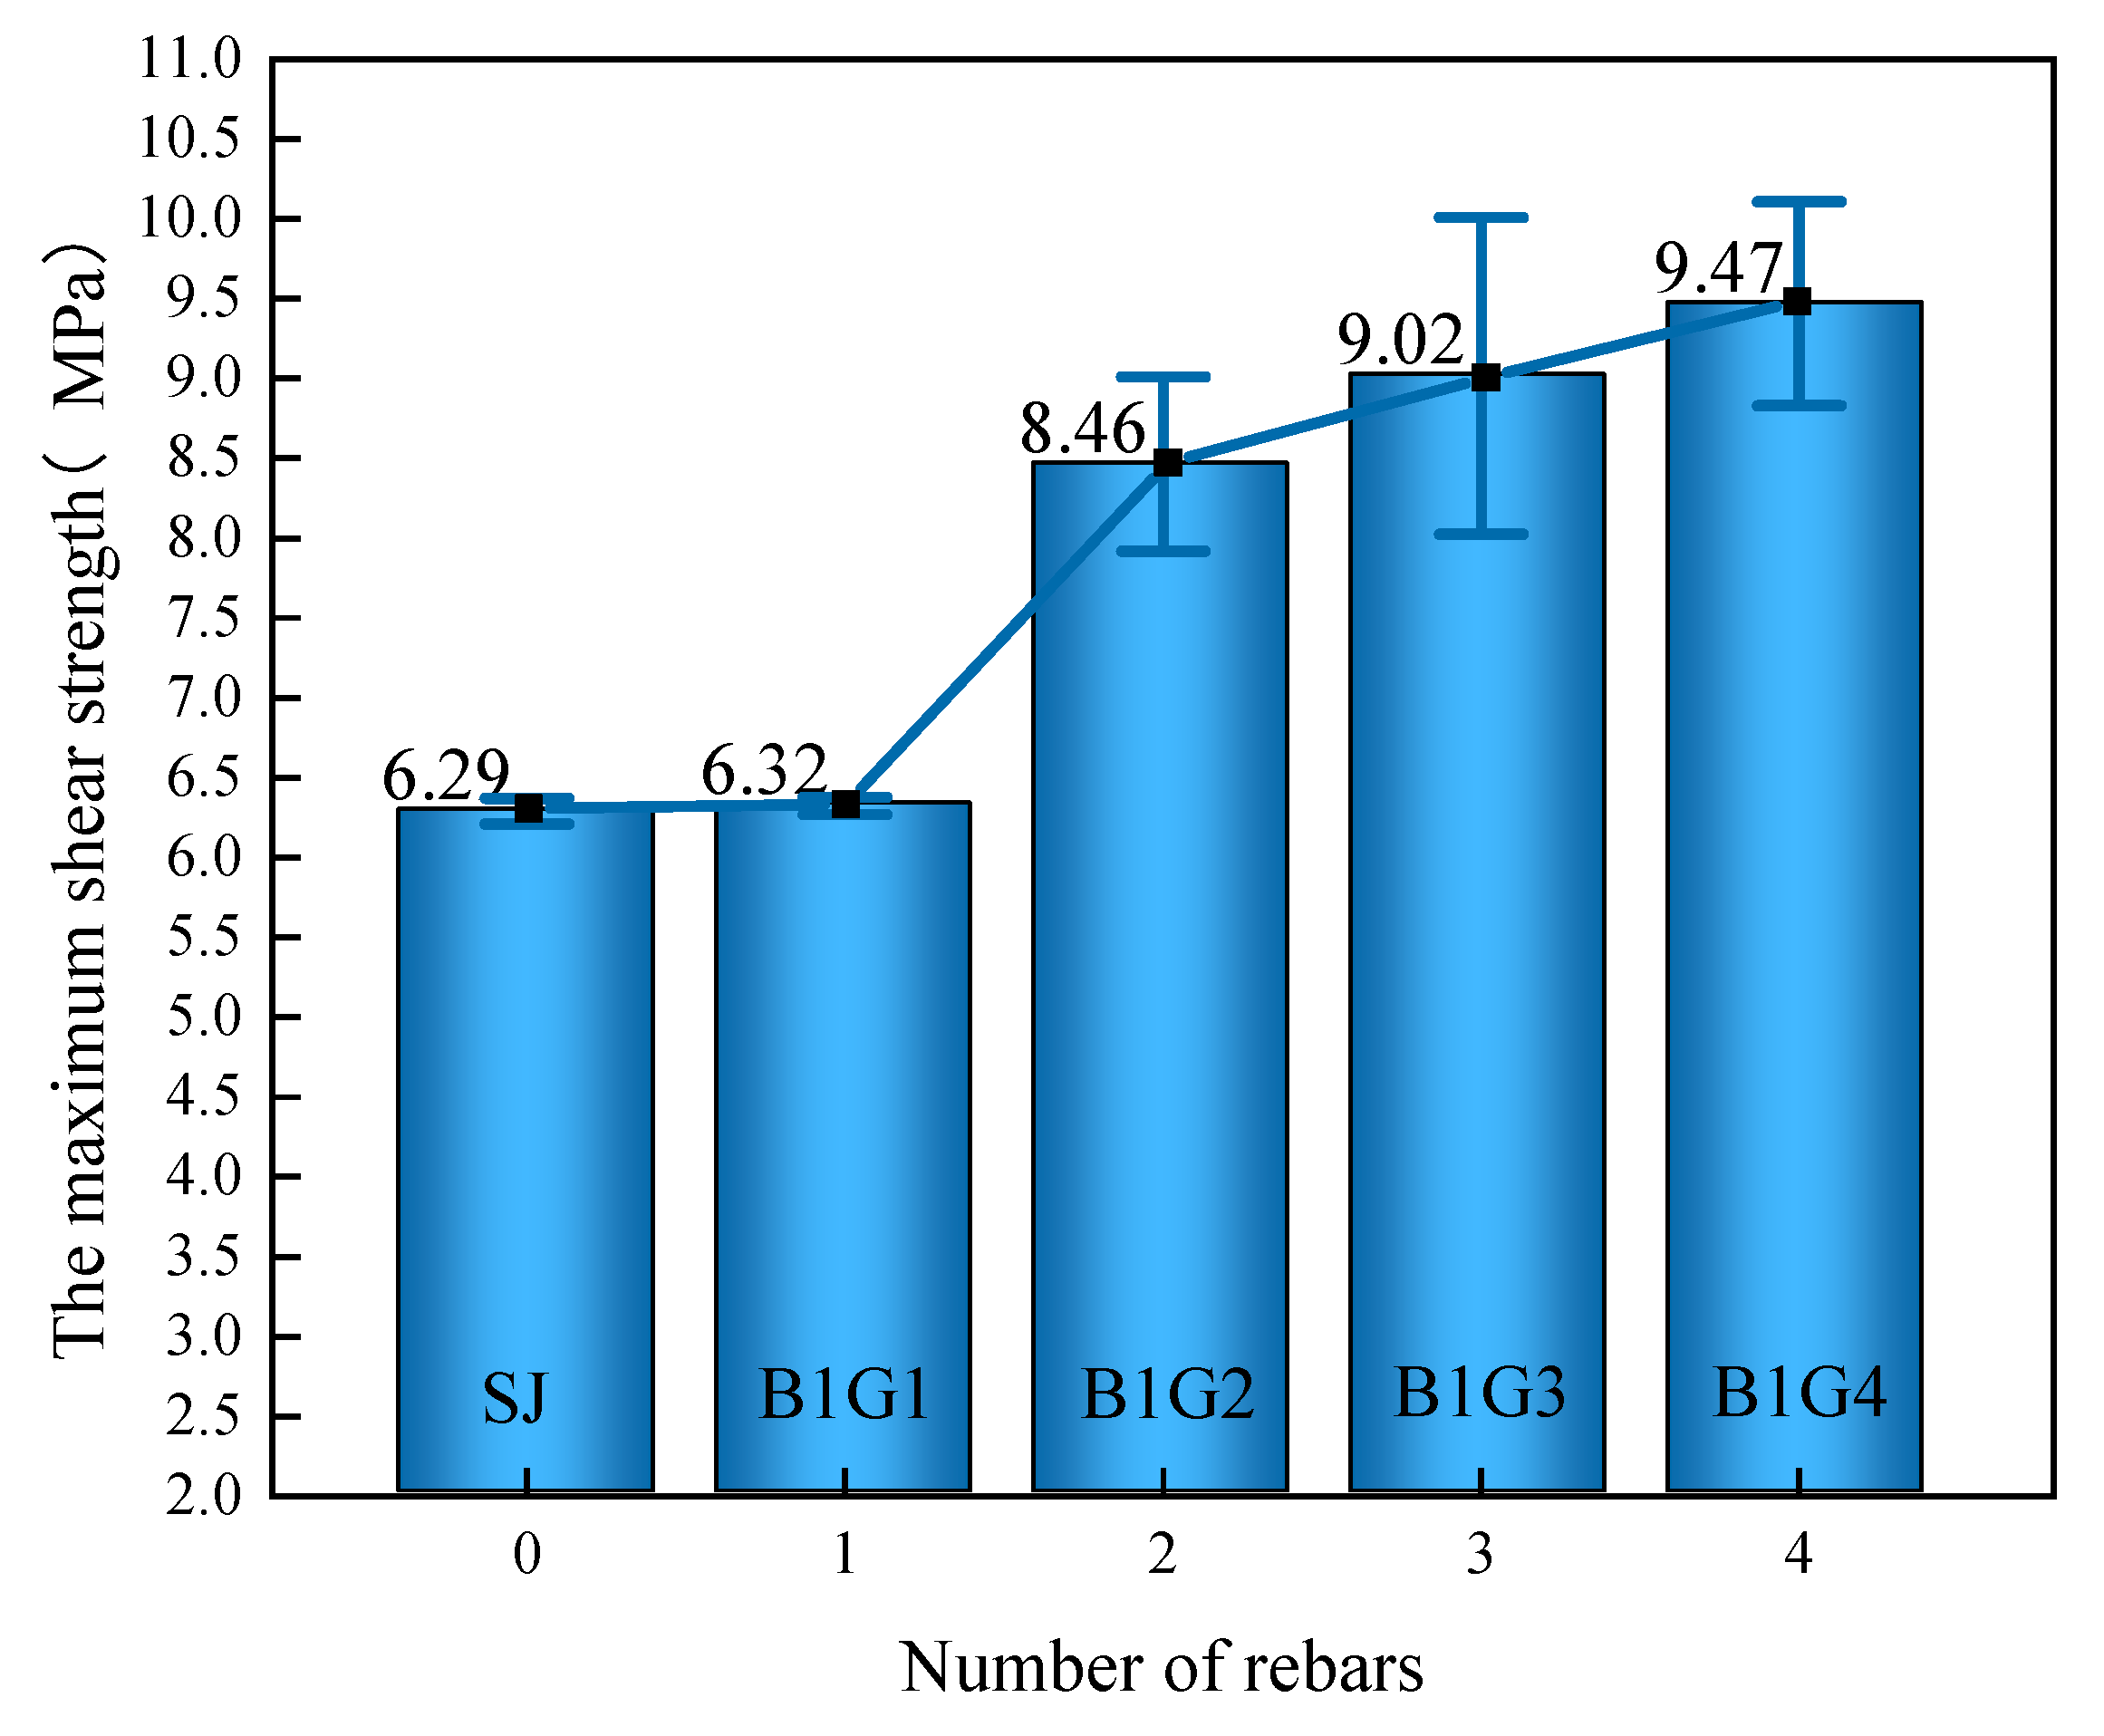
3.2. Shear Strength Analysis
- Number of rebars
- 2.
- Rebar diameter
- 3.
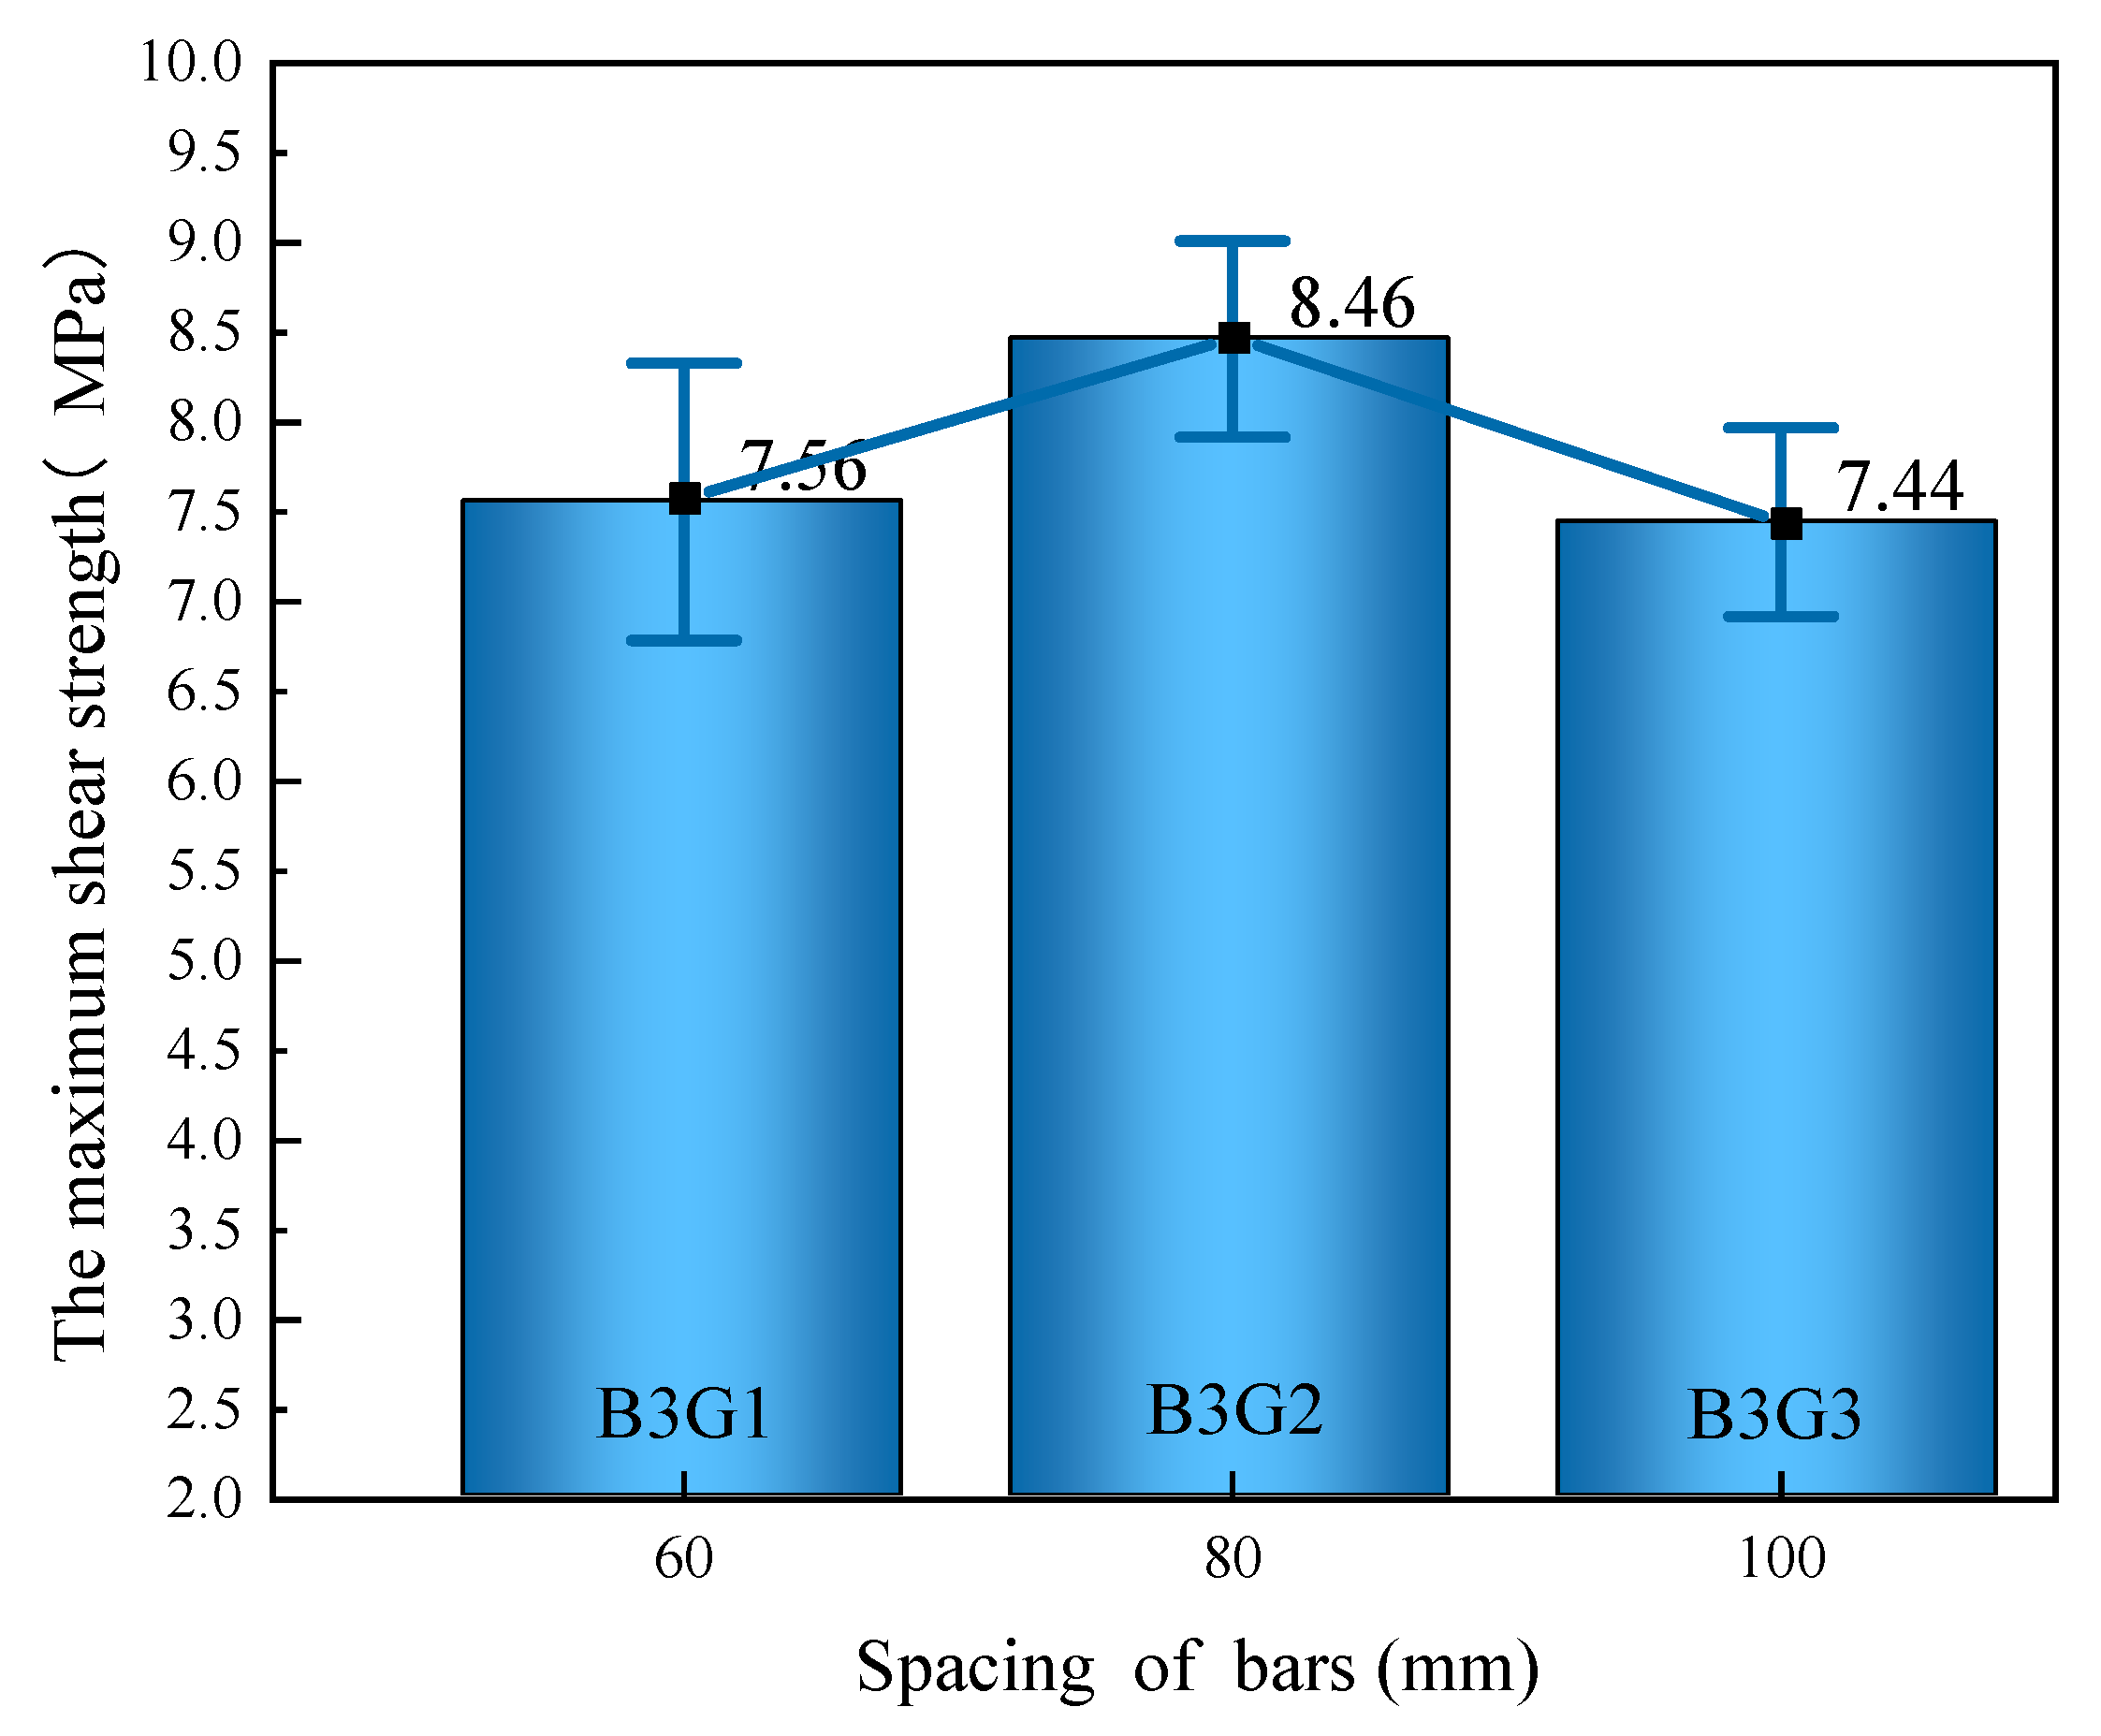
- Spacing of bars
3.3. One-Way ANOVA
- 4.
- Number of rebars
- 5.
- Rebar diameter
- 6.
- Spacing of the bars
- 7.
- Summary
4. Shearing Mechanism and Comparison of Results
4.1. Analysis of the Shear Resistance Mechanism
4.2. Analysis of the Application of Existing Shear Strength Calculation Formulae
5. Conclusions
- The form of shear damage at the unstrengthened FLWCC–OC interface was brittle damage. But the damage form becomes ductile after rebar implantation. This showed that rebar implantation could increase the ductility of the interface of FLWCC–OC.
- The rebar planting rate had a significant effect on the interfacial shear strength. The strength reached a maximum of 9.47 MPa when the rate was 0.894%. Rebar was not effective at low rates. The interfacial shear strength was positively correlated with the number of rebars, which increased and then decreased with the increase in rebar diameter. The number of rebars enhanced the shear strength better than the rebar diameter for the same planting rate.
- The shear strength was related to the spacing of the bars. In this test, the strength was maximum when the spacing was 80 mm. Too much or too little spacing affected the way the rebars transmitted force and thus the bonding action of the rebars.
- The one-way ANOVA was used to analyze the effects of the number of rebars, rebar diameter and spacing of the bars on the interfacial shear strength. The results showed that the most obvious effect of the number of rebars was followed by rebar diameter, and the effect of the spacing of the bars was less significant.
- The calculated strength of the Fib (2010) formula agreed well with the measured values in this text. It was recommended to refer to the Fib (2010) to calculate the interfacial shear strength of the rebar implantation when strengthening OC with FLWCC.
Author Contributions
Funding
Institutional Review Board Statement
Informed Consent Statement
Data Availability Statement
Conflicts of Interest
References
- Jin, W.; Zhao, Y. Durability of Concrete Structure.0s; Science Press: Beijing, China, 2014; Volume 34, pp. 13–24. (In Chinese) [Google Scholar]
- Ding, F.; Wu, X.; Xiang, P.; Yu, Z. New damage ratio strength criterion for concrete and lightweight aggregate concrete. ACI Struct. J. 2021, 118, 165–178. [Google Scholar]
- Shariati, M.; Ramlisulong, N.H.; Sinaei, H.; Arabnejad Khanouki, M.M.; Shafigh, P. Behavior of channel shear connectors in normal and light weight aggregate concrete (experimental and analytical study). Adv. Mat. Res. 2011, 168, 2303–2307. [Google Scholar] [CrossRef]
- Zheng, D.; Kou, J.; Wei, H.; Zhang, T.; Guo, H. Experimental study on flexural behavior of damaged concrete beams strengthened with high ductility concrete under repeated load. Eng. Struct. 2023, 274, 115203. [Google Scholar] [CrossRef]
- Chen, M.; Li, Z.; Wu, J.; Wang, J. Shear behaviour and diagonal crack checking of shale ceramsite lightweight aggregate concrete beams with high-strength steel bars. Constr. Build. Mater. 2020, 249, 118730. [Google Scholar] [CrossRef]
- Zhu, H.; Fu, Z.; Liu, P.; Li, Y.; Zhao, B. Shear behavior of stud-PBL composite shear connector for steel–ceramsite concrete composite structure. Coatings 2022, 12, 583. [Google Scholar] [CrossRef]
- Zhu, H.; Fu, Z.; Wang, Y.; Zhang, N. Study on splitting tensile strength of interface between the full lightweight ceramsite concrete and ordinary concrete. Case Stud. Constr. Mater. 2023, 18, e01829. [Google Scholar] [CrossRef]
- Guan, H.; Yu, J.; Umuhuza Kibugenza, A.; Sun, Q. Preparation of coal gangue ceramsite high-strength concrete and investigation of its physico-mechanical properties. Sci. Rep. 2022, 12, 16369. [Google Scholar] [CrossRef]
- Wu, X.; Yang, J.; Lin, H.; Wang, Q.; Cao, Z. Mechanical Properties and Damage Mechanism of Shale Ceramsite Concrete after High-Temperature Treatment. J. Mater. Civ. Eng. 2022, 34, 04022123. [Google Scholar] [CrossRef]
- Wang, S.; Yang, L.; Ma, X.; Mei, R.; Li, C.; Sun, Z. The formation of porous light ceramsite using Yellow River sediment and its application in concrete masonry production. Case Stud. Constr. Mat. 2022, 17, e1340. [Google Scholar] [CrossRef]
- Guan, H.; Xia, Y.; Zhang, S.; Wu, J.; Wang, J.; Wang, B. A theoretical axial stress–strain model for gangue ceramsite concrete confined with FRP tube. Constr. Build. Mater. 2022, 350, 128864. [Google Scholar] [CrossRef]
- Fang, Y.; Xu, Y.; Gu, R. Experiment and Analysis of Mechanical Properties of Lightweight Concrete Prefabricated Building Structure Beams. Int. J. Concr. Struct. Mater. 2022, 16, 5. [Google Scholar] [CrossRef]
- Zhu, H.; Chen, H.; Fu, Z.; Guo, Z.; Liu, P.; Chen, Y. Experimental Study on Axial Compressive Load-Bearing Performance of RC Short Columns Strengthened by All-Light Ceramsite Concrete. Appl. Sci. 2022, 12, 11206. [Google Scholar] [CrossRef]
- Wang, J.; Zhou, T.; Nie, S.; Zhang, X.; Shao, Y. Behavior of CFS shear walls infilled with lightweight ceramsite concrete under cyclic loading. Structures 2022, 45, 1833–1849. [Google Scholar] [CrossRef]
- Xie, J.; Zhao, J.; Wang, J.; Huang, P.; Liu, J. Investigation of the high-temperature resistance of sludge ceramsite concrete with recycled fine aggregates and GGBS and its application in hollow blocks. J. Build. Eng. 2021, 34, 101954. [Google Scholar] [CrossRef]
- Ma, S.; Gu, Y.; Bao, P. Seismic performance of ceramsite concrete T-shaped composite wallboard joints under cyclic loading. Structures 2021, 33, 4433–4445. [Google Scholar] [CrossRef]
- Cheng, M.; Ma, J. Experimental Study on Shear Behavior of the Interface between New and Old Concrete with Reinforced KSCE. J. Civ. Eng. 2018, 22, 1882–1888. [Google Scholar]
- Wang, X.; Dong, S.; Ashour, A.; Han, B. Bonding of nano inclusions reinforced concrete with old concrete: Strength, reinforcing mechanisms and prediction model. Constr. Build. Mater. 2021, 283, 122741. [Google Scholar] [CrossRef]
- Hoła, J.; Sadowski, Ł.; Reiner, J.; Stach, S. Usefulness of 3D interface roughness parameters for nondestructive evaluation of pull-off adhesion of concrete layers. Constr. Build. Mater. 2015, 84, 111–120. [Google Scholar] [CrossRef]
- Ouyang, J.; Guo, R.; Wang, X.; Fu, C.; Wan, F.; Pan, T. Effects of interface agent and cooling methods on the interfacial bonding performance of engineered cementitious composites (ECC) and existing concrete exposed to high temperature. Constr. Build. Mater. 2023, 376, 131054. [Google Scholar] [CrossRef]
- Du, G.; Xu, B.; Bu, L. Experimental study and numerical simulation of the interfacial bonding performance of ordinary concrete reinforced with reactive powder concrete. J. Build. Eng. 2022, 62, 105352. [Google Scholar] [CrossRef]
- Wang, Y.; Luo, W.; Zhou, X.; Shuai, F.; Ren, W.; Tan, J. Shear behaviour of a novel vertical grouting joint in precast concrete structure for wind turbines. Eng. Fail. Anal. 2023, 143, 106887. [Google Scholar] [CrossRef]
- Reis, E.; de Azevedo, R.; Christoforo, A.; Poggiali, F.; Bezerra, A. Bonding of steel bars in concrete: A systematic review of the literature. Structures 2023, 49, 508–519. [Google Scholar] [CrossRef]
- He, Y.; Zhang, X.; Hooton, R.; Zhang, X. Effects of interface roughness and interface adhesion on new-to-old concrete bonding. Constr. Build. Mater. 2017, 151, 582–590. [Google Scholar] [CrossRef]
- Tang, H.; Yang, Y.; Li, H.; Xiao, L.; Ge, Y. Effects of chloride salt erosion and freeze–thaw cycle on interface shear behavior between ordinary concrete and self-compacting concrete. Structures 2023, 56, 104990. [Google Scholar] [CrossRef]
- Tian, W.; Song, Z.; Xiao, C.; Zhu, R. Shear test and finite element simulation analysis of bonding interface of new and old concrete with planting bars. Build. Struct. 2019, 49, 127–133. (In Chinese) [Google Scholar]
- Yang, J.; Chen, R.; Zhang, Z.; Zou, Y.; Zhou, J.; Wang, W. Effects of planting bar parameters on the shear resistance of UHPC-stone interface. China Civ. Eng. J. 2022, 55, 62–78. (In Chinese) [Google Scholar]
- Jiang, Y.; Chen, H.; Nie, X.; Tao, M. Experimental study on bonding and anchorage of steel bars in precast concrete structures with new-to-old concrete interface. Eng. Struct. 2021, 247, 113086. [Google Scholar] [CrossRef]
- Costa, H.; Carmo, R.N.F.; Júlio, E. Influence of normal stress and reinforcement ratio on the behavior of LWAC interfaces. Constr. Build. Mater. 2018, 192, 317–329. [Google Scholar] [CrossRef]
- Goldyn, M.; Urban, T. Experimental Investigations on Interface between Ordinary and Lightweight Aggregate Concretes Cast at Different Times. Materials 2021, 14, 1664. [Google Scholar] [CrossRef]
- Cattaneo, S.; Zorzato, G.; Bonati, A. Assessing method of shear strength between old to new concrete interface under cycling loading. Constr. Build. Mater. 2021, 309, 125160. [Google Scholar] [CrossRef]
- GB/T 228.1-2021; Metallic Materials—Tensile Testing—Part 1: Method of Test at Room Temperature. State Administration for Market Reglation: Beijing, China, 2022; pp. 17–22. (In Chinese)
- GB 50367-2013; Code for Design of Strengthening Concrete Structure. Ministry of Housing and Urban-Rural Development of the People’s Republic of China: Beijing, China, 2014; pp. 7–11. (In Chinese)
- GBT50081-2019; Standard for Test Methods of Concrete Physical and Mechanical Properties. Ministry of Housing and Urban-Rural Development of the People’s Republic of China: Beijing, China, 2019; pp. 5–25. (In Chinese)
- Wang, Q.; Chen, H.; Lu, C.; Wang, C.; Qian, K. Seismic performance of precast concrete column with different longitudinal reinforcement diameters under different lateral loading directions. Eng. Struct. 2022, 266, 114536. [Google Scholar] [CrossRef]
- Jonak, J.; Siegmund, M.; Karpiński, R.; Wójcik, A. Three-Dimensional Finite Element Analysis of the Undercut Anchor Group Effect in Rock Cone Failure. Materials 2020, 13, 1332. [Google Scholar] [CrossRef] [PubMed]
- Abbas, H.; Mohammed, A.A.; Hussein, E.; Tarek, A.; Aref, A.; Yousef, A. Effect of tie spacing and GFRP rebar diameter on compression behavior of concrete columns. J. Build. Eng. 2023, 72, 106740. [Google Scholar] [CrossRef]
- Birkeland, P.W.; Birkeland, H.W. Connections in precast concrete construction. ACI J. Proc. 1966, 63, 345–368. [Google Scholar]
- Randl, N. Investigations on Transfer of Forces between New and Old Concrete at Different Joint Roughness. Ph.D. Thesis, University of Innsbruck, Innsbruck, Austria, 1997. Available online: https://www.concrete.org/publications/internationalconcreteabstractsportal/m/details/id/7627 (accessed on 1 June 2023).
- Santos, P.M.D.; Júlio, E.N.B.S. A state-of-the-art review on shear-friction. Eng. Struct. 2012, 45, 435–448. [Google Scholar] [CrossRef]
- Huang, L.; Zhuo, W.; Gu, Y.; Shangguan, P.; Huang, X. Effect test of interface agent on bonding of new and old concrete. J. Fuzhou Univ. (Nat. Sci. Ed.) 2018, 46, 396–402. (In Chinese) [Google Scholar]
- CEB-FIP. Fib Model Code for Concrete Structures; Ernst & Sohn: Berlin, Germany, 2010. [Google Scholar]
- AASHTO. AASHTO LRFD Bridge Design Specifications; American Association of State Highway and Transportation Officials: Washington, DC, USA, 2010. [Google Scholar]
- ACI Committee 318. Building Code Requirement for Structural Concrete (ACI 318-08) and Commentary (ACI 318R-08); American Concrete Institute: Detroit, MI, USA, 2008. [Google Scholar]
- JTG/T J22-2008; Specifications for Strengthening Design of Highway Bridges. China Communications Press: Beijing, China, 2015. (In Chinese)


| Type of Aggregate | Particle Size (mm) | Volume Density (kg/m3) | Apparent Density (kg/m3) | Compressive Strength of Concrete Cylinder (MPa) | Water Absorption in 1 h (%) | Mud Content | Fineness Modulus |
|---|---|---|---|---|---|---|---|
| Ordinary crushed stone | 5~20 | 814 | 2688 | 6.8 | 2.42 | / | / |
| Ceramsite pellets | 5~20 | 896 | 1553 | 9.7 | 6.3 | / | / |
| Ordinary river sand | / | 890 | 2641 | / | / | ≤2 | 3.5 |
| Ceramsite sand | / | 1570 | 1479 | / | / | ≤2 | 2.7 |
| Type of Cement | Code Number | Density (g/cm3) | Mineral Composition of Clinker | Fineness (%) | |||
|---|---|---|---|---|---|---|---|
| C3S | C2S | C3A | C3AF | Margin of 80 μm Square Sieve | |||
| Ordinary silicate cement | P.O. 42.5 | 3.15 | 45 | 25 | 12 | 8 | 6.5 |
| Appearance Color | PH Value | Specific Gravity | Solid Content (%) | Water Reducing Ratio (%) |
|---|---|---|---|---|
| Pale yellow | 6~8 | 1.08 ± 0.02 | 40 | 25~35 |
| Category | Yield Strength (MPa) | Ultimate Strength (MPa) | Modulus of Elasticity (MPa) |
|---|---|---|---|
| HRB 400 | 435.5 | 671 |
| Cement | Coarse Aggregates | Fine Aggregate | Water-Reducing Agent | Water |
|---|---|---|---|---|
| 605 | 1050 | 565 | / | 230 |
| 550 | 620 | 600 | 5.1 | 154 |
| Types of Concrete | Cube Compressive Strength (MPa) | Axial Compressive Strength (MPa) | Modulus of Elasticity (GPa) |
|---|---|---|---|
| LC50 | 53.66 | 46.53 | 3.067 |
| C45 | 35.31 | 27.28 | 3.043 |
| Specimen Number | Number of Rebars | Rebar Planting Rate (%) | Spacing of Bars (mm) | Rebar Diameter (mm) | Anchorage Depth (mm) | Interface Roughness (mm) | Interface Agents | Number of Specimens |
|---|---|---|---|---|---|---|---|---|
| CZJ | / | / | / | / | / | / | / | 3 |
| SJ | / | / | / | / | / | 2–3 | cement paste | 3 |
| B1G1 | 1 | 0.223 | C8 | 80 | 10 d | 2–3 | cement paste | 3 |
| B1G2 | 2 | 0.447 | C8 | 80 | 10 d | 2–3 | cement paste | 3 |
| B1G3 | 3 | 0.670 | C8 | 80 | 10 d | 2–3 | cement paste | 3 |
| B1G4 | 4 | 0.894 | C8 | 80 | 10 d | 2–3 | cement paste | 3 |
| B2G1 | 2 | 0.251 | C6 | 80 | 10 d | 2–3 | cement paste | 3 |
| B2G2 | 2 | 0.447 | C8 | 80 | 10 d | 2–3 | cement paste | 3 |
| B2G3 | 2 | 0.698 | C10 | 80 | 10 d | 2–3 | cement paste | 3 |
| B3G1 | 2 | 0.447 | C8 | 60 | 10 d | 2–3 | cement paste | 3 |
| B3G2 | 2 | 0.447 | C8 | 80 | 10 d | 2–3 | cement paste | 3 |
| B3G3 | 2 | 0.447 | C8 | 100 | 10 d | 2–3 | cement paste | 3 |
| Group Number | Shear Load/kN | /MPa | Average Shear Strength/kN | Strength Gain Rate/% | |
|---|---|---|---|---|---|
| CZJ | 252.35 | 11.22 | 11.22 | ||
| 256.90 | 11.42 | / | / | ||
| 247.80 | 11.01 | ||||
| SJ | 139.80 | 6.21 | 6.29 | ||
| 143.25 | 6.37 | 1 | 0 | ||
| 141.53 | 6.29 | ||||
| B1G1 | 142.30 | 6.32 | 6.32 | ||
| 143.60 | 6.38 | 1.005 | 0.5 | ||
| 141.00 | 6.27 | ||||
| B1G2 | 188.30 | 8.37 | 8.46 | ||
| 179.35 | 7.97 | 1.345 | 34.5 | ||
| 203.60 | 9.05 | ||||
| B1G3 | 181.30 | 8.06 | 9.02 | ||
| 201.45 | 8.95 | 1.434 | 43.4 | ||
| 225.90 | 10.04 | ||||
| B1G4 | 196.65 | 8.74 | 9.47 | ||
| 218.75 | 9.72 | 1.505 | 50.5 | ||
| 223.65 | 9.94 | ||||
| B2G1 | 142.23 | 6.32 | 6.32 | ||
| 141.01 | 6.27 | 1.005 | 0.5 | ||
| 143.45 | 6.38 | ||||
| B2G2 | 188.30 | 8.37 | 8.46 | ||
| 179.35 | 7.97 | 1.345 | 34.5 | ||
| 203.60 | 9.05 | ||||
| B2G3 | 147.40 | 6.55 | 7.46 | ||
| 168.50 | 7.49 | 1.185 | 18.5 | ||
| 187.40 | 8.33 | ||||
| B3G1 | 155.50 | 6.91 | 7.56 | ||
| 165.35 | 7.35 | 1.202 | 20..2 | ||
| 189.30 | 8.41 | ||||
| B3G2 | 188.30 | 8.37 | 8.46 | ||
| 179.35 | 7.97 | 1.345 | 34.5 | ||
| 203.60 | 9.05 | ||||
| B3G3 | 154.65 | 6.87 | 7.44 | ||
| 177.75 | 7.90 | 1.184 | 18.4 | ||
| 170.10 | 7.56 |
| Source of Variance | Calculated Formula | Value | ||
|---|---|---|---|---|
| Number of Rebars (Factor A) | Rebar Diameter (Factor B) | Spacing of Bars (Factor C) | ||
| Correction | 830.17 | 494.77 | 550.53 | |
| Total sum of square | 20.81 | 9.07 | 4.21 | |
| Sum of effect squares | 17.42 | 6.88 | 1.88 | |
| Error sum of squares | 3.39 | 2.19 | 2.34 | |
| Total degree of freedom | 11 | 8 | 8 | |
| Effect square and degree of freedom | 3 | 2 | 2 | |
| Error square and degree of freedom | 8 | 6 | 6 | |
| Mean squared sum of effects | 5.81 | 3.44 | 0.94 | |
| Mean square sum of errors | 0.42 | 0.36 | 0.39 | |
| Statistic | 13.72 ** | 9.43 * | 2.41 | |
| Checklist | 7.59 | 10.90 | 10.90 | |
| Checklist | 4.07 | 5.14 | 5.14 | |
| Group Number | Number of Rebars | Level | − 9.47| | − 9.02| | − 8.46| | |
|---|---|---|---|---|---|---|
| B1G1 | 1 | A1 | 6.32 | 3.14 * | 2.69 * | 2.14 ** |
| B1G2 | 2 | A2 | 8.46 | 1.00 | 0.55 | |
| B1G3 | 3 | A3 | 9.02 | 0.45 | ||
| B1G4 | 4 | A4 | 9.47 |
| Group Number | Rebar Diameter | Level | − 6.32| | − 7.46| | |
|---|---|---|---|---|---|
| B2G1 | C8 | B2 | 8.46 | 2.14 ** | 1.00 |
| B2G2 | C10 | B3 | 7.46 | 1.14 | |
| B2G3 | C6 | B1 | 6.32 |
| Specification | Calculation Formula | Annotation |
|---|---|---|
| Fib Model Code for Concrete Structures (2010) [42] | ) | τa, c—Interface cohesion μ—Interface friction coefficient ρ—Bonding rate of interface σn—Normal stress caused by interface shear k1—Bending coefficient k2—Interaction coefficient between steel bar and concrete under dowel action fy—Tensile strength of rebar fc—Axial compression strength of concrete Asv, Avf—Total cross-sectional area of interfacial shear rebar Acv—Interfacial area Pc—Positive interface pressure caused by external force |
| AASHTO LRFD Bridge Design Specifications (2010) [43] | ||
| ACI 318-08 (2008) [44] |
Disclaimer/Publisher’s Note: The statements, opinions and data contained in all publications are solely those of the individual author(s) and contributor(s) and not of MDPI and/or the editor(s). MDPI and/or the editor(s) disclaim responsibility for any injury to people or property resulting from any ideas, methods, instructions or products referred to in the content. |
© 2023 by the authors. Licensee MDPI, Basel, Switzerland. This article is an open access article distributed under the terms and conditions of the Creative Commons Attribution (CC BY) license (https://creativecommons.org/licenses/by/4.0/).
Share and Cite
Zhu, H.; Duan, Y.; Li, X.; Zhang, N.; Chen, J. Effect of Planting Rebars on the Shear Strength of Interface between Full Lightweight Ceramsite Concrete and Ordinary Concrete. Coatings 2023, 13, 1622. https://doi.org/10.3390/coatings13091622
Zhu H, Duan Y, Li X, Zhang N, Chen J. Effect of Planting Rebars on the Shear Strength of Interface between Full Lightweight Ceramsite Concrete and Ordinary Concrete. Coatings. 2023; 13(9):1622. https://doi.org/10.3390/coatings13091622
Chicago/Turabian StyleZhu, Hongbing, Yixue Duan, Xiu Li, Na Zhang, and Jingyi Chen. 2023. "Effect of Planting Rebars on the Shear Strength of Interface between Full Lightweight Ceramsite Concrete and Ordinary Concrete" Coatings 13, no. 9: 1622. https://doi.org/10.3390/coatings13091622
APA StyleZhu, H., Duan, Y., Li, X., Zhang, N., & Chen, J. (2023). Effect of Planting Rebars on the Shear Strength of Interface between Full Lightweight Ceramsite Concrete and Ordinary Concrete. Coatings, 13(9), 1622. https://doi.org/10.3390/coatings13091622