Abstract
Eu-doped periodic mesoporous organosilicate (PMO) films with terminal methyl and ethylene bridging groups have been synthesized using sol-gel technology and spin-coating, employing evaporation-induced self-assembly (EISA), on silicon wafers. Eu doping is achieved by the dissolution of Eu(NO3)3·6H2O in the precursor solution. The deposited films are characterized using Fourier transform infrared (FTIR) spectroscopy, ellipsometric porosimetry (EP), X-ray photoelectron spectroscopy (XPS) and photoluminescence spectroscopy. It is observed that Eu doping reduces the concentration of terminal methyl groups, makes the films more hydrophilic and reduces the pore size and open porosity. The reduction reaction Eu3+ → Eu2+ occurs in the pores of organosilicate glass (OSG) films, which was confirmed by the depth profiling XPS. Eu3+ was still present on the top surface of the films. The presence of Eu3+ and Eu2+ gives luminescence emission in the range of 600–630 nm (Eu3+) and 290–400 nm (Eu2+). The Eu2+/Eu3+ concentrations ratio depends on CH3 groups concentration in the films. The concentration of Eu2+ ions in the pores can be reduced by exposure to inductively coupled (ICP) oxygen plasma. The observed shift in the luminescence spectra towards the UV region, in comparison to previously reported Eu-doped organosilicate films, can be attributed to the energy transfer occurring between the host material and Eu2+ ions.
1. Introduction
Eu-doped materials are significant contenders for utilization in Si photonics, encompassing the production of light sources and optical amplifiers [1]. The advantage of Eu-doped materials stems from their ability to accommodate two distinct oxidation states (Eu3+ and Eu2+), setting them apart from other commonly employed rare earth ions in photonics, such as Erbium (Er) or Ytterbium (Yb), which remain stable solely in the trivalent oxidation state [2,3,4]. A specific prerequisite involves the utilization of Eu-containing host materials that are compatible with complementary metal-oxide semiconductor (CMOS) processing. The most straightforward approach that has been adopted entails incorporating Eu ions as dopants into a silicon oxide matrix [5,6].
However, the effectiveness of this approach is significantly hindered by the limited solubility of Eu in the SiO2 matrix, resulting in extensive clustering and precipitation phenomena [7,8]. Thus, the primary challenge for utilizing Eu in photonics lies in finding a host matrix that can be synthesized and processed in accordance with Si technology, while also being capable of accommodating high concentrations of optically active Eu ions and enabling control over the Eu oxidation state. Previous research conducted by Bellocchi et al. [2,3,9] has demonstrated that a SiOC matrix (carbon-doped oxide) possesses favorable chemical properties, allowing for the efficient promotion of the reduction of Eu3+ to Eu2+, and structural properties that enhance the mobility and solubility of Eu ions, consequently minimizing Eu precipitation. Eu3+ and Eu2+ ions can function as highly effective emitting centers in the visible region. Eu2+ ions demonstrate a remarkably strong emission resulting from dipole-allowed 4f65d → 4f7 transitions. The intra 4f-shell transition of Eu3+ ions, being electric dipole-forbidden, results in a less intense luminescence [10,11]. It is well-established that the positions of emission bands of Eu2+ are highly dependent on the host materials. In crystalline materials, the wavelength of photoluminescence (PL) emission is strongly influenced by the crystal field splitting of the 5d excited level. As the covalency between Eu2+ and ligands increases, the emission peak shifts towards longer wavelengths. For instance, in halide hosts, the shift occurs towards the near-violet to blue region due to the presence of highly electronegative halogen ions. However, in nitrides, the shift occurs at longer wavelengths due to the lower electronegativity of the N3− ions [12,13].
SiOC films (also termed as organosilicate glass films) have extensive use in CMOS technology as low dielectric constants (low-k) for advanced interconnects. When combined with low resistivity metals (Cu, Co, Ru), they help to reduce the signal propagation delay in the interconnects of ultra-large-scale integration (ULSI) devices [14]. The majority of SiOC films employed in the microelectronics industry are deposited using PECVD (plasma-enhanced chemical vapor deposition) processes. These films exhibit random porosity and have a silica-like (SiO2-like) matrix structure, but some bridging oxygen atoms are substituted with terminal methyl groups to maintain the hydrophobic nature of the films [15]. This is motivated by the fact that even a small amount of adsorbed water molecules can significantly elevate the dielectric constant and leakage current, while also diminishing the breakdown field. Currently, the interconnects developing community is increasingly focusing on periodic mesoporous organosilicates (PMOs). These materials are primarily deposited using sol-gel technology, due to its capability for precisely controlling chemical composition. PMOs exhibit ordered porosity and may use a wide variety of carbon bridges within their matrix [16,17,18]. The main advantage of these materials is improved mechanical properties, which potentially increase the reliability of integrated devices [15,19,20]. However, carbon bridging groups alone cannot provide sufficient hydrophobicity, and this is the reason why PMO materials developed for microelectronics application must also contain terminal methyl groups. The coexistence of carbon bridging and methyl terminal groups imparts distinctive properties to these materials, setting them apart from conventional PMO materials that solely feature carbon bridging. Low-k materials find widespread utility in the backend-of-the-line (BEOL) structures. Therefore, the inclusion of Eu-doped PMO films showcases notable potential in the context of nanophotonic devices and optical interconnects, rendering them suitable for integration within ULSI systems.
It is important to note that various bulk PMO materials with diverse organic bridges have already been investigated as potential hosts for Eu and other rare-earth (RE) metals. The significant findings have been examined and consolidated in the review paper [21]. However, the distinctive characteristic of our materials lies in their thin film nature and the simultaneous presence of carbon bridges and methyl terminal groups.
Hence, our focus has been on investigating the potential of periodic mesoporous organosilicate (PMO) low-k films as host materials for rare-earth metals. Our aim is to analyze the chemical and structural modifications of PMO films upon the incorporation of metal (Eu) ions and to compare the luminescent properties of these materials with those of previously reported SiOC and SiO2 films. Specifically, the objective of this study is to examine thin porous PMO films containing both ethylene bridges and methyl terminal groups, incorporating Eu ions.
2. Materials and Methods
2.1. Materials
PMO films were synthesized using the sol-gel method by spin-on deposition on silicon wafers. The method involves acid-catalyzed hydrolysis and polycondensation processes [16]. The carbon sources used were 1,2-bis(trimethoxysilyl)ethane (BTMSE, 96%, Sigma-Aldrich, Darmstadt, Germany) monomer (as the source of ethylene groups) and methyltrimethoxysilane (MTMS, 98%, Fluka, Buchs, Switzerland) monomer (as the source of terminal methyl groups). These precursors ensured the presence of ≡Si–(CH2)2–Si≡ and ≡Si–CH3 groups, respectively, in the resulting polymers, as the bridging ethylene and terminal methyl groups do not undergo hydrolysis. A surfactant (porogen) called Brij30 (C12H25(OCH2OCH2)4OH with a molecular weight of 362 g/mol, Sigma-Aldrich) was used to facilitate the evaporation induced self-assembly (EISA [22]) process and obtain a porous structure. The molar ratio of BTMSE/MTMS/deionized water was 0.47/0.53/3.087, and a little amount of 0.0053 M HCl was added as a catalyst. The prepared solution was stirred and aged for ~12 h at 60 °C and then stored for 24 h at room temperature (RT) before spin coating the PMO films. The matrix solution was divided into four parts and the different weight percent (wt%) of Brij30 surfactant (0, 10, 20 and 30 wt%) was added into four solutions and stirred. Those films were labeled as pristine PMO films. Then, the different amounts (0.0, 1.7, 12.1 and 25.8 wt%) of Eu(NO3)3·6H2O precursor powder were added into the four stored solutions for spin coating of Eu-doped PMO films, respectively. The appropriate proportion of ethanol as solvent was also used before coating the films. The final coating solution was used to deposit films on 150 mm diameter silicon wafers (1–10 Ω·cm) with a spin coater at an acceleration rate of 500 rpm for 5 s and a spinning rate of 4500 rpm for 30 s. After deposition, the films were cured on the hot plate at 150 °C for 40 min in air (soft bake (SB) to remove solvents), and the final curing was performed at 400 °C, 20 min in air (hard bake (HB) to remove template (porogen)) and produce the final porous films (Figure 1).
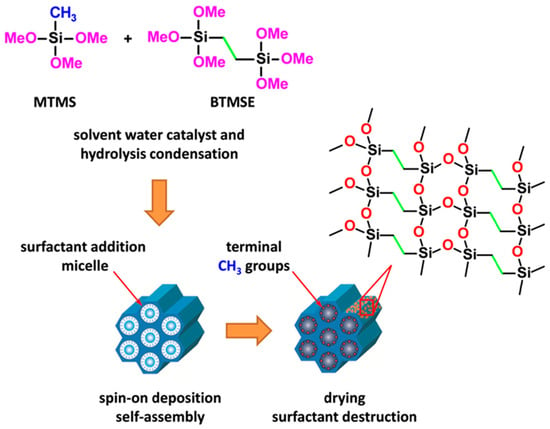
Figure 1.
Schematic presentation of PMO material with ethylene bridging and methyl terminal groups fabricated with co-polymerization of MTMS and BTMSE and EISA deposition technology (host material).
The deposited host PMO films exhibit well-defined porosity that depends on the template concentration. These films contain ethylene bridges within their matrix and methyl terminal groups, which primarily localized on the pore wall surface after thermal curing [18]. The formation of these hybrid films is based on the hydrolysis and condensation of MTMS and BTMSE precursors. The host and Eu doped films were subjected to comparative analysis using different instrumentations as outlined below.
2.2. Characterization Methods
2.2.1. Fourier-Transform Infrared (FTIR) Spectroscopy
FTIR spectra were used to study the chemical composition of the films. The spectra were obtained by using FTIR, JASCO FT/IR-6300, scanned 64 times in transmission mode with a resolution of 4 cm−1 and a measurement wavenumber range of 4000–400 cm−1. The wavenumber accuracy and maximum resolution were within ±0.01 cm−1 and 0.07 cm−1, respectively. The high-intensity ceramic source light source, a gold 28° Michelson interferometer with an auto-alignment mechanism and a Ge/KBr beam splitter with signal to-noise ratio of 50,000:1 was used for the measurements. The background spectra were obtained by using a pure silicon (1–10 Ω·cm) sample cut from the same wafer that was used for the film deposition. After performing background subtraction by using peak analyzer of Origin 2019b software, all the spectra were normalized to the highest Si–O–Si peak.
2.2.2. Ellipsometric Porosimetry (EP)
In this work, the EP system used a SENpro spectroscopic ellipsometer with SpectraRay/4 software for data analysis (SENTECH, Berlin, Germany) with λ = 350–850 nm. Atmospheric pressure ellipsometric porosimetry was used to evaluate the porosity and pore size distribution [23,24]. The angle of light incidence was fixed at 70°. Heptane vapor diluted by N2 carrier gas was used as an adsorptive. The open porosities of the films were calculated as the volume of condensed liquid adsorptive (V) from the RI values measured during the heptane adsorption by using the Lorentz–Lorenz equation. The calculation of the pore size of the mesoporous film was based on the Kelvin equation. The size of the micropores was calculated by using the Dubinin–Radushkevich equation adapted for EP [21].
2.2.3. X-ray Photoelectron Spectroscopy (XPS)
XPS analysis was performed using a PHI 5300 (PerkinElmer, Fremont, CA, USA) to investigate the point (500 µm) depth profile of OSG films under UHV conditions at a base pressure of 5 × 10⁻⁸ torr during the operation. The samples were transported in an inert gas environment prior to the insertion into the XPS machine, and exposure to air was reduced to a minimum. The experiments were performed with a monochromated Al Kα radiation source (E = 1.487 keV). Photoelectron detection was conducted with a constant analyzer energy (CAE) analyzer and a 2D delay-line detector as well as with a standard lens mode. An electron flood gun was utilized during measurements to compensate for surface charging. The peaks of individual components (C, O, Eu, Si) and survey scan were measured at a pass energy of 20 eV and 100 eV, respectively. Survey scans were conducted in the 0–1100 eV range. Peaks were fitted using the Origin 2019b software by Gaussian functions.
2.2.4. Photoluminescence Spectroscopy (PL)
The UV induced luminescence spectra of pristine and Eu-doped PMO films were measured by FP-8300 spectrofluorometer (JASCO, Tokyo, Japan) by using a continuous output Xe arc lamp with shielded lamp housing (150 W) and holographic concave grating in a modified Rowland mount monochromator. The Radio-photometer system using monochromatic light was used to monitor the intensity output of the Xe lamp. The samples were mounted in a standard cell holder (10 mm rectangular cell holder) SCE-846/D061161450 provided by JASCO. The wavelength accuracy and maximum resolution is 1 nm. The excitation was used from 200 nm (6.2 eV) under room temperature; the emission spectra ranged in wavelength from 210 nm to 500 nm and slit width was 5 nm–5 nm. The measurements were fully controlled by using a Spectra Manager. The excitation and detector collection bandwidths were both 5 nm with a scan speed of 1000 nm/min.
3. Results
3.1. Chemical Composition (FTIR Data)
The FTIR spectra of fully cured (porosity-25%, pore size-1.04 nm) Eu-doped (0–25.8 wt%) OSG films are shown in Figure 2 and Figure 3. The observed absorption bands correspond to hydroxyl and silanol groups and adsorbed water (3700–3000 cm−1), hydrocarbons (3000–2800 cm−1), Si–CH3 (1300–1250 cm−1)) and Si–O–Si (1250–1000 cm−1) [25]. The pristine films (0 wt% Eu) almost do not show the presence of Si–OH and adsorbed water at 3700–3000 cm−1 (Figure 2 and Figure 3a). The introduction of Eu decreased the concentration of the CH3 group (3000–2950 cm−1) and Si–CH3 groups (1300–1250 cm−1) (Figure 2 and Figure 3b,c). As expected, in accordance with extensive previous experience [15,16], a reduction in the concentration of CH3 groups resulted in increased hydrophilicity of the films. In instances involving porous films, the inner pore surfaces become more hydrophilic, and the presence of condensed water molecules is discerned through the application of FTIR spectroscopy. The reduction in the concentration of CH3 (and Si–CH3) groups primarily occurred in the films deposited with 1.7 wt% of Eu(NO3)3·6H2O. Further increases in Eu concentration showed insignificant effects. It is observed that the highest hydrophilicity (highest amount of adsorbed water) corresponds to a moderate Eu concentration of 12.1%. Conversely, the film doped with 25.8 wt% of Eu(NO3)3·6H2O adsorbed less water molecules than both the 1.7 wt% and 12.1 wt% Eu-doped films. Additionally, there are less pronounced features, including an increase in the concentration of CH2 groups in the sample doped with 25.8 wt% of Eu(NO3)3·6H2O (Figure 3b, region 2850–2930 cm−1, which may suggest detachment of some of the hydrogen atoms from CH3 groups or reflect the formation of hydrocarbon residues [26]). A slight red shift in the Si–O–Si peak is also observed (Figure 3c).
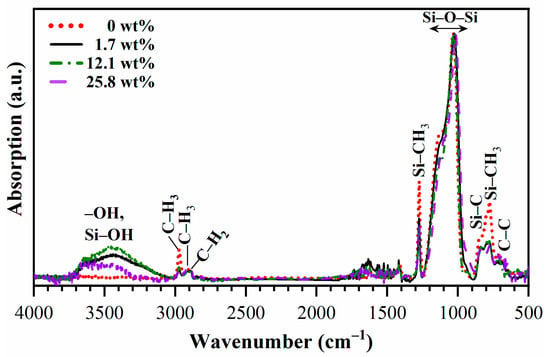
Figure 2.
FTIR survey spectra of Eu-doped PMO films deposited with a BTMSE/MTMS precursors ratio of 47/53 and porogen concentrations 20 wt% after hard bake (HB) at 400 °C for 30 min in the air. The 0, 1.7, 12.1 and 25.8 wt% are the weight % of Eu(NO3)3·6H2O in precursor solution. All spectra are normalized to Si–O–Si peak intensity.
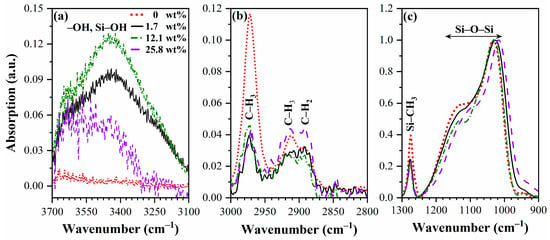
Figure 3.
Zoom of FTIR spectra in the regions: (a) to Si–OH/water (3100–3700 cm−1), (b) CHx groups (2800–3000 cm−1), (c) Si–O–Si (900–1200 cm−1) and Si–CH3 (1240–1300 cm−1). The 0, 1.7, 12.1 and 25.8 wt% are the weight % of Eu(NO3)3·6H2O in precursor solution. All spectra are normalized to Si–O–Si peak intensity.
3.2. Porosity and Pore Size Distribution
Figure 4 shows the adsorption–desorption isotherms of heptane vapor measured by EP and the calculated pore size distribution of different Eu-doped OSG films. The films with 0 wt% Eu concentration show isotherms without a hysteresis loop and an open porosity equal to 25%. Eu introduction reduces the open porosity to 14% (25.8 wt.% of Eu(NO3)3·6H2O) (Figure 4a,d). The corresponding changes in refractive indices (RI) during adsorption were as follows: 1.33–1.43 (0 wt%); 1.32–1.43 (1.7 wt%); 1.32–1.4 (12.1 wt%); 1.34–1.41 (25.8 wt%). These changes indicate that the initial RI values reflecting the full porosity [21,22] remain unchanged. If we assume that the skeleton (matrix) of an un-doped film has an RI close to 1.46 (dense SiO2), we can calculate that the full porosity is equal to 25.5%, which is very close to the open porosity of un-doped films (Table 1). Therefore, it is reasonable to assume that the reduction in open porosity is related to the “blocking” of some open pores against the heptane adsorption (Figure 5), while the change in the full porosity is very small. Furthermore, the isotherms observed for samples 3 and 4 exhibit characteristic signs typical of narrow slit-shaped pores (type H4 isotherm in Refs. [27,28], Figure 4c,d, P/Po > 0.2). Specifically, the presence of narrow slit-shaped pores indicates an initial stage of pore blocking. The reduction in pore size and the internal surface area of bulk (not thin films) PMO materials after grafting by the rare earth (RE) metals has already been observed and reported in the papers [29,30]. The pore-blocking effect becomes more pronounced with an increase in Eu concentration, and this phenomenon likely contributes to the decrease in the amount of moisture adsorbed from the air as the Eu precursor concentration rises from 1.7 to 25.8 wt%.
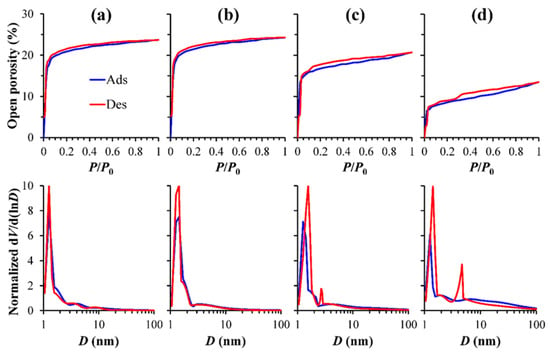
Figure 4.
Adsorption–desorption isotherms and pore size distribution of (a) 0 wt%, (b) 1.7 wt%, (c) 12.1 wt% and (d) 25.8 wt% Eu-doped in the 25% porosity (20 wt% Brij30) OSG films.

Table 1.
The most important characteristics of PMO films used in these experiments.
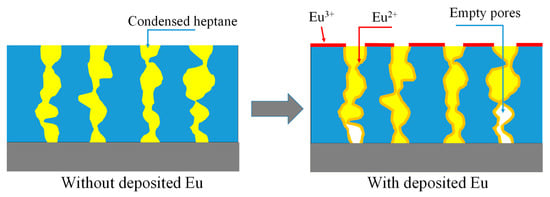
Figure 5.
In the pristine film (left), the full porosity is equal to the open porosity (Table 1) because all the pores are interconnected for heptane adsorption. However, after Eu deposition, some parts of the pores become inaccessible to heptane adsorption (parts of 1 and 4 pores). This reduces the measured open porosity while the full porosity remains the same as in the pristine film.
3.3. X-ray Photoelectron Spectroscopy Analysis (XPS)
The XPS measurements were performed only for the 25.8 wt% Eu doped PMO films deposited with a BTMSE/MTMS ratio equal to 47/53 and a 13%open porosity (Table 1). It is shown that the deposited films are mainly composed of C, O, Si and Eu (Figure 6). Figure 6a clearly illustrates the presence of Eu3+ on the film top surface (not etched sample) [31]. To analyze the depth profile of the components, the low-k films were etched using a focused ion beam with a rate of approximately 17 nm/min. The Eu3+/Eu2+ ratio during the etching already drastically decreases after 61 s etch that corresponds to 17 nm. Further etching has almost no change on this ratio (Figure 6 and Figure 7). These data confirm that Eu3+ was only present on the top surface of the film while only Eu2+ was present in the bulk of the film. Some differences between the surface and bulk properties of the film can also be seen in oxygen XPS spectra (Figure 6b). The film surface is characterized by the presence of an O 1s peak located below 530 eV but this peak disappears after ion beam etch and O 1s is only represented by the peak with energy of about 532 eV. The first peak is most probably related to surface contamination by carbon, as was suggested in Ref. [32]. The peaks position of Si 2P and C 1s is typical for organosilicate based low-k materials [33] and does not change during the depth profiling. However, the film surface also exhibits enrichment of these components, which could indicate surface contamination (Figure 6c,d).
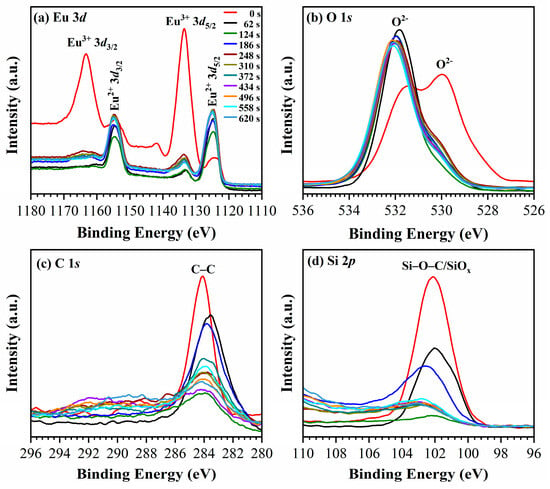
Figure 6.
The XPS spectra show the comparison between the 25.8 wt% Eu-doped nanoporous OSG film (20 wt% Brij30 sample) deposited on a Si substrate (red curve) and the film after undergoing stepped ion beam etching for a duration ranging from 62 to 620 s.
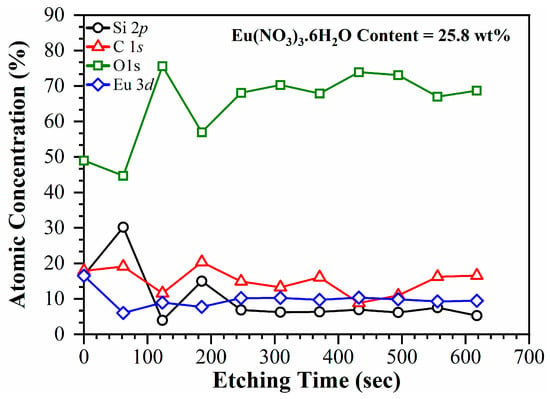
Figure 7.
The atomic concentration profile of the components in the 25.8 wt% Eu-doped nanoporous OSG films plotted as a function of ion-beam etching time.
The distribution of Eu within the low-k film is uniform, with a concentration of approximately 10 atomic percent (at%). The surface region exhibits a higher concentration of Eu, approximately 17 at%. The dopant concentration was determined based on the weight percentage (wt %) of Eu(NO3)3·6H2O in the precursor mixture. The estimations of the Eu ion concentration in the film components from the precursors indicate that 25.8 wt% of Eu(NO3)3·6H2O corresponds to 10 at% of Eu ions in the films. For detailed calculations and estimations, please refer to the Supplementary Materials.
3.4. UV-Induced Luminescence
The photoluminescence spectra of 0 wt% Eu (pristine) and 12.1 wt% Eu-doped soft bake (SB) and hard bake (HB) nanoporous OSG films are shown in Figure 8. The pristine sample (fully cured) shows a single PL peak located near 300 nm (4.2 eV), which is related to the presence of a methyl terminal group and a carbon residue [34]. Thermal curing enhances the intensity of photoluminescence and broadens the emission spectra. Furthermore, in the PL region, the peaks display a duplicated structure, characterized by distinct peaks around 290 nm, 314 nm and 348 nm (Figure 8b). The peak at 290 nm coincides with the matrix luminescence. One notable characteristic is that in all previous publications discussing luminescence from SiO2 and SiOC materials doped with Eu2+, the PL peaks were consistently found at longer wavelengths, typically within the range of 400–500 nm.
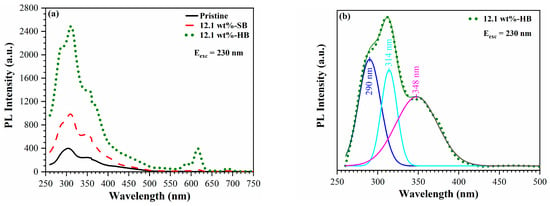
Figure 8.
(a) Photoluminescence spectra of 0 wt% Eu (pristine), 12.1 wt% Eu-doped soft bake (SB) and 12.1 wt% hard bake (HB) OSG films. (b) Deconvolution of the broad peak in the 250–500 nm region. The emission spectrum of OSG films were obtained with an excitation wavelength of 230 nm.
The peaks located in the region of 580–720 nm are well known and they are related to emission of Eu3+ ions (Figure 8a and Figure 9) and the electronic transitions 5D0–7F1 (589 nm), 5D0–7F2 (615 nm) and 5D0–7F4 (689 nm) [35,36,37,38]. The SB samples show much less intensive photoluminescence in comparison with the HB samples. The primary explanation is associated with the presence of residual solvent impurities and adsorbed moisture in the SB samples. Numerous reports have highlighted the significance of internal quenching through hydroxide (OH–) impurities and surface quenching via surface hydroxyl groups [39,40]. Additionally, it is observed that thermal annealing enhances the PL intensity and triggers PL emissions within the 580–720 nm range. This effect is directly influenced by the annealing temperature, with the highest intensity observed after a rigorous bake at 400 °C (Figure 9).
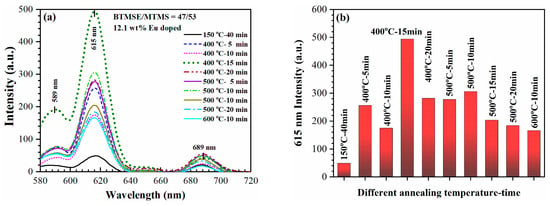
Figure 9.
(a) Dependence of the PL intensity of Eu3+ (580–720 nm) on annealing temperature for 12.1 wt% Eu-doped films and (b) the dependence of the maximum PL intensity at 615 nm for different annealing temperature-time.
The PL quenching mechanism involves energy transfer from excited Eu atoms to the surface hydroxyl groups incorporated due to water adsorption. The importance of PL quenching related to the presence of moisture impurities can also be clearly seen in temperature dependence (Figure 9a,b). The maximum PL intensity is observed in the sample annealed at 400 °C. Based on microelectronics experience, it is known that this temperature is sufficient for removing porogen and adsorbed moisture. Therefore, it is used as the final curing temperature for low-k films [41,42]. However, contrary to other Eu-doped silica and PMO materials, further increasing the temperature reduces the PL intensity of our material. The reason for this is that our material also contains methyl terminal groups that have limited temperature stability, particularly close to 500 °C.
Figure 10 also shows that the PL intensity in this region depends on the Eu concentration. First it increases with an Eu concentration 0–12.1 wt%, then drops at 25.8 wt%. It is known that a high concentration of Eu doping reduces the distance between Eu ions, stimulating the non-radiative relaxation process and leading to cross relaxation between neighbouring Eu ions, which results in a decrease in luminescence efficiency [43,44]. Practical fluorescence quenching, caused by the aggregation of Eu3+, becomes evident in silica glass when the Eu content exceeds 1% (molar ratio) [45]. In our study, fluorescence quenching occurs at a higher Eu concentration due to the significantly larger internal surface area of mesoporous organosilicate films. Figure 11 demonstrates the dependence of the photoluminescence intensity on the wavelength of the excited light. The highest PL intensity is observed when the excitation wavelength is 230 nm, which aligns with previously reported data [34].
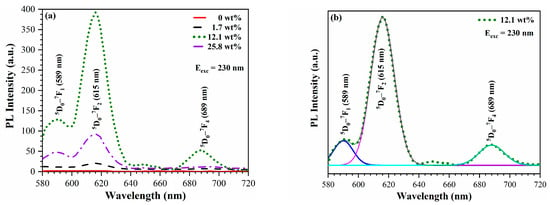
Figure 10.
(a) Eu3+ photoluminescence intensity for different Eu(NO3)3·6H2O concentrations in the precursor Sol (wt%) upon excitation with light of 230 nm. (b) Deconvolution of the PL spectra of the sample deposited with 12.1 wt% of Eu(NO3)3·6H2O to peaks corresponding to well-known 5D–7F transitions in Eu3+.
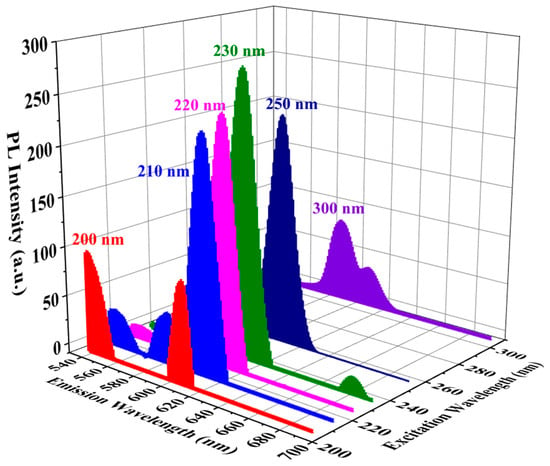
Figure 11.
Dependence of PL intensity on wavelength of excited UV light. The maximum PL intensity is observed at 230 nm excitation wavelength.
Effect of Oxygen Plasma
Figure 12 shows the effect of exposure to inductively coupled (ICP) oxygen plasma [46]. The red curve shows the PL spectra of a Eu doped sample that was stored in air several days after deposition. The spectra clearly show the PL of Eu3+ (580–720 nm) and Eu2+ (250–500 nm). The PL emission from Eu2+ exhibits well-pronounced peaks near 300 and 350 nm and is more than an order of magnitude more intense than the PL from Eu3+. Exposure to oxygen plasma results in a reduction in PL emission from Eu2+ and an increase in PL from Eu3+. This observation strongly suggests that the Eu2+ ions formed during the process undergo oxidation by the oxygen plasma. However, the depth of penetration of oxygen radicals from the plasma into the pores of low-k materials is limited and influenced by various factors, including radical concentration, pore size, and the chemical groups that are consuming the radicals [47]. In the case of pristine low-k films, the consumption of oxygen radicals is primarily associated with terminal CH3 groups. However, in the present scenario, the oxygen radicals are also consumed in the oxidation of Eu2+ ions. The decrease in photoluminescence intensity in the 330–250 nm range suggests that the fraction of oxidized Eu2+ ions does not exceed 50%, indicating that the depth of modification was approximately 250 nm (total film thickness is about 500 nm).
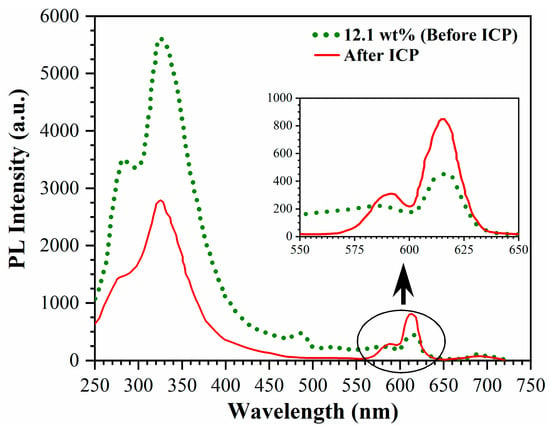
Figure 12.
Effect of ICP oxygen plasma on PL intensity of Eu3+ and Eu2+ upon excitation with light of 230 nm. Inset shows the zoom PL spectra of the 550–650 nm region.
4. Discussion
Eu, in our case, was introduced into the film’s precursor in its trivalent state as Eu(NO3)3·6H2O before deposition. However, the XPS results clearly demonstrate that Eu3+ ions are exclusively present on the top surface of PMO films, while only Eu2+ are observed inside the film. The coexistence of Eu3+ and Eu2+ significantly enhances the total photoluminescence (PL) intensity and extends the spectral range even into the ultraviolet (UV) region. The reduction of Eu3+ in porous materials (or in the matrix of dense materials) has been extensively studied and reported in the literature. Numerous mechanisms have been proposed for different materials (see, for instance, Refs. [48,49,50]).
According to literature analysis, in the case of silica-based materials that are most suitable for integration in ULSI devices, the potential mechanisms under consideration can be divided into two distinct directions. One of the popular explanations for the reduction of Eu3+ to Eu2+ in silica-based porous materials being the impact of ejected electrons from oxygen-associated hole centers. Zaitoun et al. [51,52] studied the luminescence properties of Eu3+ encapsulated in sol-gel-derived optically transparent silica gels using time-resolved laser spectroscopy. It was proposed that the electron-hole carriers, e−–h+, were generated during the polycondensation reaction of silica and trapped at the defect sites of the sol-gel matrix. The formation of the e−–h+ carrier was proposed to be responsible for the surface-assisted reduction of Eu3+ ions, where the ejected electrons from the oxygen-associated hole centers react with Eu3+ to produce Eu2+ ions. This mechanism was later extended to other materials [53]. An alternative mechanism for the internal reduction of Eu3+ to Eu2+, which is related to the formation of atomic vacancies, has been proposed. This can be seen, for instance, in Ref. [54].
However, many papers also consider more chemical mechanisms of Eu3+ reduction by reducing agents. Numerous papers explain Eu3+ reduction by interaction with certain types of reduction groups present in the matrix. The reduction of Eu3+ to Eu2+ was observed in silica based films co-doped with Al and B and other metals when the films were annealed in a reducing atmosphere (N2/H2) at T > 400 °C [55,56,57,58]. The reduction of Eu3+ by carbon-containing groups present in SiOC low-k films was proposed in the works of Boninelli et al. [2,3,9], but the detailed redox mechanism was not presented. The formation of Eu silicate (EuSiO3) has been proposed as the final product of Eu3+ reduction. The last mechanism might be most similar for our PMO material because it contained similar carbon groups, as in the case of SiOC films.
The host materials employed in this study were deposited as PMO films with well-defined porosity. These films contained ethylene bridges within their matrix and methyl terminal groups, which primarily localized on the pore wall after thermal curing (Figure 1) [18]. This characteristic sets PMO films apart from SiOC films deposited by sputtering of SiO2 and SiC targets [3,9] as well as via PECVD [15]. To introduce Eu doping into the PMO films, the film precursor was mixed with Eu(NO3)3·6H2O. However, this compound normally undergoes hydrolysis in water solutions, forming hydroxides EuO(OH) and Eu(OH)3 [59]. Eu ions (or Eu hydroxides) are expected to be randomly distributed throughout the matrix in the as-deposited films. Then, the films undergo two steps of thermal annealing at 150 °C (soft bake) and 400 °C (hard bake). Normally, in the case of low-k films (host material), this thermal treatment provides structural rearrangement leading to the enhancement of mechanical properties [41]. Our observations allow for us to conclude that Eu compounds segregate onto the pore wall surface during the structural rearrangement initiated by thermal treatment. There are two facts that support this conclusion. The first one is that Eu doping only changes the open porosity, while the internal film structure (full porosity) remains the same as in the host materials (Figure 4 and Figure 5, Table 1). The second fact is based on the data pertaining to the exposure to oxygen plasma. It can be deduced that oxygen radicals exclusively oxidize Eu2+ ions that are located on the surface of the pores. This limitation arises due to the radicals’ inability to diffuse into the dense film matrix. Conversely, the emission spectrum remains unaltered following exposure to oxygen plasma (see Figure 12). Consequently, these findings support our hypothesis that the Eu2+ ions in the fully cured films were located on the surface of the pore walls.
Additionally, Eu doping resulted in a decrease in the concentration of CH3 groups. Similar to previous publications [2,3,9], the key role of carbon in carbon-doped oxide (SiOC) can be inferred. It can also be assumed that methyl groups play a critical role in reducing Eu3+ to Eu2+. A slight increase in the concentration of CH2 groups (Figure 3b) may suggest that the destruction of CH3 groups starts with the detachment of hydrogen atom, which can already play an important role in the Eu3+ reduction to Eu2+. The mechanism for the complete detachment of methyl groups is most probably similar to so called low temperature carbothermal reduction, but can also involve reactions with hydroxyl groups introduced by Eu hydroxide. Finally, one can assume that Eu2+ is located on the pore wall and forms surface compounds where the surface Si atom in terminated by the Eu atom instead of CH3. The formation of such compounds can explain the observed red shift in –Si–O–Si– peak in FTIR spectra (Figure 3c), since the Eu atom replacing CH3 is more electropositive. The replacement of CH3 groups by Eu makes the internal surface more susceptible to water adsorption (Figure 2). The possibility of the formation of Eu silicates in SiO2 film and Si substrate has also been proposed [60,61,62,63,64].
In terms of providing a more comprehensive explanation for the reaction mechanism, it is important to note that this is a complex task that falls outside the scope of our current work. The reactions of Eu3+ reduction are taking place on the surfaces of pores with an approximate diameter of 1 nm. Moreover, the pore size remains mostly unaffected during the introduction of Eu, resulting in the creation of two-dimensional “products”. As a result, the conventional models derived from volumetric reaction analysis have limited applicability in this context. An illustrative example of such a reaction is the formation of thin barrier films (ranging from 1 to 3 nm) composed of Mn on the surfaces of organosilicate-based low-k materials, which find extensive application in microelectronics [65,66]. These barrier layers have been extensively investigated using techniques such as XPS, X-ray diffraction (XRD) and electron energy loss spectroscopy (EELS). It has been proposed that the resulting reaction products exhibit properties akin to manganese carbide and silicate. The formation of Mn-Si-O type groups at the interface has also been observed [67,68]. The notion of metal silicates forming within 1–3 nm thin layers might seem improbable. In our specific case, the porosimetry results indicate that the layer of reaction products is less than 1 nm in thickness. Consequently, it is more plausible to conceive of this layer as the termination of surface dangling bonds achieved through the presence of Eu atoms. To confirm the important role of methyl groups in the formation of Eu2+ ions, experiments were carried out with different concentrations of methyl groups. All the experiments discussed so far were conducted with PMO films deposited with a BTMSE/MTMS ratio of 47/53. However, one special experiment was performed with a film deposited with a BTMSE/MTMS ratio of 27/75. This MTMS-rich mixture was expected to produce a film with a much higher concentration of methyl groups. The results of the photoluminescence (PL) study on these samples are presented in Figure 13.
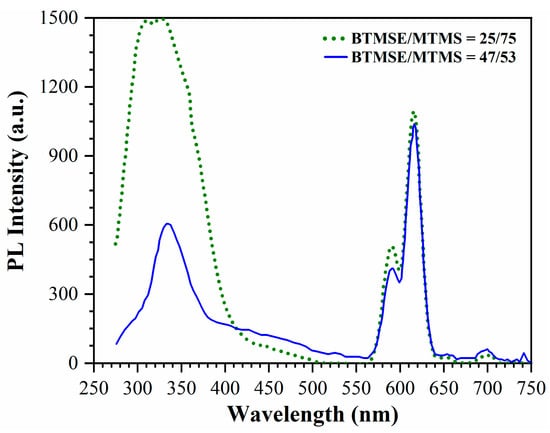
Figure 13.
PL spectra of PMO films deposited with BTMSE/MTMS ratio 47/53 (solid line) and 25/75 (dotted line) upon excitation with light of 230 nm.
The first important observation is that the intensity of the peaks related to Eu3+ are the same in both cases. This is to be expected because the concentration of Eu3+ depends solely on the concentration of Eu(NO3)3·6H2O introduced into the precursor solution and is independent of the BTMSE/MTMS ratio. Therefore, the amount of Eu3+ deposited on the top surface should be the same, as observed in Figure 13. However, the situation is different for the broad peak in the 275–400 nm region. The intensity of this peak was much higher in the film deposited with a BTMSE/MTMS ratio of 25/75. This indicates that the concentration of Eu2+, which is likely responsible for this emission, increased with the concentration of CH3 groups. It is worth mentioning that Eu2+ aqueous solution in air is known to be unstable, as it can be completely oxidized within 24 h to form Eu3+ [38,62]. Therefore, Eu2+ is not formed in the precursor solution but rather in the already formed film. It forms relatively stable molecules that can only be oxidized by oxygen radicals generated in the ICP oxygen plasma.
The final question pertains to the position of the broad peak associated with the formation of Eu2+. It has been suggested that the emission of Eu2+ in different compounds can vary from UV to blue wavelengths [11,69]. Most silica-based compounds containing Eu2+, such as xerogel, SiOC and PMO, exhibit photoluminescence in the blue light range with a maximum located near 450 nm. However, in our case, the photoluminescence was shifted towards lower wavelengths.
Based on our findings, we can hypothesize the presence of an energy transfer mechanism whereby the highly efficient absorption properties of our PMO film in the short wavelength range are utilized to transfer excitation energy to the Eu2+ ions. This energy transfer mechanism enhances the photoluminescence (PL) efficiency of the Eu2+ ions when excited at shorter wavelengths. This hypothesis is further supported by the observation in Figure 8b, where one of the three deconvoluted peaks is located at the same wavelength as the host material but exhibits a higher efficiency than the pristine material. Consequently, this energy transfer mechanism results in an overall increase in the PL efficiency of both the Eu2+ ions and the PMO matrix.
5. Conclusions
Eu-doped organosilicate glass films were synthesized using sol-gel technology and EISA-based self-assembling deposition on Si wafers. The EISA approach has allowed for us to achieve the pore ordering and these materials are termed periodic mesoporous organosilicates (PMO). The Eu doping was achieved by dissolving Eu(NO3)3·6H2O in precursor solutions based on 1,2-bis(trimethoxysilyl)ethane (BTMSE) (as the source of ethylene groups) and methyltrimethoxysilane (MTMS) mixtures, enabling the formation of both ethylene bridges in the film matrix and methyl terminal groups on the pore wall surface. The utilization of both carbon bridges and methyl terminal groups is a popular approach in microelectronics technology for producing low-k films with enhanced mechanical properties and hydrophobicity. The deposited films were characterized using Fourier transform infrared (FTIR) spectroscopy, ellipsometric porosimetry, X-ray photoelectron spectroscopy (XPS), and photoluminescence spectroscopy. By using FTIR spectroscopy and ellipsometric porosimetry, it was demonstrated that the Eu doping made the films internal surface more susceptible to the accumulation of adsorbed moisture, thus enhancing their hydrophilic nature. Furthermore, this doping led to a reduction in pore size and open porosity within the films. The reduction from Eu3+ to Eu2+ occurred within the pores of the OSG films, as confirmed by depth profiling XPS. Eu3+ was found only on the top surface of the films. The presence of both Eu3+ and Eu2+ resulted in a characteristic luminescence emission in the range of 600–630 nm (Eu3+) and 300–400 nm. The ratio of Eu2+/Eu3+ concentrations depended on the concentration of CH3 groups in the films. Furthermore, the concentration of Eu2+ ions within the pores could be reduced through oxidation during exposure to inductively coupled plasma (ICP) oxygen plasma.
One intriguing observation is the shift of the photoluminescence (PL) spectra towards the low wavelength region (290–400 nm) in comparison to other Eu-doped silica-based materials such as xerogel, sputter-deposited SiOC and PMO, which show luminescence in the range of 400–500 nm. This shift is likely attributed to the effects of energy transfer occurring between the host materials and the Eu2+ ions. While we currently lack sufficient data to fully elucidate the mechanism of energy transfer between the PMO matrix and Eu2+, it is worth noting that the ability to shift the PL spectra towards the UV/blue region using well-defined silica-based materials holds significant importance in the development of light sources with controllable spectra.
Finally, it has been demonstrated that low dielectric constant films made from PMO and used in the interconnect structures of ultra-large-scale integration (ULSI) devices can be doped with Eu (Europium) during the film deposition process. After the final curing, these films contain Eu3+ ions on the top surface and Eu2+ ions within the pores. The formation of both divalent and trivalent Eu ions allows for the generation of intense photoluminescence spanning from the UV to the red region of the spectrum. As a result, these Eu-doped layers show great promise as potential candidates for the development of nanophotonic structures integrated into the back-end-of-the-line architecture of ULSI devices.
Supplementary Materials
The following supporting information can be downloaded at: https://www.mdpi.com/article/10.3390/coatings13091656/s1, Estimations of atomic concentration of Eu (at% of Eu).
Author Contributions
Conceptualization, M.R.B.; data curation, M.R., J.Z. (Jing Zhang) and A.S.V.; formal analysis, M.R. and J.Z. (Jinming Zhang); funding acquisition, A.S.V., J.Z. (Jing Zhang) and M.R.B.; investigation, M.R.B.; methodology, M.R., J.Z. (Jinming Zhang) and A.S.V.; project administration, J.Z. (Jing Zhang) and M.R.B.; resources, J.Z. (Jing Zhang); supervision, J.Z. (Jing Zhang) and M.R.B.; validation, M.R., J.Z. (Jinming Zhang), A.S.V. and M.R.B.; visualization, M.R.; writing: original draft, M.R. and M.R.B.; writing: review and editing, M.R., A.S.V. and M.R.B. All authors have read and agreed to the published version of the manuscript.
Funding
This research was funded by the R&D Program of Beijing Municipal Education Commission, grant number KZ202210009014. The APC was funded by the R&D Program of the Beijing Municipal Education Commission and by Russian Science Foundation, grant number 23–79–30016.
Institutional Review Board Statement
This study did not require ethical approval.
Informed Consent Statement
Not applicable.
Data Availability Statement
The data presented in this study are available on request from the corresponding author.
Acknowledgments
It is our pleasure to thank S. Naumov (IOM Leipzig), A. Kabansky (LAM Research), A. Rybaltovsky and Yu. Mankelevich (Moscow State University) for their valuable discussions and advice.
Conflicts of Interest
The authors declare no conflict of interest.
References
- Zhou, Z.; Yin, B.; Michel, J. On-chip light sources for silicon photonics. Light Sci. Appl. 2015, 4, e358. [Google Scholar] [CrossRef]
- Boninelli, S.; Bellocchi, G.; Franzò, G.; Miritello, M.; Iacona, F. New strategies to improve the luminescence efficiency of Eu ions embedded in Si-based matrices. J. Appl. Phys. 2013, 113, 143503. [Google Scholar] [CrossRef]
- Bellocchi, G.; Fabbri, F.; Miritello, M.; Iacona, F.; Franzò, G. Multicolor Depth-Resolved Cathodoluminescence from Eu-Doped SiOC Thin Films. ACS Appl. Mater. Interfaces 2015, 7, 18201–18205. [Google Scholar] [CrossRef] [PubMed]
- Gallis, S.; Nikas, V.; Kaloyeros, A.E. Silicon Oxycarbide Thin films and Nanostructures: Synthesis, Properties and Applications. In Modern Technologies for Creating the Thin-Film Systems and Coatings; InTech: Vienna, Austria, 2017. [Google Scholar]
- Prucnal, S.; Sun, J.M.; Skorupa, W.; Helm, M. Switchable two-color electroluminescence based on a Si metal-oxide-semiconductor structure doped with Eu. Appl. Phys. Lett. 2007, 90, 181121. [Google Scholar] [CrossRef]
- Nazarov, A.N.; Tiagulskyi, S.I.; Tyagulskyy, I.P.; Lysenko, V.S.; Rebohle, L.; Lehmann, J.; Prucnal, S.; Voelskow, M.; Skorupa, W. The effect of rare-earth clustering on charge trapping and electroluminescence in rare-earth implanted metal-oxide-semiconductor light-emitting devices. J. Appl. Phys. 2010, 107, 123112. [Google Scholar] [CrossRef]
- Rebohle, L.; Lehmann, J.; Prucnal, S.; Kanjilal, A.; Nazarov, A.; Tyagulskii, I.; Skorupa, W.; Helm, M. Blue and red electroluminescence of Europium-implanted metal-oxide-semiconductor structures as a probe for the dynamics of microstructure. Appl. Phys. Lett. 2008, 93, 071908. [Google Scholar] [CrossRef]
- Li, D.; Zhang, X.; Jin, L.; Yang, D. Structure and luminescence evolution of annealed Europium-doped silicon oxides films. Opt. Express 2010, 18, 27191. [Google Scholar] [CrossRef] [PubMed]
- Bellocchi, G.; Franzò, G.; Boninelli, S.; Miritello, M.; Cesca, T.; Iacona, F.; Priolo, F. Structural and luminescence properties of undoped and Eu-doped SiOC thin films. IOP Conf. Ser. Mater. Sci. Eng. 2014, 56, 012009. [Google Scholar] [CrossRef]
- Blasse, G.; Grabmaier, B.C. Luminescent Materials; Springer: Berlin/Heidelberg, Germany, 1994; ISBN 978-3-540-58019-5. [Google Scholar]
- Gaft, M.; Reisfeld, R.; Panczer, G. Interpretation of Luminescence Centers. In Modern Luminescense Spectroscopy of Minerals and Materials, Springer Mineralogy; Springer International Publishing: Cham, Switzerland, 2015; pp. 221–420. [Google Scholar] [CrossRef]
- Kumar, G.B.; Raoa, B.V.; Babub, B.C.; Hungerford, G.; Nandyala, S.H.; Santos, J.D. Luminescence and Energy Transfer Phenomena in Lanthanide Ions Doped Phosphor and Glassy Materials; Nandyala, S.H., Ed.; Materials Research Forum LLC.: Warrendale, PA, USA, 2017; pp. 159–189. [Google Scholar]
- Stojadinović, S.; Vasilić, R. Eu2+ photoluminescence in Al2O3 coatings obtained by plasma electrolytic oxidation. J. Lumin. 2018, 199, 240–244. [Google Scholar] [CrossRef]
- Ho, P.S.; Leu, J.; Lee, W.W. Overview on Low Dielectric Constant Materials for IC Applications. In Low Dielectric Constant Materials for IC Applications; Ho, P.S., Leu, J.J., Lee, W.W., Eds.; Springer Series in Advanced Microelectronics; Springer: Berlin/Heidelberg, Germany, 2003; Volume 9. [Google Scholar] [CrossRef]
- Grill, A.; Gates, S.M.; Ryan, T.E.; Nguyen, S.V.; Priyadarshini, D. Progress in the development and understanding of advanced low k and ultralow k dielectrics for very large-scale integrated interconnects—State of the art. Appl. Phys. Rev. 2014, 1, 011306. [Google Scholar] [CrossRef]
- Volksen, W.; Miller, R.D.; Dubois, G. Low Dielectric Constant Materials. Chem. Rev. 2010, 110, 56–110. [Google Scholar] [CrossRef] [PubMed]
- Goethals, F.; Ciofi, I.; Madia, O.; Vanstreels, K.; Baklanov, M.R.; Detavernier, C.; Van Der Voort, P.; Van Driessche, I. Ultra-low-k cyclic carbon-bridged PMO films with a high chemical resistance. J. Mater. Chem. 2012, 22, 8281. [Google Scholar] [CrossRef]
- Vishnevskiy, A.S.; Naumov, S.; Seregin, D.S.; Wu, Y.H.; Chuang, W.T.; Rasadujjaman, M.; Zhang, J.; Leu, J.; Vorotilov, K.A.; Baklanov, M.R. Effects of methyl terminal and carbon bridging groups ratio on critical properties of porous organosilicate-glass films. Materials 2020, 13, 4484. [Google Scholar] [CrossRef] [PubMed]
- Li, H.; Knaup, J.M.; Kaxiras, E.; Vlassak, J.J. Stiffening of organosilicate glasses by organic cross-linking. Acta Mater. 2011, 59, 44–52. [Google Scholar] [CrossRef]
- Vanstreels, K.; Wu, C.; Gonzalez, M.; Schneider, D.; Gidley, D.; Verdonck, P.; Baklanov, M.R. Effect of Pore Structure of Nanometer Scale Porous Films on the Measured Elastic Modulus. Langmuir 2013, 29, 12025–12035. [Google Scholar] [CrossRef]
- Kaczmarek, A.M.; Van Der Voort, P. Light-emitting lanthanide periodic mesoporous organosilica (PMO) hybrid materials. Materials 2020, 13, 556. [Google Scholar] [CrossRef]
- Lu, Y.; Fan, H.; Doke, N.; Loy, D.A.; Assink, R.A.; LaVan, D.A.; Brinker, C.J. Evaporation-Induced Self-Assembly of Hybrid Bridged Silsesquioxane Film and Particulate Mesophases with Integral Organic Functionality. J. Am. Chem. Soc. 2000, 122, 5258–5261. [Google Scholar] [CrossRef]
- Baklanov, M.R.; Mogilnikov, K.P.; Polovinkin, V.G.; Dultsev, F.N. Determination of pore size distribution in thin films by ellipsometric porosimetry. J. Vac. Sci. Technol. B Microelectron. Nanom. Struct. 2000, 18, 1385–1391. [Google Scholar] [CrossRef]
- Baklanov, M.R.; Mogilnikov, K.P.; Vishnevskiy, A.S. Challenges in porosity characterization of thin films: Cross-evaluation of different techniques. J. Vac. Sci. Technol. A 2023, 41, 050802. [Google Scholar] [CrossRef]
- Grill, A.; Neumayer, D.A. Structure of low dielectric constant to extreme low dielectric constant SiCOH films: Fourier transform infrared spectroscopy characterization. J. Appl. Phys. 2003, 94, 6697–6707. [Google Scholar] [CrossRef]
- Marsik, P.; Verdonck, P.; De Roest, D.; Baklanov, M.R. Porogen residues detection in optical properties of low-k dielectrics cured by ultraviolet radiation. Thin Solid Films 2010, 518, 4266–4272. [Google Scholar] [CrossRef]
- ALOthman, Z.A. A Review: Fundamental Aspects of Silicate Mesoporous Materials. Materials 2012, 5, 2874–2902. [Google Scholar] [CrossRef]
- Lowell, S.; Shields, J.E.; Thomas, M.A.; Thommes, M. Characterization of Porous Solids and Powders: Surface Area, Pore Size and Density; Particle Technology Series; Springer: Dordrecht, The Netherlands, 2004; Volume 16, ISBN 978-90-481-6633-6. [Google Scholar]
- Esquivel, D.; Kaczmarek, A.M.; Jiménez-Sanchidrián, C.; Van Deun, R.; Romero-Salguero, F.J.; Van Der Voort, P. Eu3+ @PMO: Synthesis, characterization and luminescence properties. J. Mater. Chem. C 2015, 3, 2909–2917. [Google Scholar] [CrossRef]
- Li, Y.; Zhang, C.; Hu, H.; Wang, J.; Wang, X. Novel photoactive lanthanide hybrids covalently grafted on functionalized periodic mesoporous organosilicons (PMOs) by Schiff-base derivative. J. Porous Mater. 2017, 24, 487–496. [Google Scholar] [CrossRef]
- Sheng, G.; Dong, H.; Shen, R.; Li, Y. Microscopic insights into the temperature-dependent adsorption of Eu(III) onto titanate nanotubes studied by FTIR, XPS, XAFS and batch technique. Chem. Eng. J. 2013, 217, 486–494. [Google Scholar] [CrossRef]
- Bilewska, K.; Wolna, E.; Edely, M.; Ruello, P.; Szade, J. EuNiO3 thin films- growth and characterization. J. Phys. Conf. Ser. 2011, 289, 012014. [Google Scholar] [CrossRef]
- Guo, X.; Jakes, J.E.; Banna, S.; Nishi, Y.; Shohet, J.L. Effects of plasma and vacuum-ultraviolet exposure on the mechanical properties of low-k porous organosilicate glass. J. Appl. Phys. 2014, 116, 044103. [Google Scholar] [CrossRef]
- Rasadujjaman, M.; Zhang, J.; Spassky, D.A.; Naumov, S.; Vishnevskiy, A.S.; Vorotilov, K.A.; Yan, J.; Zhang, J.; Baklanov, M.R. UV-Excited Luminescence in Porous Organosilica Films with Various Organic Components. Nanomaterials 2023, 13, 1419. [Google Scholar] [CrossRef]
- Wan, N.; Xu, J.; Lin, T.; Zhang, X.; Xu, L. Energy transfer and enhanced luminescence in metal oxide nanoparticle and rare earth codoped silica. Appl. Phys. Lett. 2008, 92, 202109. [Google Scholar] [CrossRef]
- Blasse, G.; Dirksen, G.J.; Van Vliet, J.P.M. The luminescence of Europium nitrate Hexahydrate, Eu(NO3)3·6H2O. Inorganica Chim. Acta 1988, 142, 165–168. [Google Scholar] [CrossRef]
- Lu, Q.; Wang, Z.; Wang, P.; Li, J. Structure and Luminescence Properties of Eu3+-Doped Cubic Mesoporous Silica Thin Films. Nanoscale Res. Lett. 2010, 5, 761–768. [Google Scholar] [CrossRef] [PubMed][Green Version]
- Liu, W.; Kaczmarek, A.M.; Van Der Voort, P.; Van Deun, R. Chemical sensors based on periodic mesoporous organosilica @NaYF4:Ln3+ nanocomposites. Dalt. Trans. 2022, 51, 11467–11475. [Google Scholar] [CrossRef]
- Mulder, J.T.; Meijer, M.S.; van Blaaderen, J.J.; du Fossé, I.; Jenkinson, K.; Bals, S.; Manna, L.; Houtepen, A.J. Understanding and Preventing Photoluminescence Quenching to Achieve Unity Photoluminescence Quantum Yield in Yb:YLF Nanocrystals. ACS Appl. Mater. Interfaces 2023, 15, 3274–3286. [Google Scholar] [CrossRef]
- Fneich, H.; Gaumer, N.; Chaussedent, S.; Blanc, W.; Mehdi, A. Europium-Doped Sol-Gel SiO2-Based Glasses: Effect of the Europium Source and Content, Magnesium Addition and Thermal Treatment on Their Photoluminescence Properties. Molecules 2018, 23, 1768. [Google Scholar] [CrossRef] [PubMed]
- Baklanov, M.R.; Jousseaume, V.; Rakhimova, T.V.; Lopaev, D.V.; Mankelevich, Y.A.; Afanas’ev, V.V.; Shohet, J.L.; King, S.W.; Ryan, E.T. Impact of VUV photons on SiO2 and organosilicate low-k dielectrics: General behavior, practical applications, and atomic models. Appl. Phys. Rev. 2019, 6, 011301. [Google Scholar] [CrossRef]
- Iacopi, F.; Travaly, Y.; Eyckens, B.; Waldfried, C.; Abell, T.; Guyer, E.P.; Gage, D.M.; Dauskardt, R.H.; Sajavaara, T.; Houthoofd, K.; et al. Short-ranged structural rearrangement and enhancement of mechanical properties of organosilicate glasses induced by ultraviolet radiation. J. Appl. Phys. 2006, 99, 053511. [Google Scholar] [CrossRef]
- Ishizaka, T.; Nozaki, R.; Kurokawa, Y. Luminescence properties of Tb3+ and Eu3+-doped alumina films prepared by sol-gel method under various conditions and sensitized luminescence. J. Phys. Chem. Solids 2002, 63, 613–617. [Google Scholar] [CrossRef]
- Yu, M.; Lin, J.; Fu, J.; Zhang, H.J.; Han, Y.C. Sol–gel synthesis and photoluminescent properties of LaPO4:A (A = Eu3+, Ce3+, Tb3+) nanocrystalline thin films. J. Mater. Chem. 2003, 13, 1413–1419. [Google Scholar] [CrossRef]
- Jia, W.; Liu, H.; Felofilov, S.P.; Meltzer, R.; Jiao, J. Spectroscopic study of Eu3+-doped and Eu3+,Y3+-codoped SiO2 sol–gel glasses. J. Alloys Compd. 2000, 311, 11–15. [Google Scholar] [CrossRef]
- Baklanov, M.R.; De Marneffe, J.F.; Shamiryan, D.; Urbanowicz, A.M.; Shi, H.; Rakhimova, T.V.; Huang, H.; Ho, P.S. Plasma processing of low-k dielectrics. J. Appl. Phys. 2013, 113, 041101. [Google Scholar] [CrossRef]
- Safaverdi, S.; Barkema, G.T.; Kunnen, E.; Urbanowicz, A.M.; Maes, C. Saturation of front propagation in a reaction diffusion process describing plasma damage in porous low-k materials. Phys. Rev. B 2011, 83, 245320. [Google Scholar] [CrossRef]
- Zhang, Y.; Li, X.; Li, K.; Lian, H.; Shang, M.; Lin, J. Crystal-Site Engineering Control for the Reduction of Eu3+ to Eu2+ in CaYAlO4: Structure Refinement and Tunable Emission Properties. ACS Appl. Mater. Interfaces 2015, 7, 2715–2725. [Google Scholar] [CrossRef] [PubMed]
- Dereń, P.J.; Stefańska, D.; Ptak, M.; Wiśniewski, P. Method to Measure the Degree of Reduction of Eu3+ to Eu2+: How Anion and Cation Vacancies Influence the Degree of Reduction. J. Phys. Chem. C 2021, 125, 24505–24514. [Google Scholar] [CrossRef]
- Sipina, E.V.; Spassky, D.A.; Krutyak, N.R.; Morozov, V.A.; Zhukovskaya, E.S.; Belik, A.A.; Manylov, M.S.; Lazoryak, B.I.; Deyneko, D.V. Abnormal Eu3+→Eu2+ Reduction in Ca(9−x)MnxEu(PO4)7 Phosphors: Structure and Luminescent Properties. Materials 2023, 16, 1383. [Google Scholar] [CrossRef]
- Zaitoun, M.A.; Kim, T.; Lin, C.T. Observation of Electron−Hole Carrier Emission in the Eu3+-Doped Silica Xerogel. J. Phys. Chem. B 1998, 102, 1122–1125. [Google Scholar] [CrossRef]
- Zaitoun, M.A.; Goken, D.M.; Bailey, L.S.; Kim, T.; Lin, C.T. Thermoanalysis and Emission Properties of Eu3+/Eu2+ in Eu3+ -Doped Xerogels. J. Phys. Chem. B 2000, 104, 189–196. [Google Scholar] [CrossRef]
- He, J.; Wang, Y.; Liu, Y.; Wang, K.; Li, R.; Fan, J.; Xu, S.; Zhang, L. Tailoring the Luminescence of Europium Ions in Mesoporous AlPO4 Monolithic Glass. J. Phys. Chem. C 2013, 117, 21916–21922. [Google Scholar] [CrossRef]
- Gao, G.; Da, N.; Reibstein, S.; Wondraczek, L. Enhanced Photoluminescence From Mixed-Valence Eu-Doped Nanocrystalline Silicate Glass Ceramics. Opt. Express 2010, 18, A575–A583. [Google Scholar] [CrossRef]
- Zhang, Q.; Qiao, Y.; Qian, B.; Dong, G.; Ruan, J.; Liu, X.; Zhou, Q.; Chen, Q.; Qiu, J.; Chen, D. Luminescence properties of the Eu-doped porous glass and spontaneous reduction of Eu3+ to Eu2+. J. Lumin. 2009, 129, 1393–1397. [Google Scholar] [CrossRef]
- Biswas, A.; Friend, C.S.; Prasad, P.N. Spontaneous reduction of Eu3+ ion in Al co-doped sol–gel silica matrix during densification. Mater. Lett. 1999, 39, 227–231. [Google Scholar] [CrossRef]
- Wang, C.; Peng, M.; Jiang, N.; Jiang, X.; Zhao, C.; Qiu, J. Tuning the Eu luminescence in glass materials synthesized in air by adjusting glass compositions. Mater. Lett. 2007, 61, 3608–3611. [Google Scholar] [CrossRef]
- Zhang, D.; Hu, X.; Jing, G.; Liu, E.; Fan, J.; Zhang, G.; Hou, X. Transition from Eu3+ to Eu2+ in SiO2 Matrix Prepared by Sol–Gel. J. Nanosci. Nanotechnol. 2014, 14, 3642–3647. [Google Scholar] [CrossRef] [PubMed]
- Batsanov, S.S.; Deribas, A.A.; Kustova, G.N. Reaction of rare earth metal oxides with water. Zhurnal Neorganicheskoi Khimii 1967, 12, 2283–2286. [Google Scholar]
- Hreniak, D.; Jasiorski, M.; Maruszewski, K.; Kepinski, L.; Krajczyk, L.; Misiewicz, J.; Strek, W. Nature and optical behaviour of heavily europium-dopedsilica glasses obtained by the sol–gel method. J. Non-Cryst. Solids 2002, 298, 146–152. [Google Scholar] [CrossRef]
- Bellocchi, G.; Franzò, G.; Iacona, F.; Boninelli, S.; Miritello, M.; Cesca, T.; Priolo, F. Eu3+ reduction and efficient light emission in Eu2O3 films deposited on Si substrates. Opt. Express 2012, 20, 5501. [Google Scholar] [CrossRef] [PubMed]
- Gao, F.; Zhao, X.; Liu, J. A Facile Method for the Fabrication of Luminescent Eu3+-Doped SiO2 Nanowires. Gels 2022, 8, 286. [Google Scholar] [CrossRef] [PubMed]
- Qi, J.; Matsumoto, T.; Tanaka, M.; Matsumoto, Y. Preparation of white light electroluminescent Eu Silicate thin films. Electrochem. Solid-State Lett. 2000, 3, 239–241. [Google Scholar] [CrossRef]
- Li, L.; Zheng, J.; Zuo, Y.; Cheng, B.; Wang, Q. Strong Eu2+ light emission in Eu silicate through Eu3+ reduction in Eu2O3/Si multilayer deposited on Si substrates. Nanoscale Res. Lett. 2013, 8, 194. [Google Scholar] [CrossRef]
- Hecker, M.; Hübner, R. Diffusion Barriers. In Advanced Interconnects for ULSI Technology, 1st ed.; Baklanov, M.R., Ho, P., Zschech, E., Eds.; John Wiley & Sons, Ltd.: West Sussex, UK, 2012; pp. 193–234. [Google Scholar]
- Koike, J.; Haneda, M.; Iijima, J.; Otsuka, Y.; Sako, H.; Neishi, K. Growth kinetics and thermal stability of a self-formed barrier layer at Cu-Mn/SiO2 interface. J. Appl. Phys. 2007, 102, 043527. [Google Scholar] [CrossRef]
- Casey, P.; Bogan, J.; Hughes, G. Photoemission study of carbon depletion from ultralow-κ carbon doped oxide surfaces during the growth of Mn silicate barrier layers. Appl. Phys. 2011, 110, 124512. [Google Scholar] [CrossRef]
- Nakatani, R.; Yakame, H.; Endo, Y.; Yamamoto, M. Magnetic Properites in Mn/Si-O/Si(100)-substrate Systems and Mn/Si-O/Si Trilayers. Jpn. J. Appl. Phys. 2003, 42 Pt 1, 3392. [Google Scholar] [CrossRef]
- Dorenbos, P. Energy of the first 4f7→4f65d transition of Eu2+ in inorganic compounds. J. Lumin. 2003, 104, 239–260. [Google Scholar] [CrossRef]
Disclaimer/Publisher’s Note: The statements, opinions and data contained in all publications are solely those of the individual author(s) and contributor(s) and not of MDPI and/or the editor(s). MDPI and/or the editor(s) disclaim responsibility for any injury to people or property resulting from any ideas, methods, instructions or products referred to in the content. |
© 2023 by the authors. Licensee MDPI, Basel, Switzerland. This article is an open access article distributed under the terms and conditions of the Creative Commons Attribution (CC BY) license (https://creativecommons.org/licenses/by/4.0/).