1. Introduction
Sealing components (e.g., gaskets, o-rings), resistant to high temperatures, chemically inert and thermally conductive, are mostly made of pure graphite. Frequently, these mechanical components have a very complex shape (e.g., engine gasket units) and consequently their manufacturing is difficult. The method typically used to fabricate these pure-graphite components with a complex geometry is based on compacting by pressing a special type of highly porous and disordered graphite filament known as ‘expanded graphite’, which is prepared from the graphite bisulfate compound (C
48H
206O
28S
7). Graphite bisulfate represents the most important of the available graphite intercalation compounds (GICs). It was prepared for the first time by Brodie in the 1855 by oxidizing graphite flakes with concentrated nitric acid (HNO
3, 65% in water) in the presence of sulfuric acid (H
2SO
4) [
1]. The chemical process developed by Brodie included both an oxidating reaction of the graphite crystal by HNO
3 and the insertion of sulfuric acid molecules (H
2SO
4) uniformly among the graphite crystal sheets. However, since nitric acid oxidizes graphite to graphite cations (graphonium ions), HSO
ions are also as a result inserted into the crystal in order to balance the positive charges generated in the graphite crystal. Therefore, graphite bisulfate has both an ionic nature and a covalent nature, which are the two possible classes of intercalation compounds. The presence of a strong oxidizer (HNO
3) has a key role in this chemical process, because the oxidized edges of the graphite crystals, rich in large oxygen-containing species like carboxyl (-COOH), formyl (-CHO), and hydroxyl (-OH) groups, allow the molecular/ionic molecules (H
2SO
4 and HSO
) to permeate in the crystal, with formation of graphite/H
SO
/HSO
solid solutions. Nitric acid can be replaced by other types of strong oxidizers like potassium permanganate (KMnO
), potassium dichromate (KCr
O
), oxygen peroxide (H
O
), sodium perchloride (NaClO
), sodium periodate (NaIO
), etc.; however, the expanding capability and the stability of the achieved graphite bisulfate products are generally much lower than the product obtained by HNO
oxidation. Expanded graphite, processable by compacting with pressing, is obtained via thermal treatment (thermal shock) of graphite bisulfate. During this thermal treatment, H
SO
molecules present in the graphite crystal react with the nearest carbon atoms of graphite sheets, producing a gaseous mixture of carbon dioxide, sulfur dioxide, and moisture that, when violently released from the layered structure of the graphite crystal, causes significant expansion. In particular, the intercalating agent and graphite react according to the following scheme: C + 2H
SO
= CO
+ 2SO
+ 2H
O. Obviously, a low percentage of lattice defects (vacancies) randomly distributed in the graphite sheets is simultaneously generated by this chemical reaction. Expanded graphite is very useful as a precursor of many other industrial products derived from graphite like graphite nanoplatelets, graphene oxide (GO), few-layer graphene (semi-graphene), single-layer graphene, graphene aerogels, thermally reduced graphene (TRG), chemically reduced graphene (CRG), etc. Most of these materials are prepared by exfoliation of the expanded graphite filaments by using sono-acoustic energy (ultrasound). In particular, a high-intensity sonication treatment is applied to expanded graphite dispersed in a liquid medium (e.g., acetone). The resulting graphite nanocrystal thickness depends on the degree of intercalation, which is usually expressed by a ‘staging’ index (i.e., number of graphite layers contained between two intercalated layers; for example, in a stage I compound, a single layer of graphene regularly alternates with intercalated species). The staging index depends on the quality of the graphite bisulfate and therefore on the sulfuric acid concentration and the type of oxidizing agent involved in the reactive system; however, it also depends on the aging time. Indeed, freshly prepared stage I graphite bisulfate has a very strong ability to expand by the effect of a thermal shock, but such a phenomenon reduces in intensity with the aging of this chemical product. An investigation of the graphite bisulfate aging process could provide significant information for the technological development of industrial processes based on this type of compound, since its ability to expand is strongly influenced by the time elapsed since its preparation. Indeed, GBS compounds and most GICs are not stable in air, water, or organic media [
2,
3]. The configuration assumed by intercalation substances and the defects induced in the graphene layers influence the free energies of formation of the lamellar structure [
4] and, consequently, the process of expansion.
The aging effects on HNO
intercalation graphite have been investigated before by E. J. Samuelsen et al. [
5]. They observed a change in staging, the disappearance of the intermediate crystalline phase, and the growth of a new ordered phase over a period of 5 months. These changes are related to the thermal settling of the graphite crystals and defect configuration changes. A study of aging effects over a longer time could give interesting information from a basic and applicative point of view. As far as we know, no similar works are present in the literature. This lack of information motivates us to monitor the aging effects in GBS for considerably longer times. In the present paper, we report the results of our investigation on aging effects in GBS for a time period of 84 months. For this purpose, we fabricated GBS by reacting graphite flakes with an oxidizing agent/sulfuric acid mixture, as described in detail in ref. [
6]. Seven different oxidizing agent/sulfuric acid mixtures have been used. The graphite bisulfate samples were periodically monitored by micro-Raman spectroscopy over a period of 84 months. Raman spectroscopy provides an efficient method to characterize graphene and graphite-based materials [
6,
7,
8,
9,
10,
11]. Indeed, information on defect configurations can be inferred from a Raman spectral analysis [
12,
13]. In GBS compounds, HSO
ions cause point defects in the graphite crystalline structure. These defects are localized; indeed, they cannot move from the lattice positions where they originate. Differently, H
SO
molecules are free to move by diffusion in the space between the adjacent graphite crystallographic planes and segregate mostly at the crystal edges to maximize all physical interactions, allowing the formation of a network of linear defects in the graphite matrix structure [
4,
14].
3. Results
The Raman spectrum of GBS sample A (HNO
) is reported in
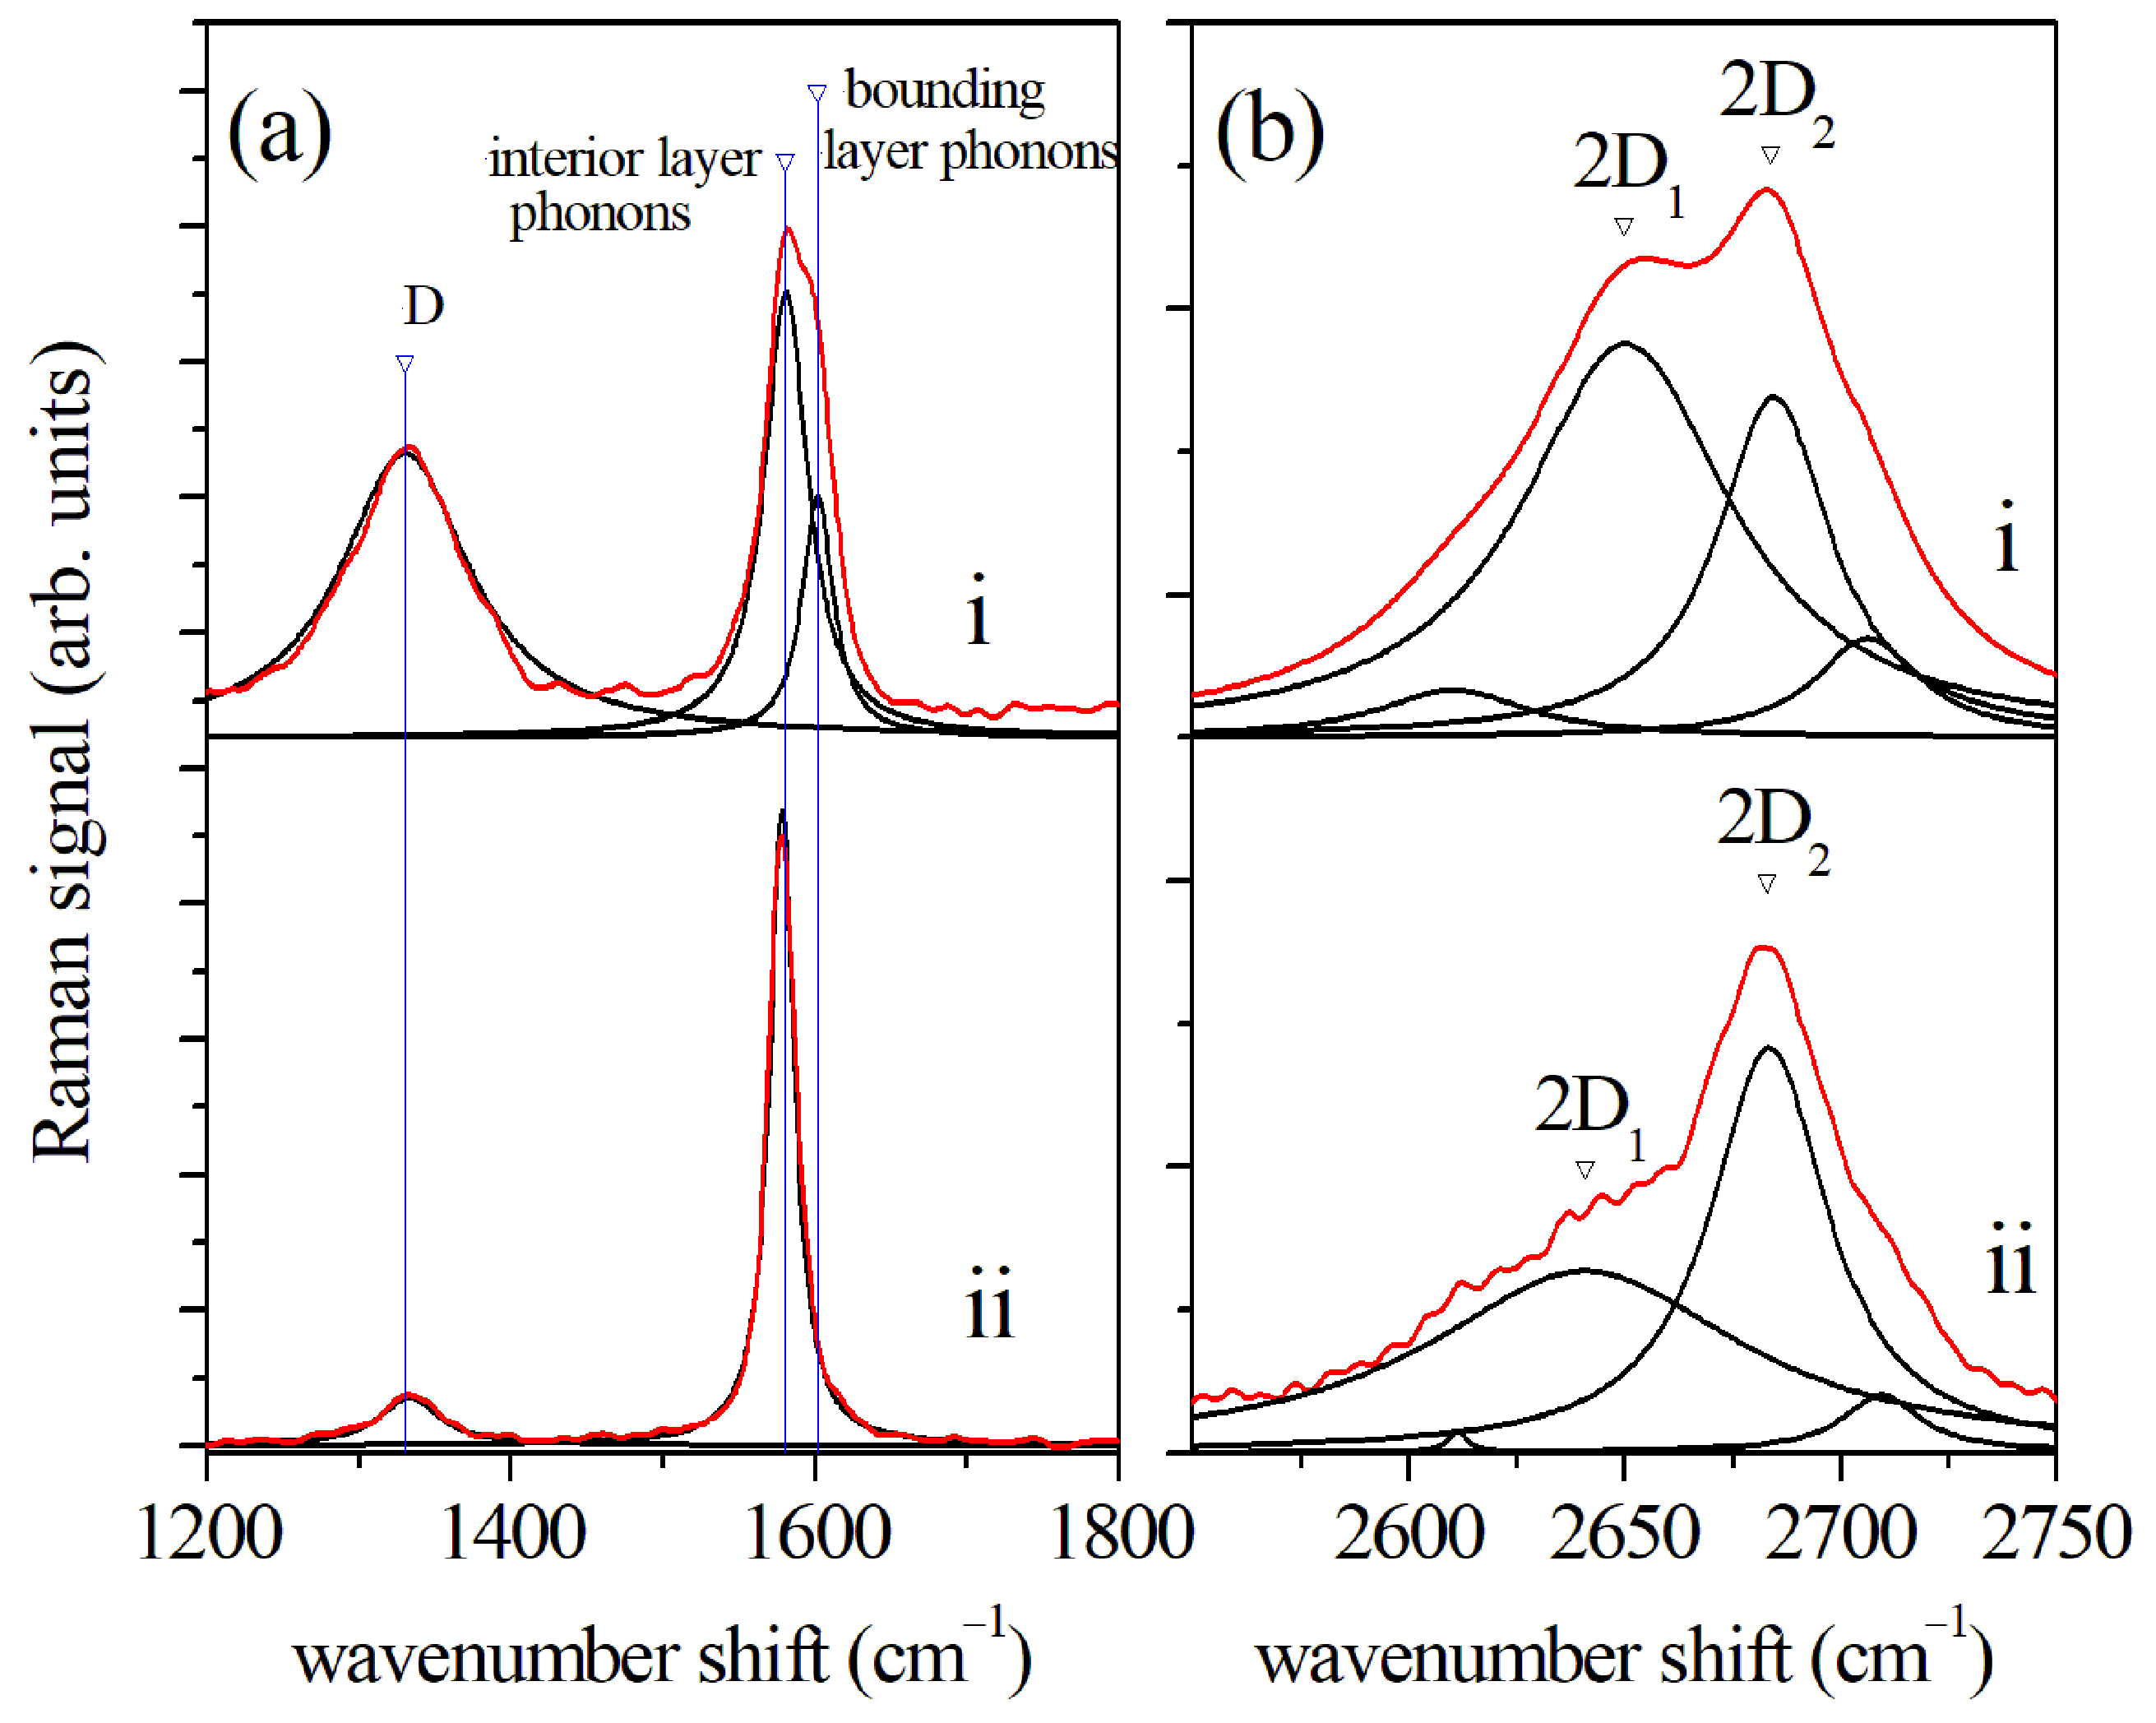
Figure 1 and is compared with the Raman spectrum of pristine graphite. The spectrum of graphite is dominated by a strong peak at 1582 cm
, which is related to the E
degenerated vibrational modes of carbon atoms (G mode). The occurrence of intercalation layers in the graphite modifies this peak and splits it into two modes, which are assigned to displacements of carbon atoms belonging to internal layers of stacking regions and to stacking boundary layers, respectively. The G mode related to interior layer phonons is centered at ca. 1580 cm
, similar to graphite, while the position of the G
mode due to boundary layer phonons is at a higher wavenumber, depending on the stacking order [
10,
11]. The split of the G peak is clearly shown in
Figure 1a. Two modes occur at 1602 cm
and 1581 cm
in the spectrum of A (HNO
) (i), while a single peak centered at 1582 cm
is observed in the spectrum of graphite flakes (ii). A list of the position of these modes is reported in
Table 1 for GBS compounds that were produced with different oxidizing agents. In the case of samples D (KMnO
), F (H
O
), and G (KNO
), the split of the E
mode is negligible, and the signal can be modeled by a single peak centered at about 1581 cm
. The thermogravimetric analysis (TGA) reported in ref. [
6] has confirmed a relatively low intercalation degree for these GBS compounds as the weight loss percentages during TGA are lower than
while values were estimated in the
–
range for the weight loss percentages of the remaining GBS compounds. In the case of sample A (HNO
), the measured weight loss was
. The D mode located at about 1334 cm
originates from edge or discontinuities in the carbon lattice, where translational symmetry is broken, and it is usually associated with structural defects occurring in the graphite [
8,
15]. This mode is relatively weak in the flakes of pure graphite (spectrum (ii) in
Figure 1a) but becomes more intense in the GBS spectrum (spectrum (i) in
Figure 1a) because of the bounding surface increase and an expected larger number of defects. The second order of this mode (2D band) is observable in the high wavenumber region of the Raman spectrum at about 2640 cm
. The D and 2D modes are dispersive bands, and hence, their actual position and intensity depend on the laser excitation energy [
8]. In
Figure 1b, the broad bands assigned to 2D modes of the sample A (KNO
) (i) and graphite flakes (ii) are shown. The spectrum of graphite flakes (ii) is characterized by two main peaks (2D
and 2D
) centered at 2641 cm
and 2681 cm
, respectively. Two further weaker components occur at 2611 cm
and 2710 cm
. These features are consistent with the Raman response of graphite, where a double resonance process involving a link between phonons and the electronic band structure is expected. Indeed, the four components of the 2D band are related to a splitting of the graphite electron bands [
8]. The position of the 2D
mode in the GBS spectrum (spectrum (i) in
Figure 1b) is 2646 cm
, slightly higher than in the graphite flake spectrum, and its relative intensity concerning the 2D
mode increases, thus indicating a change in the electronic structure related to a modified stacking configuration, in agreement with the behavior exhibited by multilayer graphene [
8]. A list of the 2D
and 2D
mode positions in GBS compounds produced with different oxidizing agents is reported in
Table 1. The position of the 2D
modes does not change, while the centers of the 2D
mode vary in the range of 2637–2659 cm
depending on the fabrication process. Aging of the samples implies some changes in the Raman spectroscopy response due to structural readjustments of intercalation components inside the stacked layered structure of GBS compounds. The Raman spectra of sample A (KNO
) over time are reported in
Figure 2 for the spectral ranges of 1200–1800 cm
(
Figure 2a) and 2500–2775 cm
(
Figure 2b). Raman acquisitions were performed on a pristine sample after 3, 12, 14, 20, 30, 61, and 84 months, as indicated in
Figure 2. The split of the G band is clearly visible in almost all spectra, with component modes centered at 1602 cm
and 1581 cm
(
Figure 2a). Their relative intensity changes with aging. Indeed, the intensity of the mode assigned to the vibration of bounding layer atoms (at 1602 cm
) initially increases with respect to the peak at 1581 cm
, reaching a maximum in the spectrum measured after 20 months of aging, gradually decreasing afterwards. A less regular dependence on the intensity of the D mode is observed, but a clear decrease in the intensity is visible in the last two spectra, for aging times longer than 61 months. In the higher region of the spectrum (
Figure 2b), the spectra are characterized by two main peaks, which are centered at 2641 cm
and 2681 cm
. Starting from the spectrum collected after 30 months of aging, a gradually broadening of the modes occurs and their energy is lowered, particularly relevant for the 2D
peak initially centered at 2641 cm
, which moves to 2636 cm
. In general, the effects of aging on the Raman responses are qualitatively similar in all the GBS compounds considered. However, in the case of sample B (NaClO
3), the intensity of the D mode is higher and the peaks are broader than in the other samples (see
Figure S1). The dependence of the area ratio of the G and G
b peaks and of the area ratio of the D and G modes is reported in
Figure S2a and S2b, respectively. The G
b mode component increases in the first aging period and reaches a maximum after about 14–20 months, after which it decreases in intensity. The behavior shown by different samples can be ascribed to a relocation of the defects inside the graphene layers with aging, which affects the Raman response of the material. As inferred in
Figure 2 and
Figure S2, the D and 2D mode intensities have a non-monotonic dependence on the aging time, indicating a reduction in the punctual defects in graphene layers after an initial increase in their density during the first 30 months. This process also influences the strain of the graphene layers inside and, more significantly, at the boundary of the stacking regions of the GBS, as inferred from the time dependence of the relative intensity of the G and G
b modes. A relaxation of the graphene lattice is inferred after aging, which can be ascribed to a segregation of moving intercalating components at the graphite grain boundaries.
The influence of aging on the Raman spectroscopy response of GBS compounds can be related to the configuration of defects in the samples and their modification occurring over time due to thermal relaxation mechanisms. Similarly to graphene, two kinds of lattice defects can occur in the graphite intercalation layers: point-like defects generated by lattice vacancies or chemical effects and extended defects, which are related to edge effects, appearing as strain, dislocations, or discontinuities at crystal grain borders [
16].
Instead, the neutral molecules of the intercalant H2SO4 can indeed move by thermal diffusion in the spaces between the adjacent graphite stacks and segregate to maximize all physical interactions. This allows the formation of aggregates that electrostatically interact with external layers of the graphite stacking structures, locally deforming them and inducing linear-like defects. The observed splitting of the Eg band in the two G and Gb modes depends on the extent of the influence of these defects on the Raman response.
The defects induce disorder in the system that can be accounted for by two characteristic lengths, L
D and L
a, which are correlated with the average distance between defects. The parameter L
D is related to point-like defects, while L
a takes into account the extended defects at the grain borders. L. G. Cançado et al. proposed a method to distinguish the contributions of the two kinds of defects in graphene via Raman spectroscopy and estimate L
D and L
a from the A
D/A
G ratio of the peak areas of the D and G modes and the
peak width of the E
G mode [
13]. The A
D/A
G ratio gives an indication of the relevance of point-like defects in the graphene layers because the Raman D mode is related to light scattering events enabled by defects and is not allowed in defect-free graphene.
Depending on the light excitation energy EL, the AD/AG ratio and values are correlated, because both are a function of LD and La.
Indeed,
is given by:
where
is the phonon localization length,
is the phonon coherence length,
is the peak width of the material without defects, and
C is a constant. The A
/A
ratio is calculated as:
where C
, C
, C
, and C
are constants,
is the electron coherence length, and
and
are the sizes of point and extended defects, respectively. We extended this approach to the intercalated graphite samples, considering the G mode of the Raman response (1581 cm
peak) in the analysis, which is related to carbon interlayers. We used the parameter values adopted in ref. [
13] to model the A
/A
ratio’s dependence on
(
cm
nm;
nm;
nm;
nm; and
nm). Similarly, a small value of between
L
and
L
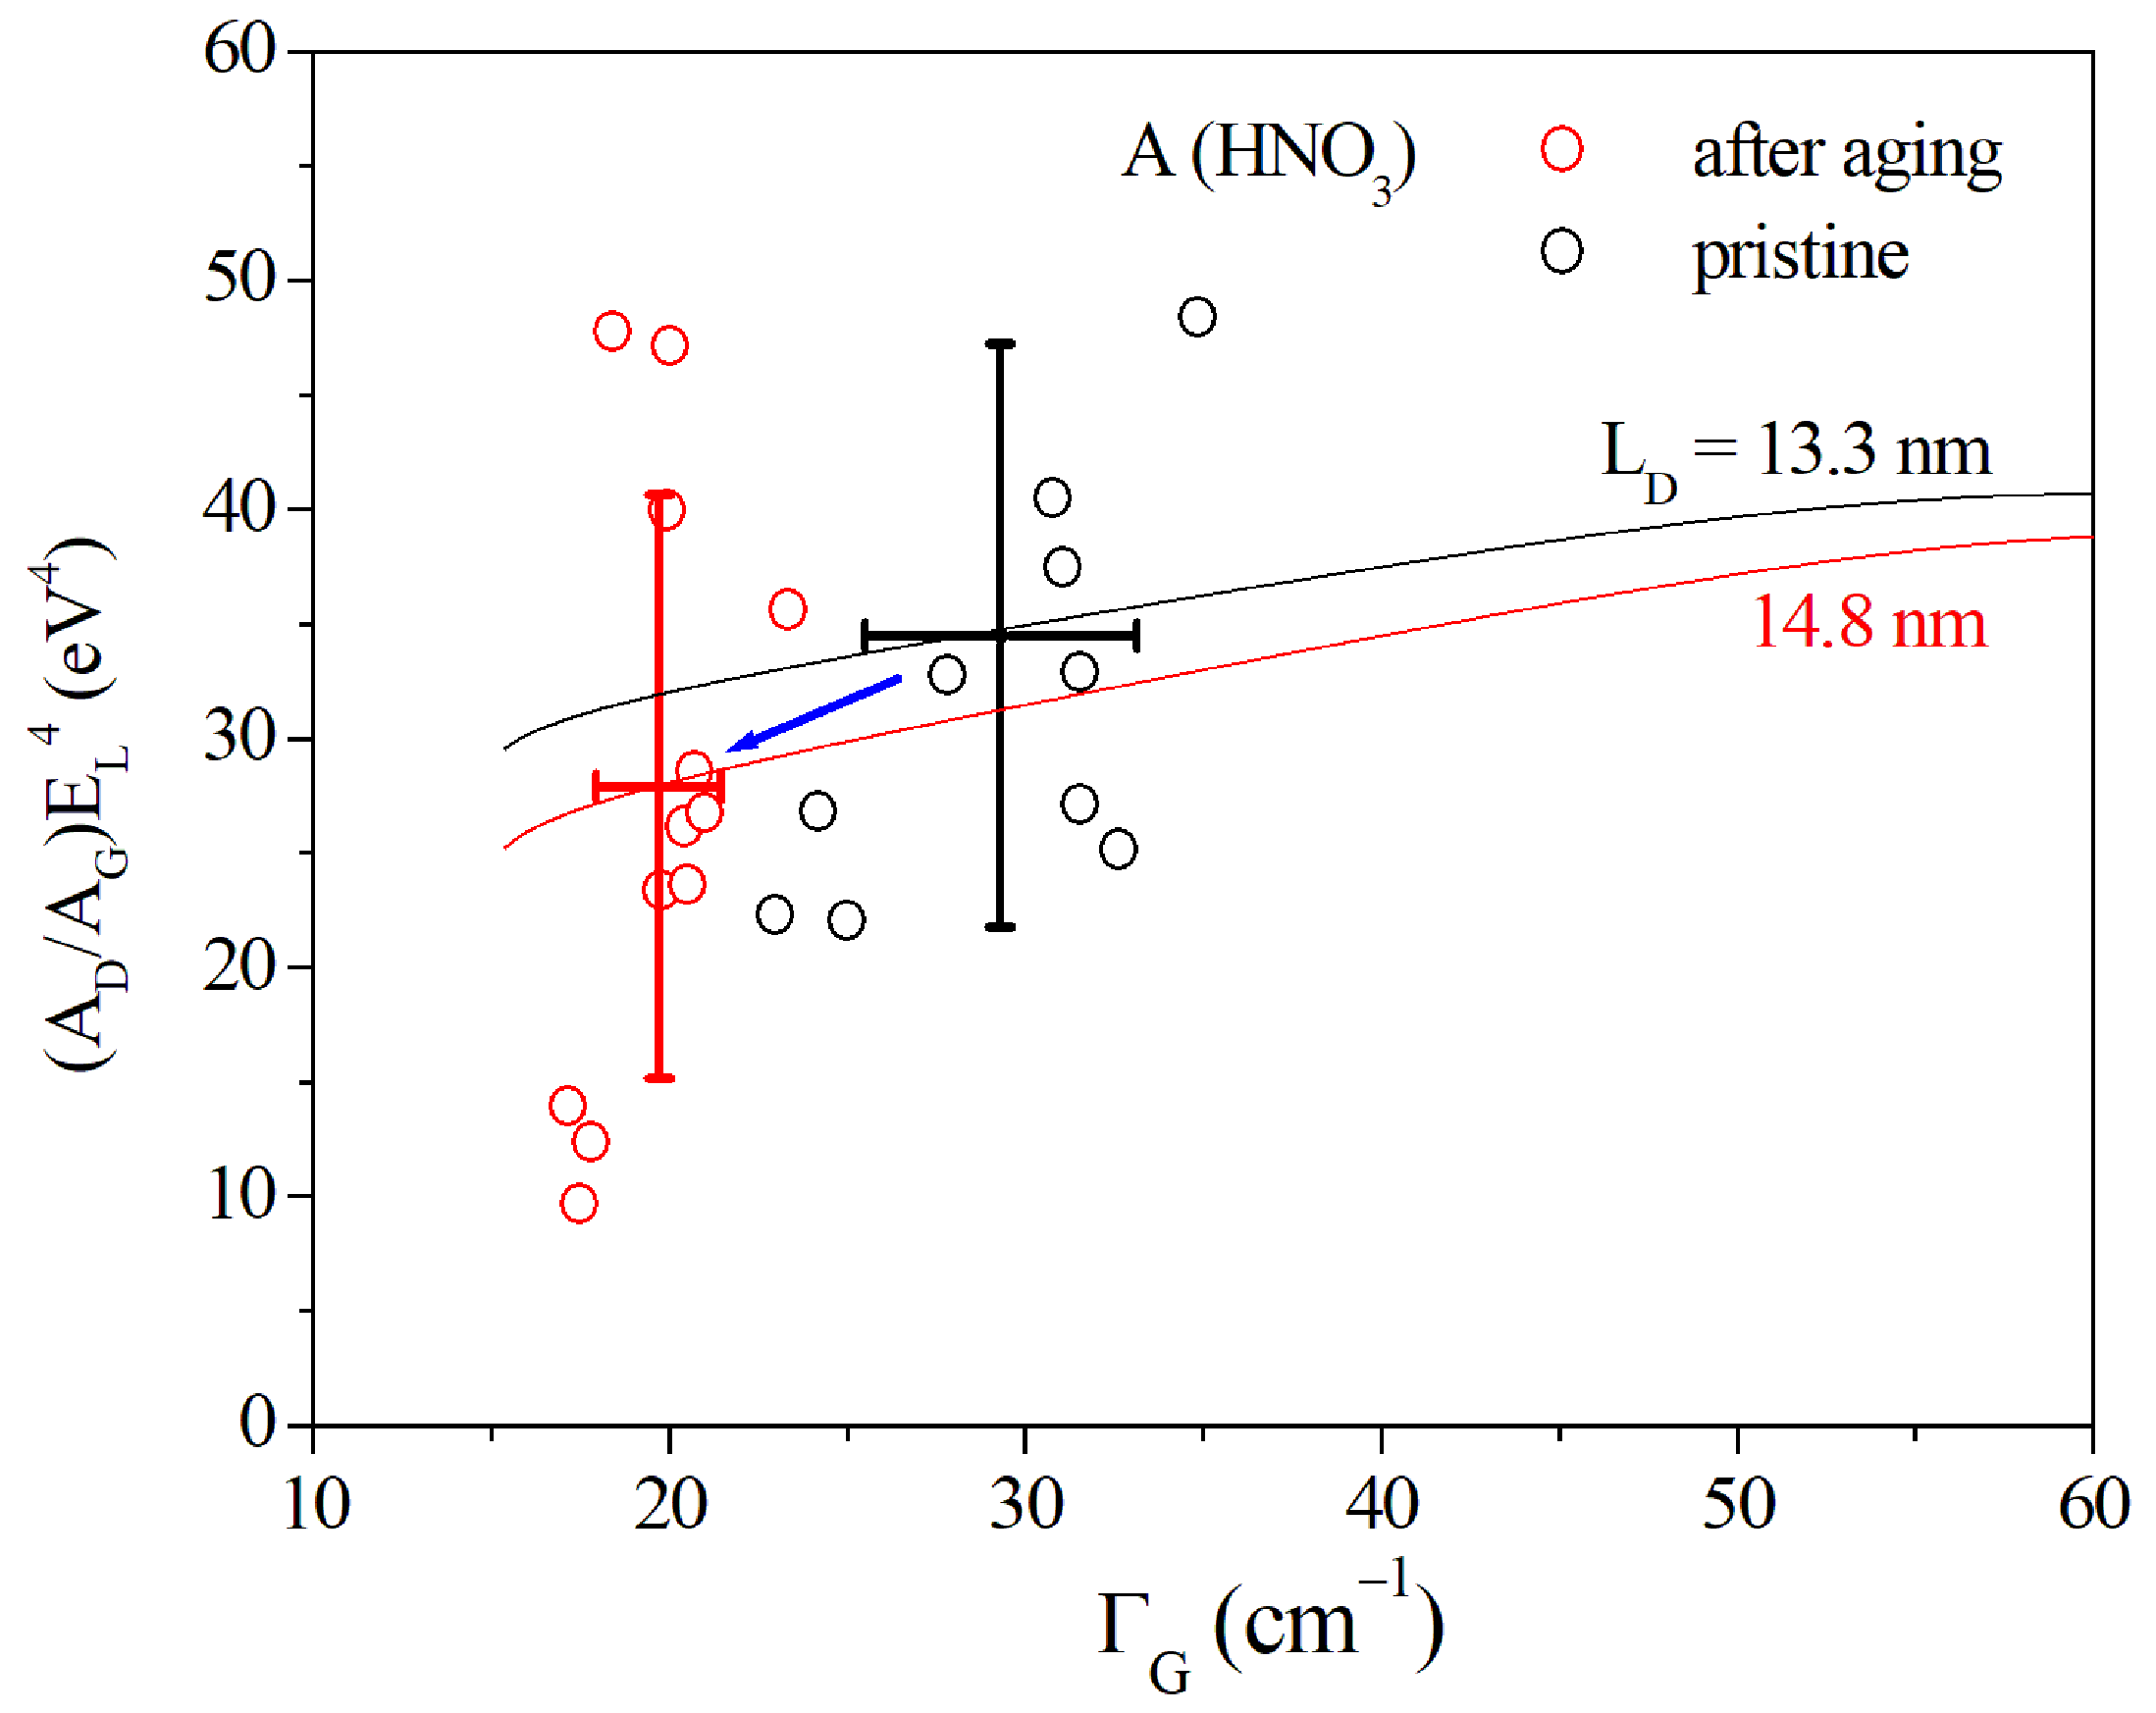
was assumed for the phonon localization length, depending on the kind of defect which is dominant out of point-like and extended defects. The experimental values of the A
/A
(E
)
ratio vs.
are reported in
Figure 3, where E
= 1.96 eV is the photon energy of the laser excitation beam. The data refer to sample A (HNO
) which was characterized by Raman spectroscopy before aging (black circles in
Figure 3) and after 84 months of aging (red circles in
Figure 3). The Raman acquisitions were performed at different positions of the GBS surface. In
Figure 3, the spread of A
/A
(E
)
ratio values is relatively large, and no significant variation between the initial and aged state is noticed. In fact, the average values are A
/A
(E
)
= 34.5 ± 12.7 eV
for the pristine sample and A
/A
(E
)
= 27.9 ± 12.8 eV
for the aged one. These data were compared with the A
/A
(E
)
dependence on
calculated via Equations (1) and (2). A good match with the experimental data can be obtained by setting L
nm and L
13.3 nm for the pristine state and L
nm and L
= 14.8 nm after aging. The curves in
Figure 3 refer to the model-predicted dependence for values of L
13.3 nm (black curve) and L
14.8 nm (red curve) and variable L
values. This suggests an increase in the Raman scattering homogeneity due to larger sizes and more relaxed grains. This feature is compatible with a segregation of mobile intercalating components to the grain boundaries and an increase in the regularity of the stacked boundary layers. A similar behavior was observed in the remaining samples. In
Figure 4, the average values of A
/A
(E
)
and
data are reported, referring to GBS compounds produced with NaClO
(sample B, black dots), NaIO
(sample C, red dots), KMnO
(sample D, blue dots), and H
O
(sample F, green dots). Full dots refer to pristine samples, while data collected after the aging are plotted with empty circles. As a reference, the trend predicted by the model for the dependence of A
/A
(E
)
on
(Equation (
2)) is reported in
Figure 4 for fixed L
values of 11.4 nm (black line), 18 nm (red line), and 30 nm (blue line) and a variable L
. In
Figure 4, a larger variation with aging is observed in sample B. Both the A
/A
(E
)
ratios and
decrease with aging as in the case of sample A (
Figure 3). These spectroscopy data are compatible with a relatively high density of point defects because they can be modeled by relatively low L
parameters. The values of L
and L
were estimated by a numerical fit of the data with Equation (
2). A moderate increase in L
from 11 ± 1 nm to 13 ± 1 nm is demonstrated with aging. The change in
values, and consequently in L
, is more relevant, reflecting a relaxation of the graphite grains. In such a case, both point-like and linear defects weakly evolve towards a clean configuration. The defect density in sample C is lower than in sample B and a larger L
of 17 ± 1 nm was estimated in the initial state. In this case, aging weakly influences the defect configuration, even if a trend towards a decrease in the defect density is inferred, mainly concerning L
and point-like defects. Samples D and F are characterized by a low density of defects, but a significant increase in L
is exhibited after aging also in these cases.
Samples E (K
Cr
O
) and G (KNO
) are not shown in
Figure 4, but their behavior is similar to that of samples D and F, with a relatively high L
value correlated with a relatively low density of point defects. A list of the estimated L
and L
parameters before and after aging is reported in
Table 2. A list of experimental A
/A
(E
)
and
values far all the GBS compounds investigated is reported in
Table S1 in the Supplementary Materials. In general, L
a does not change significantly or slightly increases with aging but, in the case of sample F, L
a decreases from 78.0 nm to 57.3 nm, indicating a relocation of extended defects.


