
The Effect of Laser Shock Peening (LSP) on the Surface Roughness and Fatigue Behavior of Additively Manufactured Ti-6Al-4V Alloy


Abstract
:1. Introduction
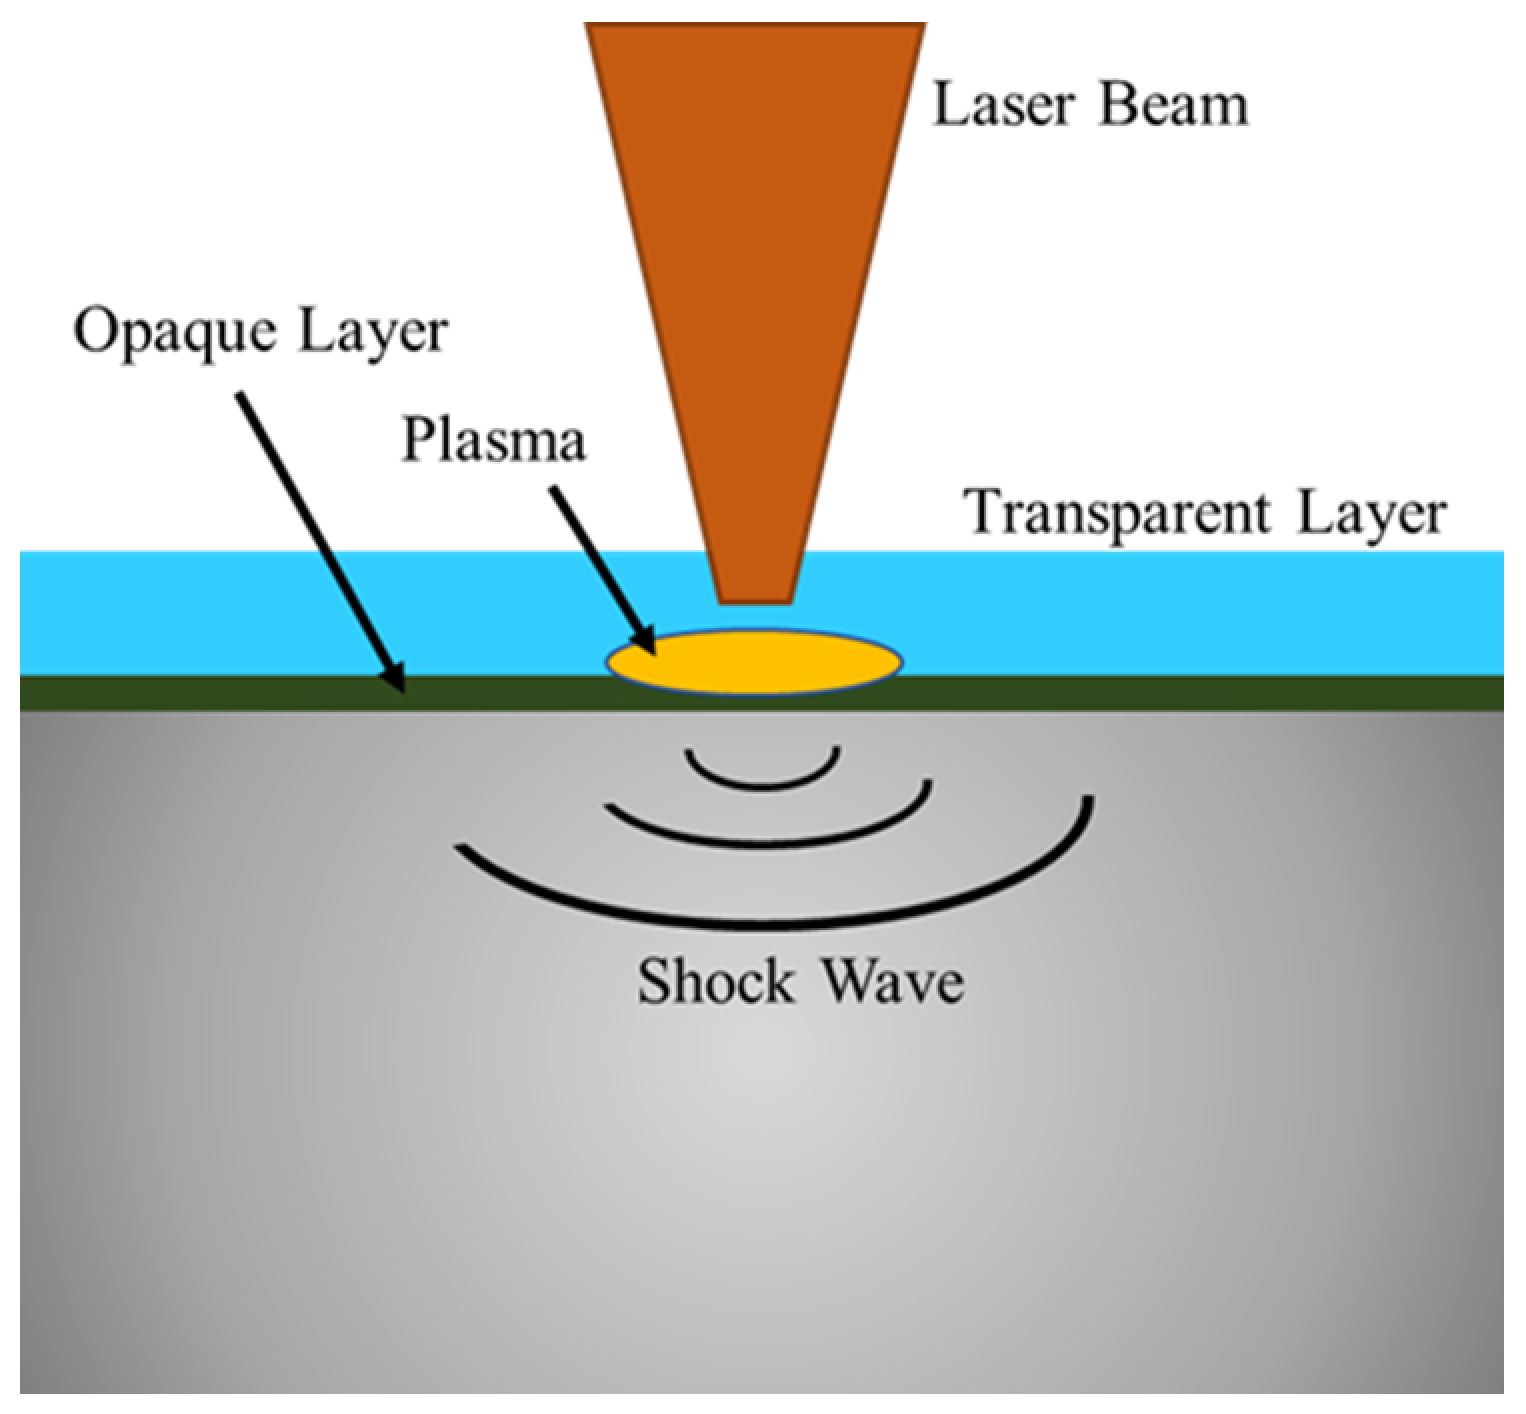
Laser Shock Peening
2. Experimental Program
2.1. Materials and Sample Preparation
2.2. Post Processing
2.3. Fatigue Tests and Defect Analysis
3. LSP on As-Built Surface Samples
3.1. Residual Stress
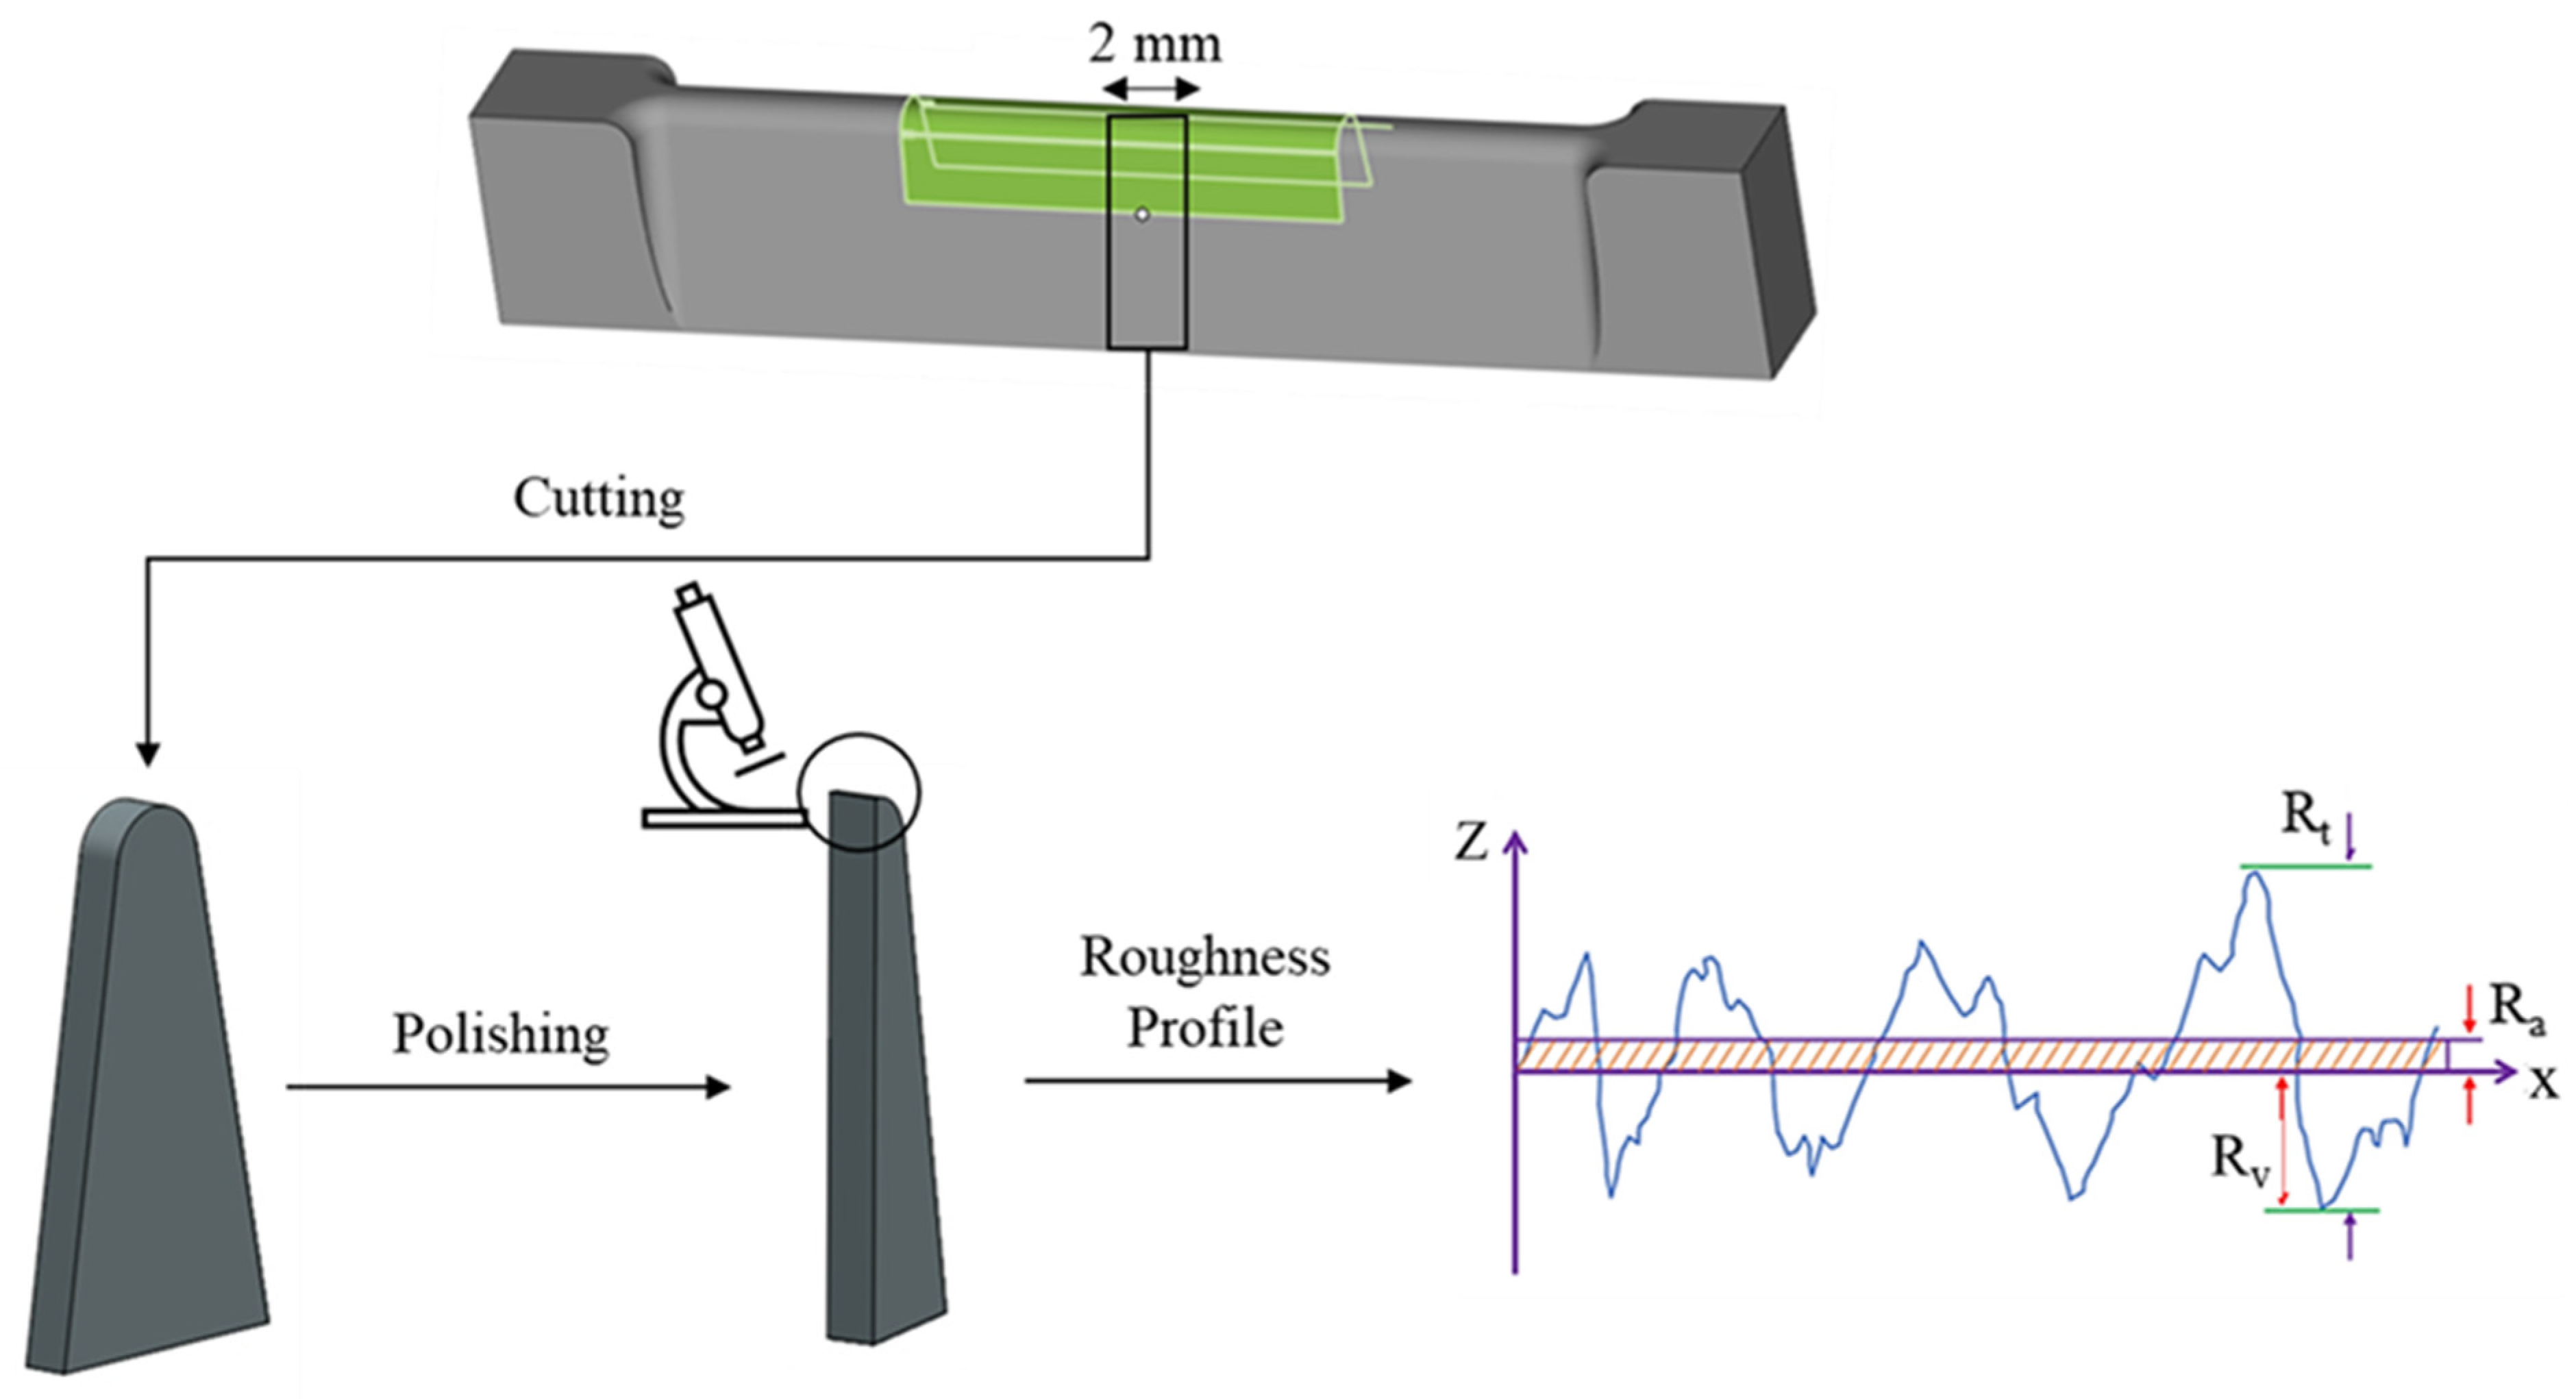
3.2. Surface Roughness
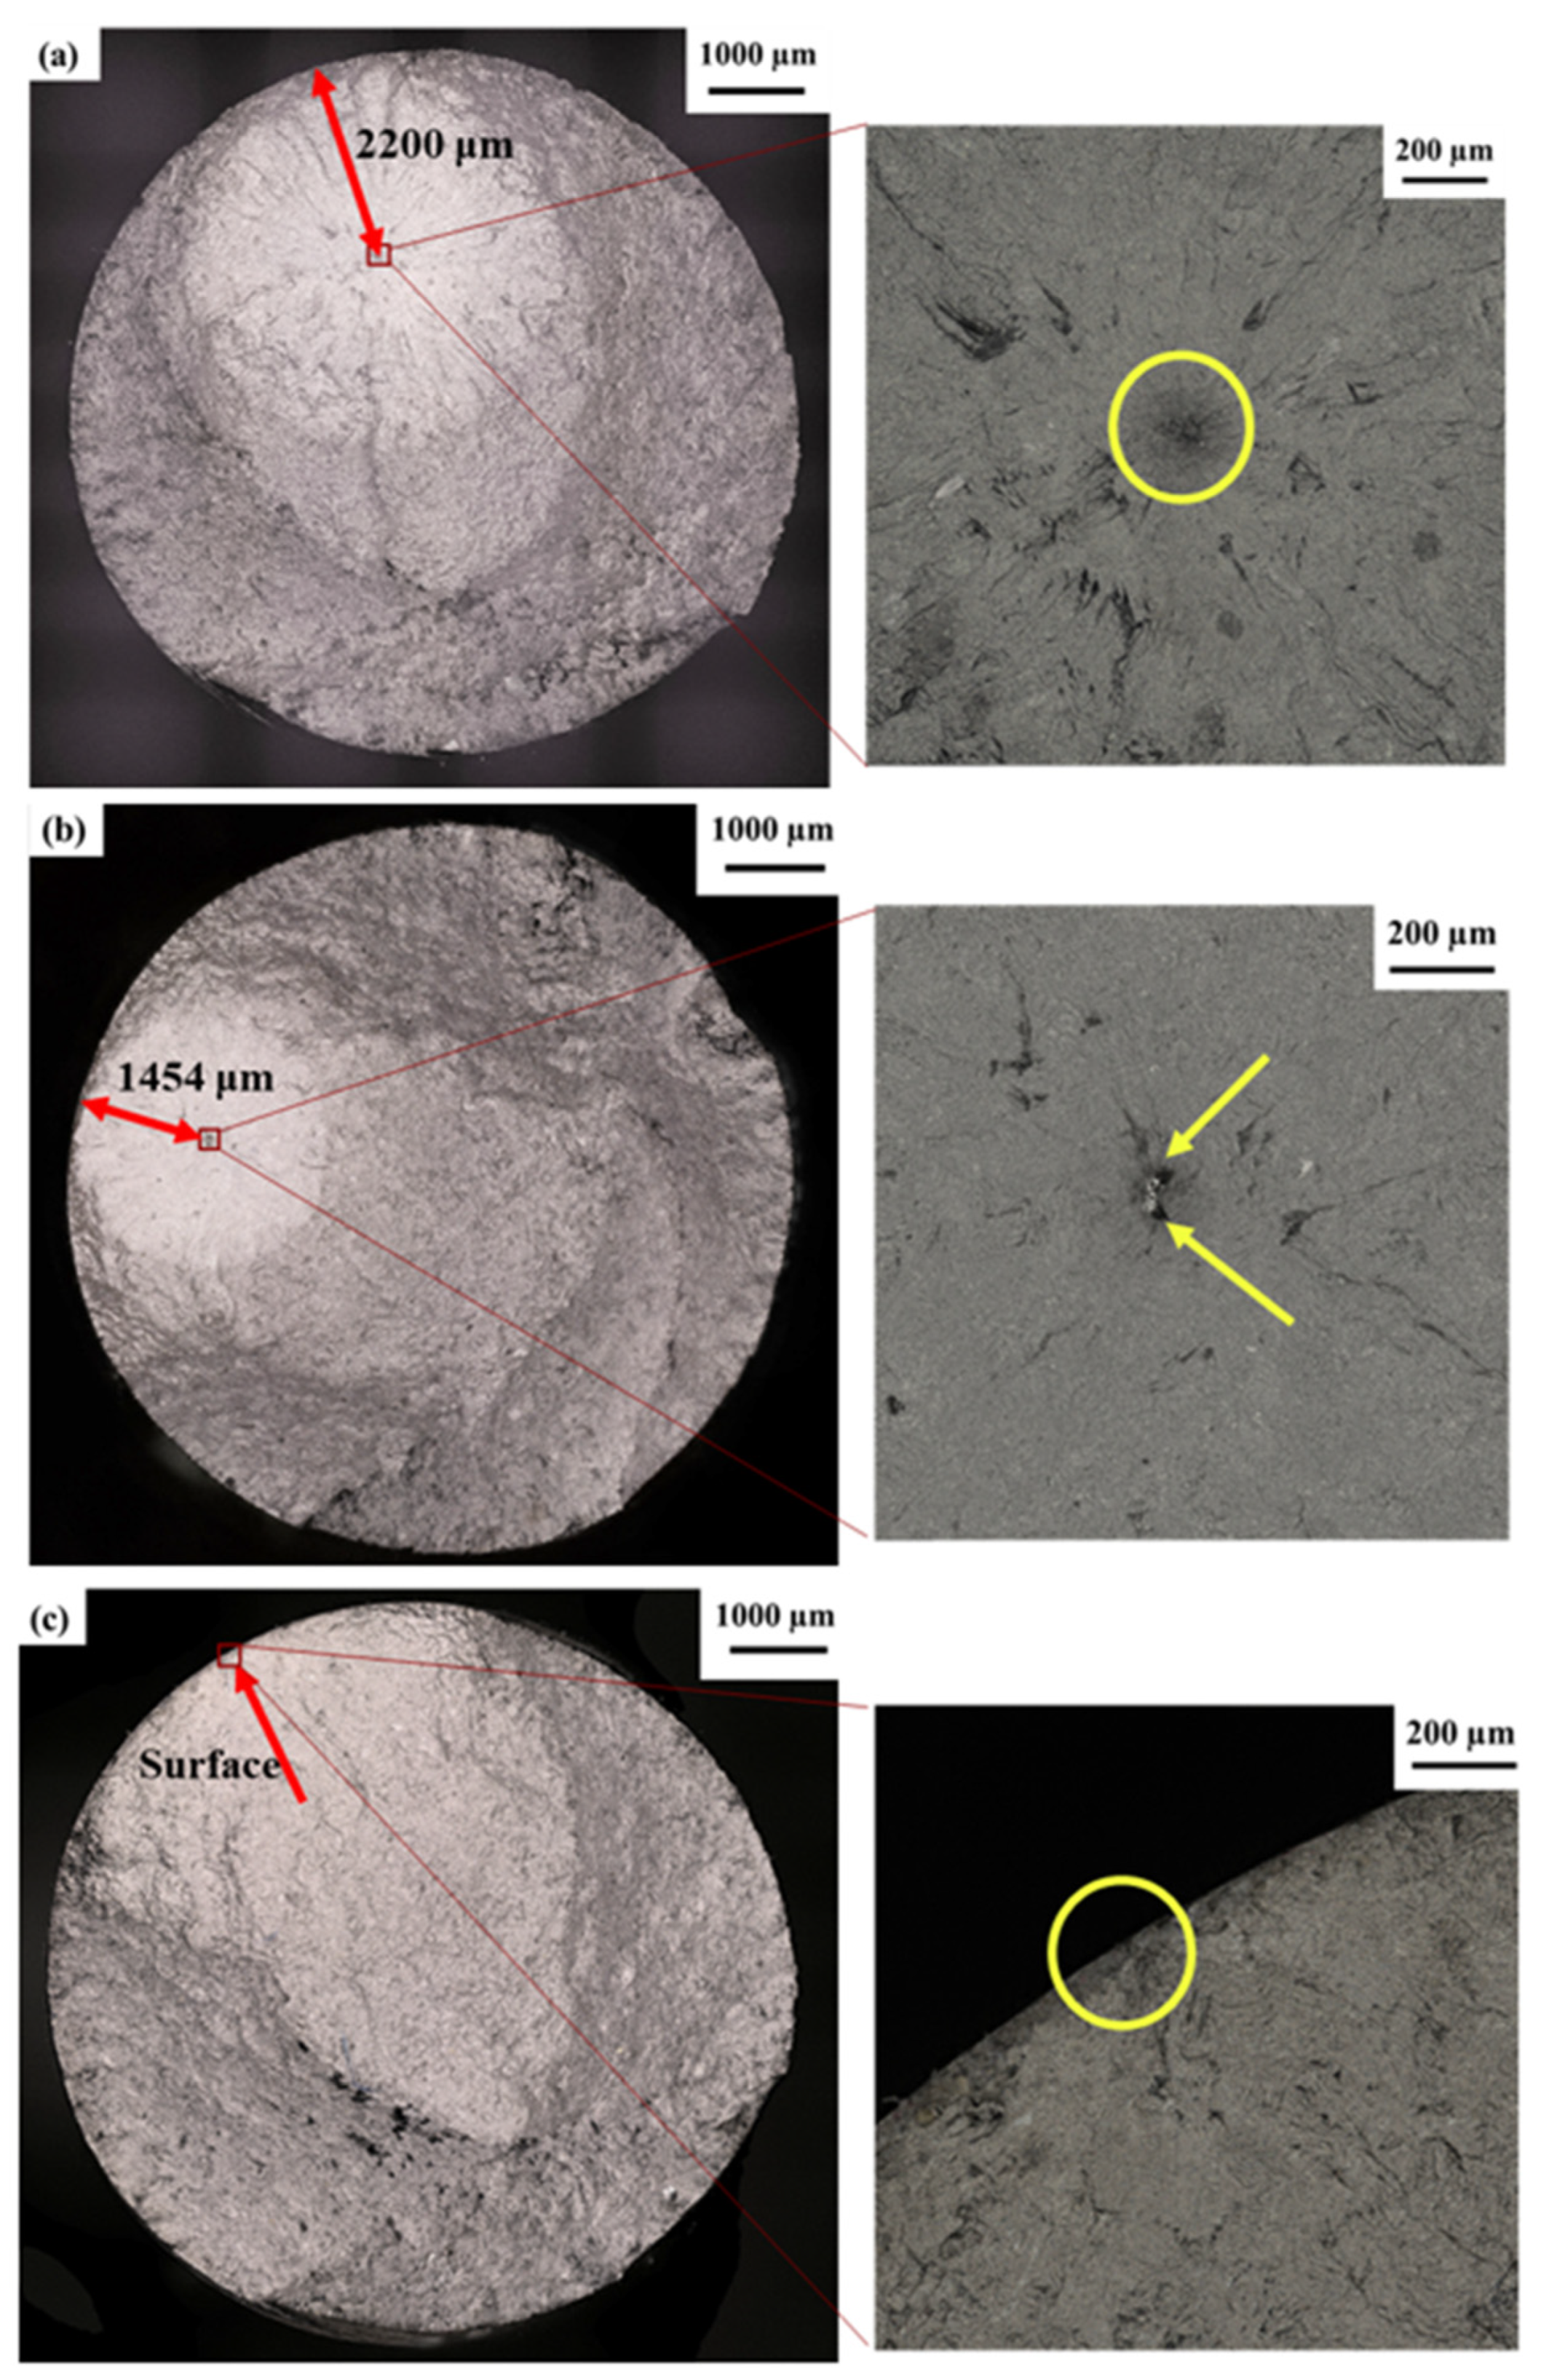
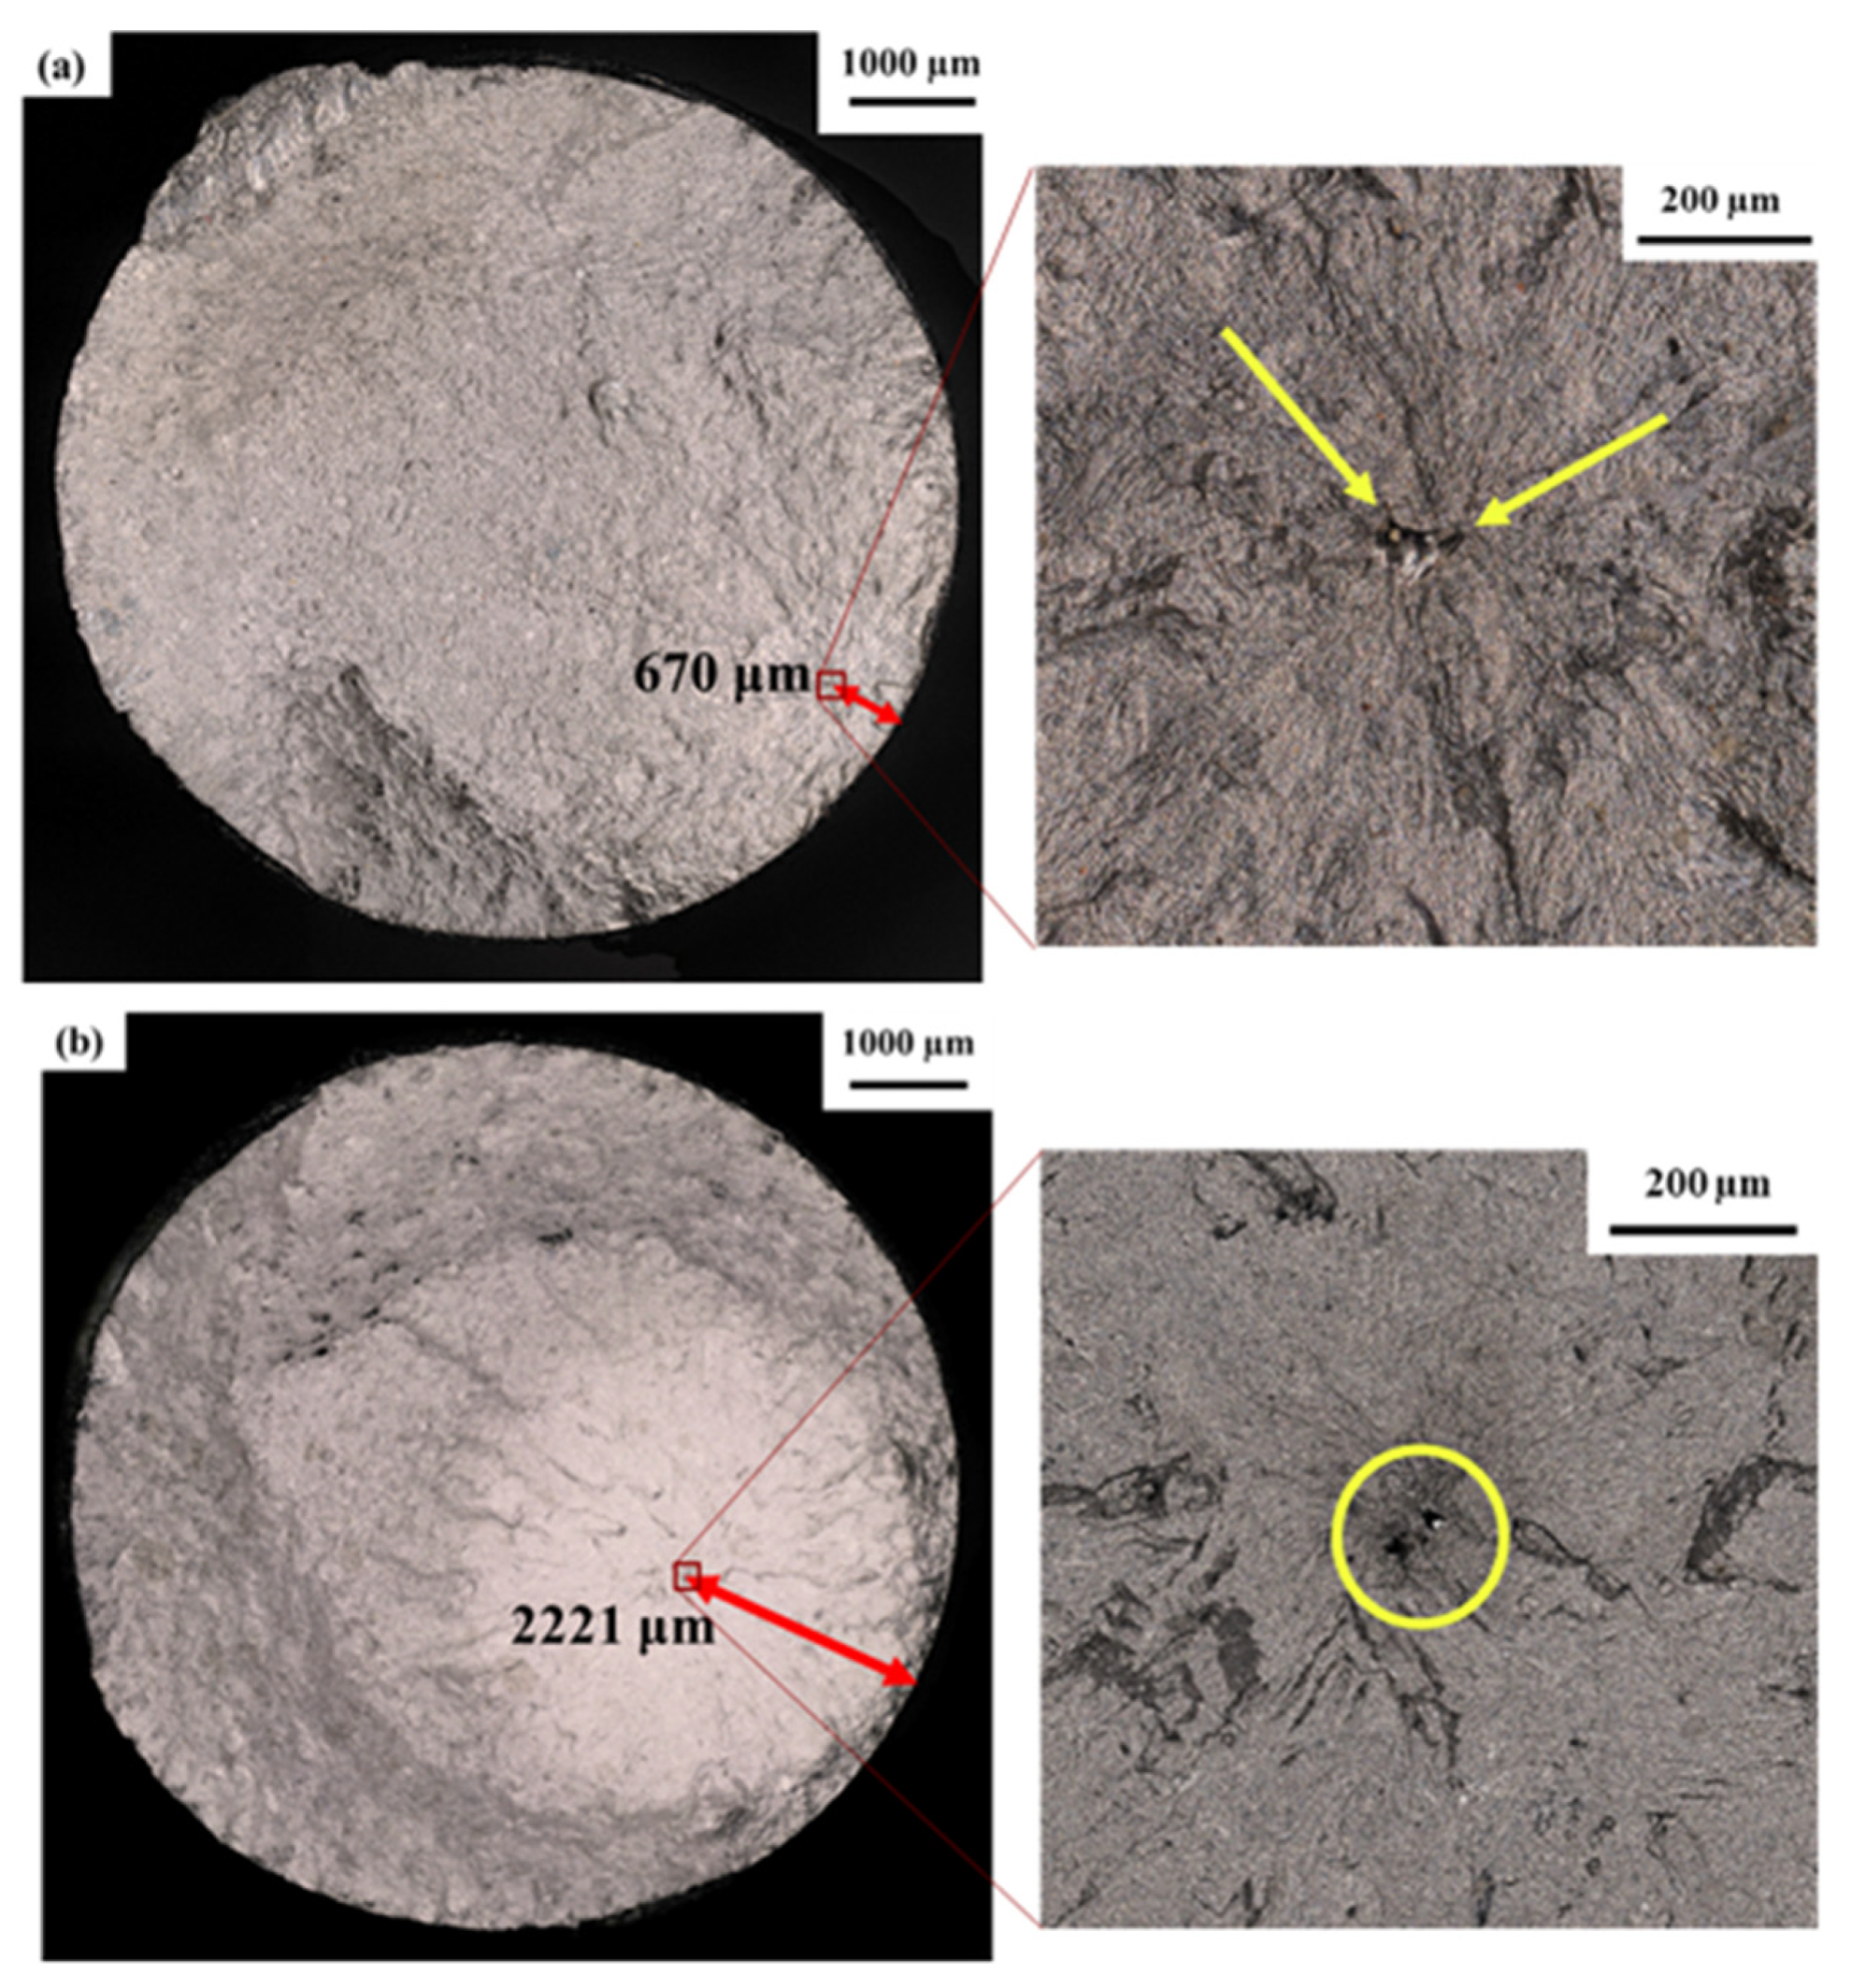
3.3. Fatigue Test Results and Fractography
3.4. Mean Stress Correction Modeling
4. LSP on Machined Surface Samples
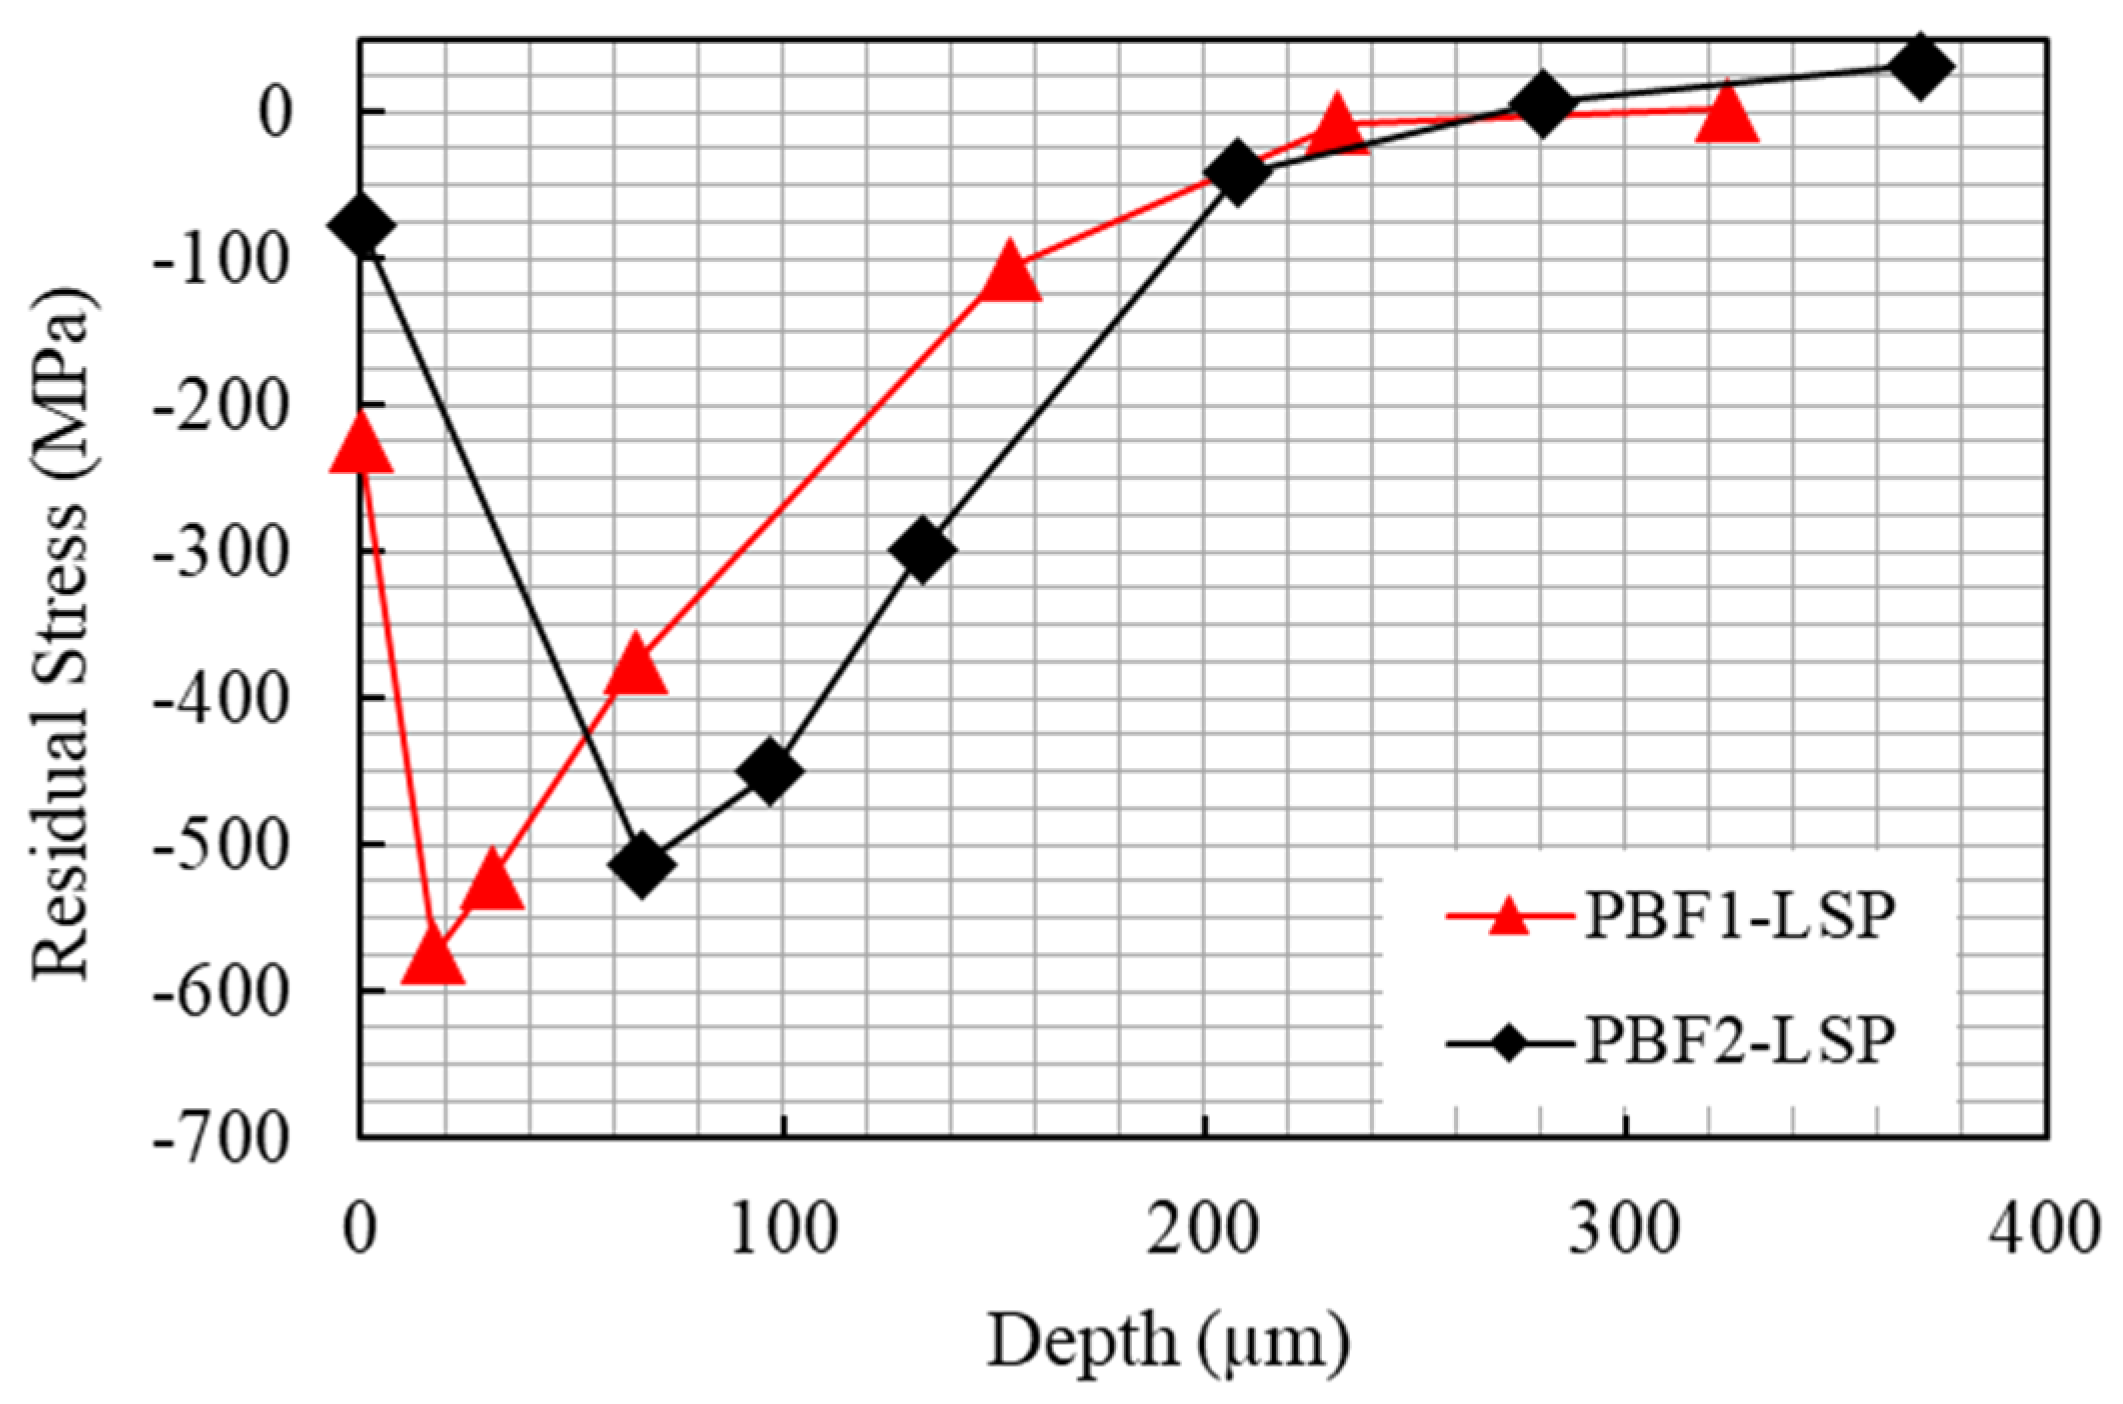
4.1. Residual Stress
4.2. Surface Roughness
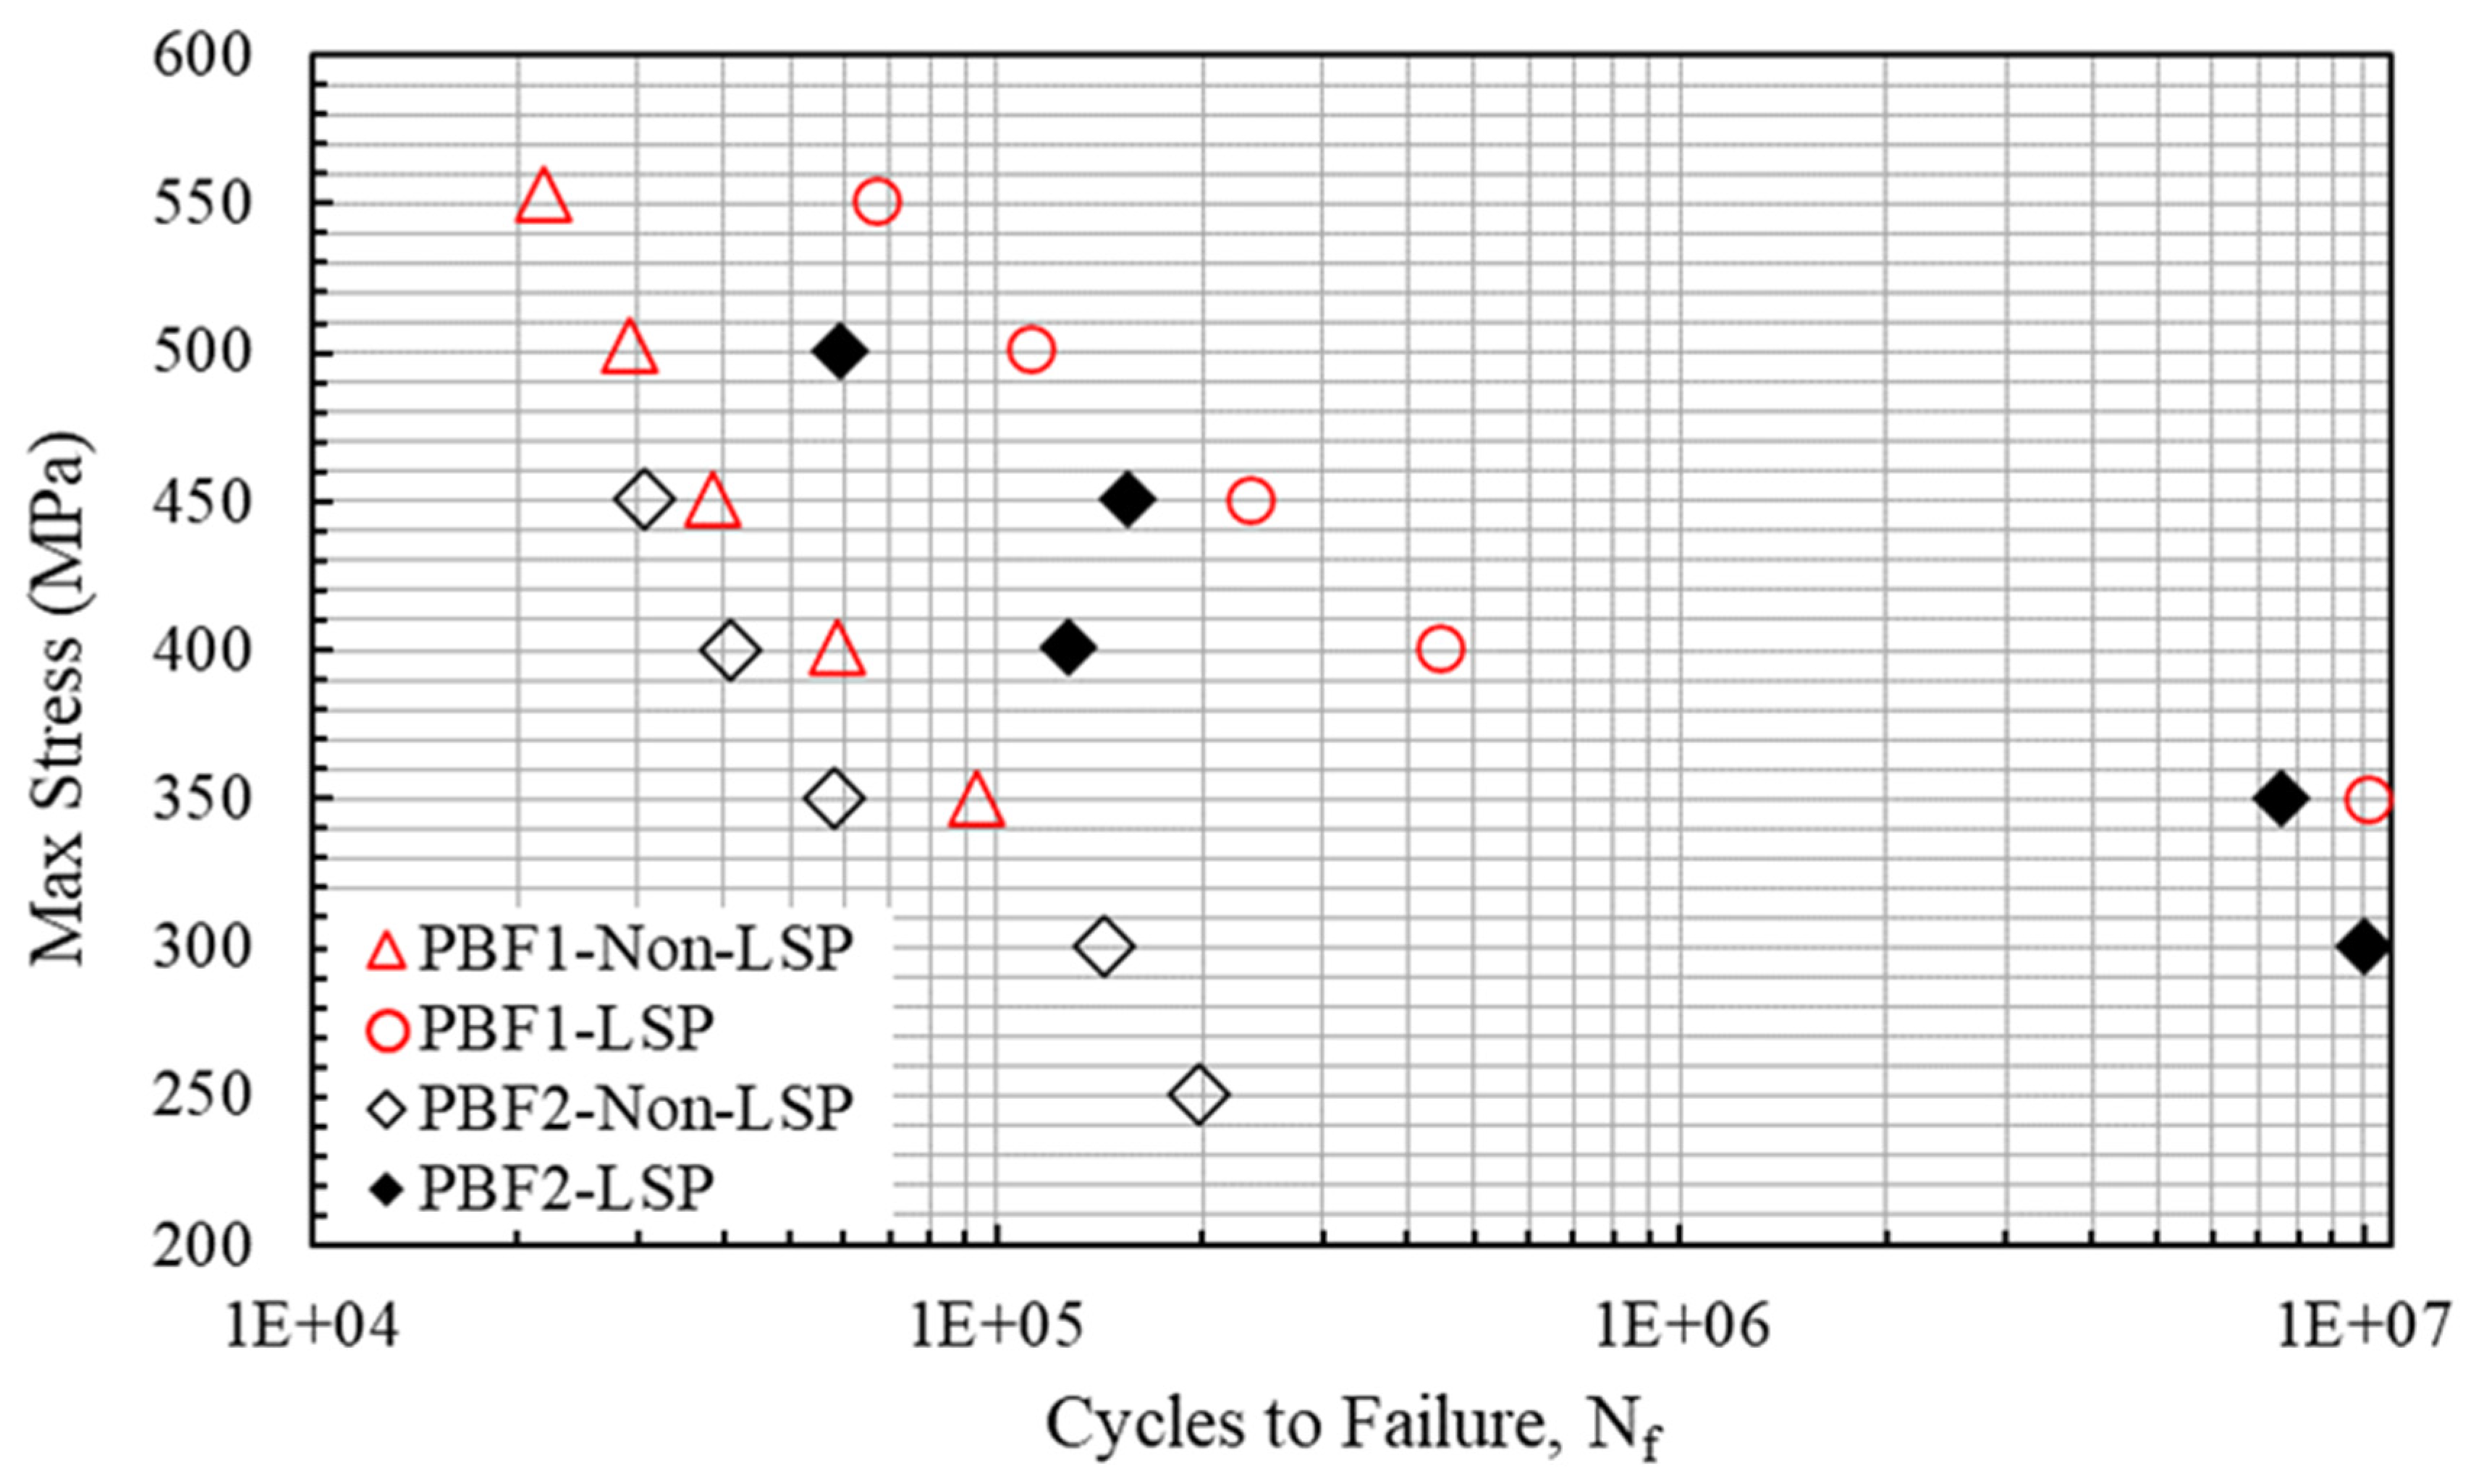
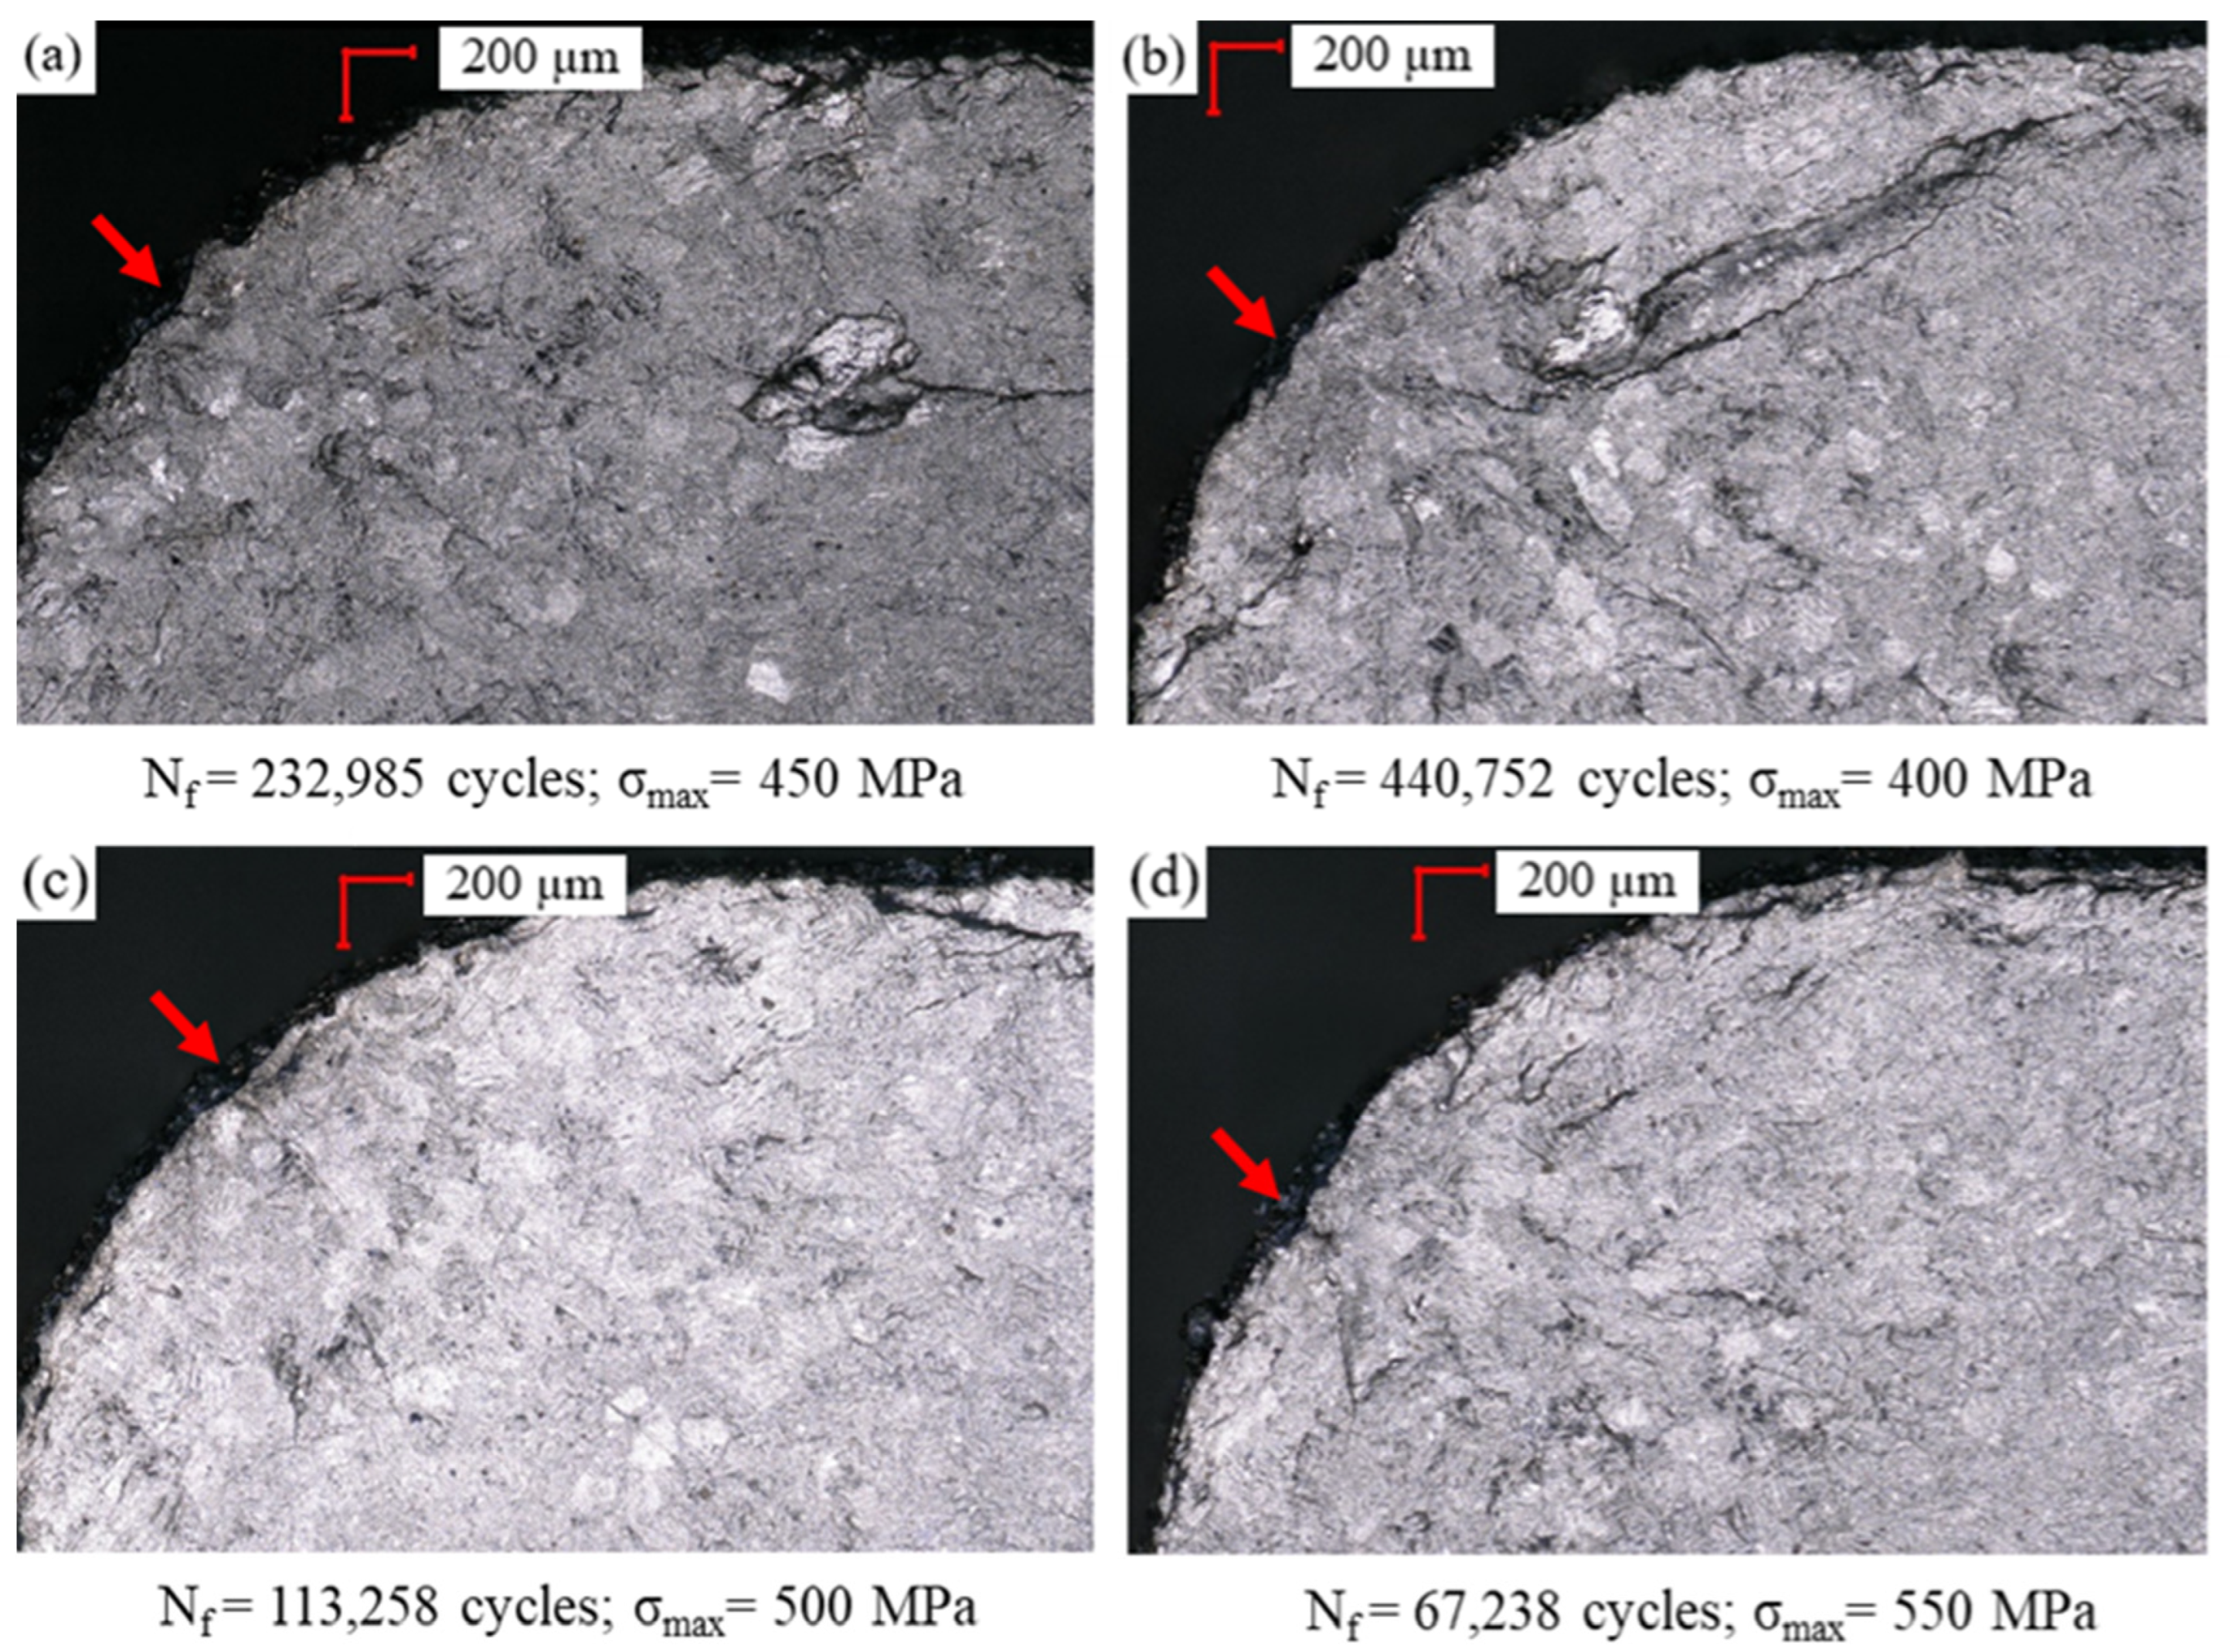
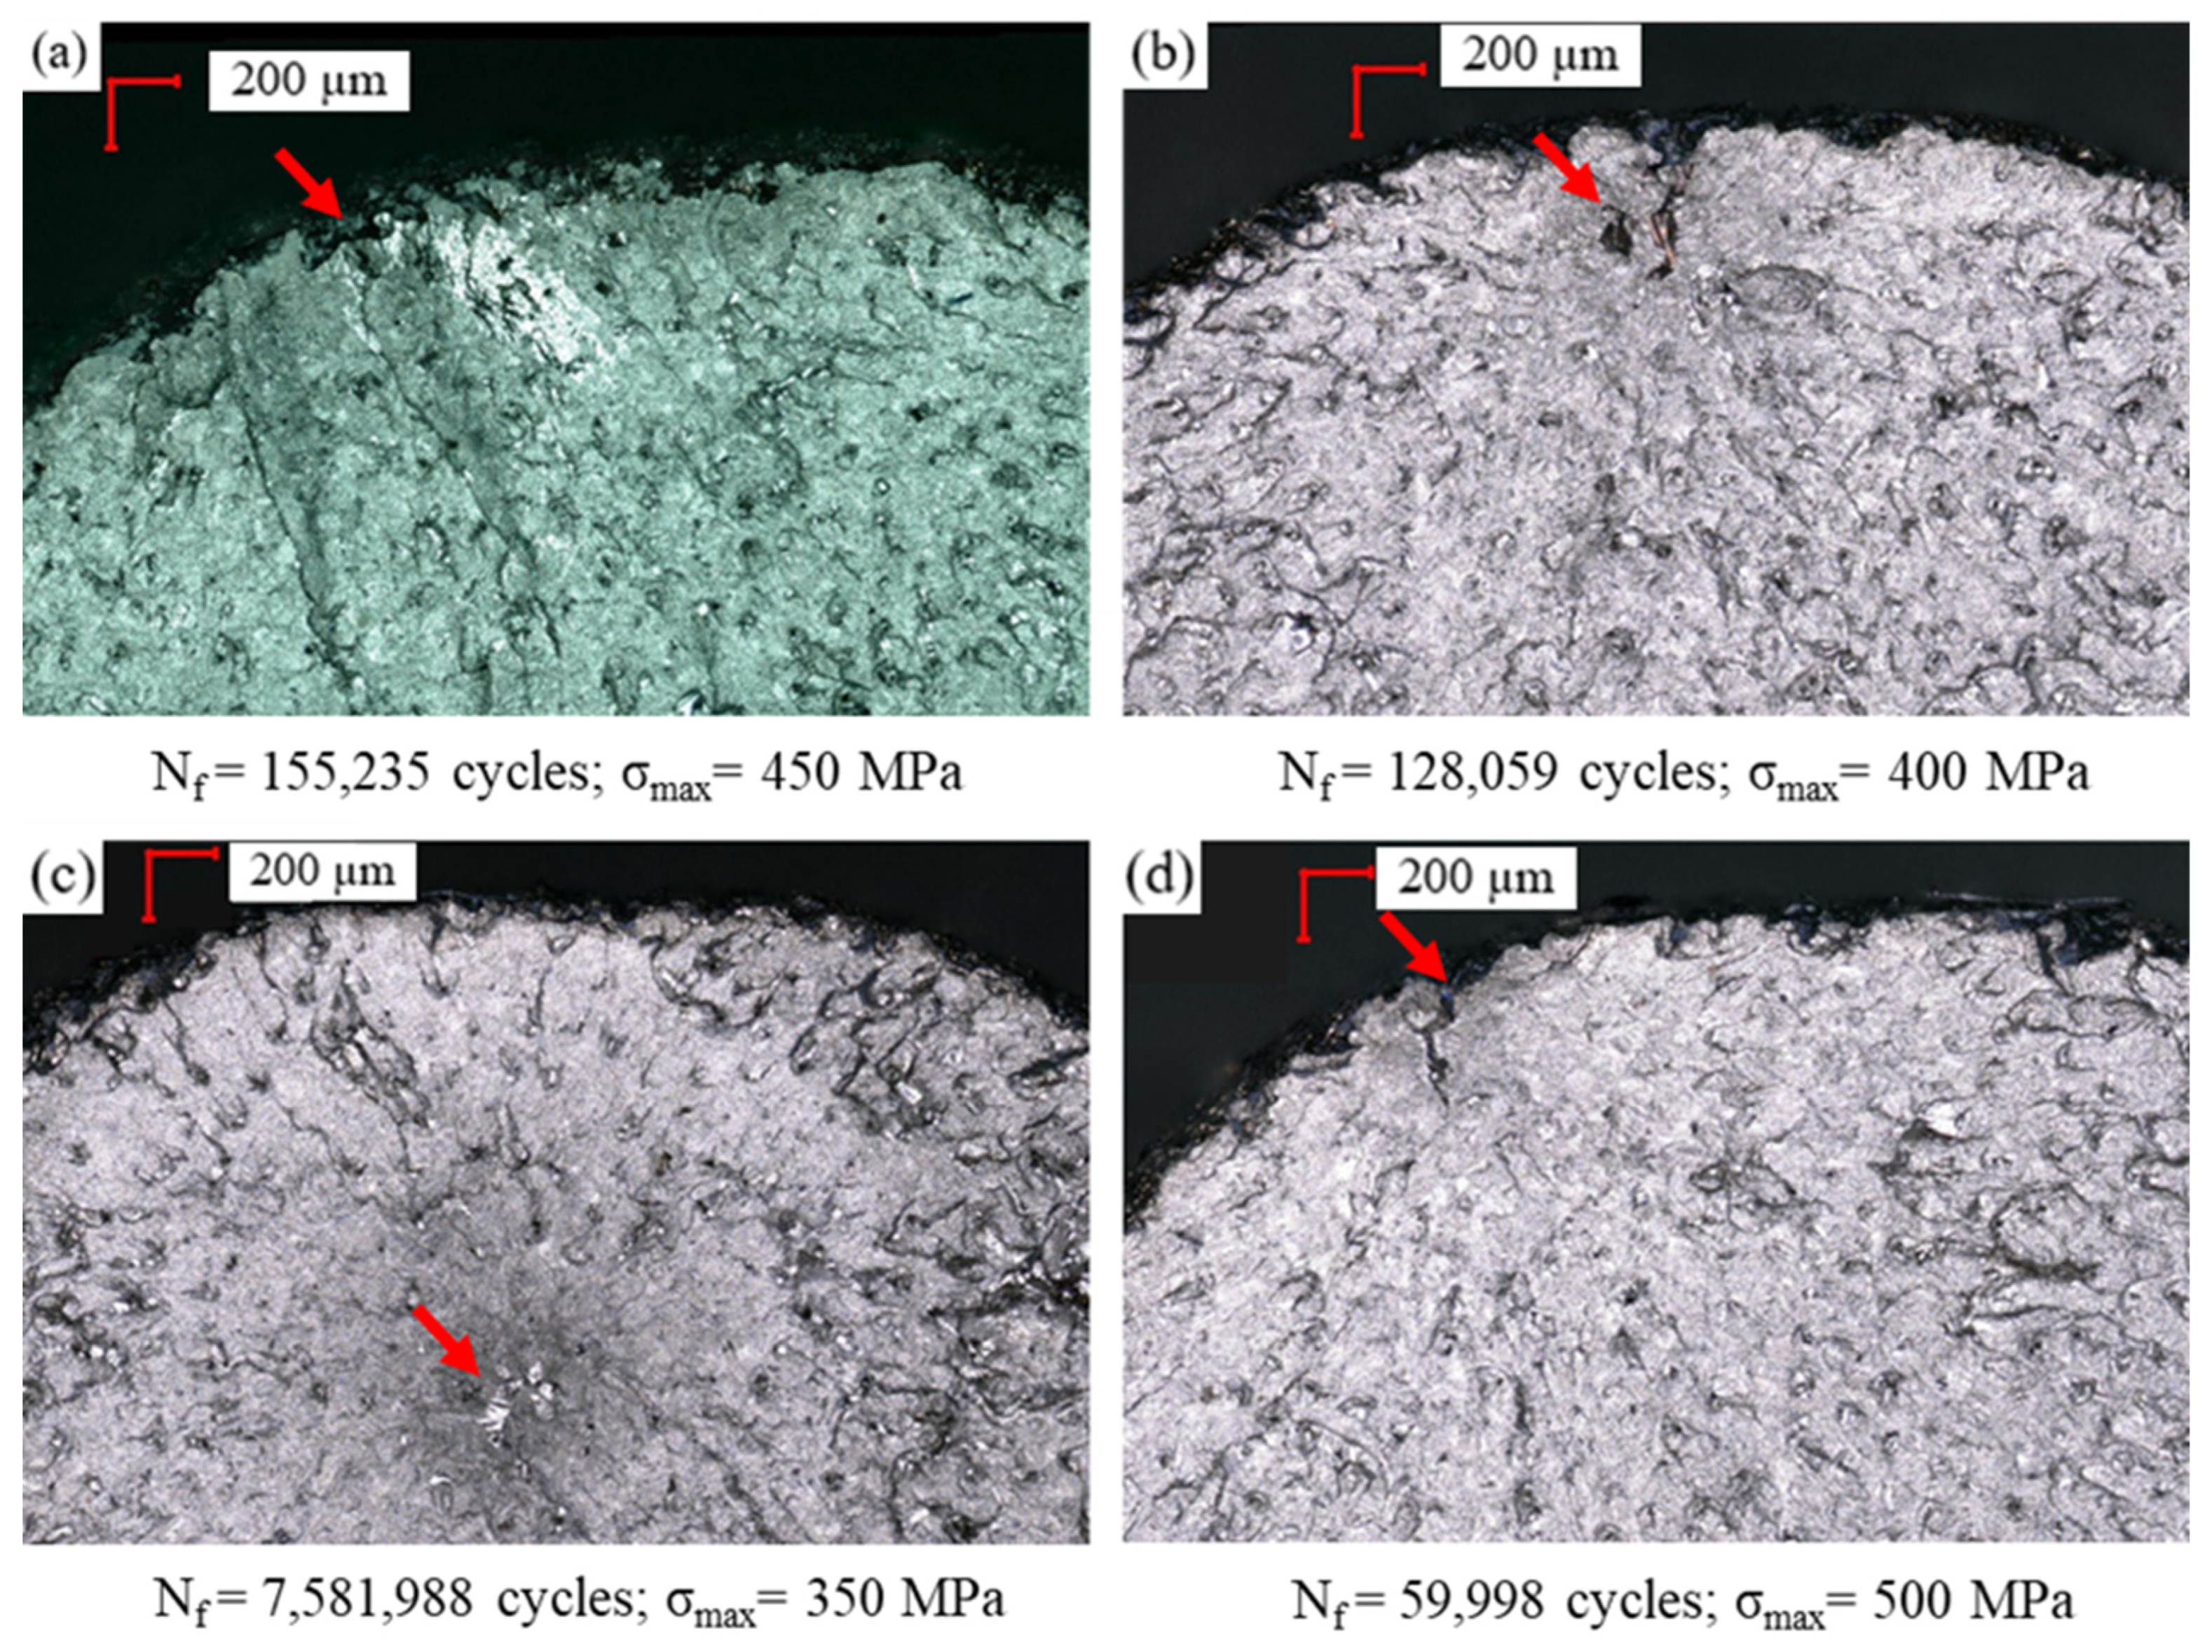
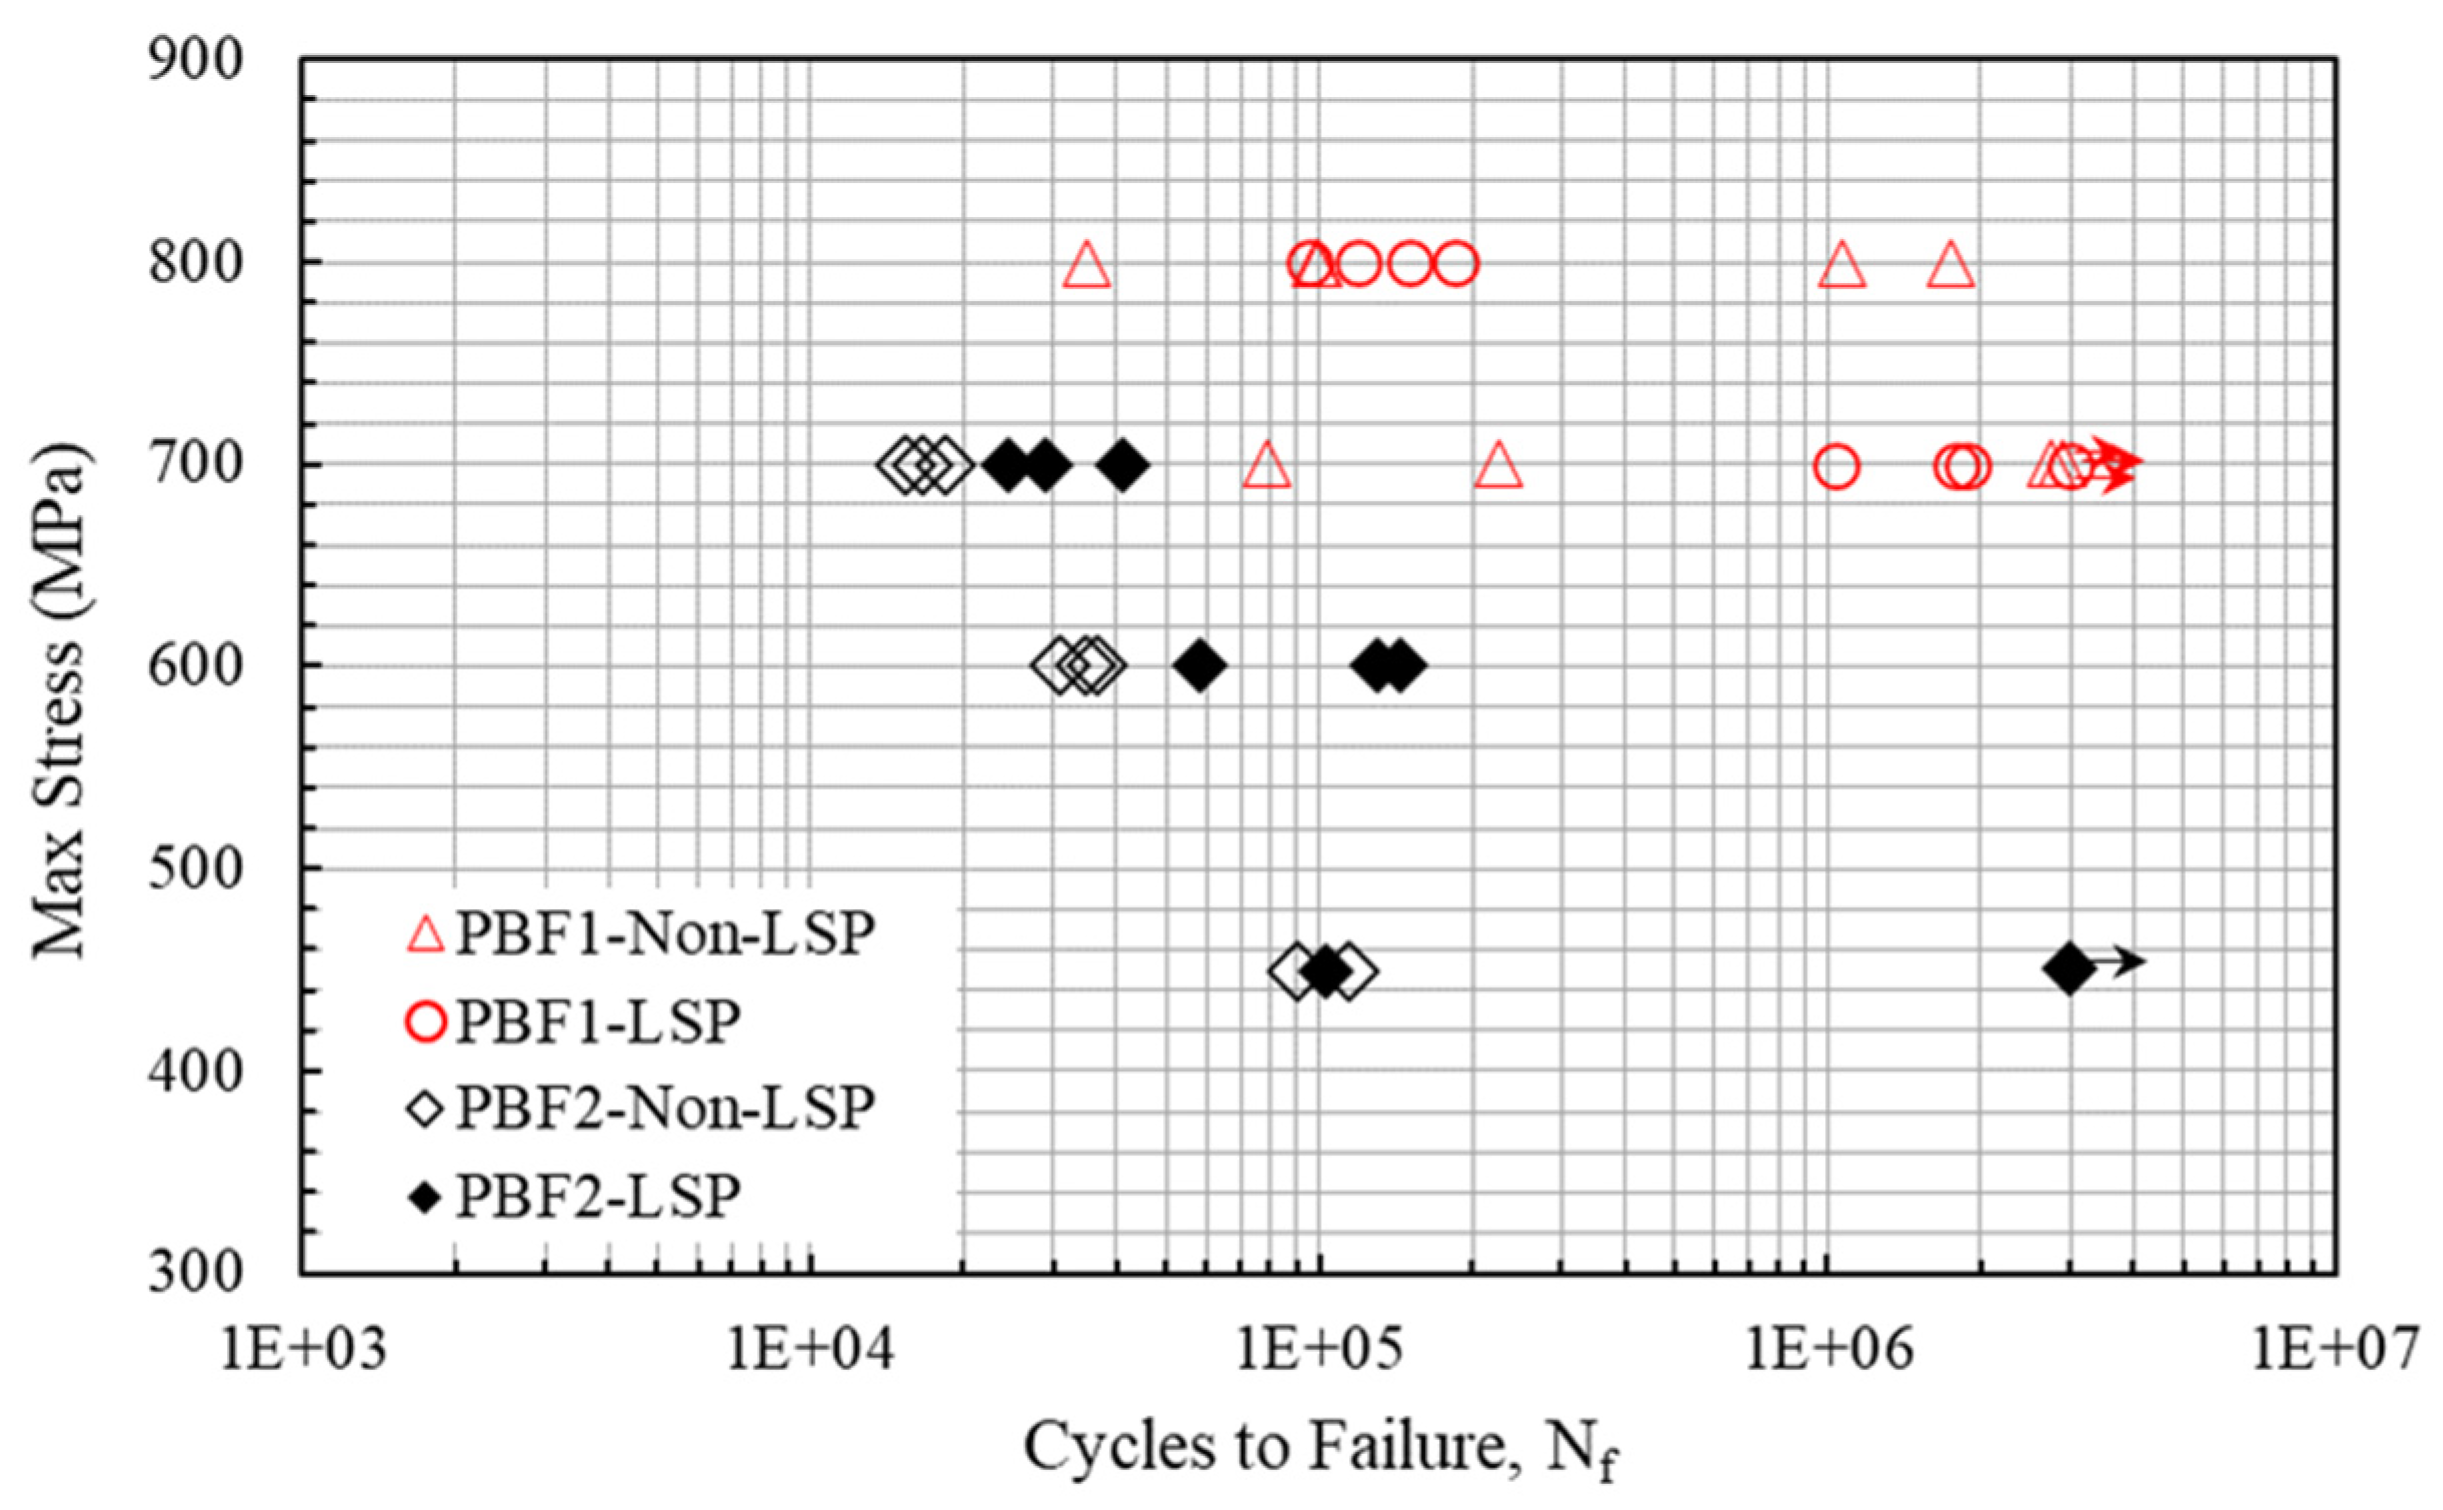
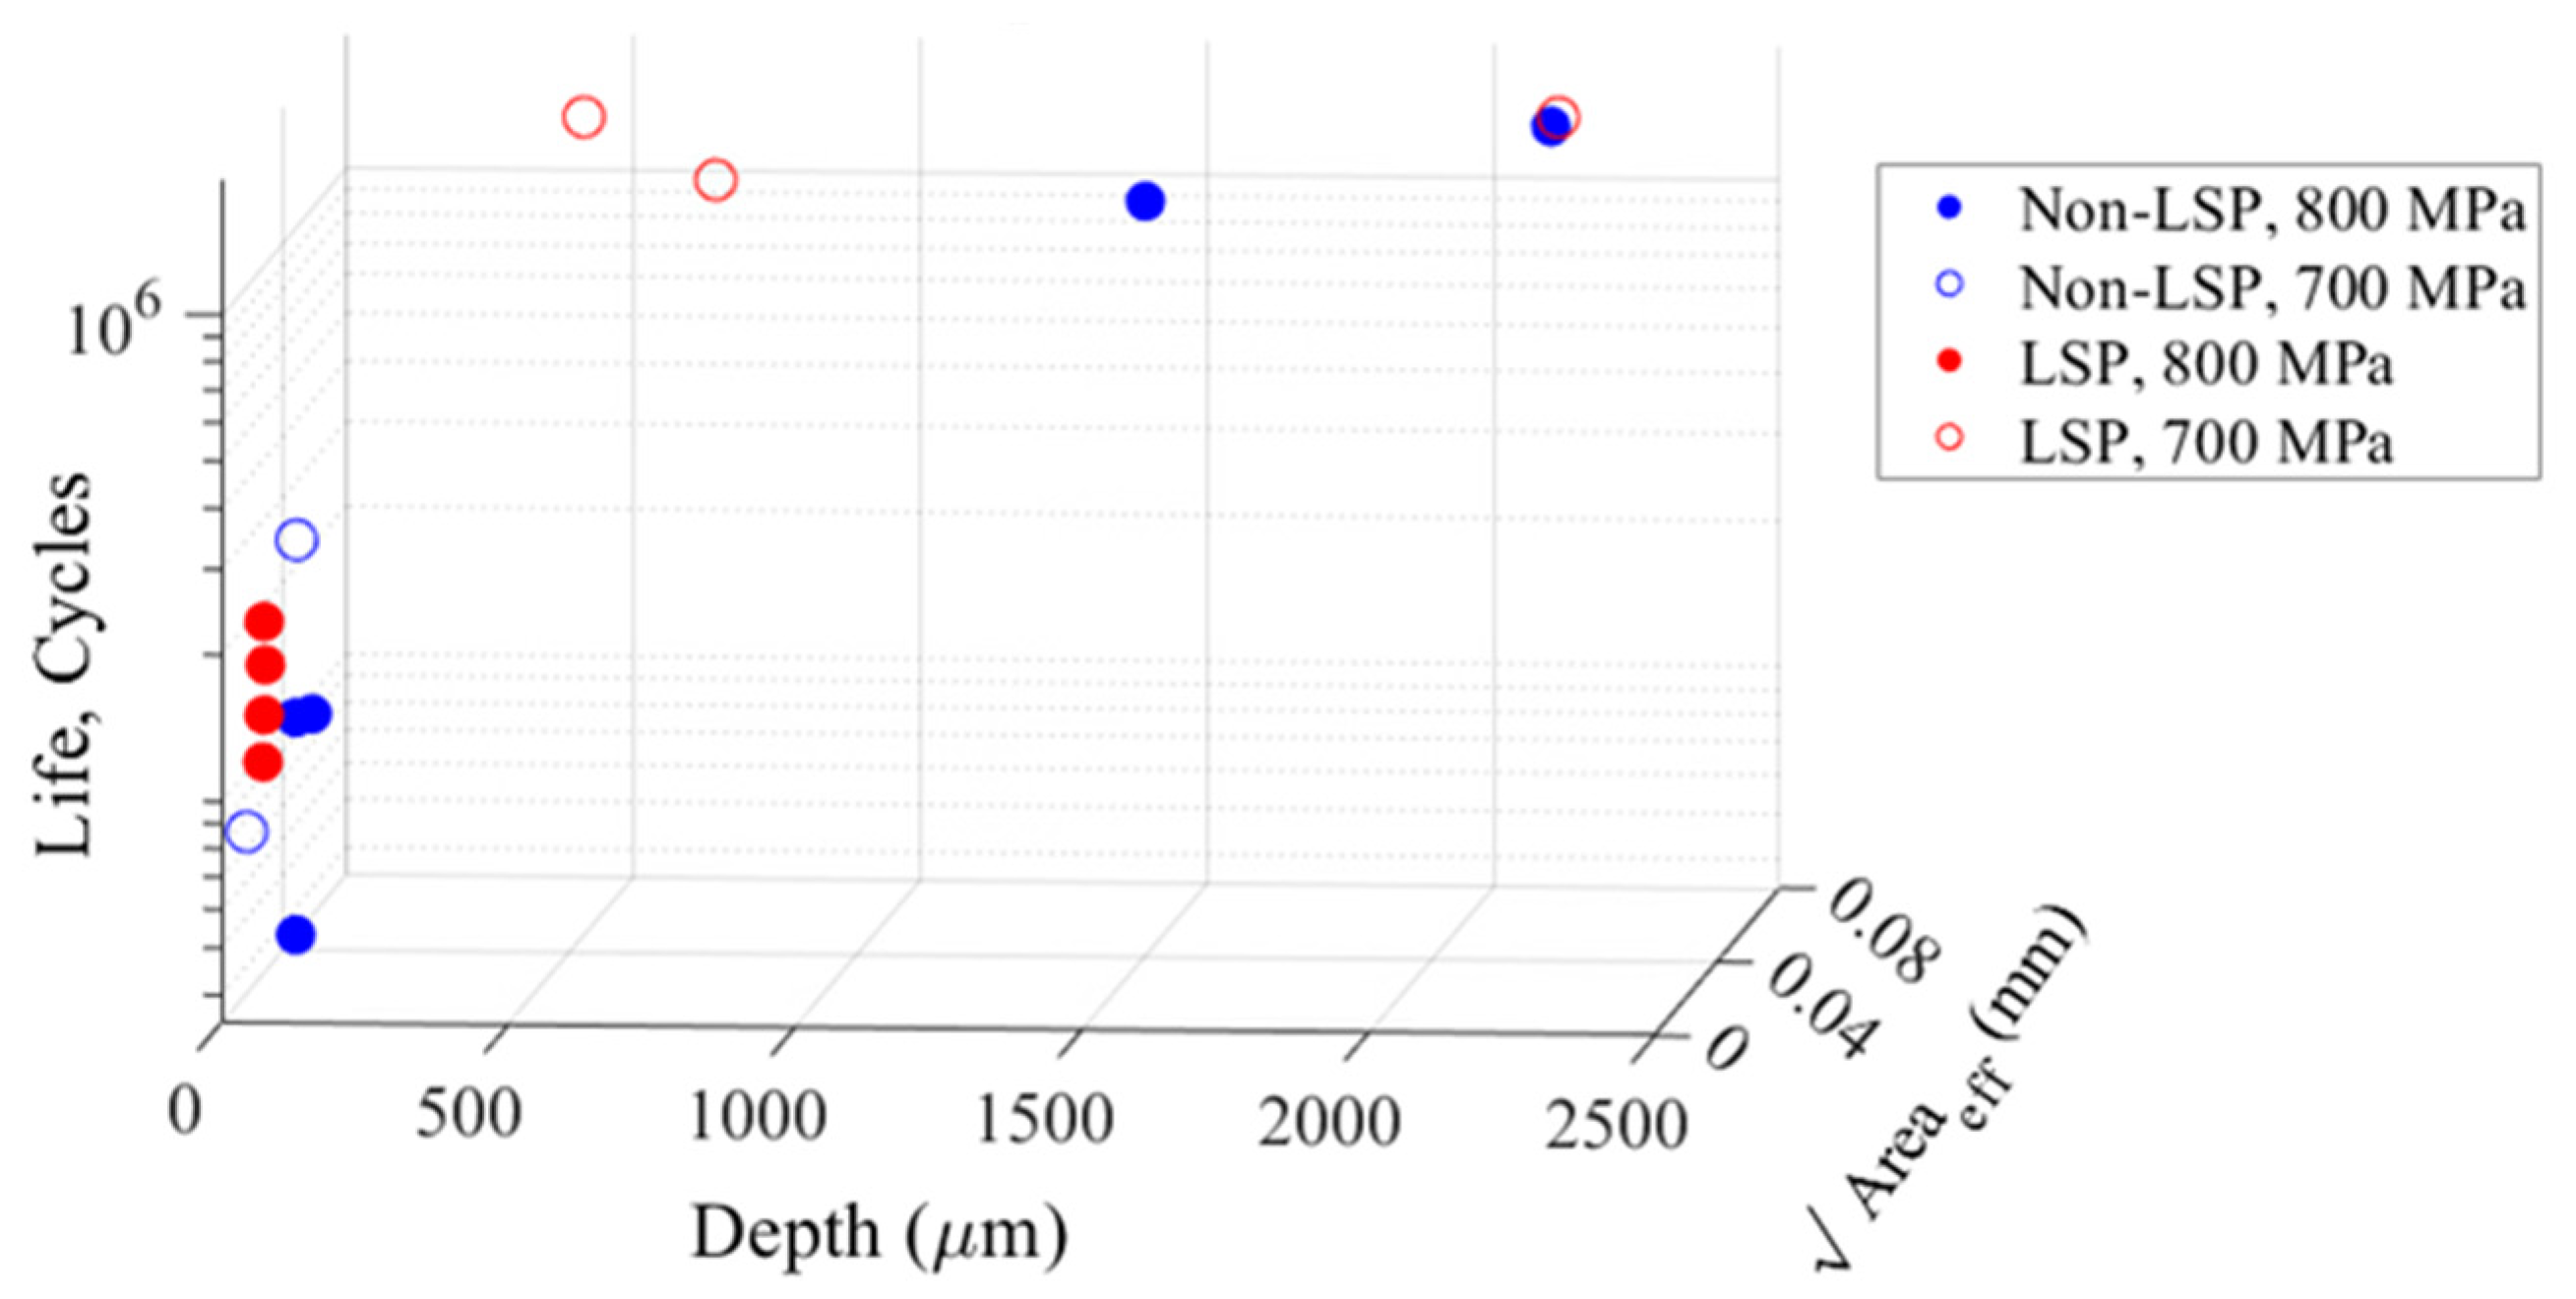
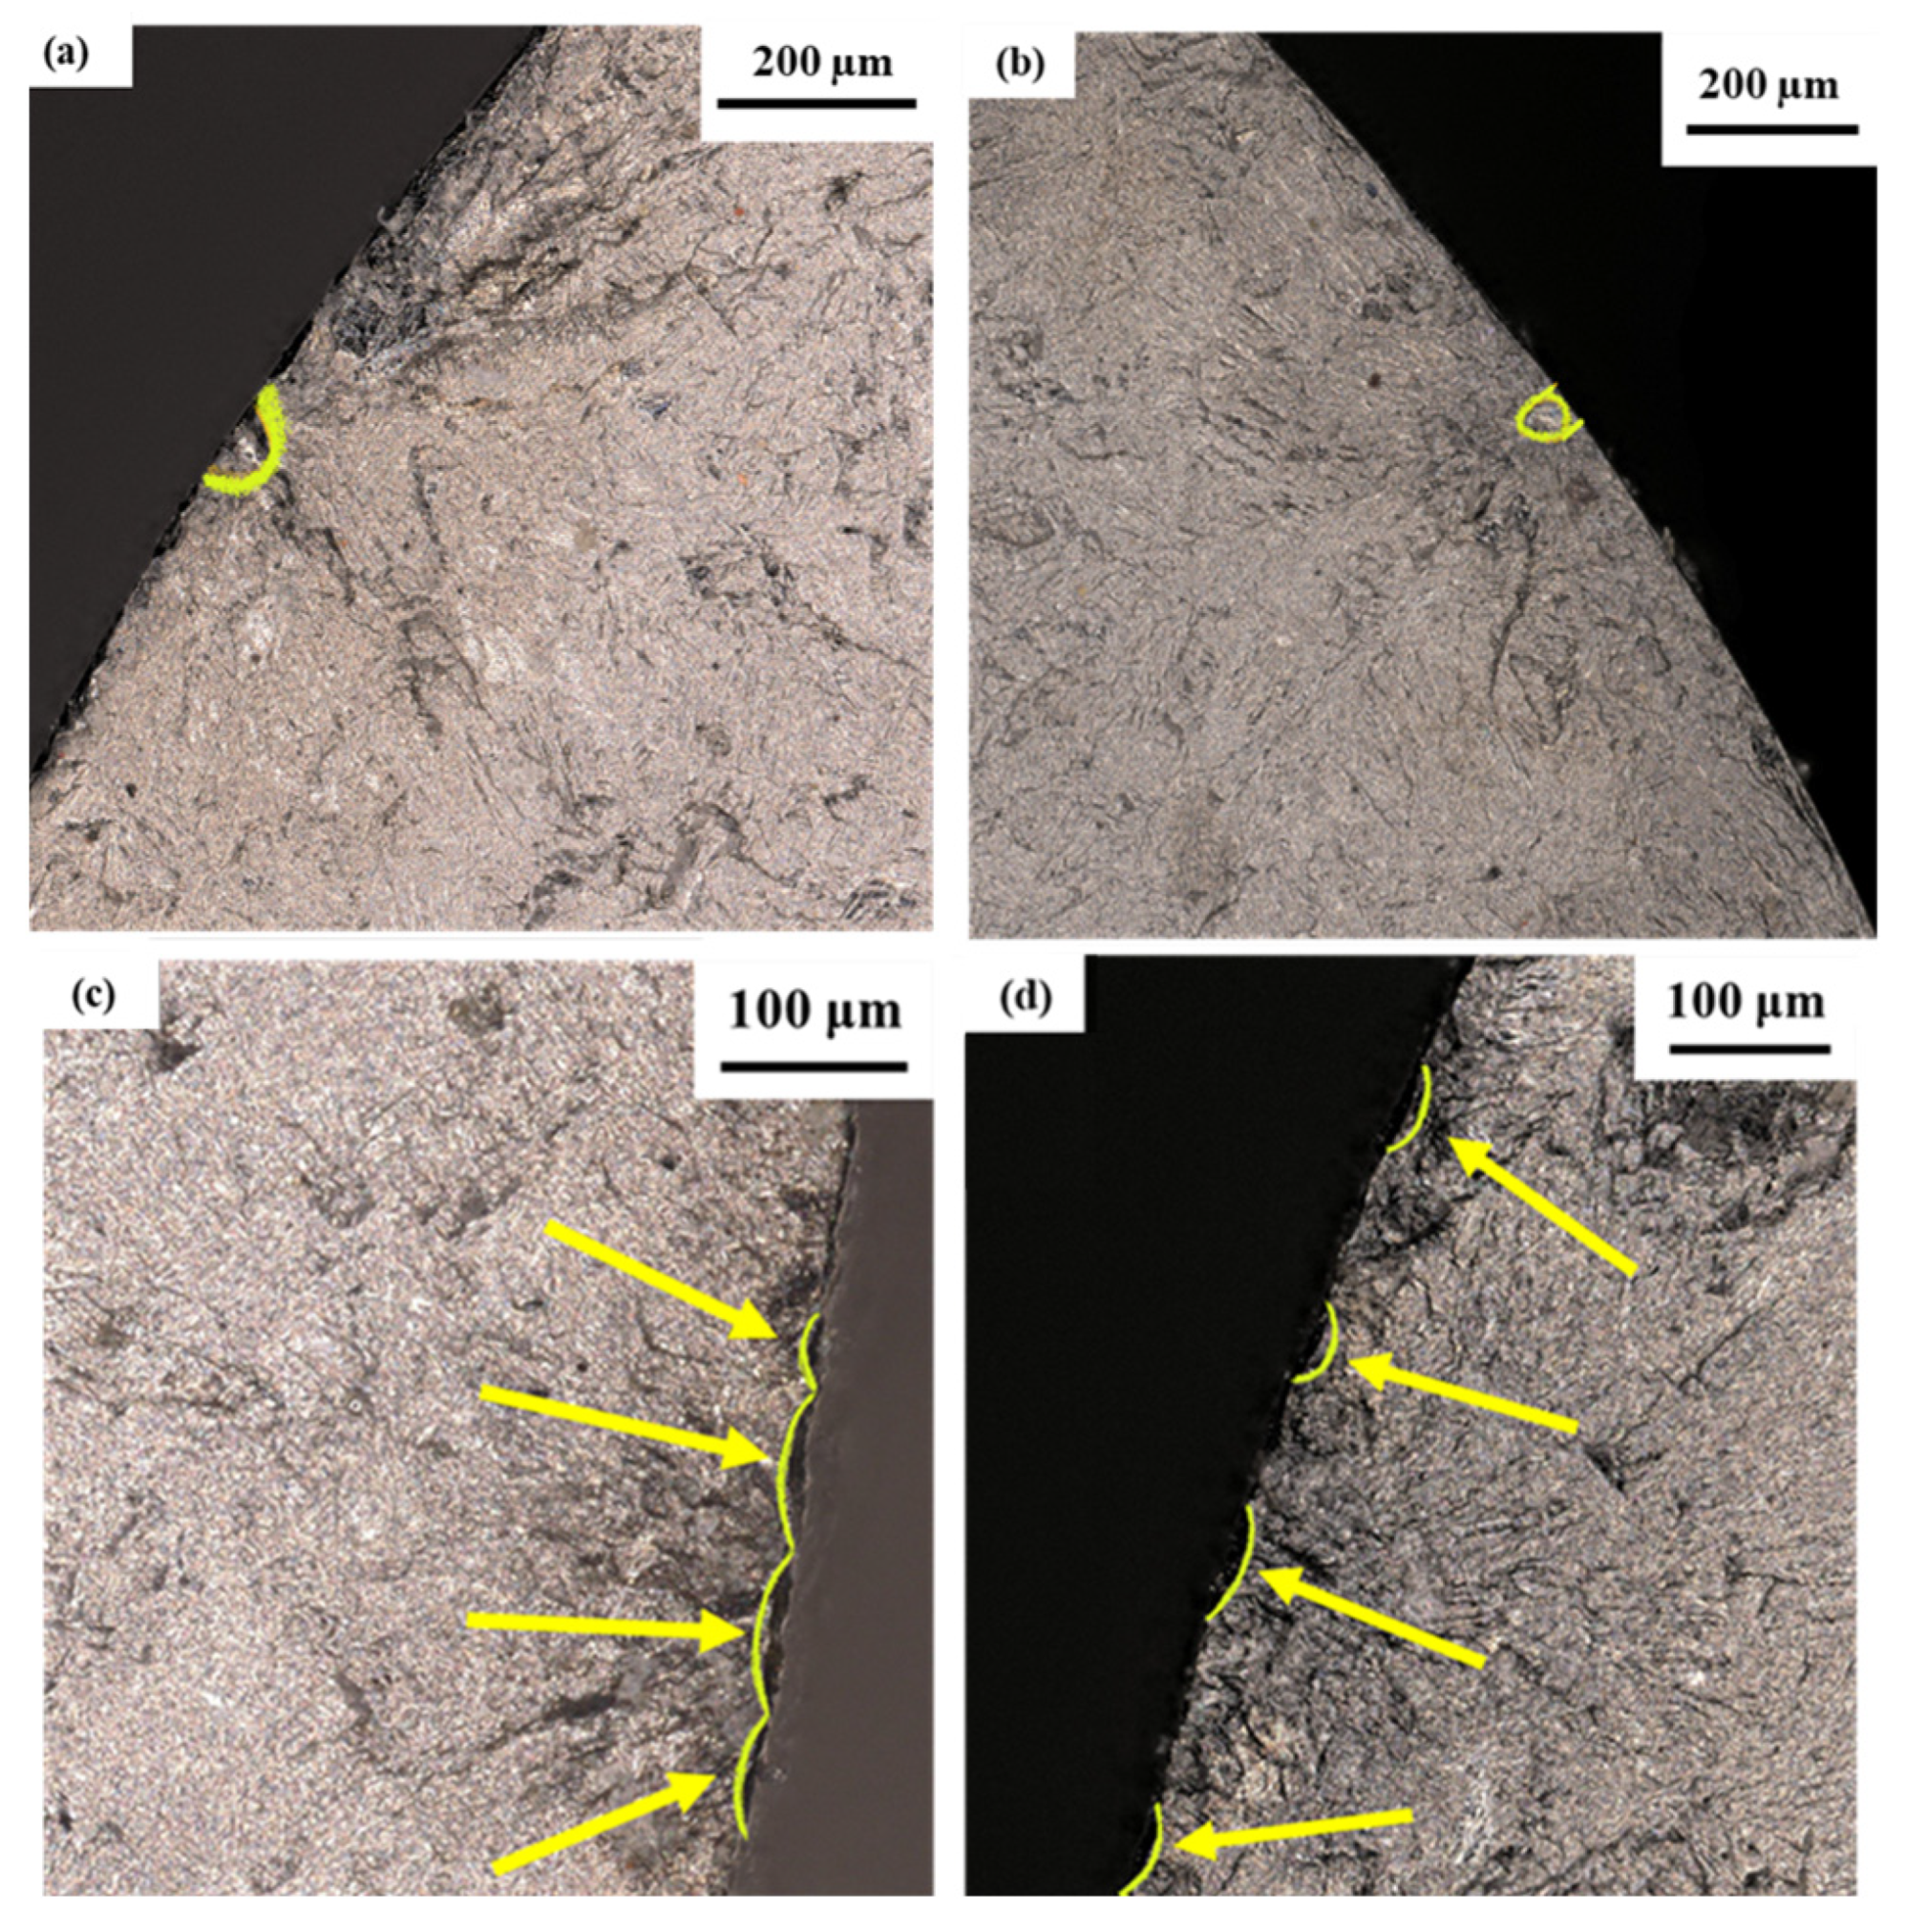
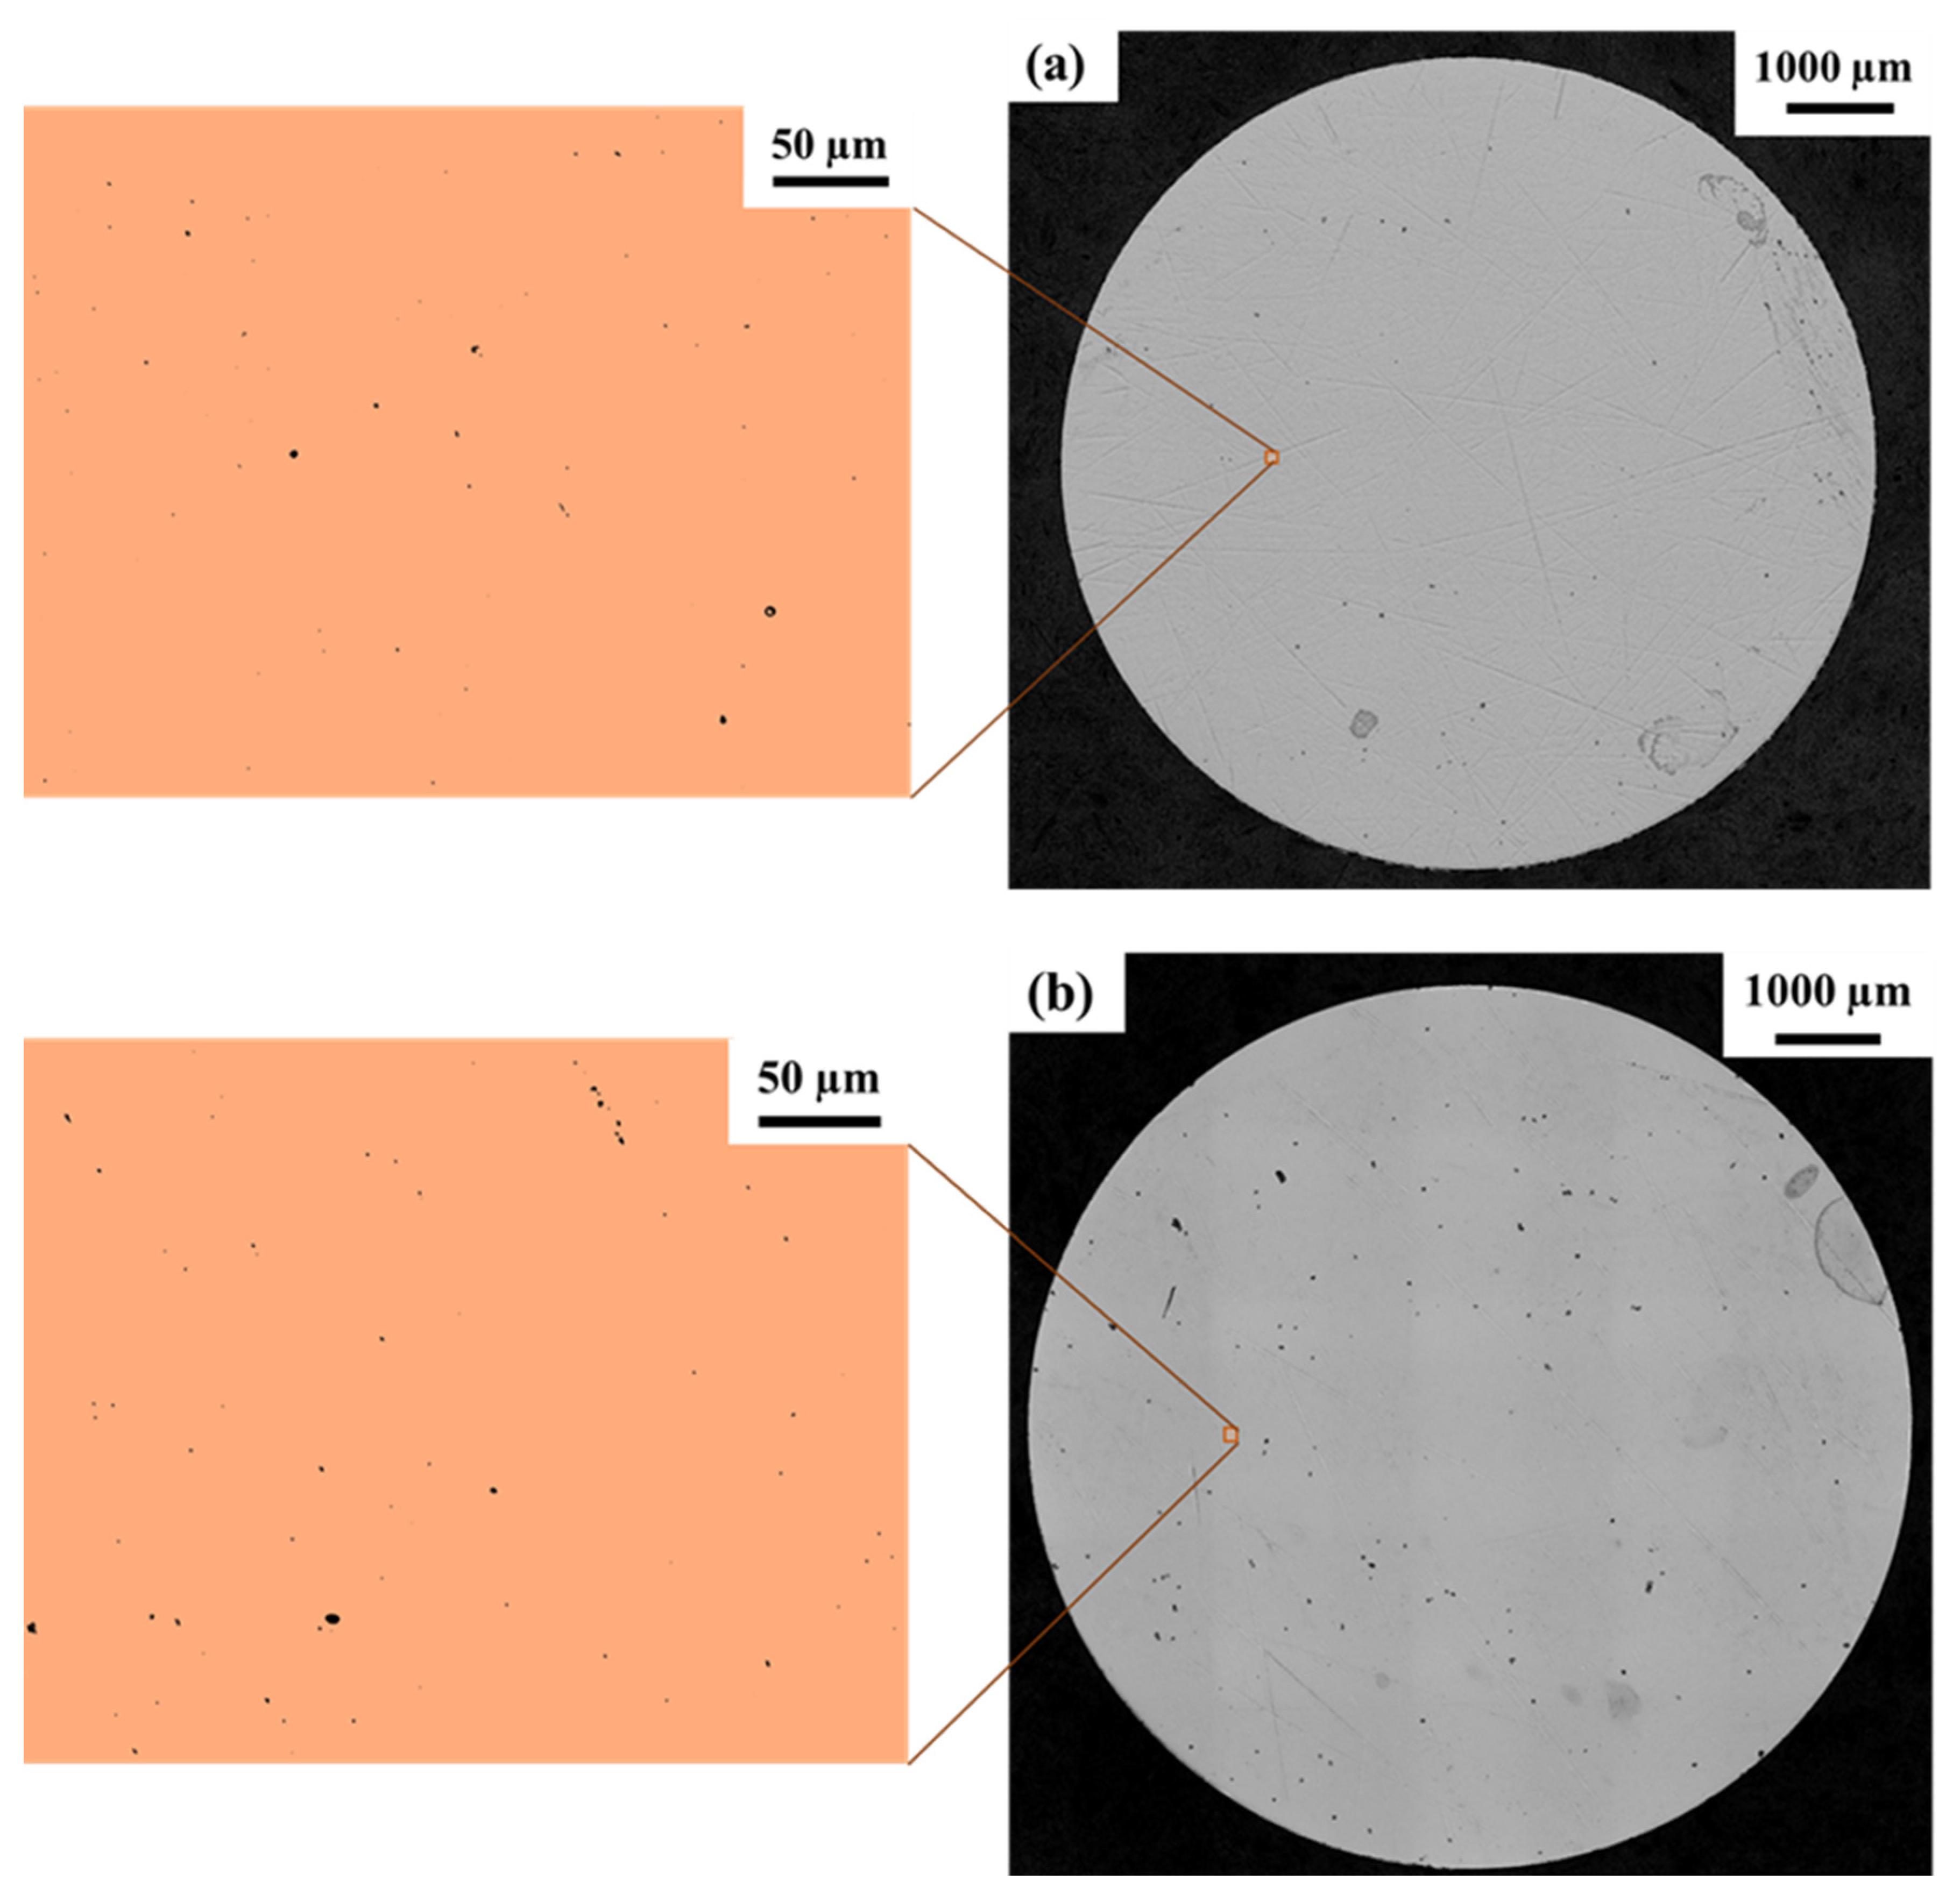
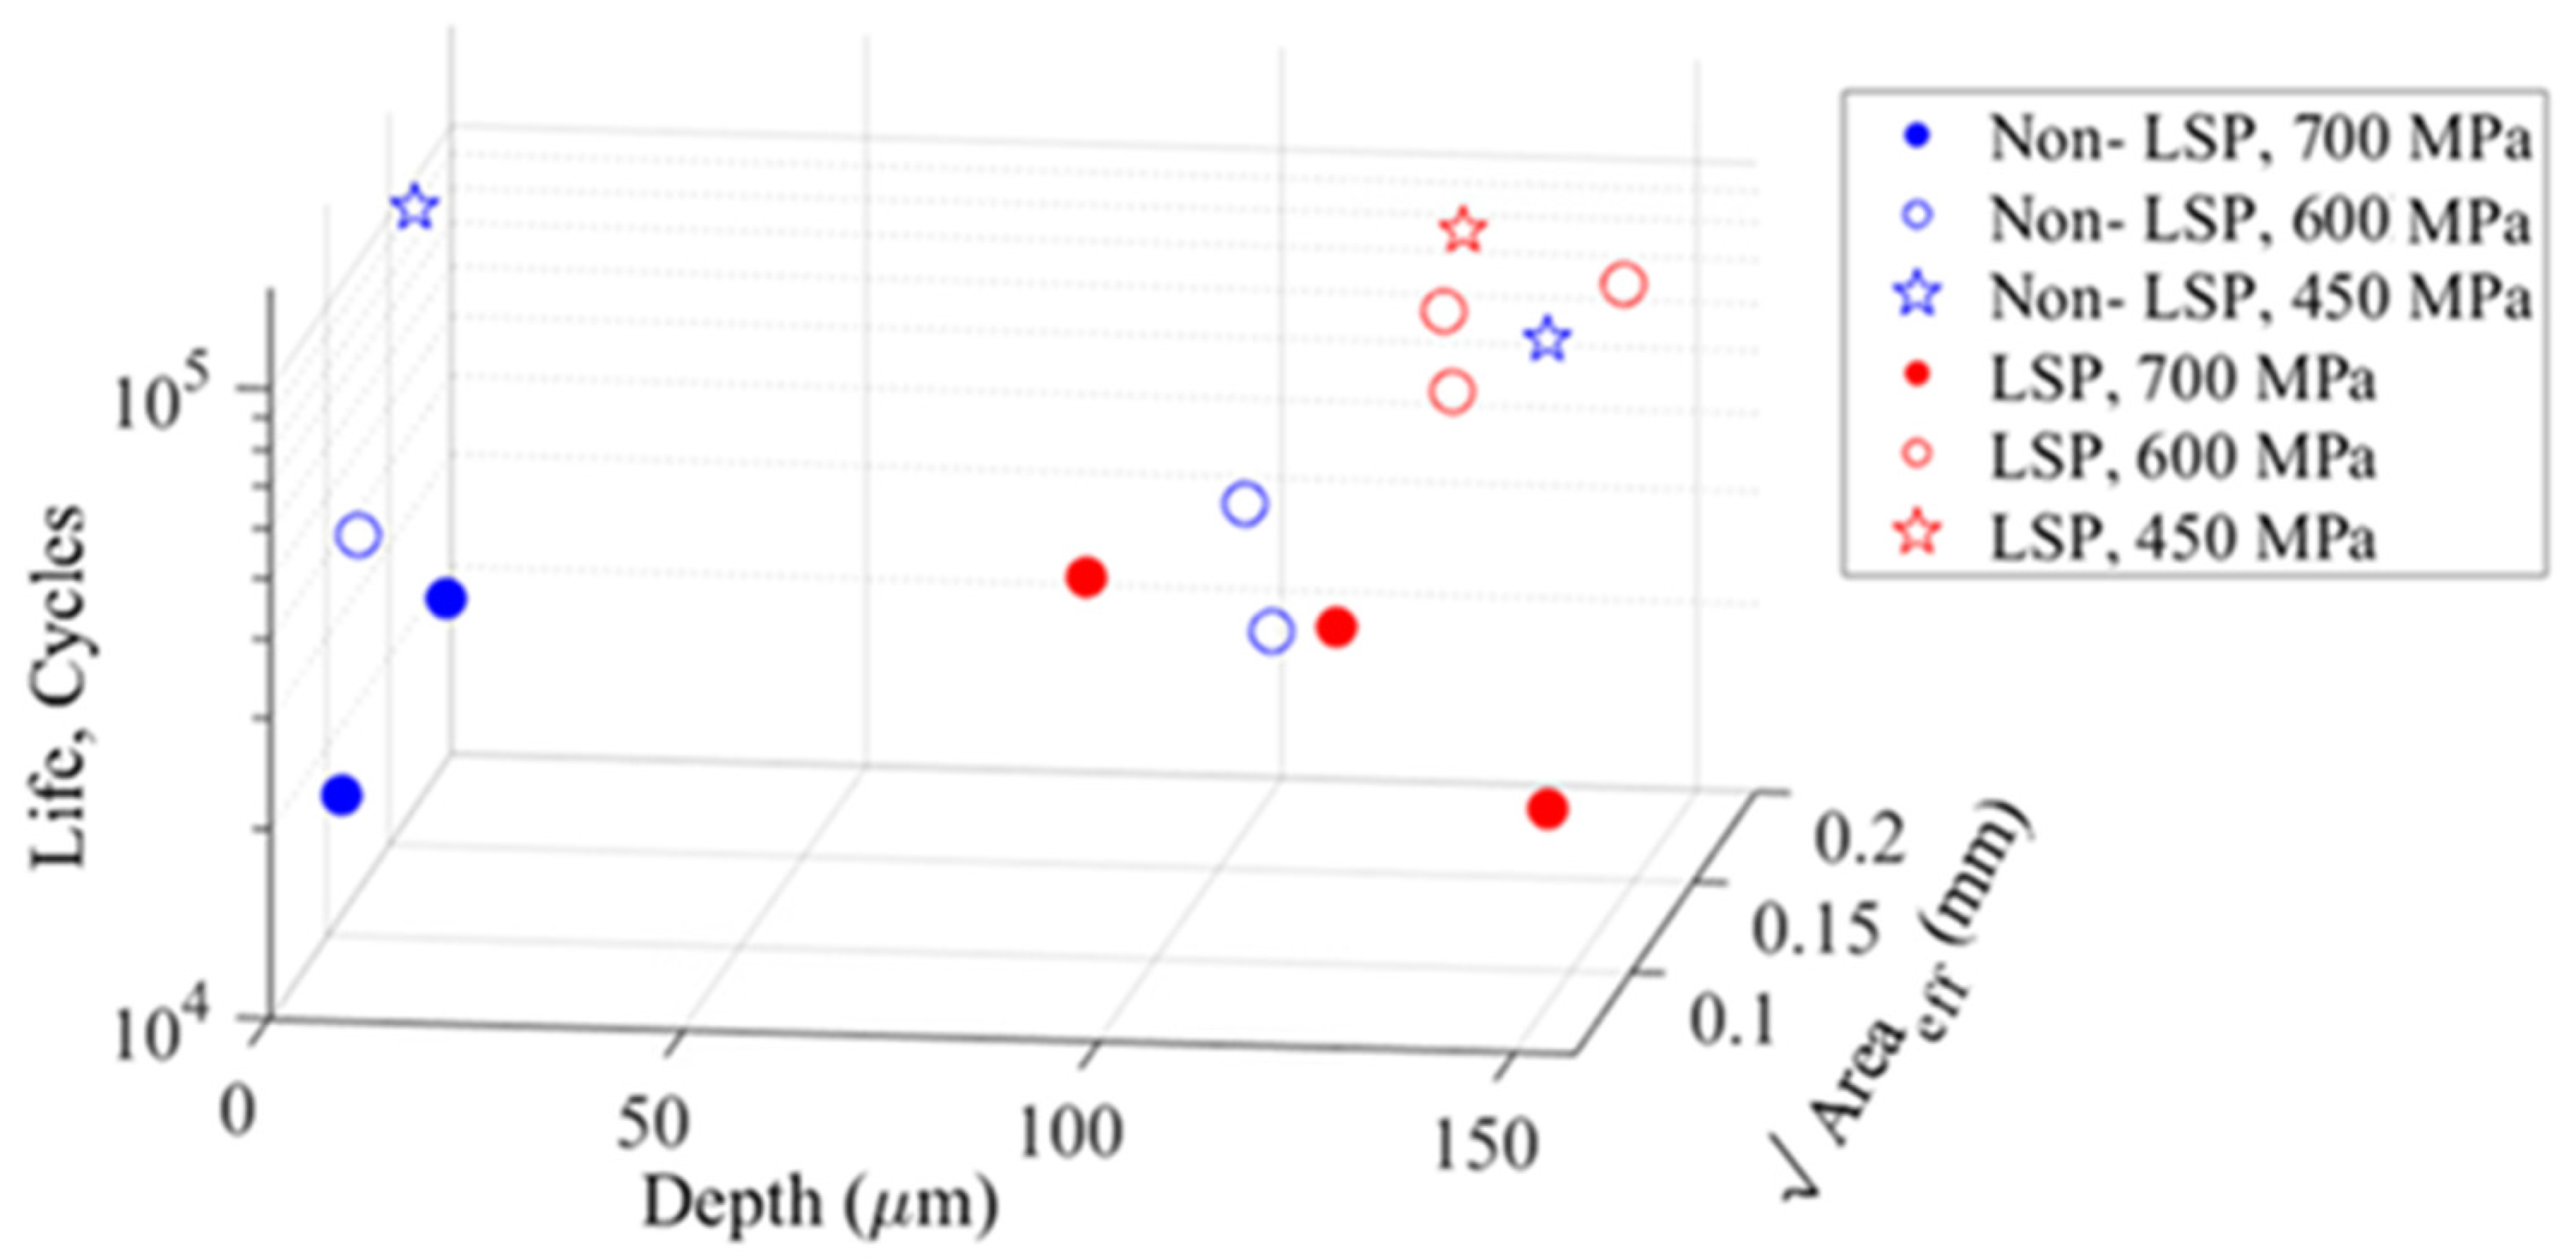
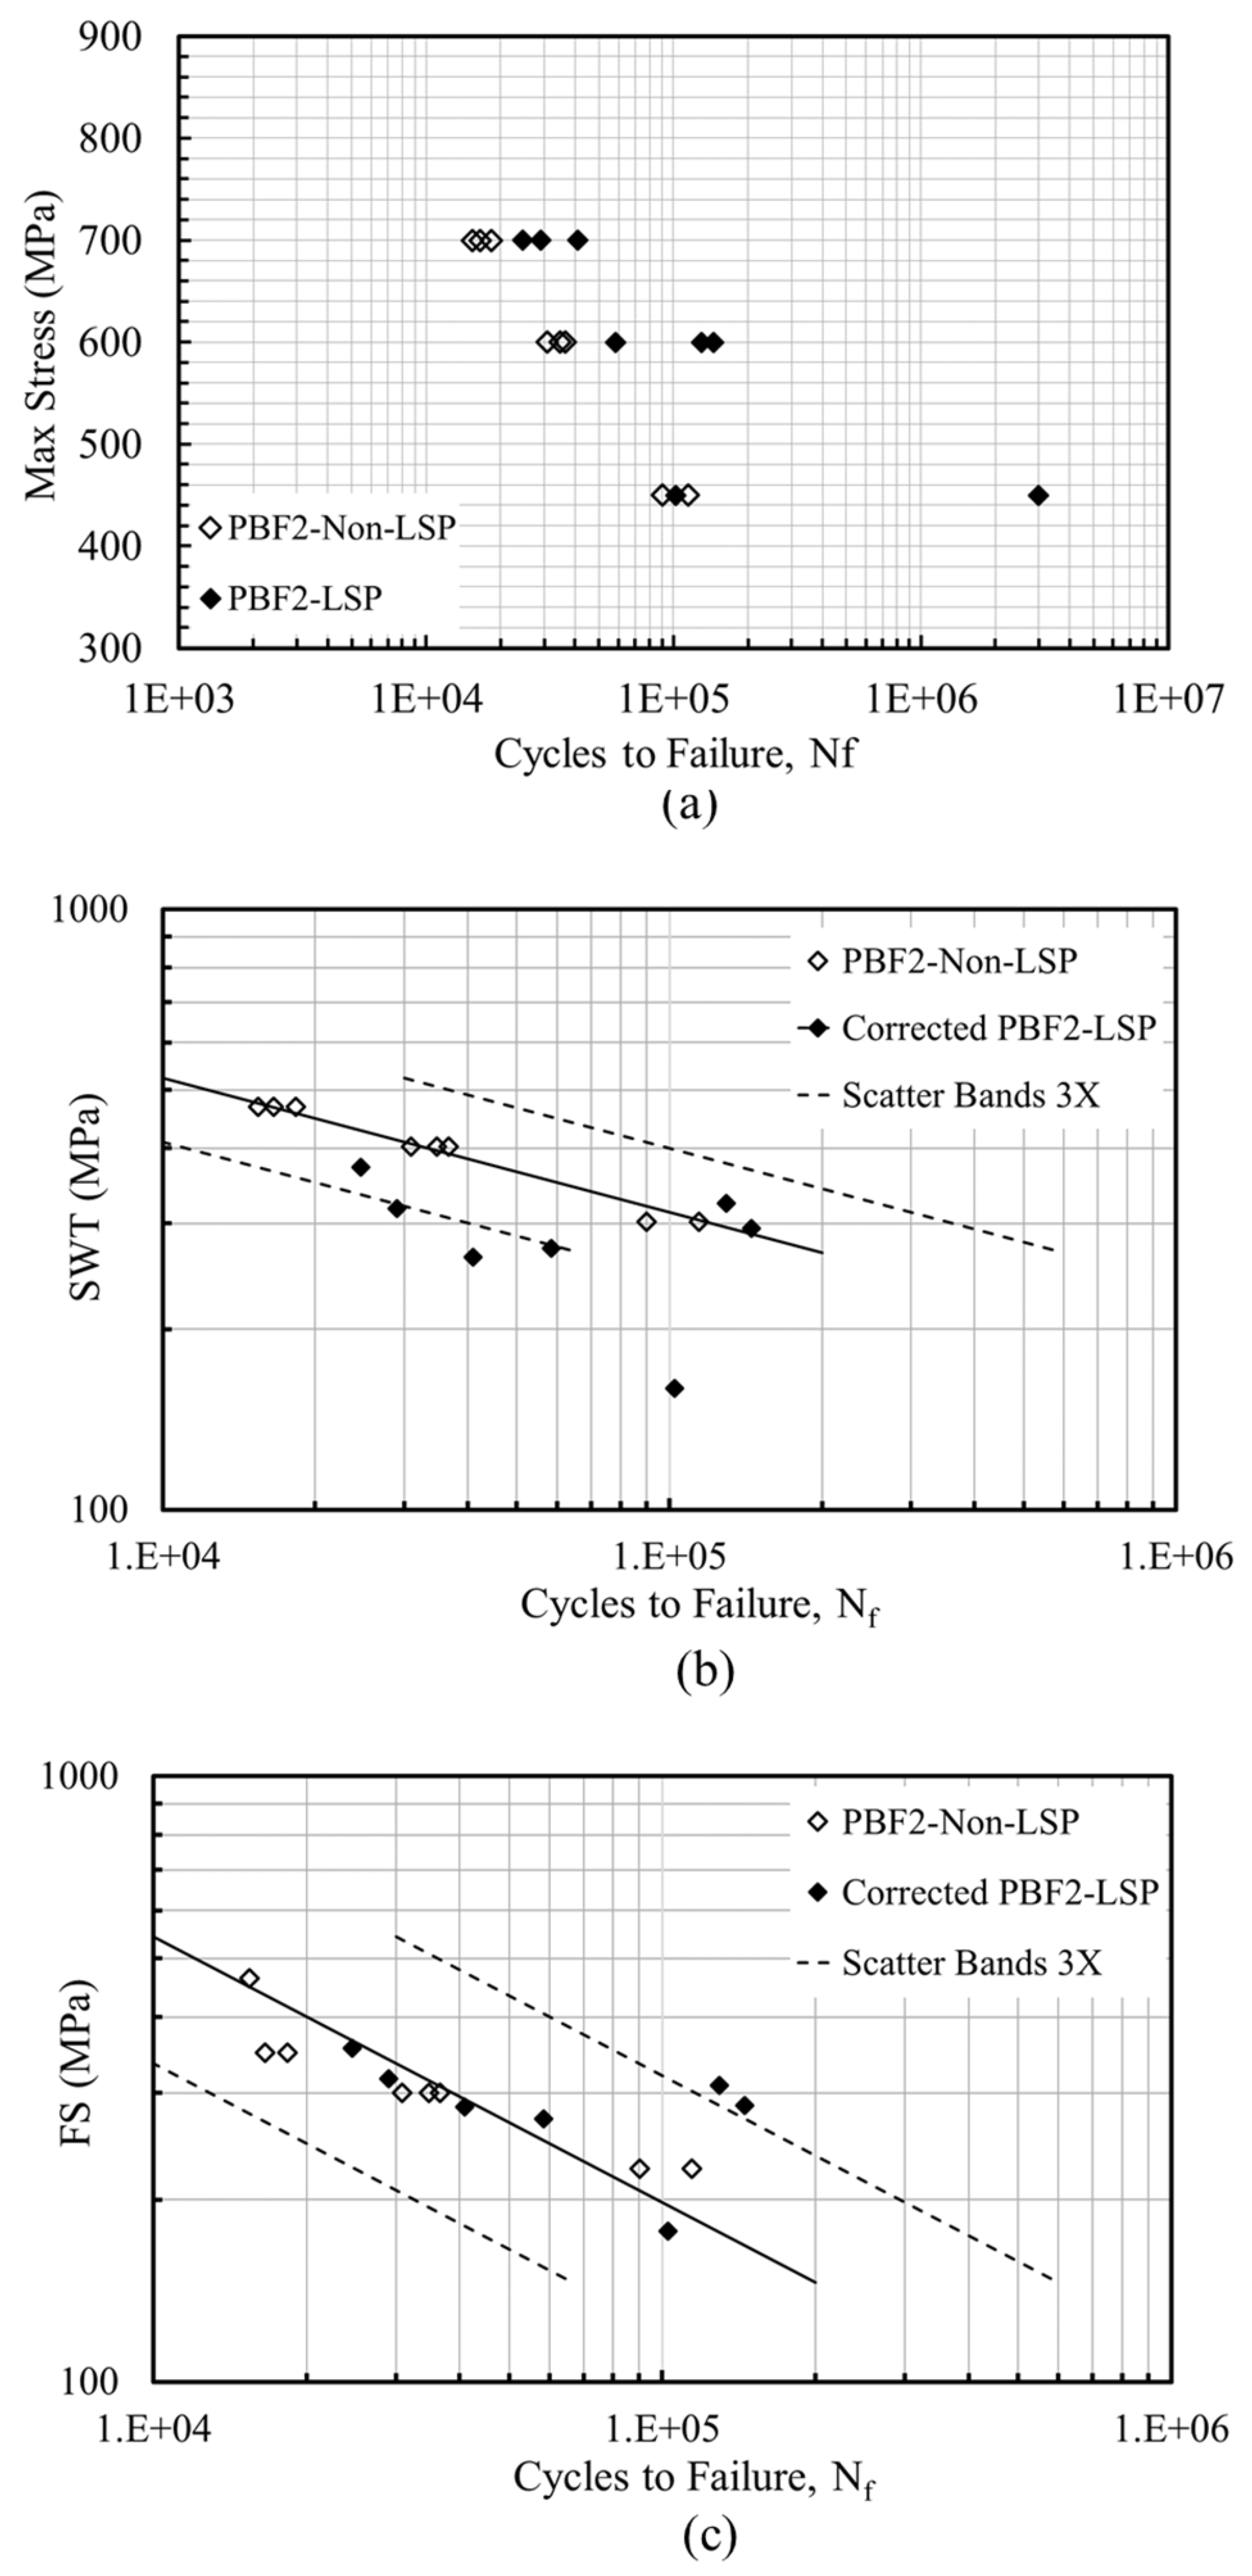
4.3. Fatigue Test Results and Fractography
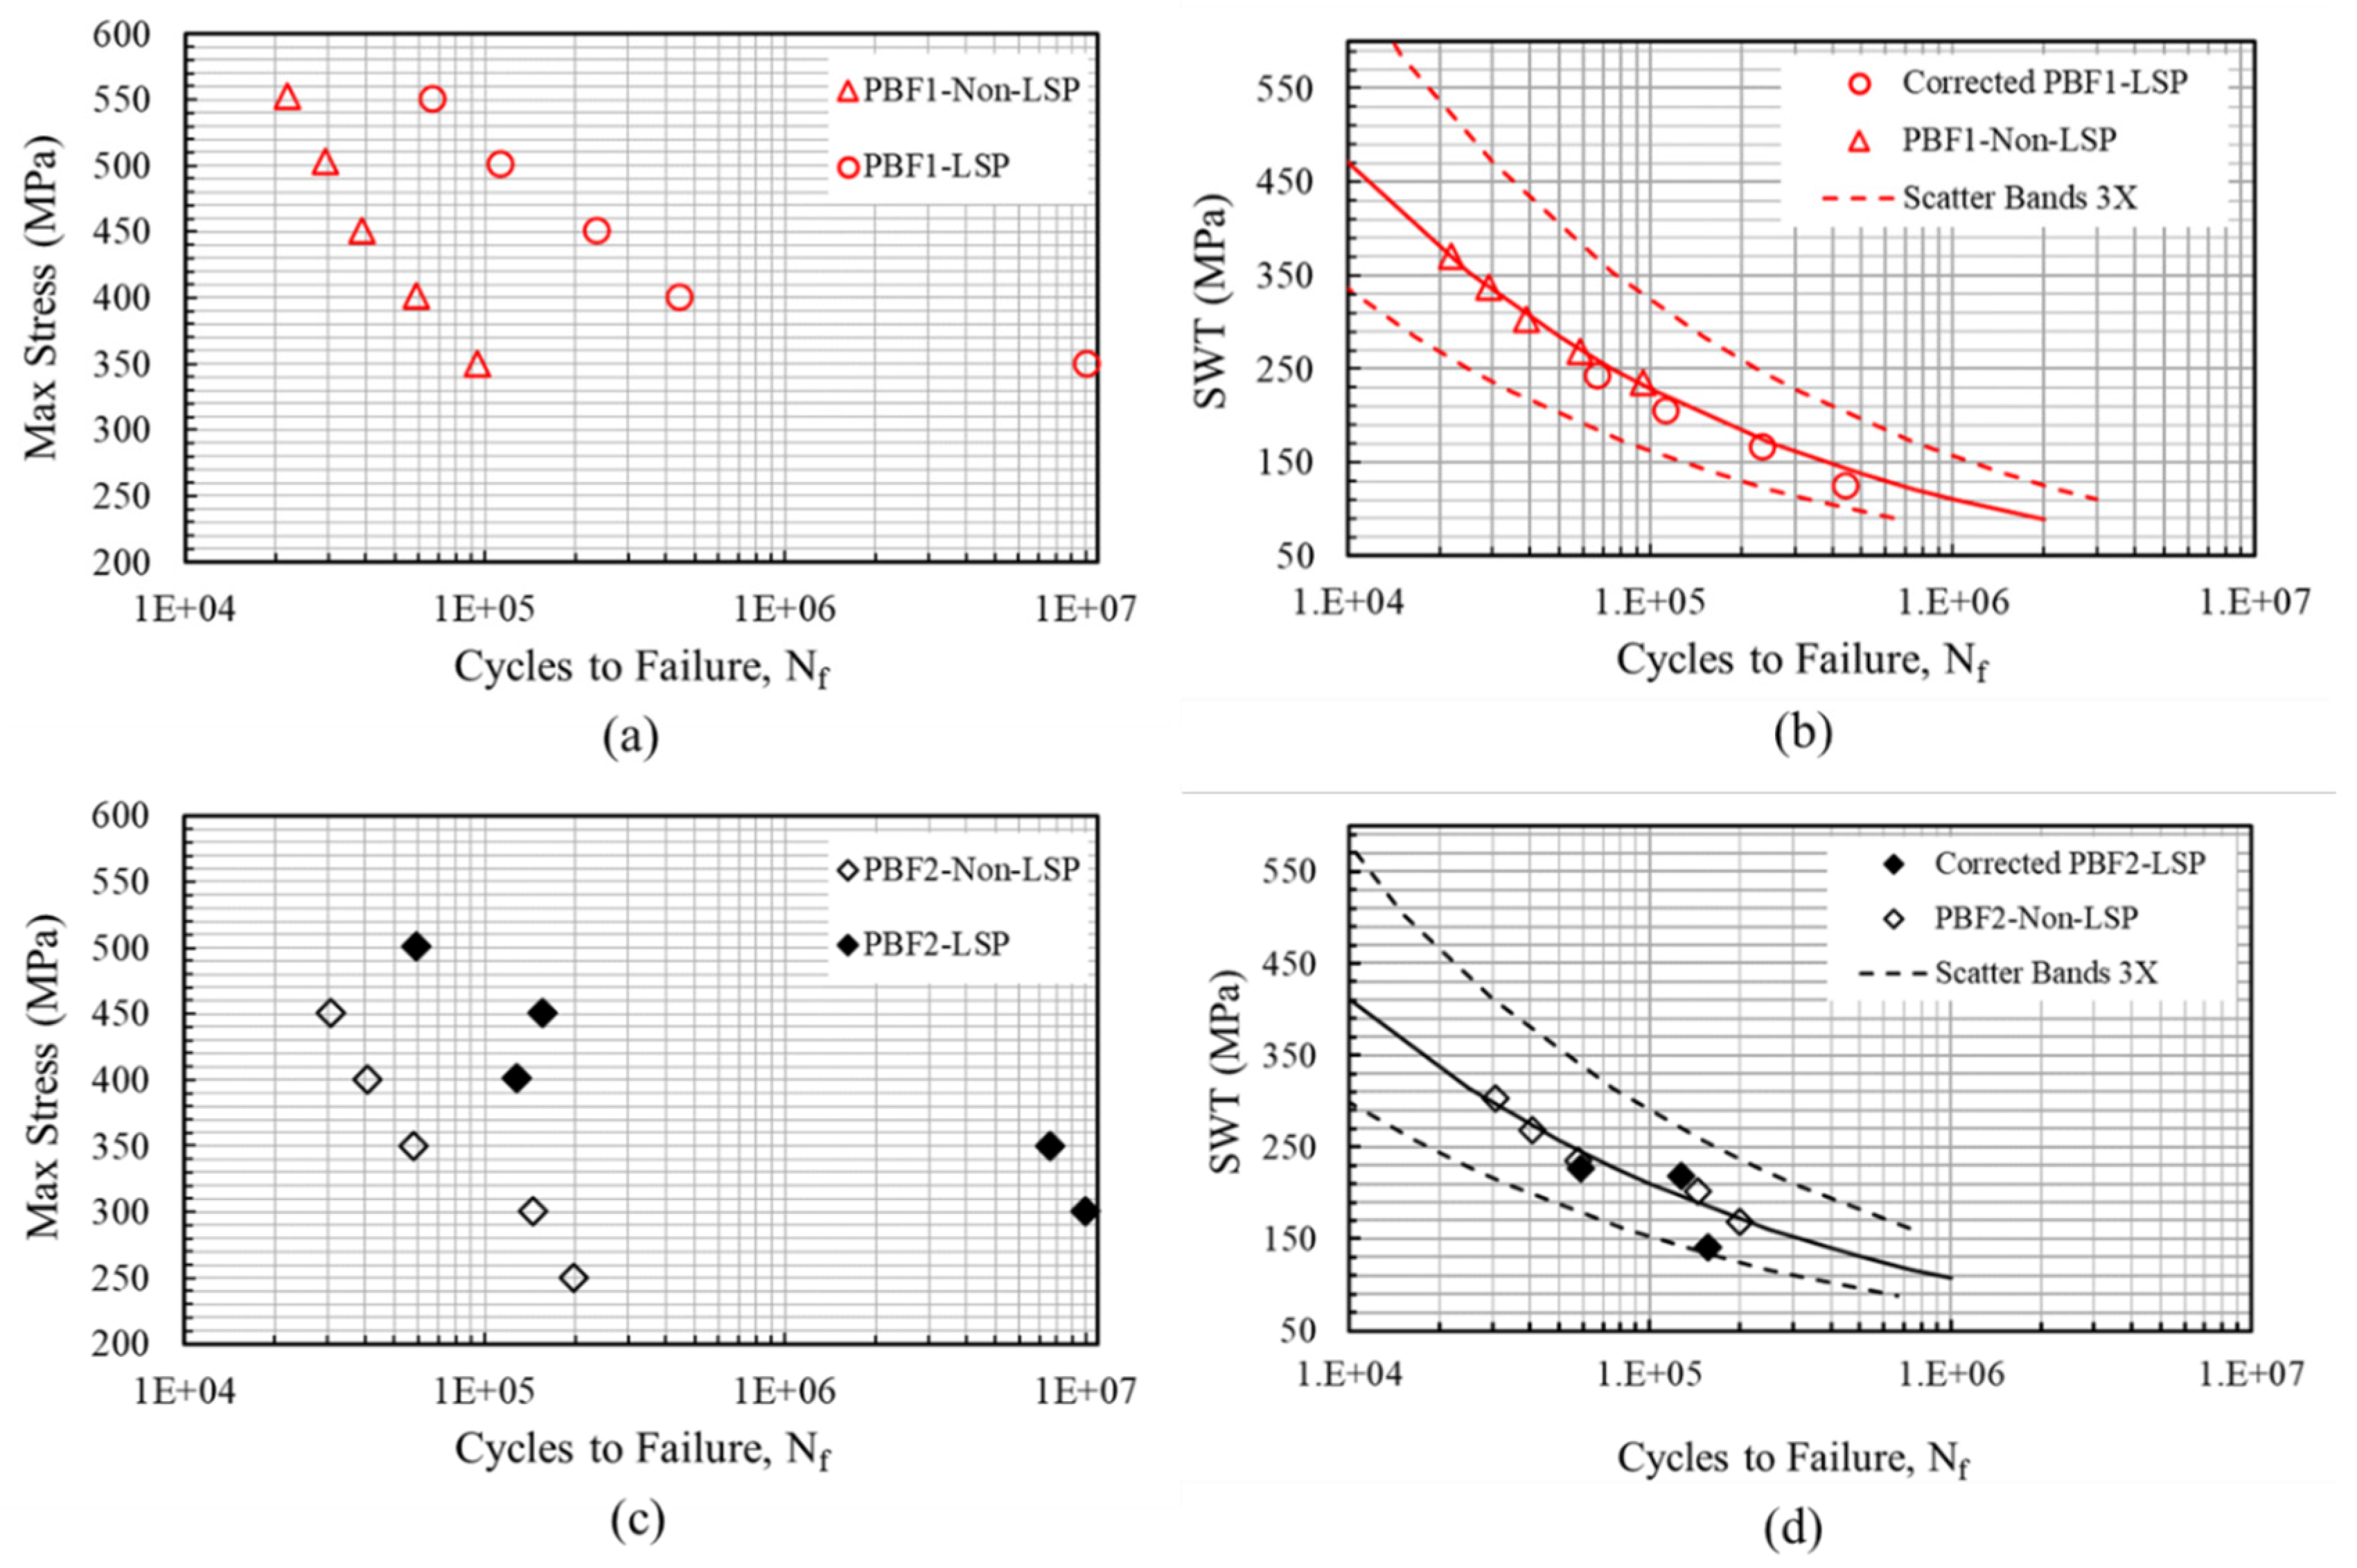
4.4. Mean Stress Correction Modeling
5. Conclusions
- Part geometry plays an important role when subjected to LSP. It was observed that for the same LSP process parameters, the geometry with partial target area results in more compressive residual stresses near the surface, which are thought to be caused by equilibrium satisfaction.
- Some roughness measurement techniques may not be useful for the AM as-built surface components. While the mechanical profilometer did not show any roughness changes after the LSP process on the as-built surface specimens, a destructive approach was employed, indicating significant changes. This was discussed to be due to the limitations of the mechanical profilometer in reaching the deep valleys of the profile.
- When no opaque layer is used, it was observed that the LSP process results in notable improvements in the surface profile of as-built samples by removing the loosely bounded unmelted particles and reflowing the material at sharp valleys. Unlike the as-built surface roughness improvements after LSP, the roughness of the machined surface specimens increases because of the laser waves.
- It was observed that the LSP process does not improve the fatigue lives when optimized process parameters are used for part fabrication and the surface is machined. This was found to be due to the contradicting effects of compressive residual stresses near the surface and the worsened roughness due to the LSP process. However, while there was not a clear improvement in their fatigue strength, a notable decrease in the scatter was observed for the optimized samples with machined surface conditions.
- While the fatigue behavior of optimized machined samples did not necessarily improve after LSP, the non-optimized samples showed significant improvements in fatigue lives along with decreased scatters. This was found to be due to the defect quantity and distributions in these samples which generate more consistency and repeatability in the potential for the cracks to initiate at or near the surface for both non-LSP and LSP samples.
- When the surface condition is as-built, LSP significantly improves the fatigue lives regardless of the AM process parameters (i.e., optimized vs. non-optimized). This is due to the improved surface profiles of these samples after the LSP process, which reduces the stress concentration effects of the rough surface by healing the sharp valleys and removing the loosely bounded particles at the surface.
- It was observed that although the SWT criterion correlated the fatigue test results of the LSP and non-LSP with as-built surfaces reasonably well, it was not able to correlate the data with machined surfaces.
- Using the Fatemi-Socie parameter for the machined surface condition resulted in good data correlations. This parameter is based on shear damage and has recently been found to work for material with a transition from shear to tensile stresses [41]. This worked well for the shear damage mechanism of the AM Ti-6Al-4V alloy with a machined surface.
Author Contributions
Funding
Institutional Review Board Statement
Informed Consent Statement
Data Availability Statement
Acknowledgments
Conflicts of Interest
Nomenclature
| E | Energy Density |
| h | Hatch Spacing |
| G | Shear Modulus |
| K | FS Material Dependent Constant |
| Cycles to Failure | |
| P | Laser Power |
| Arithmetic Mean of Surface Roughness | |
| Maximum Profile Valley Depth | |
| Total Height of Roughness Profile | |
| Maximum Height of Roughness Profile | |
| Equivalent Stress | |
| t | Layer Thickness |
| v | Laser Scan Speed |
| Maximum Shear Strain Range | |
| Axial Stress Amplitude | |
| Max Applied Stress | |
| Maximum Normal Stress on Maximum Shear Plane | |
| Effective Crack Initiation Area |
Abbreviations
| AB | As-Built Surface |
| AM | Additive Manufacturing / Additive Manufactured |
| DED | Directed Energy Deposition |
| E-PBF | Electron Beam Powder Bed Fusion |
| FS | Fatemi-Socie |
| LOF | Lack of Fusion |
| L-PBF | Laser Powder Bed Fusion |
| LSP | Laser Shock Peening |
| M | Machined Surface |
| OM | Optical Microscope |
| PBF | Powder Bed Fusion |
| SWT | Smith-Watson-Topper |
References
- Fatemi, A.; Molaei, R.; Sharifimehr, S.; Phan, N.; Shamsaei, N. Multiaxial fatigue behavior of wrought and additive manufactured Ti-6Al-4V including surface finish effect. Int. J. Fatigue 2017, 100, 347–366. [Google Scholar] [CrossRef]
- Fatemi, A.; Molaei, R.; Simsiriwong, J.; Sanaei, N.; Pegues, J.; Torries, B.; Phan, N.; Shamsaei, N. Fatigue behaviour of additive manufactured materials: An overview of some recent experimental studies on Ti-6Al-4V considering various processing and loading direction effects. Fatigue Fract. Eng. Mater. Struct. 2019, 42, 991–1009. [Google Scholar] [CrossRef]
- Kumar, R.; Kumar, M.; Chohan, J.S. The role of additive manufacturing for biomedical applications: A critical review. J. Manuf. Process. 2021, 64, 828–850. [Google Scholar] [CrossRef]
- Fatemi, A.; Molaei, R.; Sharifimehr, S.; Shamsaei, N.; Phan, N. Torsional fatigue behavior of wrought and additive manufactured Ti-6Al-4V by powder bed fusion including surface finish effect. Int. J. Fatigue 2017, 99, 187–201. [Google Scholar] [CrossRef]
- Pegues, J.; Shao, S.; Shamsaei, N.; Sanaei, N.; Fatemi, A.; Warner, D.; Li, P.; Phan, N. Fatigue of additive manufactured Ti-6Al-4V, Part I: The effects of powder feedstock, manufacturing, and post-process conditions on the resulting microstructure and defects. Int. J. Fatigue 2020, 132, 105358. [Google Scholar] [CrossRef]
- Sanaei, N.; Fatemi, A.; Phan, N. Defect characteristics and analysis of their variability in metal L-PBF additive manufacturing. Mater. Des. 2019, 182, 108091. [Google Scholar] [CrossRef]
- Oliveira, J.P.; LaLonde, A.D.; Ma, J. Processing parameters in laser powder bed fusion metal additive manufacturing. Mater. Des. 2020, 193, 108762. [Google Scholar] [CrossRef]
- Renzo, D.A.; Maletta, C.; Sgambitterra, E.; Furgiuele, F.; Berto, F. Surface roughness effect on multiaxial fatigue behavior of additively manufactured Ti6Al4V alloy. Int. J. Fatigue 2022, 163, 107022. [Google Scholar] [CrossRef]
- Taufik, M.; Jain, P.K. Role of build orientation in layered manufacturing: A review. Int. J. Manuf. Technol. Manag. 2013, 27, 47–73. [Google Scholar] [CrossRef]
- Jafari, D.; Wits, W.W. The utilization of selective laser melting technology on heat transfer devices for thermal energy conversion applications: A review. Renew. Sustain. Energy Rev. 2018, 91, 420–442. [Google Scholar] [CrossRef]
- Ulbricht, A.; Altenburg, S.J.; Sprengel, M.; Sommer, K.; Mohr, G.; Fritsch, T.; Mishurova, T.; Serrano-Munoz, I.; Evans, A.; Hofmann, M.; et al. Separation of the formation mechanisms of residual stresses in lpbf 316l. Metals 2020, 10, 1234. [Google Scholar] [CrossRef]
- Stephens, R.I.; Fatemi, A.; Stephens, R.R.; Fuchs, H.O. Metal Fatigue in Engineering; Wiley: Hoboken, NJ, USA, 2001. [Google Scholar]
- Gujba, A.K.; Medraj, M. Laser peening process and its impact on materials properties in comparison with shot peening and ultrasonic impact peening. Materials 2014, 7, 7925–7974. [Google Scholar] [CrossRef] [PubMed]
- Li, W.; Huang, H.; Xu, D.; Chen, J.; Zuo, L.; Ma, G.; He, J.; Li, C.; Peng, Z.; Ren, Y.; et al. Effect of Laser Shock Processing and Aluminizing on Microstructure and High-Temperature Creep Properties of 321 Stainless Steel for Solar Thermal Power Generation. Int. J. Photoenergy 2020, 2020, 6532820. [Google Scholar] [CrossRef]
- Pathak, S.; Zulić, S.; Kaufman, J.; Kopeček, J.; Stránský, O.; Böhm, M.; Brajer, J.; Beránek, L.; Shukla, A.; Ackermann, M.; et al. Post-processing of selective laser melting manufactured SS-304L by laser shock peening. J. Mater. Res. Technol. 2022, 19, 4787–4792. [Google Scholar] [CrossRef]
- Deng, W.W.; Lu, H.F.; Xing, Y.H.; Luo, K.Y.; Lu, J.Z. Effect of laser shock peening on tensile properties and microstructure of selective laser melted 316L stainless steel with different build directions. Mater. Sci. Eng. A 2022, 850, 143567. [Google Scholar] [CrossRef]
- Aguado-Montero, S.; Navarro, C.; Vázquez, J.; Lasagni, F.; Slawik, S.; Domínguez, J. Fatigue behaviour of PBF additive manufactured TI6AL4V alloy after shot and laser peening. Int. J. Fatigue 2022, 154, 106536. [Google Scholar] [CrossRef]
- Luo, S.; He, W.; Chen, K.; Nie, X.; Zhou, L.; Li, Y. Regain the fatigue strength of laser additive manufactured Ti alloy via laser shock peening. J. Alloys Compd. 2018, 750, 626–635. [Google Scholar] [CrossRef]
- Yang, K.; Huang, Q.; Zhong, B.; Wang, Q.; Chen, Q.; Chen, Y.; Su, N.; Liu, H. Enhanced extra-long life fatigue resistance of a bimodal titanium alloy by laser shock peening. Int. J. Fatigue 2020, 141, 105868. [Google Scholar] [CrossRef]
- Leuders, S.; Thöne, M.; Riemer, A.; Niendorf, T.; Tröster, T.; Richard, H.; Maier, H. On the mechanical behaviour of titanium alloy TiAl6V4 manufactured by selective laser melting: Fatigue resistance and crack growth performance. Int. J. Fatigue 2013, 48, 300–307. [Google Scholar] [CrossRef]
- Zhang, J.; Fatemi, A. Surface roughness effect on multiaxial fatigue behavior of additive manufactured metals and its modeling. Theor. Appl. Fract. Mech. 2019, 103, 102260. [Google Scholar] [CrossRef]
- Molaei, R.; Fatemi, A.; Phan, N. Multiaxial fatigue of LB-PBF additive manufactured 17-4 PH stainless steel including the effects of surface roughness and HIP treatment and comparisons with the wrought alloy. Int. J. Fatigue 2020, 137, 105646. [Google Scholar] [CrossRef]
- ASTM standard E466; Standard Practice for Conducting Force Controlled Constant Amplitude Axial Fatigue Tests of Metallic Materials. ASTM: West Conshohocken, PA, USA, 2021.
- Bjerregaard, L. Metalog Guide; Struers: Ballerup, Denmark, 2000. [Google Scholar]
- Maleki, E.; Bagherifard, S.; Bandini, M.; Guagliano, M. Surface post-treatments for metal additive manufacturing: Progress, challenges, and opportunities. Addit. Manuf. 2021, 37, 101619. [Google Scholar] [CrossRef]
- Nicoletto, G. Directional and notch effects on the fatigue behavior of as-built DMLS Ti6Al4V. Int. J. Fatigue 2018, 106, 124–131. [Google Scholar] [CrossRef]
- Solberg, K.; Berto, F. A diagram for capturing and predicting failure locations in notch geometries produced by additive manufacturing. Int. J. Fatigue 2020, 134, 105428. [Google Scholar] [CrossRef]
- Thorslund, T.; Kahlen, F.J.; Kar, A. Temperatures, pressures and stresses during laser shock processing. Opt. Lasers Eng. 2003, 39, 51–71. [Google Scholar] [CrossRef]
- Fabbro, R.; Peyre, P.; Berthe, L.; Sollier, A.; Bartnicki, E. Physics and Applications of Laser Shock Processing of Materials. High-Power Lasers Manuf. 2000, 3888, 155–164. [Google Scholar]
- Gupta, R.K.; Pant, B.K.; Kain, V.; Kaul, R.; Bindra, K.S. Laser Shock Peening and its Applications: A Review. Lasers Manuf. Mater. Process. 2019, 6, 424–463. [Google Scholar] [CrossRef]
- Yadav, M.J.; Jinoop, A.N.; Danduk, C.; Subbu, S.K. Laser Shock Processing: Process Physics, Parameters, and Applications. Mater. Today Proc. 2017, 4, 7921–7930. [Google Scholar] [CrossRef]
- Shen, X.; Shukla, P.; Nath, S.; Lawrence, J. Improvement in mechanical properties of titanium alloy (Ti-6Al-7Nb) subject to multiple laser shock peening. Surf. Coat. Technol. 2017, 327, 101–109. [Google Scholar] [CrossRef]
- Derrick, C.; Fatemi, A. Correlations of fatigue strength of additively manufactured metals with hardness and defect size. Int. J. Fatigue 2022, 162, 106920. [Google Scholar] [CrossRef]
- Smith, K.; Watson, P.; Topper, T. Stress-strain function for the fatigue of metals. J. Mater. 1970, 5, 767–778. [Google Scholar]
- Nasab, M.H.; Vedani, M.; Logé, R.E.; Sohrabi, N.; Jamili, A.M.; du Plessis, A.; Beretta, S. An investigation on the fatigue behavior of additively manufactured laser shock peened AlSi7Mg alloy surfaces. Mater. Charact. 2023, 200, 112907. [Google Scholar] [CrossRef]
- Yamashita, Y.; Murakami, T.; Mihara, R.; Okada, M.; Murakami, Y. Defect Analysis and Fatigue Design Basis for Ni-based Superalloy 718 manufactured by Additive Manufacturing. In Procedia Structural Integrity; Elsevier B.V.: Amsterdam, The Netherlands, 2017; pp. 11–18. [Google Scholar] [CrossRef]
- Murakami, Y.; Kodama, S.; Konuma, S. Quantitative evaluation of effects of non-metallic inclusions on fatigue strength of high strength steels. I: Basic fatigue mechanism and evaluation of correlation between the fatigue fracture stress and the size and location of non-metallic inclusions. Int. J. Fatigue 1989, 1, 291–298. [Google Scholar] [CrossRef]
- Fatemi, A.; Molaei, R.; Phan, N. Multiaxial fatigue of additive manufactured metals: Performance, analysis, and applications. Int. J. Fatigue 2020, 134, 105479. [Google Scholar] [CrossRef]
- Fatemi, A.; Socie, D.F. A critical plane approach to multiaxial fatigue damage including out-of-phase loading. Fatigue Fract. Eng. Mater. Struct. 1988, 11, 149–165. [Google Scholar] [CrossRef]
- Gates, N.R.; Fatemi, A. On the consideration of normal and shear stress interaction in multiaxial fatigue damage analysis. Int. J. Fatigue 2017, 100, 322–336. [Google Scholar] [CrossRef]
- Molaei, R.; Fatemi, A. On the transition from shear to tensile failure mode in multiaxial fatigue. Int. J. Fatigue 2024, 180, 108076. [Google Scholar] [CrossRef]


| Parameter Set ID | P (W) | v (mm/s) | h (mm) | t (µm) | Energy Density (J/mm3) |
|---|---|---|---|---|---|
| PBF1 | 280 | 1200 | 0.14 | 30 | 55.56 |
| PBF2 | 150 | 1100 | 0.14 | 30 | 32.46 |
| Process ID | Sample Type | Surface Finish | Build Orientation |
|---|---|---|---|
| PBF1 | Air foil | As-built | Vertical |
| Non-vertical up | |||
| Non-vertical down | |||
| Uniaxial | Machined | Vertical | |
| PBF2 | Air foil | As-built | Vertical |
| Non-vertical up | |||
| Non-vertical down | |||
| Uniaxial | Machined | Vertical |
| Pulse Energy (J) | Laser Source Wavelength (mm) | Pulse Duration (ns) | Pulse Overlapping (%) | Laser Energy Density (GW/cm2) | Square Spot Size (cm2) |
|---|---|---|---|---|---|
| 5 | 1030 | 14 | 50 | 4.25 | 0.0841 |
| Depth (μm) | Residual Stress (MPa) | Nominal Max Stress (MPa) | Corrected Max Stress (MPa) | Corrected Mean Stress (MPa) | Nf (Cycles) | R Ratio | |
|---|---|---|---|---|---|---|---|
| Non-LSP | - | 0 | 553 | 553 | 304.2 | 21,790 | 0.1 |
| - | 0 | 503 | 503 | 276.6 | 29,228 | 0.1 | |
| - | 0 | 451.2 | 451.2 | 248.2 | 38,708 | 0.1 | |
| - | 0 | 401 | 401 | 220.6 | 58,617 | 0.1 | |
| - | 0 | 350.4 | 350.4 | 192.7 | 94,015 | 0.1 | |
| LSP | 26 | −314 | 551 | 237.4 | −10.6 | 67,026 | −1.1 |
| 26 | −314 | 501 | 188 | −37.8 | 112,417 | −1.4 | |
| 26 | −314 | 451 | 137 | −65.7 | 234,253 | −1.96 | |
| 26 | −314 | 400.5 | 87 | −93.3 | 443,558 | −3.14 |
| Depth (μm) | Residual Stress (MPa) | Nominal Max Stress (MPa) | Corrected Max Stress (MPa) | Corrected Mean Stress (MPa) | Nf (Cycles) | R Ratio | |
|---|---|---|---|---|---|---|---|
| Non-LSP | - | 0 | 451 | 451 | 247.9 | 30,760 | 0.1 |
| - | 0 | 400 | 400 | 220 | 40,736 | 0.1 | |
| - | 0 | 350 | 350 | 192.7 | 57,873 | 0.1 | |
| - | 0 | 300 | 300 | 165.1 | 144,200 | 0.1 | |
| - | 0 | 251 | 251 | 137.9 | 198,425 | 0.1 | |
| LSP | 157 | −273 | 501 | 228 | 2.4 | 58,992 | −0.98 |
| 436 | −136 | 401 | 265 | 84.6 | 127,728 | −0.36 | |
| 26 | −352.5 | 541 | 98 | −104.6 | 155,681 | −3.13 |
| Depth (μm) | Residual Stress (MPa) | Nominal Max Stress (MPa) | Corrected Max Stress (MPa) | Corrected Mean Stress (MPa) | Nf (Cycles) | R Ratio | |
|---|---|---|---|---|---|---|---|
| Non-LSP | - | 0 | 700 | 700 | 385 | 15,434 | 0.1 |
| - | 0 | 700 | 700 | 385 | 16,549 | 0.1 | |
| - | 0 | 600 | 600 | 330 | 36,635 | 0.1 | |
| - | 0 | 600 | 600 | 330 | 30,855 | 0.1 | |
| - | 0 | 450 | 450 | 225 | 114,375 | 0.1 | |
| - | 0 | 450 | 450 | 225 | 90,221 | 0.1 | |
| - | 0 | 600 | 600 | 330 | 34,735 | 0.1 | |
| - | 0 | 700 | 700 | 385 | 18,309 | 0.1 | |
| LSP | 154 | −260 | 700 | 440 | 125 | 24,589 | −0.43 |
| 129 | −325 | 450 | 125 | −77.5 | 102,460 | −2.24 | |
| 141 | −280 | 600 | 320 | 50 | 145,000 | −0.69 | |
| 157 | −212 | 600 | 388 | 118 | 129,545 | −0.39 | |
| 118 | −380 | 700 | 320 | 5 | 29,005 | −0.97 | |
| 128 | −325 | 600 | 275 | 5 | 58,449 | −0.96 | |
| 92 | −480 | 700 | 220 | −95 | 40,946 | −1.86 |
Disclaimer/Publisher’s Note: The statements, opinions and data contained in all publications are solely those of the individual author(s) and contributor(s) and not of MDPI and/or the editor(s). MDPI and/or the editor(s) disclaim responsibility for any injury to people or property resulting from any ideas, methods, instructions or products referred to in the content. |
© 2024 by the authors. Licensee MDPI, Basel, Switzerland. This article is an open access article distributed under the terms and conditions of the Creative Commons Attribution (CC BY) license (https://creativecommons.org/licenses/by/4.0/).
Share and Cite
Dyer, K.; Ghadar, S.; Zulić, S.; Rostohar, D.; Asadi, E.; Molaei, R. The Effect of Laser Shock Peening (LSP) on the Surface Roughness and Fatigue Behavior of Additively Manufactured Ti-6Al-4V Alloy. Coatings 2024, 14, 110. https://doi.org/10.3390/coatings14010110
Dyer K, Ghadar S, Zulić S, Rostohar D, Asadi E, Molaei R. The Effect of Laser Shock Peening (LSP) on the Surface Roughness and Fatigue Behavior of Additively Manufactured Ti-6Al-4V Alloy. Coatings. 2024; 14(1):110. https://doi.org/10.3390/coatings14010110
Chicago/Turabian StyleDyer, Krista, Samira Ghadar, Sanin Zulić, Danijela Rostohar, Ebrahim Asadi, and Reza Molaei. 2024. "The Effect of Laser Shock Peening (LSP) on the Surface Roughness and Fatigue Behavior of Additively Manufactured Ti-6Al-4V Alloy" Coatings 14, no. 1: 110. https://doi.org/10.3390/coatings14010110