1. Introduction
Tetrahedral amorphous carbon (ta-C) coatings with a high content of sp
3-C bonds have characteristics similar to diamond, i.e., high hardness, high resistivity, good optical transparency, chemical inertness, and a low friction coefficient [
1]. Compared to diamond coatings deposited by chemical vapor deposition with high temperatures and seed crystals, ta-C coatings could be prepared by relatively economical physical vapor deposition, e.g., vacuum cathode arc deposition without heating and seed crystals [
2,
3]. Therefore, ta-C coatings have been widely used on tools and spare parts for improving their performance and lifetime. However, the high level compressive stress that is produced in the process of forming sp
3 bonds causes the delamination of the ta-C coatings and makes the coatings hard to grow thick and severely limits their practical application in protection.
Metal element doping has been employed to release the high compressive stress of the carbon-based coatings. So far, many metallic elements (Ti, Cr, Cu, Al, etc.) have been used to modify the carbon based coatings (e.g., diamond-like carbon, DLC) [
4,
5,
6,
7]. Among these metal elements, Al doping is regarded as a crucial method for decreasing the compressive stress of the carbon-based coatings [
8]. In addition, Al can promote the rearrangement of C atoms, leading to graphitization transformation and the formation of a graphite phase, which plays a solid lubrication role and can significantly reduce friction [
9,
10]. It is interesting that in carbon based coatings, Al tends to exist as Al-O or Al-O-C due to Al being highly reactive with O which originates from the residual water vapor, air, etc., in the vacuum chamber. The existence form of Al is also related to the carbon structure of the carbon-based coatings. Guo et al. [
11] deposited hydrogen-free Al-DLC coatings by a high impulse power magnetron sputtering (HiPIMS) technology with an Al-C composite target and found that Al tends to bond with O to form Al-O rather than Al-C. D. Peckus et al. [
12] prepared hydrogenated and hydrogen free Al-DLC coatings using a magnetron sputtering method, and found that Al-O-C was observed in hydrogenated Al-DLC coatings while Al
2O
3, Al-O-C, and Al
4C
3 were observed in hydrogen-free Al-DLC coatings when Al content exceeds 20 at.%. Ding et al. [
13] deposited ta-C:Al coatings by combining a filtered cathodic vacuum arc technique (FCVA) of carbon with magnetron sputtering of Al. They argue that metallic Al nanoparticles are formed in the ta-C coatings when the Al content reached to 14 at.%, but carbide bonds (e.g., Al-C) were not detected even the Al content reached 39.6 at.%. In our previous works [
10], we prepared hydrogenated Al-DLC coatings by a hybrid ion beam system composed of an anode-layer ion source and a magnetron sputtering. The deposited layers had nano-stripe structures composed of amorphous aluminum oxides in the coatings. It is clear that both the carbon matrix and the deposition method would influence the existence form of the doping Al.
A cathodic vacuum arc (CVA) has been widely used to prepare ta-C coatings due to its facile and low-cost features. In addition, CVA shows a higher growth rate in the deposition of the ta-C coatings compared with FCVA [
2]. Furthermore, the ta-C coatings deposited by CVA have higher sp
3/sp
2 and density compared with the DLC coatings by the magnetron sputtering and ion source [
14]. Therefore, the impact of the Al doping on the structure and properties of ta-C might be different from those of DLC coatings. In this paper, ta-C coatings with Al incorporation (ta-C:Al) were deposited by a hybrid technique of a CVA of pure graphite target and magnetron sputtering of a pure Al target. The structure, chemical composition, carbon matrix structure, residual stress, and mechanical properties, as well as the tribological performance of the ta-C:Al coatings, were studied systematically. The influence of active Al on the microstructure and properties of the ta-C:Al coatings were discussed in terms of the existence of the Al dopants.
3. Results and Discussion
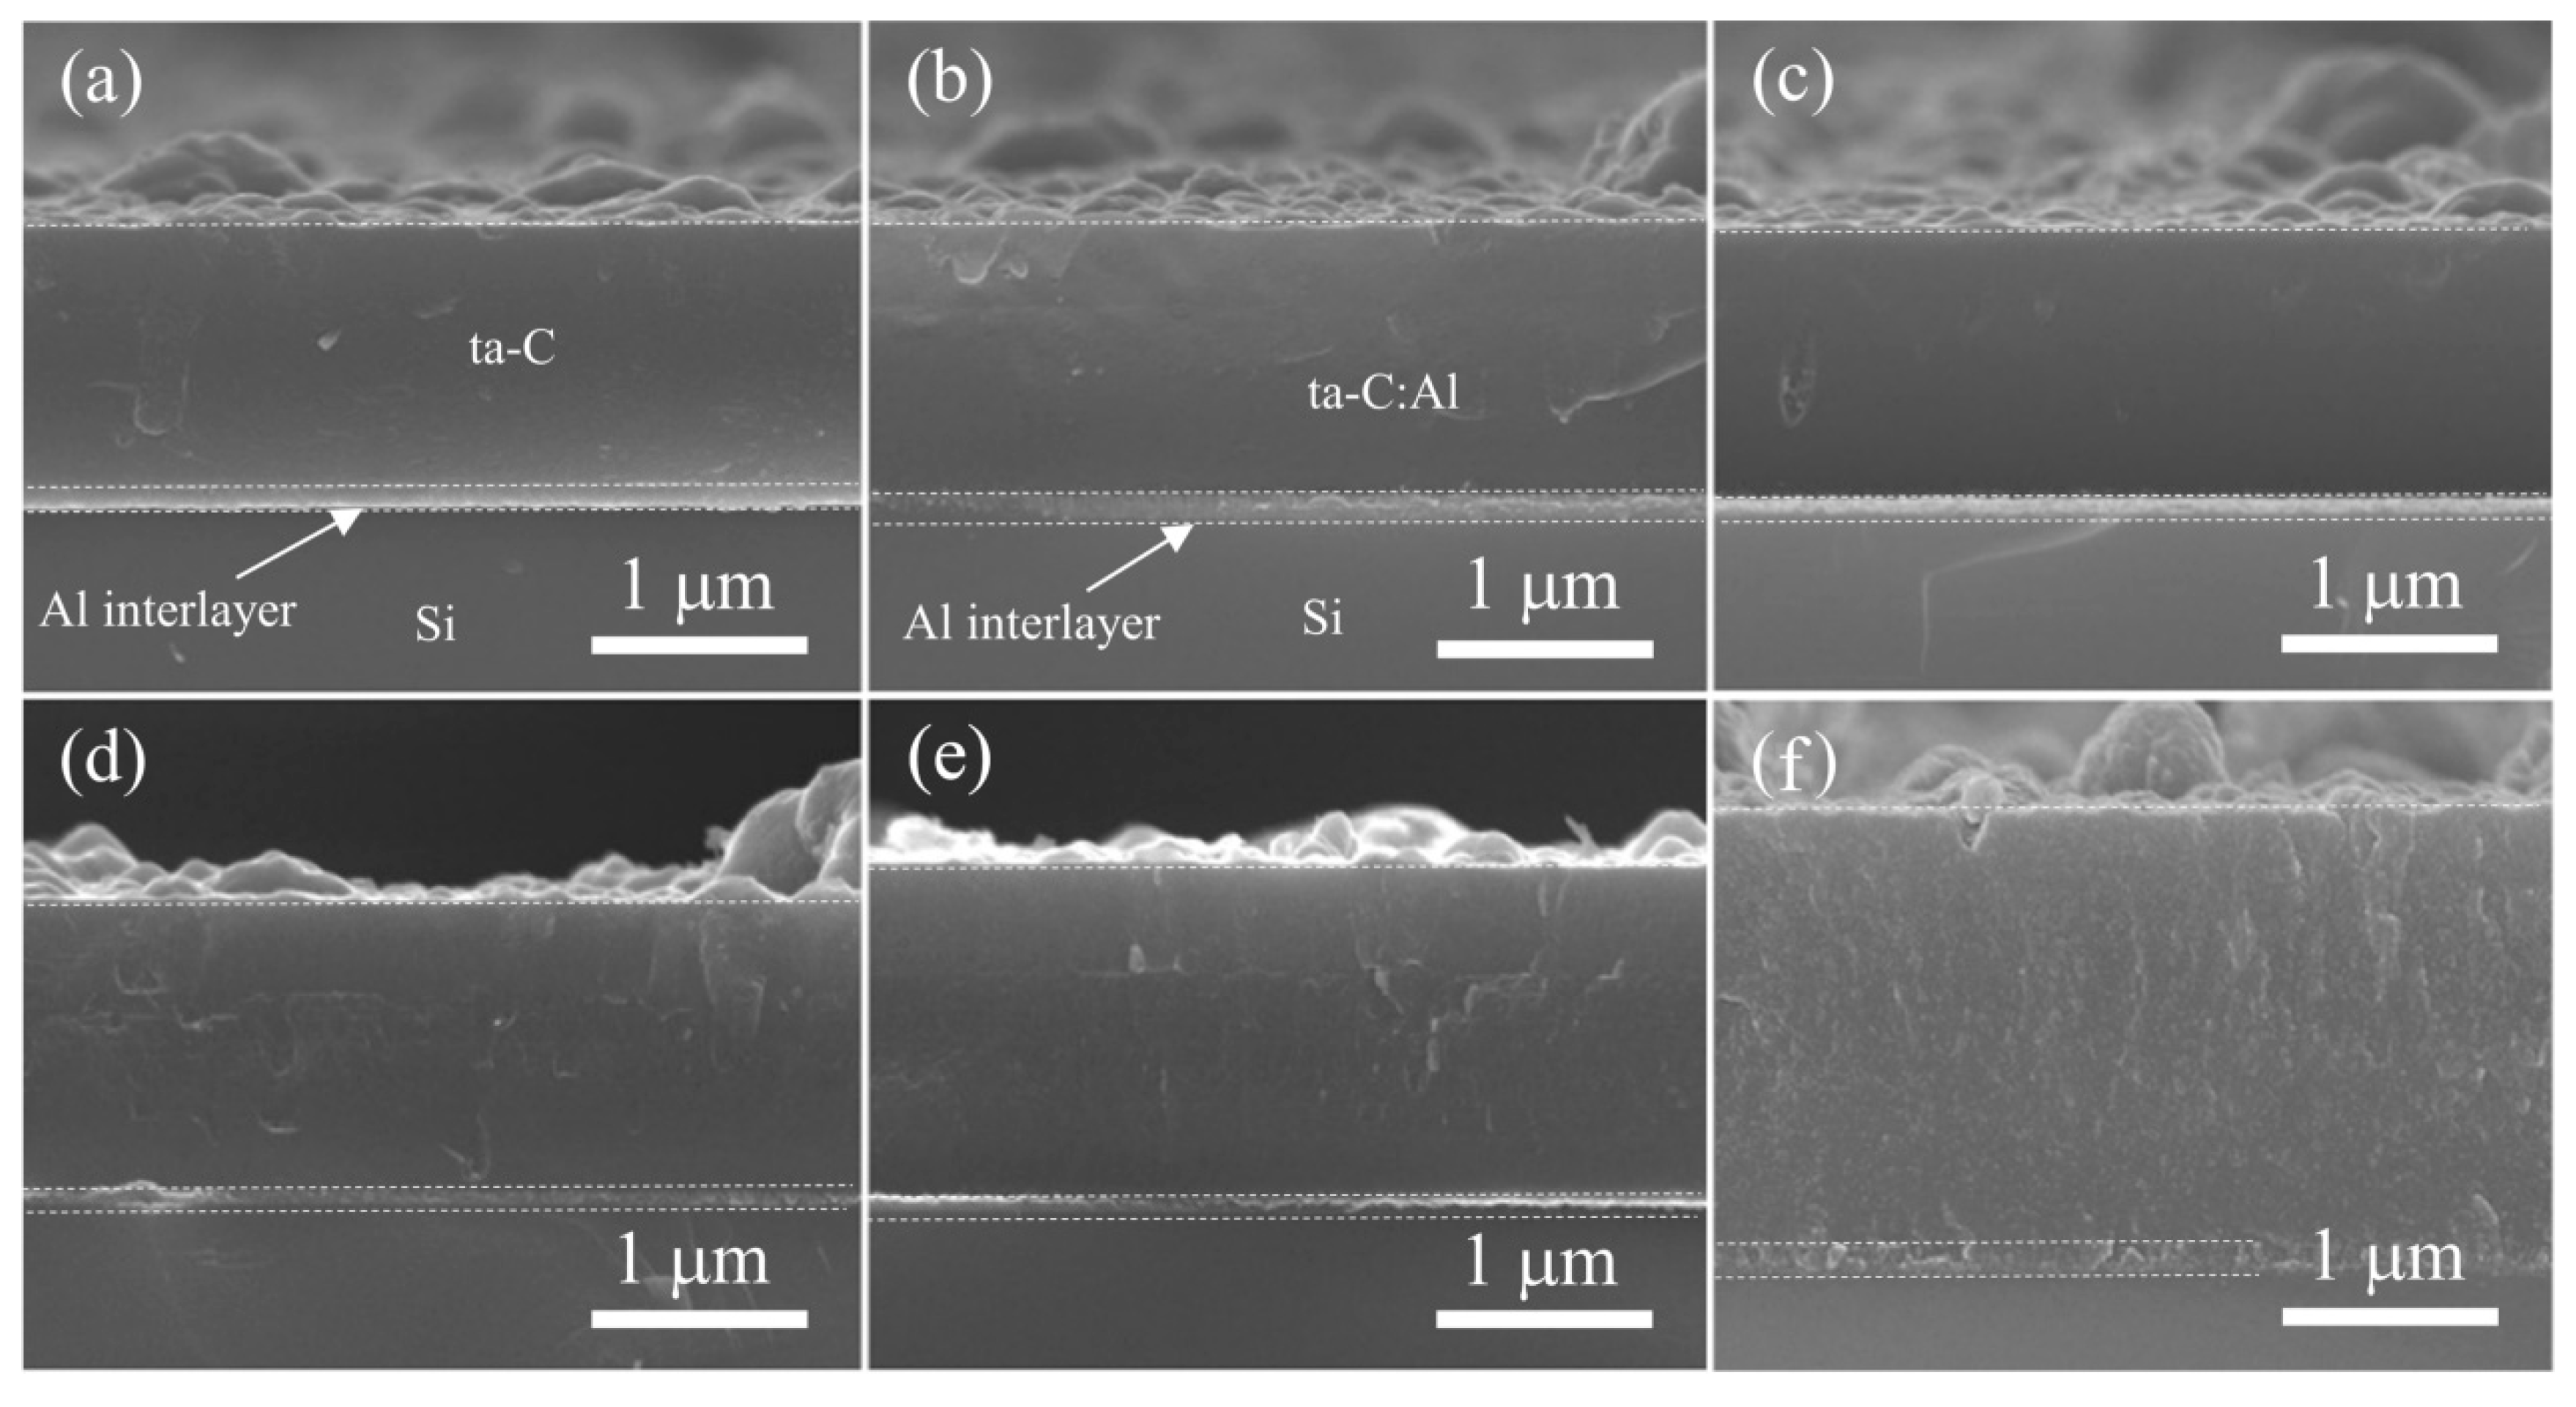
Figure 1 presents the cross-section morphology of the ta-C:Al coatings with different sputtering powers of Al target. It can be seen that all the ta-C:Al coatings are composed of the metallic Al interlayer and ta-C:Al layer. The Al interlayer has a thickness of about 200 nm. The thickness of the ta-C:Al layer increases from about 1.27 μm to 2.14 μm with the sputtering power of Al target increasing from 0 (pure ta-C) to 2.8 kW, indicating that the growth rate of the coatings is increasing with the sputtering power. For the coatings deposited with a relatively lower sputtering power (<2.8 kW), whether the ta-C layer or ta-C:Al layers show the typical amorphous structure without any features. However, the ta-C:Al layer cross-sectional structure turns from smooth and compact into coarse and granulose as the sputtering power of Al target increases to 2.8 kW. It is clear that the structure change of the ta-C:Al layer has a significant relationship with the incorporation of large amounts of Al which might cause the formation of carbide.
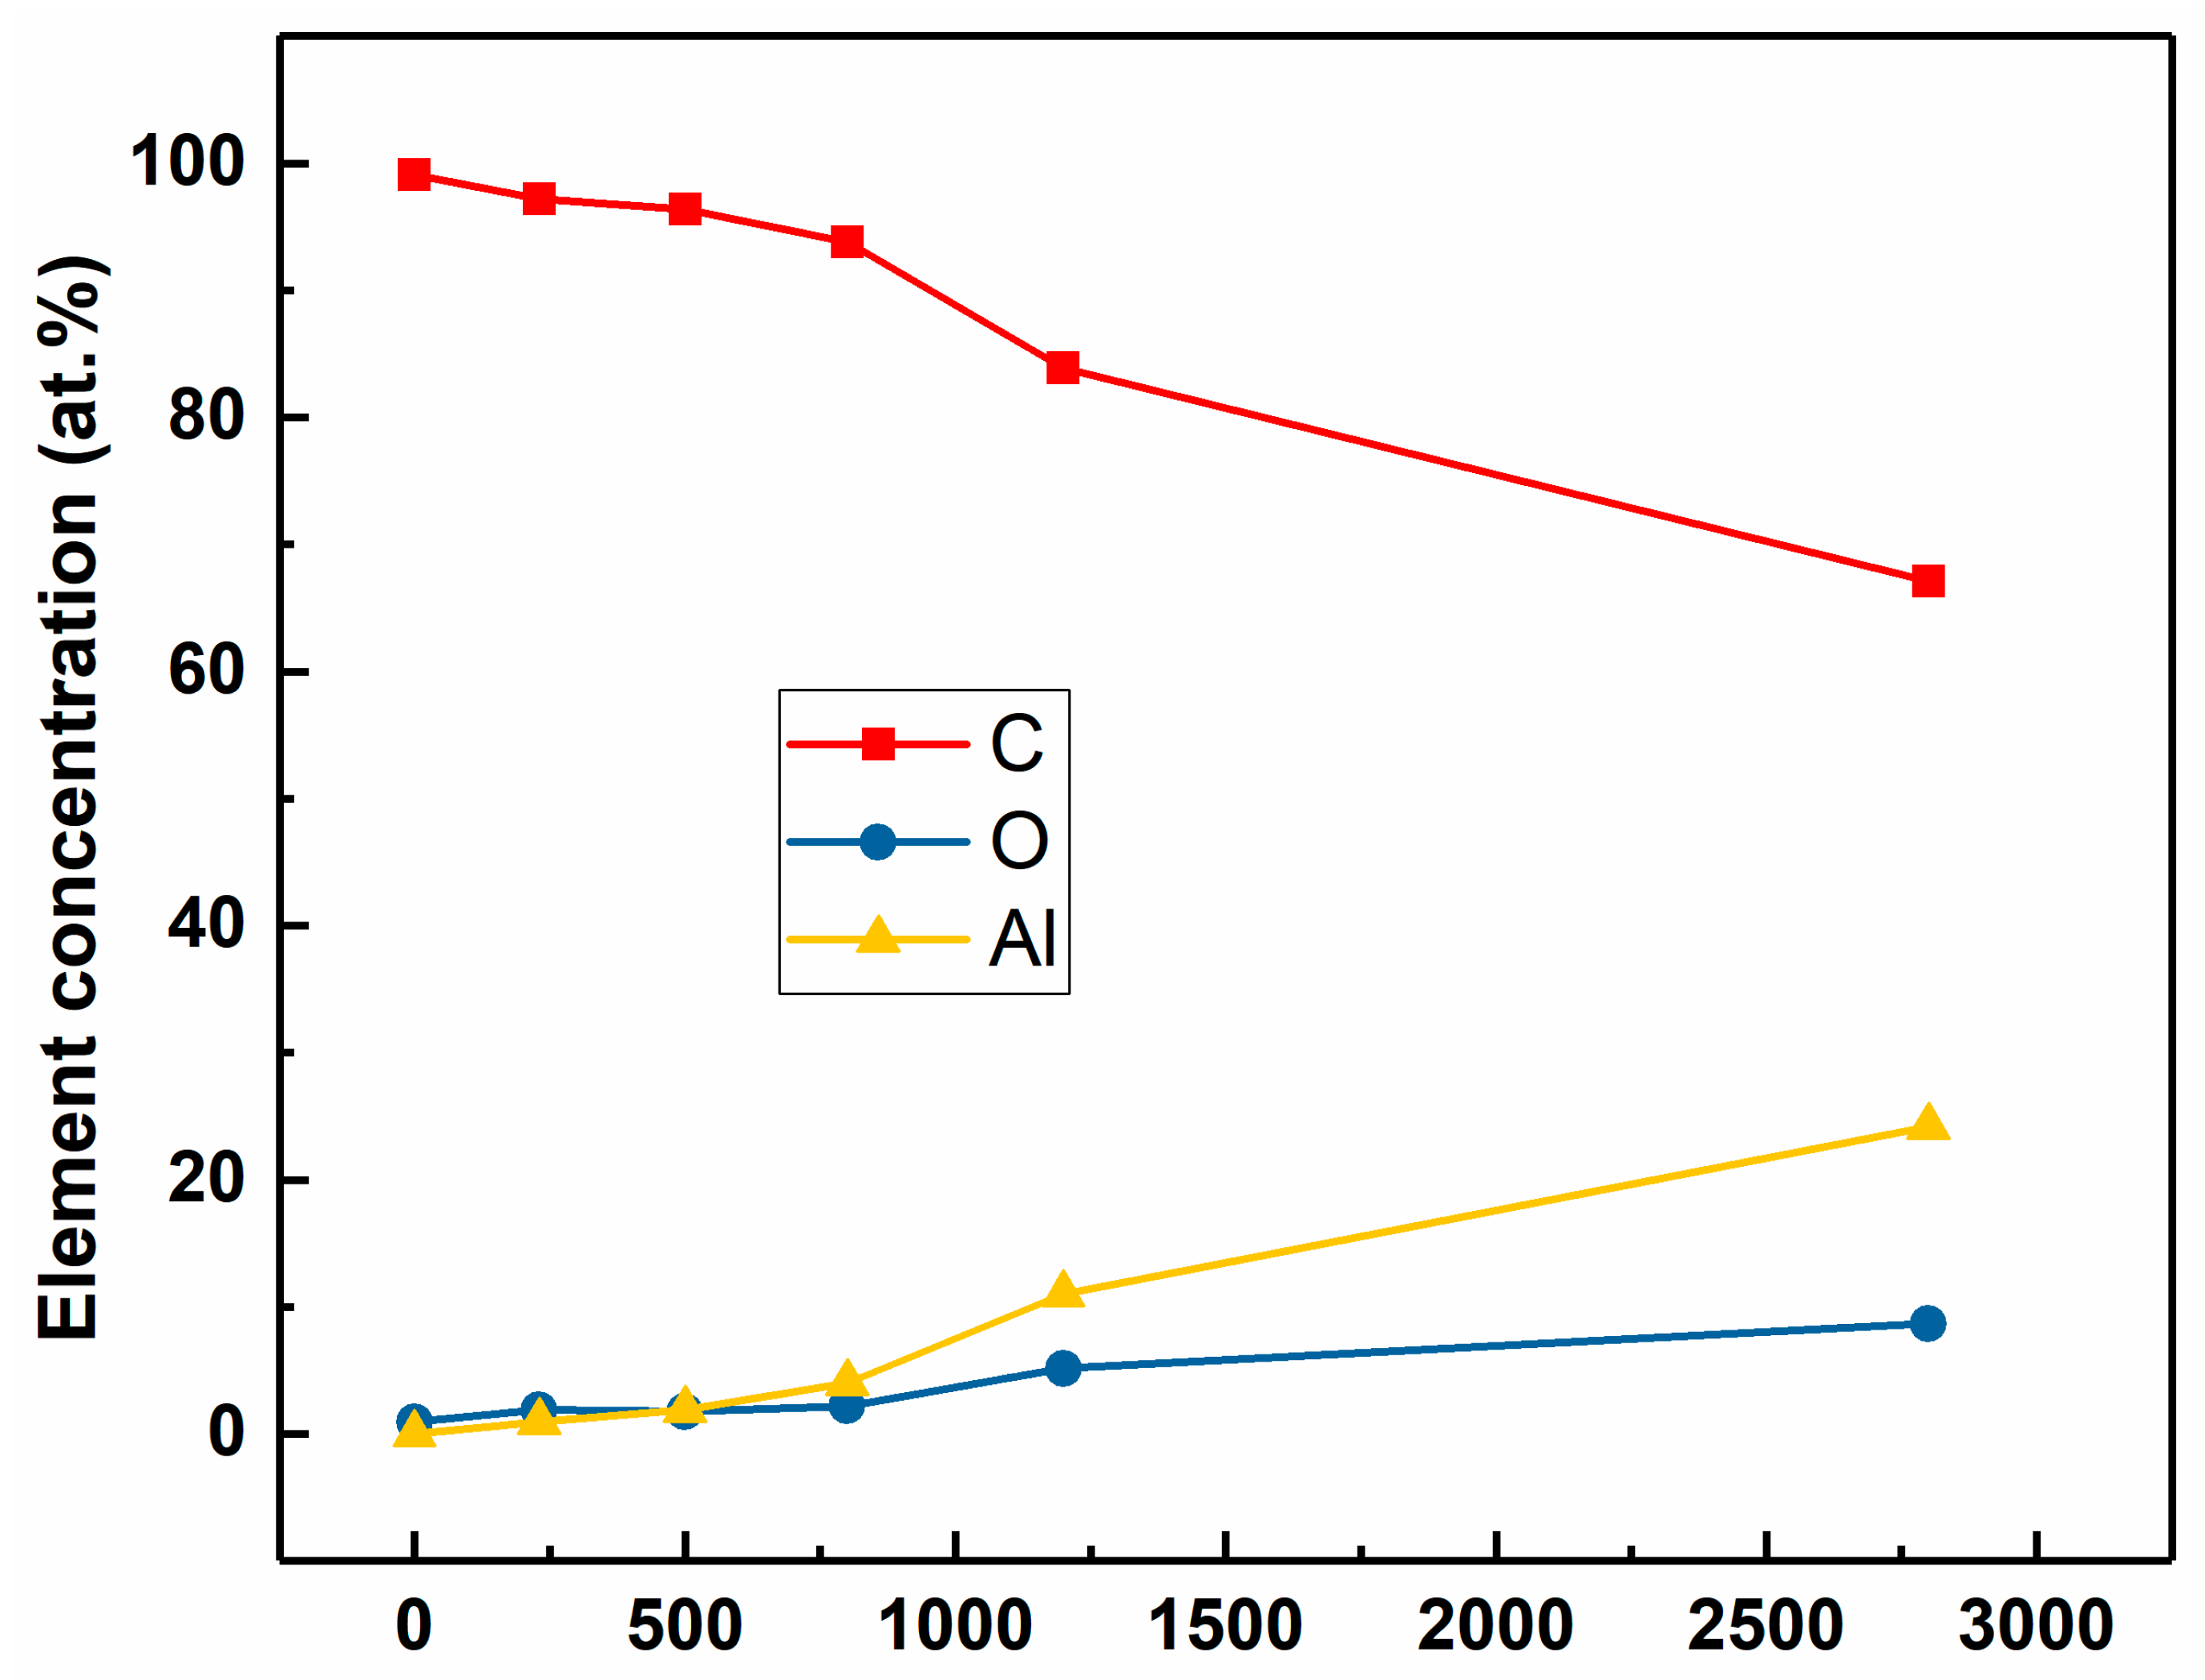
The composition determined by XPS indicates that the coatings are composed of Al, C, and O.
Figure 2 reveals the evolution of the Al, C and O in the ta-C:Al coatings deposited with different sputtering powers of the Al target. As the sputtering power increases from 0 (turn off the sputtering power) to 2.8 kW, the concentration of Al in the coatings increases monotonously from 0 (pure ta-C) to 24.18 at.%, while the C concentration decreases from 99.05 at.% to 67.13 at.%. It is clear that the sputtering power of the Al target can precisely control Al concentration in the ta-C:Al coatings. Oxygen was also detected in the coatings. The existence of oxygen may be largely due to the residual oxygen in the chamber. Additionally, the oxygen impurity in the Al target can also be sputtered to the coatings. It should be noted that the O concentration is increasing with the increasing sputtering power of Al target, implying that the O atoms tend to bond to Al in the coatings. However, the rate of increase in O concentration is lower than that of Al. The O/Al ratio decreases from about 3.36 to 0.36 when the sputtering power of Al target increases from 0.23 kW to 2.8 kW. Several reasons might be attributed to the decrease in the O/Al ratio. The residual oxygen in the chamber was limited, meaning that the O cannot satisfy the demand of the Al oxidation. On the other hand, relatively less oxygen would be adsorbed during the coatings deposition due to the high growth rate of the coatings with a higher Al concentration [
11].
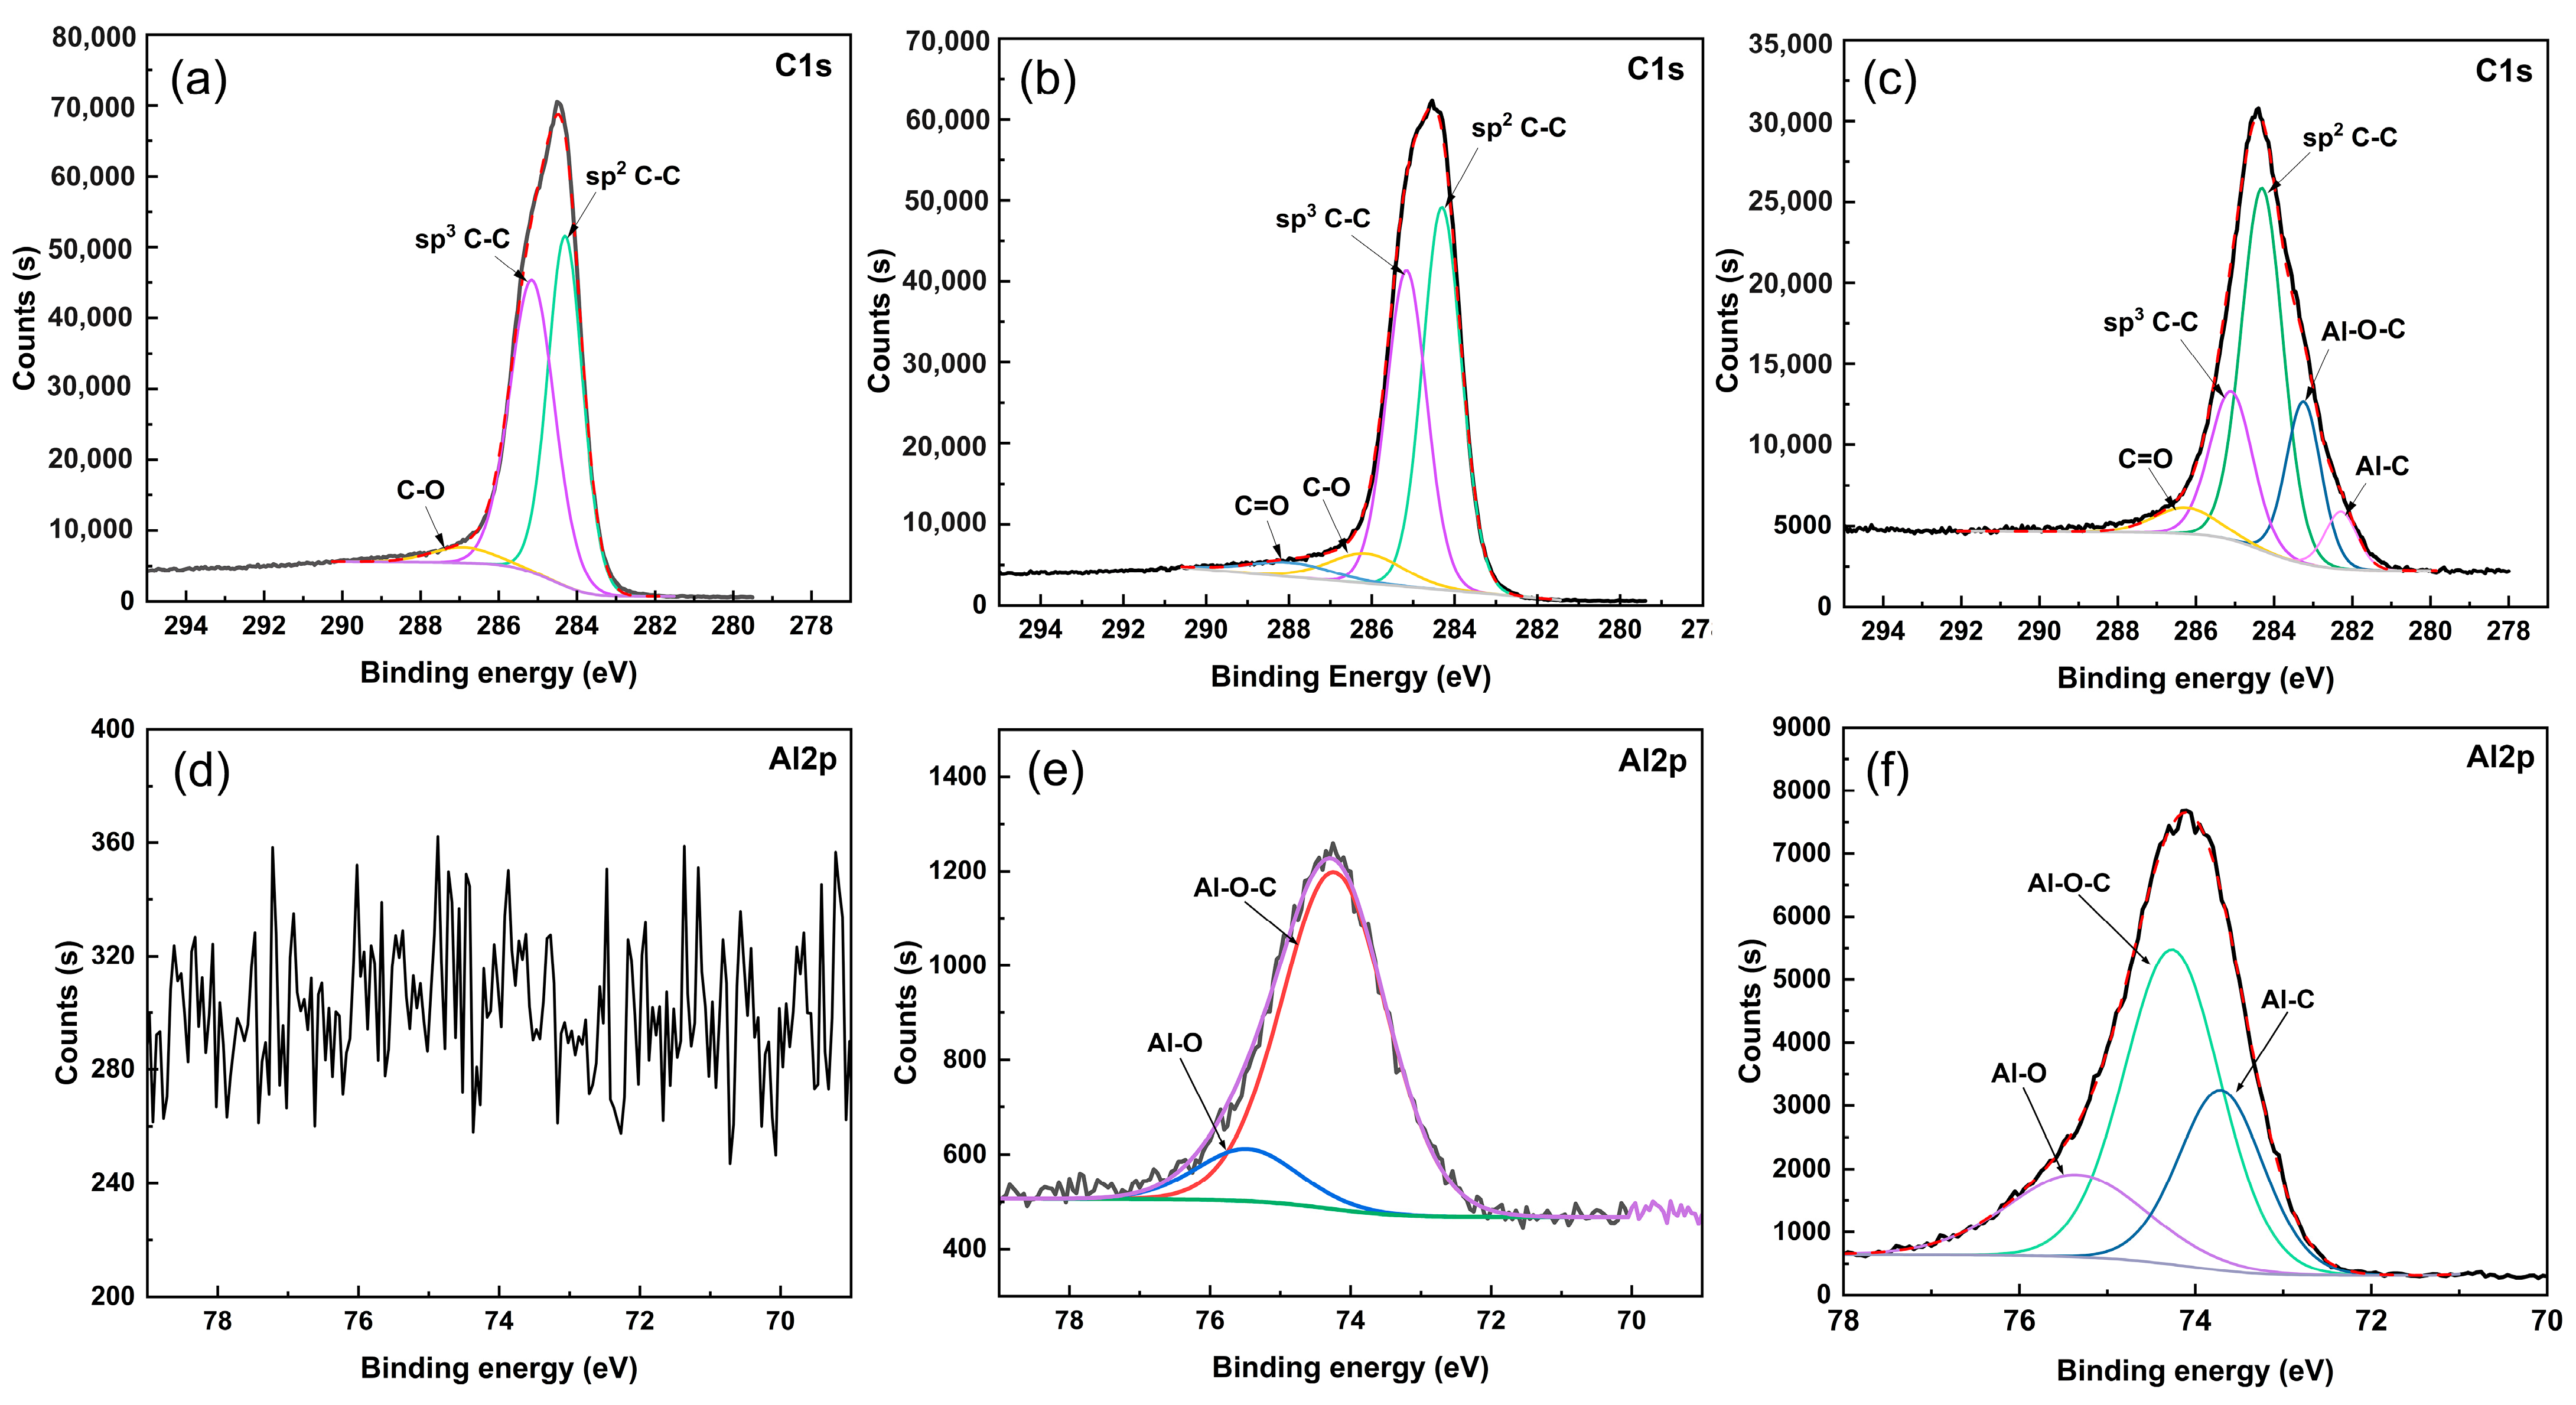
In order to analyze the chemical bonds of the elements in the ta-C:Al coatings, the typical high-resolution C1s and Al2p core level spectra of the coatings are implemented, as shown in
Figure 3. It is worth noting that as the Al concentration increases from 0 (pure ta-C) to 24.18 at.%, the relative intensity of the Al 2p increases, clearly confirming that the Al concentration increases in the coatings. After Shirley background subtraction, the C1s and Al 2p XPS spectra were deconvoluted via Gaussian fitting to obtain more details of chemical bonding of the coatings. For the pure ta-C coating (
Figure 3a,d), the C1s peak (
Figure 3a) can be superimposed by three peaks. The peak centered around 284.5 eV originates from sp
2 C-C and the peak centered around 285 eV can be ascribed to sp
3 C-C. The weak peak around 286.7 eV originates from the C-O bond [
14]. XPS signal of the Al2p peak was not detected in the coating (
Figure 3d). For the ta-C:Al coating containing an Al concentration of 1.87 at.%, the fitting peaks of the C1s spectrum (
Figure 3b) are similar to that of pure ta-C coatings but a new peak around 283 eV appears, which can be assigned to Al-O-C bonds [
11]. The observed Al2p peak in the coating (
Figure 3e) could be fitted with two peaks that are ascribed to Al-O bond around 75.5 eV and Al-O-C bond around 74.5 eV. No peaks of Al-C bonds around 73.5 eV and Al-Al bonds around 73 eV could be detected, indicating that, in this coating, the Al atoms dominantly exist in the form of oxide [
13]. For the ta-C:Al coating containing an Al concentration of 24.18 at.%, the C1s peak (
Figure 3c) could be superimposed by five peaks. In addition to the peaks representing the bonds of sp
2 C-C, sp
3 C-C and C-O, there is a new peak located around 282 eV which belongs to Al-C [
11]. In addition, the peak for Al-C bonds around 73.5 eV is also found in the Al2p spectrum (
Figure 3f). This means that the Al bonds to C and forms Al carbide when the Al concentration is very high.
It seems that the O concentration in the coating has a critical relationship with the existence of Al. Al tends to bond to O rather than to bond to C when the O/Al ratio is high (O/Al > 1) since the formation enthalpy of Al oxide (e.g., Al
2O
3:
= −1669.8 kJ⋅mol
−1) is usually much lower than that of Al carbide (e.g., Al
4C
3:
= −209 kJ⋅mol
−1). According to the composition analysis above, when the Al concentration of the coating is relatively low, the O/Al ratio is high, causing the Al atoms to appear in the oxide composition. As the Al concentration increases, the O/Al ratio decreases sharply, and not all Al atoms can be oxidized and thus, some of them will bond to C-forming carbide. In our previous work, we found the Al-rich clusters would be formed in the Al-DLC coatings when the Al concentration is high [
10,
16]. A similar phenomenon might happen in the ta-C:Al coatings. When the Al concentration is small, the Al atoms, C atoms, and O atoms would be mainly mixed into the Al-O-C composition. As the Al concentration achieves a certain level (at high sputtering power), Al-rich clusters will be precipitated in the carbon matrix.
Raman spectrum was taken for the coatings to characterize the effect of the Al doping on the carbon atomic bond structure. In amorphous carbon structures, the sp
2 sites consist of two π orbits and two σ orbits while the sp
3 sites consist of four σ orbits. The π state has a lower energy than the σ state and is thus more polarizable. Accordingly, the sp
2 sites have a 50–230 times larger Raman cross-section than sp
3 sites, resulting in that the Raman spectrum of the carbon-based coatings is dominated by the sp
2 sites [
14].
Figure 4 presents the Raman spectra of the ta-C:Al coatings containing different Al concentrations. A broad asymmetric scattering band occurs in the range of 1000 to 1700 cm
−1 of the Raman spectra, The broad asymmetric Raman scattering band represents the typical characteristics of amorphous carbon [
14]. Generally, the asymmetric Raman spectra can be fitted using two Gaussian peaks: The G-peak, centered around 1580 cm
−1 stems from the vibrations of the C-C stretching of all sp
2 pairs; and the D-peak, centered around 1360 cm
−1, due to the symmetric breathing vibration of sp
2 atoms only in rings. Accordingly, the variations of the sp
2/sp
3 ratio of the carbon-based coatings can be reflected by the changes of the G-peak position and the intensity ratio of the D-peak to G-peak (I
D/I
G). In ta-C with the sp
3 fraction > 20%, the G-peak will move towards a higher wavenumber and the I
D/I
G ratio will decrease when the sp
3/sp
2 ratio increases [
17].
Figure 4b presents the corresponding G-peak position and I
D/I
G ratio of the Raman spectra of the ta-C:Al coatings with various Al concentrations. It can be seen that the I
D/I
G ratio increases and the G-peak position moves towards a low wavenumber as the Al concentration increases, implying that the sp
2/sp
3 ratio increases. It is reported that the weak ionic bond between Al and C prefers the formation of a sp
2-like two-dimensional configuration and facilitates the graphitization of carbon structures [
9]. In addition, the doping of Al would effectively release the compressive stress, which also leads to the reduction of sp
3 fraction [
8]. Significantly, the I
D/I
G ratio shows a sharp decrease and the G-peak moves down to low wavenumber position simultaneously as the Al concentration increases to 24.18 at.%. This indicates that the Al doping causes the sp
2 fraction of the coatings to increase significantly. When the sp
3 fraction is lower than 20%, the I
D/I
G ratio and the G-peak position exhibit a similar tendency [
14]. The G
FWHM (full width at half maximum of the G peak) of the Raman spectra of the coatings are also presented in
Figure 4c. The G
FWHM has been linked to the size of sp
2-C clusters and the degree of the structural disorder. The larger the G
FWHM, the bigger the size of the sp
2-C cluster and the higher the disorder degree [
18]. When Al was added into the coatings, the G
FWHM shows a sharp decrease, implying that the small amounts of Al can promote the rapid growth of the sp
2-C. Subsequently, the G
FWHM declines gradually as the Al concentration increases, indicating that the graphitization rate of the carbon structure of the coatings becomes slow as the Al concentration increases (>4.03 at.%). The various of the G
FWHM is consistent with that of the I
D/I
G and the G peak position. It is clear that the carbon structure, including the sp
2-C cluster size and the sp
2/sp
3 ratio of the ta-C coatings, could be tuned by Al doping in small quantities.
Figure 5 presents the residual stresses of the ta-C:Al coatings containing different Al concentrations. It should be noted that the pure ta-C coating has a high residual compressive stress of about 4 GPa. The residual stresses of the ta-C:Al coatings are decreasing strictly with increasing Al concentration, and it dramatically drops down to about 1 GPa when the Al concentration increases to 24.18 at.%. This result confirms that the residual stress of the ta-C coatings could also cause a decrease in the Al doping. It can be seen that no matter the hydrogen-free DLC, hydrogenated DLC, or ta-C coatings, the Al doping shows a great effect in the relaxation of the residual compressive stress. The compressive stress of the amorphous carbon coatings originates from the process of forming sp
3 bonds during the coating deposition [
19]. The Al doping causes the reduction of the sp
3 C-C, resulting in the reduction of the compressive stress of the ta-C:Al coatings. In addition, the weak ionic bond between Al and C is helpful in reducing the residual compressive stress of the carbon-based coatings [
20].
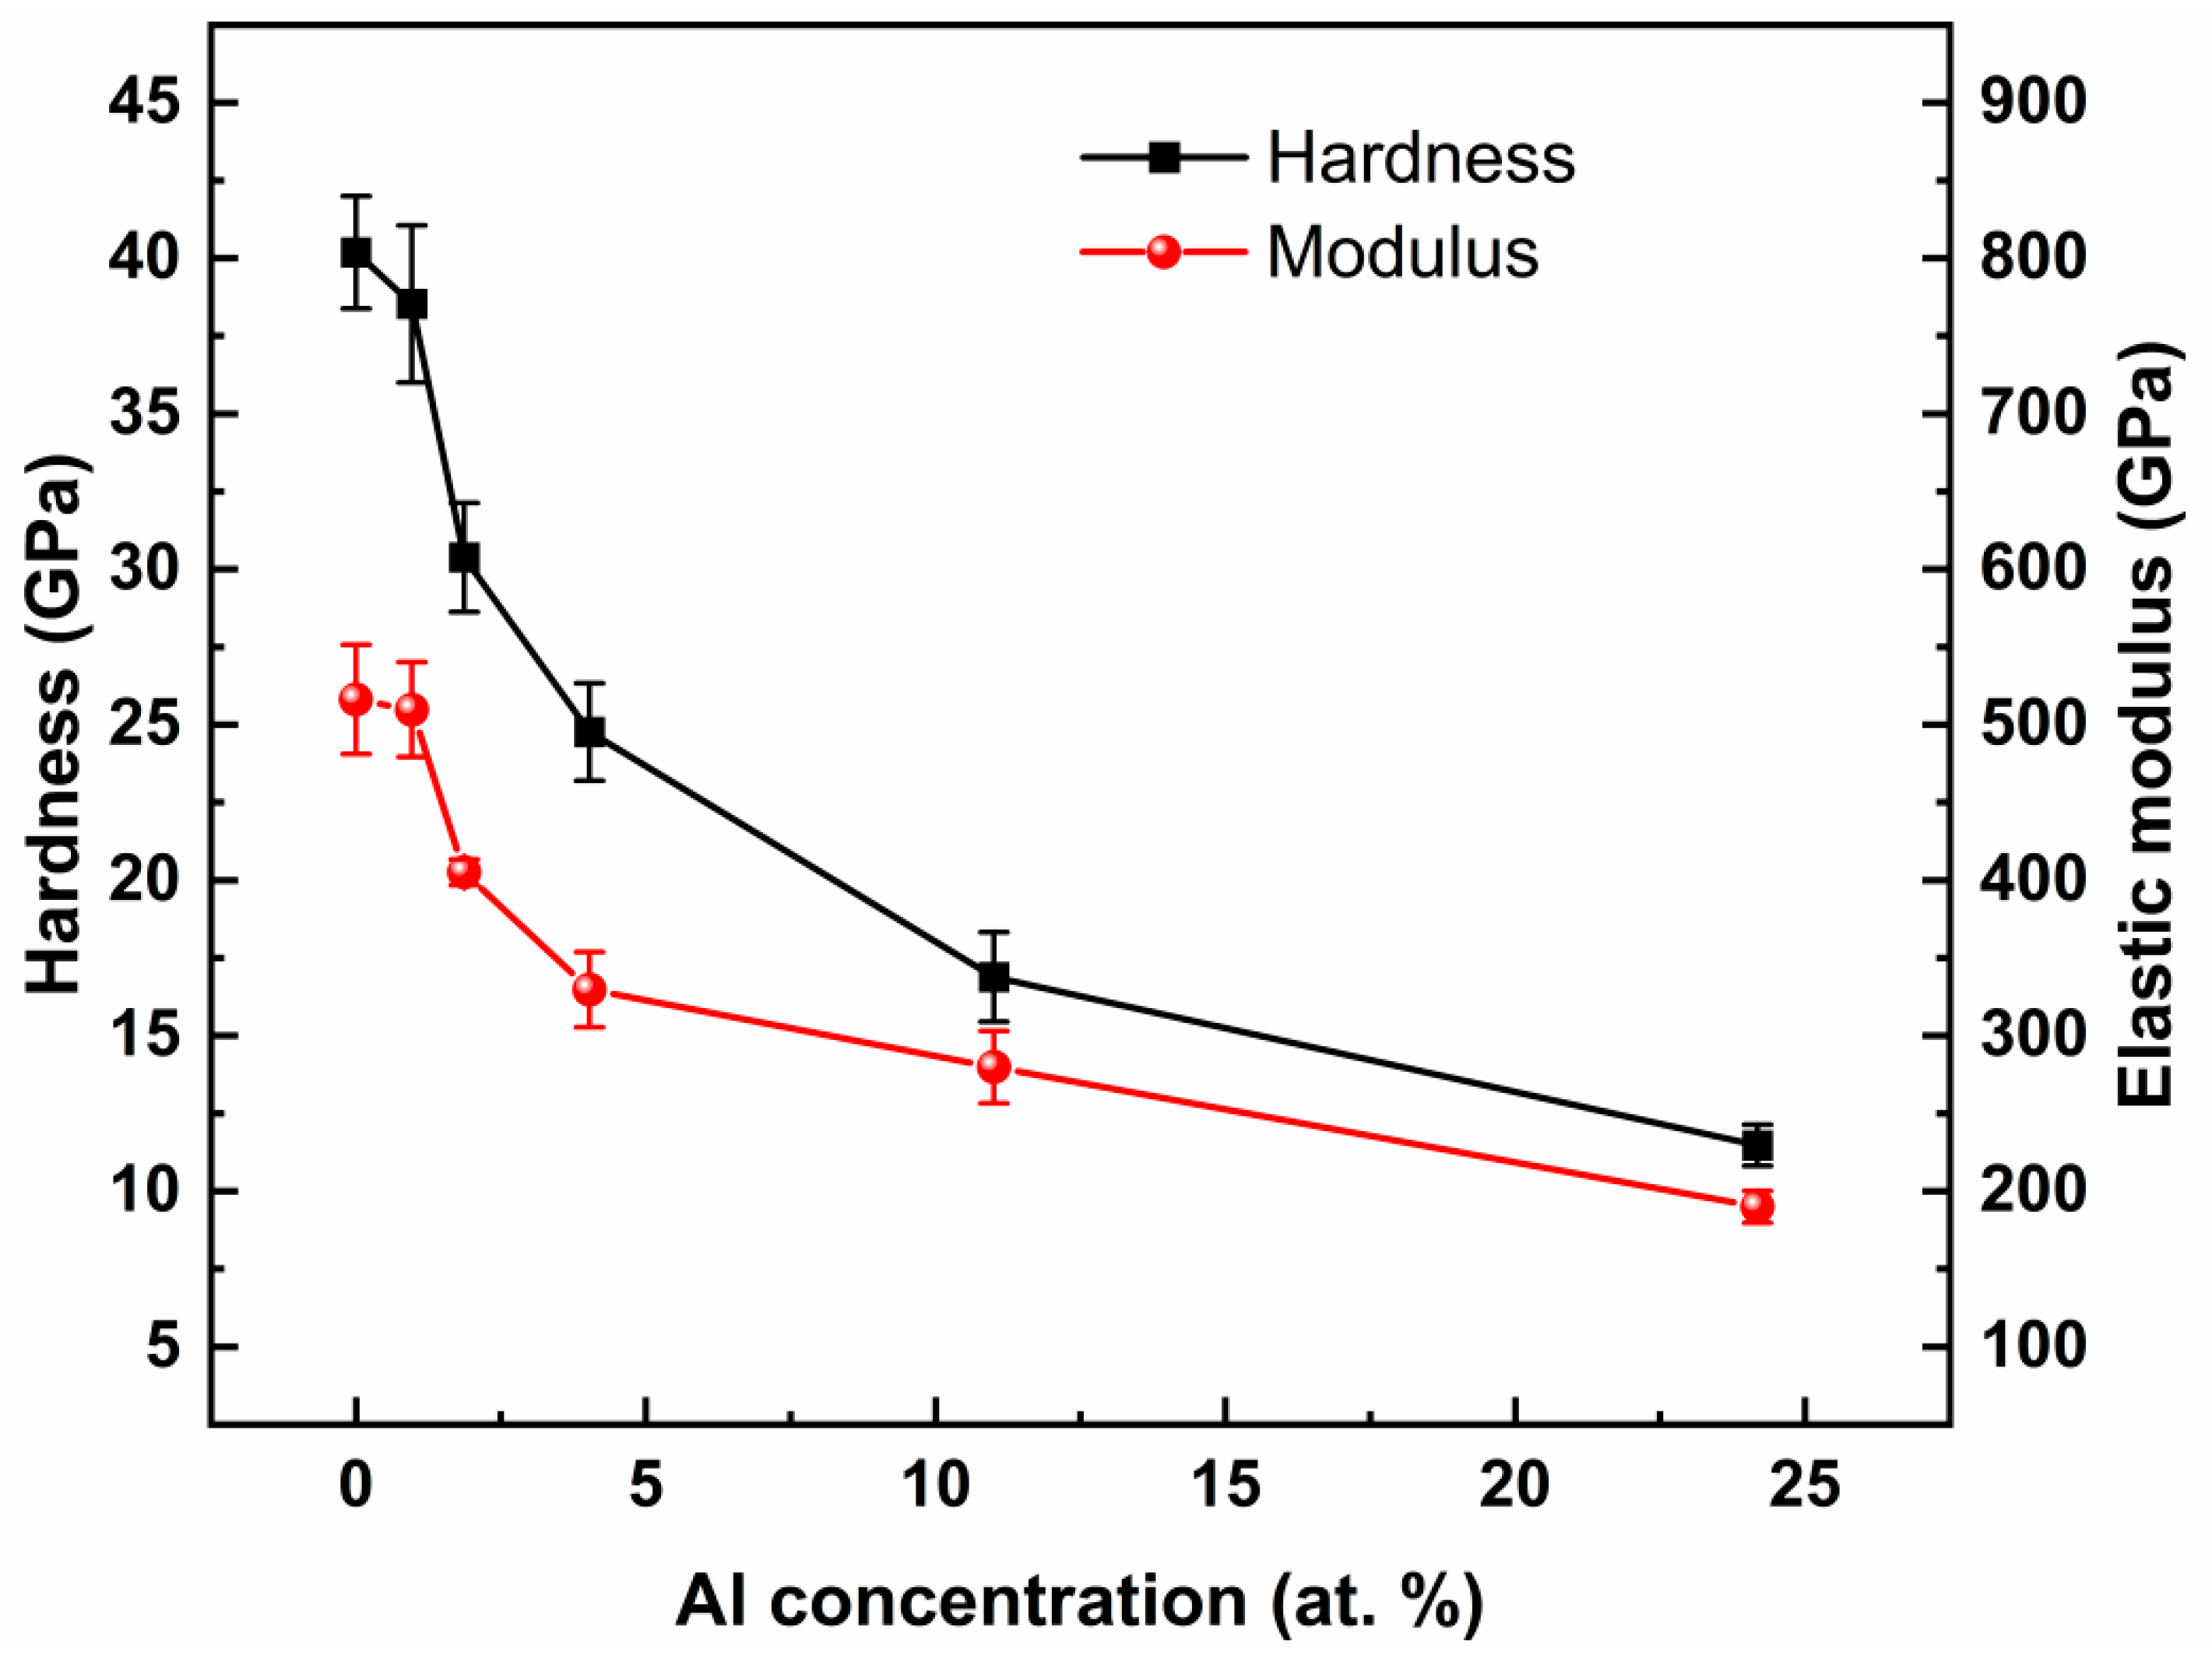
Figure 6 reveals the hardness and elastic modulus of the ta-C:Al coatings containing various Al concentrations. The hardness and elastic modulus of the pure ta-C coating are approximately 40 GPa and 520 GPa, respectively, which are far higher than that of the DLC coatings [
14]. When Al was added, the hardness and elastic modulus of the ta-C:Al coatings show a distinct decline compared to that of the pure ta-C coating. Then, the coating hardness, as well as the elastic modulus, decrease with the Al concentration. It is worth noting that the coating hardness and elastic modulus dropped greatly with a small number of Al, and then the rates of decline of the coating hardness and elastic modulus become slow at a high Al concentration (>4.03 at.%), similar to the variation of the G
FWHM against the Al concentration
. The changes in the mechanical properties of the ta-C coatings are believed to correlate with the variation of the carbon structure. According to the results of Raman (
Figure 4), the sp
2/sp
3 ratio increases firstly with the Al in small quantities, leading to a rapid decrease in the mechanical properties of the ta-C:Al coatings with an Al concentration
≤ 4.03 at.%. However, the ta-C:Al coatings still maintain a relatively higher hardness of about 25 GPa and an elastic modulus of about 330 GPa compared to the Al-DLC coatings [
12].
The tribological performances of the ta-C:Al coatings were studied using the ball-on-disk tribometer.
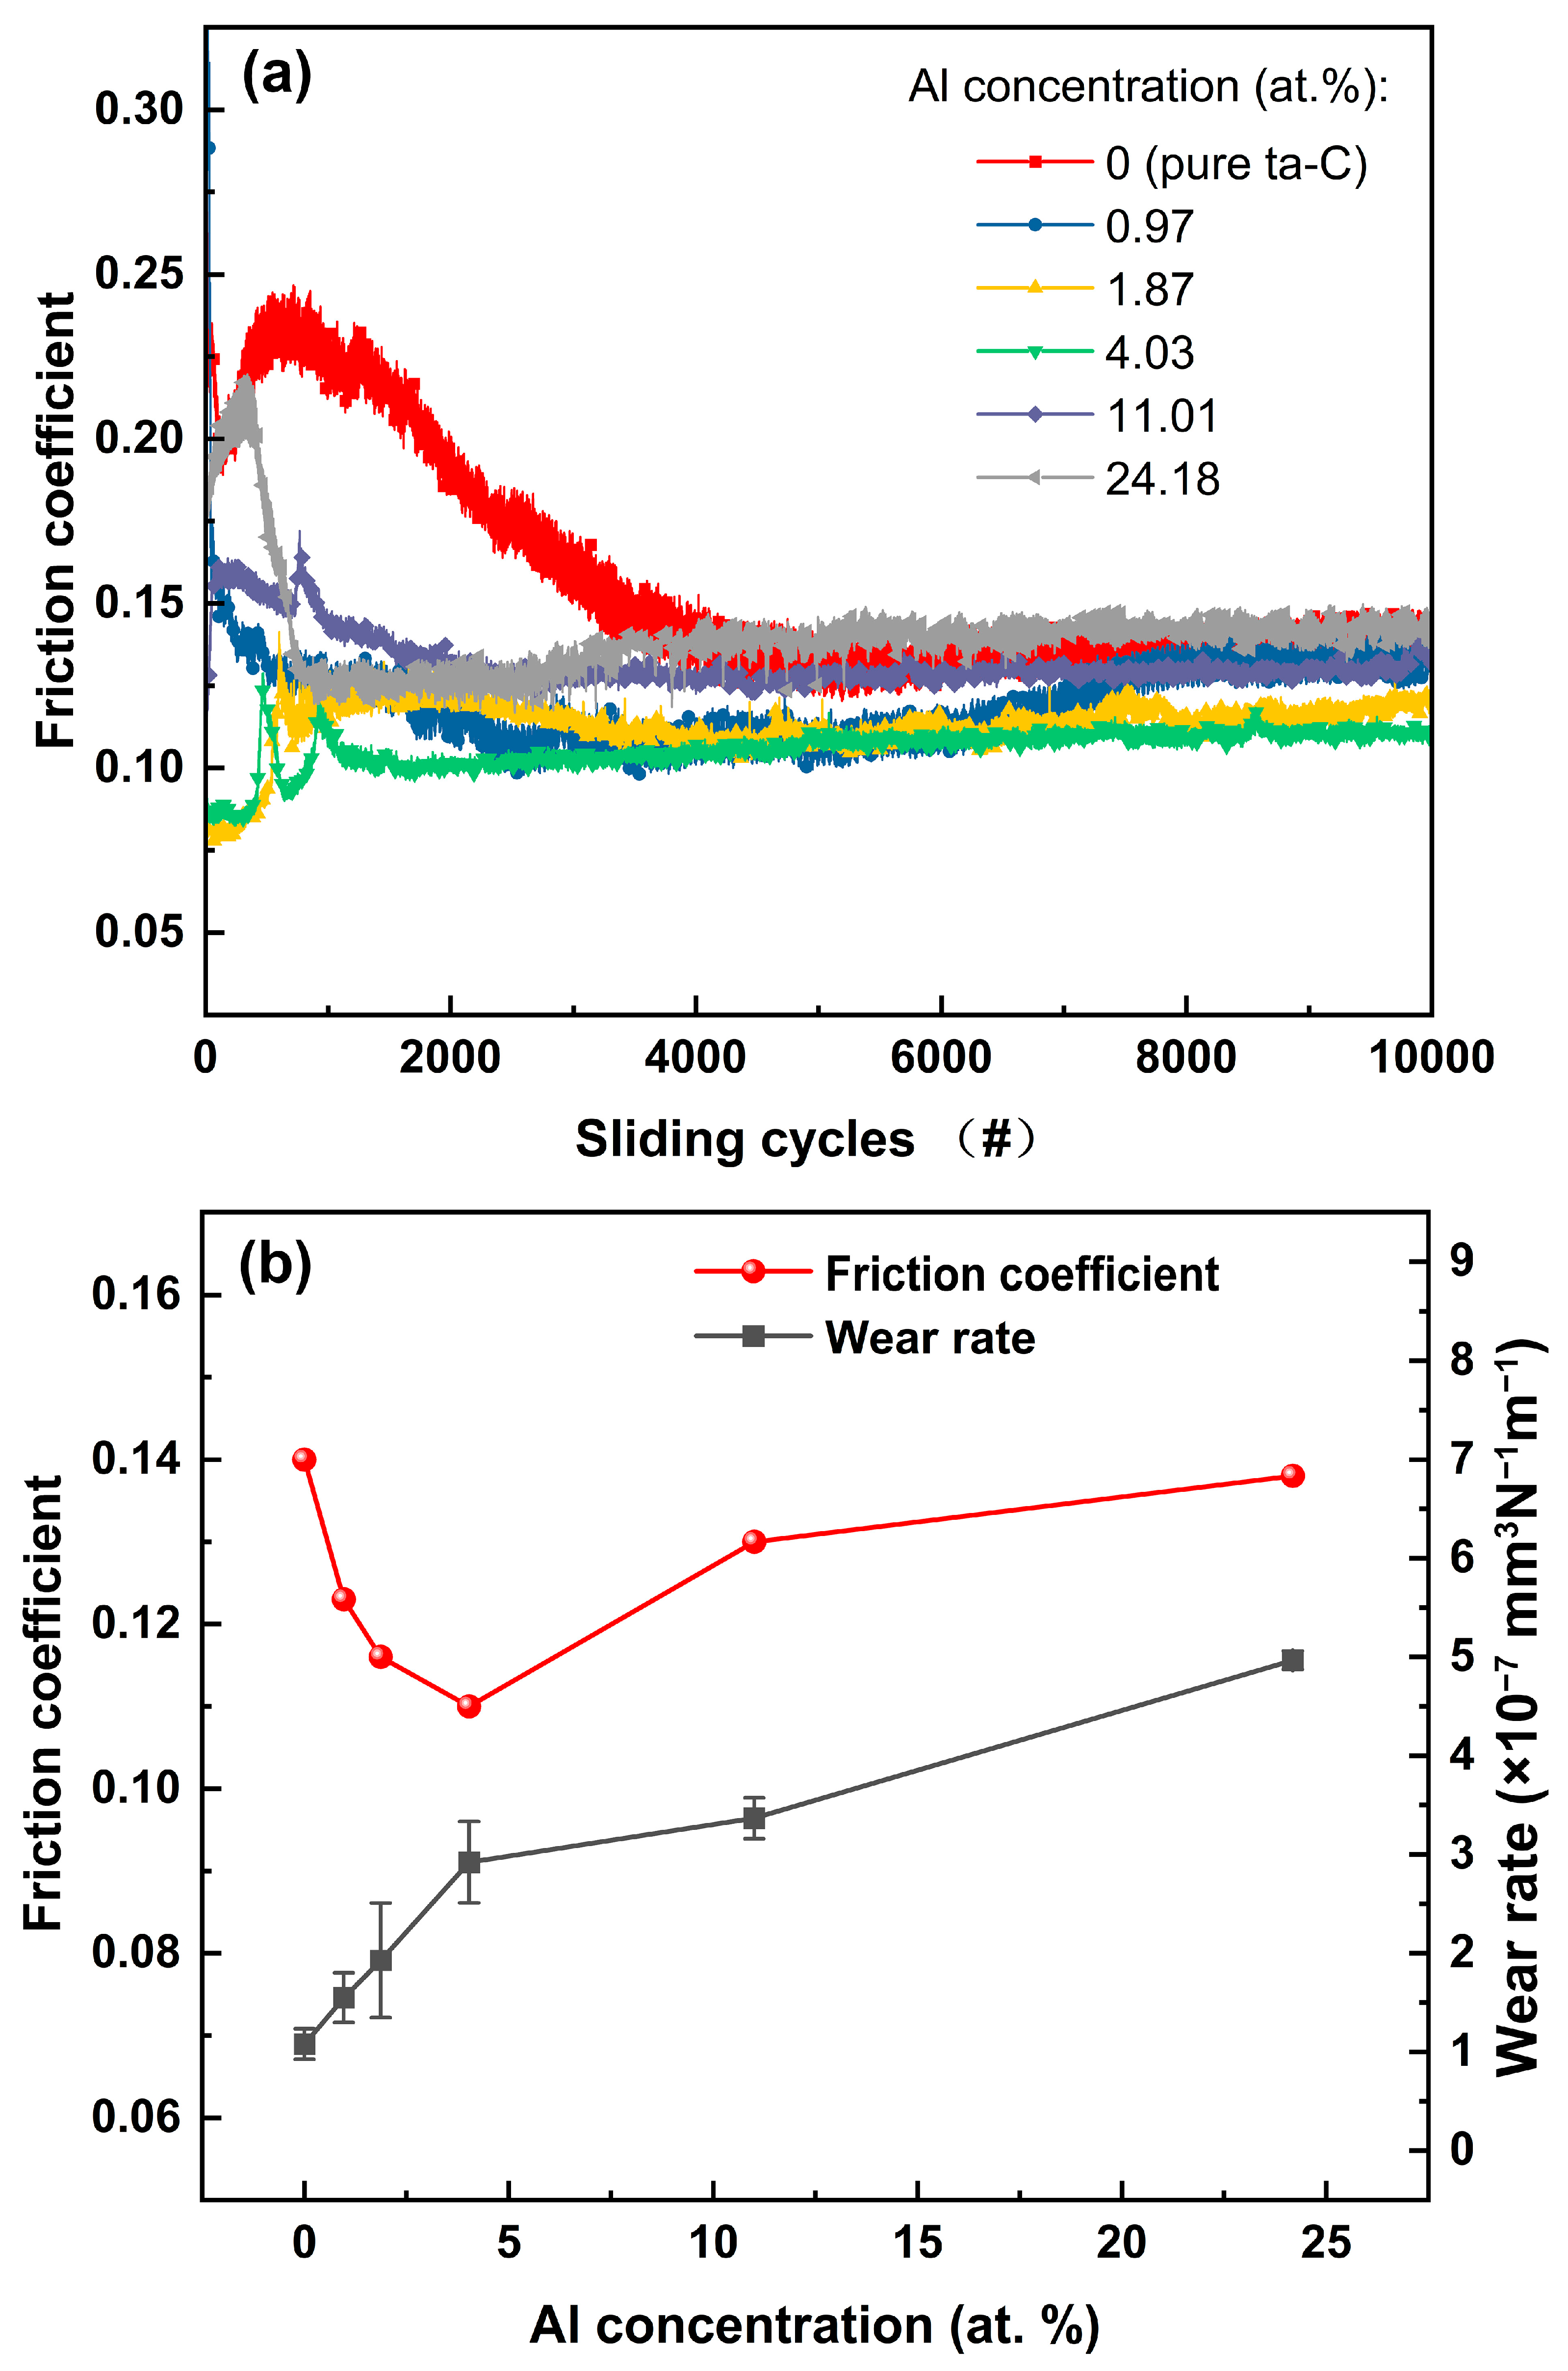
Figure 7a shows the dynamic curves of the friction coefficient of the coatings with containing various Al concentrations as a function of the sliding cycles. It should be noted that all the coatings exhibit relatively smooth and stable friction curves after the initial running-in process, implying that all the coatings have a fairly stable friction process. The pure ta-C coating has a relatively longer running-in period (about 4000 cycles) than other coatings. The initial running-in process seems to correlate with the surface topography of the coatings. However, it is reported that the Al doping would have little influence on the surface roughness of the ta-C coatings, although the surface morphology of the coatings was not tested in this paper [
11]. The long running-in period might be attributed to the high hardness of the pure ta-C coating, which would extend the breaking-in time. The corresponding average friction coefficients (calculated from the stable wear stage after 4000 cycles) of the ta-C:Al coatings are shown in
Figure 7b as a function of the Al concentration. The average friction coefficient of the pure ta-C coating (about 0.14) is slightly higher than that of the DLC coating (about 0.1 [
14]). When Al was added, the average friction coefficient of the ta-C:Al coatings shows a distinct decline compared to that of the pure ta-C coating. The average friction coefficient of the ta-C:Al coatings is dropping firstly and then increasing with increasing Al concentration. The ta-C:Al coating containing an Al concentration of 4.03 at.% reveals the lowest average friction coefficient among the samples.
It is reported that the sp
3 C-C bonds will be broken during the dry friction process, causing the formation of dangling σ bonds that are exposed to the friction surface. As a result, the interaction of the coating-ball pairs will be enhanced by the dangling σ bonds, resulting in the increase in the friction coefficient [
21]. The pure ta-C coating has a high sp
3 fraction and thus, shows a relative higher friction coefficient compared to the pure DLC coatings during the dry friction process. The Raman spectra results illustrate that the incorporation of Al will reduce the sp
3 C-C bond fraction and increase the size of the sp
2 cluster. The decrease in the sp
3 fraction would weaken the interaction effect of the dangling σ bonds. In addition, the sp
2 clusters have an effect of solid lubrication. As a result, the friction coefficient of the ta-C:Al coatings decreases with the Al concentration. However, when the Al concentration is high, the hardness of the ta-C:Al coatings decreases significantly, causing an increase in the contact area of the coating-ball pairs. As a result, the friction coefficient of the ta-C:Al coatings increases with the Al concentration.
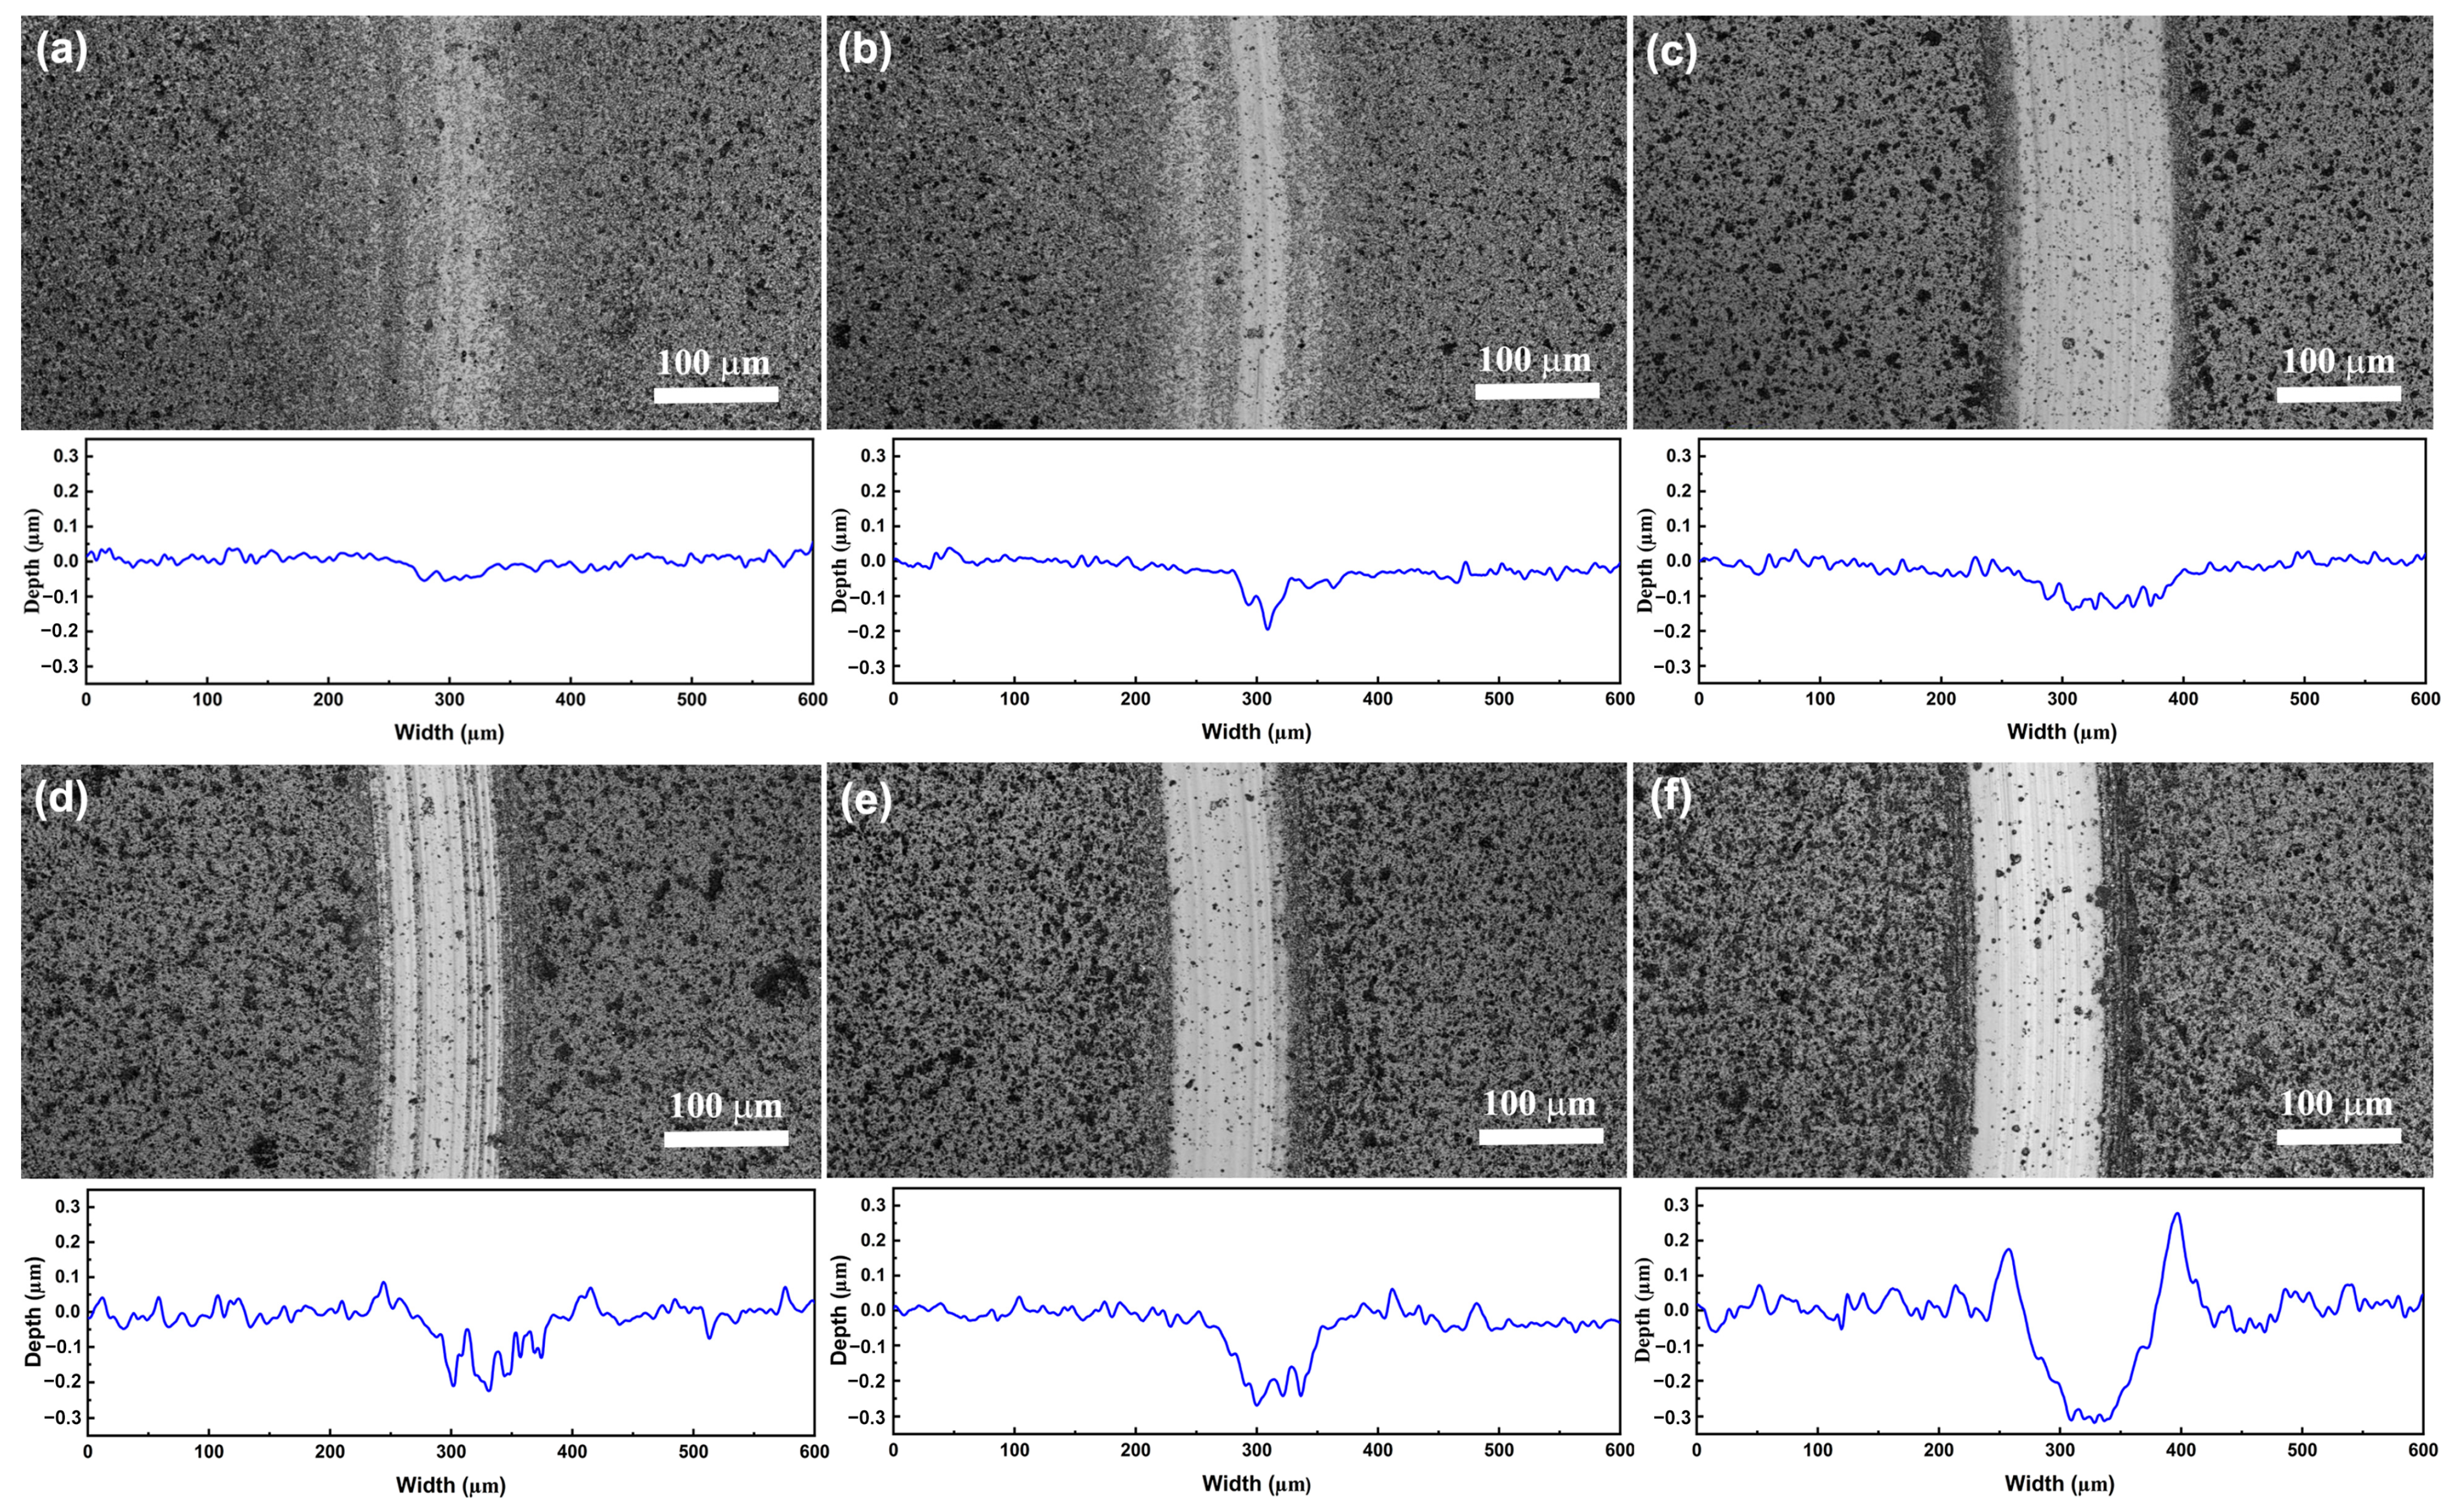
The morphology and corresponding cross-section profiles of the wear tracks of the coatings after the friction test are shown in
Figure 8. The pure ta-C coating (
Figure 8a) exhibits a very small wear track. As the Al concentration increases, the wear track becomes larger and deeper. Although the depth of wear track of the ta-C:Al coating just increases to about 300 nm when the Al concentration increases to 24.18 at.% (
Figure 8c), it is much lower than the coating thickness, implying that the coating is not worn out. The wear rate of the coatings are shown in
Figure 7b. It should be noted that the pure ta-C coating has a good wear resistance with a wear rate of about 1.1 × 10
−7 mm
3N
−1m
−1. As the Al concentration increases, the wear rate of the coatings increases slowly, and it increases to about 5.0 × 10
−7 mm
3N
−1m
−1 as the Al concentration increases to 24.18 at.%. The wear resistance of the coatings might be relevant to the mechanical properties of the coatings. According to the results above, the hardness of the coatings is decreasing with the increasing Al concentration, causing the wear rate to increase with the Al concentration. In general, all the ta-C:Al coatings still keep a good wear resistance.
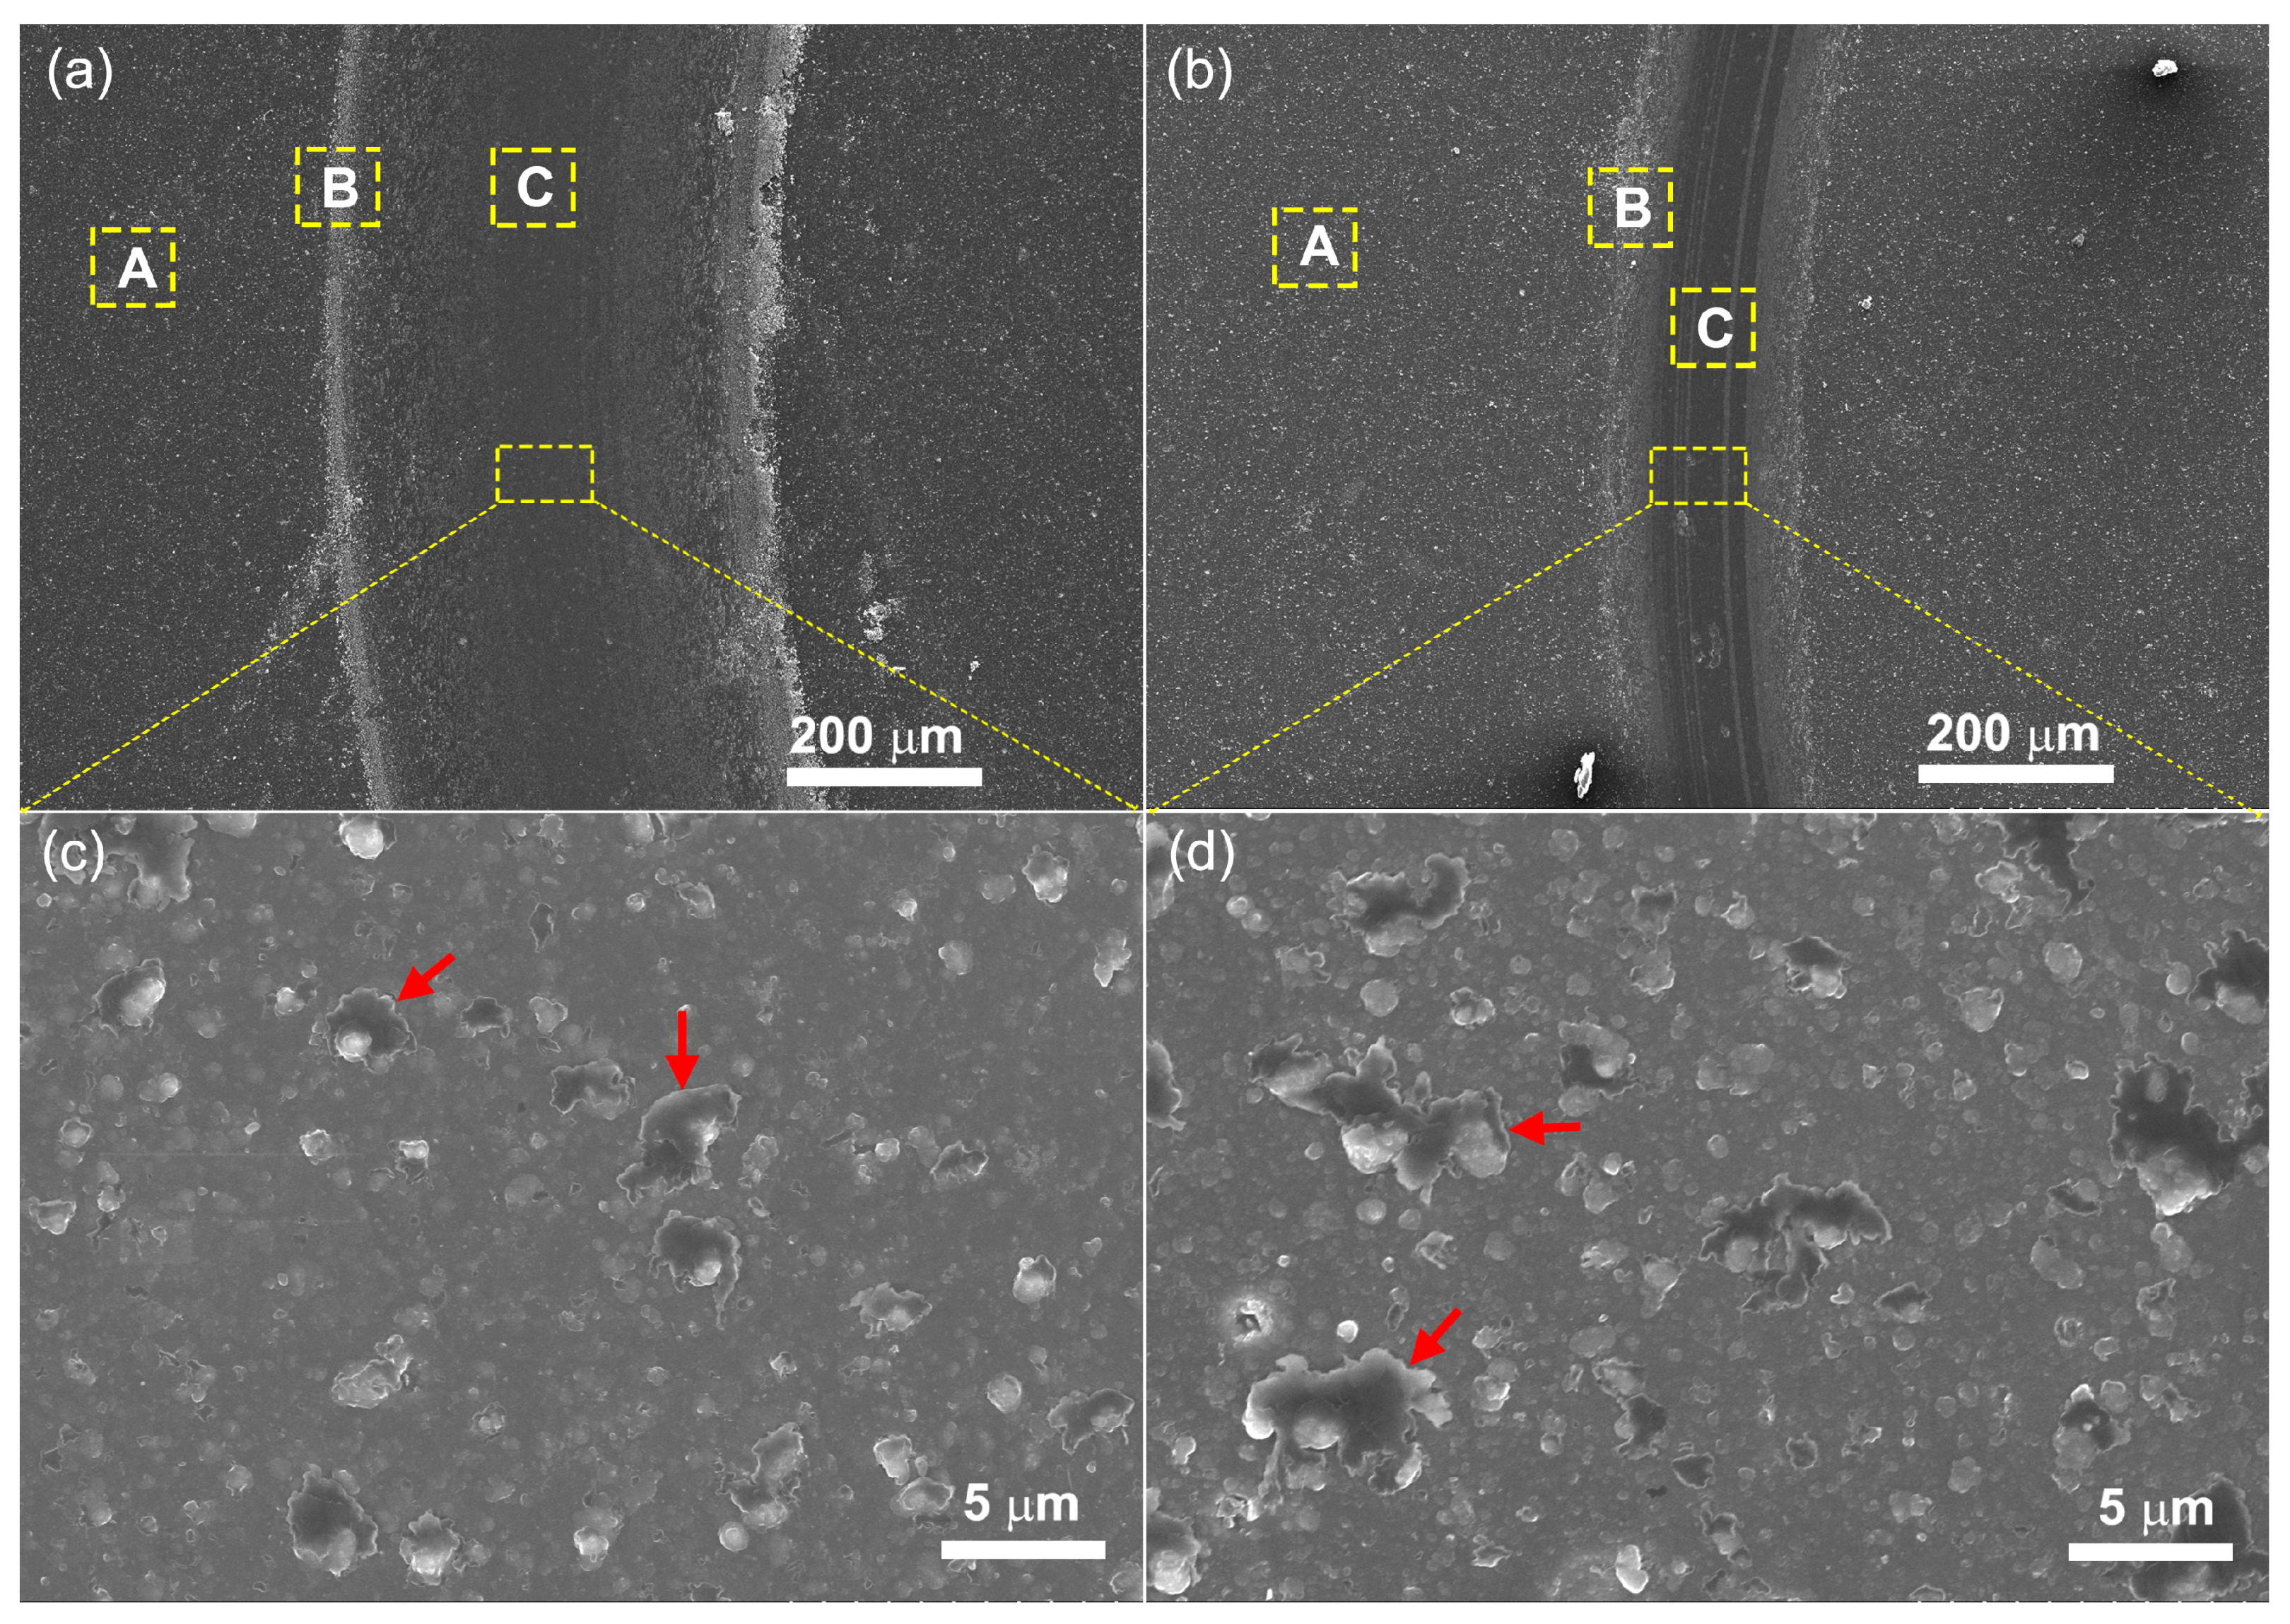
The morphologies of the wear surfaces of the coatings were also analyzed using SEM.
Figure 9 shows the typical microtopographies of wear track of pure ta-C coating (
Figure 9a,c) and the ta-C:Al coating containing an Al concentration of 4.03 at.% (
Figure 9b,d). It is worth noting that the wear track of pure ta-C coating is bordered by numerous wear debris. The detail in the wear track shows that there are many sheet shapes in the wear track (the red arrows in
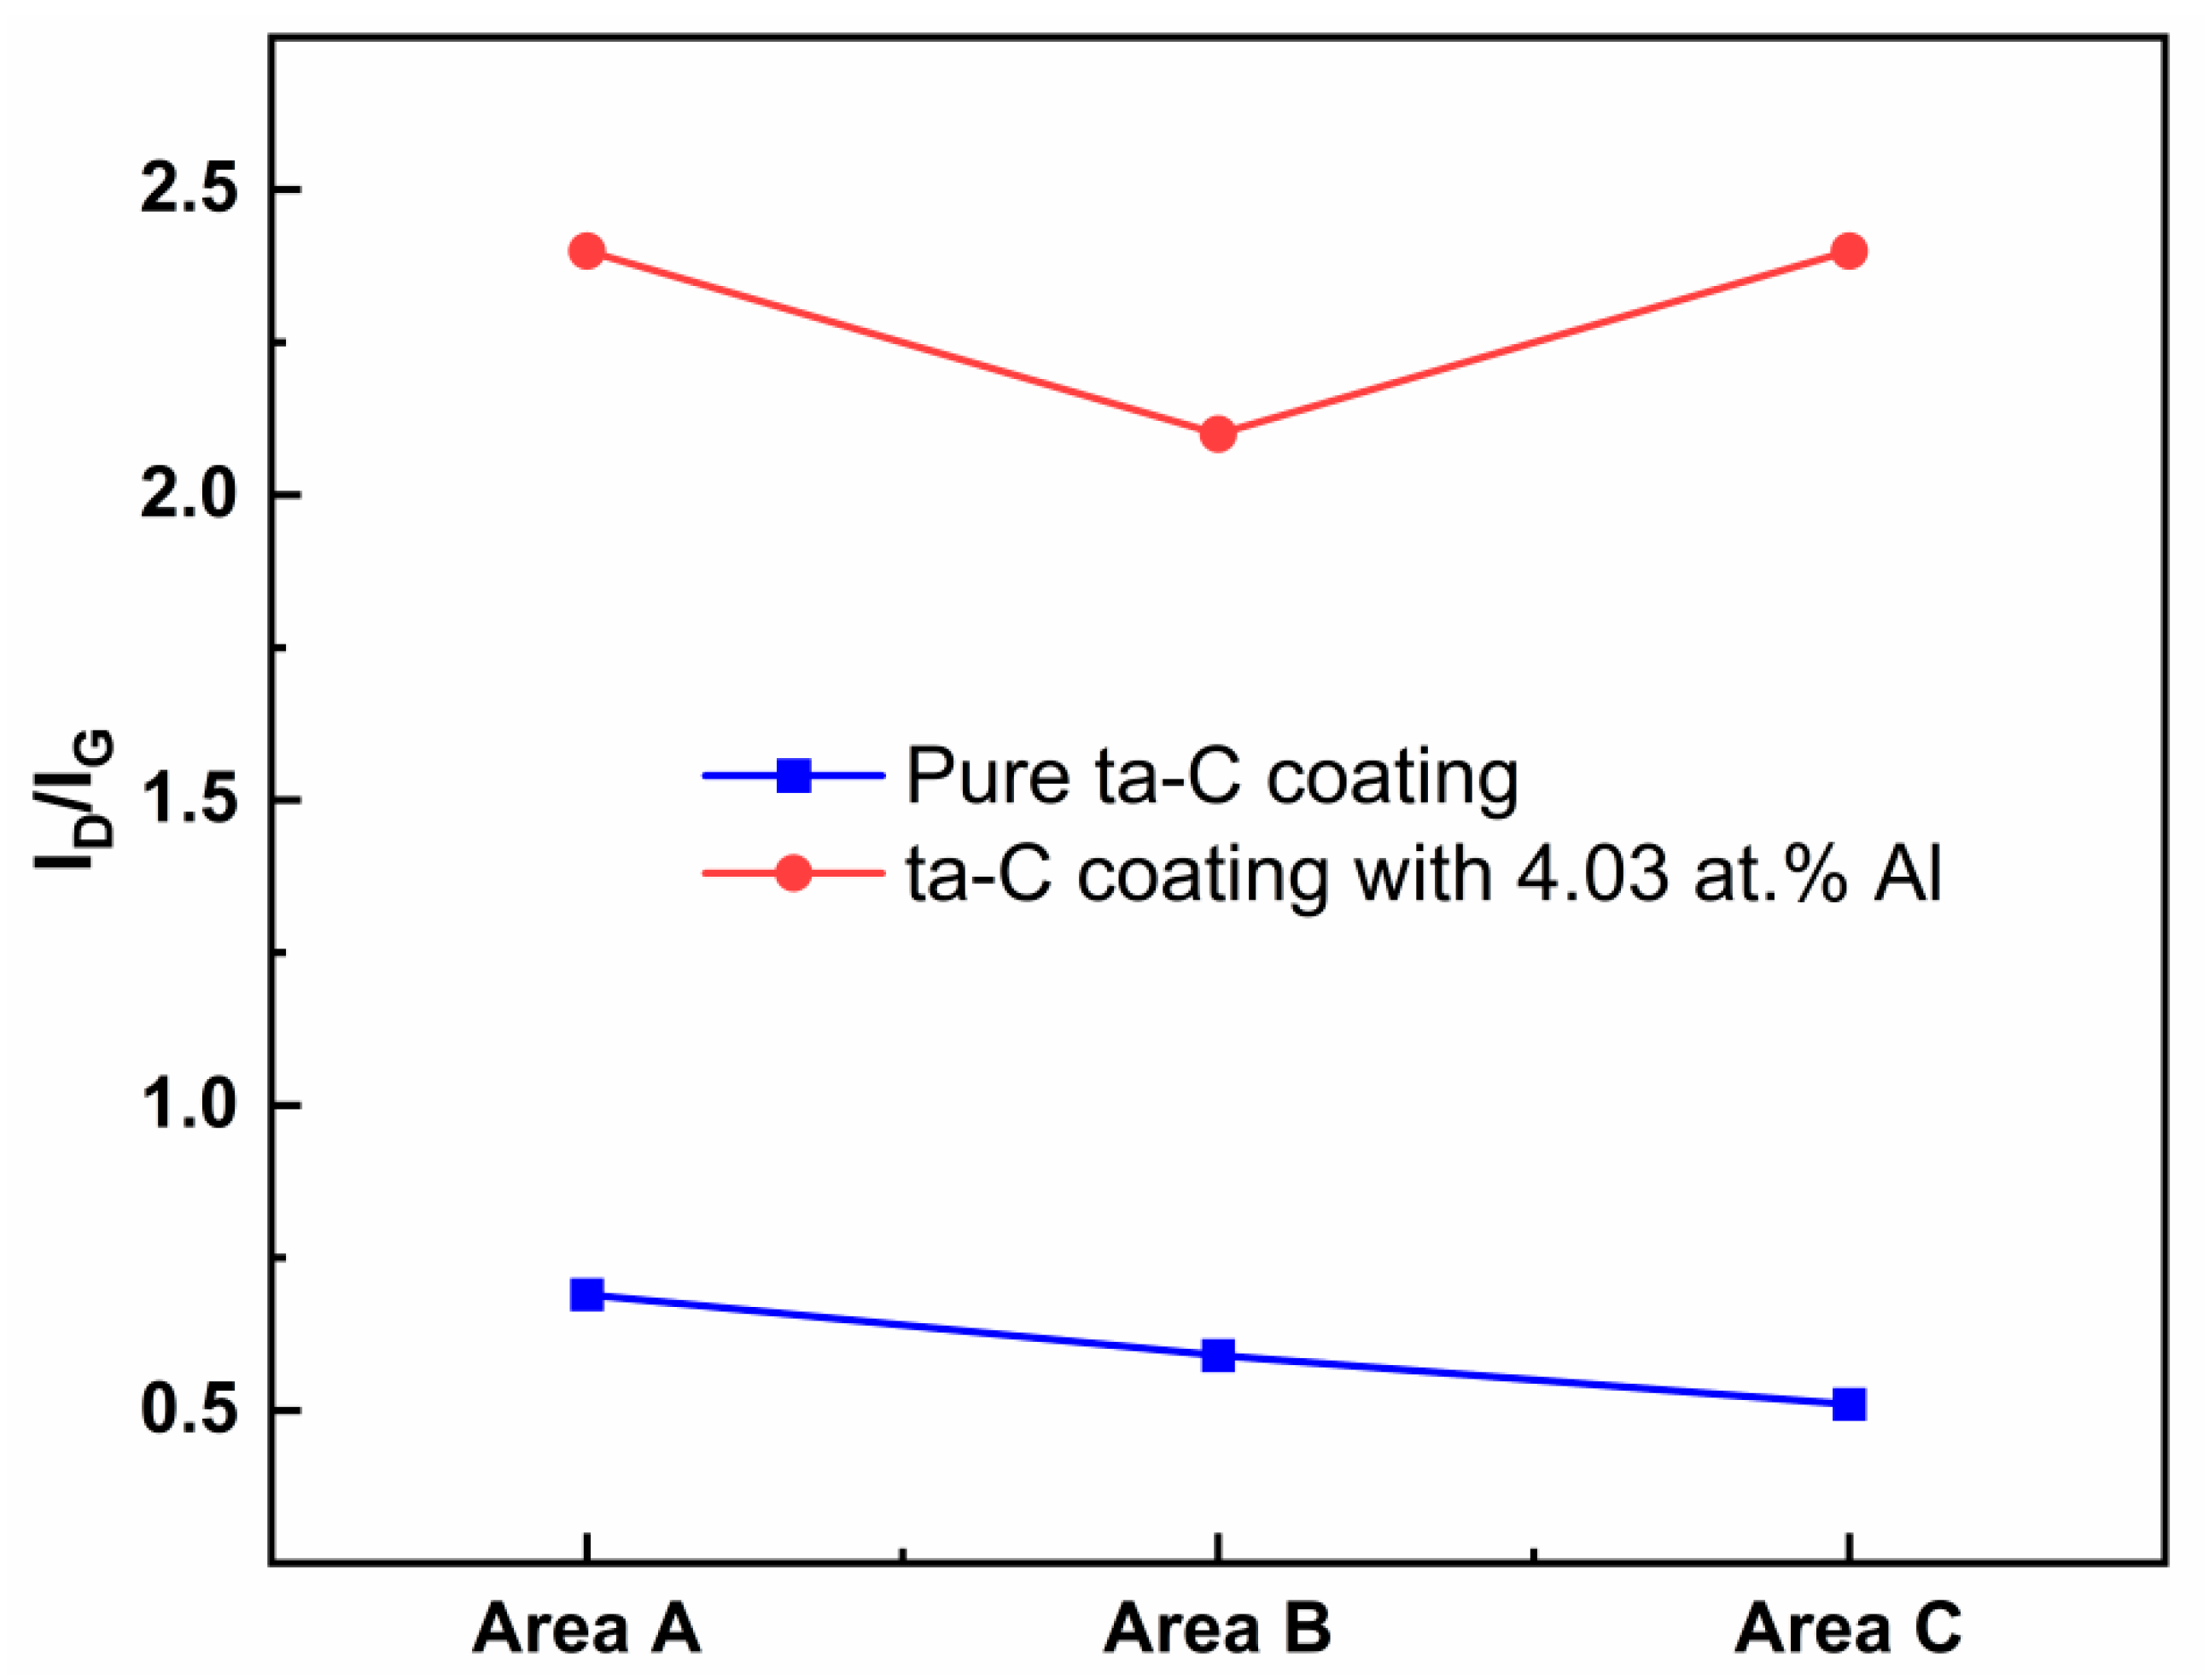
Figure 9c). The Raman spectra was taken on a part of the coating surface without wear (area A), the edge of the wear track (area B) and in the wear track (area C). The I
D/I
G ratios from the Raman spectra are presented in
Figure 10. For the pure ta-C coating, the I
D/I
G ratios in area A and area B are higher than in area C, implying that the sp
3 fraction increases in the wear track (area C). For the ta-C:Al coating with 4.03 at.% Al, however, the I
D/I
G ratio in area C is slightly higher than these in area A and B, indicating that the sp
2 fraction increases in the wear track, while the sp
3 fraction increases in the wear edge. It is reported that during the friction process of the hydrogen-free amorphous carbon coating, C-C bonds of carbon atoms are broken and rearranged at the sliding interface, resulting in the graphitization of the carbon matrix structure and the formation of the sp
3 C-C bonds [
22]. It is clear that the friction process causes the increase the sp
3 bonds in pure ta-C coating. However, the Al doping will facilitate the formation of the sp
2 clusters. These sheet shapes on the wear tracks might be the graphite-like tribo-layer which has an effect of solid lubrication and thus, reduces friction. It should be noted that the sheet shapes on the wear track show a sharp increase in the size and number for the ta-C:Al coating (
Figure 9c,d). The increase in the sheet shapes is mainly due to the incorporation of Al which promotes the segregation of graphitic cluster from the amorphous carbon matrix structure forming graphitic tribo-layer. As a result, the ta-C:Al coating shows a relatively lower friction coefficient compared to the pure ta-C coating (
Figure 7b).

