Article

Attenuation Law of Performance of Concrete Anti-Corrosion Coating under Long-Term Salt Corrosion

1
School of Materials Science and Engineering, Chang’an University, Xi’an 710061, China
2
Qinghai Communications Construction Engineering Co., Ltd., Xining 810021, China
3
Xi’an Highway Research Institute Co., Ltd., Xi’an 710065, China
4
Xi’an Huaze Highway Material Co., Ltd., Xi’an 710065, China
*
Author to whom correspondence should be addressed.
Coatings 2024, 14(10), 1249; https://doi.org/10.3390/coatings14101249
Submission received: 22 August 2024 / Revised: 20 September 2024 / Accepted: 24 September 2024 / Published: 30 September 2024

Abstract

:
In saline soil areas, the concrete piers of concrete bridges experience long-term corrosion, mainly caused by chloride salts due to alternating temperature changes. Waterborne concrete coatings are prone to failure in this aggressive salt environment. Implementing coating protection measures can improve the durability of concrete and enhance the service life of bridges. However, the effectiveness and longevity of coatings need further research. In this paper, three types of waterborne concrete anti-corrosion coatings were applied to analyze the macro and micro surface morphology under wet–dry cycles and long-term immersion conditions. Various indicators such as glossiness, color difference, and adhesion of the coatings were tested during different cyclic periods. The chloride ion distribution characteristics of the buried concrete coatings in saline soil, the macro morphology analysis of chloride ion distribution regions, and the micro morphology changes of the coatings under different corrosion times were also investigated. The results showed that waterborne epoxy coatings (ES), waterborne fluorocarbon coatings (FS), and waterborne acrylic coatings (AS) all gradually failed under long-term salt exposure, with increasing coating porosity, loss of internal fillers, and delamination. The chloride ion content inside the concrete decreased with increasing depth at the same corrosion time, while the chloride ion content at the same depth increased with time. The chloride ion distribution boundary in the cross-section of concrete with coating protection was not significant, while the chloride ion distribution boundary in the cross-section of untreated concrete gradually contracted towards the concrete core with increasing corrosion time. During the corrosion process in saline soil, the coatings underwent three stages: adherence of small saline soil particles, continuous increase in adhered material area, and multiple layers of uneven coverage by saline soil. The failure process of the coatings still required erosive ions to infiltrate the surface through micropores. The predicted lifespans of FS, ES, and AS coatings, obtained through weighted methods, were 2.45 years, 2.48 years, and 2.74 years, respectively, which were close to the actual lifespans observed in salt environments. The developed formulas effectively reflect the corrosion patterns of different resin-based coatings under salt exposure, providing a basis for accurately assessing the corrosion behavior and protective effectiveness of concrete under actual environmental factors.

1. Introduction

Concrete, due to its good plasticity, economy, and strength characteristics, is widely used in various infrastructure constructions such as transportation and civil engineering [1]. Especially in saline soil areas, the structures of concrete bridges, pedestals, and columns are directly affected by complex climate conditions, including freeze–thaw cycles, salt erosion, and wet–dry alternation [2,3,4]. As a result, the performance of concrete materials deteriorates significantly, seriously affecting the serviceability of concrete structures [5].
The soluble salt content in saline soil is much higher than the specified value, and corrosive ions such as chloride ions, sulfate ions, and carbonate ions cause severe corrosion to concrete structures [6]. Under the coupling effect of various corrosion factors, the durability of concrete structures is greatly challenged. The permeable hydrophilic structure on the surface of concrete structures makes water and salt easily penetrate the interior, leading to various types of deterioration, especially near the wet–dry alternating surface of concrete structures [7]. Wet–dry alternation accelerates the precipitation of crystalline salts, causing more severe deterioration and damage than other locations. Infiltrating water carrying chloride ions enters the interior of the concrete, causing “salt scaling” and corroding internal reinforcement and nails [8]. The water also carries sulfate ions, which react with cement hydration products to form salt crystals when infiltrating the interior of the concrete [9]. This product expands the volume by twice the original reactant, generating expansive internal stress within the concrete. When the expansive stress exceeds the tensile strength of the cementitious material, cracks will occur, causing cracking damage. Moreover, salt crystals do not have adhesive properties, resulting in structural damage and fragmentation of the concrete [10,11,12].
According to the survey results [13,14,15], anti-corrosion coatings can effectively protect concrete structures and improve their service life.
Research has shown that traditional sealing coating methods can be used to prevent water from penetrating into the interior of concrete [16]. Commonly used coatings in traditional sealing coating methods include epoxy coatings, chlorinated rubber coatings, acrylic coatings, and polyester resins [17]. By brushing or spraying, a dense protective film is formed on the surface of the concrete, isolating it from external water and moisture. This method has a significant waterproof effect. When anti-corrosion coatings are applied to concrete, different types of coatings can enhance the concrete structure’s resistance to chloride ions to varying degrees [18,19]. However, due to the aromatic ether bond in the epoxy, it is easy to degrade and break the chain under UV irradiation, resulting in the loss of light and powder coating. The water-borne acrylic resin has low water resistance and poor solvent resistance, and the hardness of the coating decreases rapidly in the marine environment. Fluorocarbon resin has good heat resistance and corrosion resistance because of its alternating copolymerization structure of fluoroolefin unit and vinyl ether unit. The attenuation of these apparent morphology and protective properties (such as luster, color, etc.) still need to be observed under long-term simulation tests.
Based on the existing corrosion characteristics of concrete bridges in saline soil areas and the current application status of anti-corrosion coatings, this paper sets up long-term exposure tests and accelerated tests of wet–dry cycles to simulate the corrosion conditions of concrete bridge structures in wet–dry areas. Macroscopic and microscopic observations are made on concrete structures in different burial depths, different corrosion zones, and different corrosion damage effects. In addition, a systematic anti-corrosion design is conducted based on the corrosion areas and environments to guide the anti-corrosion of concrete structures in highway bridges in saline soil areas. The optimal anti-corrosion coating system is selected to ensure the anti-corrosion performance of concrete structures throughout their lifecycle, aiming to effectively estimate the corrosion life of bridge structures in saline soil areas.

2. Experimental Section

2.1. Materials

The concrete used for the experiment was 42.5-grade ordinary Portland cement (OPC). The chemical composition of the cement is shown in Table 1. The physical properties of the cement and aggregate are shown in Table 2. The coarse and fine aggregate used were limestone gravel and river sand, respectively. The physical properties of the aggregates are shown in Table 3. Potable water was used for both concrete mixing and solution preparation. The concrete was designed for a target compressive strength of C30, and the mix ratio of the concrete specimen is shown in Table 4. After standard curing for 28 days, the specimens were set aside for subsequent use. Following the completion of the curing process, the concrete surfaces were cleaned and kept ready for coating.
The coating material used is a commonly used water-based coating for concrete surfaces. Waterborne epoxy coatings are marketed by Zhongshan Forbes Waterborne coatings Co., Ltd. (Zhongshan, China); waterborne acrylic coatings are marketed by Fujian Shengda coating Co., Ltd. (Fuzhou, China).; and waterborne fluorocarbon coating is marketed by Guangdong Tonglida New Material Co., Ltd. (Guangzhou, China). The content of volatile organic compounds is below 150 g/L, and the ratio of epoxy main paint and curing agent is 2:1.

2.2. Preparation of the Multi-Layer Anticorrosion Coating System

The coating protection for the specimens was applied using the brush coating method. On each surface of the concrete specimens, a primer, intermediate layer, and topcoat were sequentially applied. Two coats were brushed for each layer, with the brushing direction of adjacent coats perpendicular to each other. Each coat was applied after the previous coat had fully dried. The coating process was conducted in an environment with a temperature range of 5 °C to 38 °C and a relative humidity of ≤85%. The total thickness of the coating was between 250 μm and 260 μm. The coating thickness on the concrete test blocks was verified using a magnetic thickness gauge following the procession control panel method [20]. After completion of the coating process, the test blocks were cured at room temperature for 7 days before testing. The coating system and thickness for the concrete coating are specified in Table 5. The preparation of concrete specimens under long-term salt corrosion is shown in Table 6.

2.3. Test Methods

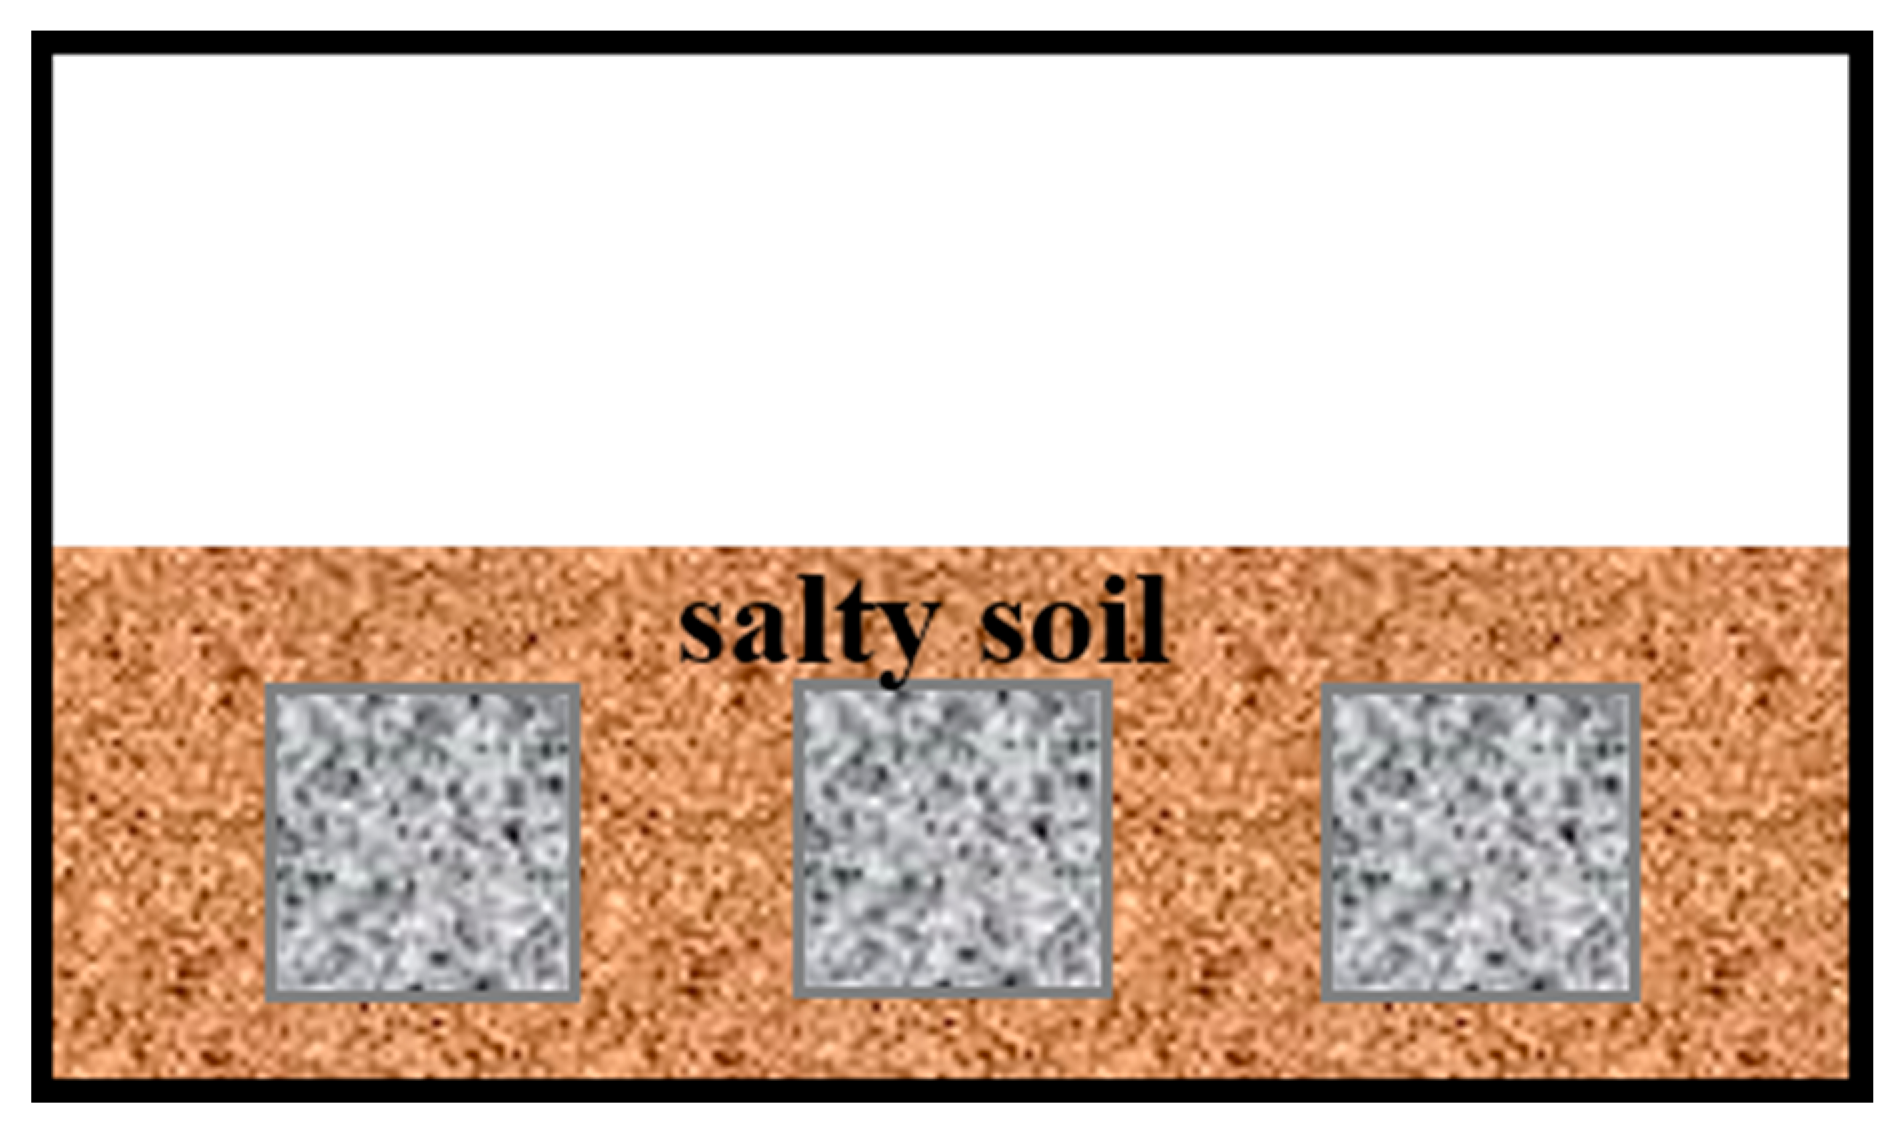
2.3.1. Long-Term Burial Salt Corrosion Test

A salt corrosion test was conducted using the method of burying the specimens in saline soil. The saline soil used was collected from the lower part of bridges in the Golmud area of Qinghai Province. The chemical composition and content of the saline soil can be found in Table 7. The collected saline soil was air-dried for 7 days at room temperature, crushed, and then uniformly spread at the bottom of the specimen box with a moisture content of 15%. After placing the specimens, the soil was further uniformly spread, and each 2 cm layer was compacted using a compacting rod. The depth of the soil burial was 2 cm higher than the top of the test block. At the end of each testing cycle, the concrete test blocks were taken out for gloss, color difference, and adhesion testing. The schematic diagram of the salt corrosion test is shown in Figure 1.

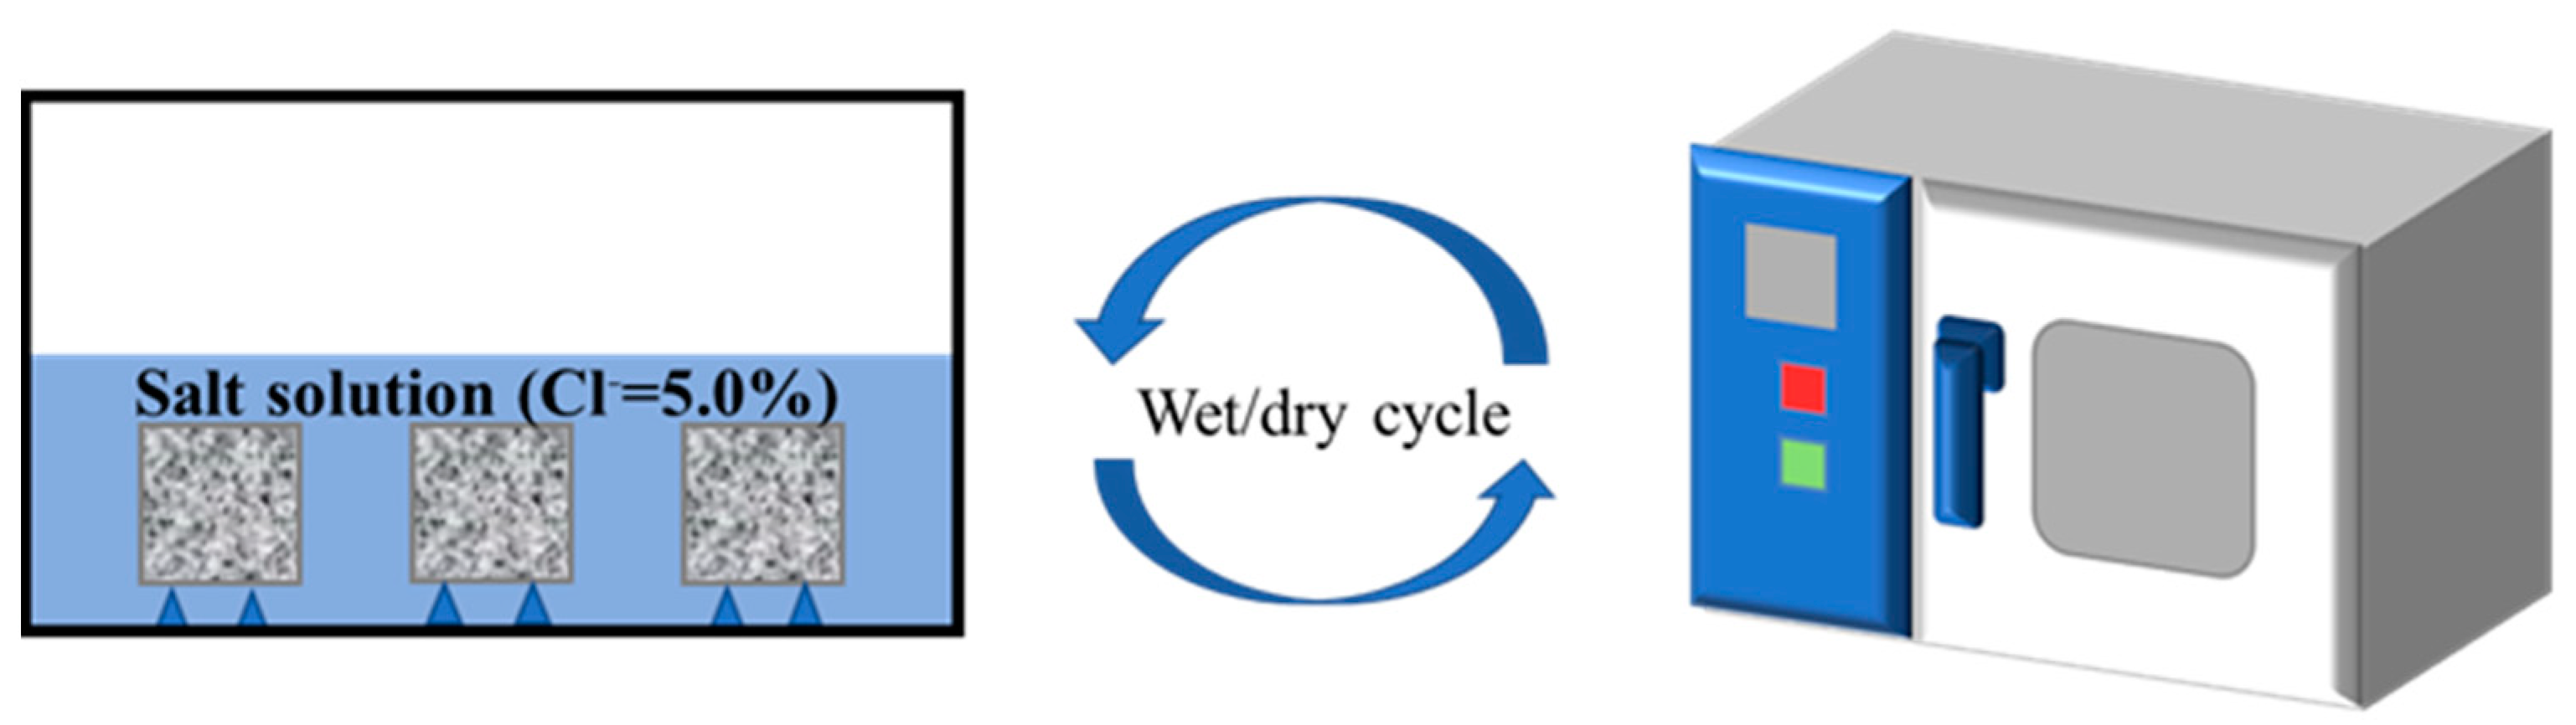
2.3.2. Wet–Dry Cycle Accelerated Salt Corrosion Test

The wet–dry cycle test was conducted using the method of soaking the specimens in a salt-shell solution. After the coating and curing process, the soaking solution for each type of concrete specimen was prepared using a salt shell. The chemical composition and content of the salt shell can be found in Table 8. The salt shell was collected from the surface of saline soil in the Golmud area of Qinghai Province. A long-term soaking control group was also set up, and the replacement cycle of the salt-shell solution was consistent with the wet–dry cycle period.
The processed test blocks were immersed in a 5% salt solution for 24 h, followed by placing them in a drying oven set at 60℃ for 6 h, and then allowing them to cool naturally for 18 h. A 2-day period was considered as one wet–dry cycle, and the 12th, 24th, 36th, 48th, 60th, 90th, 180th, and 270th days were chosen as the testing periods. At the end of each testing period, the coated concrete test blocks were tested for chloride content and surface morphology, and the salt-shell solution was replaced. The schematic diagram of the wet–dry cycle apparatus is shown in Figure 2.

2.4. Determination of Chloride Ion Content

The determination of chloride ion content at different depths in the concrete specimens was conducted using a drilling and sampling method. After sampling, the powdered samples were tested for chloride ion content using an ion chromatograph. Prior to sampling, the surface of the coated concrete test blocks was wiped clean and then kept at 60 °C for 24 h before being cooled to room temperature. The coating on the surface of the test blocks was scraped off using a scraper, and 9 evenly distributed holes were drilled vertically into the surface of the test block. The powder obtained from drilling at different depths was collected for testing. (See Figure 3).
The aged test blocks were split using a splitting machine, and then the cross-section was sprayed with a 0.1 mol/L AgNO3 solution. When the chloride ion concentration at a certain point on the cross-section exceeded the critical value, the chloride ions present in the cross-section would react with AgNO3 to form white AgCl. If the chloride ion concentration was below this critical value, the OH ions inside the concrete would react with Ag+ ions to form AgOH precipitates, which would then be oxidized to brown Ag2O in the air. These two different colors would create a distinct color change boundary on the cross-section of the concrete. Photographs of the cross-section were taken and recorded.

2.5. Surface Characterization

The macro-morphology of the coating was photographed to analyze the appearance changes of the coating after aging, such as the amount and size of damage. Prior to the test, the coating surface was cleaned by wiping with anhydrous ethanol. For microscopic morphology analysis, a Gemini Supra 40 field emission scanning electron microscope (SEM) was used.
The coating glossiness was measured by MN60 gloss meter from Tianjin Optical Instrument Factory. The testing process was based on CN GB/T 9754. The gloss loss rate was the ratio of the glossiness changed value and the initial glossiness. It was divided into five grades: “No loss” (grade 1, ≤3%), “Very slight loss” (grade 1, 4~15%), “Slight loss” (level 2, 16~30), “Obvious loss” (level 3, 31~50), “Severe loss” (grade 4, 51~80), and “Complete loss” (grade 5, >80).
The color difference of the coating was measured using a 3 nh NR110 multi-function colorimeter. The testing process was based on CN GB 11186.3. The total color difference (ΔE) was calculated before and after the change in the test color coordinates (L, a , b). The formula of the total color difference is shown in Equation (1):
E a b * = [ L * 2 + a * 2 + b * 2 ] 1 2
The adhesion of the coating was evaluated using the pull-off method specified with a DeFelsko PosiTAst AT-A adhesion tester. The testing process was based on CN GB 11186.3. The diameter of the pull dolly used was 20 mm, bonded to the coating surface by AB glue before pulling, The drawing condition of the coating is shown in Figure 4:

2.6. Weighted Analysis Method of Coating Life

In the concrete anti-corrosion coating system, the failure of the coating occurred gradually from the outside to the inside. First, the failure of the top coat led to the reduction in the coating gloss; then, the loss of the middle paint packing led to the change in color difference; and finally, the failure of the primer led to the reduction in the adhesion of the coating and the substrate. Therefore, the weighted analysis method of coating life will establish the mathematical model of the three performance indexes of gloss, color difference and adhesion, respectively, analyze the weight coefficient of the three indicators in the process of coating failure, and finally, obtain a prediction model of the actual service life of the coating.

3. Results and Discussions

3.1. The Morphology of the Concrete Coating

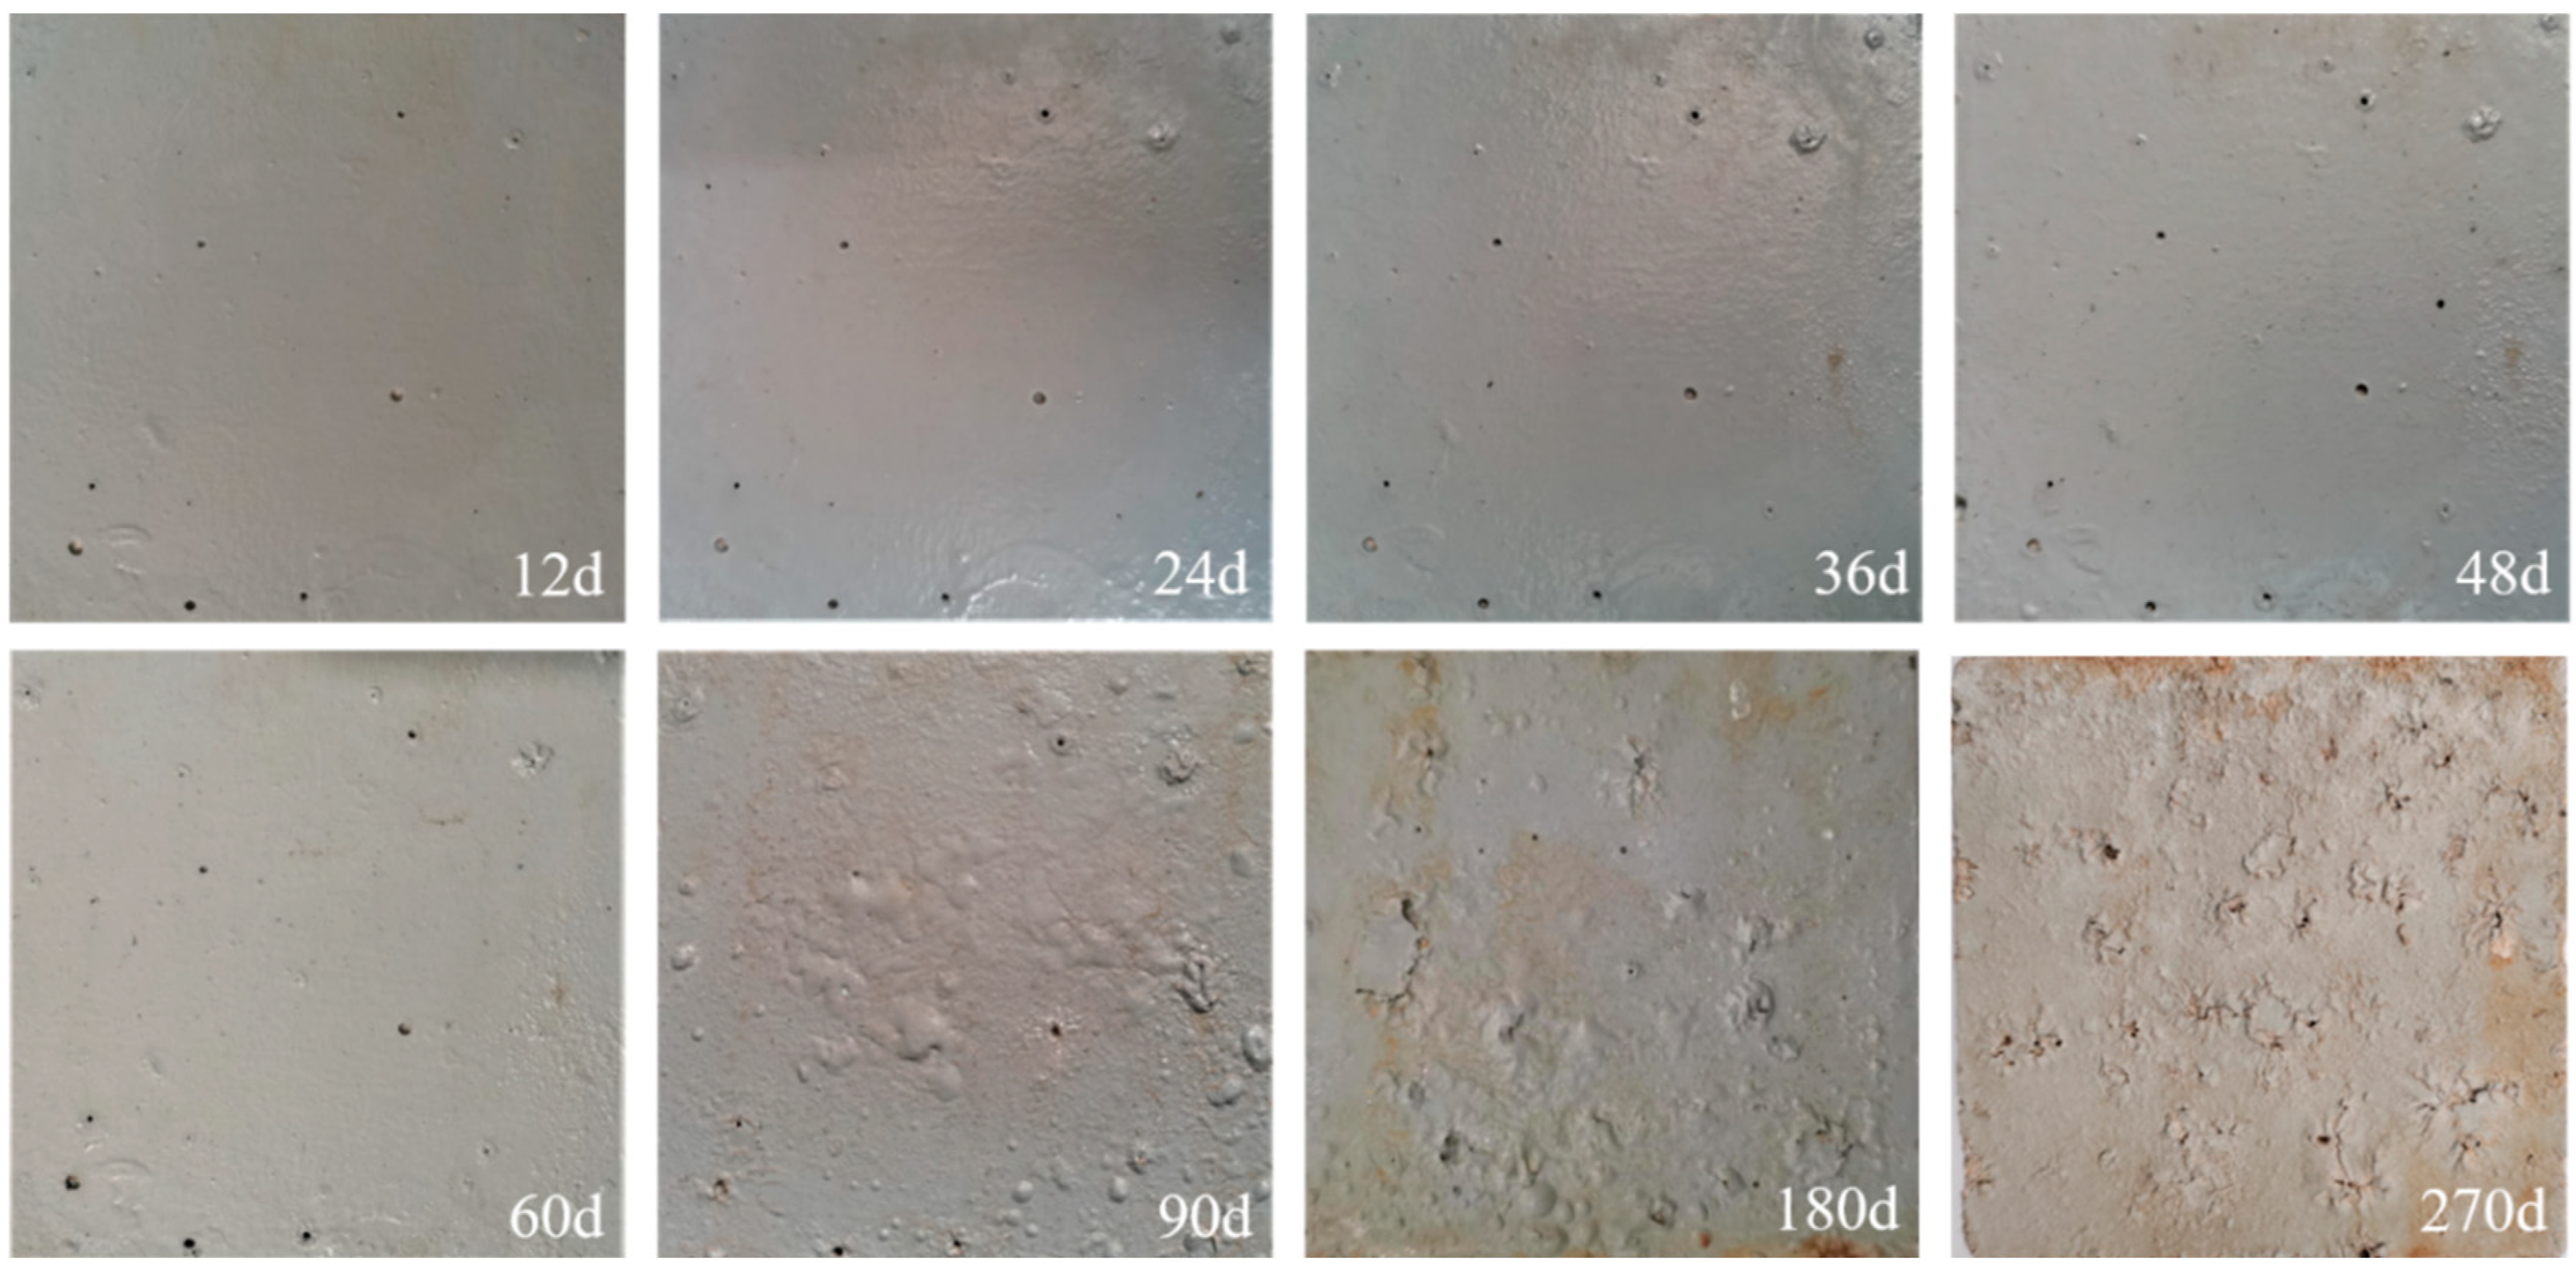
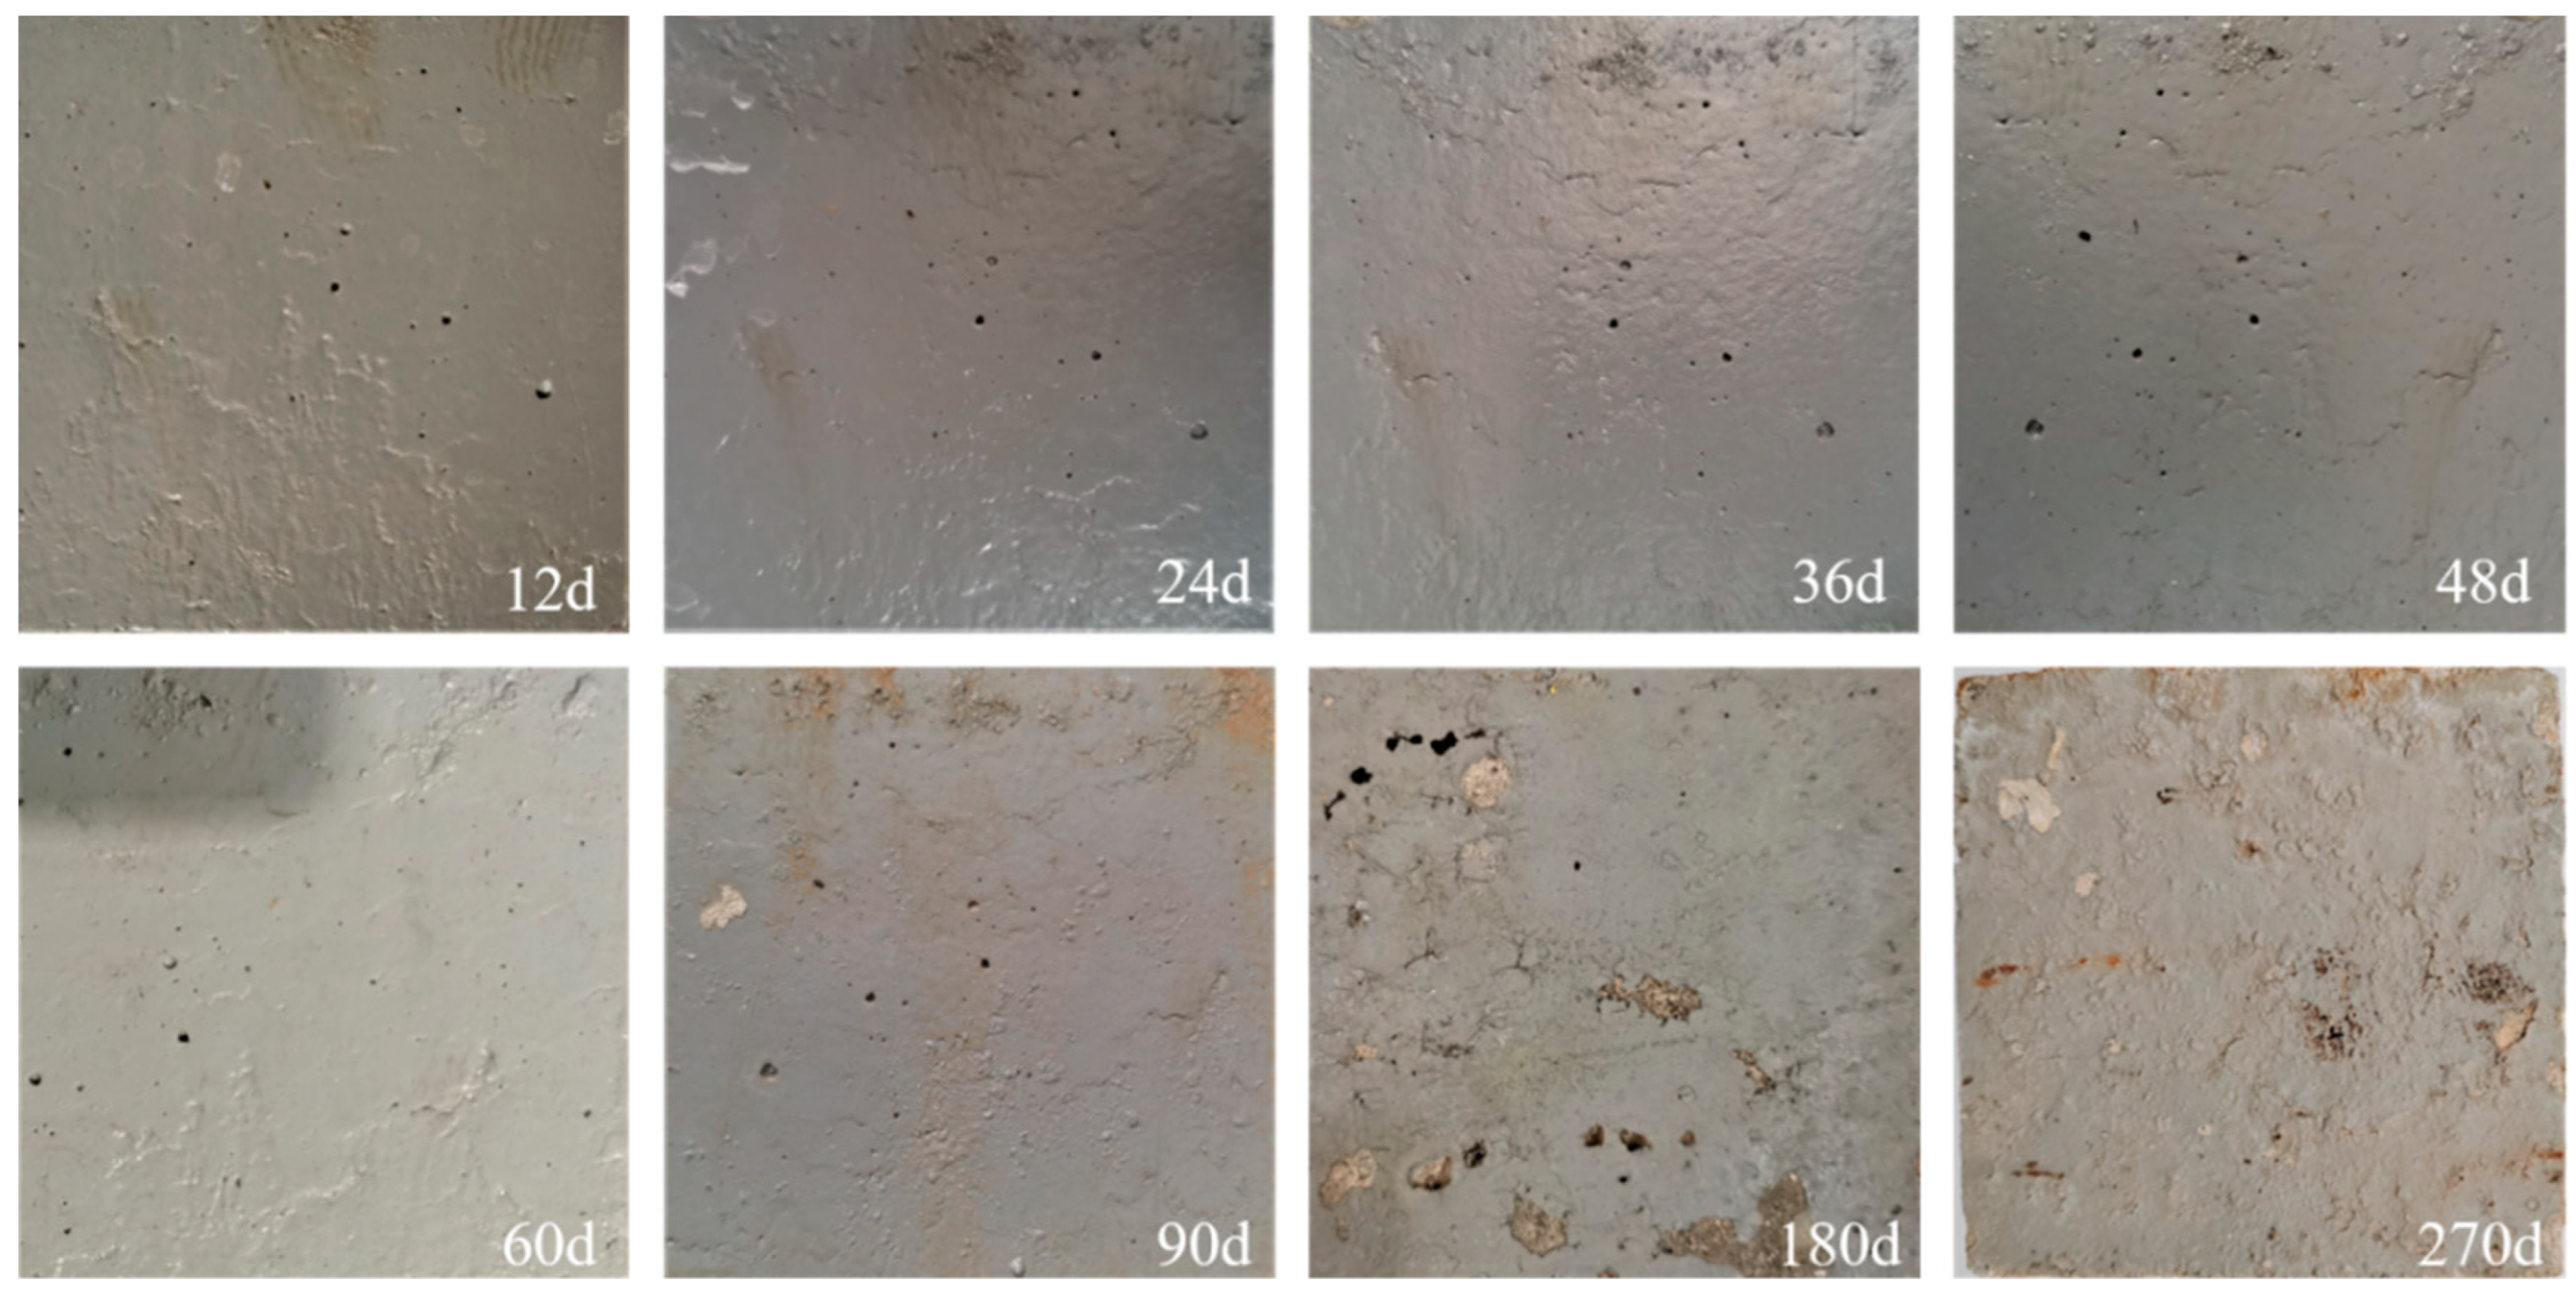
3.1.1. Macroscopic Topography of the Coating for Long-Term Salt Corrosion

Figure 5, Figure 6 and Figure 7 show the macroscopic morphology of FS coating, ES coating, and AS coating after 270 days of continuous corrosion under wet–dry cycling test conditions.
From Figure 5, Figure 6 and Figure 7, it can be observed that the initial surfaces of the three different types of coatings are gray and have a certain degree of gloss. They were applied to fill the surface voids of the concrete. The surfaces of the three coatings are smooth, flat, and dense, with a complete film formation without fine pores, providing protection to the concrete substrate and isolating corrosive ions. As the test duration elapses, the FS coating surface first shows signs of aging such as discoloration, loss of gloss, and blistering. At 24 days, small bubbles appear on non-porous areas of the coating surface. At 48 days, these small bubbles increase in area. At 180 days, extensive delamination occurs on the coating surface. The macroscopic corrosion morphology changes in the ES coating and AS coating are similar. At 90 days, both coatings show dense microbubbles that gradually expand. These bubbles continue to develop and rupture on the coating surface at 180 days and 270 days, with slight soiling around the rupture points.
Compared to the other two water-based coatings, the FS coating is more susceptible to damage and irregular blistering. On the one hand, during the wet–dry alternating process, the FS coating is easily affected by repeated water absorption and swelling, as well as water loss and contraction, resulting in the continuous enlargement of micro-pores in the coating. This accelerates the penetration of corrosive solution into the coating, leading to blistering and rupture. On the other hand, higher temperatures are more likely to cause damage to the molecular structure of fluorocarbon resin, accelerating coating aging and gradually corroding the entire coating. This results in blistering, reduces adhesion between the coating and substrate, and eventually leads to coating failure.

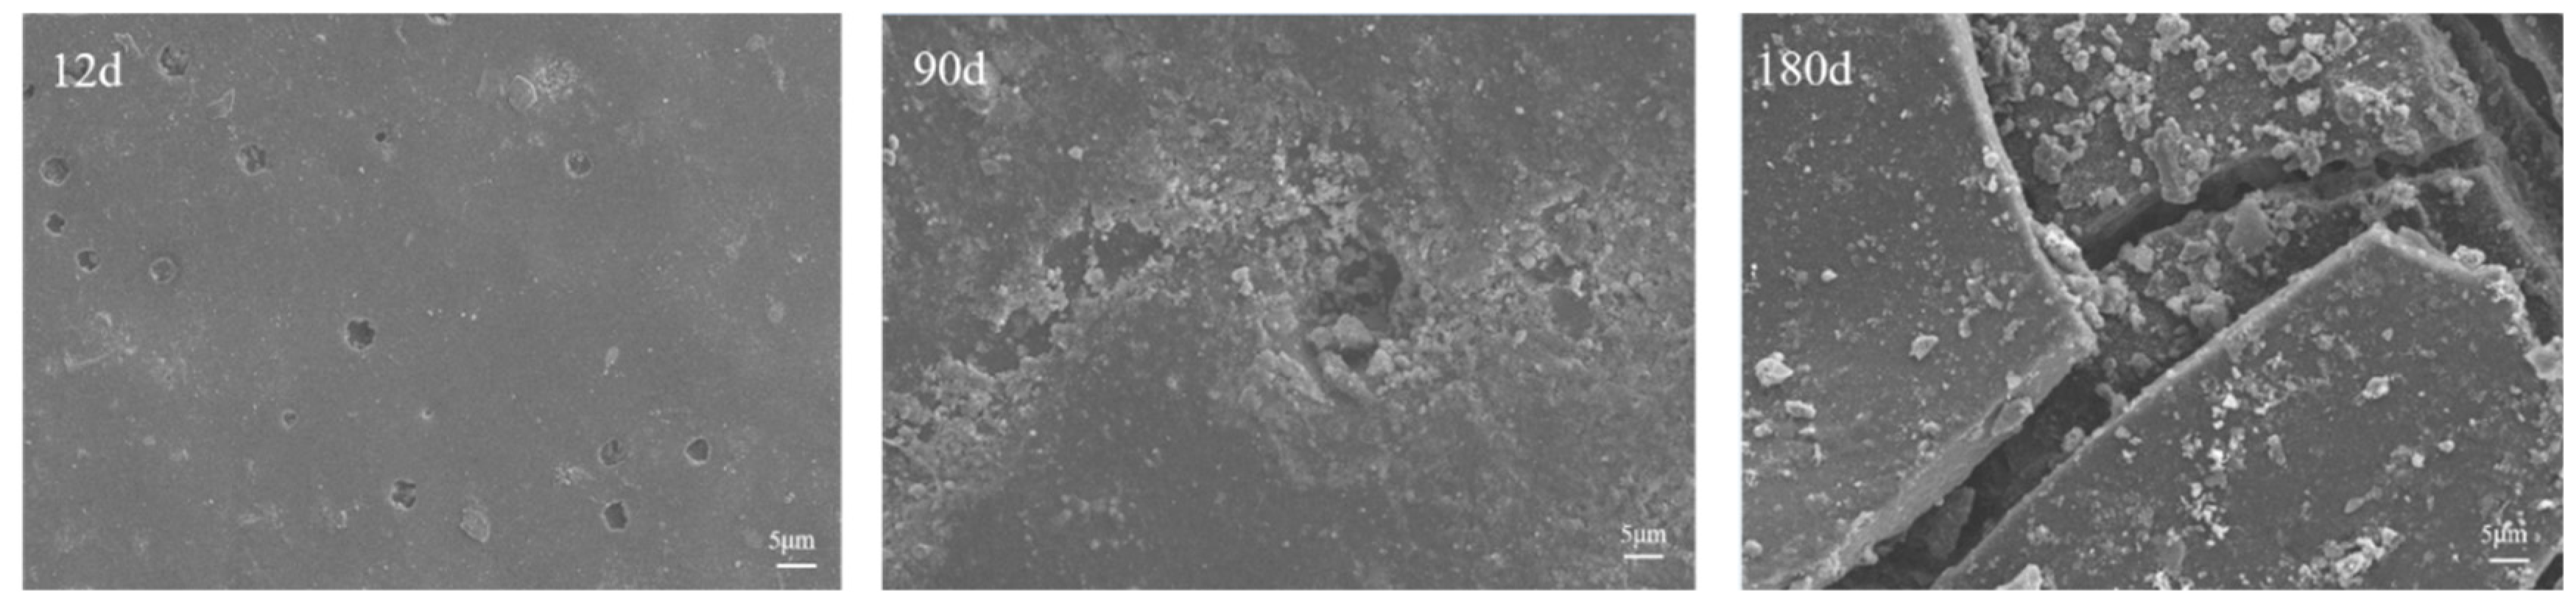
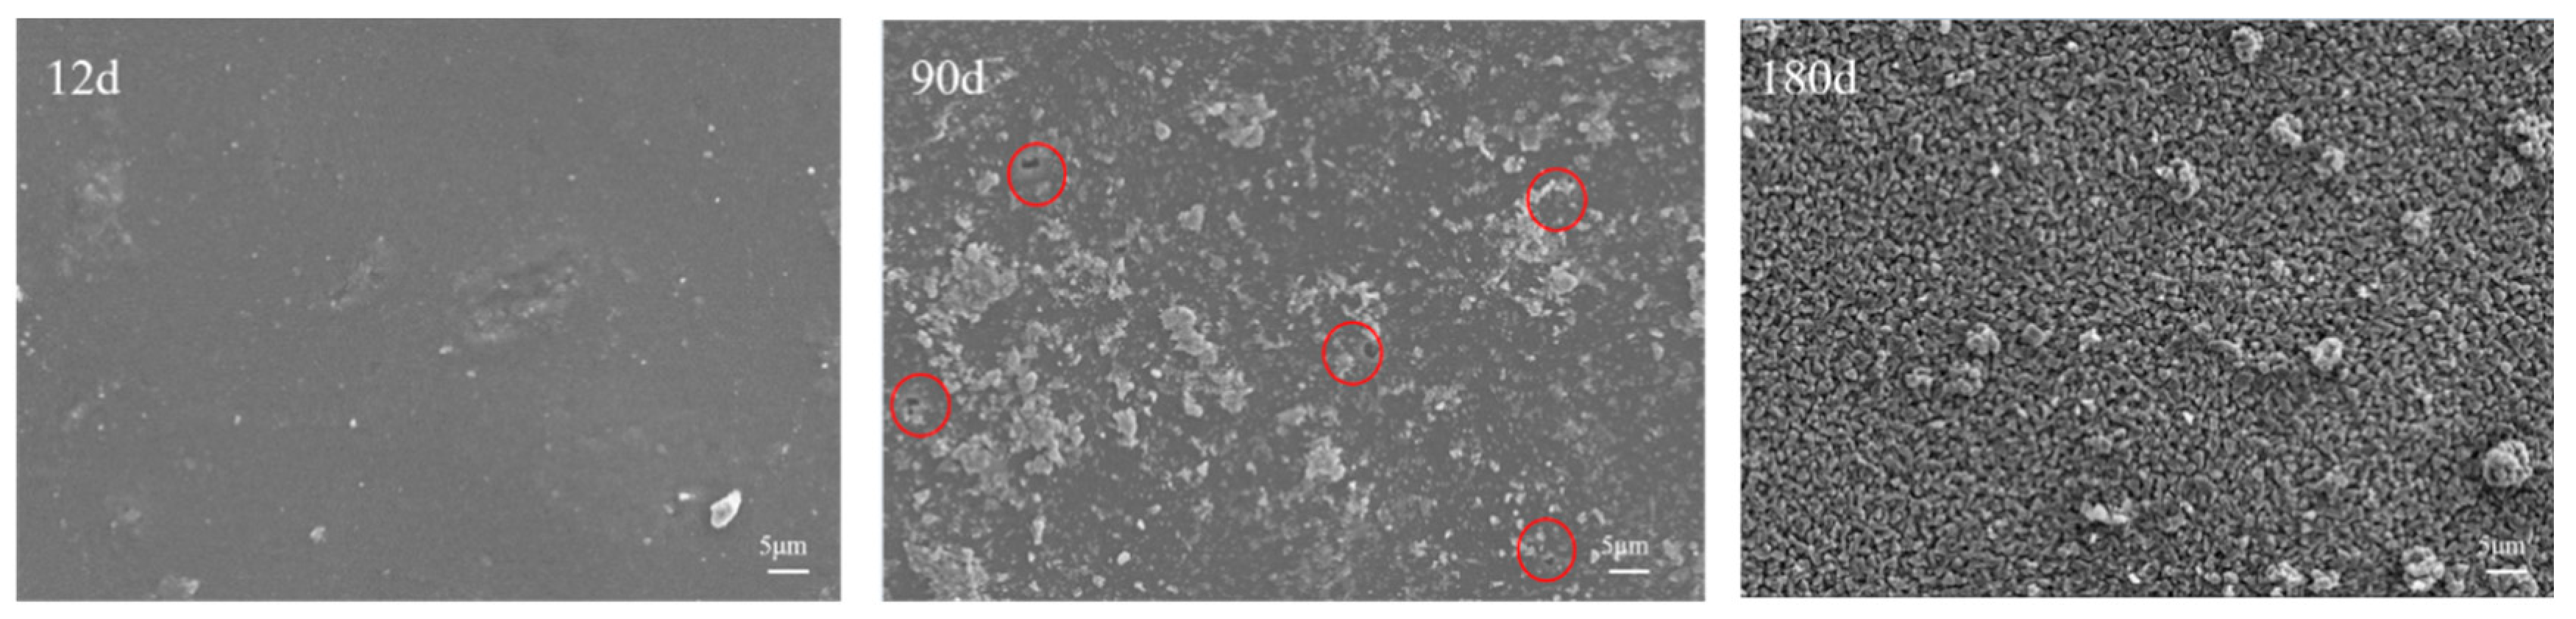
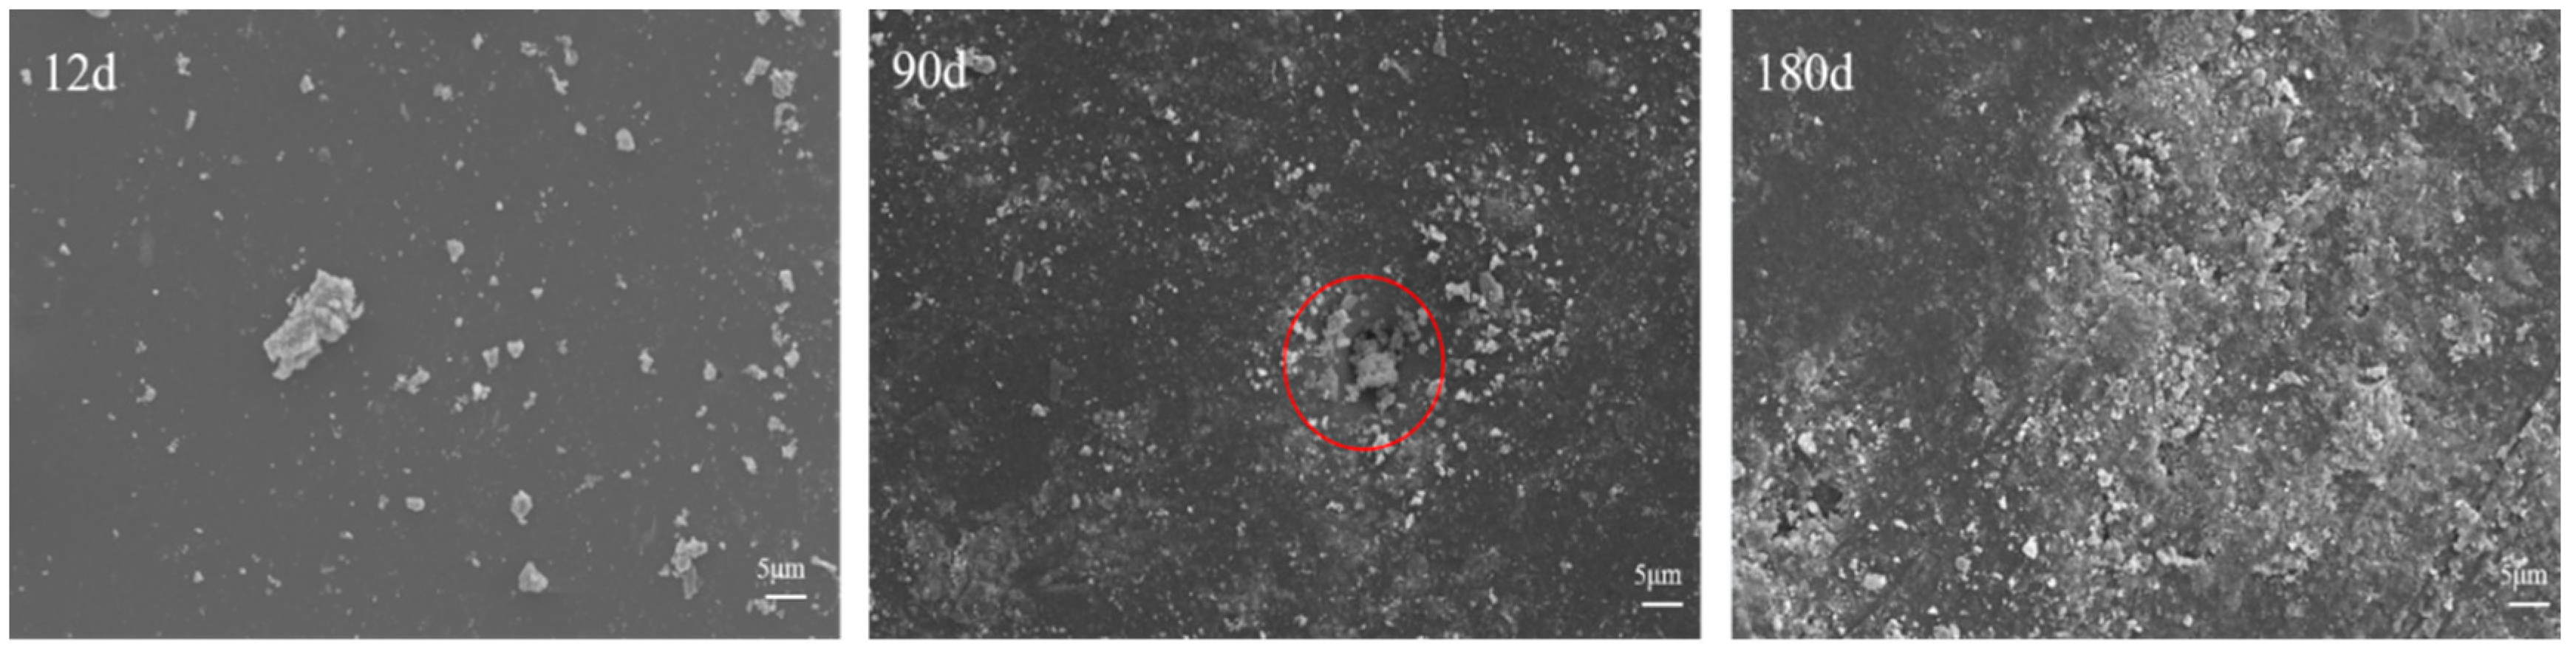
3.1.2. Microscopic Morphology of Long-Term Salt Corrosion Coatings

Figure 8, Figure 9 and Figure 10 are photographs of SEM, showing the micro-morphology of the FS coating, ES coating, and AS coating after different test periods under the action of wet–dry cycles.
The surface roughness and damage of the FS coating become more pronounced with increasing time. At 12 days, the coating surface shows a small number of micro-pores with a diameter of 3–5 μm. At 90 days, the pore diameter of the coating widens, and the filler component inside the pores is lost, forming “pits”. At 180 days, the coating experiences extensive cracking and delamination, with cracks extending to the substrate surface. At this point, there is already widespread powdering and detachment of the coating at the macroscopic level.
The surface smoothness of the water-based epoxy coating and water-based acrylic coating at 12 days does not show significant changes. At 90 days, the coating surface exhibits a small number of micro-pores with a diameter of 1–2 μm, and salt particles can be observed adhering to the coating surface. At 180 days, the number of pores on the coating surface increases, and the eroded and fallen filler particles fill the surface of the coating. At this point, the coating starts to lose its gloss and color at the macroscopic level.

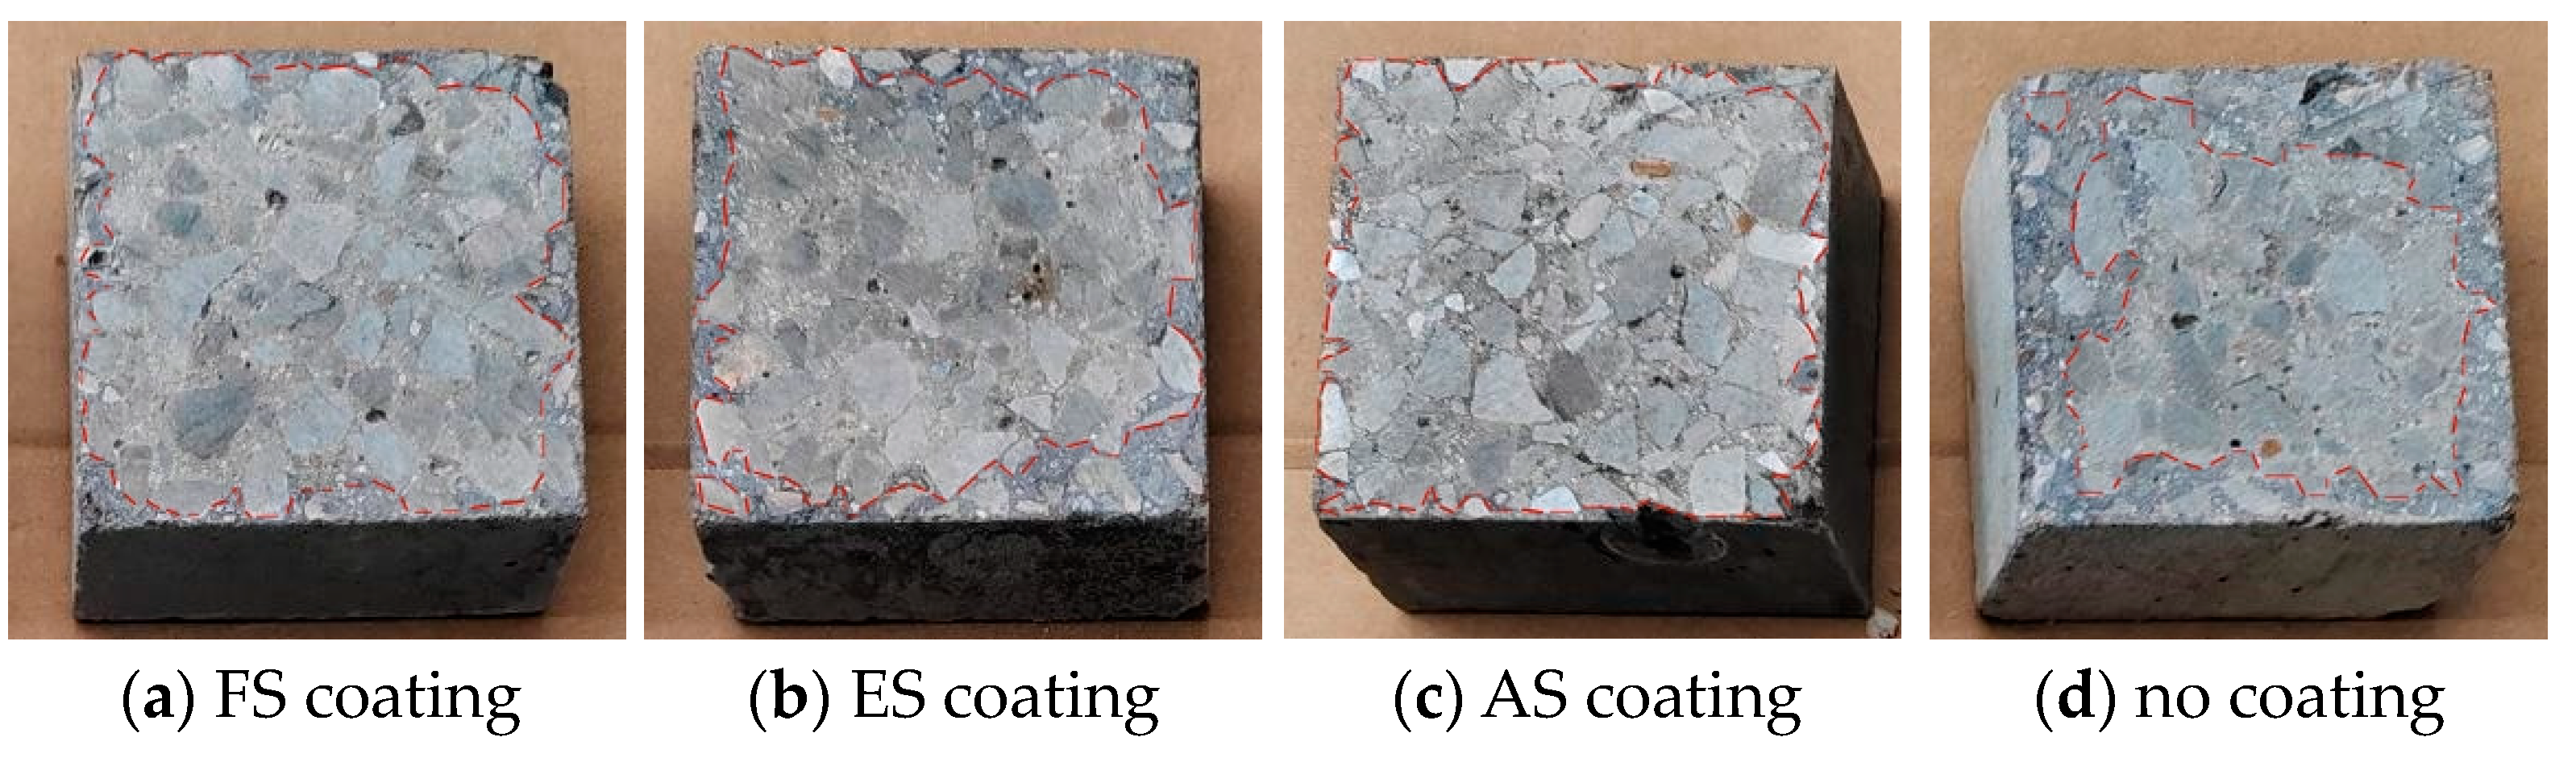
3.1.3. Macroscopic Discoloration Boundary of Coated Concrete under Salt Corrosion

The concrete specimens subjected to wet–dry cycle salt corrosion for 36 d, 90 d, 180 d, and 270 d were sprayed with silver nitrate solution on their split surfaces. The macroscopic morphology of the color change after the reaction is shown in Figure 11, Figure 12, Figure 13 and Figure 14.
From the figures, it can be observed that with the increase in corrosion time, the color boundaries of the split surfaces of the concrete coated with the three coatings are not clearly visible. The color boundaries of the split surfaces of the three coatings do not show significant differences as the corrosion time increases. This indicates that the coating protection has a good inhibitory effect on corrosion in salt-laden buried environments, and the coating serves as a barrier against chloride ion penetration.
Compared to the concrete specimens with coating, the color boundaries of the split surfaces of the uncoated concrete gradually move towards the core of the concrete with the increase in corrosion time. This indicates that the process of chloride ion penetration exists under salt corrosion. The effectiveness of the uncoated concrete in resisting chloride ion penetration is limited without the protection of a coating.

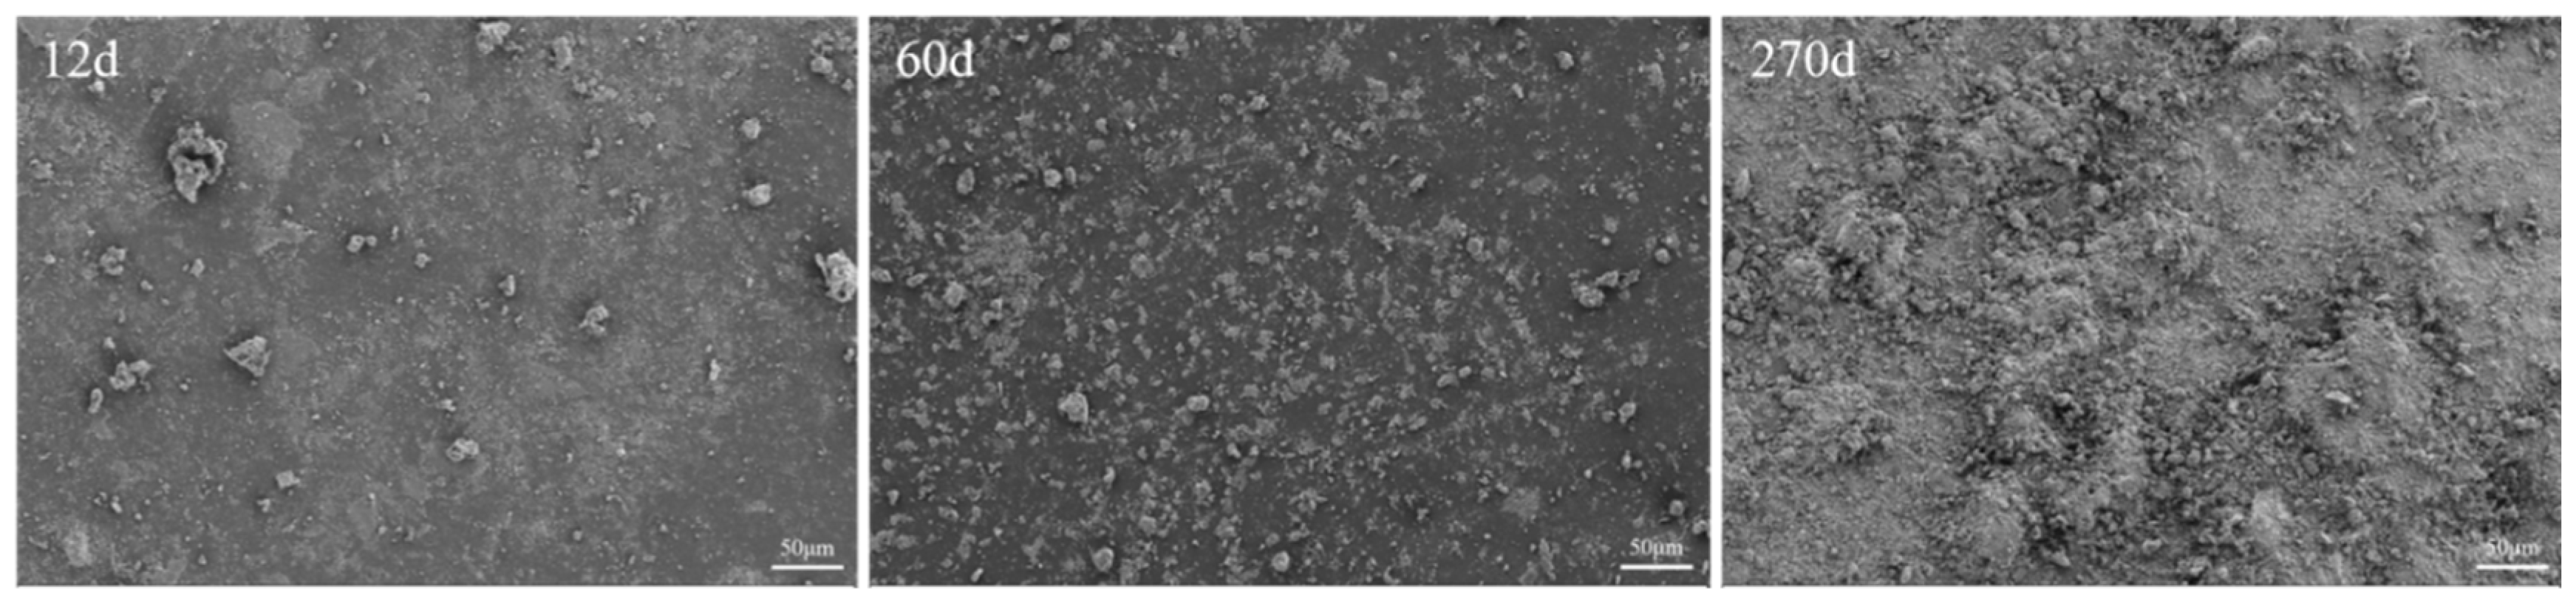
3.1.4. Micromorphology of Coated Concrete Buried by Saline Soil

Microscopic morphology analysis was performed on the coating surfaces of concrete specimens coated with water-based fluorocarbon coating (FS), water-based epoxy coating (ES), and water-based acrylic coating (AS) after salt corrosion. The microscopic morphology of the coatings at different corrosion times is shown in Figure 15, Figure 16 and Figure 17.
From Figure 15, it can be observed that during the salt corrosion process under salt-laden burial conditions, the surface of the FS coating at 12 d is overall smooth and intact, but there are numerous distributed pore defects with diameters ranging from 10 to 20 μm, with a minimal amount of salt particles attached. At 60 d, the surface of the FS coating is relatively smooth, and the existing pores do not show obvious expansion. There are a large number of salt particles and salt-like substances attached to and covering the coating surface. At 270 d, the surface of the FS coating is completely covered by salt particles and salt-like substances, and the existing coating pores are also shielded by salt particles and salt-like substances.
From Figure 16 and Figure 17, it can be observed that the surfaces of the ES and AS coatings remain intact after long-term salt corrosion. However, as the corrosion time increases, the number of salt particles and salt-like substances attached to the coating surface gradually increases until they are completely covered. Therefore, it can be concluded that during the early, middle, and late stages of salt corrosion, all three types of coatings showed the adhesion of tiny salt particles, and the size and area of the attached salt particles increased. The coatings were covered by multiple layers of salt-like substances, resulting in an uneven surface. This is related to the characteristics of salt-laden burial corrosion.
Due to the presence of pores, the FS coating has a lower resistance to chloride salt corrosion compared to the other two coatings. This may be due to the high surface energy of water-based fluorocarbon resin, the low density of fluorocarbon resin film formation, and the formation of voids during the coating process caused by resin Brownian motion, resulting in micro-pores with a diameter of around 20 μm. In a salt corrosion environment, corrosive ions can penetrate the substrate surface through these micro-pores, accelerating the failure of the coating. The ES coating has a high curing film density, while the AS coating contains surfactants with hydrophilic polar groups, which ensures the uniform distribution of water-based acrylic resin particles in water and improves the density of the coating [21,22,23].

3.2. Performance Change of Coating under Salt Corrosion

During the process of coating pore enlargement and filler loss, the polymer molecular chains of the coating resin undergo decomposition. As a result, the coating surface gradually becomes rough and loses its pigment gloss, and color variation may occur. In the process of gradual layering and fracture of the coating, the adhesion also changes [24,25,26]. Figure 18, Figure 19 and Figure 20 show the trends in gloss, color difference, and adhesion of the three coatings, respectively.

3.2.1. Glossiness of the Coating under Long-Term Salt Corrosion

In the process of coating aging, the polymer molecular chain in the surface layer film is usually decomposed, and the coating surface gradually roughens and loses light. Using the light loss rate as the evaluation index can further analyze the aging resistance of the three coating systems. Due to the long time of aging and overpunching, the coating expands with the alternating temperature changes, accelerating the cracking of the coating, a large number of water molecules and corrosion ions, the coating began to pulverize and fail, and this eventually affects the gradual decline of the coating gloss.
As shown in Figure 18, the gloss loss rate of the three coatings gradually increased, and the trend of gloss loss also gradually eased. The ES coating has the lowest initial gloss loss rate, but its gloss loss trend is the most direct. The AS coating has the highest initial gloss loss rate, but its final gloss loss trend is similar to the other two coatings. After continuous wet–dry cycling for 50–60 days, the gloss loss rate of all three coatings exceeds 80%. The performance of coating gloss mainly relies on the surface layer of the coating. In the early stage of wet–dry cycling, water-based epoxy coatings have better anti-aging performance than the other two coatings. This may be due to secondary curing of epoxy resin at high temperatures, promoting film formation, and delaying aging failure [27]. In the middle stage of wet–dry cycling, water-based fluorocarbon coatings can better maintain their gloss for a longer period compared to the other two coatings. In the later stage of wet–dry cycling, long-term exposure to wet and hot conditions leads to temperature fluctuations, thermal expansion and contraction, accelerating coating cracking, and accelerating the infiltration of a large number of water molecules and corrosive ions. The coatings gradually start to powder and crack, eventually resulting in complete loss of gloss.
The trend of gloss change for coatings under long-term immersion is similar to that under wet–dry cycling conditions, but it takes around 200 days for all three coatings to completely lose their gloss.

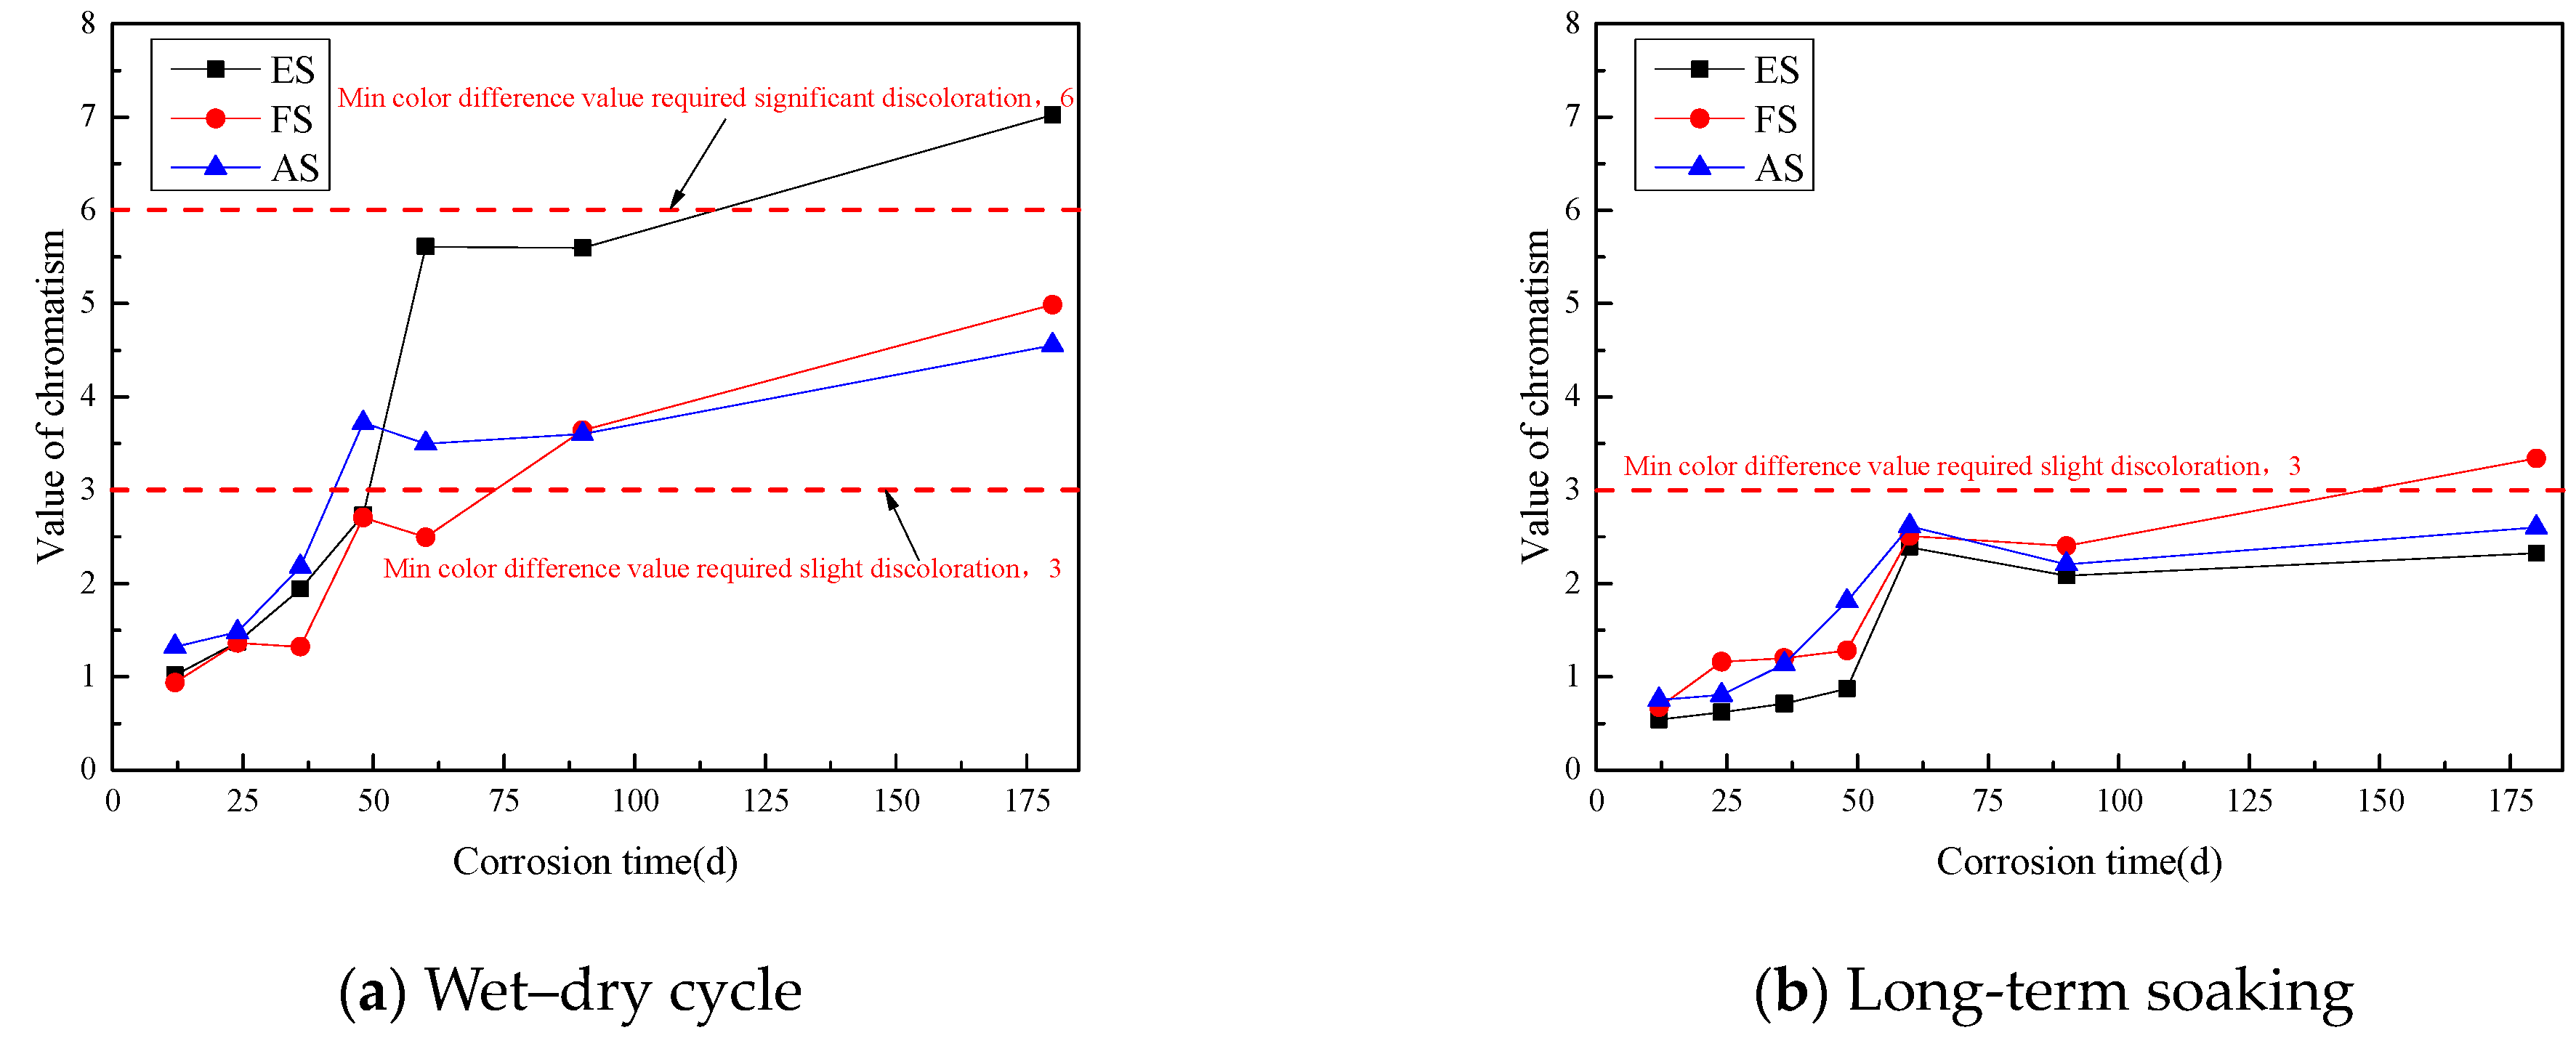
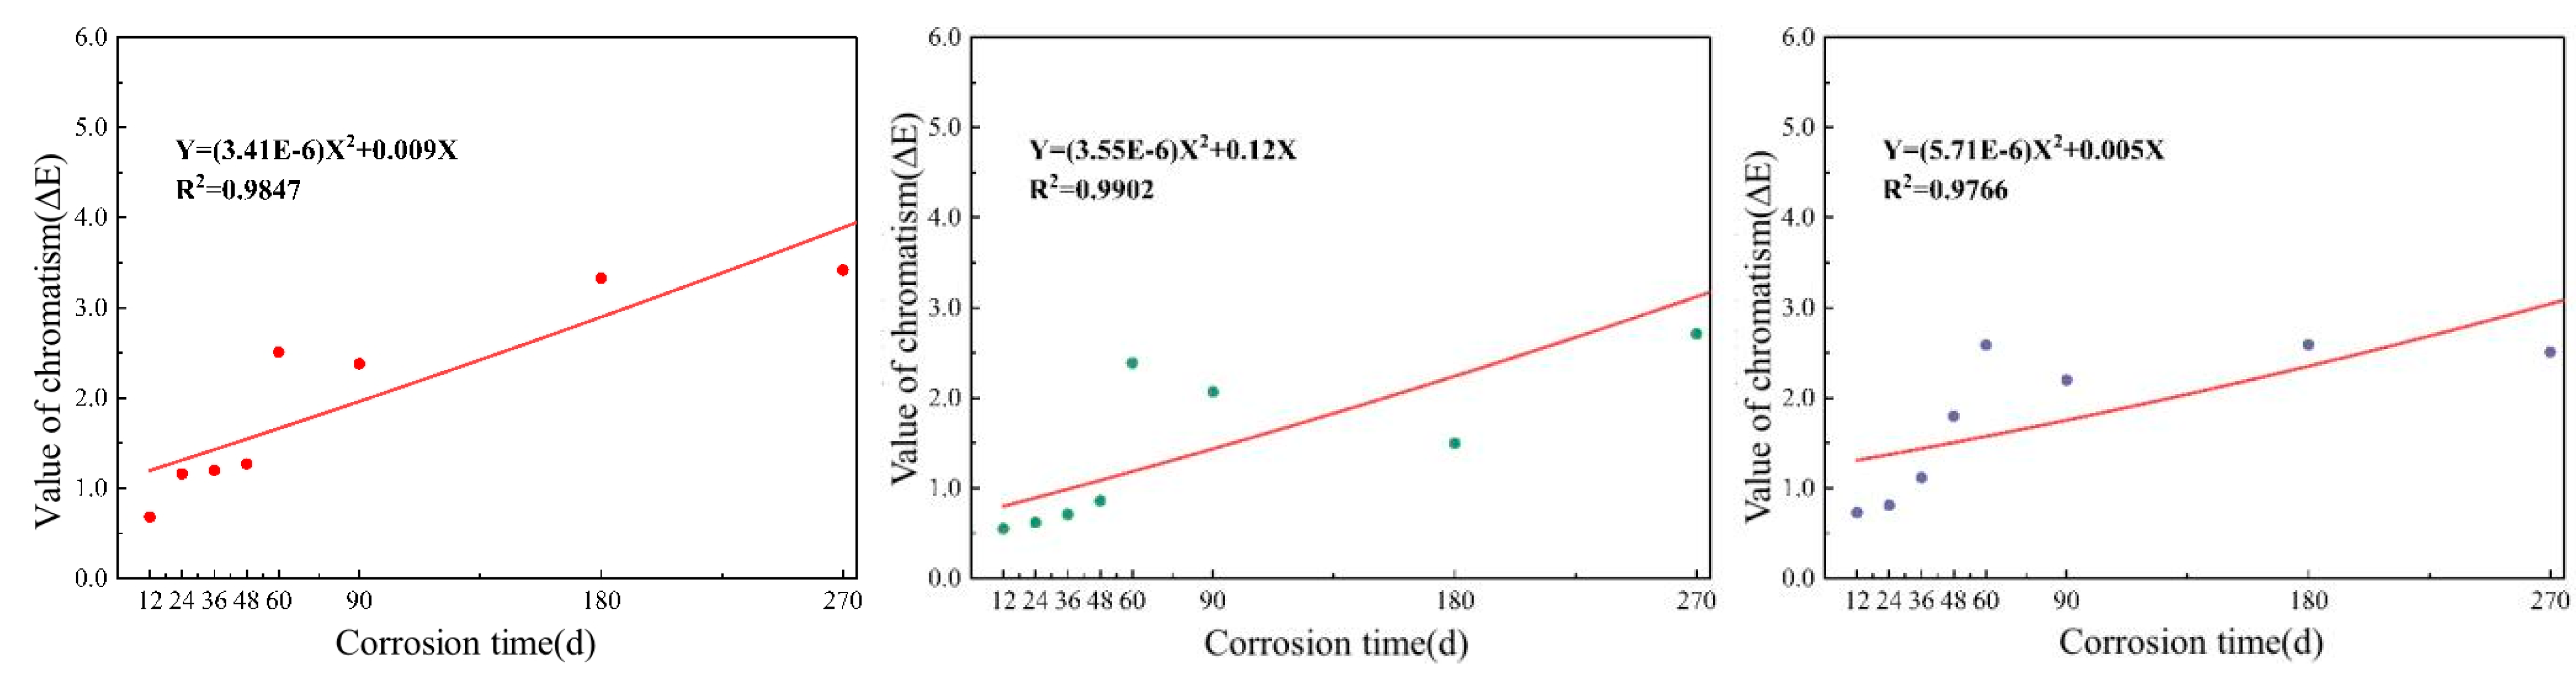
3.2.2. Color Difference Value of the Coating under Long-Term Salt Corrosion Conditions

As shown in Figure 19, the color difference values on the surfaces of the three coatings gradually increase under both test conditions. Compared to the other two coatings, the FS coating has the best color retention. The other two coatings already exhibited slight discoloration (ΔE ≤ 3) after 40–50 days of wet–dry cycling, while the FS coating took more than 70 days. After 180 days of wet–dry cycling, the ES coating first showed significant discoloration (ΔE ≥ 6). In the early stage of wet–dry cycling, the presence of the topcoat provides protection to the intermediate layer, resulting in slower color change for all three coatings. However, with prolonged wet and hot aging, corrosion of the topcoat gradually produces holes, allowing various media ions to infiltrate. The color fillers in the coating particles start to become unstable and gradually peel off, leading to detailed color changes in the coating.
During long-term immersion, the color difference on the surfaces of the three coatings gradually increases, but the change is not significant after 90 days of immersion. This indicates that in a saltwater solution environment, the interaction between the surface of the coating and the corrosive ions in the solution slows down the rate of pore and crack formation on the coating surface. However, it still leads to a saturation point where the loss of color fillers in the intermediate coat becomes minimal, resulting in insignificant color difference changes in the coating.

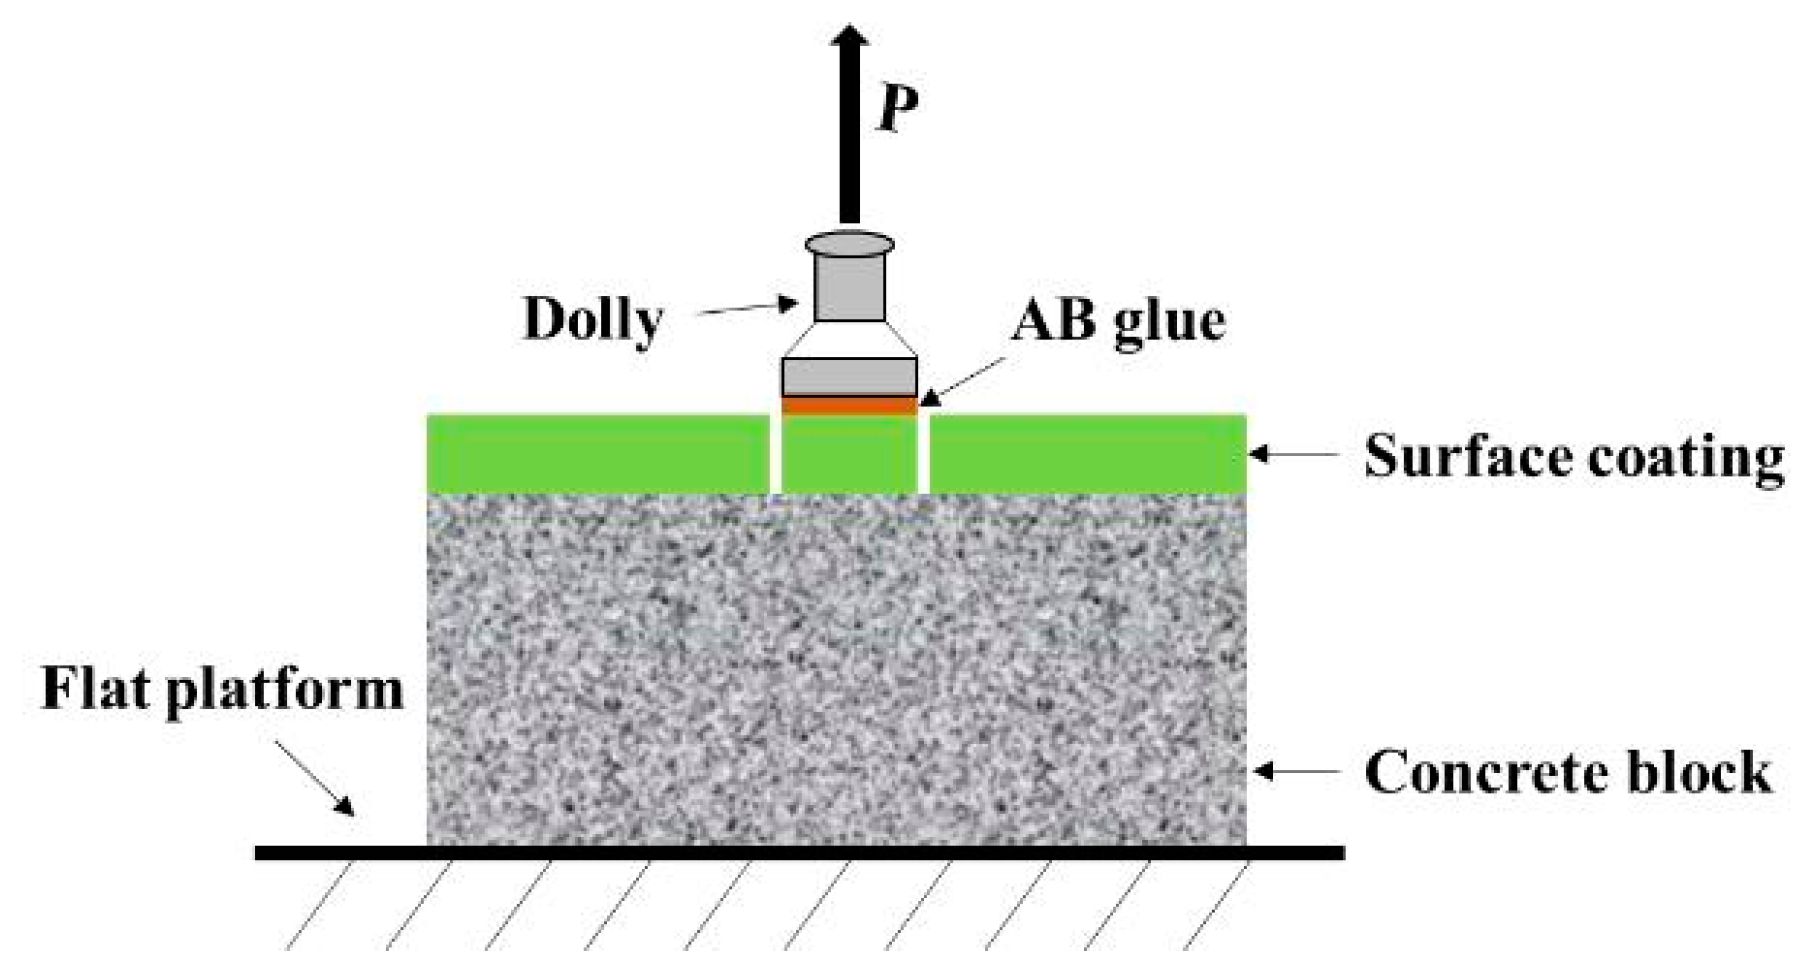
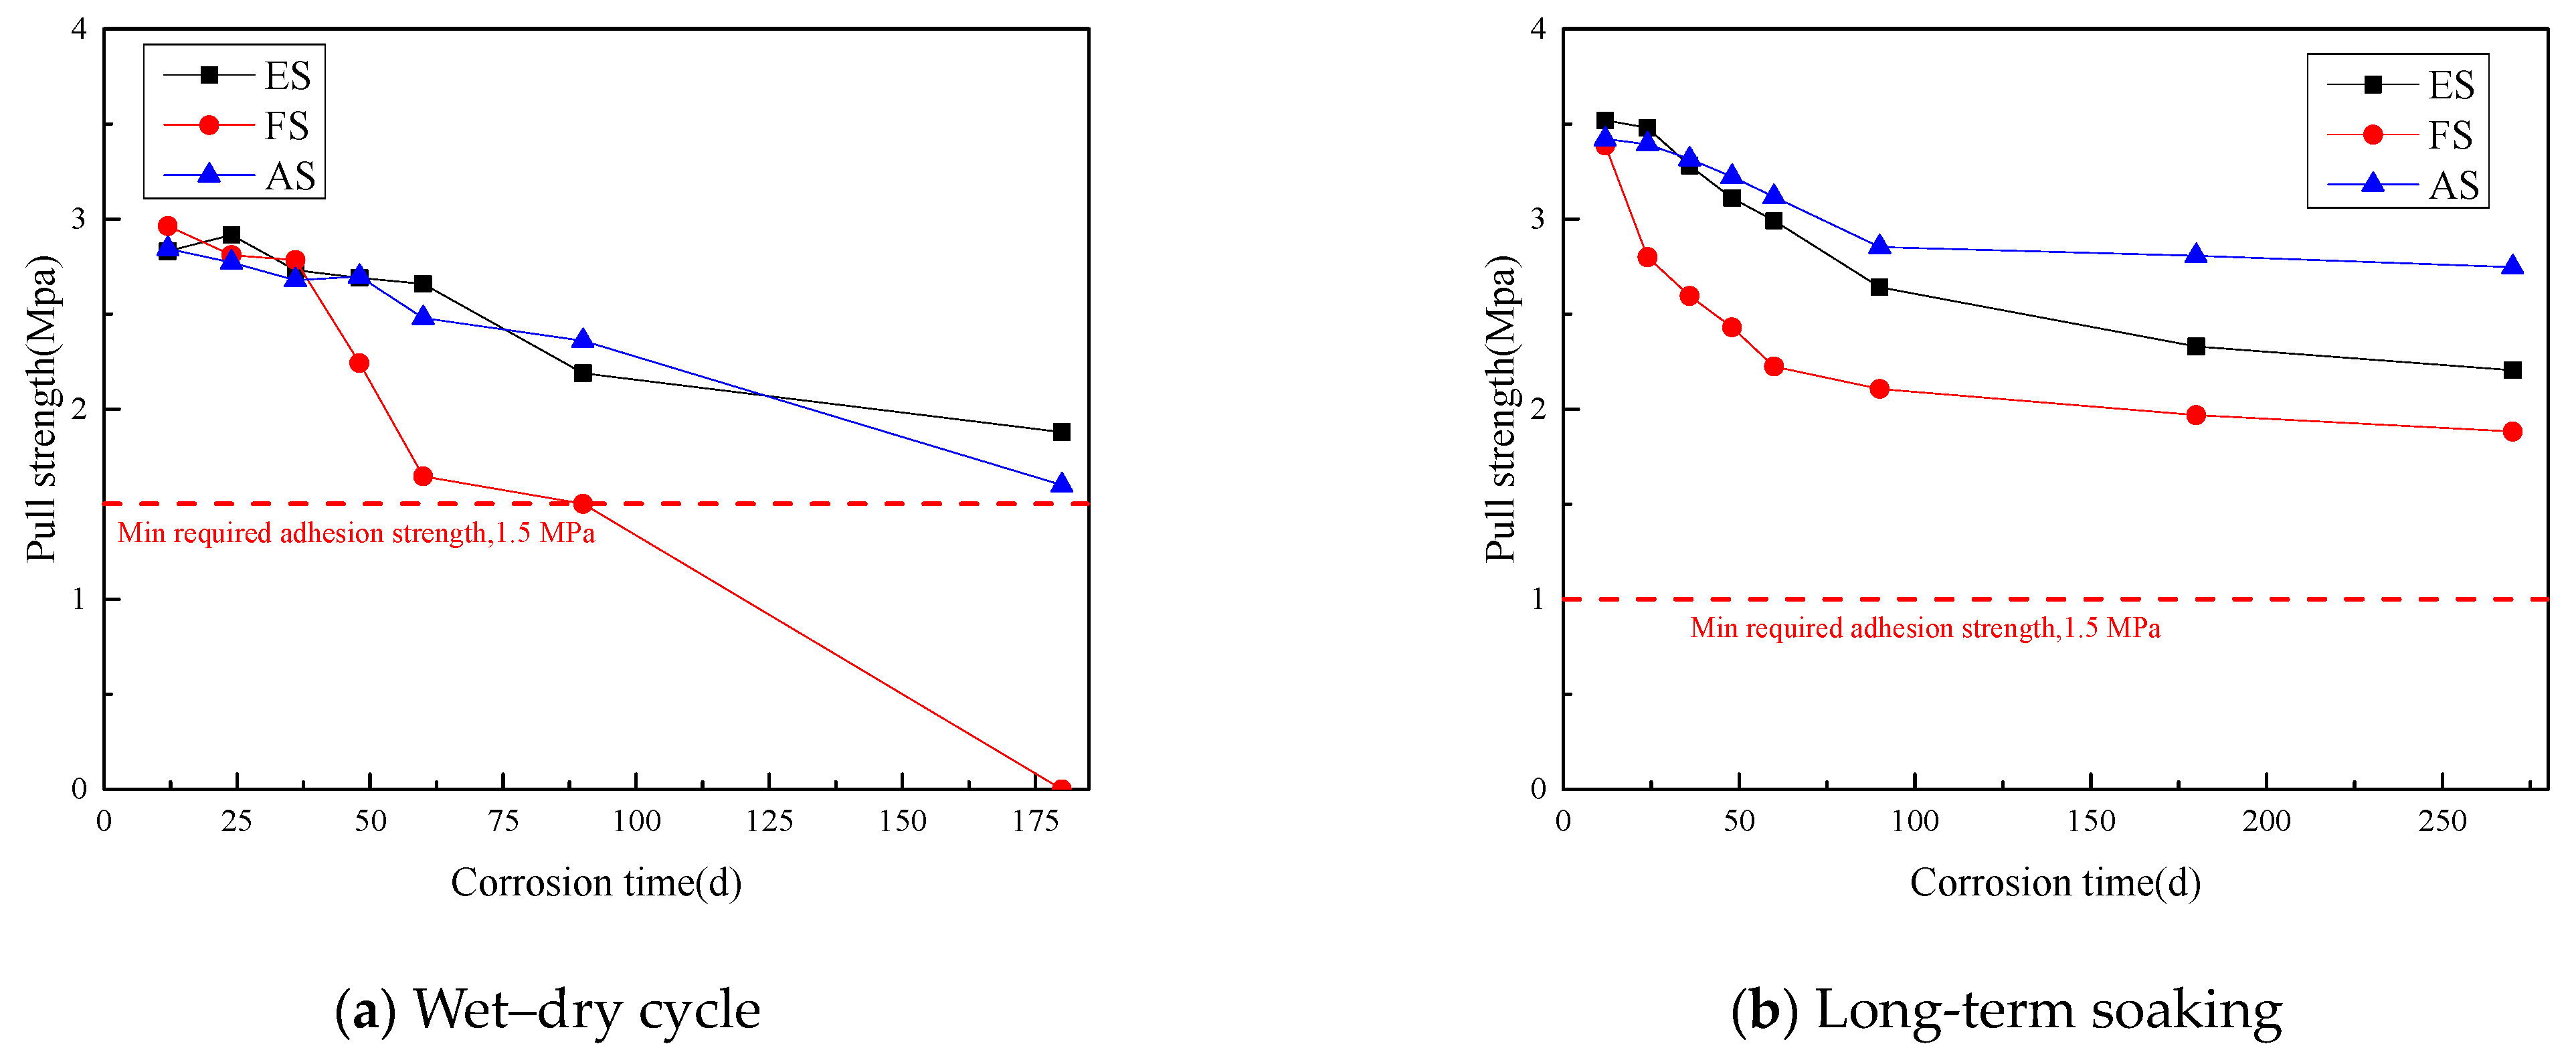
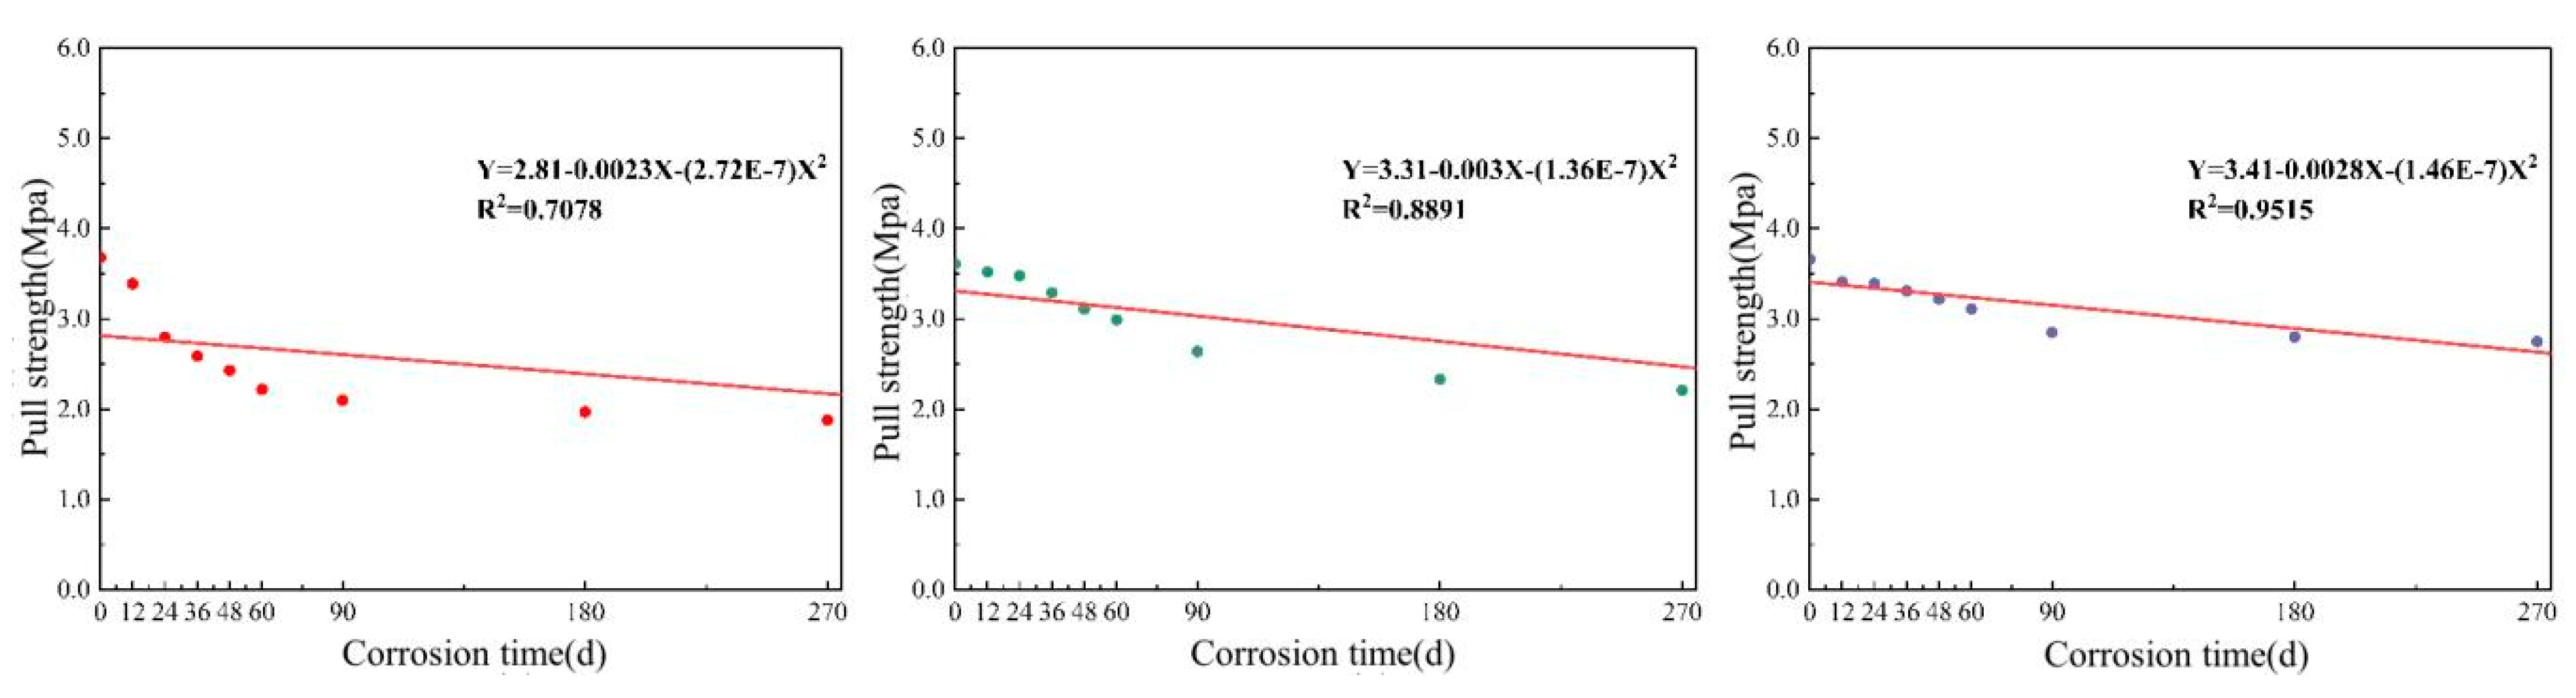
3.2.3. Adhesion of the Coating under Long-Term Salt Corrosion

According to Figure 20, the adhesion of the three coatings gradually decreases with an increase in the number of wet–dry cycles. After 12 d wet–dry cycle, the adhesion of ES, AS and FS coating was 2.84 MPa, 2.85 MPa, 2.96 MPa, respectively, and the adhesion decrease was 19.7%, 22.8% and 19.1%, respectively. After 180 d wet–dry cycle, the adhesion of ES, AS and FS coatings was 1.51 MPa, 1.42 MPa and 0 MPa, respectively.
Compared to the other two coating systems, the ES coating exhibits the slowest rate of adhesion decrease. This is mainly due to the initial wet–dry cycles promoting secondary curing of the epoxy resin, resulting in a tighter film formation and improved adhesion. In the medium to long term, the adhesion of the epoxy coating gradually decreases due to swelling and blistering. On the other hand, the FS coating shows the fastest rate of adhesion decrease, with a coating adhesion of less than 1.5 MPa after 90 days of wet–dry cycles. This is because the water-based fluorocarbon coating has weaker resistance to wet-heat aging. During the initial wet–dry cycles, the internal voids of the coating increase, and localized microcracks appear. Under the influence of salt solution permeation pressure, corrosive ions and water molecules penetrate through the coating, reducing the adhesion between the coating and the substrate.
Although the adhesion of all three coatings after 270 days of long-term immersion is above 1.5 MPa, the FS coating still exhibits the fastest rate of adhesion decrease during immersion. This also indicates that the water-based fluorocarbon coating has rapid expansion of inherent voids. The presence of voids allows for faster penetration of water and corrosive media such as chlorides through the coating. In the medium to long term immersion state, the color fillers in the coating detach due to moisture migration, leading to further enlargement and deepening of coating voids, ultimately resulting in delamination and reduced adhesion strength between the primer coating and the concrete substrate.

3.3. Chloride Ion Resistance Characteristics of the Coating

The concrete specimens tested after 12 to 270 days of salt corrosion were examined for the distribution of chloride ion content at different depths for each coating, as shown in Figure 21.
According to Figure 21, when the sampling depth is 5 mm, the chloride ion content in the concrete specimens without coating protection is higher than 6000 mg/kg, while the chloride ion content in the concrete specimens protected by coating system is less than 3500 mg/kg, and the coating content of epoxy acrylic resin system is 2631 mg/kg. The average reduction in chloride ion content by coating protection was 52.3%, and the maximum protection reduction was 57.6%. When the sampling depth is 25 mm, the chloride ion content of the uncoated protected concrete specimen is 942 mg/kg, the average chloride ion content of the concrete specimen with coating protection is 136 mg/kg, and the reduction ratio of the chloride ion content is 85.5%.
It can be observed that as the test depth increases, the chloride ion content decreases. However, with the increase in test time, the chloride ion content in the concrete specimens increases. Additionally, at the same duration of salt corrosion, the chloride ion content in the concrete specimens decreases with increasing sampling depth. At the same depth of salt corrosion, the chloride ion content in the concrete specimens increases with the increase in corrosion time.
During the salt corrosion process, the chloride ion content in all specimens decreases significantly within a penetration depth of 0–15 mm, remains relatively unchanged within a penetration depth of 15–25 mm, and exhibits a more pronounced decrease in the uncoated concrete specimens. This indicates that all three coatings have a significant barrier effect on the penetration of chloride ions. At the same penetration depth, compared to the ES coating, the FS coating shows more severe variation in chloride ion content in the coated concrete specimens, while the AS coating shows a weaker change in chloride ion content in the concrete specimens after 180 to 270 days of salt corrosion, indicating better resistance to chloride ion penetration.
The different chloride ion content at different time periods and depths in the salt corrosion test is mainly related to the corrosive environment of the specimens. In a relatively low chloride ion content environment, the concentration of chloride ions that penetrate into the concrete decreases as well.

3.4. Computation for Mechanism Analysis

3.4.1. Analysis of Coating Service Life Based on Gloss Variation Pattern

Fitting the long-term immersion-induced changes in coating glossiness using a logistic regression curve [28], the general equation of the logistic curve is y = a + ( b a ) / ( 1 + ( x / x 0 ) ^ p ) . Here, a, b, and p are all constants, with a > 0 and p > 0. The fitted curve is shown in Figure 22.
In the previous section, the concrete coating in the 270 d-long soaking process still had protective performance, so using the logistic curve analysis coating theory service life and the actual life of the coating is different, as there is a need to correct the actual service life, and the correction coefficient is dependent on three kinds of coating according to the average of the regression curve. The determination of the complete loss of coating glossiness level is based on a glossiness reduction greater than 80%. The proportion of the linear regression curve of each coating can be considered as the correction parameter for the actual life of the coating. The correction parameters for FS, ES, and AS are calculated as (0.53 + 0.54 + 0.44)/3 = 0.50, (0.45 + 0.50 + 0.44)/3 = 0.46, and (0.50 + 0.54 + 0.45)/3 = 0.49, respectively. The predicted lifespan of FS, ES, and AS coatings after correction is 1.29, 1.52, and 1.37 years, respectively.

3.4.2. Analysis of Service Life of Long-Term Soaking Coating Based on Color Variation Rule

Based on related studies [29], a sigmoidal curve equation is used for prediction. The general equation is y = a b + e c x , where a, b, and c are constants, and a > 0, c > 0. The color difference of the coating at various time periods after long-term immersion is fitted using a quadratic function of time. The fitted regression curve is shown in Figure 23.
In the test stage of color difference, due to the slow long-term soaking aging rate, the existing data can only fit the slow growth stage of S-shaped curve, though the data of the slow growth stage is less than the actual failure time of the coating, so the coating failure time is needed to correct the actual coating life. When the color difference value ΔE > 12 is considered as the failure criterion for the final lifespan of the coating, the proportion of the coating’s linear regression curve is taken as the correction parameter for the actual lifespan of the coating. The correction parameters for FS, ES, and AS are calculated as (0.76 + 0.64 + 0.74)/3 = 0.71, (0.75 + 0.74 + 0.84)/3 = 0.77, and (0.81 + 0.66 + 0.77)/3 = 0.74, respectively. The predicted lifespan of FS, ES, and AS coatings after correction is 3.38, 3.33, and 3.68 years, respectively.

3.4.3. Analysis of the Service Life of the Long-Term Immersion Coating Based on the Law of Adhesion Change

According to the overall trend of the coating’s adhesion decreasing slowly, a parabolic curve equation is used for lifespan prediction [30]. The general equation is y = a x 2 + b x + c , where a ≠ 0. The adhesion of the coating at various time periods after long-term immersion is fitted using a parabolic regression curve of time. The fitted regression curve is shown in Figure 24.
In the actual test, the coating life predicted by the adhesion linear is lower than the actual life of the whole coating system, so the service life of the coating needs to be corrected. Similar to other indicators, the proportion of the linear regression curve of each coating will still be used as the correction parameter for the actual life of the coating. A coating adhesion of less than 1.5 Mpa is used as the criterion for determining the final lifespan of the coating. The proportion of each coating’s linear regression curve is used as the correction parameter for the actual lifespan of the coating. The correction parameters for FS, ES, and AS are calculated as 0.87, 0.91, and 0.86, respectively. Based on these parameters, the predicted lifespan after correction for FS, ES, and AS coatings is estimated as 1.69, 1.73, and 2.08 years, respectively.
By combining the lifespan predictions based on the different patterns mentioned above, along with the changes in color difference and adhesion during the decrease in coating glossiness, a weighted approach is used to comprehensively predict the coating lifespan. The weight coefficients for glossiness, color difference, and adhesion are 0.2, 0.5, and 0.3, respectively. Therefore, the weighted service lifespan for the FS, ES, and AS coating systems is calculated as 2.45, 2.48, and 2.74 years, respectively.

3.4.4. Prediction Model of Chloride Ion Resistance Erosion Life of Coated Concrete

Concrete is exposed to chloride salt environments, and depending on the specific conditions, it is generally believed that external chloride ions infiltrate through penetration, diffusion, and capillary action, with diffusion being the primary mechanism in most cases. By analyzing the chloride ion diffusion process in concrete buried under saline soil using one-dimensional diffusion, Fick’s second law is employed for description [31,32]. The initial condition is established as t = 0, x > 0, c = c0, and the boundary condition is x = 0, t > 0, c = cs. The theoretical model for the simple diffusion of chloride ions in concrete is given by Equation (2), and the error function formula is given by Equation (3):
c = c 0 + ( c s c 0 ) 1 e r f x 2 D t
e r f u = 2 π 0 u e t 2 d t
In the equations, c0 represents the initial chloride ion concentration within the concrete; cs represents the chloride ion concentration on the surface of the concrete; and erf represents the error function.

3.4.5. Calculation of Service Life of Coating under Salt Shell Environment

Combining Equations (2) and (3), based on relevant research, the predicted lifespan equation for coated concrete can be derived as Equation (4):
T = d 2 4 D e r f 1 1 c c r c 0 c s c 0 2
In the equations, T represents the service life of the concrete (in years); d represents the thickness of the protective layer of the concrete structure (in mm); D represents the chloride ion diffusion coefficient (in mm2/s); ccr represents the critical chloride ion concentration (%); c0 represents the initial chloride ion concentration in the concrete (%); and cs represents the chloride ion concentration on the surface of the concrete (%).
According to relevant research, the salt shell environment falls into the category IV-C of the exposure classification, which includes deicing salts and other chloride environments. The thickness of the protective layer for concrete, d, is taken as 40 mm. Furthermore, the critical chloride ion concentration for concrete under different conditions is generally between 0.2% and 0.4%. Therefore, a value of 0.3% is selected as the critical chloride ion concentration. By using Equation (4), the service life of concrete components with different coatings buried under saline soil can be predicted.
Under the condition of curve fitting, the service life of FS, ES, and AS coatings are 21.38, 22.32, and 22.58 years, respectively. The service life of the untreated concrete is 18.61 years. Compared to unprotected concrete, the use of coatings can extend the service life of concrete by approximately 3.5 years. The corresponding service lives for FS, ES, and AS coatings are 2.77, 3.71, and 3.97 years, respectively, which are consistent with the service life of the coated concrete.

4. Conclusions

This study focuses on concrete structures in saline soil areas and applies commonly used coating materials for protection. and the following conclusions were drawn:
(1)
The corrosion erosion patterns of the three anti-corrosion coatings used in this study were basically consistent in the accelerated salt corrosion test under wet–dry cycles. The coating pores gradually expanded, followed by the loss of filler components inside the pores, forming “pits”, and eventually resulting in coating layer delamination. Compared to the other two water-based coatings, the hydrofluorocarbon (FS) coating was more prone to damage. There were more holes in the FS coating, which make the corrosive medium, such as water and chloride, rapidly permeate into the interior.
(2)
During the salt corrosion process under salt-shell environment, all coatings exhibited three stages: the adhesion of tiny saline soil particles on the coating surface, an increase in the size and area of attached saline soil particles, and the uneven coverage of multiple layers of saline soil resulting in surface irregularities. The corrosion caused by buried saline soil still required the infiltration of microscopic pores into the substrate surface, leading to coating failure.
(3)
The color difference values on the surfaces of the three coatings gradually increased under the conditions of wet–dry cycles and long-term immersion tests. At 180 days, the glossiness of all three coating systems reached a severe loss, with the FS coating completely losing its glossiness, while the color difference still does not reach the grade of slight discoloration. The pores and cracks expanded in the process of coating corrosion, which caused the gradual loss of paint particles, thus causing color difference.
(4)
The adhesion of the three coatings gradually decreased as the wet–dry cycle period increased. The loss of adhesion was mainly due to the enlargement of internal gaps within the coatings and the continuous expansion of localized microcracks.
(5)
In the salt corrosion test, the chloride ion content inside the concrete specimens decreased with increasing depth at the same corrosion time, while the chloride ion content within the concrete at the same depth increased with time. The coloration boundary of the uncoated concrete section moved closer to the concrete core as the corrosion time prolonged, with the brown area gradually approaching the concrete core.
(6)
Logistic curve, S-shaped curve, and quadratic function curve were used to analyze and fit the glossiness, color difference, and adhesion of the coatings, respectively. The predicted coating lifetimes weighted by glossiness, color difference, and adhesion were generally consistent with the actual results.

Author Contributions

Conceptualization, H.C.; methodology, Y.W.; validation, T.F.; resources, M.Y. and L.W.; data curation, T.F.; writing—original draft preparation, T.F.; supervision, P.X.; project administration, Y.L. All authors have read and agreed to the published version of the manuscript.

Funding

This research was funded by Qinghai Provincial Science and Technology Department, China (2021-GX-122).

Institutional Review Board Statement

Not applicable.

Informed Consent Statement

Not applicable.

Data Availability Statement

Data are contained within the article.

Acknowledgments

This work was supported by the Qinghai scientific and technological achievements transformation project of Qinghai Provincial Science and Technology Department, China (2021-GX-122).

Conflicts of Interest

Author Mingda Yang, Yongqing Li and Laifa Wang were employed by the company Qinghai Communications Construction Engineering Co., Ltd. Author Peng Xu was employed by the company Xi’an Highway Research Institute Co., Ltd. Author Peng Xu was employed by the company Xi’an Huaze Highway Material Co., Ltd. The remaining authors declare that the research was conducted in the absence of any commercial or financial relationships that could be construed as a potential conflict of interest.

References

  1. Deng, Y.; Yan, C.; Niu, P. Hysteretic model of reinforced concrete bridge piers based on earthquake damage and corrosion from saline soil. Soil Dynam. Earthq. Eng. 2023, 166, 107732. [Google Scholar] [CrossRef]
  2. Katiyar, P.K.; Randhawa, N.S. Corrosion behavior of WC-Co tool bits in simulated (concrete, soil, and mine) solutions with and without chloride additions. Int. J. Refract. Met. Hard Mater. 2019, 85, 105062. [Google Scholar] [CrossRef]
  3. Duan, M.; Qin, Y.; Li, Y.; Zhou, H. Durability and damage model of polyacrylonitrile fiber reinforced concrete under freeze–thaw and erosion. Construct. Build. Mater. 2023, 394, 132238. [Google Scholar] [CrossRef]
  4. Shen, J.; Wang, Q.; Chen, Y.; Han, Y.; Zhang, X.; Liu, Y. Evolution process of the microstructure of saline soil with different compaction degrees during freeze-thaw cycles. Eng. Geol. 2022, 304, 106699. [Google Scholar] [CrossRef]
  5. Xue, Q.; Zhang, L.; Mei, K.; Li, X.; Newell, P.; Wang, Y.; Cheng, X.; Zheng, W. CO2-induced evolution of chemical, structural and mechanical properties of reinforced concrete: A review. Construct. Build. Mater. 2022, 353, 129069. [Google Scholar] [CrossRef]
  6. Sadati, S.; Arezoumandi, M.; Shekarchi, M. Long-term performance of concrete surface coatings in soil exposure of marine environments. Construct. Build. Mater. 2015, 94, 656–663. [Google Scholar] [CrossRef]
  7. Pasupathy, K.; Berndt, M.; Sanjayan, J.; Rajeev, P.; Cheema, D.S. Durability of low-calcium fly ash based geopolymer concrete culvert in a saline environment. Cem. Concr. Res. 2017, 100, 297–310. [Google Scholar] [CrossRef]
  8. Chen, Q.; Rong, H.; Tao, G.; Nimbalkar, S.; Xie, K. Fatigue characteristics of nano-SiO2 cemented soil under coupled effects of dry-wet cycle and seawater corrosion. Construct. Build. Mater. 2023, 401, 132579. [Google Scholar] [CrossRef]
  9. Chen, C.; Wang, L.; Liu, R.; Zhu, P.; Liu, H.; Wang, X.; Yu, J.; Chen, Y. Chloride penetration of concrete exposed to dry-wet cycle with various dry-wet ratios and temperature. Construct. Build. Mater. 2023, 400, 132883. [Google Scholar] [CrossRef]
  10. Tian, Y.; Zhang, G.; Ye, H.; Zeng, Q.; Zhang, Z.; Tian, Z.; Jin, X.; Jin, N.; Chen, Z.; Wang, J. Corrosion of steel rebar in concrete induced by chloride ions under natural environments. Construct. Build. Mater. 2023, 369, 130504. [Google Scholar] [CrossRef]
  11. Merachtsaki, D.; Tsardaka, E.; Anastasiou, E.; Zouboulis, A. Anti-corrosion properties of magnesium oxide/magnesium hydroxide coatings for application on concrete surfaces (sewerage network pipes). Construct. Build. Mater. 2021, 312, 125441. [Google Scholar] [CrossRef]
  12. Zhang, M.; Xu, H.; Phalé Zeze, A.L.; Liu, X.; Tao, M. Coating performance, durability and anti-corrosion mechanism of organic modified geopolymer composite for marine concrete protection. Cem. Concr. Compos. 2022, 129, 104495. [Google Scholar] [CrossRef]
  13. Berndt, M.L. Evaluation of coatings, mortars and mix design for protection of concrete against sulphur oxidising bacteria. Construct. Build. Mater. 2011, 25, 3893–3902. [Google Scholar] [CrossRef]
  14. Aguirre-Guerrero, A.M.; Robayo-Salazar, R.A.; de Gutiérrez, R.M. A novel geopolymer application: Coatings to protect reinforced concrete against corrosion. Appl. Clay Sci. 2017, 135, 437–446. [Google Scholar] [CrossRef]
  15. Deshmukh, K.; Parsai, R.; Anshul, A.; Singh, A.; Bharadwaj, P.; Gupta, R.; Mishra, D.; Amritphale, S.S. Studies on fly ash based geopolymeric material for coating on mild steel by paint brush technique. Int. J. Adhesion Adhes. 2017, 75, 139–144. [Google Scholar] [CrossRef]
  16. Kuenzel, C.; Vandeperre, L.J.; Donatello, S.; Boccaccini, A.R.; Cheeseman, C. Ambient temperature drying shrinkage and cracking in metakaolin-based geopolymers. J. Am. Ceram. Soc. 2012, 95, 3270–3277. [Google Scholar] [CrossRef]
  17. Lee, N.K.; Jang, J.G.; Lee, H.K. Shrinkage characteristics of alkali-activated fly ash/slag paste and mortar at early ages. Cem. Concr. Compos. 2014, 53, 239–248. [Google Scholar] [CrossRef]
  18. Wang, C.; Wang, Z.; Liu, S.; Luo, H.; Fan, W.; Liu, Z.; Liu, F.; Wang, H. Anti-corrosion and wear-resistant coating of waterborne epoxy resin by concrete-like three-dimensional functionalized framework fillers. Chem. Eng. Sci. 2021, 242, 116748. [Google Scholar] [CrossRef]
  19. Chi, J.; Zhang, G.; Xie, Q.; Ma, C.; Zhang, G. High performance epoxy coating with cross-linkable solvent via Diels-Alder reaction for anti-corrosion of concrete. Prog. Org. Coat. 2020, 139, 105473. [Google Scholar] [CrossRef]
  20. Kiwa, T.; Hayashi, T.; Kawasaki, Y.; Yamada, H.; Tsukada, K. Magnetic thickness gauge using a Fourier transformed eddy current technique. NDT E Int. 2009, 42, 606–609. [Google Scholar] [CrossRef]
  21. Zhou, Y.; Li, M.; Zhong, X.; Zhu, Z.; Deng, P.; Liu, H. Hydrophobic composite coatings with photocatalytic self-cleaning properties by micro/nanoparticles mixed with fluorocarbon resin. Ceram. Int. 2015, 41, 5341–5347. [Google Scholar] [CrossRef]
  22. Choudalakis, G.; Gotsis, A.D. Morphology and gas transport properties of acrylic resin/bentonite nanocomposite coatings. Prog. Org. Coat. 2014, 77, 845–852. [Google Scholar] [CrossRef]
  23. Bagherzadeh, M.R.; Ghasemi, M.; Mahdavi, F.; Shariatpanahi, H. Investigation on anticorrosion performance of nano and micro polyaniline in new water-based epoxy coating. Prog. Org. Coat. 2011, 72, 348–352. [Google Scholar] [CrossRef]
  24. Liu, X.; Liu, H.; Meng, X.; Sun, C.; Wang, M.; Qi, L.; Shi, G.; Wu, S. Effects of aging treatment on microstructure and tribological properties of nickel-based high-temperature self-lubrication wear resistant composite coatings by laser cladding. Mater. Chem. Phys. 2014, 143, 616–621. [Google Scholar] [CrossRef]
  25. Bhargava, S.; Kubota, M.; Lewis, R.D.; Advani, S.G.; Prasad, A.K.; Deitzel, J.M. Ultraviolet, water, and thermal aging studies of a waterborne polyurethane elastomer-based high reflectivity coating. Prog. Org. Coat. 2015, 79, 75–82. [Google Scholar] [CrossRef]
  26. Elkebir, Y.; Mallarino, S.; Trinh, D.; Touzain, S. Effect of physical ageing onto the water uptake in epoxy coatings. Electrochim. Acta 2020, 337, 135766. [Google Scholar] [CrossRef]
  27. Nguyen Dang, D.; Peraudeau, B.; Cohendoz, S.; Mallarino, S.; Feaugas, X.; Touzain, S. Effect of mechanical stresses on epoxy coating ageing approached by Electrochemical Impedance Spectroscopy measurements. Electrochim. Acta 2014, 124, 80–89. [Google Scholar] [CrossRef]
  28. Coudun, C.; Gégout, J. The derivation of species response curves with Gaussian logistic regression is sensitive to sampling intensity and curve characteristics. Ecol. Monogr. 2006, 199, 164–175. [Google Scholar] [CrossRef]
  29. Chindaprasirt, P.; Rukzon, S.; Sirivivatnanon, V. Effect of carbon dioxide on chloride penetration and chloride ion diffusion coefficient of blended Portland cement mortar. Construct. Build. Mater. 2008, 22, 1701–1707. [Google Scholar] [CrossRef]
  30. Li, B.; Mao, J.; Nawa, T.; Liu, Z. Mesoscopic chloride ion diffusion model of marine concrete subjected to freeze-thaw cycles. Construct. Build. Mater. 2016, 125, 337–351. [Google Scholar] [CrossRef]
  31. Guo, L.; Chen, T.; Gao, X. Transient meshless boundary element method for prediction of chloride diffusion in concrete with time dependent nonlinear coefficients. Eng. Anal. Bound. Elem. 2012, 36, 104–111. [Google Scholar] [CrossRef]
  32. Park, S.; Kwon, S.; Jung, S. Analysis technique for chloride penetration in cracked concrete using equivalent diffusion and permeation. Construct. Build. Mater. 2012, 29, 183–192. [Google Scholar] [CrossRef]
Figure 1. Salt content corrosion test signal.
Coatings 14 01249 g001
Figure 2. Wet–dry cycle test device.
Coatings 14 01249 g002
Figure 3. Drilling point location and depth distribution.
Coatings 14 01249 g003
Figure 4. Coating bond strength test.
Coatings 14 01249 g004
Figure 5. Macromorphological changes of waterborne fluorocarbon coating at different durations of wet–dry cycling.
Coatings 14 01249 g005
Figure 6. Macromorphological changes of waterborne epoxy coating at different durations of wet–dry cycling.
Coatings 14 01249 g006
Figure 7. Macromorphological changes of waterborne acrylic coating at different durations of wet–dry cycling.
Coatings 14 01249 g007
Figure 8. Microscopic morphological changes (SEM) of waterborne fluorocarbon coatings.
Coatings 14 01249 g008
Figure 9. Microscopic morphological changes (SEM) of waterborne epoxy coatings.
Coatings 14 01249 g009
Figure 10. Microscopic morphological changes (SEM) of waterborne acrylic coatings.
Coatings 14 01249 g010
Figure 11. Discolor boundary of coating protective concrete test block section for 36 days.
Coatings 14 01249 g011
Figure 12. Discolor boundary of coating protective concrete test block section for 90 days.
Coatings 14 01249 g012
Figure 13. Discolor boundary of coating protective concrete test block section for 180 days.
Coatings 14 01249 g013
Figure 14. Discolor boundary of coating protective concrete test block section for 270 days.
Coatings 14 01249 g014
Figure 15. Microtopography of FS coating at different salt corrosion times.
Coatings 14 01249 g015
Figure 16. Microtopography of ES coating at different salt corrosion times.
Coatings 14 01249 g016
Figure 17. Microtopography of AS coating at different salt corrosion times.
Coatings 14 01249 g017
Figure 18. Changes in glossiness of FS, ES, and AS coatings.
Coatings 14 01249 g018
Figure 19. Changes in color difference values of FS, ES, and AS coatings.
Coatings 14 01249 g019
Figure 20. Changes in adhesion of FS, ES, and AS coatings.
Coatings 14 01249 g020
Figure 21. Different depth chloride content in concrete for coating protection.
Coatings 14 01249 g021
Figure 22. Fitting curve of coating loss rate with time (FS, ES, AS coatings from left to right).
Coatings 14 01249 g022
Figure 23. Fitting curve of coating color difference value with time (FS, ES, and AS coatings from left to right).
Coatings 14 01249 g023
Figure 24. Fitting curve of coating adhesion and time (FS, ES, and AS coatings from left to right).
Coatings 14 01249 g024
Table 1. Chemical composition of the cement.
Chemical Composition
(%)
SiO2Al2O3CaOMgOSO3Fe2O3Na2OK2OLoss
24.538.3856.932.521.794.270.430.801.09
Table 2. Physical and mechanical properties of the cement.
Specific Surface Area (m2/kg)Cement Stability (Boiling Method)Setting Time (min)Resistance Strength (MPa)Compressive Strength (MPa)
Initial Setting TimeFinal Setting Time3 d28 d3 d28 d
300No crack and deformation for 3 h456003.56.517.042.5
Table 3. Physical properties of aggregates.
AggregateTypeGrain Size (mm)Apparent Density (kg/m3)Stacking Density (kg/m3)Crushing Value (%)Sediment Percentage (%)Fineness Modulus
Coarse aggregateLimestone5~25270016.81.0
Fine aggregateRiver sand0–4.75260015000.92.9
Table 4. Mix ratio of the concrete specimen.
Water Cement Ratio Amount of Material Used per Cubic Meter of Concrete (kg/m3)Sand to Aggregate Ratio
CementFine AggregateCoarse AggregateWater
0.632565612741950.36
Table 5. Coating system and thickness selection.
Coating SystemPrimerThickness (μm)Intermediate CoatThickness (μm)TopcoatThickness (μm)Aggregate Thickness
(μm)
Hydrofluorocarbon coating (FS)Water-based epoxy sealing primer50Water-based epoxy intermediate coat150Water-based fluorocarbon topcoat60260
Aqueous epoxy system (ES)Water-based epoxy sealing primer50Water-based epoxy intermediate coat150Water-based epoxy topcoat60260
Waterborne acrylic acid system (AS)Waterborne acrylic closure primer50Water-based acrylic resin intermediate coat120Water-based acrylic resin topcoat80250
Table 6. Concrete specimens under long-term salt corrosion.
Concrete SpecimenCorrosion Time (d)ESASFSNo CoatingNumber of Replication
Wet-dry cycle accelerated salt corrosion test
(100 * 100 * 100 mm)
12ES-A-1AS-A-1FS-A-1US-A-13
24ES-A-2AS-A-2FS-A-2US-A-23
36ES-A-3AS-A-3FS-A-3US-A-33
48ES-A-4AS-A-4FS-A-4US-A-43
60ES-A-5AS-A-5FS-A-5US-A-53
90ES-A-6AS-A-6FS-A-6US-A-63
180ES-A-7AS-A-7FS-A-7US-A-73
270ES-A-8AS-A-8FS-A-8US-A-83
long-term burial salt corrosion test
(100 * 100 * 100 mm)
12ES-B-1AS-B-1FS-B-1US-B-13
24ES-B-2AS-B-2FS-B-2US-B-23
36ES-B-3AS-B-3FS-B-3US-B-33
48ES-B-4AS-B-4FS-B-4US-B-43
60ES-B-5AS-B-5FS-B-5US-B-53
90ES-B-6AS-B-6FS-B-6US-B-63
180ES-B-7AS-B-7FS-B-7US-B-73
270ES-B-8AS-B-8FS-B-8US-B-83
Table 7. Chemical composition and content of saline soil.
Chemical Composition (mg/kg)Total Soluble Salt Content (mg/kg)
CO32−HCO3−.Cl−.SO42−Na+K+16,940
0170398091203000670
Table 8. Chemical composition and content of salt shell.
Chemical Composition (mg/kg)Total Soluble Salt Content (mg/kg)
CO32−HCO3Cl−.SO42−Ca2+Mg2+Na+K+815,700
2640504,89225,04813817996270,0585,237,926
Disclaimer/Publisher’s Note: The statements, opinions and data contained in all publications are solely those of the individual author(s) and contributor(s) and not of MDPI and/or the editor(s). MDPI and/or the editor(s) disclaim responsibility for any injury to people or property resulting from any ideas, methods, instructions or products referred to in the content.

