Article

Sunlight-Driven Photodegradation of RB49 Dye Using TiO2-P25 and TiO2-UV100: Performance Comparison

1
Laboratory of Nanotechnology, Materials and Environment, Department of Chemistry, Faculty of Science, Mohammed V University in Rabat, Av. Ibn Batouta, BP, Rabat P.O. Box 1014, Morocco
2
Department of Chemistry, Faculty of Sciences & CICA, University of A Coruña, E-15071 A Coruña, Spain
3
Plant Chemistry and Organic and Bioorganic Synthesis Laboratory, Faculty of Sciences, Mohammed V University in Rabat, Rabat P.O. Box 1014, Morocco
4
Euromed University of Fes, UEMF, Fez 30000, Morocco
5
Engineering Laboratory of Organometallic, Molecular Materials and Environment, Faculty of Sciences, Sidi Mohammed Ben Abdellah University, Fez 30000, Morocco
6
Department of Chemistry, An-Najah National University, Nablus P.O. Box 7, Palestine
7
Matériaux & Ingénierie Mécanique, Université de Reims Champagne-Ardenne, 51687 Reims, France
*
Authors to whom correspondence should be addressed.
Coatings 2024, 14(10), 1270; https://doi.org/10.3390/coatings14101270
Submission received: 5 September 2024 / Revised: 28 September 2024 / Accepted: 2 October 2024 / Published: 3 October 2024

Abstract

:
By combining measurements of photocatalysis under solar irradiation with measurements of total organic carbon, we have compared the performance of two TiO2-based photocatalysts in the photodegradation of the dye Reactive Blue 49 (RB49). TiO2-P25 and TiO2-UV100 commercial photocatalysts were tested within a concentration ranging from 0.5 to 4 g/L. The dye solution concentration was varied from 10 to 50 mg/L and its pH was increased from 3 to 9. Extensive characterization of the photocatalysts was performed using Fourier-transform infrared spectroscopy, scanning electron microscopy and X-ray diffraction. TiO2-UV100 proved to be more active in adsorbing RB49 dye than TiO2-P25. At low dye concentrations, the adsorption equilibrium is reached in 15 min. This time increases to 1 h at higher concentrations. The photocatalytic degradation of aqueous RB49 under sunlight was monitored by UV-Vis spectrophotometry. The apparent rate constant of dye photodegradation with TiO2-UV100 is twice that of TiO2-P25. The total organic carbon (TOC) analysis showed a removal of around 98% with TiO2-UV100 and only 85% with TiO2-P25 after 3 h of solar irradiation. Over five photocatalytic cycles of 3 h, TiO2-UV100 maintained a more stable and higher efficient photocatalytic performance. All our results converge toward a better photocatalytic performance of TiO2-UV100 for the photodegradation of RB49 dye and indicate that the most decisive factor is its greater capacity to adsorb the pollutant.

1. Introduction

Water is essential for life on earth. Unfortunately, this precious and increasingly scarce resource is often polluted by various industrial discharges and organic substances. A lack of clean water can lead to serious problems for aquatic life and human health. The textile industry is responsible for a large proportion of the world’s water pollution through wastewater containing reactive dyes that affect the physico-chemical properties of water [1]. The complexity of textile wastewater lies in the presence of synthetic dyes with varied structures and intense colors [2]. These dyes are often toxic compounds that are difficult to biodegrade due to their complex structures and high stability. Their direct release into the environment without appropriate treatment can have harmful consequences for humans and the ecosystem [3,4]. It is therefore essential to break down these organic dyes before discharging the effluent from dyeing plants. Economical and effective treatment remains a challenge.
Advanced oxidation processes (AOPs) have recently emerged as a promising technological alternative for treating polluted water. In particular, heterogeneous photocatalytic oxidation is recognized as being particularly effective in generating highly reactive hydroxyl radicals (OH) and superoxide anion radicals (O2), making it the most suitable method for wastewater decontamination [5,6]. The use of semiconductors with a band structure adapted to the redox potentials of O2/O2 and OH/H2O couples [6,7,8] in photocatalysis is gradually emerging as a promising alternative for the elimination of soluble organic compounds. Using this technique leads to the complete mineralization of these pollutants into carbon dioxide, water and mineral acids even at ambient temperature and atmospheric pressure.
The optical properties of a semiconductor depend on the conditions under which it is manufactured [9]. From a photocatalytic point of view, a wide-bandgap semiconductor such as TiO2 is only active under UV radiation, which represents only a low percent of the sunlight spectrum. Improving the absorption of wide-bandgap semiconductors in the visible range to make them more efficient under solar irradiation remains a challenge and the focus of intense research. In addition, their reactive surface area and, at the same time, their photocatalytic performance are significantly increased by their elaboration in the form of nanostructures.
In the category of photocatalysts commonly used in nanoparticle form, TiO2 remains the most attractive and best-performing [10]. Interest in this photocatalyst has also motivated research into its production using increasingly environmentally friendly methods [11,12]. However, its high bandgap energy of 3.2 eV, which limits its photocatalytic activity to the UV region, makes its use limited [13]. TiO2-P25 is widely recognized as the commercial photocatalyst of reference, although the photocatalytic properties of TiO2 Hombikat UV100 have also been widely studied [14], particularly in liquid-phase applications [15]. As a photocatalyst, the higher efficiency of TiO2-P25 compared with TiO2-UV100 reported in some studies is mainly attributed to its mixed-phase nature, which allows better charge separation [16,17]. Other studies reported contradictory results, highlighting the superiority of UV100, mainly due to its greater capacity to adsorb pollutants and generate OH radicals [14]. A smaller crystallite size would result in a better balance between surface and bulk photogenerated charge recombination. The removal of Reactive Blue 49 (RB49) dye in solution by various techniques has resulted in a great deal of work [18,19]. In this work, the solar photocatalytic degradation of RB49 is investigated by comparing the efficiency of these two TiO2-based photocatalysts: TiO2-P25 and TiO2-UV100. The Reactive Blue 49 (RB49) dye was chosen because it is one of the most widely used and environmentally harmful dyes in the textile industry. In addition, its degradation can be easily monitored by the discoloration of the solution over time. These photocatalysts were previously characterized by various techniques, including X-ray diffraction (XRD), Fourier-transform infrared (FTIR) spectroscopy and scanning electron microscopy (SEM). We first studied the adsorption kinetics of the dye on the photocatalyst, before investigating its photocatalytic performance and the different parameters that can affect it (photocatalyst loading, dye concentration and solution pH). Through this work, we hope to contribute to the resolution of this open debate on the quality of the photocatalytic performance of these two TiO2-based photocatalysts.

2. Experimental

2.1. Materials

Sachtleben GmbH’s (Hamburg, Germany) TiO2 “Hombikat UV-100” is 100% anatase-crystalline, with a specific surface area of 250 ± 20 m2/g and a particle size of around 30 nm [14]. J. Evonik’s (Essen, Germany) TiO2-P25 is approximately 70% anatase and 30% rutile, with a small amount in the amorphous phase [13]. This substance has a specific surface area of 55 ± 15 m2/g and a particle size of around 30 nm [13]. The anatase phase of TiO2 results in a bandgap of the order of 3.2 eV [20], while the rutile phase results in a slightly narrower bandgap of the order of 3.0 eV [21]. The obvious conclusion is that the bandgaps of the two photocatalysts are comparable [22]. All chemicals were used without further purification, and the distilled water used was obtained from a Millipore (Burlington, MA, USA) apparatus (Milli-Q water) with a resistivity of 18.2 MΩ.cm at ambient temperature and a total organic carbon (TOC) of less than 5 µg/L.

2.2. Product Characterization

TiO2-P25 and TiO2-UV100 were fully characterized, including structural, morphological and optical evaluations. The crystalline phase of the synthesized titanium nanoparticles TiO2 (P25 and UV100) was determined by X-ray powder diffraction (XRD) using a Shimadzu XDR-6100 instrument via Cu K irradiation (λ = 1.5406 Å). The analysis was carried out by Fourier-transform infrared spectroscopy (FTIR) in the 400–4000 cm−1 range using a Bruker Alpha Platinum–ATR spectrometer (Zevenhuizen, The Netherlands) equipped with a KBr disk. The morphology of both catalysts was observed by scanning electron microscopy (SEM) using an energy-dispersive analysis (EDX) Quanta (Taoyuan City, Taiwan) 200 instrument.

2.3. Adsorption Kinetics

The characteristics of the azo dye RB49 (C32H23CLN7Na3O11S3), frequently used in textile industry, are summarized in Table 1 [19]. Tests were carried out using a 100 mL Erlenmeyer flask containing 50 mL of RB49 solution at a concentration of 40 mg/L, to which 1 g of photocatalyst was added. This was stirred with a magnetic stirrer at 400 rpm and kept at room temperature for various contact times ranging from 10 to 180 min. The adsorbent was then separated from the mixture by filtration or centrifugation at 4000 rpm. The quantity of RB49 adsorbed was analyzed spectrophotometrically at a maximum absorption wavelength of λmax = 590 nm to determine the time required to reach equilibrium. The amount of RB49 adsorbed per unit mass was calculated using the following equation:
q e = C i C e m V
where
  • qe (mg/g−1): quantity adsorbed at equilibrium;
  • Ci (mg/L−1): initial dye concentration;
  • Ce (mg/L−1): dye concentration at equilibrium;
  • V (L): volume of solution;
  • m (g): mass of adsorbent in solution.
If the process of photocatalytic degradation is first-order kinetics, it is subject to the following equation:
C t = C 0 e x p K app t
  • Ct: the dye concentration after an illumination time t;
  • Kapp: the apparent first-order constant rate.
Table 1. Characteristics of RB49 dye [19].
DyeChemical StructureFamilyMolecular Mass (g.mol−1)Maximum Absorption λmax (nm)
C.I. Reactive Blue 49 (RB49)Coatings 14 01270 i001Azoic882.2590

2.4. Photocatalysis under Solar Irradiation

The 50 mL solution of RB49 dye was mixed with a mass of photocatalyst (TiO2-P25 or TiO2-UV100) in an Erlenmeyer flask, then stirred in the dark for 15 min to allow adsorption of the species onto the catalyst surface. The mixture (RB49 solution + photocatalyst) was then exposed to sunlight. The experiments were carried out at the University of A Coruña (43° 22′ 17″ N, 8° 23′ 46″ W) in the month of May, within the time slot of 12 pm to 3 pm. The solar irradiance at this time of day is about 200 W.m−2. This value is consistent with the seasonal averages at the measurement site [23]. After a certain time t of photodegradation, a sample is taken and the nanoparticles of the photocatalyst are separated by centrifugation at 4000 rpm. The absorbance of the obtained liquid is measured using a UV–visible spectrophotometer (Thermo Scientific Evolution 201, Waltham, MA, USA) in the spectral range of 400–800 nm (Figure 1). The concentration Ct of the solution is obtained by prior calibration. Within the studied concentration range, a maximum uncertainty of ± 2 mg/L can be estimated from this calibration curve. (inset of Figure 1).
Figure 1 shows the absorption spectra of RB49 solutions at different concentrations. Within the studied spectral range, the reactive dye is characterized by a prominent band in the 590–630 nm visible region. The 590–630 nm absorbance peaks correspond to the chromophore of the RB49 dye [24]. According to Figure 1, 590 nm was chosen as λmax to monitor the photodegradation of RB49.

2.5. Total Organic Carbon Determination

Total organic carbon (TOC) removal was measured using a ShimadzuTOC-5000A analyzer (Kyoto, Japan). The extent of degradation in terms of TOC was calculated using the following relationship:
T O C % = 100   T O C 0 T O C t T O C 0

3. Results and Discussion

3.1. Characterization of TiO2-Based Catalysts by XRD

The XRD patterns of the two TiO2-based photocatalysts are shown in Figure 2. TiO2-UV100 is a pure anatase-phase material. Its diffraction peaks are all well indexed to the pure anatase phase per JCPDS standard map #99-101-0679. Its main peak, (101), is located at around 25.3°, and the secondary anatase peaks, at 2θ = 25.3°, 37.8°, 48.0°, 53.9°, 55.0°, 62.7° and 68.9°, correspond to the following Miller index (hkl) values: (004), (200), (105), (211), (204) and (116) of the anatase phase [25]. The XRD pattern of Degussa TiO2-P25 is based on its crystalline structure, a mixture of 70% anatase and 30% rutile. Notable peaks in a range of 10° < 2θ < 70° were observed for anatase at 25.7°, 27.45°, 36.97°, 37.69°, 54.1°, 38.40° and 68.7°, corresponding to the following Miller index (hkl) values: (101), (112), (200), (105), (211), (204) and (116), respectively. For the rutile, three peaks were observed at 26.5°, 37.1° and 41.8°, corresponding to the following Miller (hkl) values: (110), (101) and (111), respectively. The main anatase peak, (101), is at around 25.3°, and the rutile peak, (110), is at around 27.4° [25,26]. Figure 2 highlights the different crystalline structures of the two photocatalysts.

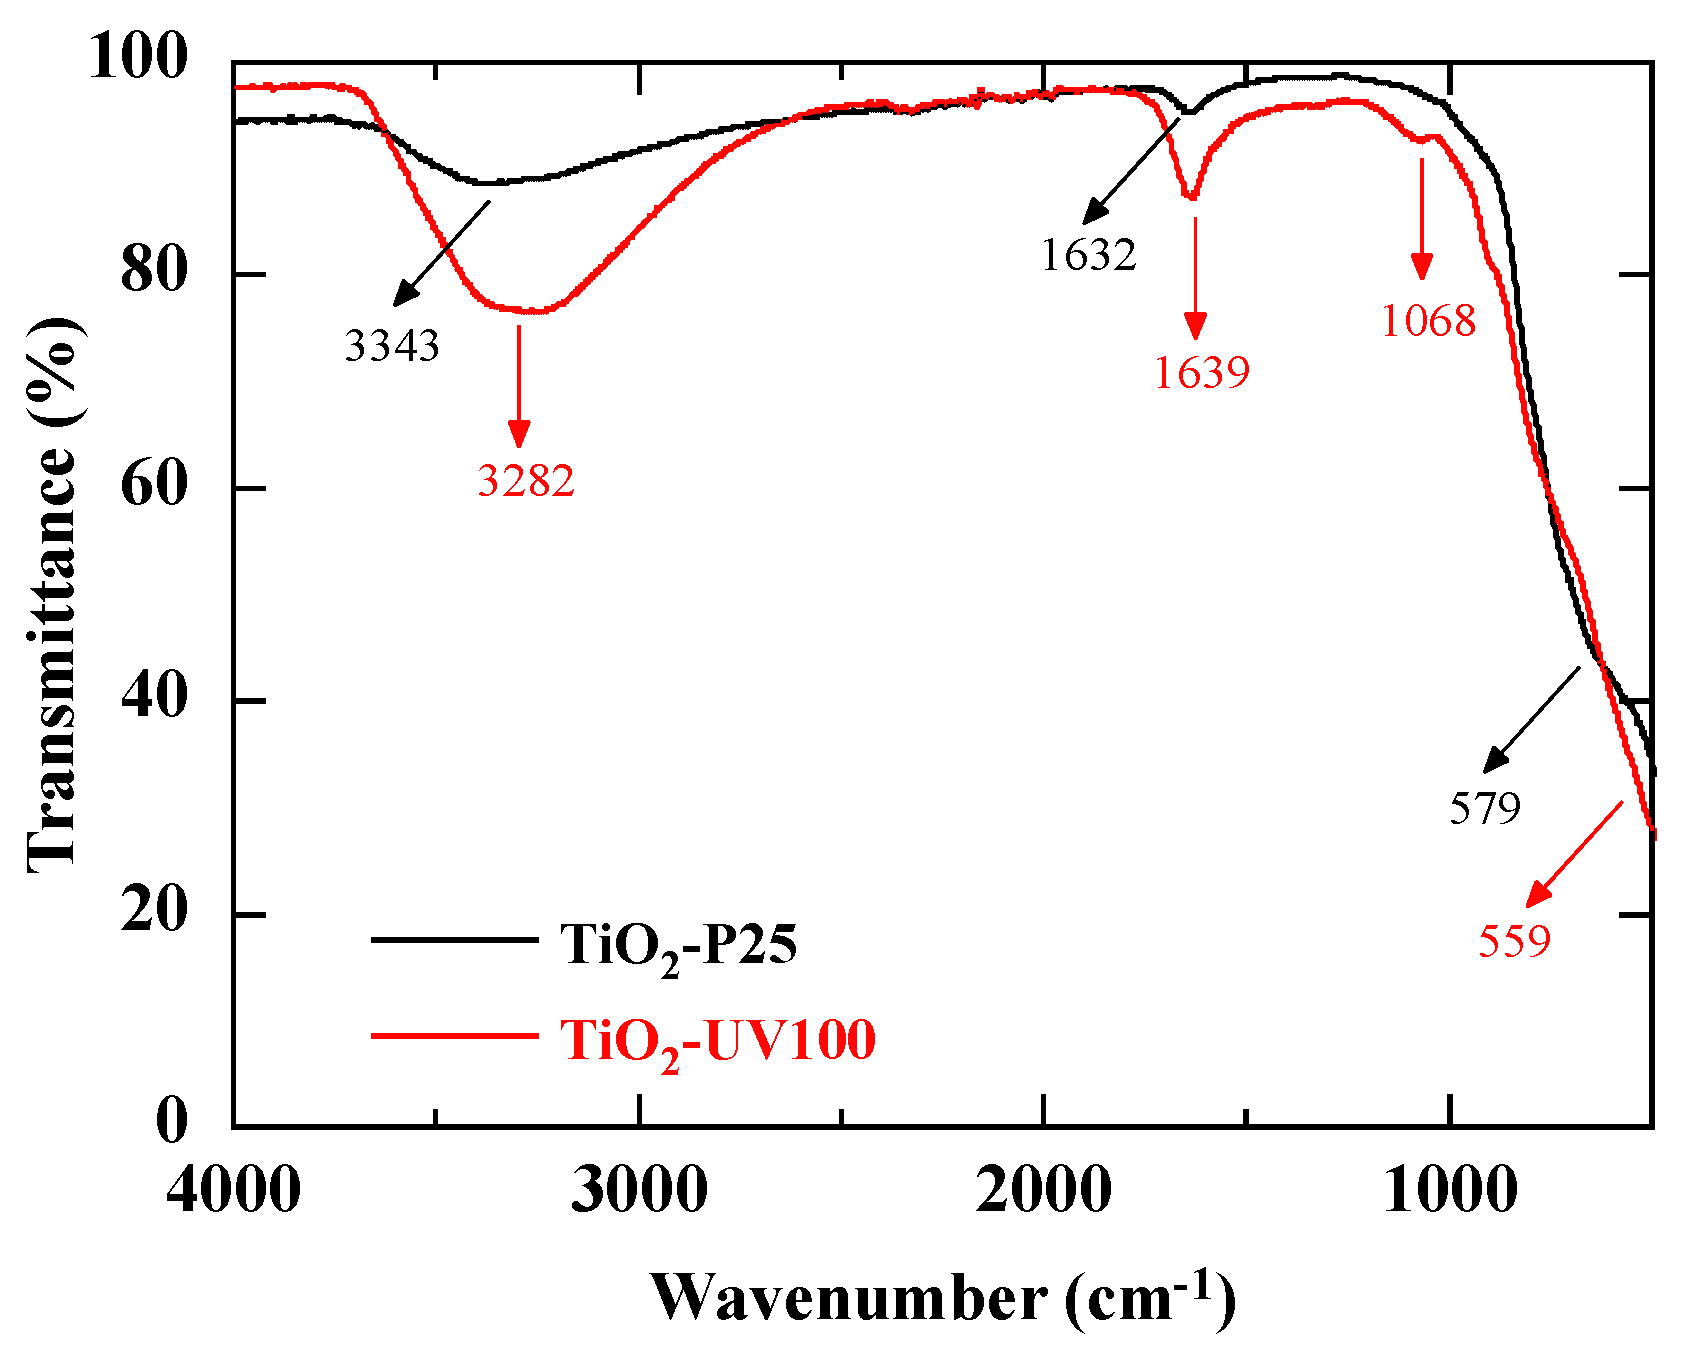
3.2. Characterization by FTIR

Figure 3 shows the Fourier-transform infrared (FTIR) transmittance spectra of TiO-P25 and TiO2-UV100. The Ti-O modes are generally assigned to the bands appearing in the wave number range 400 cm−1–1000 cm−1 [27]. The broad band around 500–600 cm−1 can then be attributed to the stretching vibration of Ti-O and Ti-O-Ti bonds in the TiO2 nanoparticles. The deformation vibrations of the water molecule adsorbed from the atmosphere onto the surface of the TiO2 nanoparticles give rise to a band around 1620 cm−1 [26]. Therefore, the band at 1632 cm−1 for TiO2-P25 and 1639 cm−1 for TiO2-UV100 should correspond to the characteristic bending vibrations of the hydroxyl group [28]. The presence of this hydroxyl group is important as it suggests an interaction with water or other hydroxyl group-containing compounds. This has significant implications for various TiO2 applications, including its reactivity with water and its ability to adsorb compounds containing hydroxyl groups. Finally, a broad band in the range 3650–3100 cm−1 is observed, corresponding to the intermolecular interaction between the TiO2 surface and the hydroxyl group of water molecules [29,30,31]. This interaction is crucial in many TiO2 applications, particularly in heterogeneous catalysis and photocatalysis. A small band around 1068 cm−1 is only present in the TiO2-UV100 spectrum. It can be assigned to the C-O stretching vibration of Ti-O-C due to surface carbonate species [32]. This band has also been attributed to the vibrations of specific impurities on the surface or to the effects of changes in the surface of the structure following a particular treatment [33]. The differences in the FTIR spectra of the two TiO2 samples are therefore due to differences in their crystalline structure, but also suggest differences in surface adsorption, particularly of water molecules.

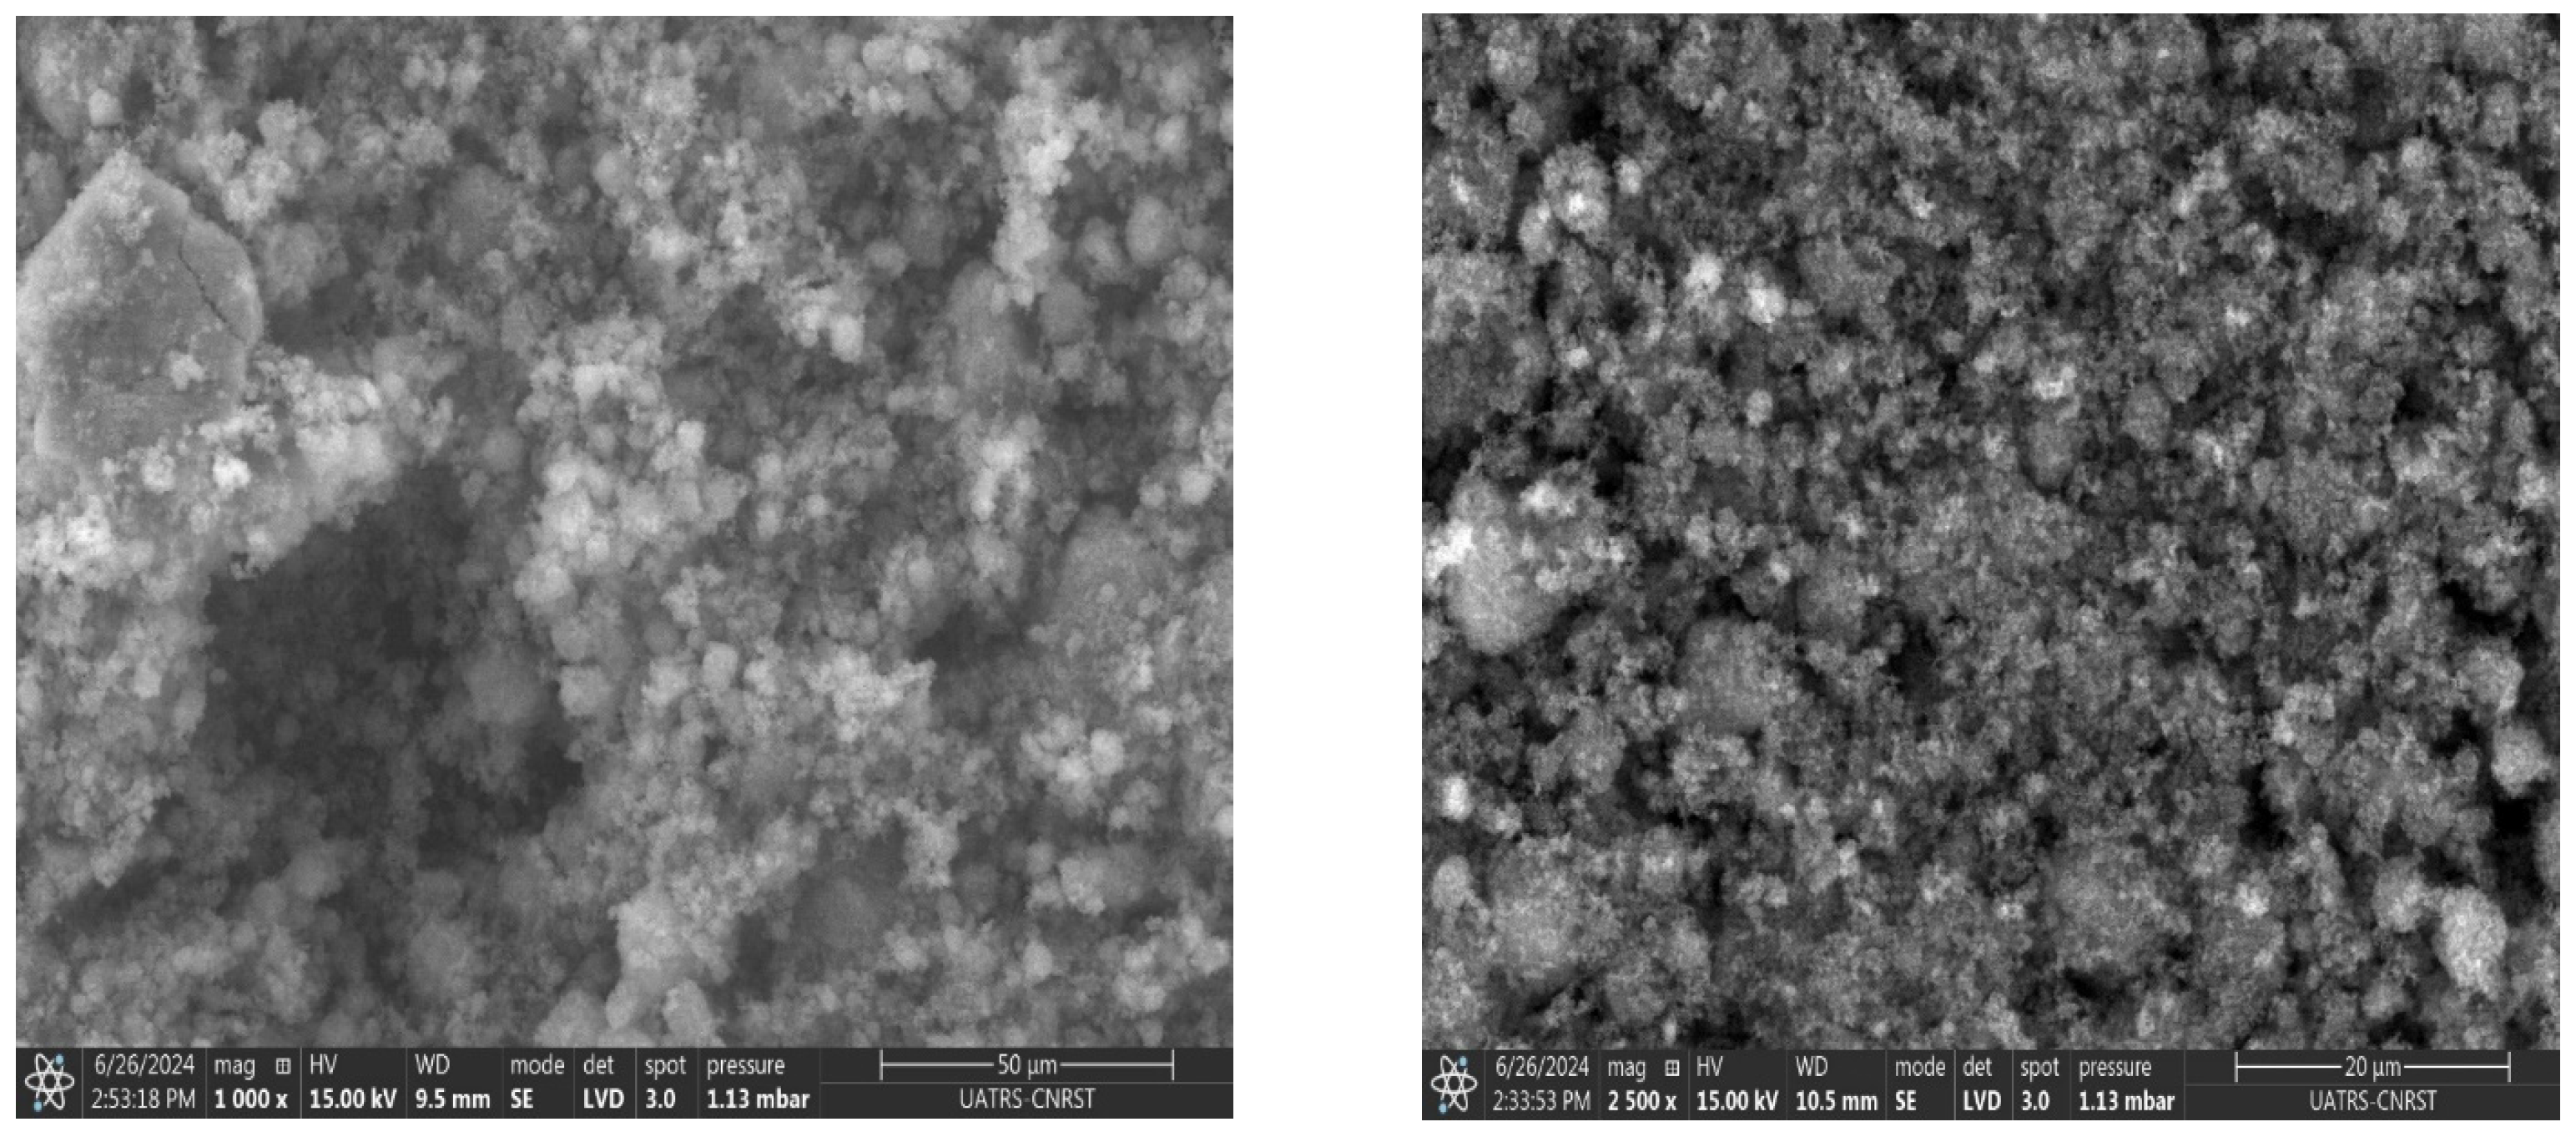
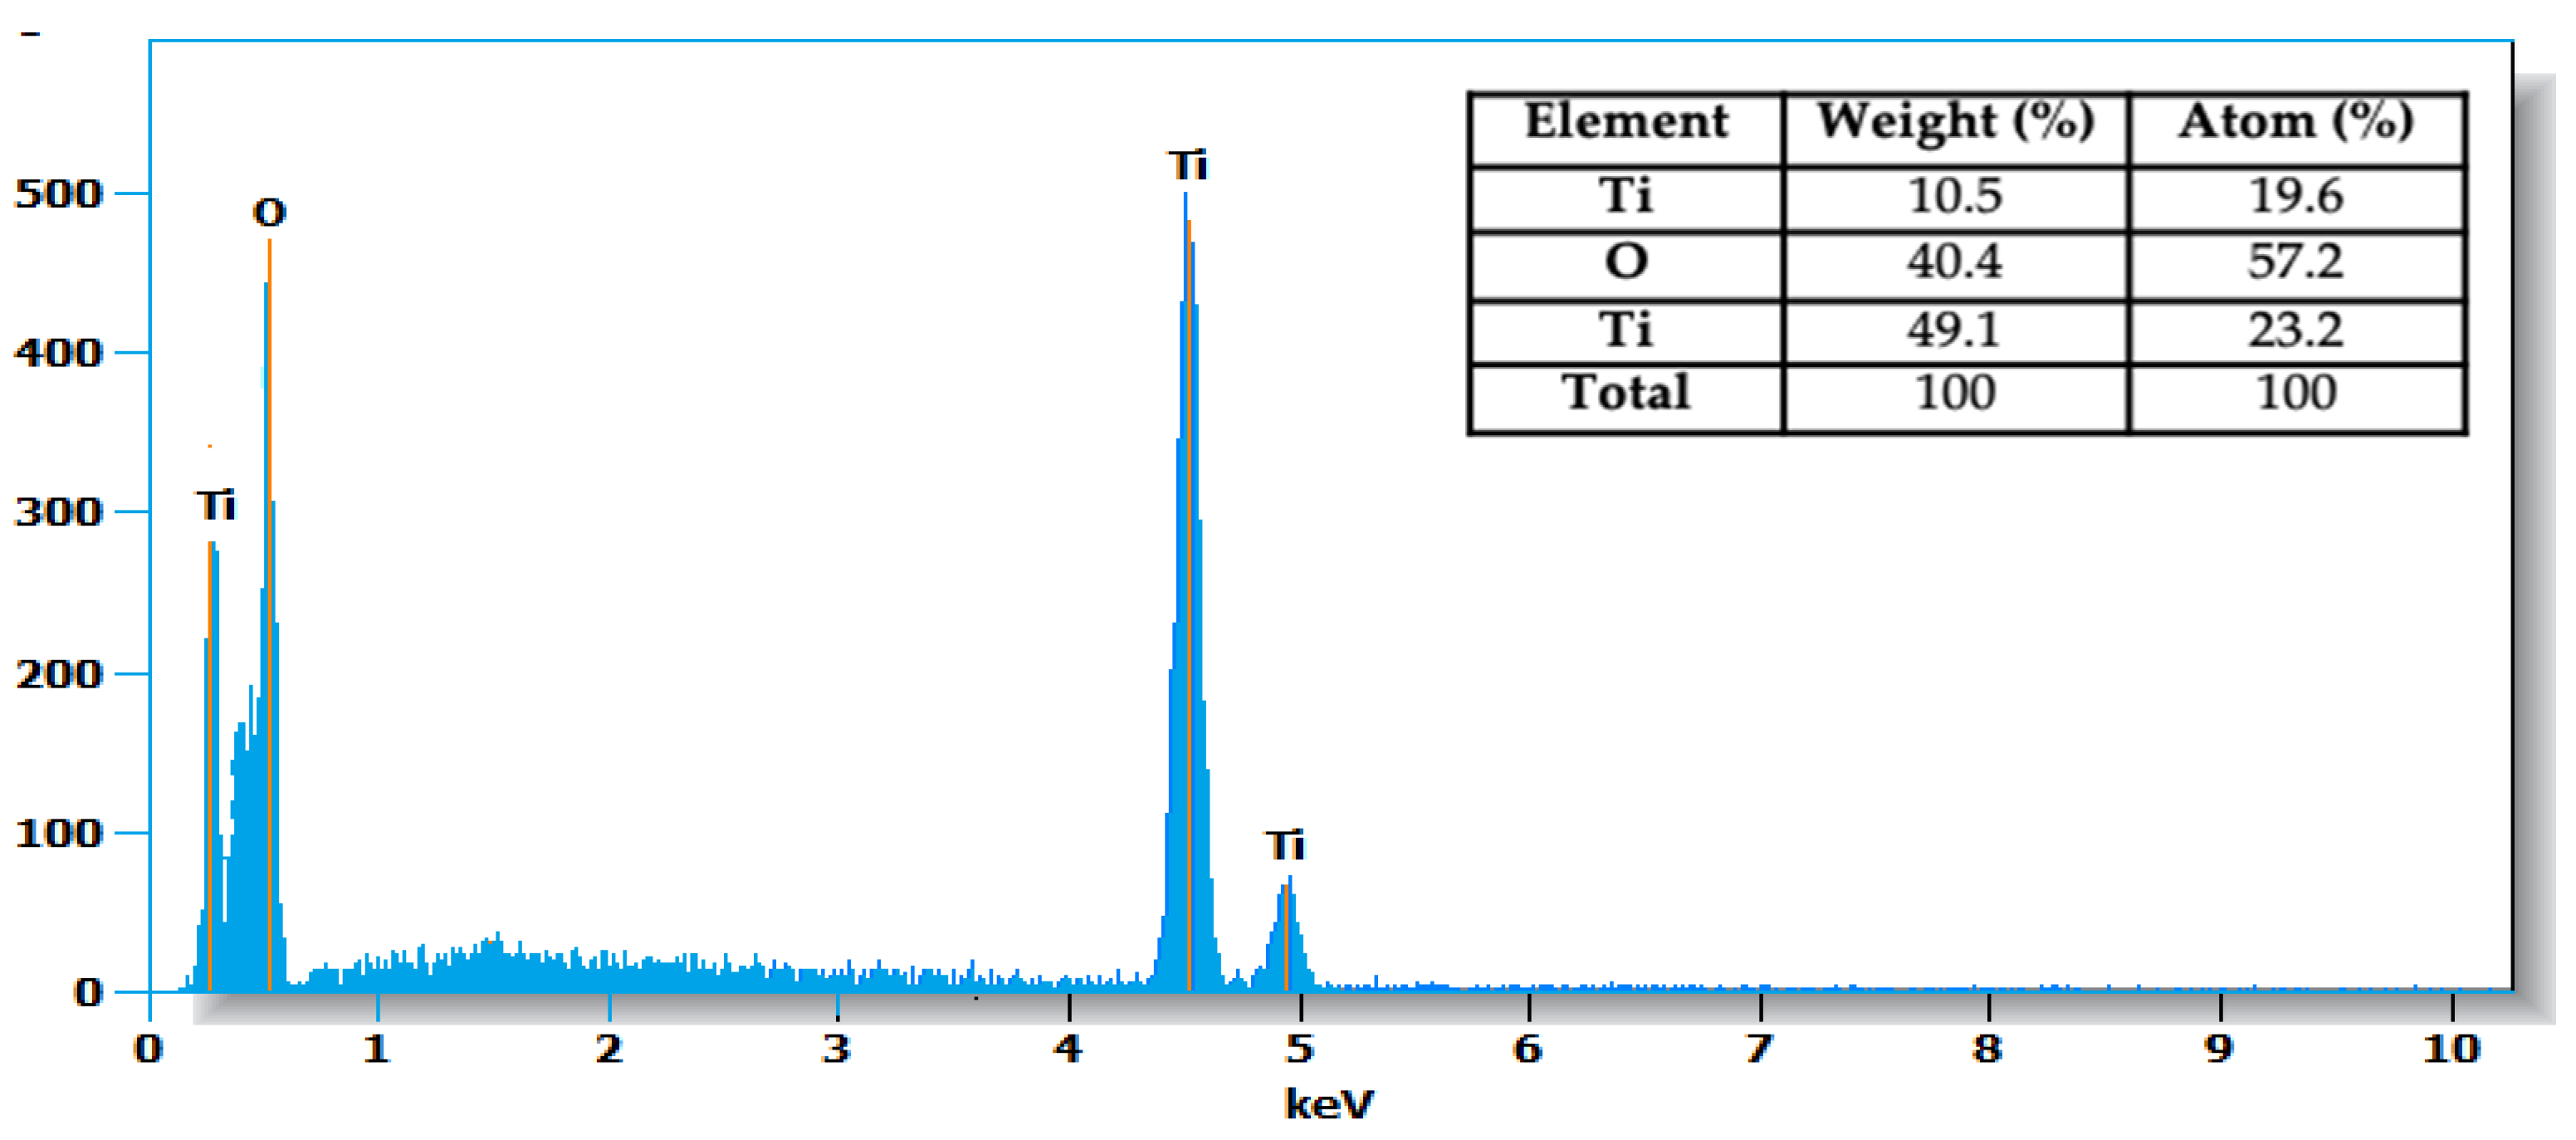
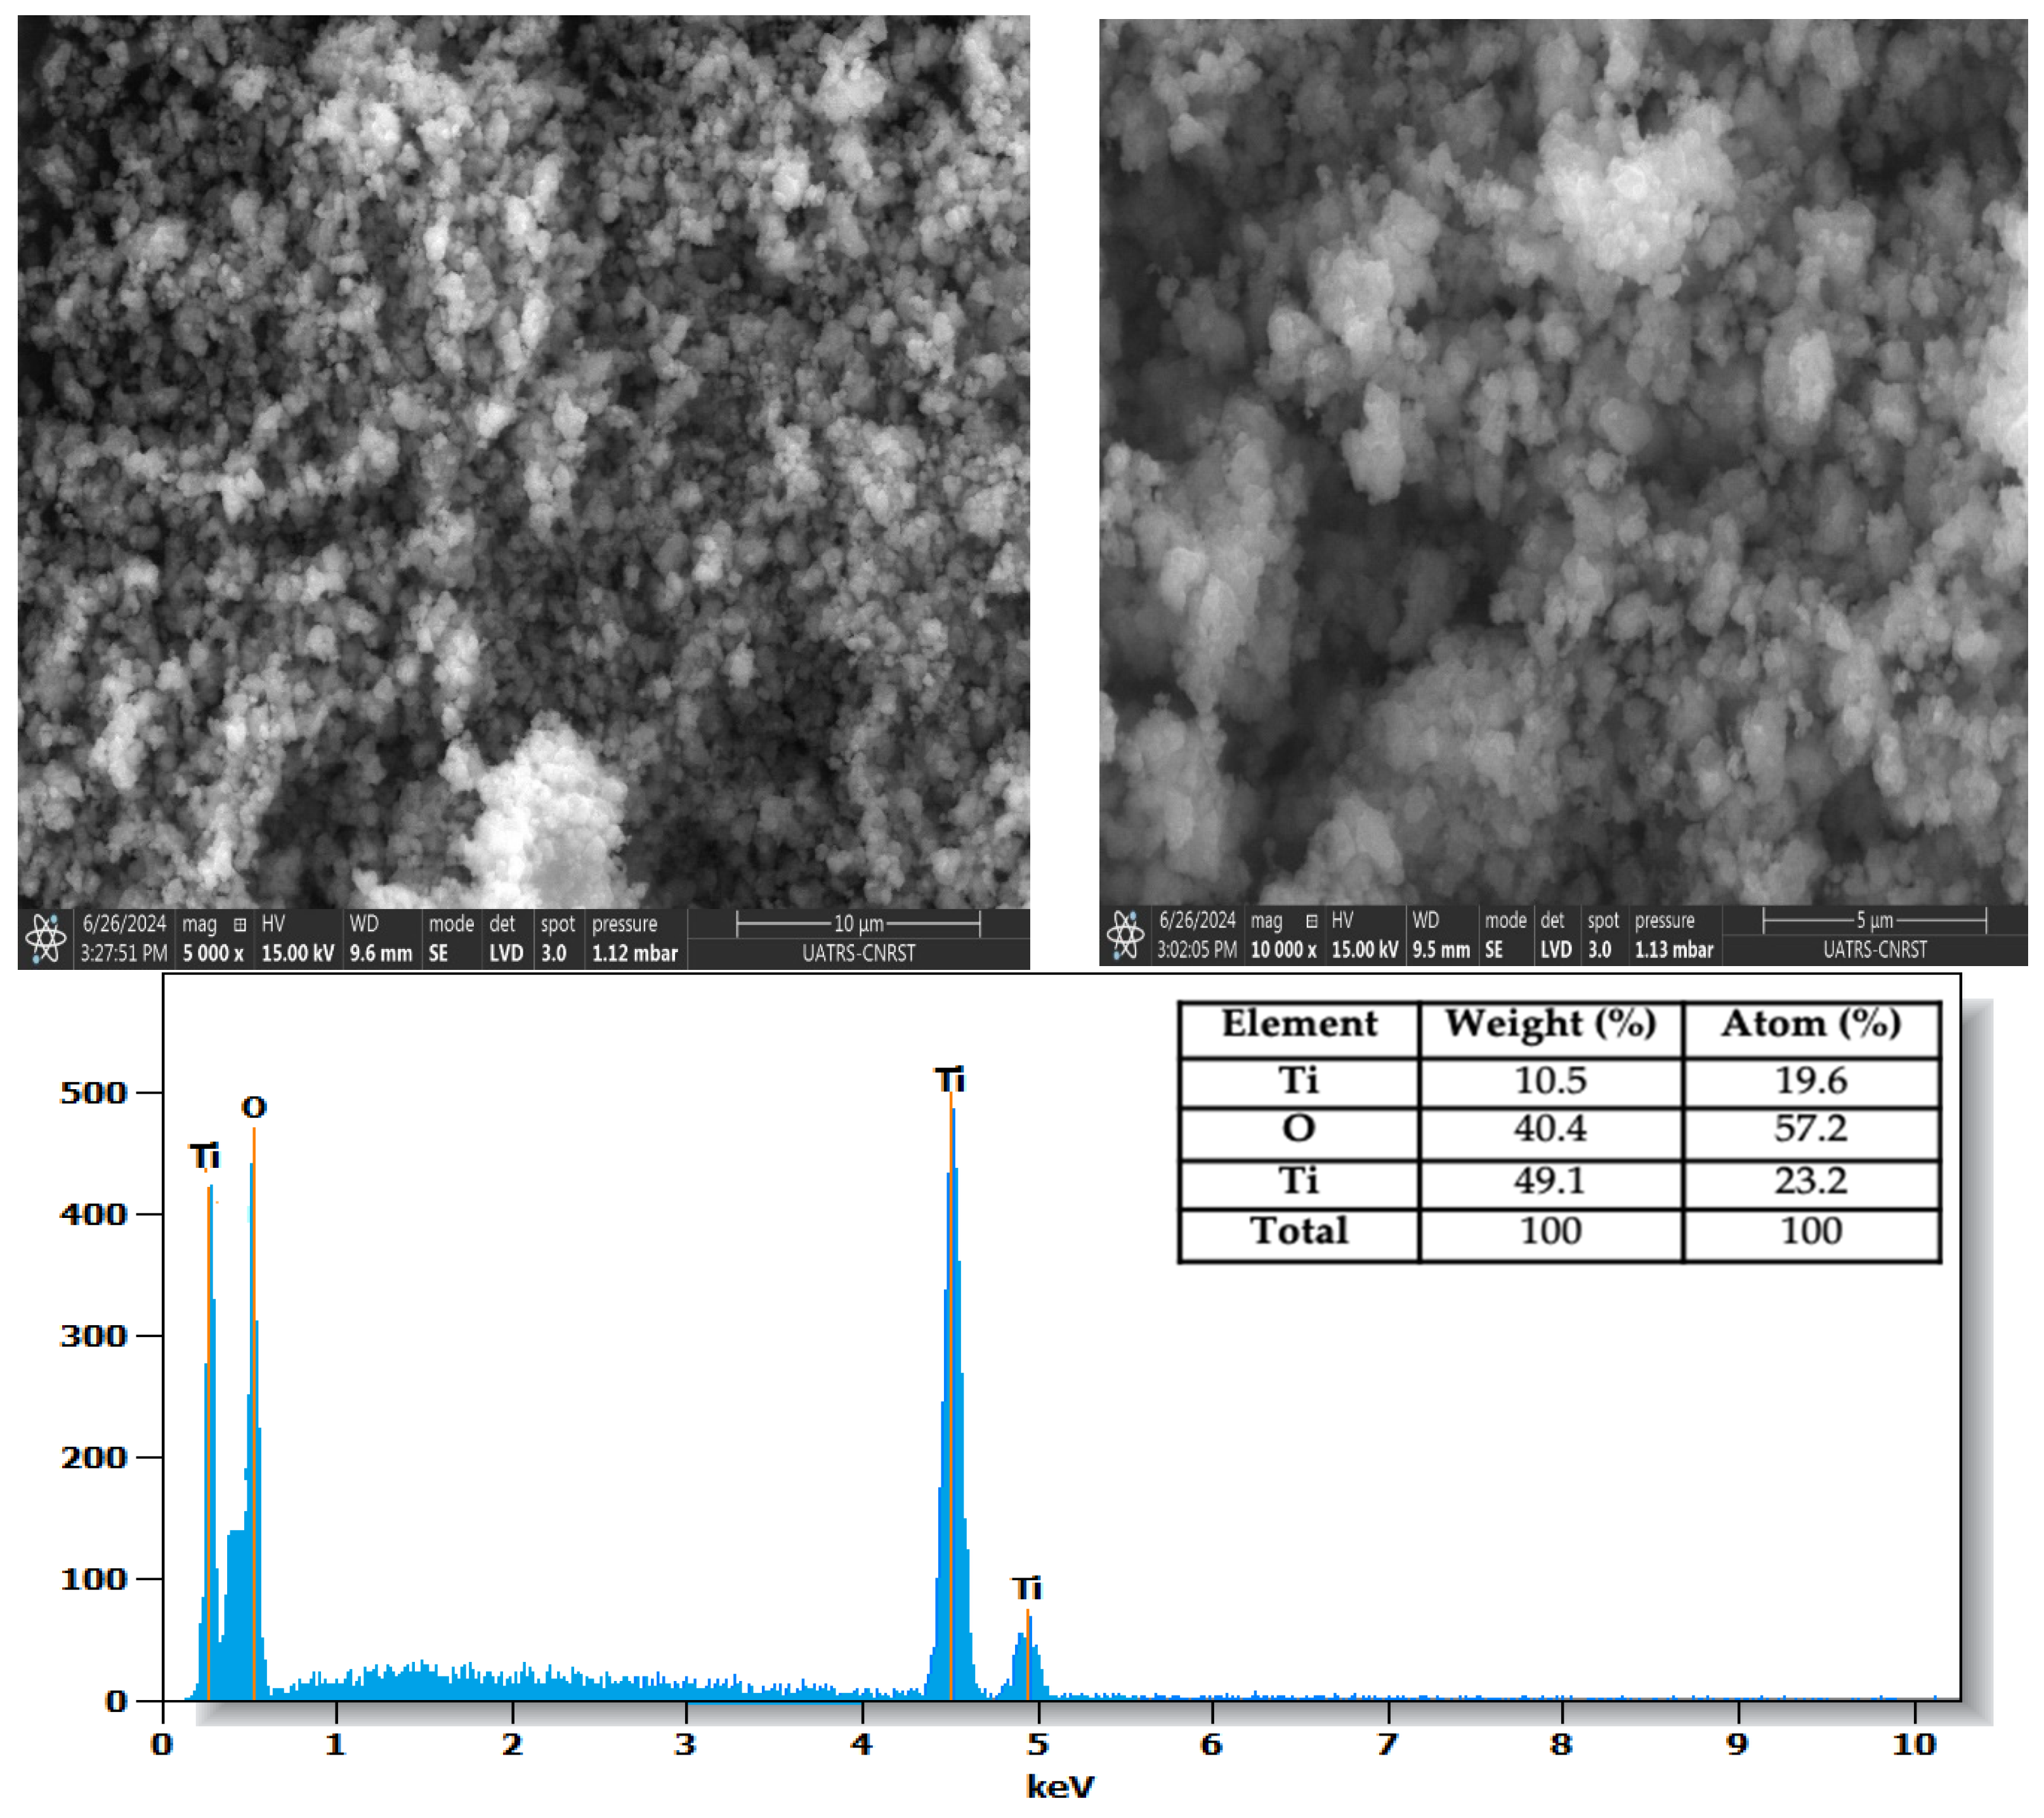
3.3. Morphology and EDS Analysis

SEM images and EDS analysis results provide information on the samples’ morphology and their elemental composition. The SEM images of the TiO2-P25 sample (Figure 4) reveal a surface composed of agglomerated nanoparticles, typical of titanium dioxide (TiO2), with a rough, heterogeneous structure [34]. Analysis by EDS confirms the majority presence of titanium (Ti) and oxygen (O), the constituent elements of TiO2, with weight percentages of 59.6% for titanium and 40.4% for oxygen. These data are consistent with the composition expected for TiO2-P25, which is often used in photocatalytic applications due to its specific chemical and physical properties. The results show the absence of significant contaminants, indicating high sample purity.
The SEM images of TiO2-UV100 (Figure 5) show a granular, agglomerated structure typical of TiO2 nanoparticles, with a uniform particle distribution and contrast variations, indicating differences in size and topography. EDS analysis confirmed the presence of oxygen and titanium, with respective weight compositions of 59% and 41%, in agreement with the expected stoichiometry of titanium dioxide (TiO2). The results corroborate the nanoparticulate nature of TiO2-UV100, indicating a homogeneous particle distribution, essential for its potential applications in fields such as catalysis or photocatalysis.

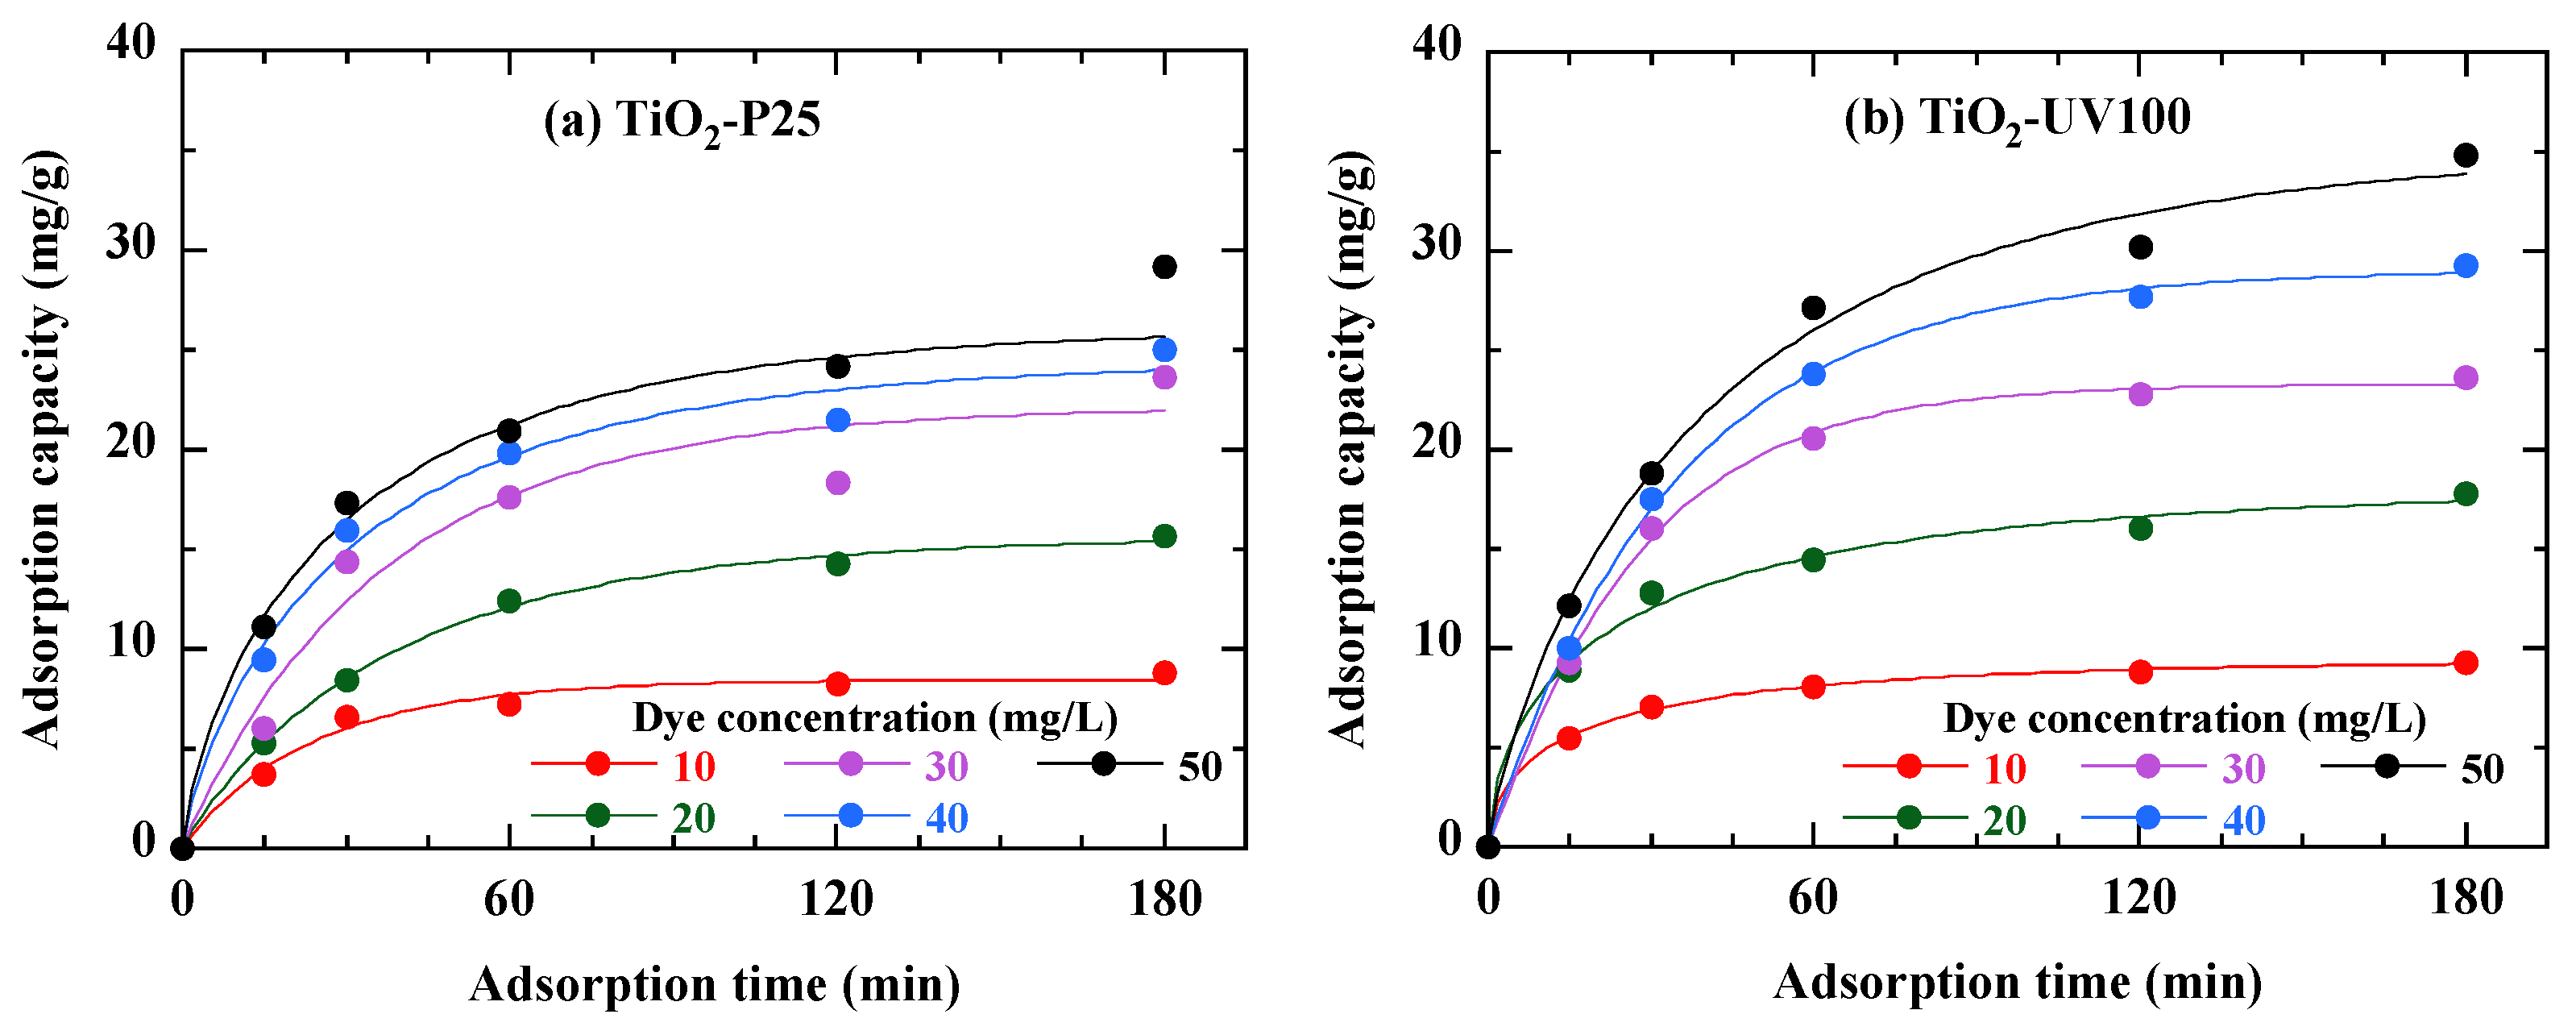
3.4. Adsorption Kinetics of RB49

The phenomenon of adsorption on the catalyst surface, an initial and primordial stage in the photocatalytic reaction, was studied in order to highlight the optimum conditions for the degradation of a specific dye. From a kinetic point of view, adsorption occurs in two stages: a rapid first stage and a slower second stage. The adsorption curves in Figure 6 show that, at low dye concentrations, it takes only 15 min of stirring for the amount of dye adsorbed to reach equilibrium. This time increases to nearly 1 h at high concentrations. It is therefore imperative to leave the mixture stirring for at least this length of time before irradiating it [35]. However, it is important to note that at high concentrations, the curve deviates somewhat from first-order kinetics.
TiO2-UV100 (Figure 6b) shows a higher adsorption capacity for all dye concentrations compared to TiO2-P25 (Figure 6a). This suggests that TiO2-UV100 is more effective at adsorbing RB49 dye, probably due to its better surface properties. The curves show that adsorption occurs rapidly at first, then gradually slows down. This is typical of adsorption processes, where the initial phase is governed by the availability of active sites on the photocatalyst’s surface. This is probably due to the structure of each photocatalyst. The maximum adsorption capacity of each photocatalyst is reached beyond 60 min of agitation. After 60 min of contact, the adsorption rate slows to zero. For photocatalysis measurements, the solution in the presence of the photocatalyst is kept in the dark for 15 min to ensure that the adsorption phenomenon is not far from equilibrium [36]. On the one hand, this time allows the adsorption phenomenon to establish to a large extent, and on the other hand, it does not affect the absorption of light and electron–hole pairs on the surface of the photocatalyst.

3.5. Adsorption Isotherm

To estimate the amount of dye adsorbed, we studied the adsorption isotherm using dye concentrations ranging from 10 to 50 mg/L in the presence of TiO2-P25 and TiO2-UV100. The curve shown in Figure 7 illustrates the adsorption isotherm at room temperature. As the initial dye concentration rises, the amount adsorbed increases toward a limit value corresponding to the maximum amount adsorbed. In general, the adsorption of organic compounds on TiO2 in aqueous solution follows the Langmuir model, described by the following expression [37]:
Q e = q m K L C e 1 + K L C e
Ce (mg/L) denotes the equilibrium dye concentration in solution, Qe (mg/g) the equilibrium unit adsorption capacity, qm (mg/g) the adsorption capacity for a complete monolayer and the constant KL (mg/L) the adsorption energy and binding site affinity. Figure 7 shows a rapid uptake with TiO2-UV100 from the beginning of the adsorption process, which could be explained by the high affinity of this photocatalyst for RB49 dye molecules [38].
The good fits of Figure 6 highlight a single type of adsorption site and suggest that the Langmuir model is well appropriate to describe the adsorption of RB49 on the TiO2-based photocatalysts. In Table 2 are reported the Langmuir model parameters derived from these fits. Figure 7 indicates that TiO2-UV100 is more effective in retaining dye molecules, suggesting better performance in catalytic degradation and monolayer adsorption processes according to the Langmuir model [39].

3.6. Photolysis and Photocatalysis

In a preliminary study, we investigated the photolysis and photodegradation kinetics of a 40 mg/L RB49 dye solution. The study was divided into two parts: the first concerned the direct photolysis of the dye (without the addition of a photocatalyst) under solar irradiation, and the second focused on photodegradation kinetics with the addition of 1 g/L TiO2-P25 or TiO2-UV100 under solar irradiation. The initial pH of the solution was maintained without adjustment (pH Rb49 = 5.8). The results, displayed in Figure 8, indicate that after 3 h of direct exposure of the dye to sunlight without the addition of photocatalytic nanoparticles, the rate of degradation remained negligible. This highlights the crucial role of the photocatalyst in the reaction medium. However, a significantly higher removal efficiency, reaching 95% for TiO2-UV100 and 90% for TiO2-P25, was obtained after 3 h contact with RB49 degradation under solar irradiation.
According to Figure 8, in contrast to simple direct photolysis, the photodegradation efficiency of the dye under solar irradiation is considerably enhanced in the presence of the TiO2-based photocatalyst. Comparing the photodegradation kinetics obtained with the two photocatalysts, the plots in Figure 8 show that an exponential fit, corresponding to first-order kinetics, leads to a Kapp rate constant of the order of 0.030 ± 0.001 and 0.017 ± 0.001 min−1 with TiO2-UV100 and TiO2-P25, respectively. This results highlights the fact that the photodegradation efficiency of the dye under solar irradiation is significantly increased in contact with TiO2-UV100.

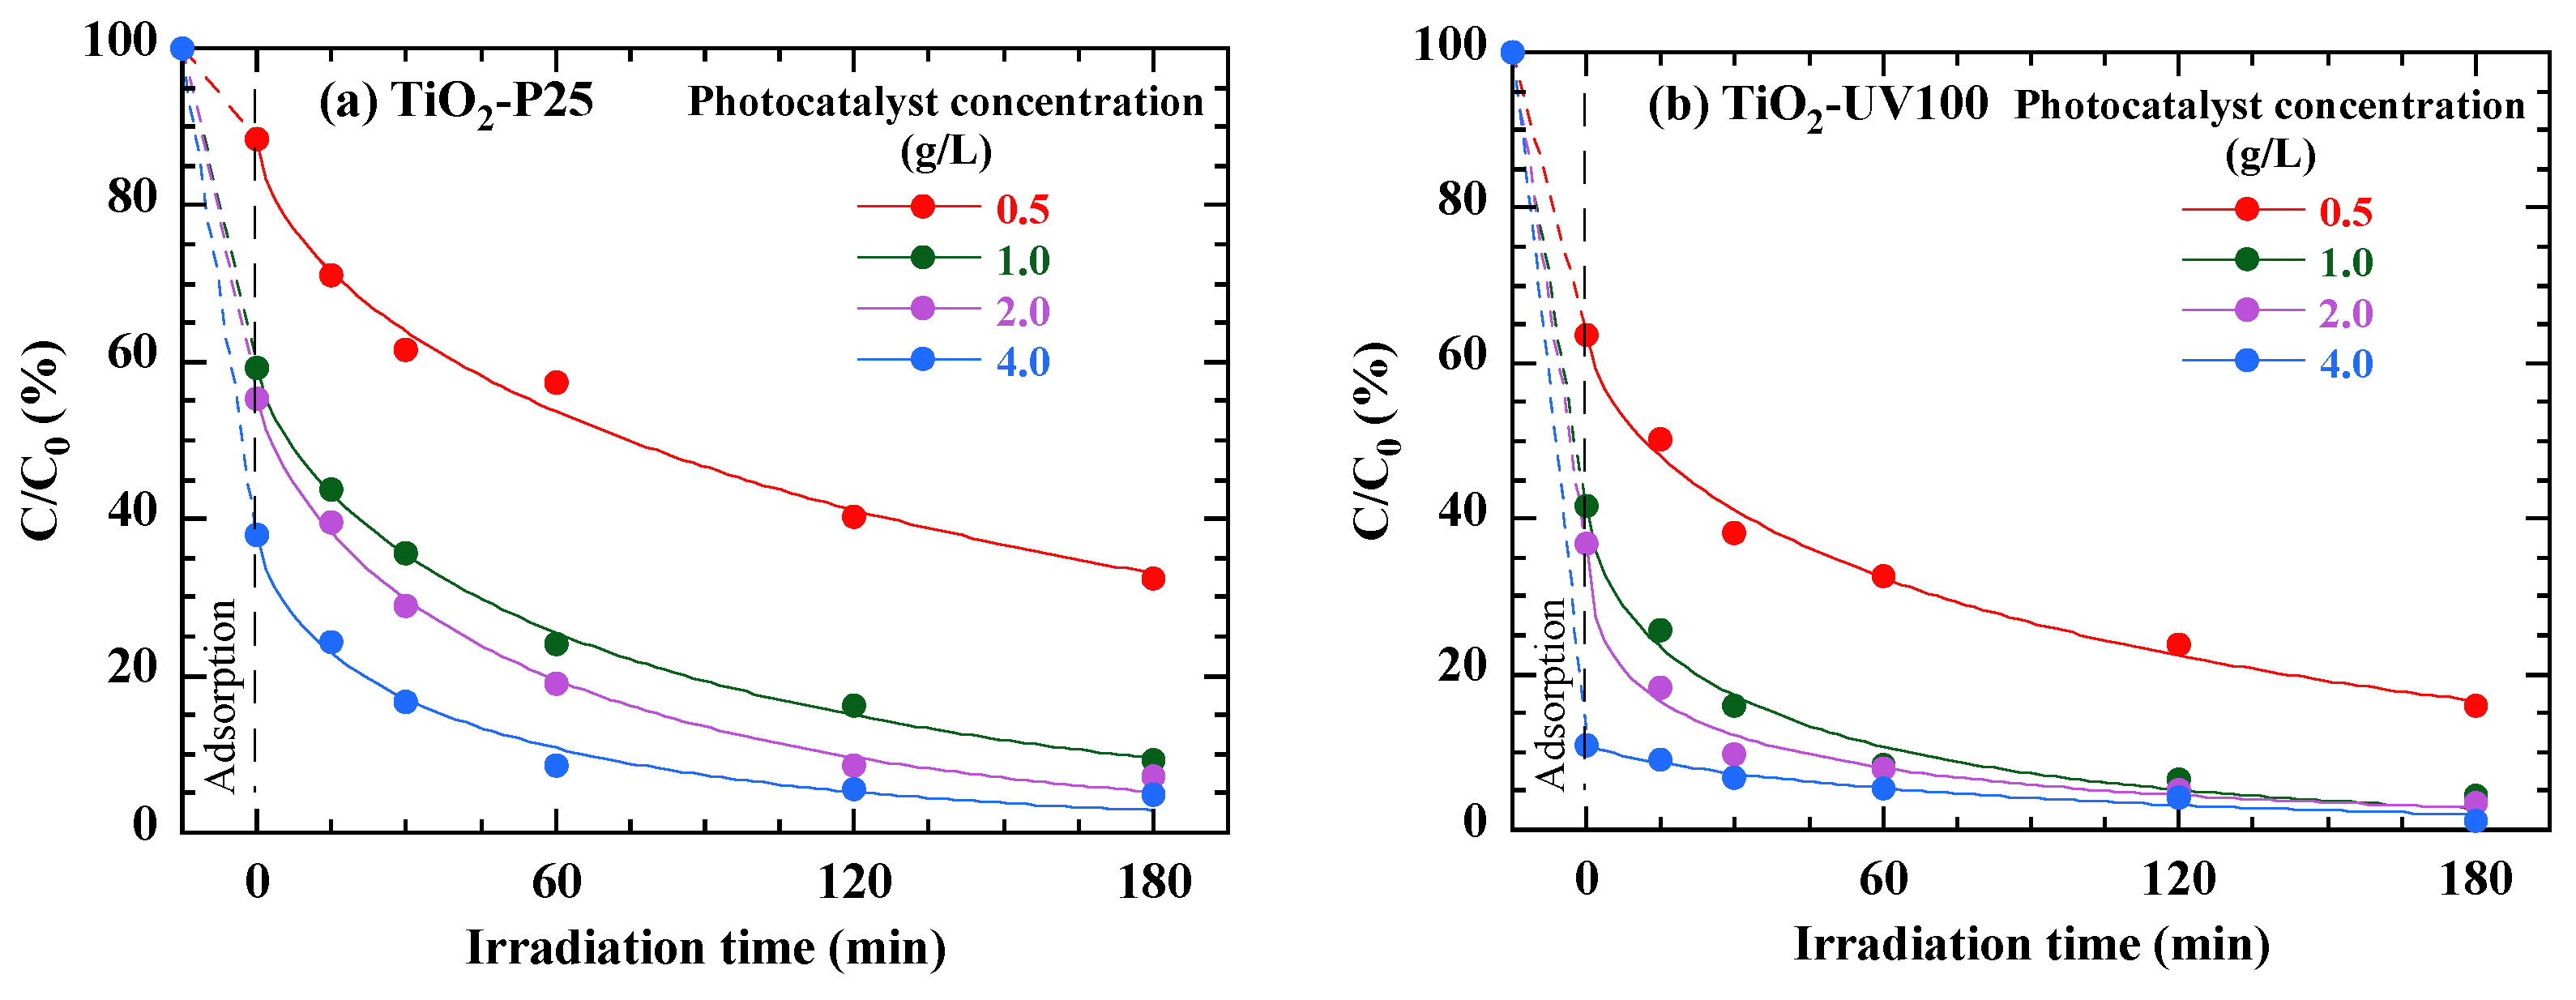
3.7. Effect of Photocatalyst Loading

The photocatalytic degradation rate is highly dependent on photocatalyst quantity [40]. To assess the effect of the catalyst dose added on the degradation of the RB49 dye at a concentration of 40 mg/L, tests were carried out varying the photocatalyst loading from 0.5 to 4 g/L, while keeping the solution pH constant (pH (RB49) = 5.8). Furthermore, the data presented in Figure 9 show that dye degradation efficiency increases with photocatalyst loading. Even before irradiation begins, an initial drop is observed in the curves, reflecting the adsorption of the dye onto the TiO2 particles. This adsorption effect is more pronounced for higher TiO2 nanoparticle concentrations, showing that the TiO2 particles capture some of the dye before the degradation process begins under the effect of light. This initial adsorption thus contributes to the rapid decrease in dye concentration within the first few minutes of irradiation. Indeed, increasing the amount of TiO2-P25 and TiO2-UV100 from 0.5 to 1 g/L leads to a significant increase in the degradation rate. This improvement can be attributed to the multiplication of active reaction sites on TiO2-P25 and TiO2-UV100, as well as to increased photon capture on the photocatalyst surface. The abundance of high-energy dynamic sites on the photocatalyst surface can overcome the mass transfer resistance of contaminants between the solid and aqueous phases, enhancing degradation. Above this concentration (1 g/L), the degradation rate increases slightly, probably due to excess photocatalyst and particle agglomeration, masking a large part of the photosensitive surface [40]. Figure 9 shows that TiO2-UV100 has a better photocatalytic performance than TiO2-P25, regardless of the photocatalyst load.

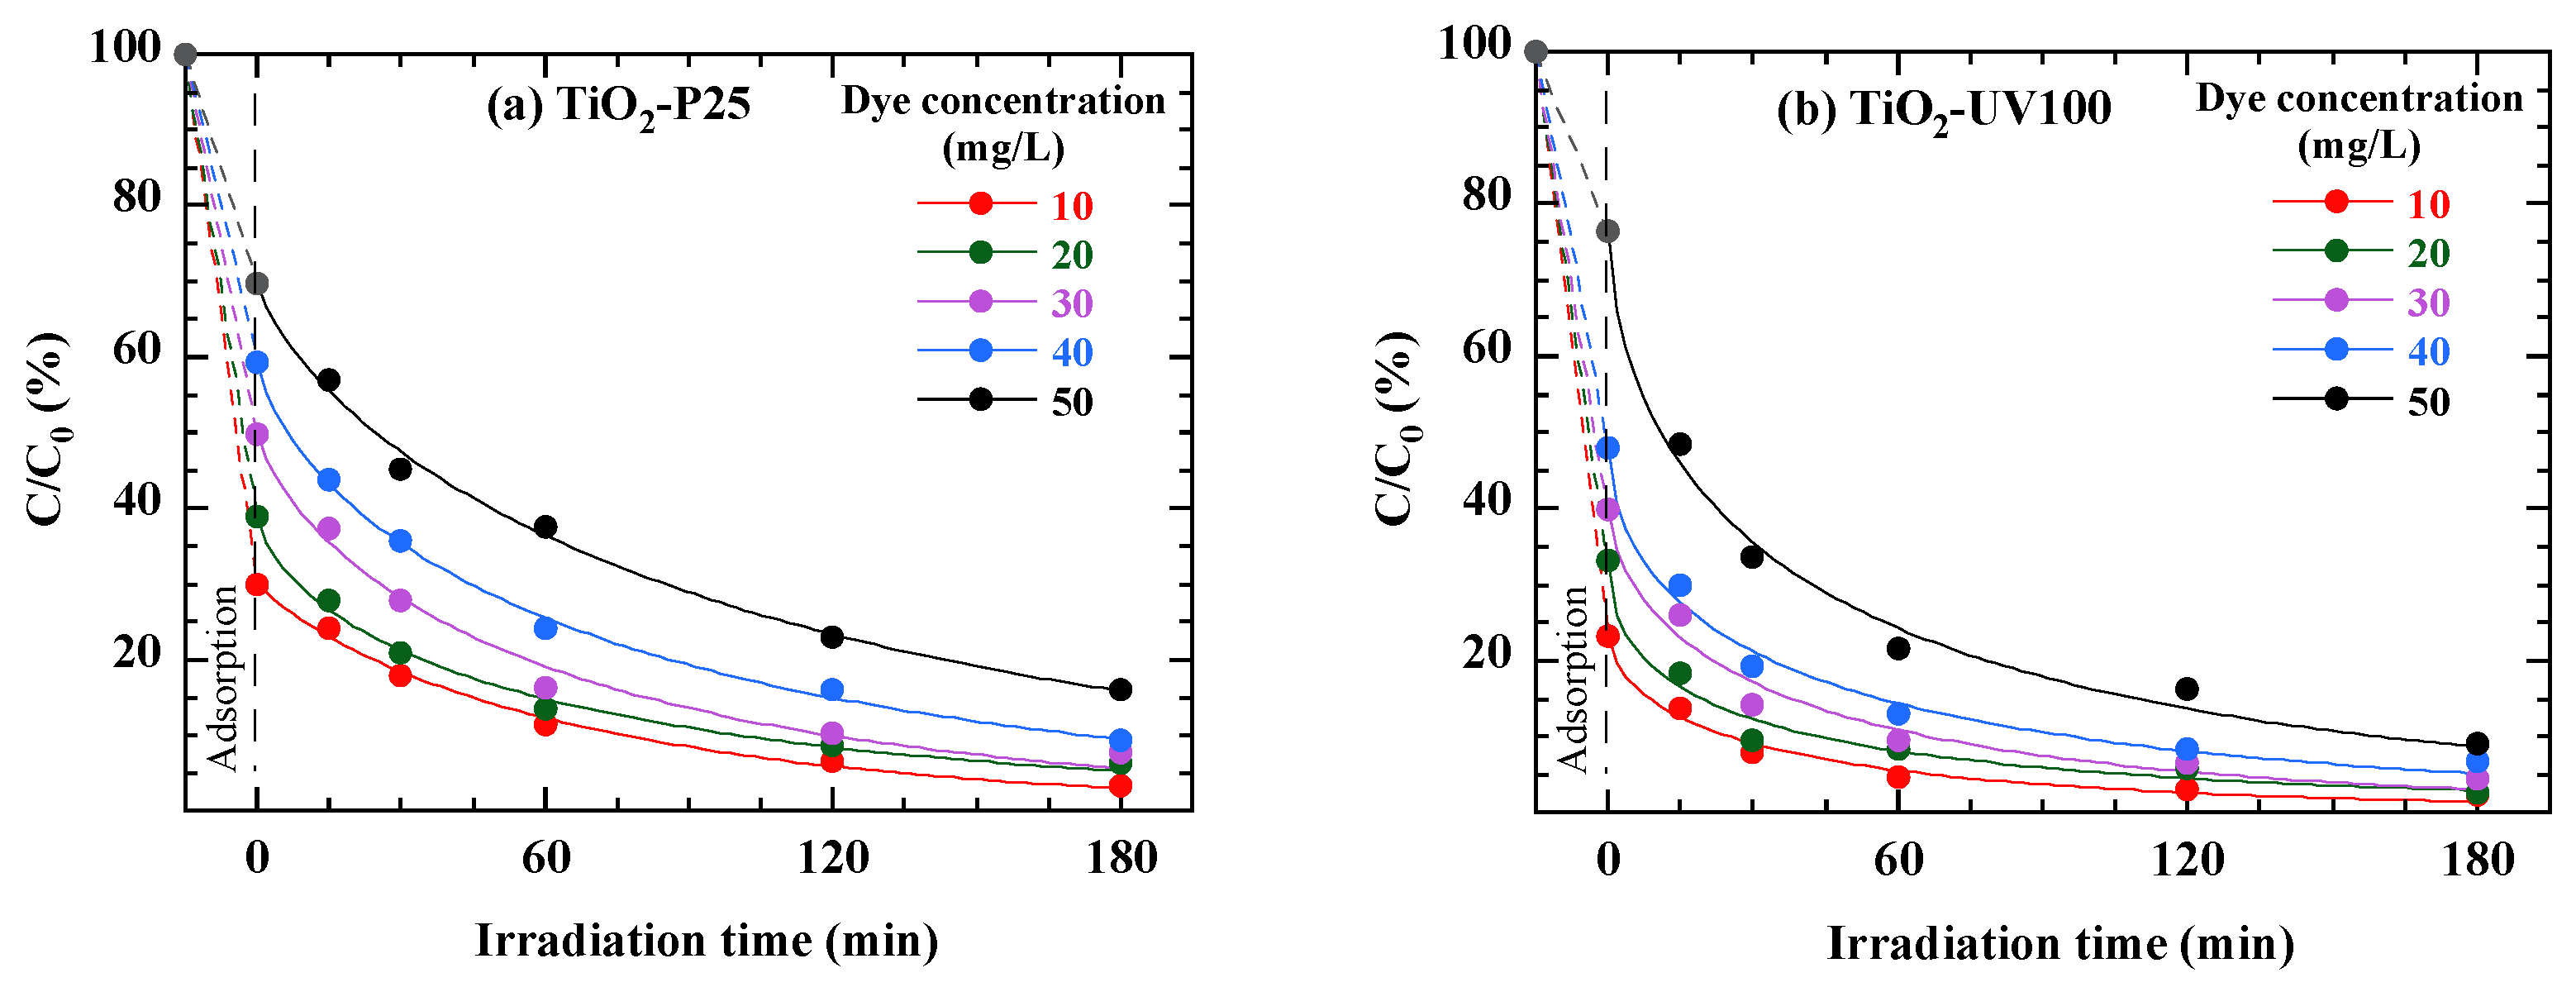
3.8. Effect of Dye Solution Concentration

The concentration of pollutants plays a crucial role in regulating the rate of photocatalytic degradation since a high concentration of pollutants prevents photons from reaching the catalyst surface, as highlighted by several works [40]. The impact of the initial pollutant concentration on dye photocatalytic activity was examined by varying the initial concentration of RB49 from 10 to 50 mg/L. The results displayed in Figure 10 correspond to the dye degradation kinetics in the presence of 1 g/L of each photocatalyst (TiO2-P25 or TiO2-UV100). After the adsorption phase, photocatalytic degradation follows quasi-first-order kinetics, characterized by a decrease in concentration as a function of irradiation time, in the form of a stretched exponential. Figure 10 shows that the higher the initial dye concentration, the longer the time required for photodegradation. These kinetics are more rapid at lower initial concentrations, consistent with the idea that at lower concentrations, the catalyst surface is less saturated, enabling better interaction between the dye and the catalyst’s active sites. Furthermore, in the presence of TiO2-UV100, when the concentration of RB49 is increased from 10 to 50 mg/L, the photocatalytic efficiency decreases from 98% to 90% after 3 h of solar irradiation (Figure 10b). Similarly, a notable reduction in photocatalytic efficiency, from 95% to 83%, is observed in the case of TiO2-P25 (Figure 10a). The results show that both catalysts, TiO2-P25 and TiO2-UV100, are effective in degrading RB49 dye under solar irradiation. However, TiO2-UV100 offers a slight advantage in terms of speed and efficiency, particularly at lower dye concentrations. This must be attributed to differences in the physical and chemical properties of the two photocatalysts, such as crystalline structure, specific surface area and adsorption capacity.

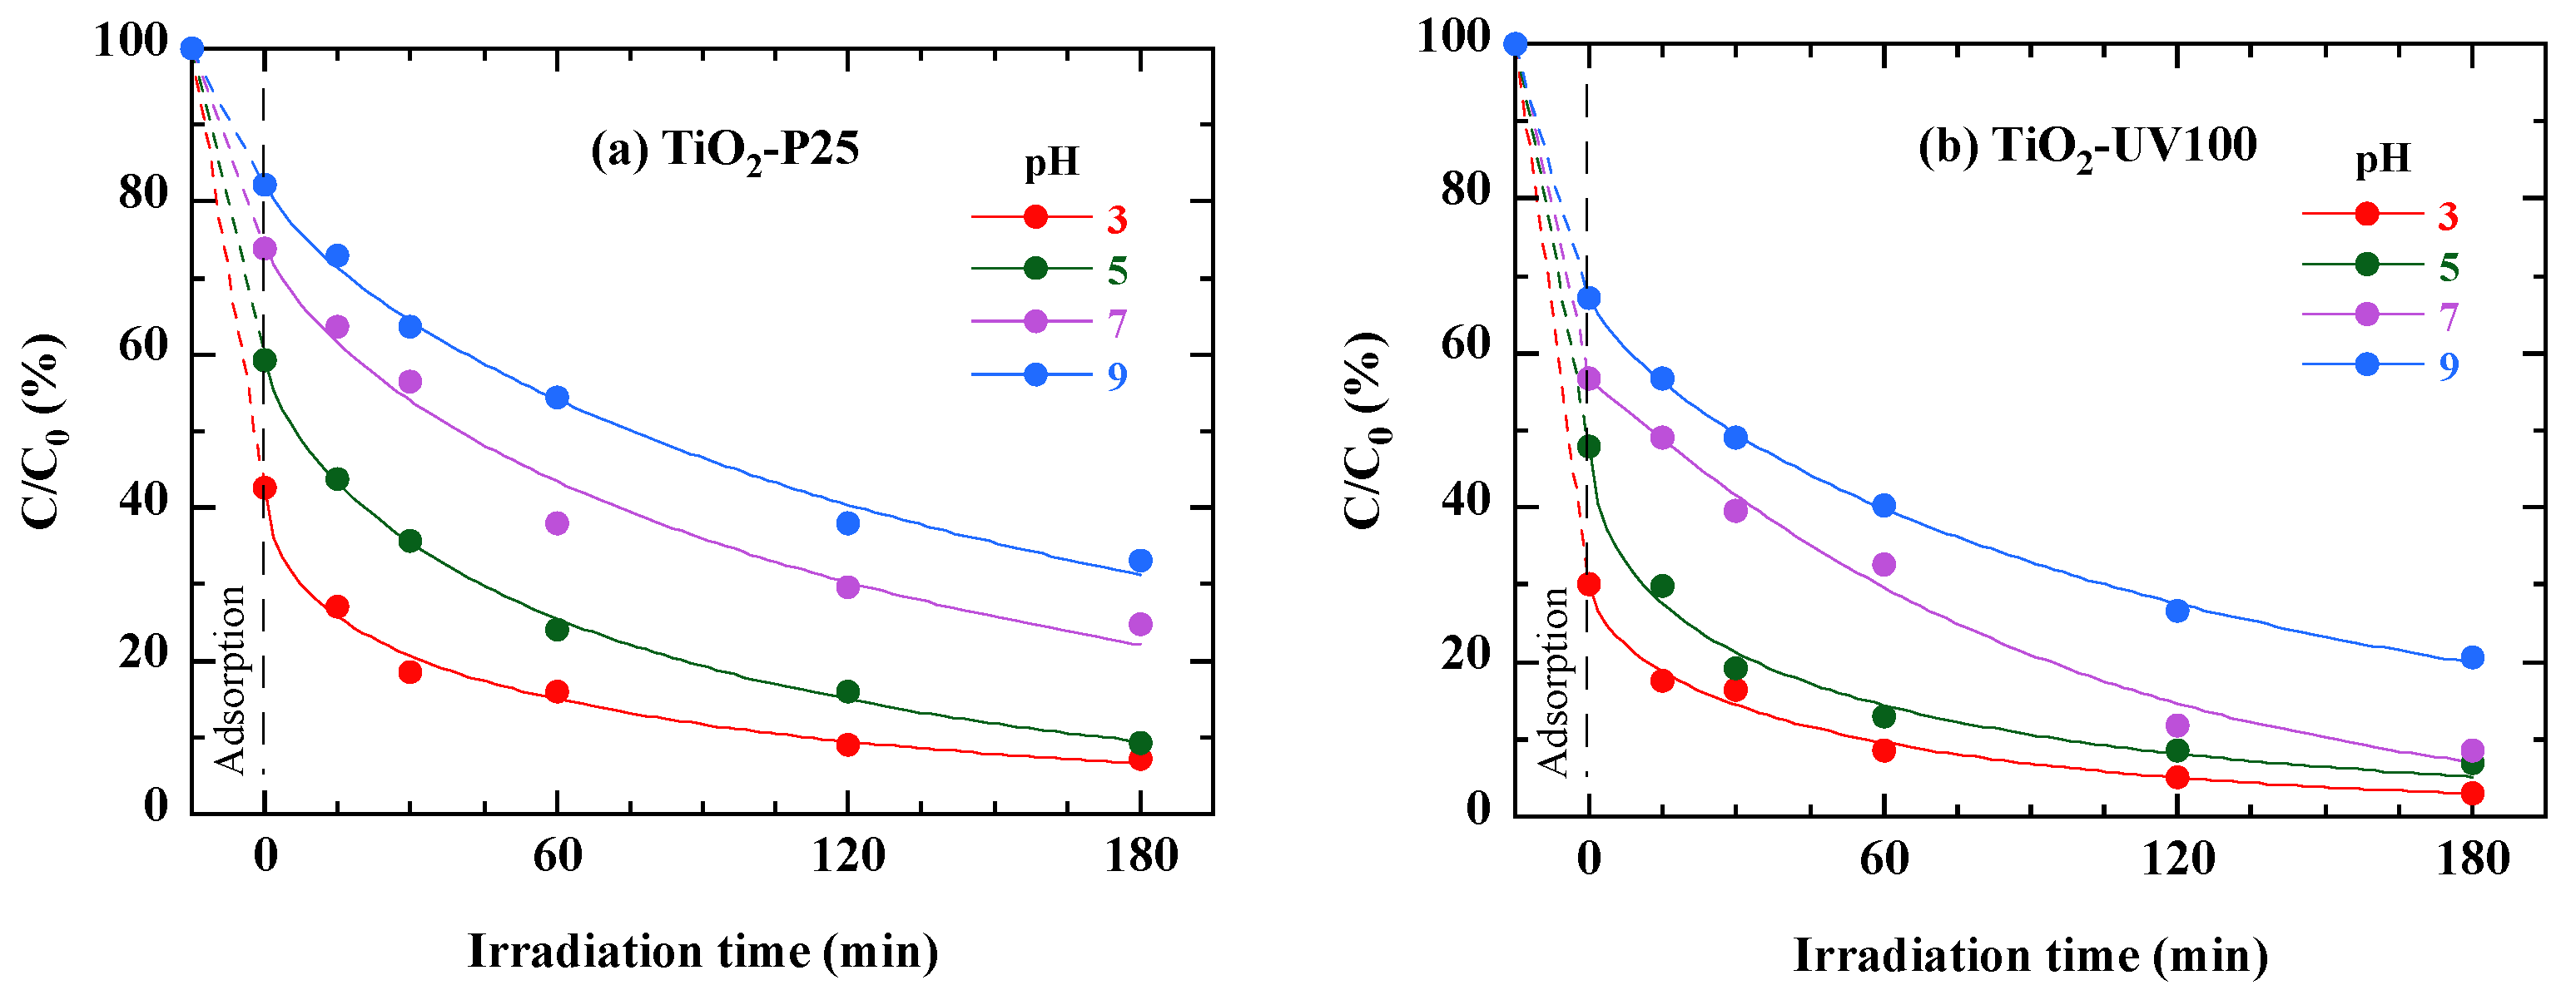
3.9. Effect of the Solution pH

The pH plays a crucial role in influencing the charging properties of the semiconductor surface [6,41]. To assess the impact of pH on the degradation and mineralization of RB49 by TiO2-P25 and TiO2-UV100, we varied the pH values (3, 5, 7 and 9). In Figure 11 is displayed the RB49 photodegradation as a function of irradiation time for different pH values. The results show that photodegradation is most effective at a slightly acidic pH for both catalysts. This observation may be attributed to the nature of the pollutant’s charges. Specifically, in the presence of TiO2-UV100, when the pH of RB49 varied from 3 to 9, the photocatalytic reaction showed a significant increase in efficiency, from 79% to 96% (Figure 11b). Similarly, a notable decrease in efficiency, from 92% to 66%, was observed for TiO2-P25 (Figure 11a). In acidic conditions, a significant adsorption of the anionic RB49 dye on the nanoparticles of the TiO2-P25 and TiO2-UV100 photocatalysts is observed, probably due to the electrostatic attraction between the positive charge of the catalysts and the negative charge of the dye [42]. However, the rate of photocatalytic degradation decreases with increasing pH, although TiO2-UV100 generally outperforms TiO2-P25.

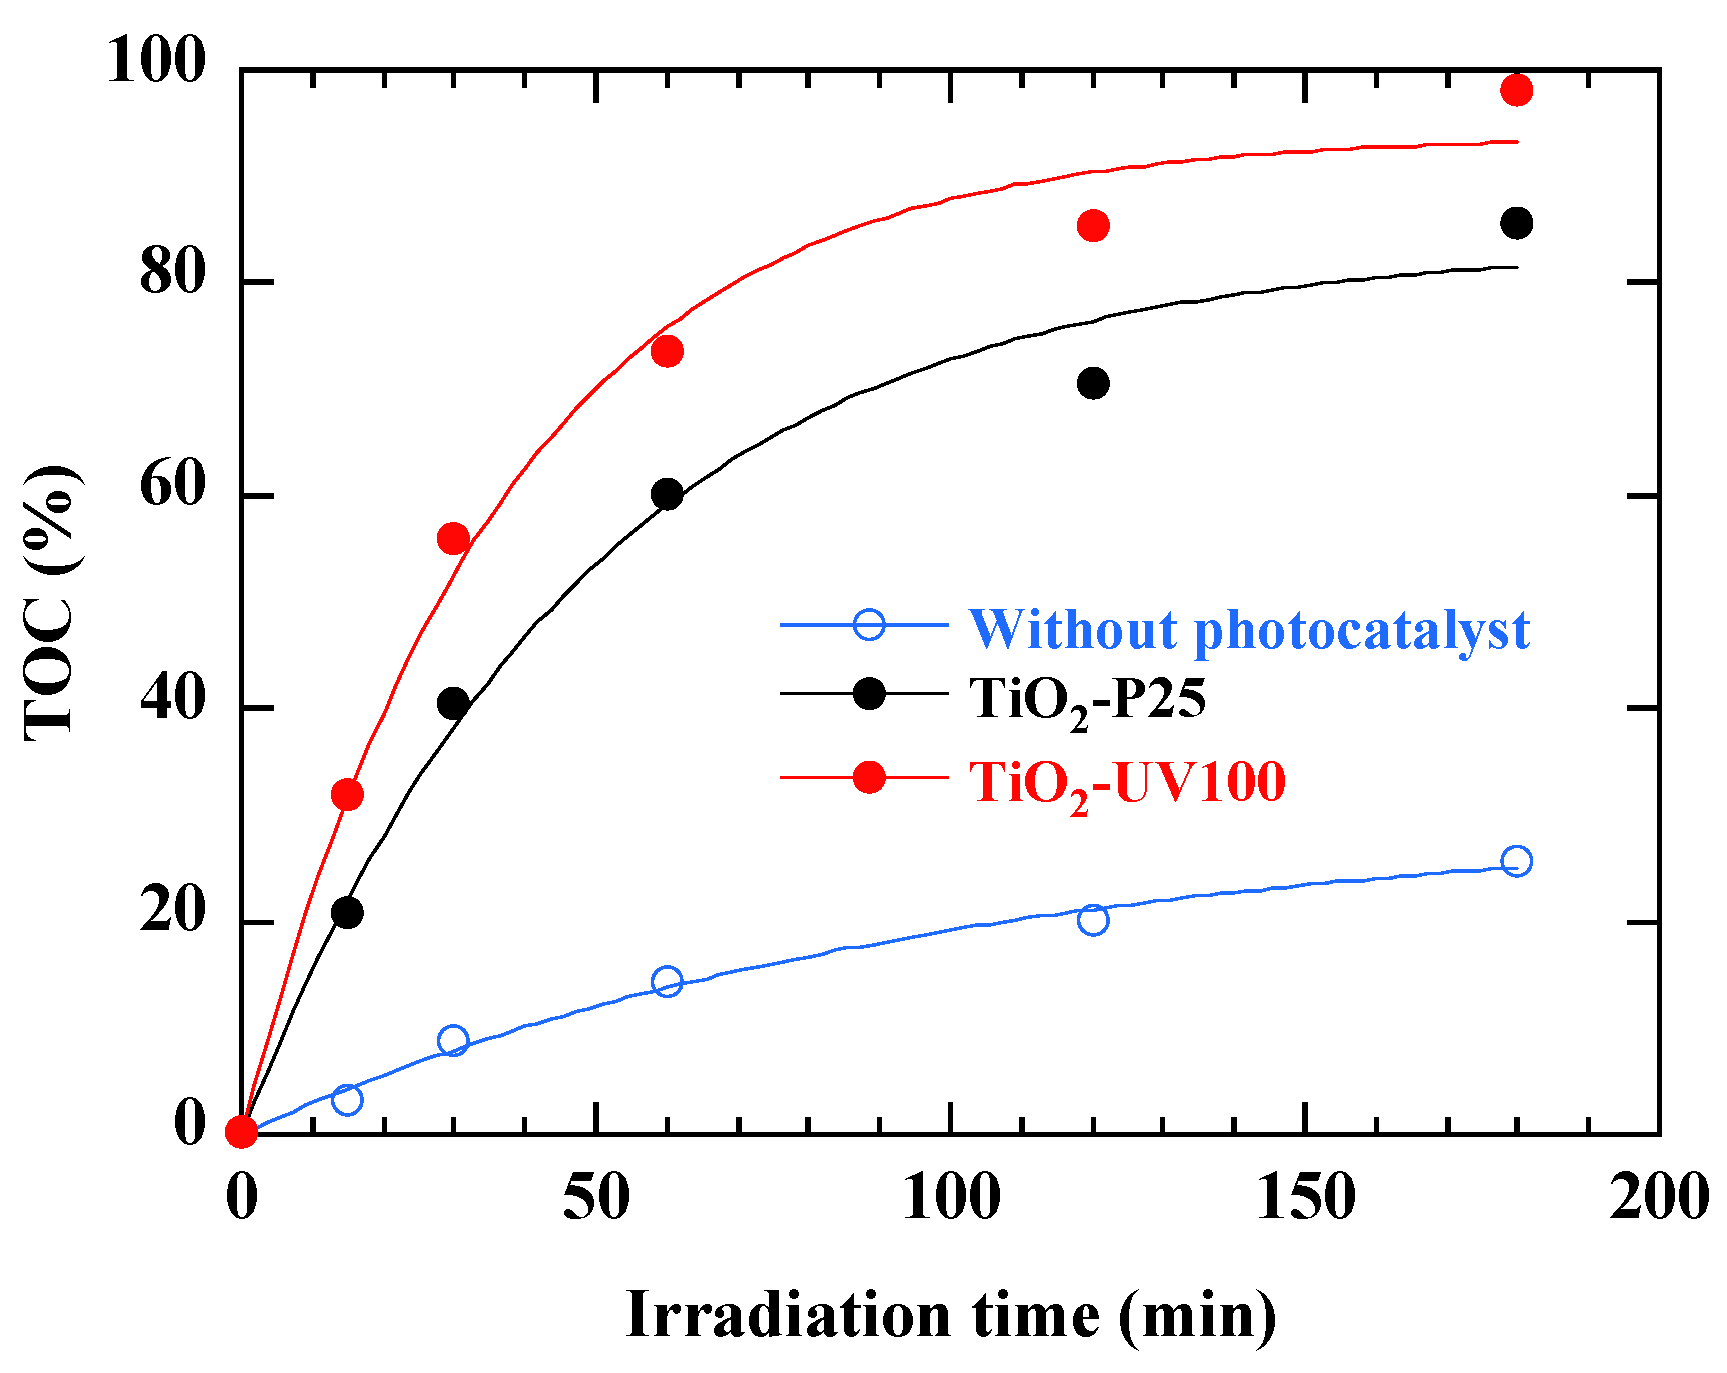
3.10. Kinetics Study of Total Organic Carbon (TOC) Removal
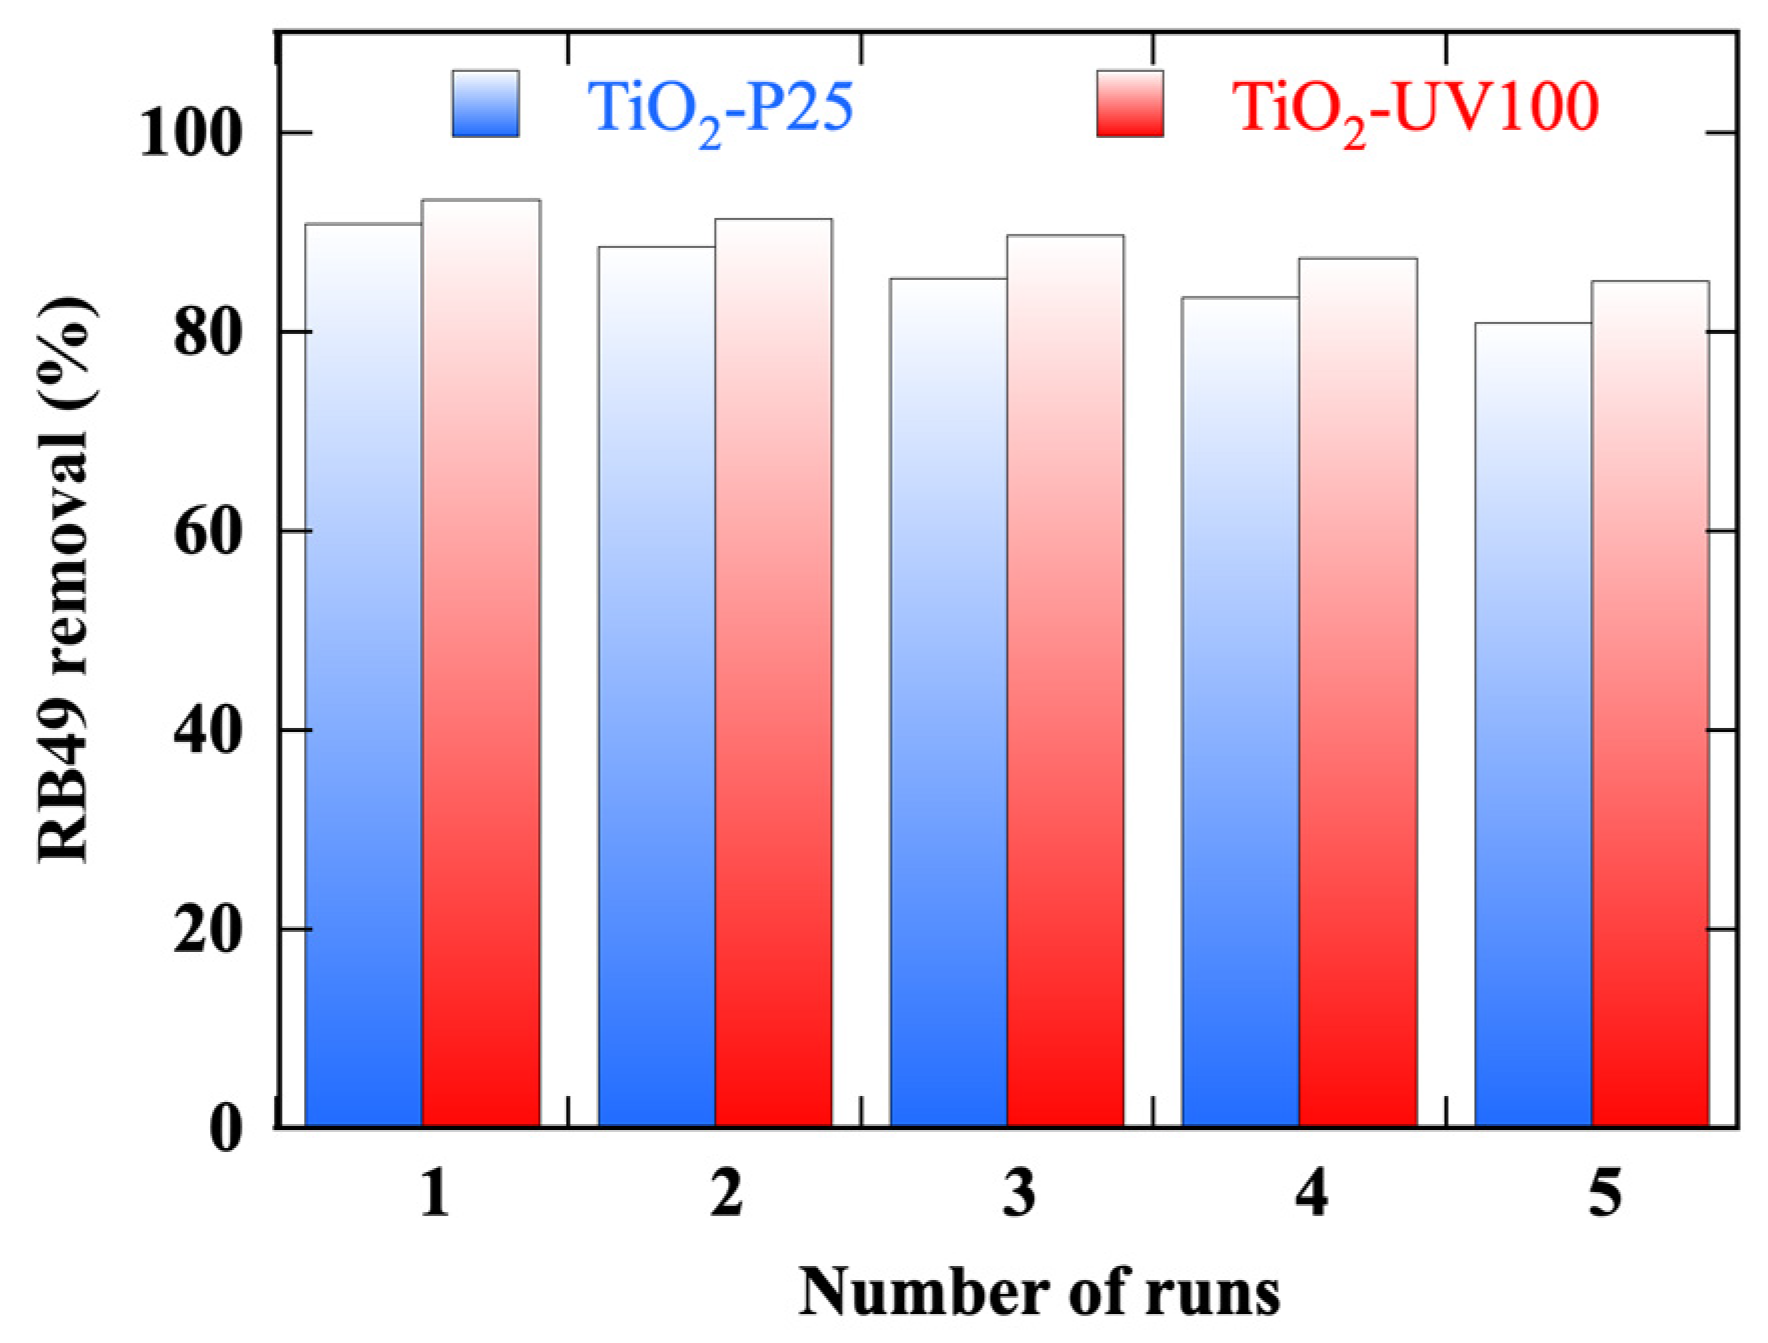
In order to monitor the evolution of the total organic carbon and nitrogen concentrations through samples taken at different time intervals during the photodegradation process, a TOC analysis was carried out. Samples were taken at the start of the experiment (t = 0) and after a 3 h reaction period (t = 180 min). These measurements are crucial in determining the mineralization efficiency of the photolysis and photodegradation process.
Analyzing the results shows a consistent superiority in total organic carbon (TOC) removal compared to RB49 alone (Figure 12). This suggests that the photodegradation process not only induces the transformation of the dye into smaller intermediates, but also promotes their subsequent mineralization into simple inorganic compounds such as carbon dioxide (CO2), water (H2O) and minerals [21]. This observation is crucial, as it implies the potential of the photocatalytic process not only in the selective degradation of specific contaminants such as RB49 but also in reducing the total concentration of organic carbon, thus approaching a more complete purification of treated water. Figure 12 highlights the fact that the addition of a TiO2-based photocatalyst significantly improves TOC reduction compared with photolysis alone. TiO2-UV100 performs slightly better than TiO2-P25 at each time interval, suggesting that TiO2-UV100 has a better catalytic capacity for the degradation of the organic compounds present in the sample analyzed [22].
Although it is difficult to compare the results of studies that have not been carried out under perfectly identical conditions, we have summarized in Table 3 the performance of the two photocatalysts that are the subject of this paper in the photodegradation of different pollutants. Our work on the photocatalysis of RB49 using TiO2-UV100 and TiO2-P25 showed degradation efficiencies of over 98% and 85%, respectively.

3.11. Reusability

The stability of photocatalytic performance and reusability are critical parameters in the selection of a photocatalyst [5]. Photodegradation experiments of the 40 mg/L RB49 solution by the two TiO2-based photocatalyst were repeated for five cycles of 3 h each. Figure 13 summarizes the results of the reuse test experiments obtained with TiO2-UV100 and TiO2-P25 under sunlight irradiation for the photodegradation of a 40 mg/L RB49 solution (pH Rb49 = 5.8):
(i)
Often, a first cycle is required as a step to activate the photocatalyst surface. In our case, both photocatalysts are activated in the first cycle.
(ii)
Over the five photocatalytic cycles, TiO2-UV100 maintains a more stable and higher-efficiency photocatalytic performance.
(iii)
After up to five cycles, there is a slight decrease in the photocatalytic efficiency of 8% for TiO2-UV100, compared to 11% for TiO2-P25.
Figure 13. Photodegradation efficiency by TiO2-P25 and TiO2-UV100 photocatalysts under solar illumination of a 40 mg/L RB49 solution (pH Rb49 = 5.8) during 5 cycles of 3 h.
Coatings 14 01270 g013

4. Conclusions

Our study demonstrates that sunlight photocatalysis, using TiO2-P25 or TiO2-UV100, is effective in treating water contamination by Reactive Blue 49, a synthetic dye that is resistant to biodegradation. This type of photocatalyst is a promising solution for reducing environmental pollution. Our results show that TiO2-UV100 exhibits higher efficiency in the degradation of RB49. The photocatalysts’ characterizations suggest that the higher efficiency of TiO2-UV100, which consists mainly of a pure anatase phase, is due to a higher specific surface area and better resistance to deactivation. The photodegradation kinetics observed do not strictly follow a first-order model. Such a discrepancy is probably due to the absorption of the dye at the photocatalyst surface, which influences the reaction dynamics, and a contribution from photolysis. TiO2-UV100 maintains a more stable and highly efficient photocatalytic performance over five photocatalytic cycles of 3 h. In conclusion, this study demonstrates the promising potential of photocatalysis for textile wastewater treatment, highlighting the importance of choosing the right type of catalyst to optimize process efficiency. The use of TiO2-UV100, in particular, could represent a significant advancement in the sustainable management of water resources and the reduction in industrial pollution. However, the use of a photocatalyst in powder form still poses the problems of recovery, cleaning and reuse.

Author Contributions

Conceptualization, F.Z.; methodology, C.H.; software, J.A.S.; validation, F.Z. and A.H.; formal analysis, M.C.; investigation, F.Z.; resources, B.H.; data curation, A.E.H.; writing—original draft preparation, K.A.; writing—review and editing, S.J.; visualization, A.E.H. All authors have read and agreed to the published version of the manuscript.

Funding

This research received no external funding.

Institutional Review Board Statement

Not applicable.

Informed Consent Statement

Not applicable.

Data Availability Statement

The data presented in this study are available upon request from the corresponding author.

Acknowledgments

This work was carried out in collaboration with the laboratory research group for chemical reactivity and photoreactivity University of A Coruña Spain, and the Centre National de la Recherche Scientifique et Technique, Morocco, with thanks on behalf of the authors.

Conflicts of Interest

The authors declare no conflicts of interest.

References

  1. Khiari, M.; Gilliot, M.; Lejeune, M.; Lazar, F.; Hadjadj, A. Effects of ag nanoparticles on zinc oxide photocatalytic performance. Coatings 2021, 11, 400. [Google Scholar] [CrossRef]
  2. Sahu, A.; Poler, J.C. Removal and degradation of dyes from textile industry wastewater: Benchmarking recent advancements, toxicity assessment and cost analysis of treatment processes. J. Environ. Chem. Eng. 2024, 12, 113754. [Google Scholar] [CrossRef]
  3. Dutta, S.; Adhikary, S.; Bhattacharya, S.; Roy, D.; Chatterjee, S.; Chakraborty, A.; Banerjee, D.; Ganguly, A.; Nanda, S.; Rajak, P. Contamination of textile dyes in aquatic environment: Adverse impacts on aquatic ecosystem and human health, and its management using bioremediation. J. Environ. Manag. 2024, 353, 120103. [Google Scholar] [CrossRef] [PubMed]
  4. Köktürk, M.; Altindağ, F.; Ozhan, G.; Çalimli, M.H.; Nas, M.S. Textile dyes Maxilon blue 5G and Reactive blue 203 induce acute toxicity and DNA damage during embryonic development of Danio rerio. Comp. Biochem. Physiol. Part C 2021, 242, 108947. [Google Scholar] [CrossRef]
  5. Khiari, M.; Lejeune, M.; Gilliot, M.; Lazar, F.; Hadjadj, A. Photocatalytic Performance of ZnO/Ag(NPs) Nanocomposite Thin Films under Natural Conditions. Coatings 2022, 12, 1782. [Google Scholar] [CrossRef]
  6. Nosaka, Y.; Nosaka, A.Y. Generation and Detection of Reactive Oxygen Species in Photocatalysis. Chem. Rev. 2017, 117, 11302–11336. [Google Scholar] [CrossRef]
  7. Abdullah, E.A. Band edge positions as a key parameter to a systematic design of heterogeneous photocatalyst. Eur. J. Chem. 2019, 10, 82–94. [Google Scholar] [CrossRef]
  8. Yu, S.; Che Mohamad, N.A.R.; Kim, M.; Nah, Y.; Marques Mota, F.; Kim, D.H. Plasmon-Enhanced Electrocatalysis, Chapter 9. In Plasmonic Catalysis: From Fundamentals to Applications; Camargo, P.H.C., Cortés, E., Eds.; Wily: Hoboken, NJ, USA, 2021; pp. 261–293. [Google Scholar] [CrossRef]
  9. Gilliot, M.; Eypert, C.; Hadjadj, A. Dielectric function of sol-gel prepared nano-granular zinc oxide by spectroscopic ellipsometry. J. Appl. Phys. 2013, 114, 183513. [Google Scholar] [CrossRef]
  10. Henderson, M.A. A surface science perspective on TiO2 photocatalysis. Surf. Sci. Rep. 2011, 66, 185–297. [Google Scholar] [CrossRef]
  11. Ajmal, N.; Saraswat, K.; Bakht, M.A.; Riadi, Y.; Ahsan, M.J.; Noushad, M. Cost-effective and eco-friendly synthesis of titanium dioxide (TiO2) nanoparticles using fruit’s peel agro-waste extracts: Characterization, in vitro antibacterial, antioxidant activities. Green Chem. Lett. Rev. 2019, 12, 244–254. [Google Scholar] [CrossRef]
  12. Nabi, G.; Majid, A.; Riaz, A.; Alharbi, T.; Arshad Kamran, M.; Al-Habardi, M. Green synthesis of spherical TiO2 nanoparticles using Citrus Limetta extract: Excellent photocatalytic water decontamination agent for RhB dye. Inorg. Chem. Commun. 2021, 129, 108618. [Google Scholar] [CrossRef]
  13. Belekbir, S.; El Azzouzi, M.; Rodríguez-Lorenzo, L.; El Hamidi, A.; Santaballa, J.A.; Canle, M. Cobalt Impregnation on Titania Photocatalysts Enhances Vis Phenol Photodegradation. Materials 2023, 16, 4134. [Google Scholar] [CrossRef] [PubMed]
  14. Alonso-Tellez, A.; Masson, R.; Robert, D.; Keller, N.; Keller, V. Comparison of Hombikat UV100 and P25-TiO2 performance in gas-phase photocatalytic oxidation reactions. J. Photochem. Photobiol. A 2012, 250, 58–65. [Google Scholar] [CrossRef]
  15. Bresolin, B.M.; Balayeva, N.O.; Granone, L.I.; Dillert, R.; Bahnemann, D.W.; Sillanpää, M. Anchoring lead-free halide Cs3Bi2I9 perovskite on UV100–TiO2 for enhanced photocatalytic performance. Sol. Energy Mater. Sol. Cells 2020, 204, 110214. [Google Scholar] [CrossRef]
  16. Doudrick, K.; Monzoόn, O.; Mangonon, A.; Hristovski, K.; Westerhoff, P.K. Nitrate reduction in water using commercial titanium dioxide photocatalysts (P25 P90, and Hombikat UV100). ASCE J. Environ. Eng. 2012, 138, 852–861. [Google Scholar] [CrossRef]
  17. Luttrell, T.; Halpegamage, S.; Tao, J.; Kramer, A.; Sutter, E.; Batzill, M. Why is anatase a better photocatalyst than rutile?—Model studies on epitaxial TiO2 films. Sci. Rep. 2015, 4, 4043. [Google Scholar] [CrossRef]
  18. Krupková, O.; Dušek, L.; Cuhorka, J.; Soares, G.; Kuchtová, G.; Mikulášek, P.; Bendová, H. Removal of textile dye reactive blue 49 from wastewater and dye baths by membrane separation and subsequent photo-Fenton reaction, UV-C and UV-C/H2O2. J. Water Process Eng. 2024, 65, 105735. [Google Scholar] [CrossRef]
  19. Zaaboul, F.; Kaichouh, G.; Haoufazane, C.; Abuelizz, H.A.; Karrouchi, K.; Zarrouk, A.; El Hourch, A. Adsorption of reactive blue day 49 from aqueous solution on commercial activated carbon and polyaniline electrochemically deposited on carbon felt: Kinetic modeling and equilibrium isotherm analysis. Int. J. Electrochem. Sci. 2024, 19, 100713. [Google Scholar] [CrossRef]
  20. Wang, X.; Pehkonen, S.O.; Rämö, J.; Väänänen, M.; Highfield, J.G.; Laasonen, K. Experimental and computational studies of nitrogen doped Degussa P25 TiO2: Application to visible-light driven photo-oxidation of As(iii). Catal. Sci. Technol. 2012, 2, 784–793. [Google Scholar] [CrossRef]
  21. Sadia, S.I.; Shishir, M.K.H.; Ahmed, S.; Aidid, A.R.; Islam, M.M.; Rana, M.M.; Al-Reza, S.M.; Alam, M.A. Crystallographic biography on nanocrystalline phase of polymorphs titanium dioxide (TiO2): A perspective static review. S. Afr. J. Chem. Eng. 2024, 50, 51–64. [Google Scholar] [CrossRef]
  22. Siah, W.R.; Lintang, H.O.; Shamsuddin, M.; Yuliati, L. High photocatalytic activity of mixed anatase-rutile phases on commercial TiO2 nanoparticles. Mater. Sci. Eng. 2016, 107, 012005. [Google Scholar] [CrossRef]
  23. Sanchez-Lorenzo, A.; Calbó, J.; Wild, M. Global and diffuse solar radiation in Spain: Building a homogeneous dataset and assessing their trends. Glob. Planet. Change 2013, 100, 343–352. [Google Scholar] [CrossRef]
  24. Kusic, H.; Koprivanac, N.; Horvat, S.; Bakija, S.; Bozic, A.L. Modeling dye degradation kinetic using dark- and photo-Fenton type processes. Chem. Eng. J. 2009, 155, 144–154. [Google Scholar] [CrossRef]
  25. Becerra-Ruiz, J.D.; Rangel-Vazquez, I.; Jauregui-Correa, J.C.; del Angel-Montes, G.A. Photo-catalytic water splitting: TiO2–GO for water splitting. In Proceedings of the CONIIN 2021—17th International Engineering Congress, Queretaro, Mexico, 14–18 June 2021. [Google Scholar] [CrossRef]
  26. Srinivasan, M.; Venkatesan, M.; Arumugam, V.; Natesan, G. Green synthesis and characterization of titanium dioxide nanoparticles (TiO2 NPs) using Sesbania grandiflora and evaluation of toxicity in zebrafish embryos. Process Biochem. 2019, 80, 197–202. [Google Scholar] [CrossRef]
  27. Huseynov, E.M.; Huseynova, E.A. Infrared spectroscopy of nanocrystalline anatase (TiO2) particles under the neutron irradiation. Opt. Mater. 2023, 144, 114351. [Google Scholar] [CrossRef]
  28. Jain, K.; Jain, S.K.; Tripathi, B. Structural, optical and morphological study of sol-gel synthesized titanium dioxide incorporated with transition metal elements (silver and cobalt). Interactions 2024, 245, 124. [Google Scholar] [CrossRef]
  29. León, A.; Reuquen, P.; Garín, C.; Segura, R.; Vargas, P.; Zapata, P.; Orihuela, P.A. FTIR and Raman characterization of TiO2 nanoparticles coated with polyethylene glycol as carrier for 2-methoxyestradiol. Appl. Sci. 2017, 7, 49. [Google Scholar] [CrossRef]
  30. Maanane, F.; El Yadini, A.; El Alouani, M.; Mabrouki, J.; Saufi, H.; Tabyaoui, M. Green Development of Titanium Dioxide Using Astragalus boeticus for the Degradation of Cationic and Anionic Dyes in an Aqueous Environment. Water 2023, 15, 3471. [Google Scholar] [CrossRef]
  31. Goñi-ciaurriz, L.; Senosiain-nicolay, M.; Vélaz, I. Aging studies on food packaging films containing β-cy-clodextrin-grafted TiO2 nanoparticles. Int. J. Mol. Sci. 2021, 22, 2257. [Google Scholar] [CrossRef]
  32. Connor, P.A.; Dobson, K.D.; James McQuillan, A. Infrared spectroscopy of the TiO2/aqueous solution interface. Langmuir 1999, 15, 2402–2408. [Google Scholar] [CrossRef]
  33. Zhang, X.; Li, X.; Zhang, Q.; Yang, J.; Deng, N. Efficient photodegradation of 4,4’-(propane-2,2-diyl)diphenol over biomolecule modified titanium dioxide under visible light irradiation. Catalys. Commun. 2011, 16, 7–10. [Google Scholar] [CrossRef]
  34. Belekbir, S.; El Azzouzi, M.; El Hamidi, A.; Rodríguez-Lorenzo, L.; Arturo Santaballa, J.; Canle, M. Improved Photocatalyzed Degradation of Phenol, as a Model Pollutant, over Metal-Impregnated Nanosized TiO2. Nanomaterials 2020, 10, 996. [Google Scholar] [CrossRef] [PubMed]
  35. Azeez, F.; Al-Hetlani, E.; Arafa, M.; Abdelmonem, Y.; Nazeer, A.A.; Amin, M.O.; Madkour, M. The effect of surface charge on photocatalytic degradation of methylene blue dye using chargeable titania nanoparticles. Sci. Rep. 2018, 8, 1–9. [Google Scholar] [CrossRef] [PubMed]
  36. Tolosana-Moranchel, A.; Montejano, A.; Casas, J.A.; Bahamonde, A. Elucidation of the photocatalytic-mechanism of phenolic compounds. J. Environ. Chem. Eng. 2018, 6, 5712–5719. [Google Scholar] [CrossRef]
  37. Salahshoor, S.; Fahes, M.; Teodoriu, C. A review on the effect of confinement on phase behavior in tight formations. J. Nat. Gas Sci. Eng. 2018, 51, 89–103. [Google Scholar] [CrossRef]
  38. Sahbaz, D.A.; Dandil, S.; Acikgoz, C. Adsorption of reactive blue 49 onto cross-linked chitosan-based composites containing waste mussel shell and waste active sludge char. Water Sci. Technol. 2021, 83, 715–726. [Google Scholar] [CrossRef]
  39. Ajmal, A.; Majeed, I.; Malik, R.N.; Iqbal, M.; Nadeem, M.A.; Hussain, I.; Yousaf, S.; Mustafa, G.; Zafar, M.I.; Nadeem, M.A. Photocatalytic degradation of textile dyes on Cu2O-CuO/TiO2 anatase powders. J. Environ. Chem. Eng. 2016, 4, 2138–2146. [Google Scholar] [CrossRef]
  40. Baral, S.C.; Maneesha, P.; Datta, S.; Dukiya, K.; Sasmal, D.; Samantaray, K.S.; Krupa, B.V.; Dasgupta, A.; Sen, S. Enhanced photocatalytic degradation of organic pollutants in water using copper oxide (CuO) nanosheets for environmental application. JCIS Open 2024, 13, 100102. [Google Scholar] [CrossRef]
  41. Kosmulski, M. The pH dependent surface charging and points of zero charge. Update. Adv. Colloid Interface Sci. 2023, 319, 102973. [Google Scholar] [CrossRef]
  42. Khan, S.; Noor, T.; Iqbal, N.; Yaqoob, L. Photocatalytic Dye Degradation from Textile Wastewater: A Review. ACS Omega 2024, 9, 21751–21767. [Google Scholar] [CrossRef]
  43. Mir, N.A.; Khan, A.; Dar, A.A.; Muneer, M. Photocatalytic study of two azo dye derivatives, ponceau bs and reactive blue 160 in aqueous suspension of TiO2: Adsorption isotherm and decolorization kinetics. IJIRSET 2014, 3, 933–9348. [Google Scholar]
  44. Velmurugan, R.; Krishnakumar, B.; Kumar, R.; Swaminathan, M. Solar active nano-TiO2 for mineralization of Reactive Red 120 and Trypan Blue. Arab. J. Chem. 2012, 5, 447–452. [Google Scholar] [CrossRef]
  45. Alahiane, S.; Qourzal, S.; El Ouardi, M.; Belmouden, M.; Assabbane, A.; Ait-Ichou, Y. Adsorption and photocatalytic degradation of indigo carmine dye in aqueous solutions using TiO2/UV/O2. J. Mater. Environ. Sci. 2013, 4, 239–250. [Google Scholar]
Figure 1. Absorbance of untreated dye solutions at different concentrations of RB49. The inset shows the calibration curve.
Coatings 14 01270 g001
Figure 2. X-ray diffraction (XRD) pattern of TiO2-P25 and TiO2-UV100.
Coatings 14 01270 g002
Figure 3. FTIR spectra of TiO2-P25 and TiO2-UV100.
Coatings 14 01270 g003
Figure 4. TiO2-P25 morphology and EDS composition.
Coatings 14 01270 g004aCoatings 14 01270 g004b
Figure 5. TiO2-UV100 morphology and EDS composition.
Coatings 14 01270 g005
Figure 6. Dye adsorption kinetics on the two photocatalysts TiO2-P25 (a) and TiO2-UV100 (b). The curves are provided as guides for the eye.
Coatings 14 01270 g006
Figure 7. Dye adsorption isotherms on both of TiO2-P25 and TiO2-UV100 photocatalysts (pH Rb49 = 5.8). The curves are the fits from Equation (4).
Coatings 14 01270 g007
Figure 8. Sunlight photodegradation of 40 mg/L RB49 solution (pH Rb49 = 5.8) without and with photocatalyst. The curves are provided as guides for the eye. Dashed lines correspond to first-order kinetics.
Coatings 14 01270 g008
Figure 9. Effect of TiO2 dosage on photodegradation of 40 mg/L RB49 solution (pH Rb49 = 5.8) by TiO2-P25 (a) and TiO2-UV100 (b). The curves are provided as guides for the eye.
Coatings 14 01270 g009
Figure 10. Concentration effect on photocatalytic degradation of 40 mg/L RB49 solution (pH Rb49 = 5.8) by 1 g/L of TiO2-P25 (a) and 1 g/L of TiO2-UV100 (b). The curves are provided as guides for the eye.
Coatings 14 01270 g010
Figure 11. Effect of pH on photodegradation of 40 mg/L RB49 solution by TiO2-P25 (a) and TiO2-UV100 (b). The curves are provided as guides for the eye.
Coatings 14 01270 g011
Figure 12. TOC percentage removal during photodegradation of 40 mg/L RB49 solution without and with photocatalyst. The curves are provided as guides for the eye.
Coatings 14 01270 g012
Table 2. Langmuir parameters of adsorption isotherms of Figure 7.
ParameterTiO2-P25TiO2-UV100
qm (mg/g)51 ± 2103 ± 1
KL (L/mg)0.023 ± 0.0060.010 ± 0.002
Table 3. Photocatalytic performance of TiO2-P25 and TiO2-UV100 in some other works.
PhotocatalystPollutantIrradiationDurationEfficiencyRef.
TiO2-P252,4-dichlorophenoxyacetic acidUV60 min83%[22]
Reactive Blue 160UV-light20 min70.04%[43]
Ponceau BSUV-light15 min82.04%[43]
Red 120Sunlight90 min81%[44]
RB49Sunlight180 min85%This study
TiO2-UV1002,4-dichlorophenoxyacetic acidUV60 min73%[22]
Reactive Blue 160UV20 min63.78%[43]
Ponceau BSUV15 min75.49%[43]
Indigo CarmineUV330 min80%[45]
RB49Sunlight180 min98%This study
Disclaimer/Publisher’s Note: The statements, opinions and data contained in all publications are solely those of the individual author(s) and contributor(s) and not of MDPI and/or the editor(s). MDPI and/or the editor(s) disclaim responsibility for any injury to people or property resulting from any ideas, methods, instructions or products referred to in the content.

