Abstract
Coatings are essential for protecting steel structures from corrosion and mechanical stresses, especially under challenging environmental conditions. To this end, this study systematically examines the effects of temperature (−20 °C to 50 °C), strain rate (6.67 × 10⁻⁴ s−1 to 1.67 × 10⁻² s−1), and intermediate coat thickness (140 μm to 700 μm, the layer between the primer and topcoat) on the uniaxial tensile properties of heavy-duty coatings for steel structures. Experimental and theoretical analyses were conducted to quantitatively assess the influence of these factors on the mechanical properties of the coatings. A multifactor constitutive model was developed based on the Sherwood–Frost model by integrating material characteristics and fitting experimental data, incorporating response functions for temperature, strain rate, and intermediate coat thickness. The results reveal that increased temperature causes temperature-induced softening, while higher strain rates lead to strain rate-dependent strengthening of the coatings. In contrast, the effect of layer thickness on mechanical properties follows a non-monotonic trend, influenced by the structural and material characteristics of the coatings, with the most significant mechanical response occurring at 560 μm thickness. These findings suggest that optimal coating design must consider multiple factors to enhance mechanical performance. Additionally, the correlation coefficients (r) between the model predictions and experimental results are 0.97 or higher, indicating the model’s effectiveness in predicting and optimizing the mechanical performance of heavy-duty coatings under complex conditions.
1. Introduction
Coatings play a crucial role in the corrosion protection of steel structures, not only effectively resisting corrosion but also accommodating substrate deformation and withstanding external loads. Among these, organic coatings are currently the most widely used and effective technology for the corrosion protection of steel structures. Heavy-duty coatings, which typically consist of a primer, an intermediate coat, and topcoats made from composite polymeric materials, are particularly representative [1,2,3]. Despite the significant role that coatings play in protecting steel structures from corrosion, they face several challenges in real-world applications. When steel structures are exposed to extreme temperature fluctuations, intense ultraviolet radiation, and marine environments over prolonged periods, the coatings are prone to degradation due to thermal stress, aging, and corrosion. This degradation can result in coating peeling and performance deterioration, which may subsequently lead to a decline in the structural performance of the steel and potential structural damage, posing significant safety and economic risks [4,5,6,7]. Therefore, understanding the comprehensive physical, chemical, and mechanical properties of coatings is essential to ensure the long-term protection of steel structures.
The challenges and solution strategies relating to steel structure coatings, which are a special class of polymer materials, such as epoxy or polyurethane, are closely related to a wide range of polymer material fields. Therefore, research relating to polymer materials can provide an important theoretical foundation and serve as a reference for analyzing and improving the performance of steel structure coatings. In terms of mechanical properties, scholars like Hesp, Zhang, and Sharma [8,9,10] have demonstrated that temperature and loading rate significantly affect the mechanical response of polymer-modified asphalt, glass fiber-reinforced composites (FRP), and titanium-based fiber-metal laminates (FMLs). In addition to temperature and loading rate, Amjadi et al. [11] also investigated the effect of thickness and processing technology on the tensile behavior of high-density polyethylene (HDPE) in conjunction with the material’s own properties. Hwang et al. [12] chose density, temperature, and impact energy as the variables to conduct a series of drop impact tests on polyurethane foams (PUF) and investigated the effects of each variable on their dynamic behavior. Saha et al. [13] investigated the effects of foam density, foam microstructure and strain rate on peak stress and energy absorption based on the quasi-static compression testing of polymer foams. Chen et al. [14] investigated the effects of the peel layer and cooling rate on the tensile properties of Al/Gf/PP laminates prepared via hot pressing based on the characteristics of the material processing process. In terms of constitutive modeling, most of the existing studies focus on the establishment of macroscopic models. Building on the integral power model proposed by Schwaber et al. [15], Sherwood and Frost [16] developed a uniaxial compression constitutive model for foam materials, taking into account density, temperature, and strain rate. Based on uniaxial and biaxial testing of polyvinyl chloride (PVC), Dinh et al. [17] proposed a uniaxial compression constitutive model. Jekel et al. [18] proposed a multiparameter elastic–plastic constitutive model for PVC-coated polyester fabrics based on 45° off-axis tests. Yanbo et al. [19] proposed a nonlinear infra-elastic orthotropic anisotropic constitutive model for PVC-coated polyester fabrics based on the ideal elastic–plastic constitutive model and the Mises yield criterion. A nonlinear infra-elastic orthotropic anisotropic constitutive model was proposed for PVC-coated polyester fabrics using the stress–strain increment theory to propose a dynamic constitutive model for high-density RPUF.
However, most existing studies focus primarily on the basic properties of coatings, such as impact damage, adhesion, and fatigue failure [20,21,22]. Experimental research on their elastic and plastic properties, as well as the relationship between temperature and material performance, is relatively limited. Moreover, the majority of studies concentrate on coated fabric membranes and single-layer coatings [23,24], with relatively few investigations on multi-layer steel structure coatings. Systematic studies on the mechanical properties and constitutive models of coatings under extreme temperatures and high strain rates are also scarce. Therefore, this study combines experimental and theoretical analysis, using multiple variables such as temperature, strain rate, and intermediate coating thickness to systematically investigate the mechanical properties of heavy-duty anti-corrosion coatings. Through these studies, we aim to uncover the intrinsic mechanisms of the material’s mechanical behavior and develop a macroscopic constitutive model suitable for engineering applications. This will provide new theoretical insights and data support for the design, performance evaluation, and life prediction of steel structure coatings.
2. Experimental Section
2.1. Experimental Materials
The experimental coating consists of an epoxy zinc-rich primer, an epoxy mica iron oxide thick paste intermediate coat, and a fluorocarbon topcoat. The coatings discussed in this study were manufactured by Northwest Yongxin Coatings Co., Ltd. (Lanzhou, China). The detailed compositions and physical parameters of each individual coating are provided in Table 1 and Table 2.

Table 1.
Experimental coating components.
Table 2.
Physical parameters of materials.
2.2. Experimental Setup and Procedures
2.2.1. Experimental Conditions
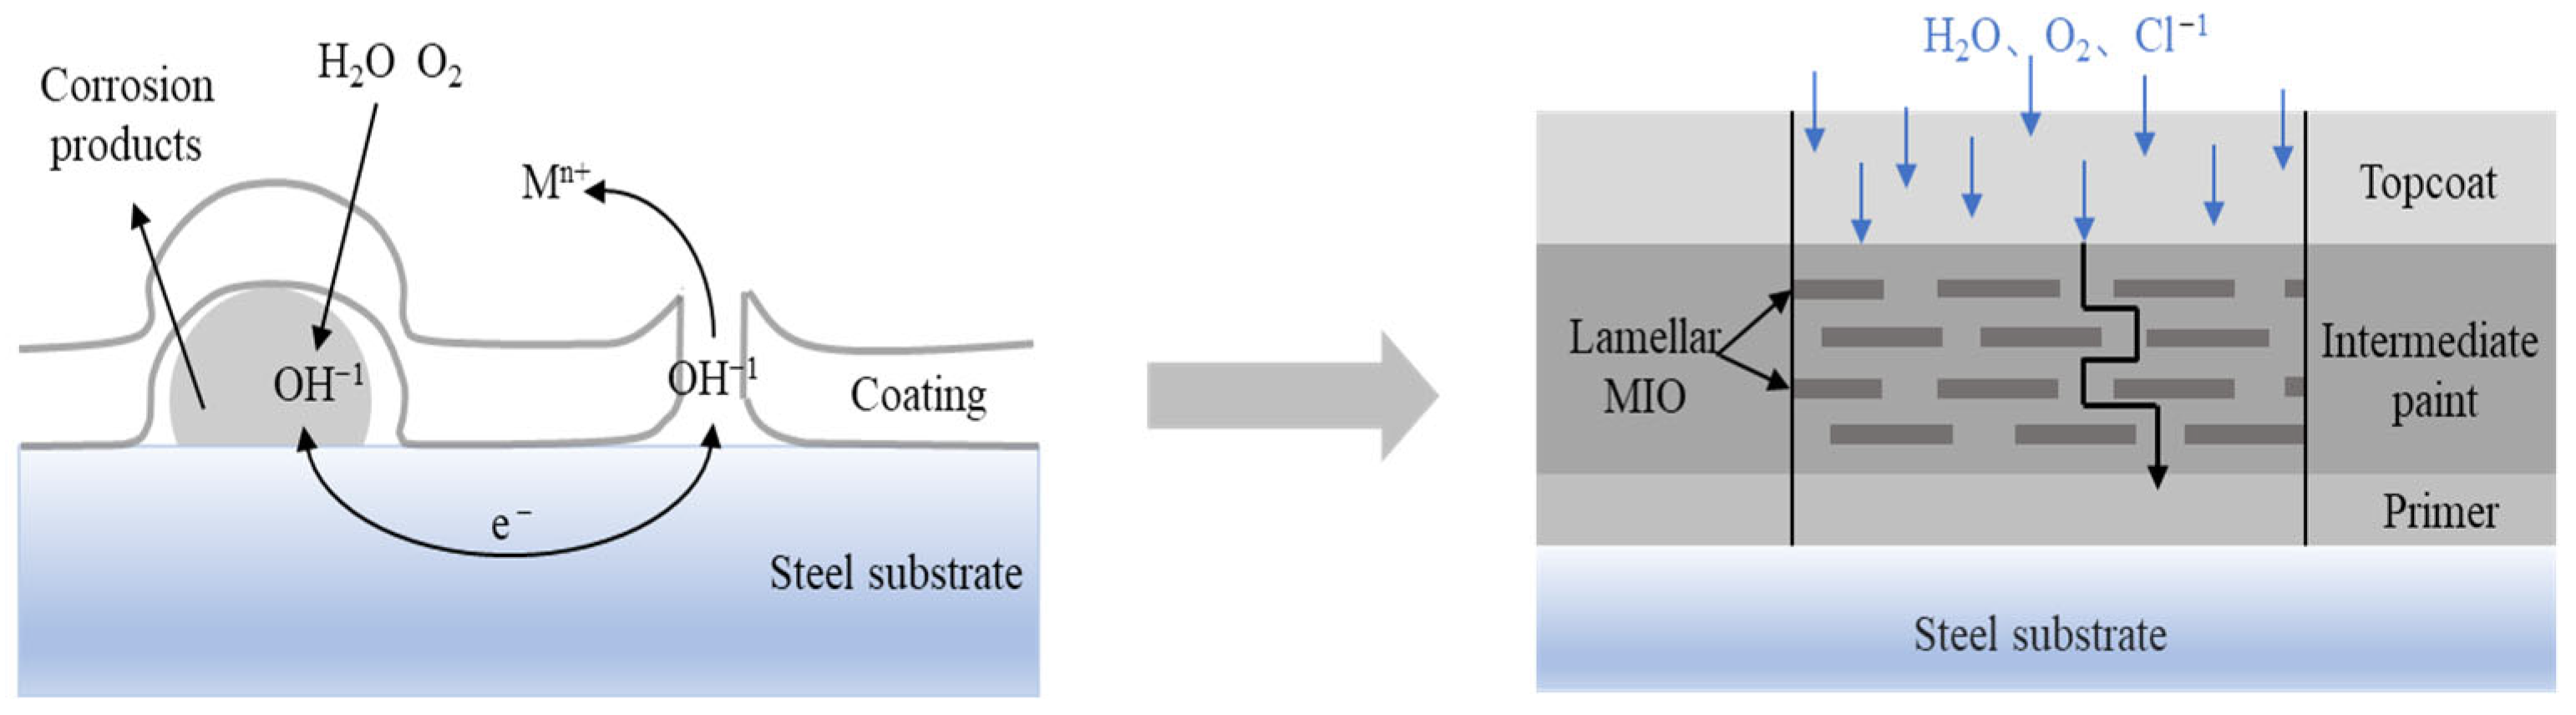
The mechanical properties of polymer materials are the macroscopic manifestations of various molecular interactions within them. Temperature affects the rate and intensity of molecular motion, which is the main factor affecting the mechanical properties of polymers [25]. Additionally, since polymers are viscoelastic materials, their mechanical properties are also influenced by the stretching rate. This influence is due to the fact that their destruction is a relaxation process, and the extent to which the relaxation time of chain segment motion matches the tensile rate determines the mechanical response of the material [11]. For heavy-duty coatings on steel structures, which are a special class of polymer material, temperature and tensile rate equally affect their mechanical properties. Common forms of coating failure include blistering and peeling, and the thickness of coatings with multilayer structures plays a key role in erosion resistance. Particularly, the intermediate coat not only increases the total thickness of the coating to shield against corrosive media [26], but also the interlocking layers of mica iron oxide (MIO) in the epoxy thick paste MIO intermediate coat effectively block the penetration of water, oxygen molecules, and electrolytes, providing superior protection [27]. Therefore, in this study, the thickness of the intermediate coat was set as a potential influencing factor to investigate whether it also affects the mechanical properties of the coating (Figure 1).
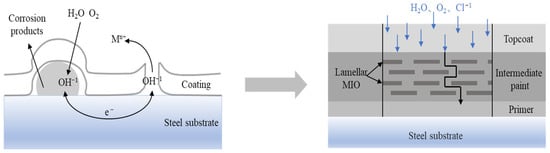
Figure 1.
Coating failure forms and anti-corrosion mechanisms.
Based on the above analyses of the material properties of polymers and the role of single coatings in composite coatings, three independent variable factors were identified: temperature, tensile rate, and intermediate coat thickness. According to the actual service environments of heavy-duty coatings for steel structures, and with reference to key standards, such as ISO 12944 [28] (corrosion protection for steel structure protective coating systems), JT/T 722-2008 [29] (technical conditions for anti-corrosion coatings on highway bridges), and ISO 527-3:2018 [30] (determination of tensile properties of plastics), the room temperature was set (20 °C) and a tensile rate of 2 mm/min was used along with the following coating system parameters: a primer thickness of 60 μm, an intermediate coat thickness of 280 μm (140 μm per layer for 2 layers), and a topcoat thickness of 160 μm (80 μm per layer for 2 layers). These were used as the standard experimental conditions. The experimental temperature range was set from −20 to 50 °C, with a tensile rate range from 2 to 50 mm/min and an intermediate coat thickness range from 140 μm to 700 μm, with 280 μm used as the baseline for increases or decreases of 140 μm. The specific experimental conditions are presented in Table 3. The specific experimental conditions are shown in Table 3, with tensile rates of 2, 5, 10, 20, and 50 mm/min corresponding, respectively, to strain rates of 6.67 × 10⁻⁴, 1.67 × 10⁻³, 3.3 × 10⁻³, 6.67 × 10⁻³, and 1.67 × 10⁻² s−1.
Table 3.
Test conditions.
2.2.2. Coating Preparation
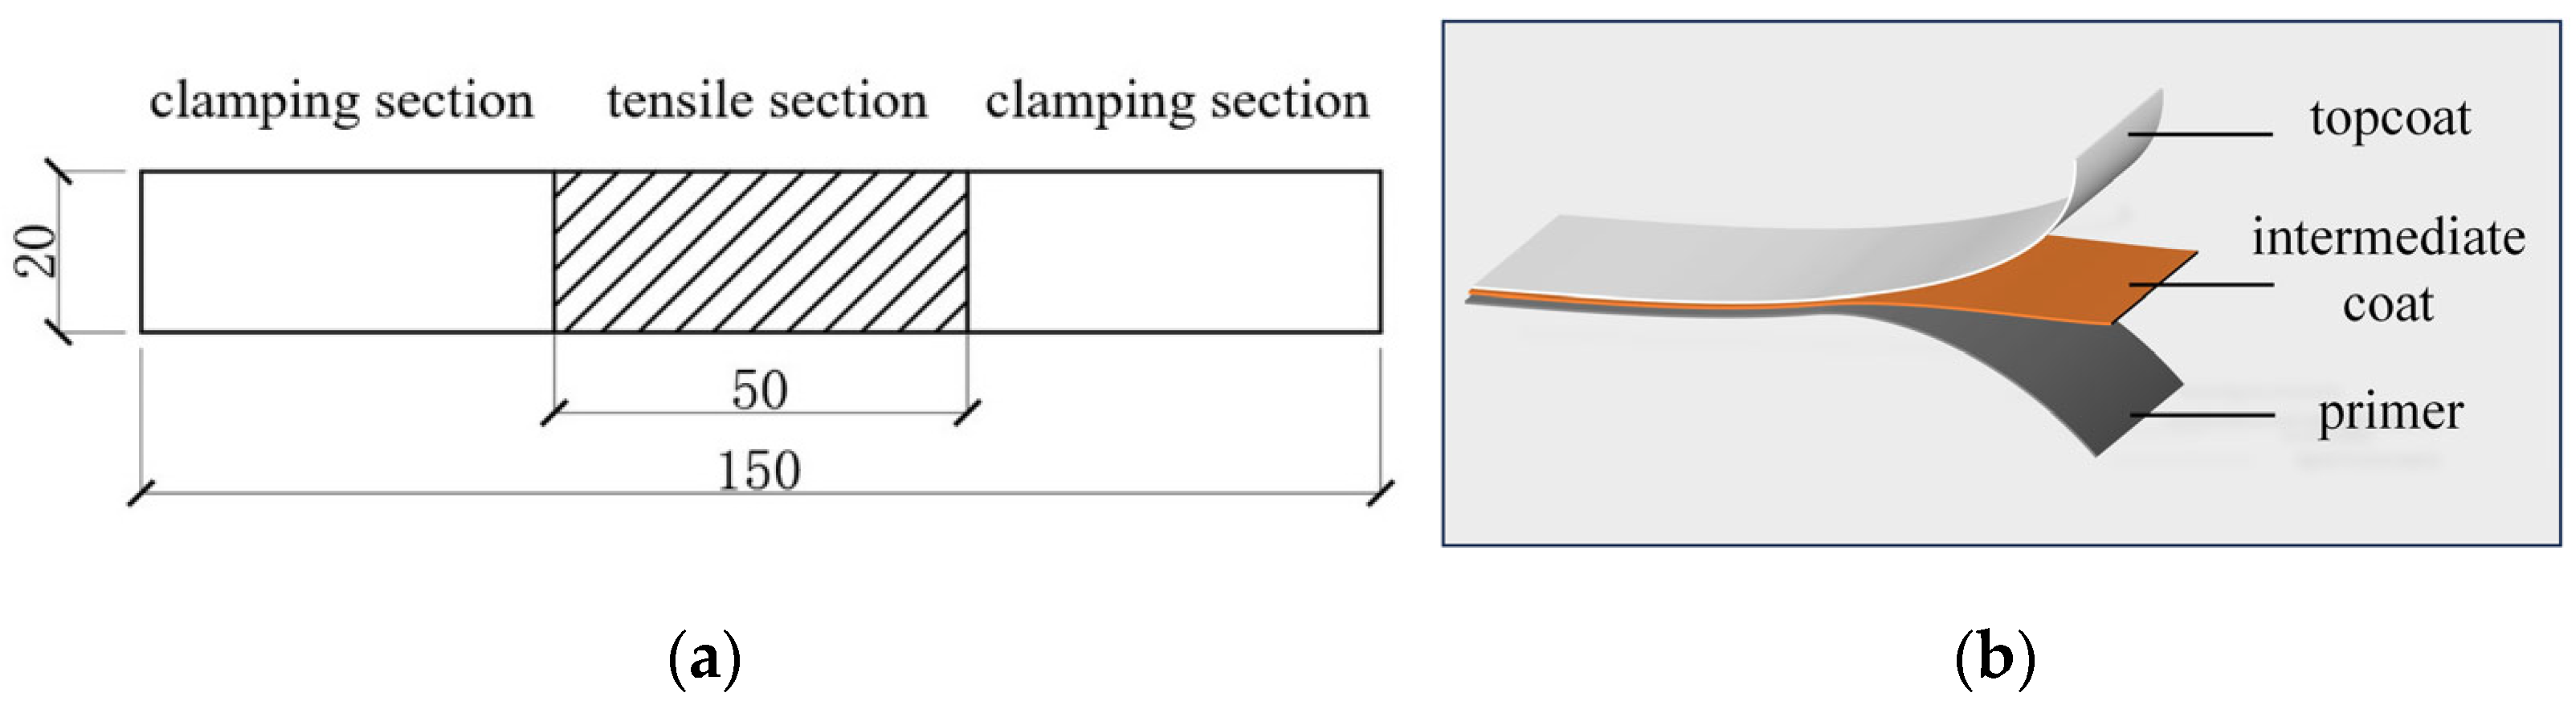
Based on the solid content of the individual coatings presented in Table 2 and the dry film thickness shown in Table 3, the wet film thickness presented in Table 4 was calculated. Components A and B of the paint were mixed at a low speed at the ratio shown in Table 1 and then left to stand for 1~3 min to eliminate bubbles. The KTQ-III magnetic adjustable coater was adjusted to the corresponding thickness for film preparation. During preparation, the primer was applied first, and the surface drying time of the primer for a dry film thickness of 25 ± 2 µm, as per Table 2, was calculated to determine the time required for the primer to dry. After the primer surface dried completely, the intermediate and topcoats were applied in sequence. The surface drying time for all coatings was calculated using the same method, and the calculated surface drying times are listed in Table 4. During the preparation of all layers, multiple applications were made at the minimum thickness to ensure the stability and uniformity of the coating material. After preparation, the coatings were cured for 4 days in a CABR-MCB artificial climate simulation test box at an environmental temperature of (23 ± 2) °C and a relative humidity of (50 ± 5)%, and then demolded and cured face-down for 3 days, totaling 7 days. After curing, the film was cut into specimens with a total length of l = 150 mm, a width of b = 20 mm, a clamping end length of l’ = 50 mm, and an effective stretching length of l0 = 50 mm, as shown in Figure 2. The thickness of the prepared coating was measured using a UEE920 high-precision coating thickness gauge, with three points measured within the gauge length of each specimen, taking the arithmetic mean and controlling the error within 5%.
Table 4.
Test piece preparation parameters.
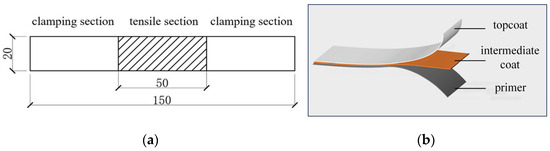
Figure 2.
Tensile sample: (a) dimensions of the tensile sample(mm); (b) composition of the tensile sample.
2.2.3. Tensile Test
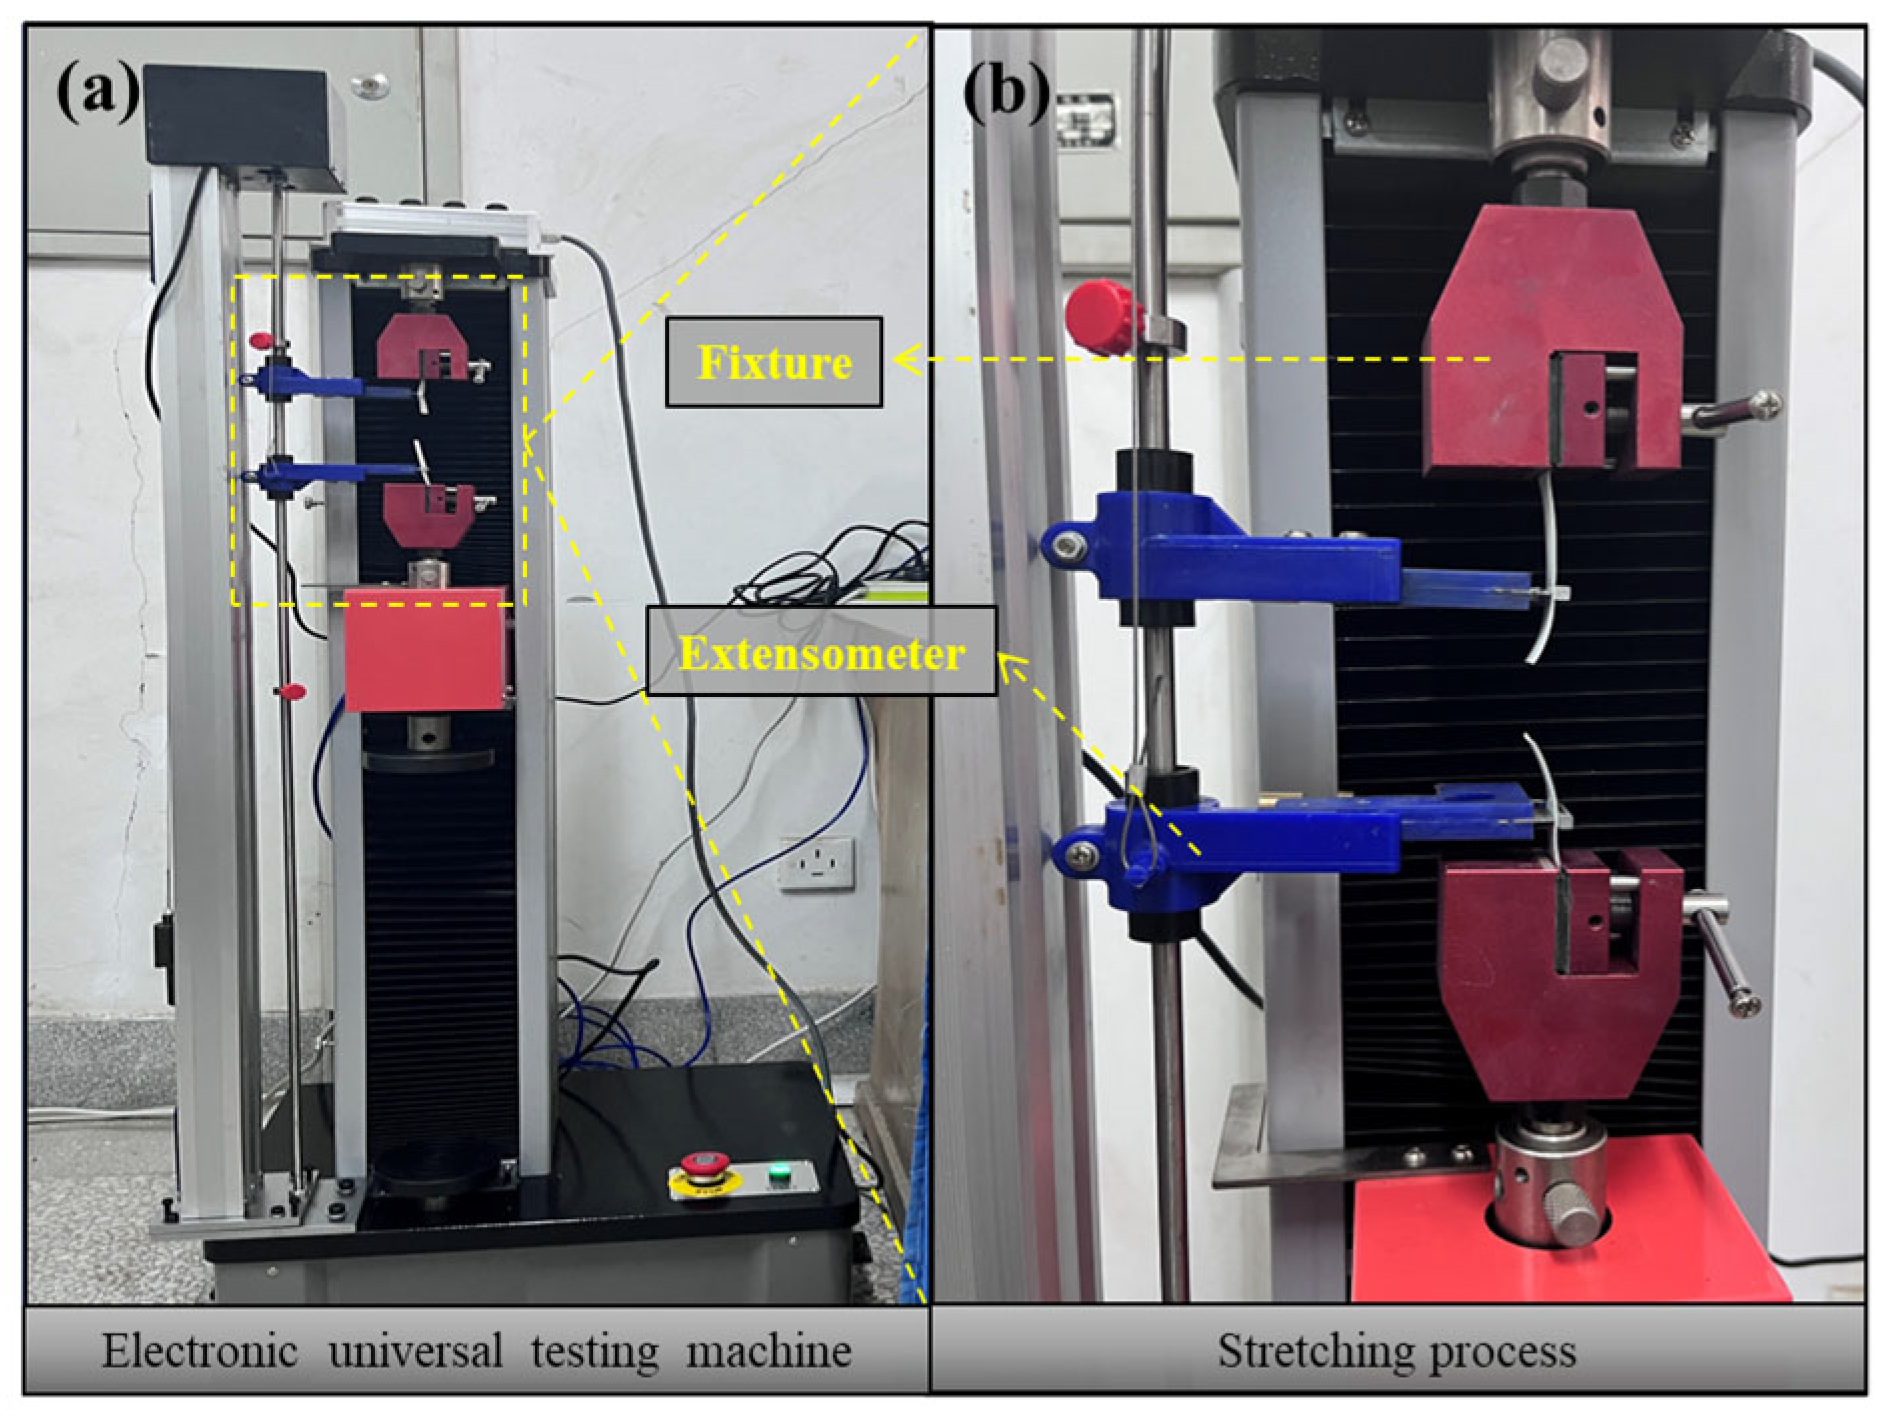
When the tensile rate was variable, the temperature was kept at 20 °C, and the coating-matching program of primer 60 μm + intermediate coat 280 μm + topcoat 160 μm was unchanged. Then, the specimens were subjected to uniaxial stretching with the WDW-05 microcomputer-controlled electronic universal testing machine after controlling for different rates on the microcomputer. When the temperature was variable, the coating matching program was set to primer 60 μm + intermediate coat 280 μm + topcoat 160 μm, and after maintenance, the specimen was placed in an artificial climate simulation test chamber at −20, 0, 40, and 50 °C for 1 h. Then, a uniaxial tensile test was immediately carried out at a rate of 2 mm/min. When the thickness was variable, the thickness of the intermediate coat was controlled at 140 μm, 280 μm, 420 μm, 560 μm, and 700 μm during mold making, and uniaxial stretching was carried out at a rate of 2 mm/min at a temperature of 20 °C after maintenance. The specimens should be inspected before stretching, and a low magnifying glass can be used to check whether the specimens have smooth edges without gaps and whether there is obvious blistering on the surface, meaning that any defective specimens can be removed. Then, the specimen was placed in the two fixtures of the testing machine. The longitudinal axis of the specimen was made to coincide with the center line of the upper and lower fixtures, and they were loosened and tightened appropriately to prevent the specimen from slipping off and breaking in the fixtures. Moreover, the measurement points on both sides of the extensometer were adjusted to coincide with the specimen’s marking distance; the extensometer should not subject the specimen to load. When stretching, the center line in the length direction of the specimen should be kept in line with the center of the tester fixture. If the fracture surface of the specimen appears near the fixture port after the specimen is pulled off, a spare part shall be used to make up for it. The averages of the stress–strain values of 10 specimens were taken as the result of a set of tests. The absolute error between each measured value and the average value should not exceed 5 percent. If a measured value exceeds this threshold, it should be removed and made up with spare parts. The experimental equipment and procedures are shown in Figure 3 and Figure 4.
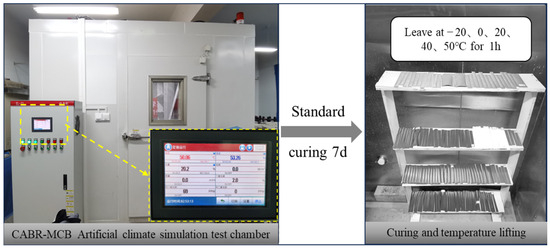
Figure 3.
Climate simulation chamber and test process.

Figure 4.
Electronic universal testing machine.
3. Results and Discussion
3.1. Standard Experimental State
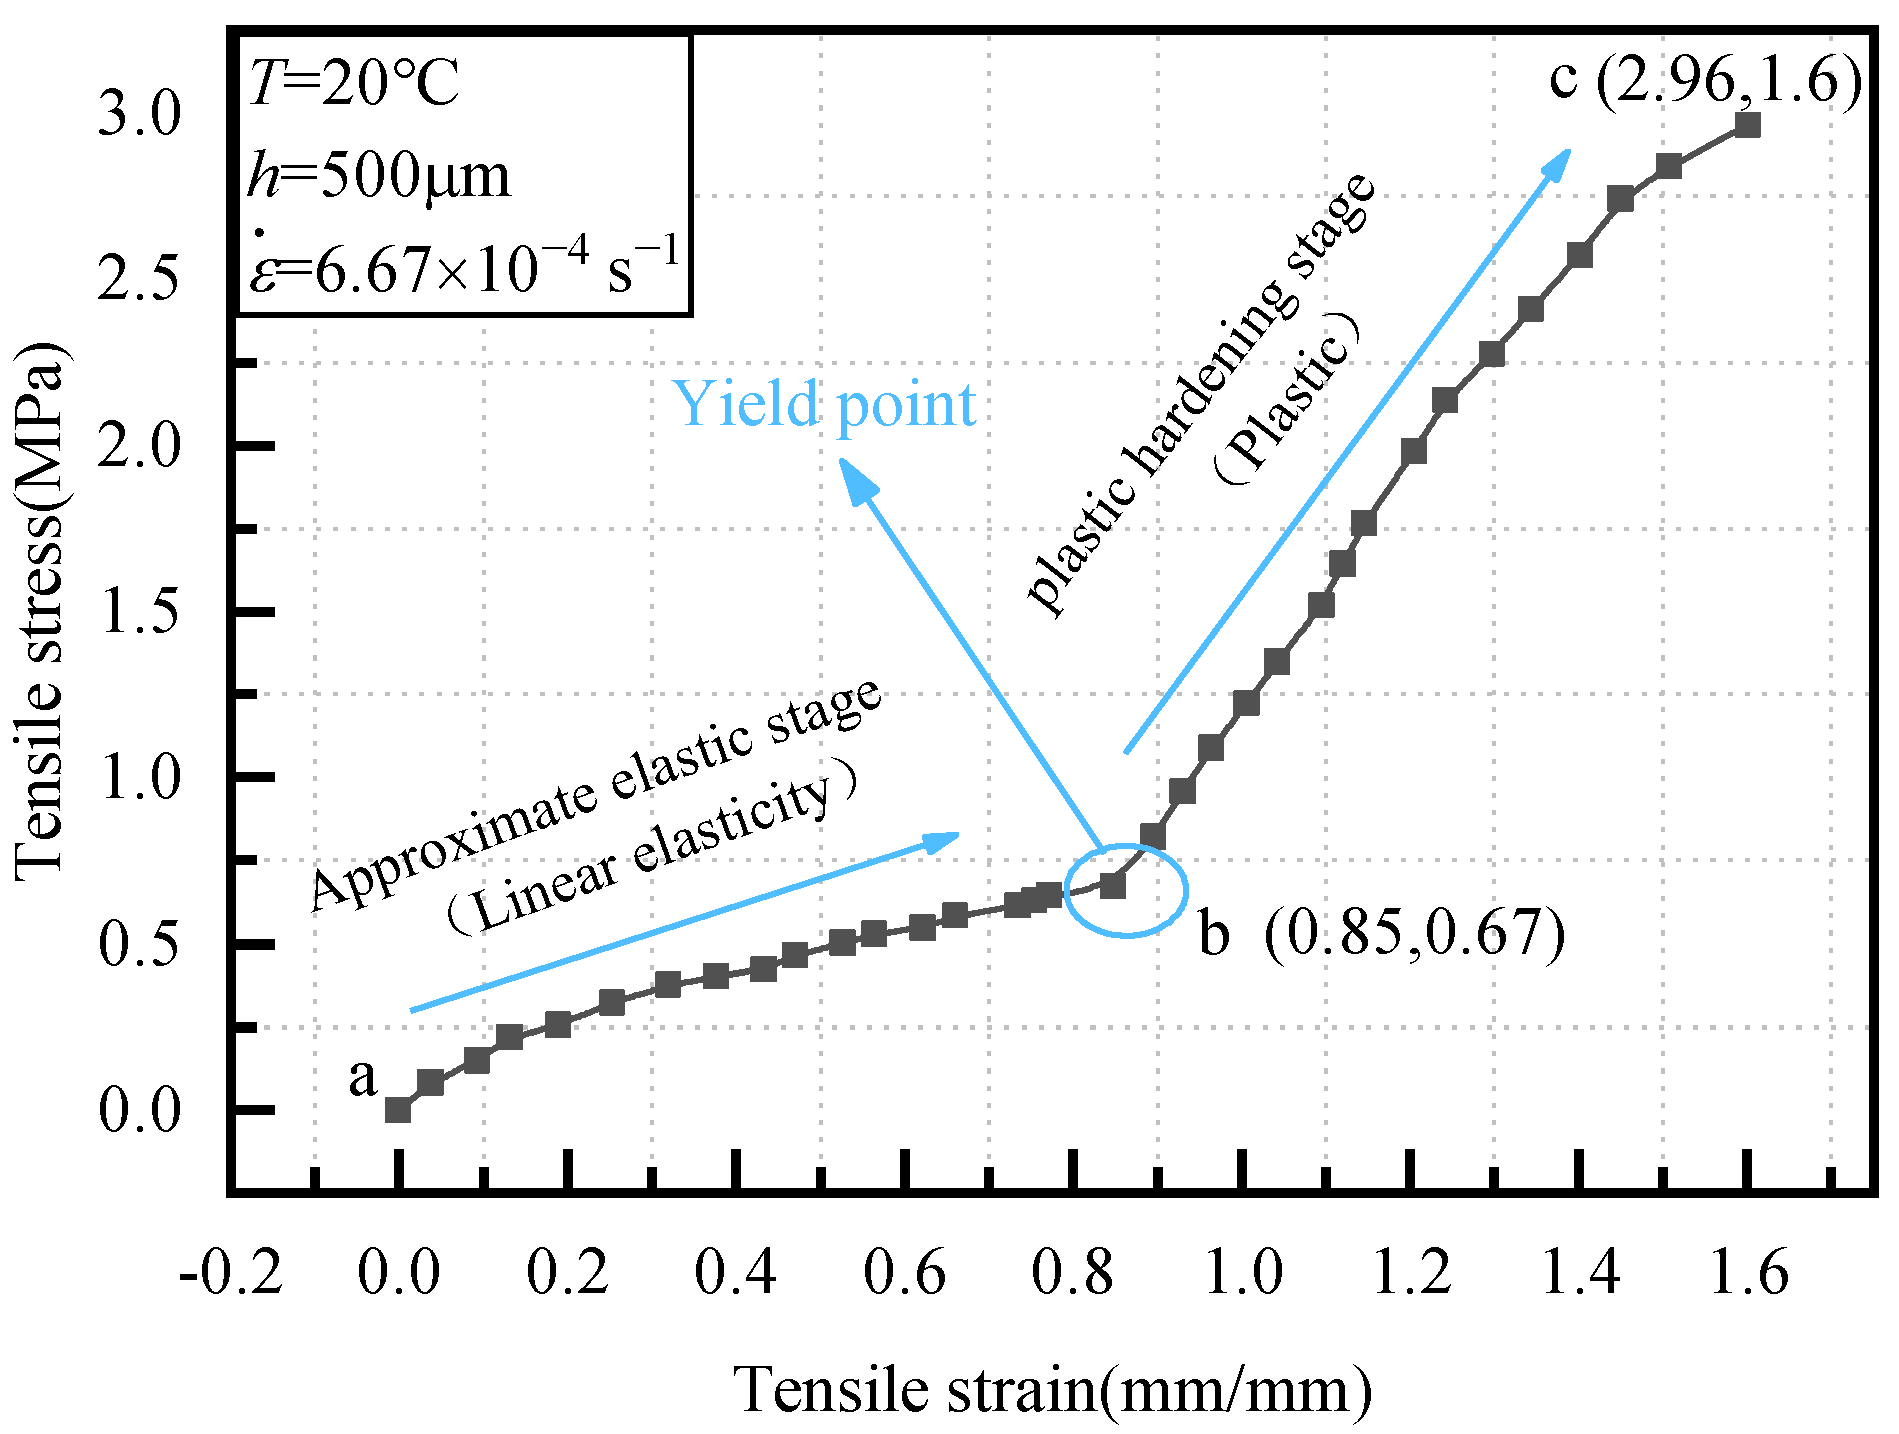
Figure 5 shows the stress–strain curve of the coating under standard experimental conditions. It can be seen that the curve does not have an obvious yielding phase but exhibits significant hardening. The curve is divided into two sections, with a significant turn at point b (yield point), which is defined as two parts: the approximate elastic stage (ab segment) and the plastic hardening stage (bc segment). The average tensile strength and elongation at break of each specimen were calculated to be 2.96 MPa and 1.6%, respectively. The equivalent yield strength and modulus of elasticity were 0.67 MPa and 0.74 MPa, respectively. The approximate elastic stage conforms to Hooke’s law and is expressed as a linear function. The plastic hardening stage exhibits significant nonlinearity and is expressed as a quadratic polynomial. Therefore, the constitutive relationship of the coating can be expressed as follows:

Figure 5.
Stress–strain curves of the coating under standard experimental conditions.
- (1)
- Approximate elastic stage:
- (2)
- Plastic hardening stage:
According to the above definition of the tensile working stage, the approximate elastic stage obeys Hooke’s law. Therefore, the experimental data of the approximate elastic stage (ab segment) of the tensile stress–strain curve of the coating were used to calculate its tensile elastic modulus. The stress–strain curve data (x1, y1), (x2, y2), …, (xn, yn) before the yield point (point b) were selected and linearly fitted using the least squares method, and the slope of its straight line was used as the tensile elastic modulus of the coating. Slope K was calculated using the least squares method, as shown in Equation (3).
In Equation (3), , .
3.2. Mechanical Properties
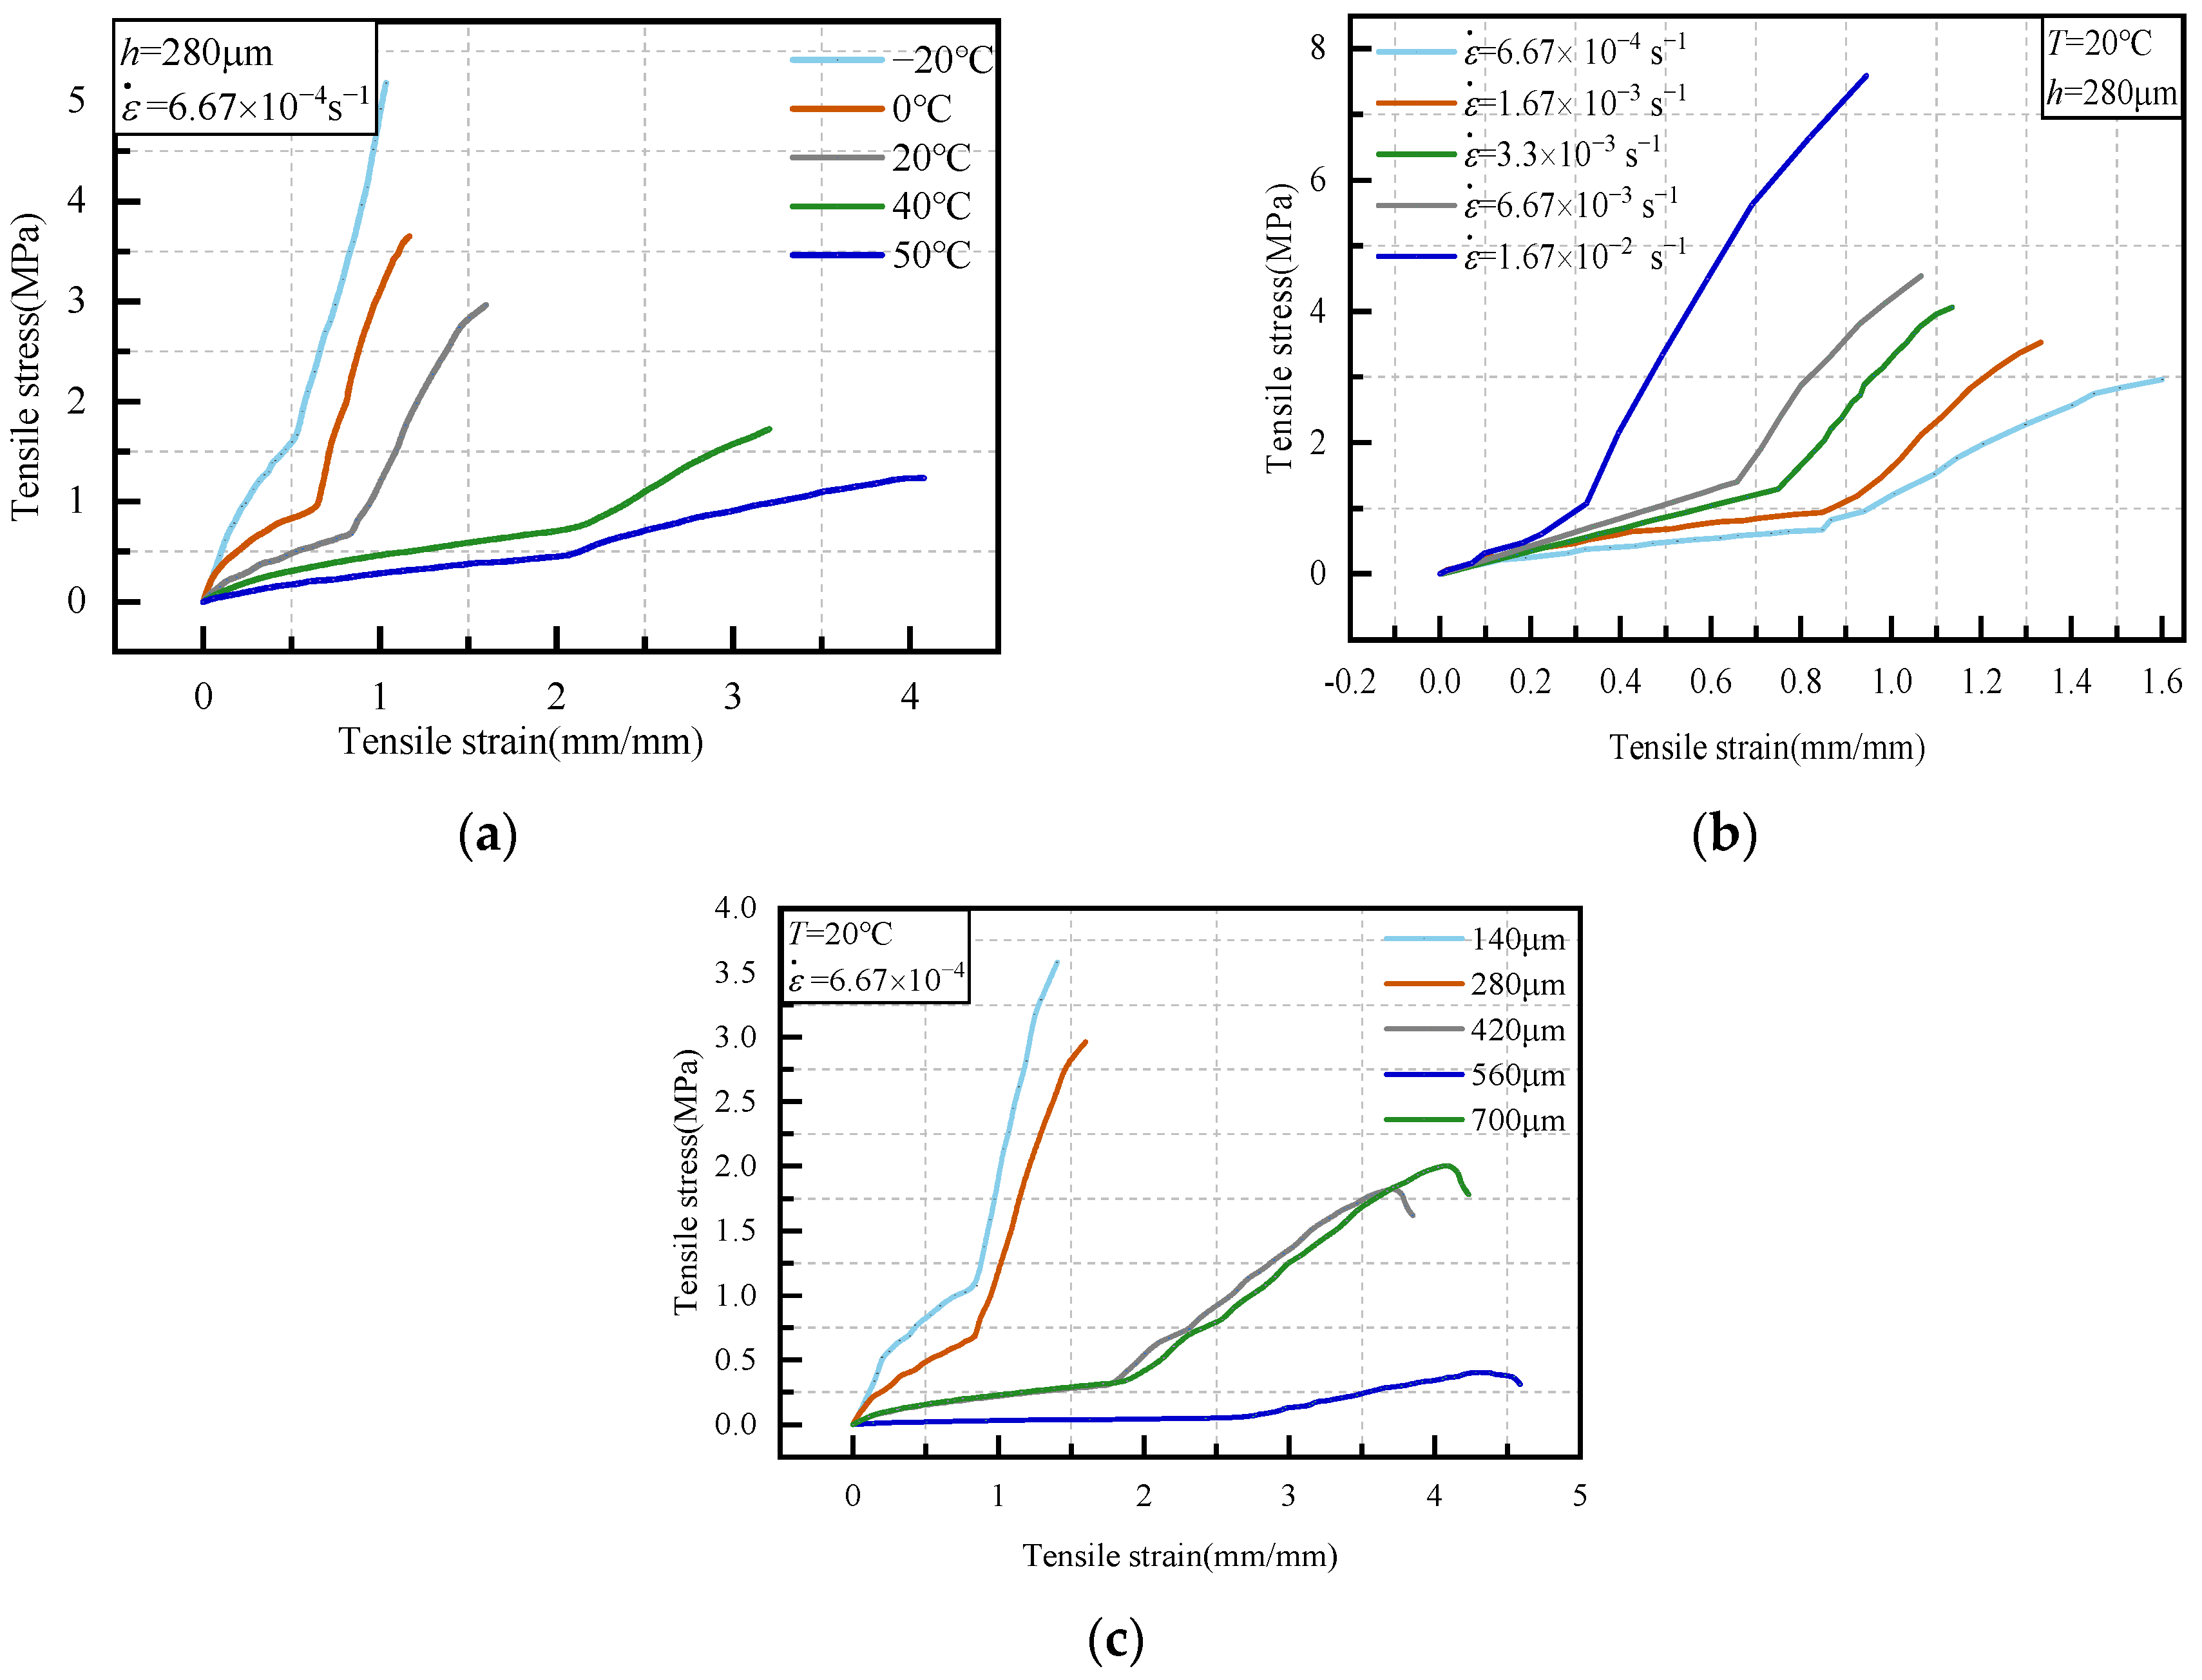
Figure 6 shows the measured stress–strain curves of the steel structure heavy-duty coatings under three working conditions of different temperatures, strain rates, and intermediate coat thicknesses. Table 5 lists the tensile mechanical properties of coatings under various working conditions, along with the standard deviation of each experimental data point.
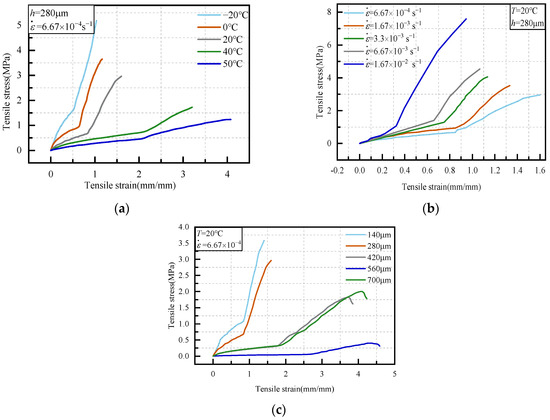
Figure 6.
Tensile stress–strain curves of heavy-duty coatings under various conditions: (a) stress–strain curves under different temperatures; (b) stress–strain curves under different strain rates; (c) stress–strain curves under different intermediate coat thicknesses.
Table 5.
Tensile mechanical properties of coatings under various working conditions.
Figure 6a,b illustrate that as the temperature decreases or the tensile rate increases, the stress–strain curves become steeper. The changes in mechanical properties relating to tensile strength, modulus of elasticity, and yield strength all show increasing trends; however, elongation at break decreases. As shown in Figure 6c, the effect of the thickness of the intermediate coat on the mechanical properties of the coating shows a nonlinear relationship. The tensile strength, modulus of elasticity, and yield strength showed a trend of decreasing, then increasing and then decreasing with the increase in the thickness of the intermediate coat, while the elongation at break showed a trend of increasing and then decreasing. A turning point occurs when the thickness of the intermediate coat is 560 μm.
When the coating is thinner, it is more uniform and dense, providing better initial strength. However, as thickness increases, internal defects and stress concentration points increase, leading to a decrease in strength. When the intermediate coat reaches a certain thickness, interlayer bonding and stress distribution improve, increasing tensile strength. Yet, if the intermediate coat is too thick, increased internal defects and inhomogeneities reduce the strength. Elongation at break increases and then decreases with the thickness of the intermediate coat, indicating that moderate thickness improves plasticity and ductility; however, beyond a certain threshold, the presence of defects promotes early fracture.
Based on the results of this study, it is recommended that in practical engineering applications, the coating thickness should be controlled at around 560 μm to achieve optimal ductility and durability. Additionally, when used in cold climates or high strain rate environments, a coating formulation with a higher modulus of elasticity should be selected to ensure stability and durability under high-stress conditions (Figure 7).
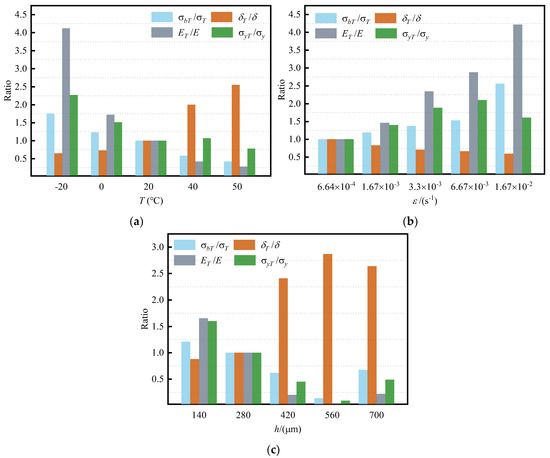
Figure 7.
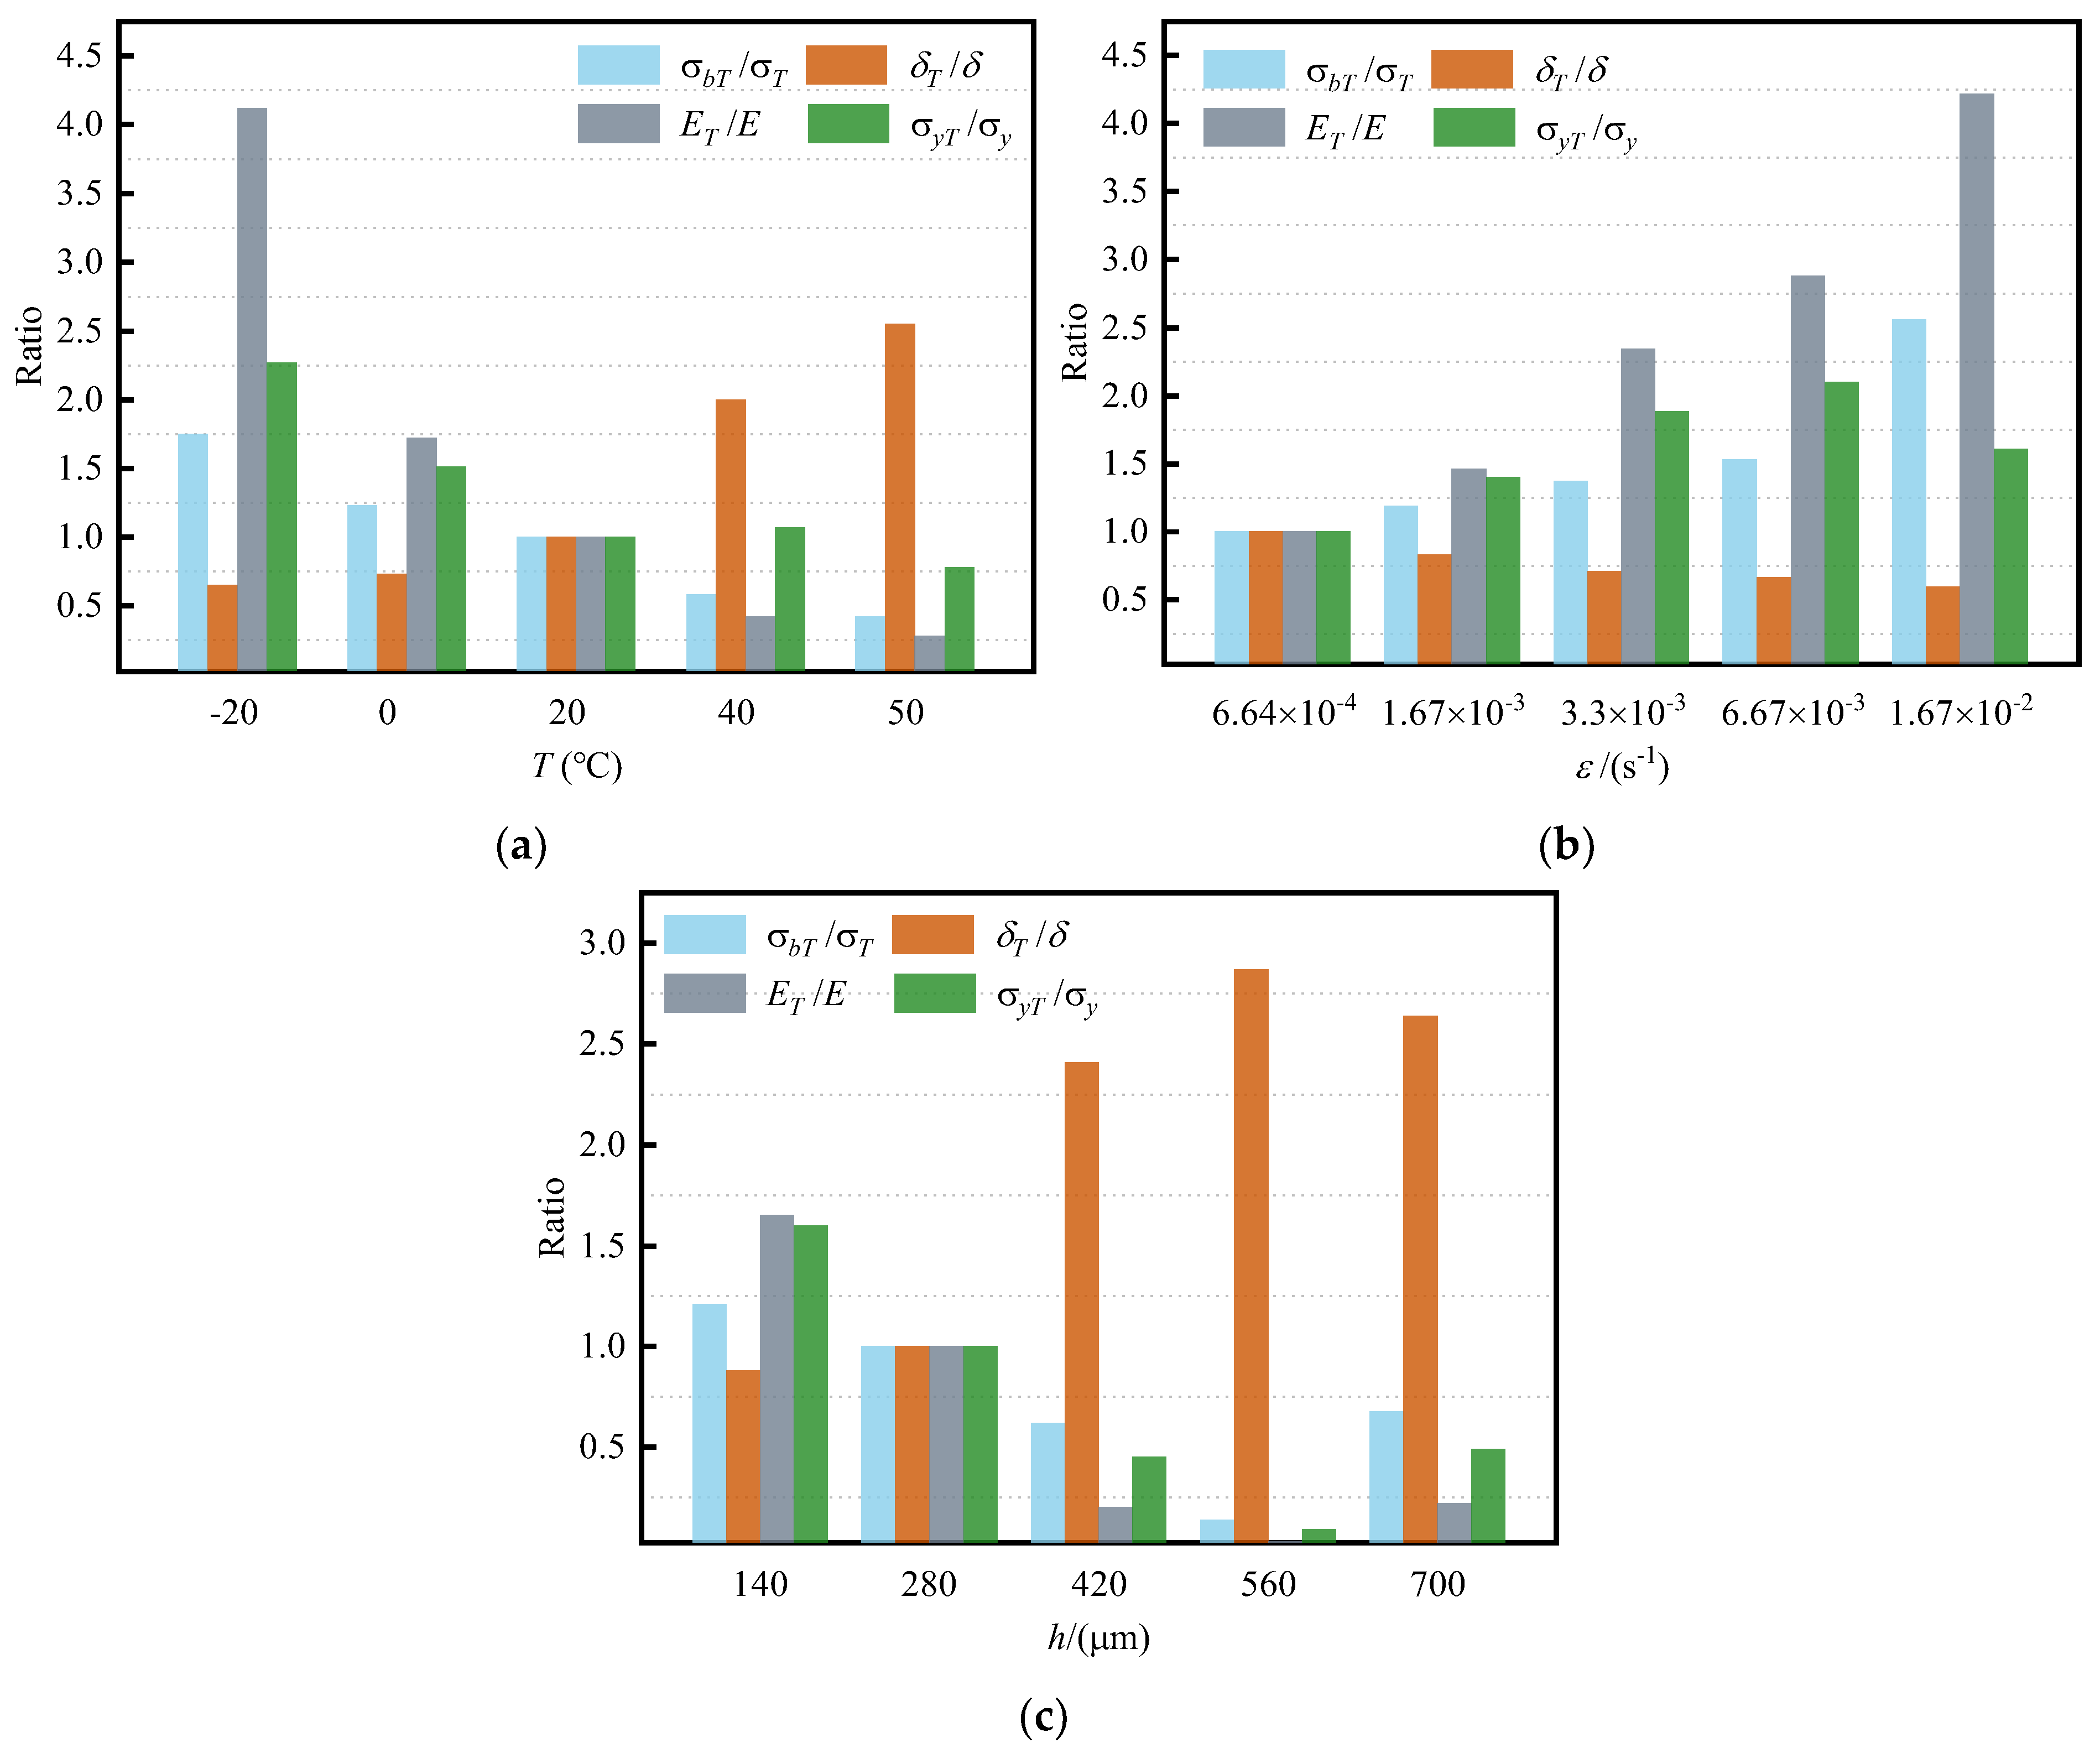
Ratio analysis of mechanical properties under various conditions: (a) ratio analysis of mechanical properties under different temperatures; (b) ratio analysis of mechanical properties under different tensile rates; (c) ratio analysis of mechanical properties under different intermediate coat thicknesses.
In this study, we quantitatively analyzed the effects of temperature, strain rate, and intermediate coat thickness on the mechanical properties of coatings by comparing them to the properties of heavy-duty coatings used for steel structures under standard conditions. The results show the following:
Temperature significantly affects the elongation at break and modulus of elasticity. At 50 °C, the elongation at break increased to 4.08%, which is 2.55 times that of the standard condition, while the modulus of elasticity decreased to 0.21 MPa, about 28% of the standard condition. At −20 °C, the elongation at break and modulus of elasticity were 1.04% and 3.05 MPa, respectively, representing 65% and 4.12 times the standard condition.
Intermediate coat thickness also impacts tensile strength and elongation at break. As thickness increases, elongation at break significantly increases, reaching approximately 250% of the standard condition. At a thickness of 560 μm, tensile strength, modulus of elasticity, and yield strength decrease to 13.85%, 3%, and 9% of the standard conditions, indicating that the thickness of the intermediate coat directly affects the coating’s toughness and resistance to crack extension.
Our analysis identified strain rate as the most significant factor affecting tensile strength and the modulus of elasticity. Intermediate coat thickness had a substantial effect on elongation at break, while temperature primarily influenced yield strength. These findings suggest that the mechanical properties of heavy-duty coatings used for steel structures can be optimized by adjusting the strain rate, intermediate coat thickness, and temperature. For example, in northern China, winter temperatures can drop as low as −40 °C. Under such conditions, coatings are prone to cracking and delamination due to external impacts, such as gravel propelled by vehicles. In this climate, it is advisable to use materials with better ductility and impact resistance. Additionally, controlling the intermediate coating thickness between 540 and 580 μm could optimize the coating’s ductility and impact resistance.
4. Constitutive Modeling and Experimental Analysis
4.1. Sherwood-Frost Model
Foam is a kind of porous polymer material, and in addition to temperature and tensile rate, density is also one of the main factors affecting its mechanical properties. According to its material properties, Sherwood and Frost [16] added density and temperature functions to the integral power model proposed by Schwaber et al. [15] and constructed the Sherwood–Frost compression principal model. This model can express the stress state of a material based on the combined effect of temperature, density, strain and strain rate, as shown Equation (4).
where H(T) is the temperature function, G(ρ) is the density function, and M(ε,) is the strain–strain rate coupling function, which is used to explain the mechanical response of temperature, density, and strain–strain rate coupling, respectively. ƒ(ε) is the shape function, which is a function of the stress–strain curve obtained from quasi-static compression testing of the specimen block at a certain reference temperature and reference density.
The Sherwood–Frost model describes the shape function in terms of a power series of strain, which is expressed as
The effects of temperature and density are expressed as linear functions, and the strain–strain rate coupling response is described by the power finger function proposed by Nagy et al. [31], which is expressed as
where n(ε) is obtained from a linear fit to the experimental data.
4.2. Constitutive Model of Coatings
The temperature, density, and strain rate terms in the Sherwood–Frost model are separable functions. According to the test results of the set working conditions in this paper and combined with the characteristics of polymer materials, it can be seen that the main factors affecting the mechanical properties of heavy-duty anti-corrosion coatings for steel structures are as follows: temperature, strain rate and intermediate coat thickness. In addition, steel structure heavy-duty anti-corrosion coating layers and foam materials are typical polymer materials, and from the main factors affecting the mechanical properties and the constitutive model in the form of the composition of a lot of common points, it is predicted that the constitutive relationship between the two types of materials should have a certain degree of similarity. Therefore, based on the theory presented in the Sherwood–Frost model and combined with the coating material properties, the proposed constitutive model of the coating is composed of a temperature term, a thickness term, a strain rate term, and a shape function; the specific expression of the constitutive model is as follows:
where H(T) is the response function of temperature, G(h) is the response function of intermediate coat thickness, M(ε,) is the strain–strain rate coupling response function, and ƒ(ε) is the shape function.
Establishment of Shape Function
- 1.
- Establishment of shape function:
Here, 20 °C is set as the reference temperature, 280 μm is set as the reference intermediate coat thickness, and 6.67 × 10⁻⁴ s−1 is set as the reference strain rate. Therefore, its constitutive relationship in the standard state defines the model’s shape function. Its constitutive relationship under the standard experimental state is expressed by the segment function Equations (1) and (2). According to the definition of the shape function, it is known that the shape function is the constitutive relationship of the coating in the standard experimental conduction:
- 2.
- Establishment of temperature response function:
When the temperature changes, the strain rate is kept constant at 6.67 × 10⁻⁴ s−1 and the thickness of the intermediate coat is 280 μm. Therefore, the temperature response function and the strain–strain rate coupling response function are constant; G(h) equals 1 and M(ε,) equals 1. Substituting the values of the thickness response function and the strain–strain rate coupling response function into Equation (7), it follows that
Studies have shown that the Arrhenius equation can effectively describe the mechanical property changes in polymer materials under high-temperature conditions [32]. Furthermore, tensile tests on the coating reveal that with increasing temperature, the mechanical properties of the coating exhibit a typical temperature dependence, which aligns with the thermally activated processes described by the Arrhenius equation. Therefore, the theory of thermal activation and the Arrhenius equation are used to describe the effect of temperature on the mechanical properties of the coating material.
where H0 is the prefactor, usually related to the base stress level or initial response rate of the material. It is used to express the baseline effect of temperature changes on the response rate of the system or the material properties. Q is the activation energy, representing the internal energy barrier that must be overcome during the deformation of the material. R is the gas constant, which is approximately 8.314 J/(mol·K). T is the absolute temperature, which is measured in Kelvin (K).
Let y = ln H(T), x = 1/T, m = −Q/R, b = lnH0; thus, the above Equation (12) can be transformed into
In order to determine the key parameters of the temperature response function, we performed a least squares linear regression fit to the linear relationship between ln H(T) and 1/T, obtaining slope m and intercept b. Subsequently, based on Equations (14) and (15), activation energy Q and pre-exponential factor H0 were calculated from the regression results (Table 6).
Table 6.
Fitting results of temperature function.
The R2 values, all 0.96 or higher, indicate that the model effectively captures the relationship between temperature and the coating’s mechanical properties, confirming the accuracy of the temperature response function.
- 3.
- Establishment of thickness response function:
When the thickness of the intermediate coat changes, with the temperature maintained at 20 °C and the strain rate held constant at 6.67 × 10⁻⁴ s−1, then H(T) equals 1 and M(ε,) equals 1. Substituting the values of the strain rate response function and the temperature response function into Equation (7), thus
A polynomial was used to describe the effect of coating thickness on the mechanical properties of the coatings to better describe the nonlinear trend of the intrinsic relationship, as shown in Equation (18).
where c1, c2, and c3 are polynomial coefficients and h is the coating thickness.
By performing a least squares fitting of G(h), the fitting coefficients c1, c2, and c3 were obtained, along with the residuals of the fitted model. These values are presented in Table 7.
Table 7.
Fitting results of thickness function.
The R2 values are all 0.94 or higher, indicating that the model effectively represents the influence of intermediate coat thickness on the mechanical properties of the coating.
- 4.
- Establishment of strain rate response function:
When the strain rate changes, with the temperature maintained at 20 °C and the thickness of the intermediate coat at 280 μm, then G(h) is 1 and H(T) is 1. Substituting the values of the thickness response function and the temperature response function into Equation (7), it follows that
Strain strengthening theory is used to describe the hardening phenomenon exhibited by materials during plastic deformation, as shown in the following equation:
where K is the strength factor, and n is the hardening index.
In order to further describe the effect of strain rate on stress, the traditional strain hardening model is extended to include an exponential term in the strain hardening model, which is used to comprehensively reflect the effect of strain and strain rate, as shown in the following equation:
where b is the exponential parameter of the strain rate.
Finally, the parameters ln(K), n, and b were determined by fitting the experimental data using linear regression (Table 8).
Table 8.
Fitting results of strain rate function.
The R2 values, all above 0.95, confirm that the model reliably captures the effect of strain rate on the mechanical properties of the coating.
In summary, the constitutive model of the heavy-duty anti-corrosion coating for steel structures is shown in the following equation.
4.3. Analysis with Coupled Factor Experiments
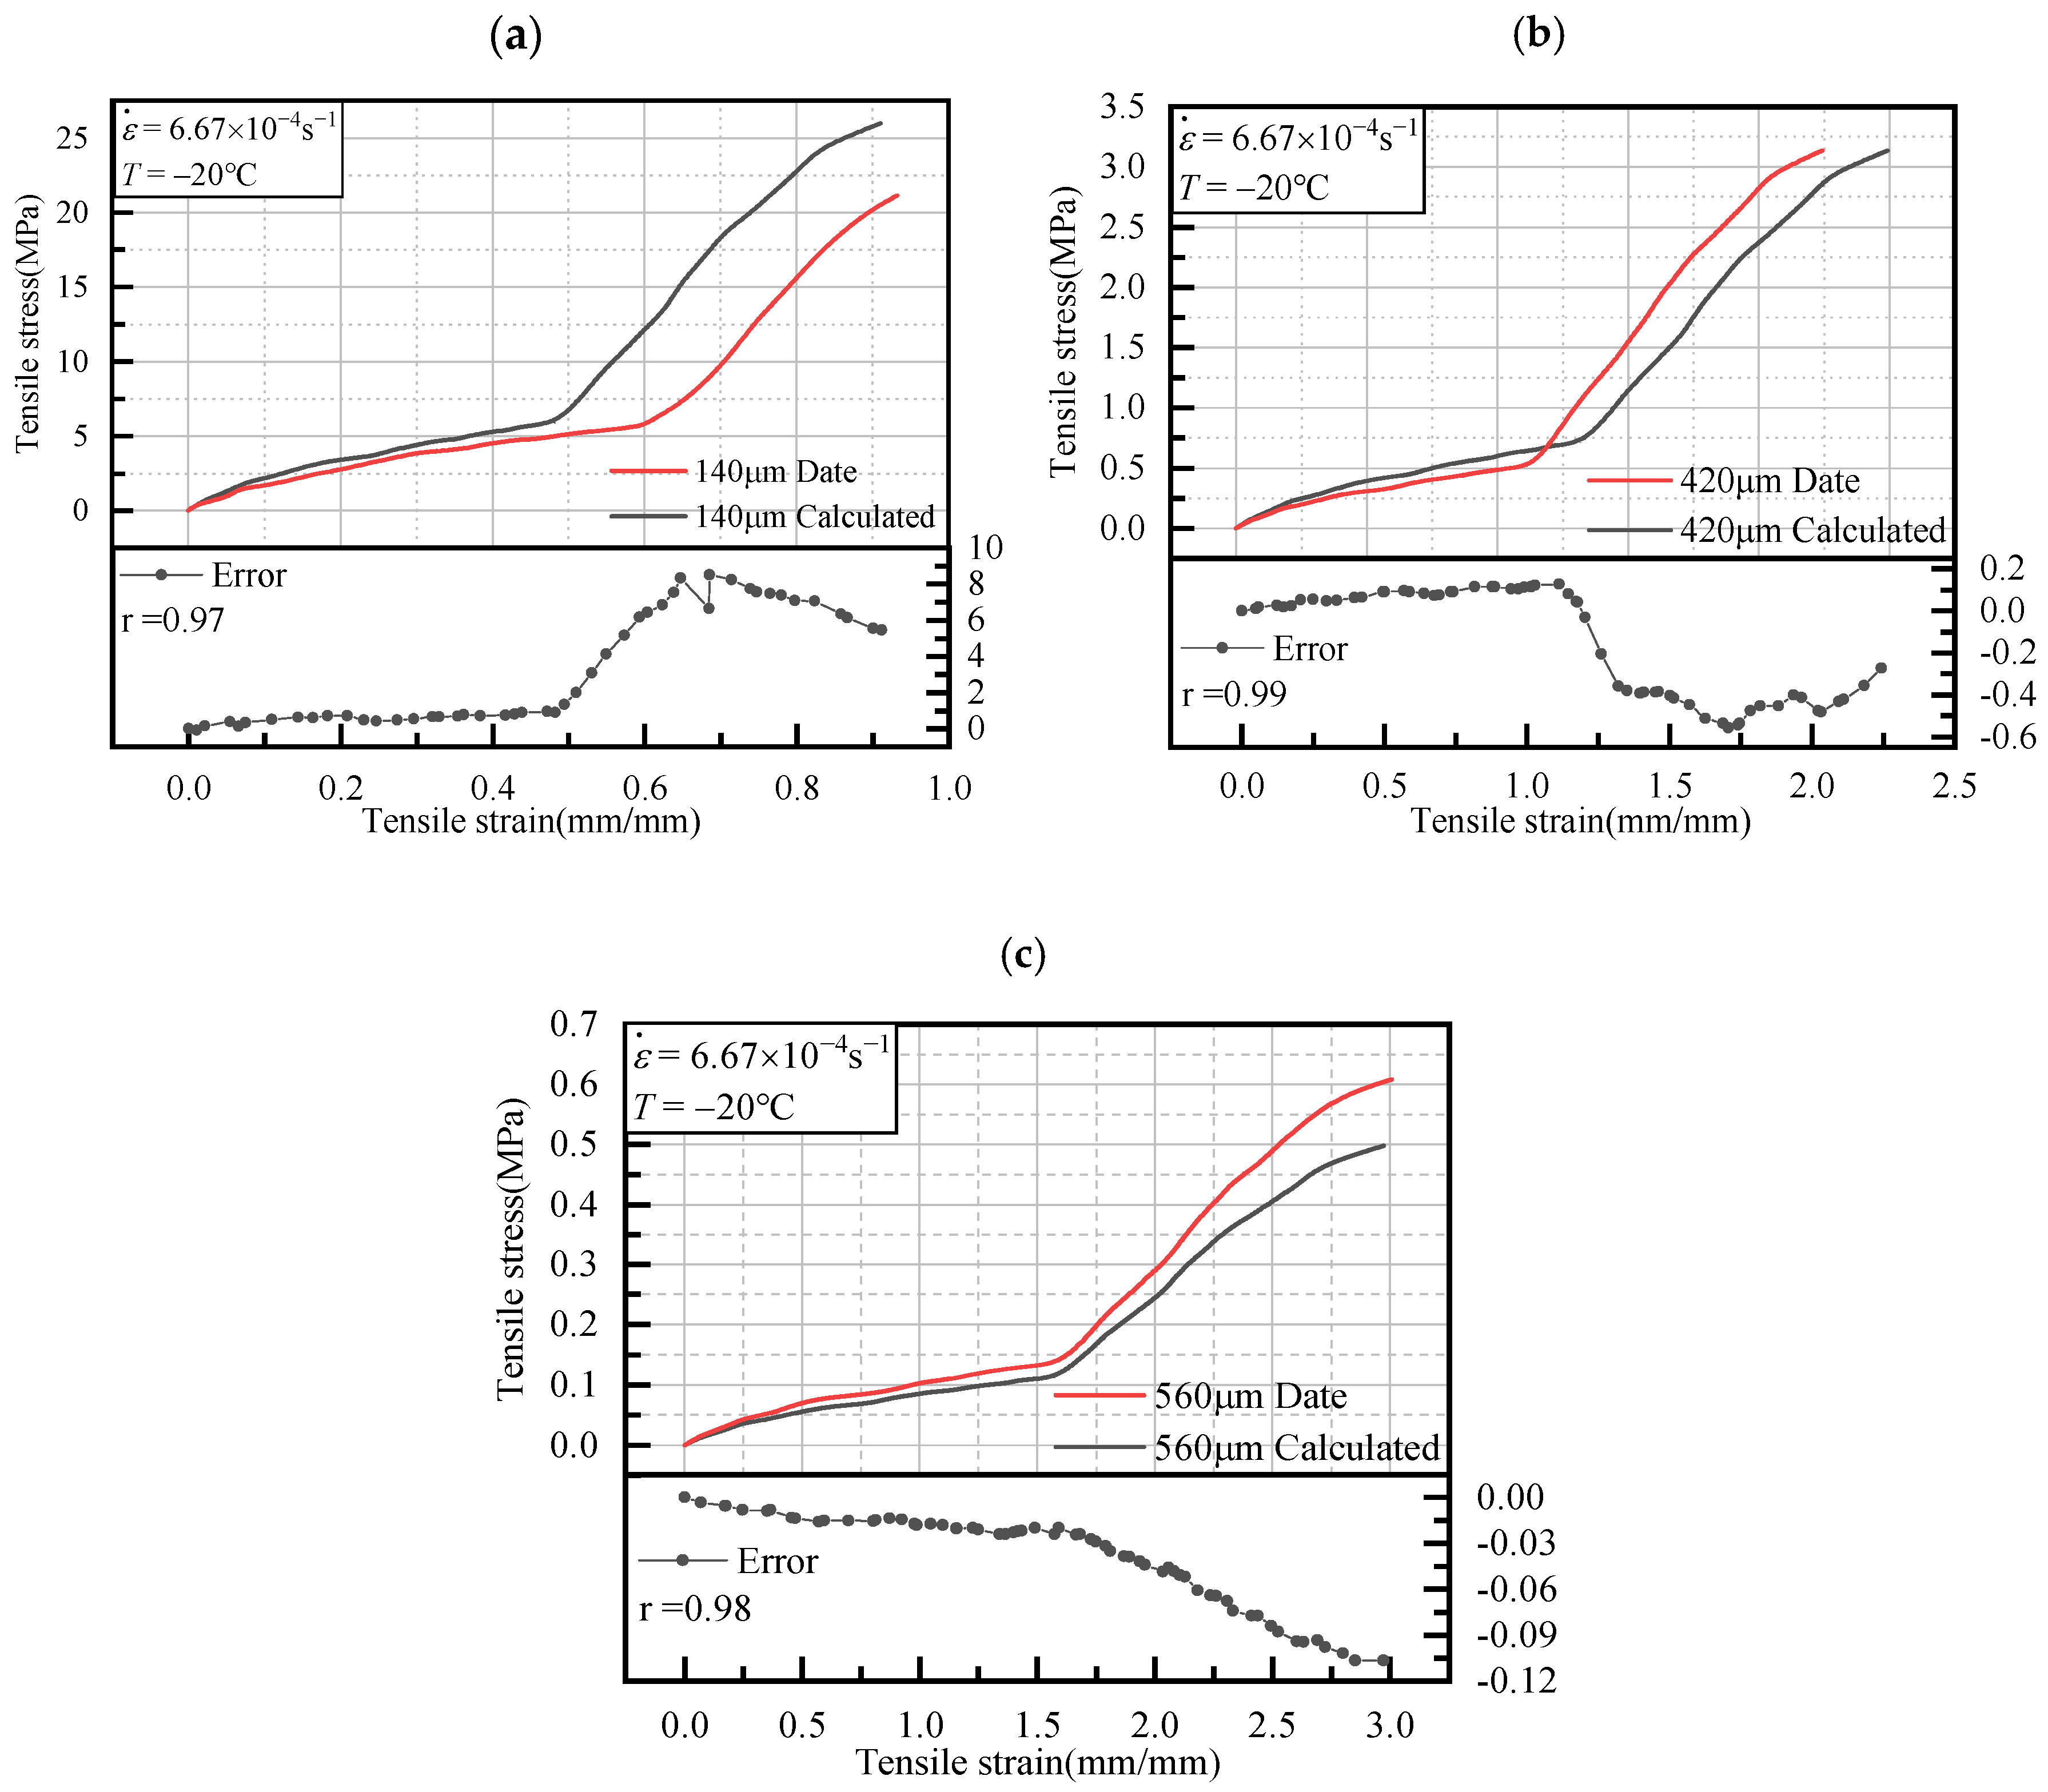
To verify the tensile constitutive model of a heavy-duty coating for steel structures proposed in this paper, a multifactorial coupled tensile experiment with a constant strain rate of 6.67 × 10⁻⁴ s−1 and temperature and intermediate coat thickness variations was carried out on the coating specimens. The specific working conditions were as follows: the strain rate constant was 6.67 × 10⁻⁴ s−1, the primer thickness constant was 60 μm, the topcoat thickness constant was 160 μm, the temperatures used were −20 °C and 0 °C, and intermediate coat thicknesses of 140 μm, 420 μm, and 560 μm were used for six experiments. Figure 8 shows the calculated and experimental values of the coating’s constitutive relationship at −20 °C, and Figure 9 shows these values at 0 °C. The stress–strain curves predicted using the model were compared with the experimental curves. Additionally, the predicted tensile strength values at the same strain within the experimental range were compared with the experimental values. Finally, to assess the applicability of the constitutive model for steel structure coatings, the Pearson correlation coefficient r between the calculated and experimental data was determined using Equation (25).
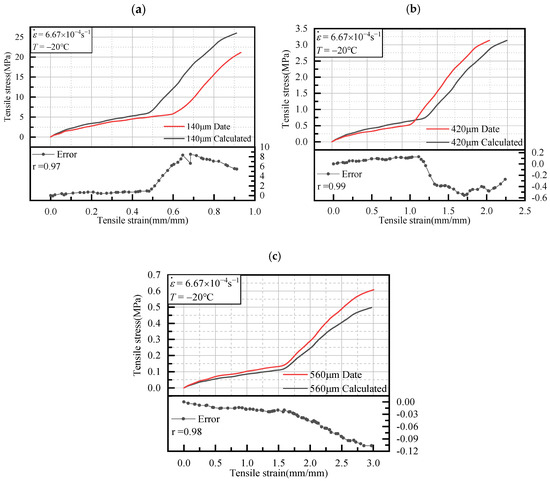
Figure 8.
Calculated and experimental values at −20 °C: (a) calculated and experimental values at an intermediate coat thickness of 140 μm; (b) calculated and experimental values at an intermediate coat thickness of 420 μm; (c) calculated and experimental values at an intermediate coat thickness of 560 μm.
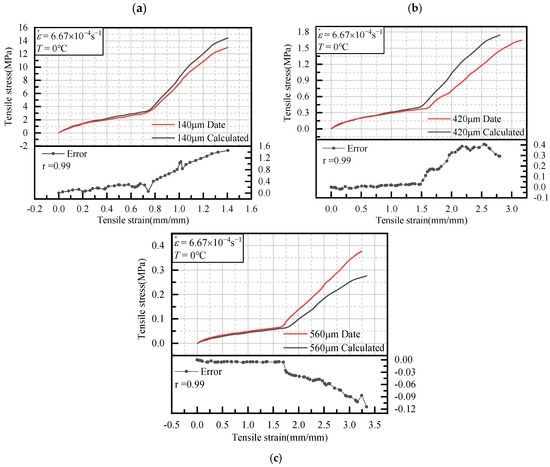
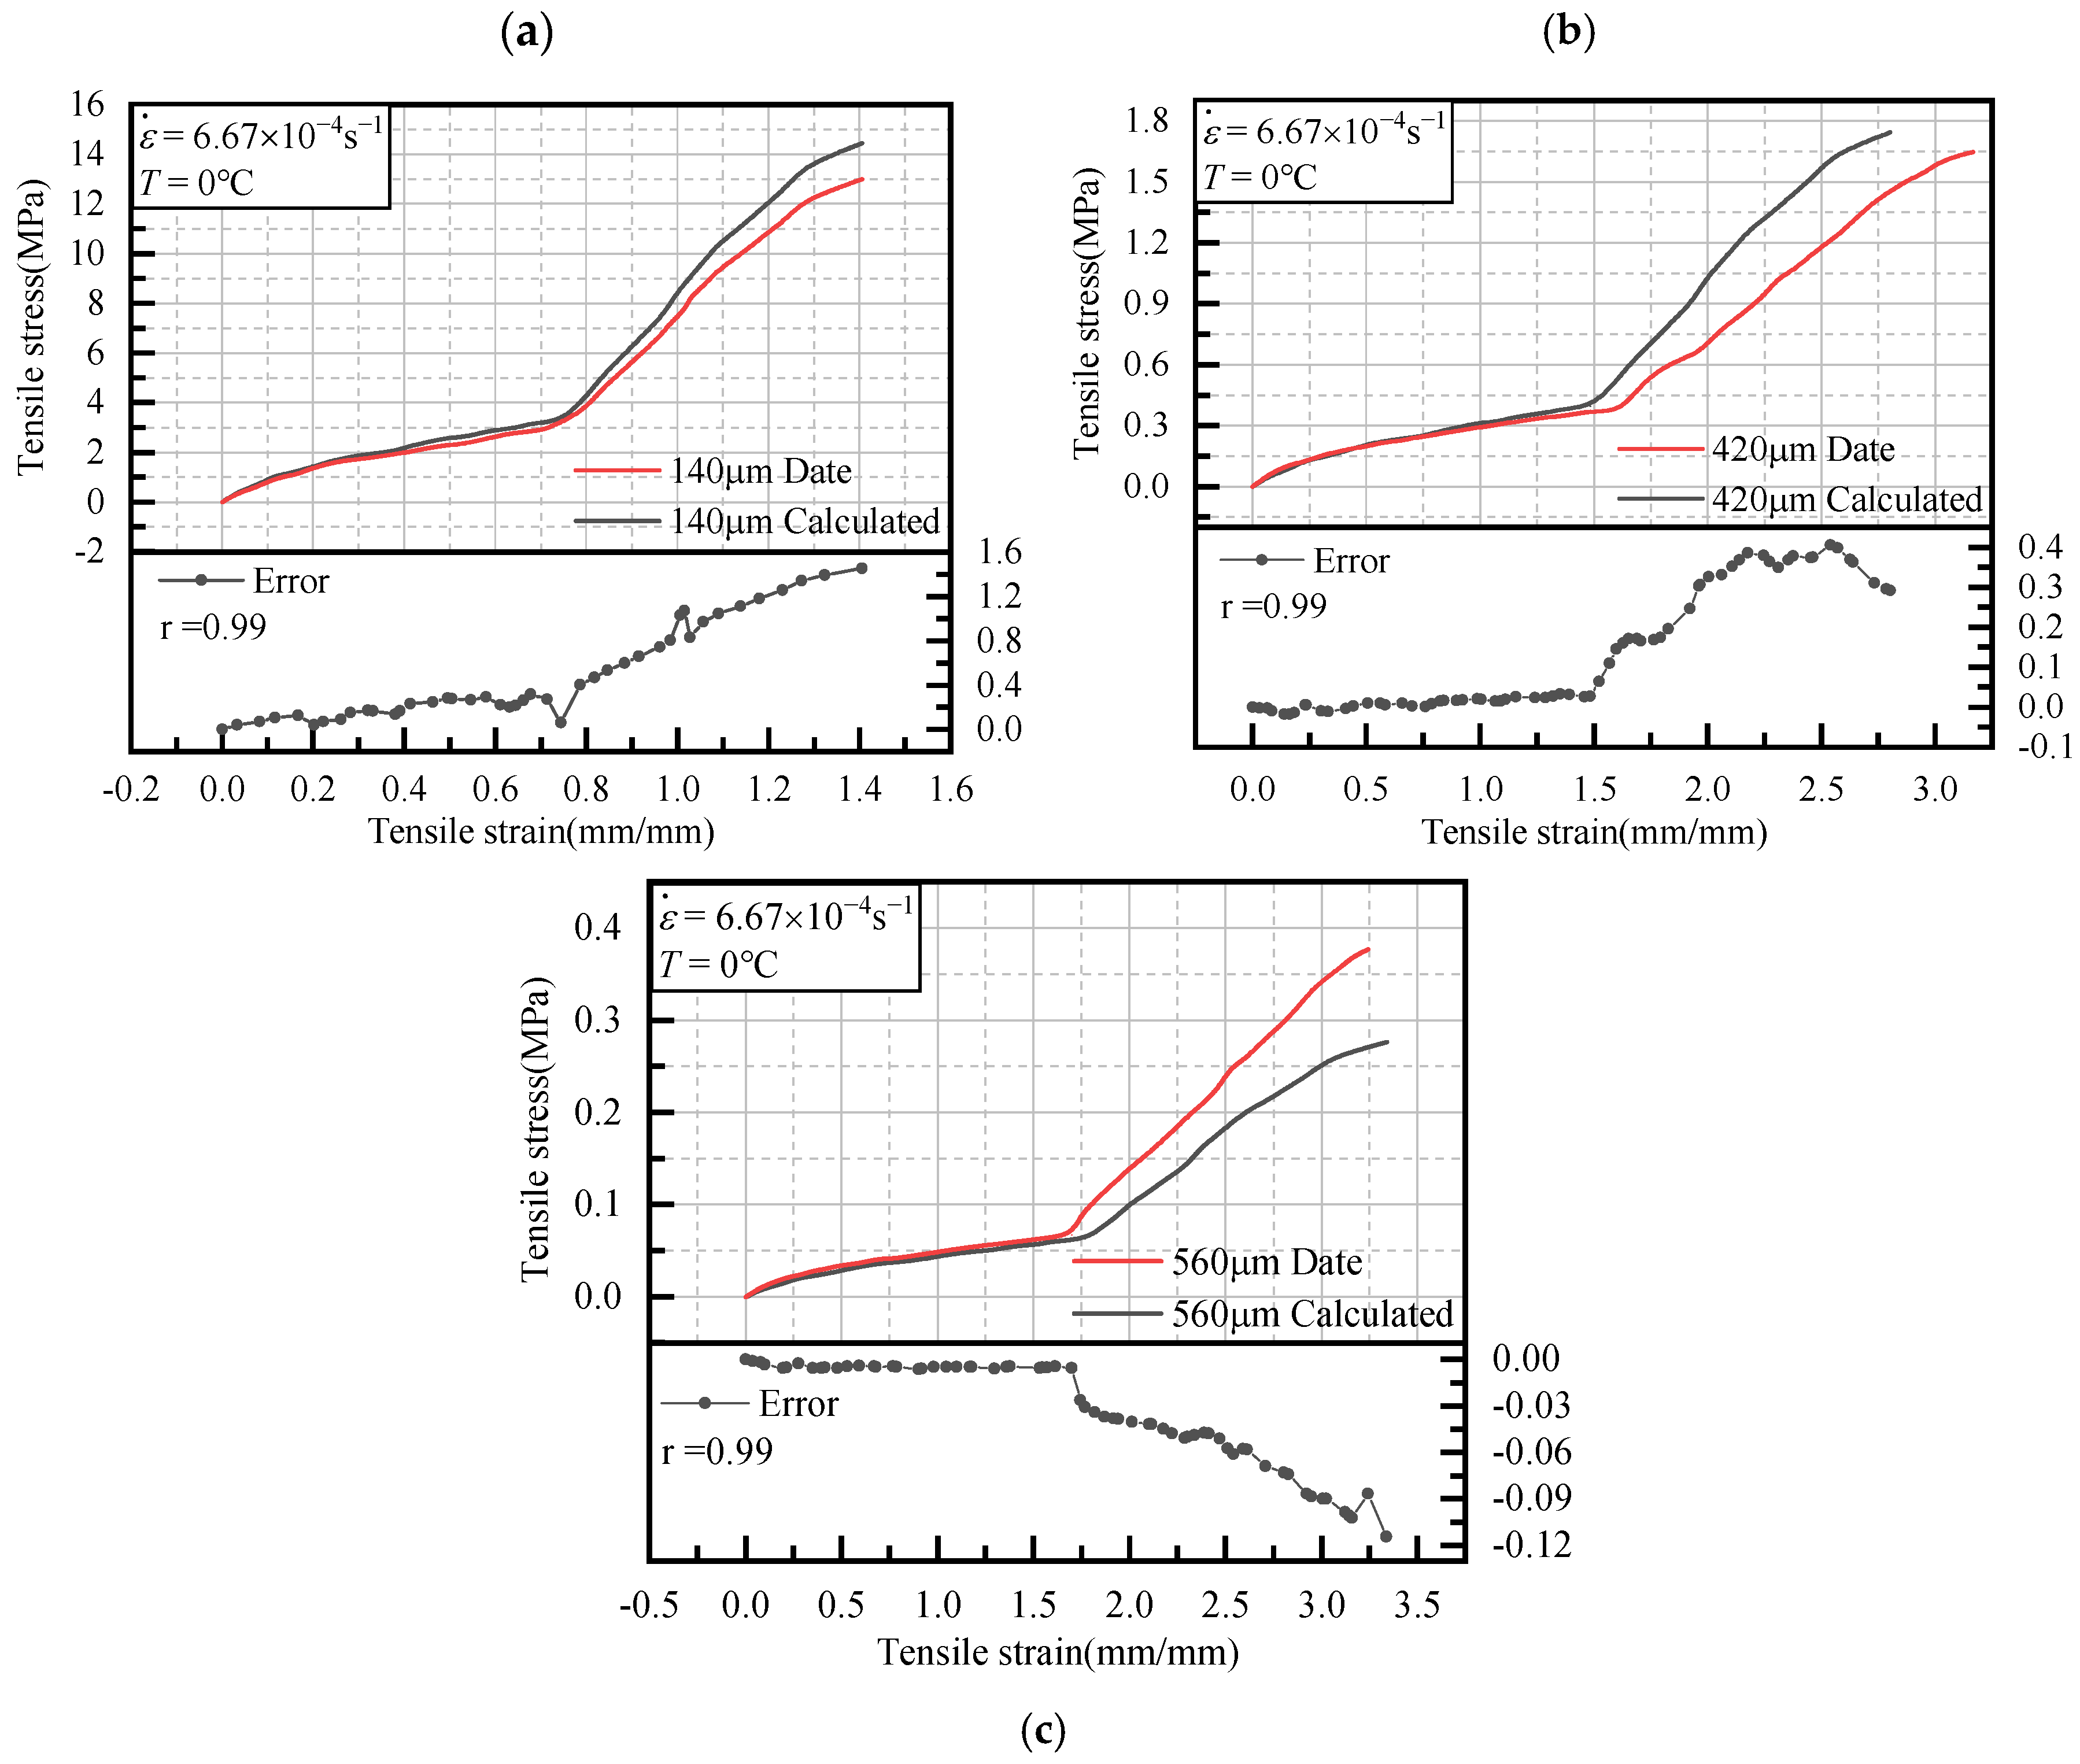
Figure 9.
Calculated and experimental values at 0 °C: (a) calculated and experimental values at an intermediate coat thickness of 140 μm; (b) calculated and experimental values at an intermediate coat thickness of 420 μm; (c) calculated and experimental values at an intermediate coat thickness of 560 μm.
As shown in Figure 8 and Figure 9, it can be observed that in the approximate elastic stage, the trends of the test results and the predicted values of the constitutive model are highly consistent, indicating a strong correlation. However, in the plastic hardening stage, the overall error between the test results and the predicted values gradually increases with the increase in strain. The reasons for this phenomenon include the fact that the model assumes that the material is homogeneous and isotropic, ignoring microstructural variations. Furthermore, it does not account for the complex material damage and microcrack development that occur during the plastic phase. There is also the nonlinear nature of plastic deformation, which leads to the accumulation of measurement errors, as well as small variations in the test conditions, which can result in significant differences in the macroscopic stress–strain behavior. Furthermore, there is the complexity of multifactorial coupling effects to consider. Despite these discrepancies, the stress–strain curves still demonstrate a high degree of consistency throughout the entire range, with the correlation coefficients all being above 0.97. Therefore, the multifactor coupled constitutive model developed in this paper effectively reflects the stress–strain relationship of steel structure heavy-duty coatings under uniaxial tensile loading, demonstrating good predictive capabilities.
Although this study successfully verified the tensile constitutive model of heavy-duty coatings through multifactorial coupled tensile experiments, with the correlation coefficients all being above 0.97, demonstrating strong predictive capabilities under the used conditions, the selection of experimental parameters remains somewhat limited, particularly regarding the diversity of strain rates and temperatures. While the current experimental conditions provide strong support for model validation, future studies should aim to validate the model across a broader range of parameter values, especially considering different combinations of strain rates, temperatures, and coating thicknesses. Expanding the parameter range will allow for more comprehensive evaluation and improvement of the model’s accuracy and applicability under more complex conditions.
5. Conclusions
- The experiments demonstrated that the tensile strength, modulus of elasticity, and yield strength of the coatings decrease with rising temperature or decreasing strain rate; however, elongation at break increases. Additionally, as the paint layer thickness increases, tensile strength, modulus of elasticity, and yield strength initially decrease, then increase, while elongation at break first increases and then decreases. These findings suggest that optimal coating performance requires a careful balance of multiple factors, including temperature, strain rate, and layer thickness.
- Via comparative analysis, it was found that temperature has the most significant impact on elongation at break and modulus of elasticity. Strain rate significantly affects tensile strength and elastic modulus, while changes in intermediate coat thickness significantly influence all of the examined mechanical properties. Notably, the highest tensile strength occurs at a strain rate of 1.16 × 10 −2 s−1, reaching 7.6 MPa. The maximum elongation at break occurs at an intermediate coat thickness of 560 μm, reaching 4.59%.
- The constructed constitutive model of heavy-duty coatings for steel structures comprehensively describes the effects of temperature, thickness, and strain rate by using segmental, linear, and exponential composite functions. The correlation coefficients r between the predicted values of the model and the experimental results are all 0.97 and above, with good prediction accuracy and applicability. The model can be used to accurately predict the mechanical behavior of a coating under static uniaxial tension. To further improve the model’s predictive capability, we plan to conduct experiments over a broader range of parameter values in the future to enhance its applicability and accuracy.
- The constitutive model shows high agreement with the experimental results in the approximate elastic phase; however, errors gradually increase in the plastic strengthening phase. The generation of errors is attributed to model simplification assumptions, material damage and microcrack development, the accumulation of measurement errors, changes in the experimental conditions, and the complexity of multifactor coupling effects. These factors contribute to discrepancies between the model predictions and the experimental results. Future research should focus on refining the model by incorporating microstructural variations, accounting for complex material behaviors, improving experimental condition simulations, and addressing multifactor coupling complexities to enhance accuracy across all phases of deformation.
Author Contributions
P.L.: methodology, visualization, writing—review and editing, supervision, project administration, and funding acquisition. X.C.: formal analysis, investigation, data curation, writing—original draft, and validation. All authors have read and agreed to the published version of the manuscript.
Funding
This work was supported by the scientific research project of the Gansu Provincial Department of Transportation (2022-26), the Gansu Provincial Higher Education Industry Support Program Project (2024CYZC-21), and the Gansu Provincial Key R&D Programme-Industrial Projects (23YFGA0042).
Institutional Review Board Statement
Not applicable.
Informed Consent Statement
Not applicable.
Data Availability Statement
Data are contained within the article.
Conflicts of Interest
The authors declare no conflicts of interest.
References
- Olajire, A.A. Recent advances on organic coating system technologies for corrosion protection of offshore metallic structures. J. Mol. Liq. 2018, 269, 572–606. [Google Scholar] [CrossRef]
- Chambers, L.D.; Stokes, K.R.; Walsh, F.C.; Wood, R.J. Modern approaches to marine antifouling coatings. Surf. Coat. Technol. 2006, 201, 3642–3652. [Google Scholar] [CrossRef]
- Toubia, E.A.; Emami, S. Experimental Evaluation of Structural Steel Coating Systems. J. Mater. Civ. Eng. 2016, 28, 04016147. [Google Scholar] [CrossRef]
- Yang, H.Q.; Zhang, Q.; Li, Y.M.; Liu, G.; Huang, Y. Effects of mechanical stress on protective properties of a marine coating on mild steel substrate. Corros. Sci. 2020, 177, 108986. [Google Scholar] [CrossRef]
- Cheng, M.; Frangopol, D.M.; Gong, C. Acceptance of corrosion-resistant steel in design of steel girder bridges based on expected utility theory. J. Bridge Eng. 2020, 25, 04020098. [Google Scholar] [CrossRef]
- Potgieter, J.H.; Olubambi, P.A.; Cornish, L.; Machio, C.N.; Sherif, E.S.M. Influence of nickel additions on the corrosion behavior of low nitrogen 22% Cr series duplex stainless steels. Corros. Sci. 2008, 50, 2572–2579. [Google Scholar] [CrossRef]
- Mizuba, S.; Tomiyama, T.; Miyata, A. Electrochemical Measurement of Protective Paint Systems for Steel Road Bridges: Results of the Exposure Test in Marine Environment for 30 Years. Corros. Eng. 2018, 67, 287–291. [Google Scholar] [CrossRef]
- Hesp, S.A.M.; Roy, S.D. How Temperature and Loading Rate Affect the Yield Behavior in Polymer-Modified Asphalt Systems. Int. J. Pavement Eng. 2003, 4, 13–23. [Google Scholar] [CrossRef]
- Zhang, C.T.; Li, Y.Y.; Wu, J.J. Mechanical Properties of Fiber-Reinforced Polymer (FRP) Composites at Elevated Temperatures. Buildings 2023, 13, 67. [Google Scholar] [CrossRef]
- Sharma, A.P.; Velmurugan, R. Effect of high strain rate on tensile response and failure analysis of titanium/glass fiber reinforced polymer composites. J. Compos. Mater. 2021, 55, 3443–3470. [Google Scholar] [CrossRef]
- Amjadi, M.; Fatemi, A. Tensile Behavior of High-Density Polyethylene Including the Effects of Processing Technique, Thickness, Temperature, and Strain Rate. Polymers 2020, 12, 1857. [Google Scholar] [CrossRef] [PubMed]
- Hwang, B.K.; Kim, S.K.; Kim, J.H.; Kim, J.D.; Lee, J.M. Dynamic Compressive Behavior of Rigid Polyurethane Foam with Various Densities under Different Temperatures. Int. J. Mech. Sci. 2020, 180, 105657. [Google Scholar] [CrossRef]
- Saha, M.C.; Mahfuz, H.; Chakravarty, U.K.; Uddin, M.; Kabir, M.E.; Jeelani, S. Effect of density, microstructure, and strain rate on compression behavior of polymeric foams. Mater. Sci. Eng. A 2005, 406, 328–336. [Google Scholar] [CrossRef]
- Chen, Y.; Jin, K.; Li, H.; Lin, Y.; Lu, Y.; Hua, X. Effect of peer ply and cooling rate on the tensile properties of Al/Gf/PP laminate prepared by hot pressing. J. Sandw. Struct. Mater. 2018, 22, 109963621880247. [Google Scholar] [CrossRef]
- Schwaber, D.M.; Meinecke, E.A. Energy absorption in polymeric foams. II. Prediction of impact behavior from instron data for foams with rate-dependent modulus. J. Appl. Polym. Sci. 1971, 15, 2381–2393. [Google Scholar] [CrossRef]
- Sherwood, J.A.; Frost, C.C. Constitutive modeling and simulation of energy absorbing polyurethane foam under impact loading. Polym. Eng. Sci. 1992, 32, 1138–1146. [Google Scholar] [CrossRef]
- Dinh, T.D.; Rezaei, A.; De Laet, L.; Mollaert, M.; Van Hemelrijck, D.; Van Paepegem, W. A new elasto-plastic material model for coated fabric. Eng. Struct. 2014, 71, 222–233. [Google Scholar] [CrossRef]
- Jekel, C.F.; Venter, G.; Venter, M.P. Modeling PVC-coated polyester as a hypoelastic non-linear orthotropic material. Compos. Struct. 2017, 161, 51–64. [Google Scholar] [CrossRef]
- Wen, Y.; Lai, Z.; Ma, J.; Liu, H.; Wang, Y.; Chi, H.; Huang, R. A dynamic constitutive model for high-density rigid polyurethane foam subjected to impact loading. Constr. Build. Mater. 2023, 387, 131642. [Google Scholar] [CrossRef]
- Kim, I.T.; Dao, D.K.; Jeong, Y.S.; Huh, J.; Ahn, J.H. Effect of corrosion on the tension behavior of painted structural steel members. J. Constr. Steel Res. 2017, 133, 256–268. [Google Scholar] [CrossRef]
- See, S.C.; Zhang, Z.Y.; Richardson, M. A study of water absorption characteristics of a novel nano-gelcoat for marine application. Prog. Org. Coat. 2009, 64, 169–174. [Google Scholar] [CrossRef]
- Beydon, R.; Bernhart, G.; Segui, Y. Measurement of metallic coatings adhesion to fibre reinforced plastic materials. Surf. Coat. Technol. 2000, 126, 39–47. [Google Scholar] [CrossRef]
- Sikdar, P.; Islam, S.; Dhar, A.; Bhat, G.; Hinchliffe, D.; Condon, B. Barrier and mechanical properties of water-based polyurethane-coated hydroentangled cotton nonwovens. J. Coat. Technol. Res. 2022, 19, 1255–1267. [Google Scholar] [CrossRef]
- Zhang, Z.; Yang, M.; He, G. Structure, mechanical, and sand erosion behavior of TiN/Ti coating deposited at various temperature. Ceram. Int. 2023, 49, 16786–16795. [Google Scholar] [CrossRef]
- Sharifzadeh, E.; Cheraghi, K. Temperature-affected mechanical properties of polymer nanocomposites from glassy-state to glass transition temperature. Mech. Mater. 2021, 160, 103990. [Google Scholar] [CrossRef]
- Shuai, J.; Zuo, X.; Wang, Z.; Sun, L.; Chen, R.; Wang, L.; Ke, P. Erosion behavior and failure mechanism of Ti/TiAlN multilayer coatings eroded by silica sand and glass beads. J. Mater. Sci. Technol. 2021, 80, 179–190. [Google Scholar] [CrossRef]
- Giúdice, C.A.; Benítez, J.C. Optimising the corrosion protective abilities of lamellar micaceous iron oxide containing primers. Anti-Corros. Method Mater. 2000, 47, 226–232. [Google Scholar] [CrossRef]
- ISO 12944-1:2017; Paints and Varnishes—Corrosion Protection of Steel Structures by Protective Paint Systems—General Introduction. International Organization for Standardization: Geneva, Switzerland, 2017.
- JT/T722-2023; Specification of Protective Coating for Highway Bridge Steel Structure. Ministry of Transport of the People’s Republic of China: Beijing, China, 2023. (In Chinese)
- ISO 527-3:2018; Plastics—Determination of Tensile Properties. International Organization for Standardization: Geneva, Switzerland, 2018.
- Nagy, A.; Ko, W.L.; Lindholm, U.S. Mechanical Behavior of Foamed Materials Under Dynamic Compression. J. Cell. Plast. 1974, 10, 127–134. [Google Scholar] [CrossRef]
- Shangguan, Y.; Chen, F.; Jia, E.; Lin, Y.; Hu, J.; Zheng, Q. New insight into time-temperature correlation for polymer relaxations ranging from secondary relaxation to terminal flow: Application of a universal and developed WLF equation. Polymers 2017, 9, 567. [Google Scholar] [CrossRef]

Disclaimer/Publisher’s Note: The statements, opinions and data contained in all publications are solely those of the individual author(s) and contributor(s) and not of MDPI and/or the editor(s). MDPI and/or the editor(s) disclaim responsibility for any injury to people or property resulting from any ideas, methods, instructions or products referred to in the content. |
© 2024 by the authors. Licensee MDPI, Basel, Switzerland. This article is an open access article distributed under the terms and conditions of the Creative Commons Attribution (CC BY) license (https://creativecommons.org/licenses/by/4.0/).