Article

Polypyrrole/α-Fe2O3 Hybrids for Enhanced Electrochemical Sensing Performance towards Uric Acid

College of Materials Science & Engineering, Henan University of Technology, Zhengzhou 450001, China
*
Authors to whom correspondence should be addressed.
These authors contributed equally to this work.
Coatings 2024, 14(2), 227; https://doi.org/10.3390/coatings14020227
Submission received: 16 January 2024 / Revised: 28 January 2024 / Accepted: 29 January 2024 / Published: 15 February 2024
(This article belongs to the Special Issue Advances in Electrochemical Sensors and Biosensors)

Abstract

:
Uric acid, a metabolite formed by the oxidation of purines in the human body, plays a crucial role in disease development when its metabolism is altered. Various techniques have been employed for uric acid analysis, with electrochemical sensing emerging as a sensitive, selective, affordable, rapid, and simple approach. In this study, we developed a polymer-based sensor (PPy/α-Fe2O3) for the accurate determination of uric acid levels. The PPy/α-Fe2O3 hybrids were synthesized using an uncomplicated in situ growth technique. Characterization of the samples was performed using scanning electron microscopy (SEM), Fourier transform infrared spectroscopy (FT-IR), X-ray powder diffraction (XRD), and X-ray photoelectron spectroscopy (XPS). The electrochemical sensing performance towards uric acid was evaluated through cyclic voltammetry (CV) and differential pulse voltammetry (DPV). The obtained results demonstrated that the sensor exhibited excellent sensitivity towards uric acid detection within a wide range of 5–200 μM with a limit of detection (LOD) as low as 1.349 μM. Furthermore, this work elucidated the underlying sensing mechanism and highlighted the pivotal role played by PPy/α-Fe2O3 hybrids in enabling efficient uric acid sensing applications using electrochemical sensors.

1. Introduction

Uric acid (UA) is a metabolite generated through the oxidation of purines within the human body. Elevated levels of serum UA (hyperuricemia) have been implicated in the pathogenesis of various diseases, including gout, nephrolithiasis, and chronic kidney disease [1,2]. Therefore, the precise and expeditious detection of UA is imperative for the diagnosis and management of these ailments. Currently, there are several methods for determining serum UA levels, including high-performance liquid chromatography (HPLC) [3], colorimetric methods [4,5], and enzymatic methods [6,7]. However, these techniques require expensive equipment or complicated operating procedures, which limit their widespread use in clinical laboratories.
Electrochemical detection has gained significant attention in recent years due to its high sensitivity, selectivity, affordability, rapid response time, and simplicity when compared to other methods [8,9]. Electrochemical-based sensors have been extensively employed for the detection of environmental pollutants such as heavy metals (e.g., arsenic, cadmium, mercury, lead, and chromium) [10,11,12,13,14,15] as well as organic pollutants, including toxins, pesticides, antibiotics, phenolics, etc. [16,17,18,19]. With technological advancements, electrochemical biosensing technology is gradually replacing traditional biological sensing techniques for various applications like dopamine and glucose detection. Currently, the limit of detection (LOD) achieved through electrochemical techniques is approximately 1–25 nM [20,21,22,23,24] and 0.1–0.3 μM [25,26,27] for dopamine and glucose, respectively. Notably, fruitful results have also been obtained in utilizing electrochemical detection for UA research [28,29,30,31,32].
Sensor materials play a crucial role in electrochemical sensing technology due to their large surface areas, excellent electrochemical activity, and ability to promote electron transfer reactions. Transition metal oxides, such as ZnO [33,34], CuO [35], NiO [36], and Fe2O3 [37,38], are extensively utilized for electrochemical sensors owing to their remarkable properties. Among them, α-Fe2O3 is considered the most promising material due to its non-toxicity; its biological, economical, and chemical inertness; as well as its outstanding electrical and catalytic characteristics. However, the easy aggregation, poor dispersibility, and conductivity limitations of transition metal oxides significantly hinder their electrochemical performance. To address this issue effectively, extensive research has focused on incorporating conductive materials to enhance the electrochemical sensing capabilities. Noble metals like Au and Ag have been doped into transition metal oxide sensors to improve their electrochemical performance [39,40]. Additionally explored are conductive carbon materials such as graphene and carbon nanotubes that possess high surface areas along with excellent electron mobility while being environmentally friendly and non-toxic. These have been widely investigated as substrates for electrochemical sensors [16,32,41,42]. However, the preparation process of graphene and carbon nanotubes is intricate and prone to agglomeration. In comparison with these options, conductive polymer materials offer simpler preparation processes, better formability, and greater suitability for wearable devices; hence, they represent an important research direction in the field of electrochemical sensing at the present time. Among various extensively studied conductive polymers, polypyrole (PPy) stands out due to its facile synthesis, high electrical conductivity, and good stability.
In conclusion, α-Fe2O3 displays remarkable potential as a sensitive material for UA detection, while PPy has the ability to enhance electron mobility. Furthermore, both materials are harmless to the environment and non-toxic. Taking into account these factors, we fabricated nano-α-Fe2O3 decorated PPy hybrids in this study to detect UA. The utilization of in situ synthesis techniques effectively prevented the agglomeration of α-Fe2O3 particles and the incorporation of PPy significantly improved their electron mobility. The electrochemical sensing performance of UA was comprehensively characterized through the use of diverse analytical techniques. Moreover, the mechanism underlying UA sensing was also elucidated.

2. Experimental Section

2.1. Materials and Solvents

Pyrrole (Py) was obtained from Ron’s Reagent. Ferric chloride hexahydrate (99%, FeCl3·6H2O) and uric acid (99%, UA) were both purchased from Aladdin Biochemical Technology Co., Ltd. (Shanghai, China). Ammonia was obtained from Huateng Chemical Co., Ltd. (Beijing, China). Nafion was purchased from DuPont Inc. Phosphate buffer saline (0.1 M, PBS) was purchased from Solarbio Science & Technology Co., Ltd. (Beijing, China). High-purity nitrogen was provided by Yingzhong Chemical Products Technology Co., Ltd. (Zhengzhou, Henan, China). Absolute ethanol and methanol were purchased from Damao Chemical Reagent Factory (Tianjin, China). All chemical reagents used in this study were of analytical grade and were used without further treatment after purchase.

2.2. The Fabrication of PPy/α-Fe2O3 Composite

The pure α-Fe2O3 nanoparticle (NP) was synthesized through a hydrothermal reaction using FeCl3·6H2O and ammonia as raw materials. Firstly, a certain amount of FeCl3·6H2O was dissolved in deionized water. Then, NH3·H2O was added drop by drop and the mixture was continuously stirred for 1 h. The resulting emulsion was then transferred to a reactor and placed in an oven for the complete reaction. After the reaction, the solution was centrifuged, washed with distilled water several times, and dried in a vacuum oven at 60 °C. The dried sample was ground into a fine powder and then subjected to calcination at 350 °C in a Muffle furnace with a heating rate of 10 °C/min for 30 min, resulting in the formation of α-Fe2O3.
The pure PPy was prepared by a simple polymerization reaction. Firstly, an appropriate amount of FeCl3·6H2O was weighed and dissolved in deionized water to prepare an aqueous solution. Then, a certain quantity of pyrrole was added to deionized water, followed by the gradual addition of the FeCl3 solution while maintaining stirring at room temperature for 10 h, resulting in the formation of a black slurry. The obtained black precipitate was washed multiple times with methanol and distilled water, then dried at 60 °C in a vacuum oven to obtain pure PPy.
The PPy/α-Fe2O3 composites were prepared by a simple in situ growth technology, as shown in Scheme 1. Firstly, pyrrole droplets were added to deionized water and stirred magnetically to form a pyrrole suspension. Different amounts of α-Fe2O3 were added to the pyrrole suspension and sonicated for 1 h. Secondly, a certain amount of FeCl3·6H2O was dissolved in 100 mL of deionized water. After complete dissolution, it was added dropwise to the above solution to obtain a black emulsion, which was fully reacted by magnetic stirring for 10 h. Thirdly, at the end of the reaction, the precipitate was collected and washed successively with methanol and distilled water. The products were dried in a vacuum dryer. A series of samples were prepared and recorded as PPy/α-Fe2O3−X, where X corresponds to the molar ratio of nano-α-Fe2O3 to polymer precursors. In this study, pure PPy was used as a control sample.

2.3. Characterization

The microstructure and morphology of the pure PPy, α-Fe2O3, and PPy/α-Fe2O3 composites were observed using scanning electron microscopy (SEM, INSRECT F50, FEI, USA). The chemical structure of the composite was characterized by Fourier transform infrared spectroscopy (FT-IR, Nicolet Is-20, ThermoFisher, China). The chemical composition of the samples and the existence state of these elements were analyzed with reference to the C1s signal peak (~284.8 eV) by using X-ray photoelectron spectroscopy (XPS, ThermoFisher, ESCALAB Xi+, China). The crystal structure of the synthesized composites was determined through X-ray diffraction (XRD, Bruker D8 ADVANCE, Germany). Cyclic voltammetry (CV) and differential pulse voltammetry (DPV) were measured by an electrochemical workstation (CHI 760E, China) in a standard three-electrode configuration with Pt wire as the counter electrode and Hg/HgCl as the reference electrode. The electrolyte solution was 0.1 M PBS solution saturated with N2.

2.4. Preparation of Working Electrodes

The exposed surface of the glass carbon electrode (with an inner diameter of 3 mm and an outer diameter of 6 mm) was polished with aluminum oxide polishing powder (0.05 μm). The polished, bare electrode was sonicated in ethanol and deionized water for 2 min and dried at room temperature. The 5 mg sample was dispersed in a mixture of 1 mL deionized water, 0.5 mL anhydrous ethanol, and 10 μL 0.5 wt% nafion solution, and a uniform mixture was formed after sonication for 3 h. PPy/α-Fe2O3/GCE can be obtained by coating 6 μL of the sample suspension uniformly on a glass carbon electrode and drying at room temperature. Using the PPy/α-Fe2O3/GCE nanocomposite sensor prepared after drying, the UA was qualitatively and quantitatively analyzed by adjusting and optimizing the suitable voltage.

2.5. Biosensing Performance Measurements

Whether the modified electrode reacted with UA was determined by performing CV tests in 0.1 M of nitrogen-saturated PBS electrolyte. The working electrode, reference electrode, and counter electrode were immersed in a PBS electrolyte containing 5 mM UA, and CV tests were conducted on the working electrode after the electrochemical workstation was stabilized. The voltage range in the test was controlled within −1.6~0.5 V, and the scanning rate was 50 mV·s−1. Activation was required before accurate testing, and the CV test was performed after the working electrode was stabilized. The REDOX peak, peak current position, and peak height were observed to determine whether the working electrode had a response to UA and the best response. After selecting the best response ratio, CV tests were conducted on the working electrode at different scanning rates, and linear fitting was performed according to the data. The UA reaction mechanism was determined by fitting the curve.
DPV tests were performed on PBS electrolytes containing different concentrations of UA. By linear fitting the peak current value, the limit of detection (LOD) of UA was calculated according to the equation LOD = 3σ/K. LOD is the detection limit; σ is the standard deviation of the blank sample measurement, that is, the determination of 0.1 mM UA-free saturated nitrogen PBS solution with PPy/α-Fe2O3 composite material; and the K value is the slope of the DPV simulation curve.

3. Results and Discussion

3.1. Characterizations of Samples

The FT-IR spectrum of α-Fe2O3, PPy, and PPy/α-Fe2O3 is presented in Figure 1a to elucidate the material composition. As depicted in the figure, distinct characteristic absorption peaks of pure PPy are prominently observed at 3445.6 cm−1, 1536 cm−1, 1451.1 cm−1, 1303.2 cm−1, 1170.1 cm−1, 1040.9 cm−1, and 901.6 cm−1, which correspond to the symmetric stretching mode of the imino group (N−H), the symmetric stretching mode of C=C, the stretching mode of C−C, the bending mode of C=N, the stretching mode of C−N, the bending mode of =C−H, and the stretching mode of =C−N+−C, respectively [43,44]. These peaks provide evidence for the formation of PPy and its effective oxidation by FeCl3. In the α-Fe2O3 NP spectrum, a weak peak is observed at 1630.5 cm−1 due to O−H stretching vibrations from water molecules, while peaks at 561.2 cm−1 and 480 cm−1 correspond to the vibration of the chemical bond of Fe3+−O2−, which are basically in accordance with the literature values [45,46]. Comparatively lower wavelength shifts are observed in all characteristic peaks when comparing the spectrum obtained for PPy/α-Fe2O3 with that for pure PPy, indicating synergistic electron interactions between the PPy chain and α-Fe2O3 NP. Notably, no significant peak corresponding to α-Fe2O3 NP is observed in the PPy/α-Fe2O3 spectrum, suggesting its encapsulation within the PPy matrix (as confirmed by SEM images).
The crystal structures of pure α-Fe2O3, PPy, and the PPy/α-Fe2O3 composite materials were analyzed using X-ray diffraction (XRD) patterns, as depicted in Figure 1b. For pure α-Fe2O3, the seven characteristic peaks observed at 24.2°, 33.5°, 36.3°, 43.3° 51.4°, 53.5°, and 64.1° corresponded to the diffraction planes of (012), (104), (110), (113), (024), (116), and (300), respectively. Similarly, the XRD pattern of the PPy sample exhibited an amorphous structure with a broad peak centered around 24°, indicative of its non-crystalline nature [47]. Upon combining these components in the composite material formulation, apart from the broad peaks attributed to PPy’s amorphous phase presence, distinct peaks corresponding to α-Fe2O3 were also detected by XRD analysis, confirming the successful compounding of PPy/α-Fe2O3 composites. Furthermore, the study revealed that the surface functionalization of PPy did not induce any changes in either the crystal structure or phase characteristics of α-Fe2O3.
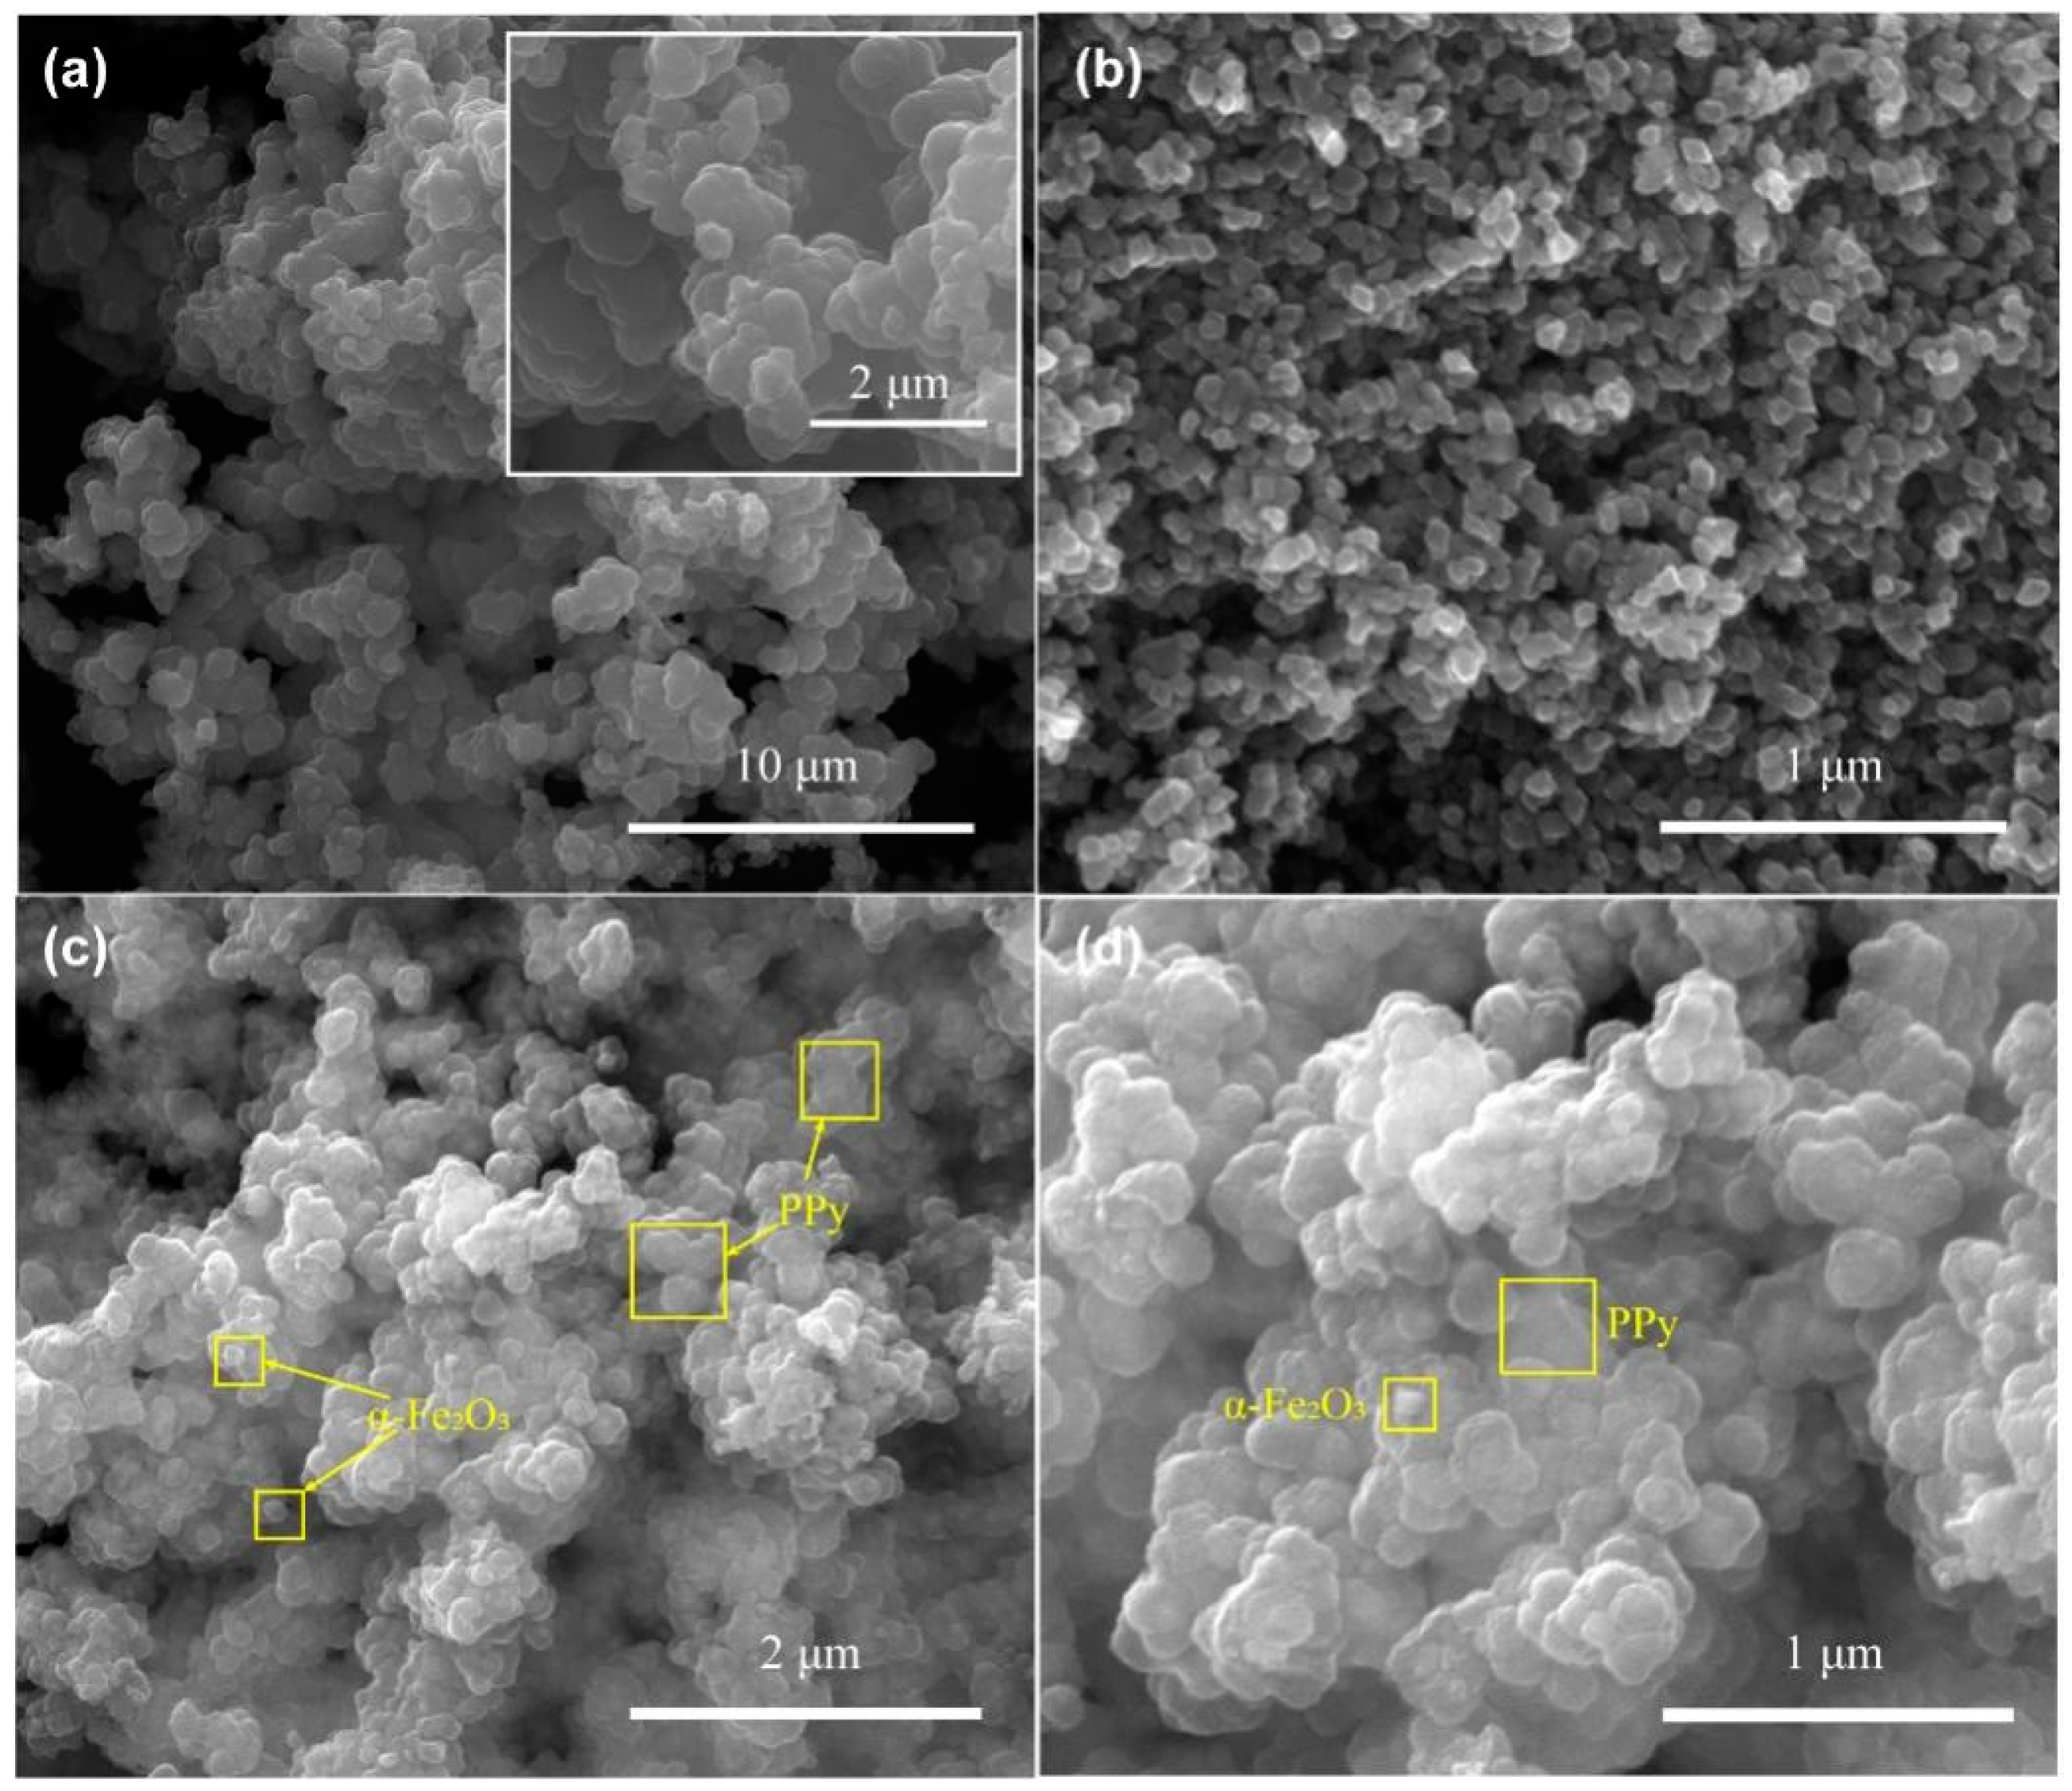
The microstructure and morphology characteristics of PPy, α-Fe2O3, and PPy/α-Fe2O3 composites were investigated using scanning electron microscopy (SEM), as depicted in Figure 2. The bare PPy exhibited a layered structure with each layer resembling several irregular particles adhered together (Figure 2a). The presence of the five-membered ring structure in Py contributed to the stiffness of PPy, resulting in its layered morphology. Additionally, the flexibility observed in the irregular particle morphology was attributed to the C-C bonds connecting the structural units of PPy. The morphology of α-Fe2O3 consisted of uniformly distributed nanoparticles with an average particle size of approximately 70 nm (Figure 2b). Upon composite formation with α-Fe2O3, SEM analysis revealed that apart from retaining its layered morphology, small dispersed α-Fe2O3 particles were also observed on the surface of PPy (indicated by yellow squares and arrows in Figure 2c,d). Notably, some α-Fe2O3 nanoparticles were encapsulated within the PPy matrix. These SEM images confirmed the successful fabrication and distribution of α-Fe2O3 NPs on the surface as well as within the matrix of PPy. Furthermore, EDS investigation provided additional evidence for the presence of both PPy and α-Fe2O3 within the composite material (Figure S1).
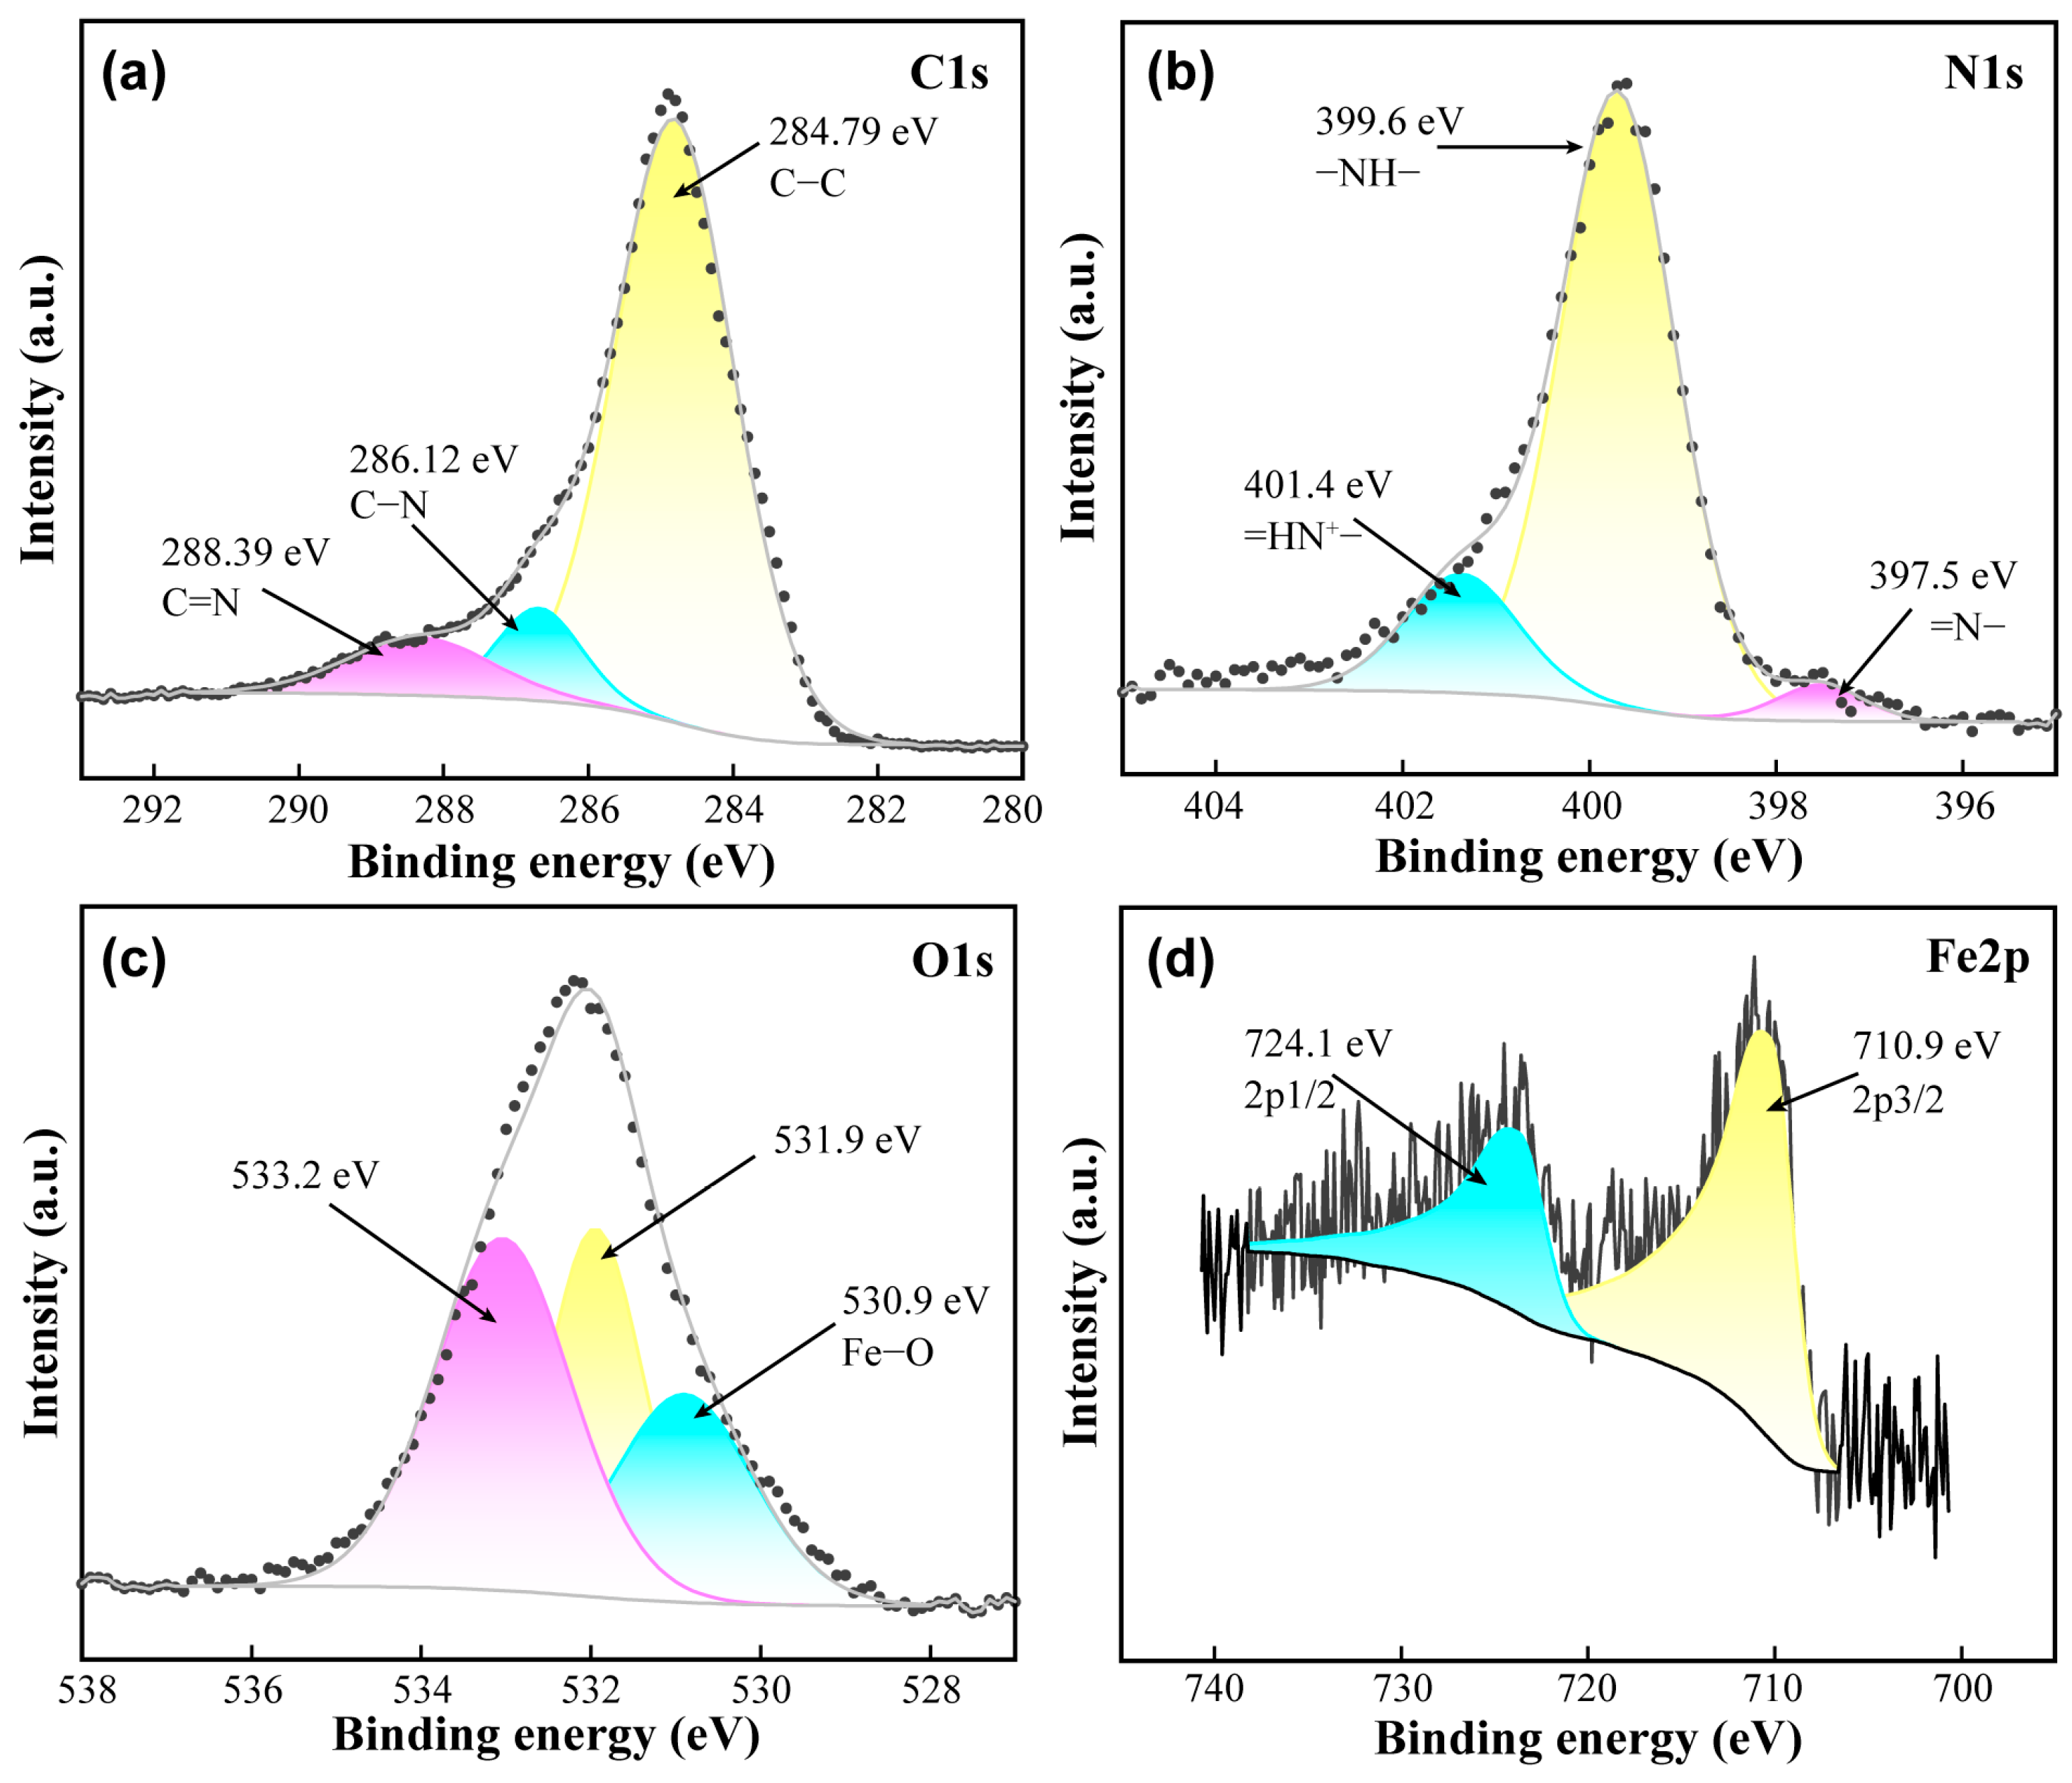
XPS spectroscopy was employed to investigate the surface chemical composition and the chemical state of α-Fe2O3, PPy, and PPy/α-Fe2O3 composites. As shown in Figure S2, the XPS spectra reveal the presence of C, O, and N elements in the pure PPy samples; Fe, C, O, and N elements in the PPy/α-Fe2O3 composites; and Fe, O, and C (impurity) elements in the bare α-Fe2O3 samples. These findings are consistent with the EDS and XRD results. Importantly, the XPS results also confirmed that the lower content of Fe in the composite was due to the encapsulation of α-Fe2O3 within the PPy matrix observed by SEM and FT-IR analysis. A representative XPS spectrum illustrating the structure of the PPy/α-Fe2O3 nanocomposite is shown in Figure 3. The core-level C 1s spectra are curve-fitted into three groups: C−C (284.79 eV), C−N (286.12 eV), and C=N (288.39 eV) from PPy (Figure 3a). In Figure 3b, the N 1s peaks at 397.5 eV, 399.6 eV, and 401.4 eV for PPy/α-Fe2O3 are assigned to the imine group (−NH−), the charged polaronic nitrogen group (=HN+−), and the neutral pyrrolylium nitrogen group (=N−) in PPy, respectively. The presence of these functional groups confirms the existence of PPy within the composite material. The core-level O 1s spectrum is deconvoluted into three peaks corresponding to the O−H species (531.9 eV) and surface adsorbed oxygen (533.2 eV) of the PPy and the Fe-O bonds (530.9 eV) of the α-Fe2O3 (Figure 3c). The Fe 2p peaks are separated into Fe 2p1/2 (724.1 eV) and Fe 2p3/2 (710.9 eV) for α-Fe2O3 in Figure 3d, which further supports its existence.

3.2. Electrochemical Performance of PPy/α-Fe2O3 Composite

The electrochemical properties of pure PPy, α-Fe2O3, and PPy/α-Fe2O3 hybrid electrodes were investigated by cyclic voltammetry (CV) and electrochemical impedance spectroscopy (EIS) in a KCl solution (0.1 mol/L) containing 5 mM [Fe(CN)6]3−/4−. As depicted in Figure 4a,b, the PPy/α-Fe2O3 hybrids exhibit enhanced electrochemical activity compared to bare PPy and α-Fe2O3, particularly for sample PPy/α-Fe2O3−2. From Figure 4c,d, it can be observed that the charge transfer resistance (Rct) is lowest for the PPy/α-Fe2O3−2 sample, indicating an increase in the conductivity of α-Fe2O3 after loading with PPy. The electroactive surface area (ESA) was calculated using the Randles–Sevcik equation [48]:
I p = 2.69 × 10 5 A D 1 / 2 n 3 / 2 ν 1 / 2 C
where A represents the ESA, ν denotes the scan rates, D refers to the diffusion coefficient, n represents the electron transfer number, and C signifies the concentration of [Fe(CN)6]3−/4−. The peak current for all electrodes, as shown in Figure S3b,d,f,h,j,l, exhibits a strong linear relationship with the square roots of the scan rate. Equation (1) can be used to calculate the ESA by determining the slope of the IP-V1/2 curve. The PPy/α-Fe2O3−2 hybrids demonstrate a significantly higher ESA value (0.242 cm2) compared to pure PPy (0.206 cm2) and α-Fe2O3 (0.215 cm2), indicating an abundance of active sites on the PPy/α-Fe2O3−2 hybrids.
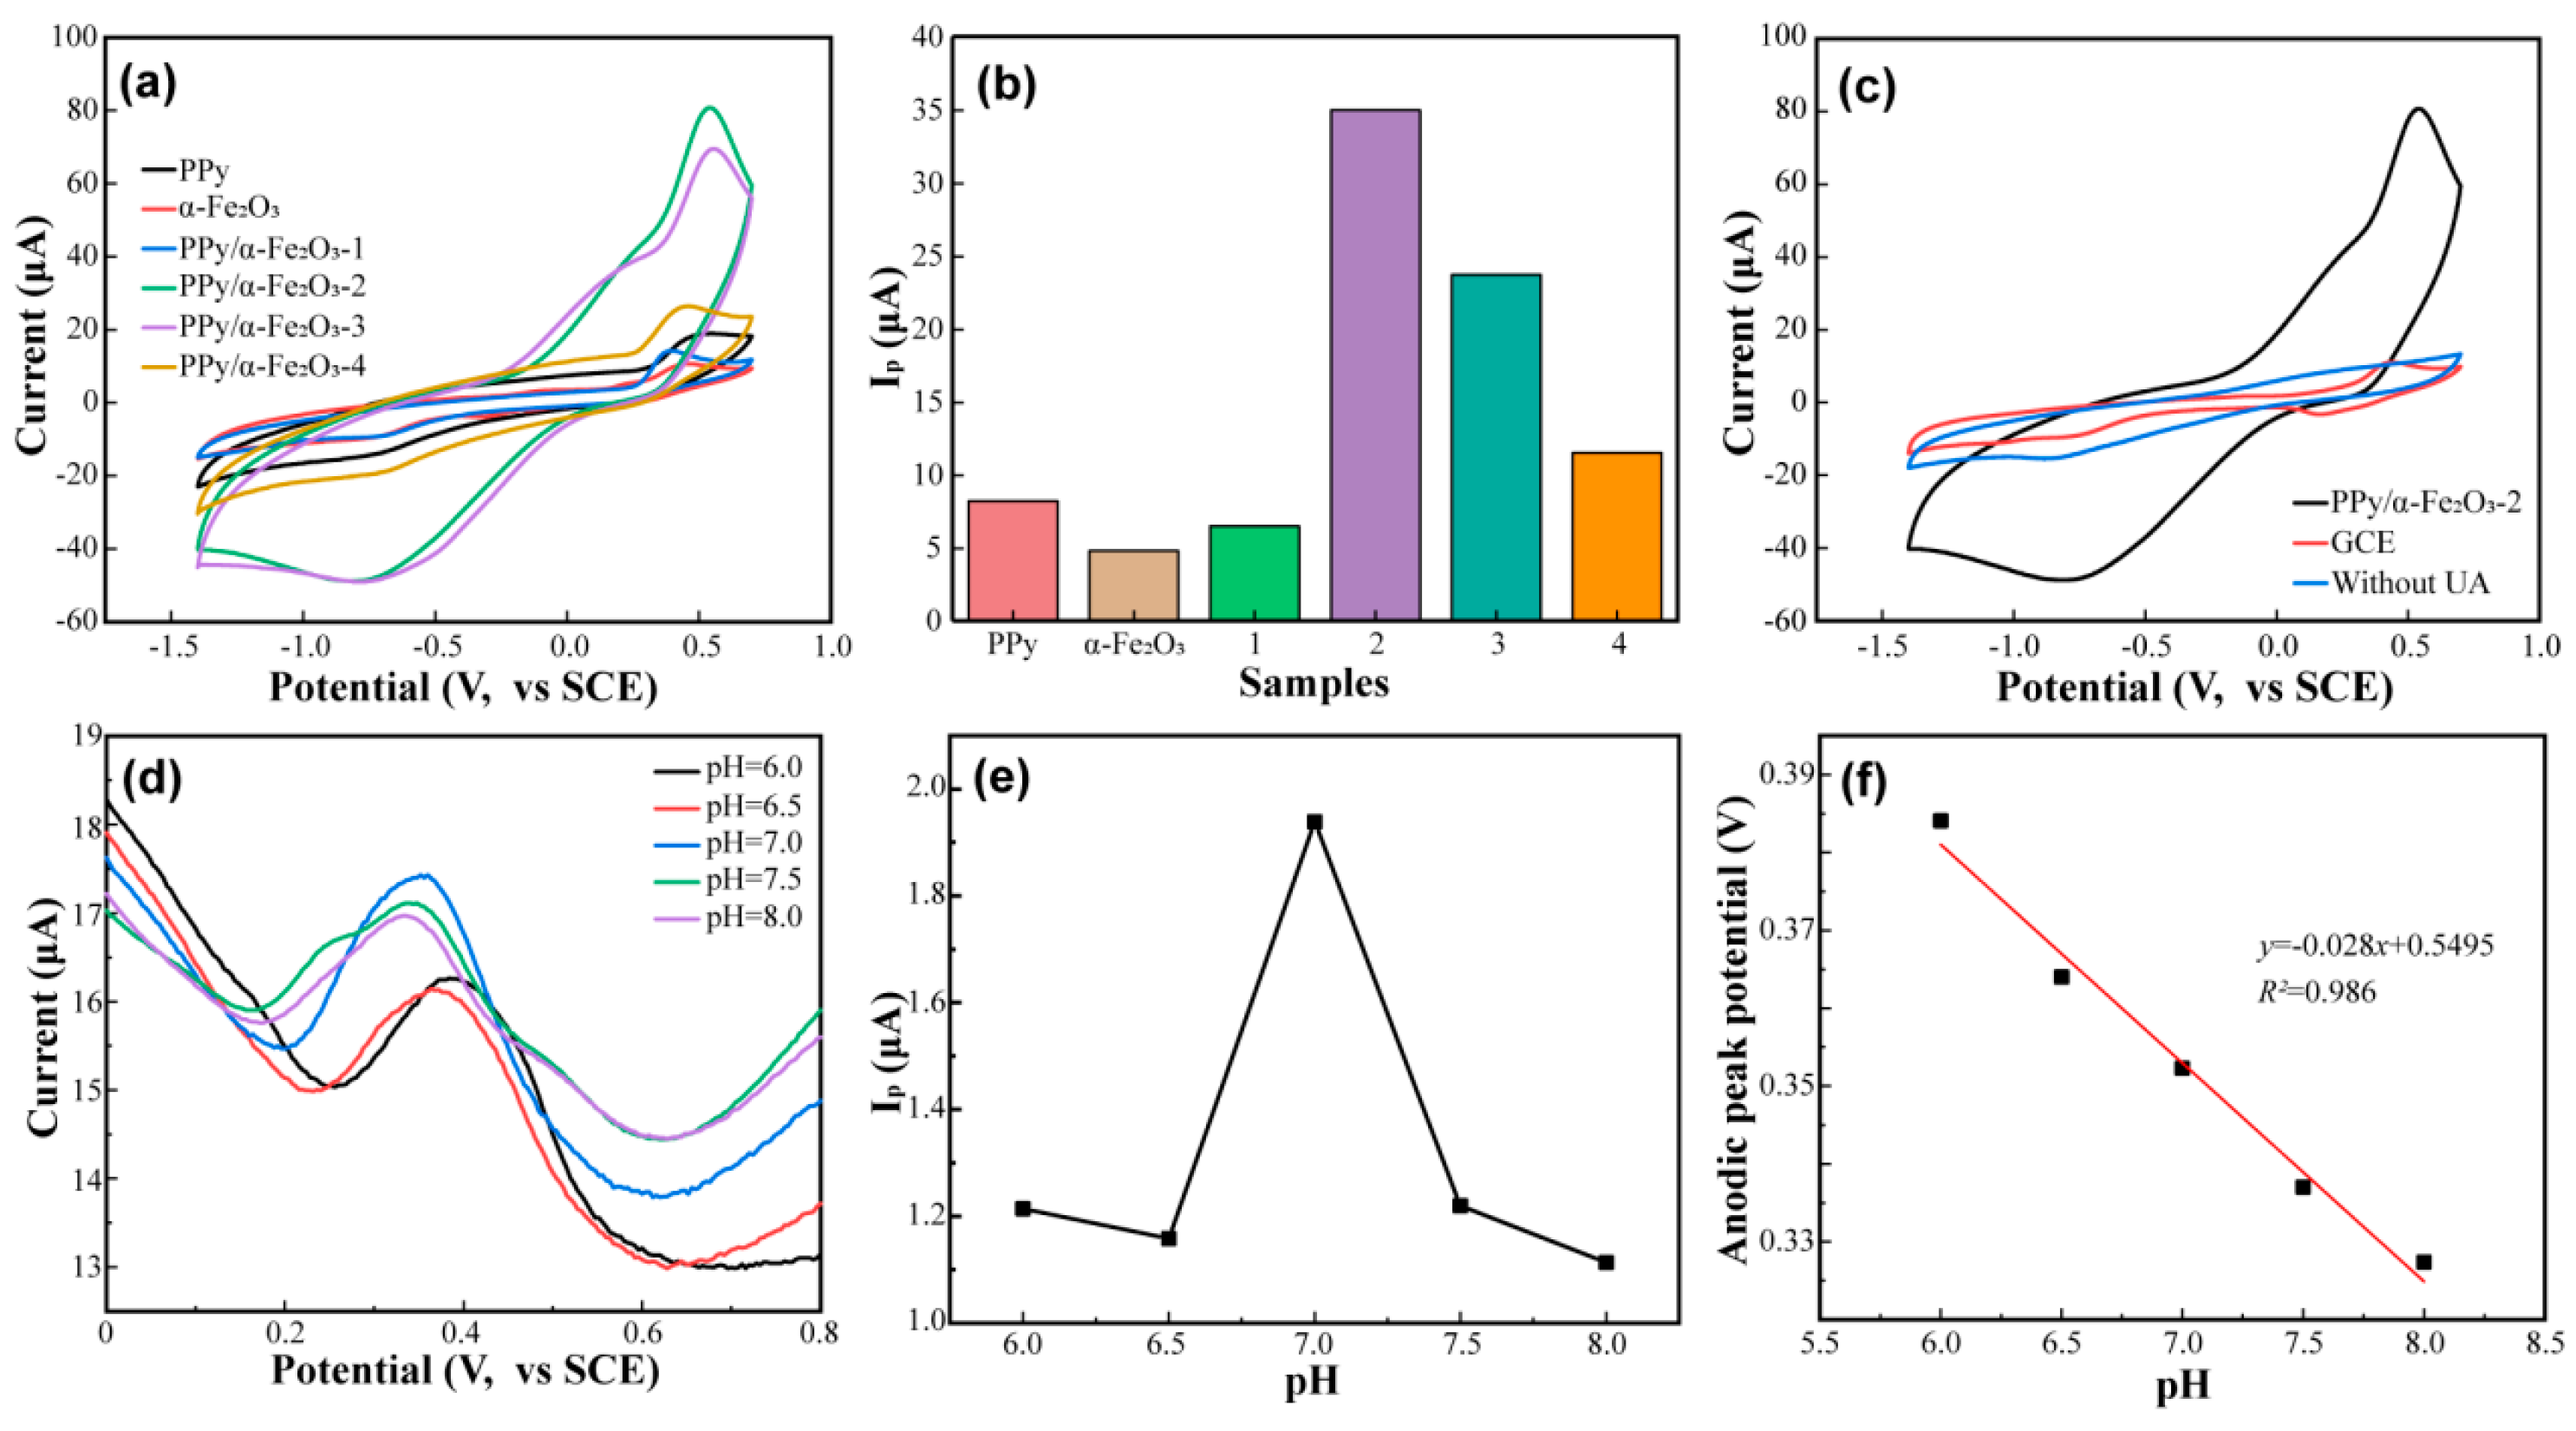
To investigate the sensing performance of the PPy/α-Fe2O3 composite towards UA, the electrochemical responses of UA on various modified electrodes were examined by using cyclic voltammetry (CV). CV scans were performed with different modified electrodes as working electrodes in nitrogen-saturated PBS containing 0.5 mmol/L UA, employing a scanning rate of 50 mV/S. The CV responses of PPy, α-Fe2O3, and PPy/α-Fe2O3 electrodes towards UA are shown in Figure 5a. As depicted in the figure, pure PPy and α-Fe2O3 exhibited a low response within the voltage range 0.2–0.6 V, corresponding to the response towards UA. Most of the PPy/α-Fe2O3 composites displayed a significantly higher current response with a pair of REDOX peaks. However, when a small amount of α-Fe2O3 was added to modify PPy (PPy/α-Fe2O3−1), a weaker current response was observed. This could be attributed to the encapsulation of most of the α-Fe2O3 into PPy at low content levels, resulting in fewer exposed active sites for interaction with UA. In addition, the recombination of a small amount of α-Fe2O3 also reduced the charge transport performance of PPy to a certain extent. We hypothesized that the composite should exhibit an enhanced response compared to pure PPy due to the presence of the polyvalent iron element as an active center in α-Fe2O3. Actually, with the increasing content of α-Fe2O3, particularly in sample PPy/α-Fe2O3−2, a distinct peak response was observed within the range of 0.2–0.6 V, further confirming that the incorporation of α-Fe2O3 effectively enhances UA detection capability. However, as the content of α-Fe2O3 exceeded an optimal level, we noticed a relative weakening in response, which could be attributed to agglomeration caused by excessive amounts of α-Fe2O3 leading to the reduced exposure of active sites on the composite surface. Furthermore, excess amounts of α-Fe2O3 were found to negatively impact the charge transport performance and subsequently reduce its responsiveness towards UA detection.
Figure 5b demonstrates that an optimized composition ratio between PPy and α-Fe2O3 leads to enhanced electrocatalytic activity for UA detection compared to the individual materials alone. When the content of α-Fe2O3 is low, the current response of UA closely resembles that of pure PPy and α-Fe2O3. However, as the α-Fe2O3 content increases to PPy/α-Fe2O3−2, the current response of UA reaches its maximum value, which is approximately five times higher than that observed for bare PPy. Nevertheless, a further increase in the α-Fe2O3 content results in a decrease in the current response of UA. These findings suggest that the presence of α-Fe2O3 facilitates an increased electrochemical surface area and promotes more active sites for electrocatalysis, thereby synergistically enhancing the oxidation reaction of UA. In summary, based on our observations, an optimal composition ratio for maximizing UA oxidation can be achieved with the composite PPy/α-Fe2O3−2.
The CV curves of the PPy/α-Fe2O3 electrode with and without 0.5 mM UA, as well as the bare glass carbon electrode (GCE), are presented in Figure 5c. Upon the addition of 0.5 mM of UA, an oxidation peak was observed near 0.2 V and 0.4 V in the CV curve, demonstrating a significantly enhanced current signal compared to the oxidation peak at 0.4 V observed without UA. This observation suggests that the primary reaction predominantly occurs at this potential, which is consistent with the expected response of UA [28].
The effect of pH on the electrochemical response of UA was investigated through DPV measurements in a buffer solution with a pH range from 6.0 to 8.0. As depicted in Figure 5d, the anodic peak potentials shifted negatively as the pH value increased from 6.0 to 8.0. Furthermore, Figure 5f illustrates a linear correlation between the anodic peak potential (Eap) and pH value, with a linear regression equation of y = 0.028   p H + 0.5495   R 2 = 0.986 . The slope value is half that calculated from the Nernst equation, which is 0.0592 V/pH, indicating that twice as many as electrons are involved in oxidation compared to protons (2 e and 1 H + ) [49]. The electrochemical oxidation process can be expressed by the equation in Figure S4. Due to the electrical absorption of the carbonyl group, the unpaired electrons on the intermediate tertiary amine of the two carbonyl groups may become electron donors. UA donates an electron from the intermediate tertiary amine of both carbonyl groups, resulting in the formation of a cation radical. Upon proton loss, this cation radical transforms into a radical species. Subsequently, this radical species loses an electron and undergoes hydrolysis to form a secondary amine. The aforementioned prediction was consistent with earlier reports on the oxidation of similar structures [31]. Additionally, as shown in Figure 5e, the anodic peak current reached its maximum at a pH of 7.0; therefore, all electrochemical measurements were conducted at this pH.
In order to further investigate the reaction mechanism of UA at the electrode interface, we examined the mechanism by varying the scanning rate in a nitrogen-saturated PBS solution containing 0.5 mmol/L of UA. Figure 6a illustrates the cyclic voltammograms of 0.5 mmol/L of UA at the PPy/α-Fe2O3 modified electrode interface under different scan rates from 30 mV/s to 100 mV/s. The voltammograms exhibited an increase in the oxidation current peak with higher scan rates. The relationship between the square root of the scan rate and the redox peak current values is depicted in Figure 6b. The redox peak current values demonstrate a strong linear correlation with the square root of the scanning rate within the range of 30 mV/s to 100 mV/s, following I μ A = 4.47 V 1 / 2 m V 1 / 2 / s 1 / 2 + 14.48 R 2 = 0.99 , where I represents the peak current and V represents the scanning rate. The direct proportionality observed between the square root of the scan rate and the oxidation current peaks indicates that the UA oxidation is diffusion-controlled at the electrode interface. Furthermore, through Figure 6a, it can be observed that there is partial inconsistency between the oxidation and reduction processes, suggesting that UA undergoes a quasi-reversible, rather than completely reversible, redox process.
The sensitivity of the developed electrode towards UA detection was evaluated using the differential pulse voltammetry (DPV) technique, and the results are presented in Figure 6c,d. Figure 6c illustrates the DPV voltammograms obtained for a wide range of UA concentrations ranging from 5 μmol/L to 200 μmol/L. The DPVs exhibited an oxidation potential peak at approximately 0.32–0.35 V. Additionally, Figure 6d demonstrates the relationship between UA concentration and its corresponding oxidation current peak. The findings revealed that as the concentration of UA increased, so did the oxidation current peak. A strong linear correlation was observed between the oxidation peak current and UA concentration, indicating that the PPy/α-Fe2O3−2 modified electrode can be effectively employed for the quantitative detection of UA. Based on the fitted linear correlation equation Ip (µA) = 0.0486C(×10−6 M) − 0.4088 (R2 = 0.992), where I represents the oxidation peak current and C denotes the UA concentration, it can be inferred that this modified electrode has a limit of detection (LOD) for UA determined to be approximately 1.349 μM using DPV technique according to the LOD = /K formulae calculation method applied herein. The performance of the PPy/α-Fe2O3 sensor was compared with that of other sensors, as summarized in Table 1. In terms of UA detection, the PPy/α-Fe2O3 electrode exhibited a significantly lower LOD compared with the W-ZIF-67, the Au/Ni-MOF, the UOx/ZnONFs, the GP5AuNPs5, the holey MoS2, and the Co0.01Ni0.99Fe2O4 electrodes. In addition, the LOD achieved by our fabricated sensors is two orders of magnitude lower than the normal physiological levels found in healthy individuals, thus highlighting great potential value for PPy/α-Fe2O3 as a low-cost electrocatalyst in detecting UA.
The stability of the PPy/α-Fe2O3−2 hybrid decorated electrode was evaluated by CV over 100 cycles within a potential window ranging from −1.4 V to 0.7 V. As illustrated in Figure 6e,f, only a marginal decrease of 1.31–1.33% in the redox peak current was observed even after 50 or 100 cycles, indicating excellent stability. Additionally, Figure S5a illustrates the long-term stability of the PPy/α-Fe2O3−2 hybrid electrode by showcasing its current density responses over a period of 180 days. Remarkably, even after this extended duration, the electrode exhibits an impressive retention rate of 97.7% in response to UA. The interference of dopamine (DA) and ascorbic acid (AA) in clinical analysis is significant. Figure S5b presents the selectivity test against UA of the PPy/α-Fe2O3−2 hybrid sensor in PBS at a pH of 7.0. It is evident that there exists a potential difference of 0.399 V between the oxidation potentials of DA and UA. Based on this observation, the oxidation peak of UA is sufficiently separated from that of DA, indicating the excellent selectivity of the hybrid sensor for UA detection at a specific operating voltage.

3.3. The Detection Mechanism

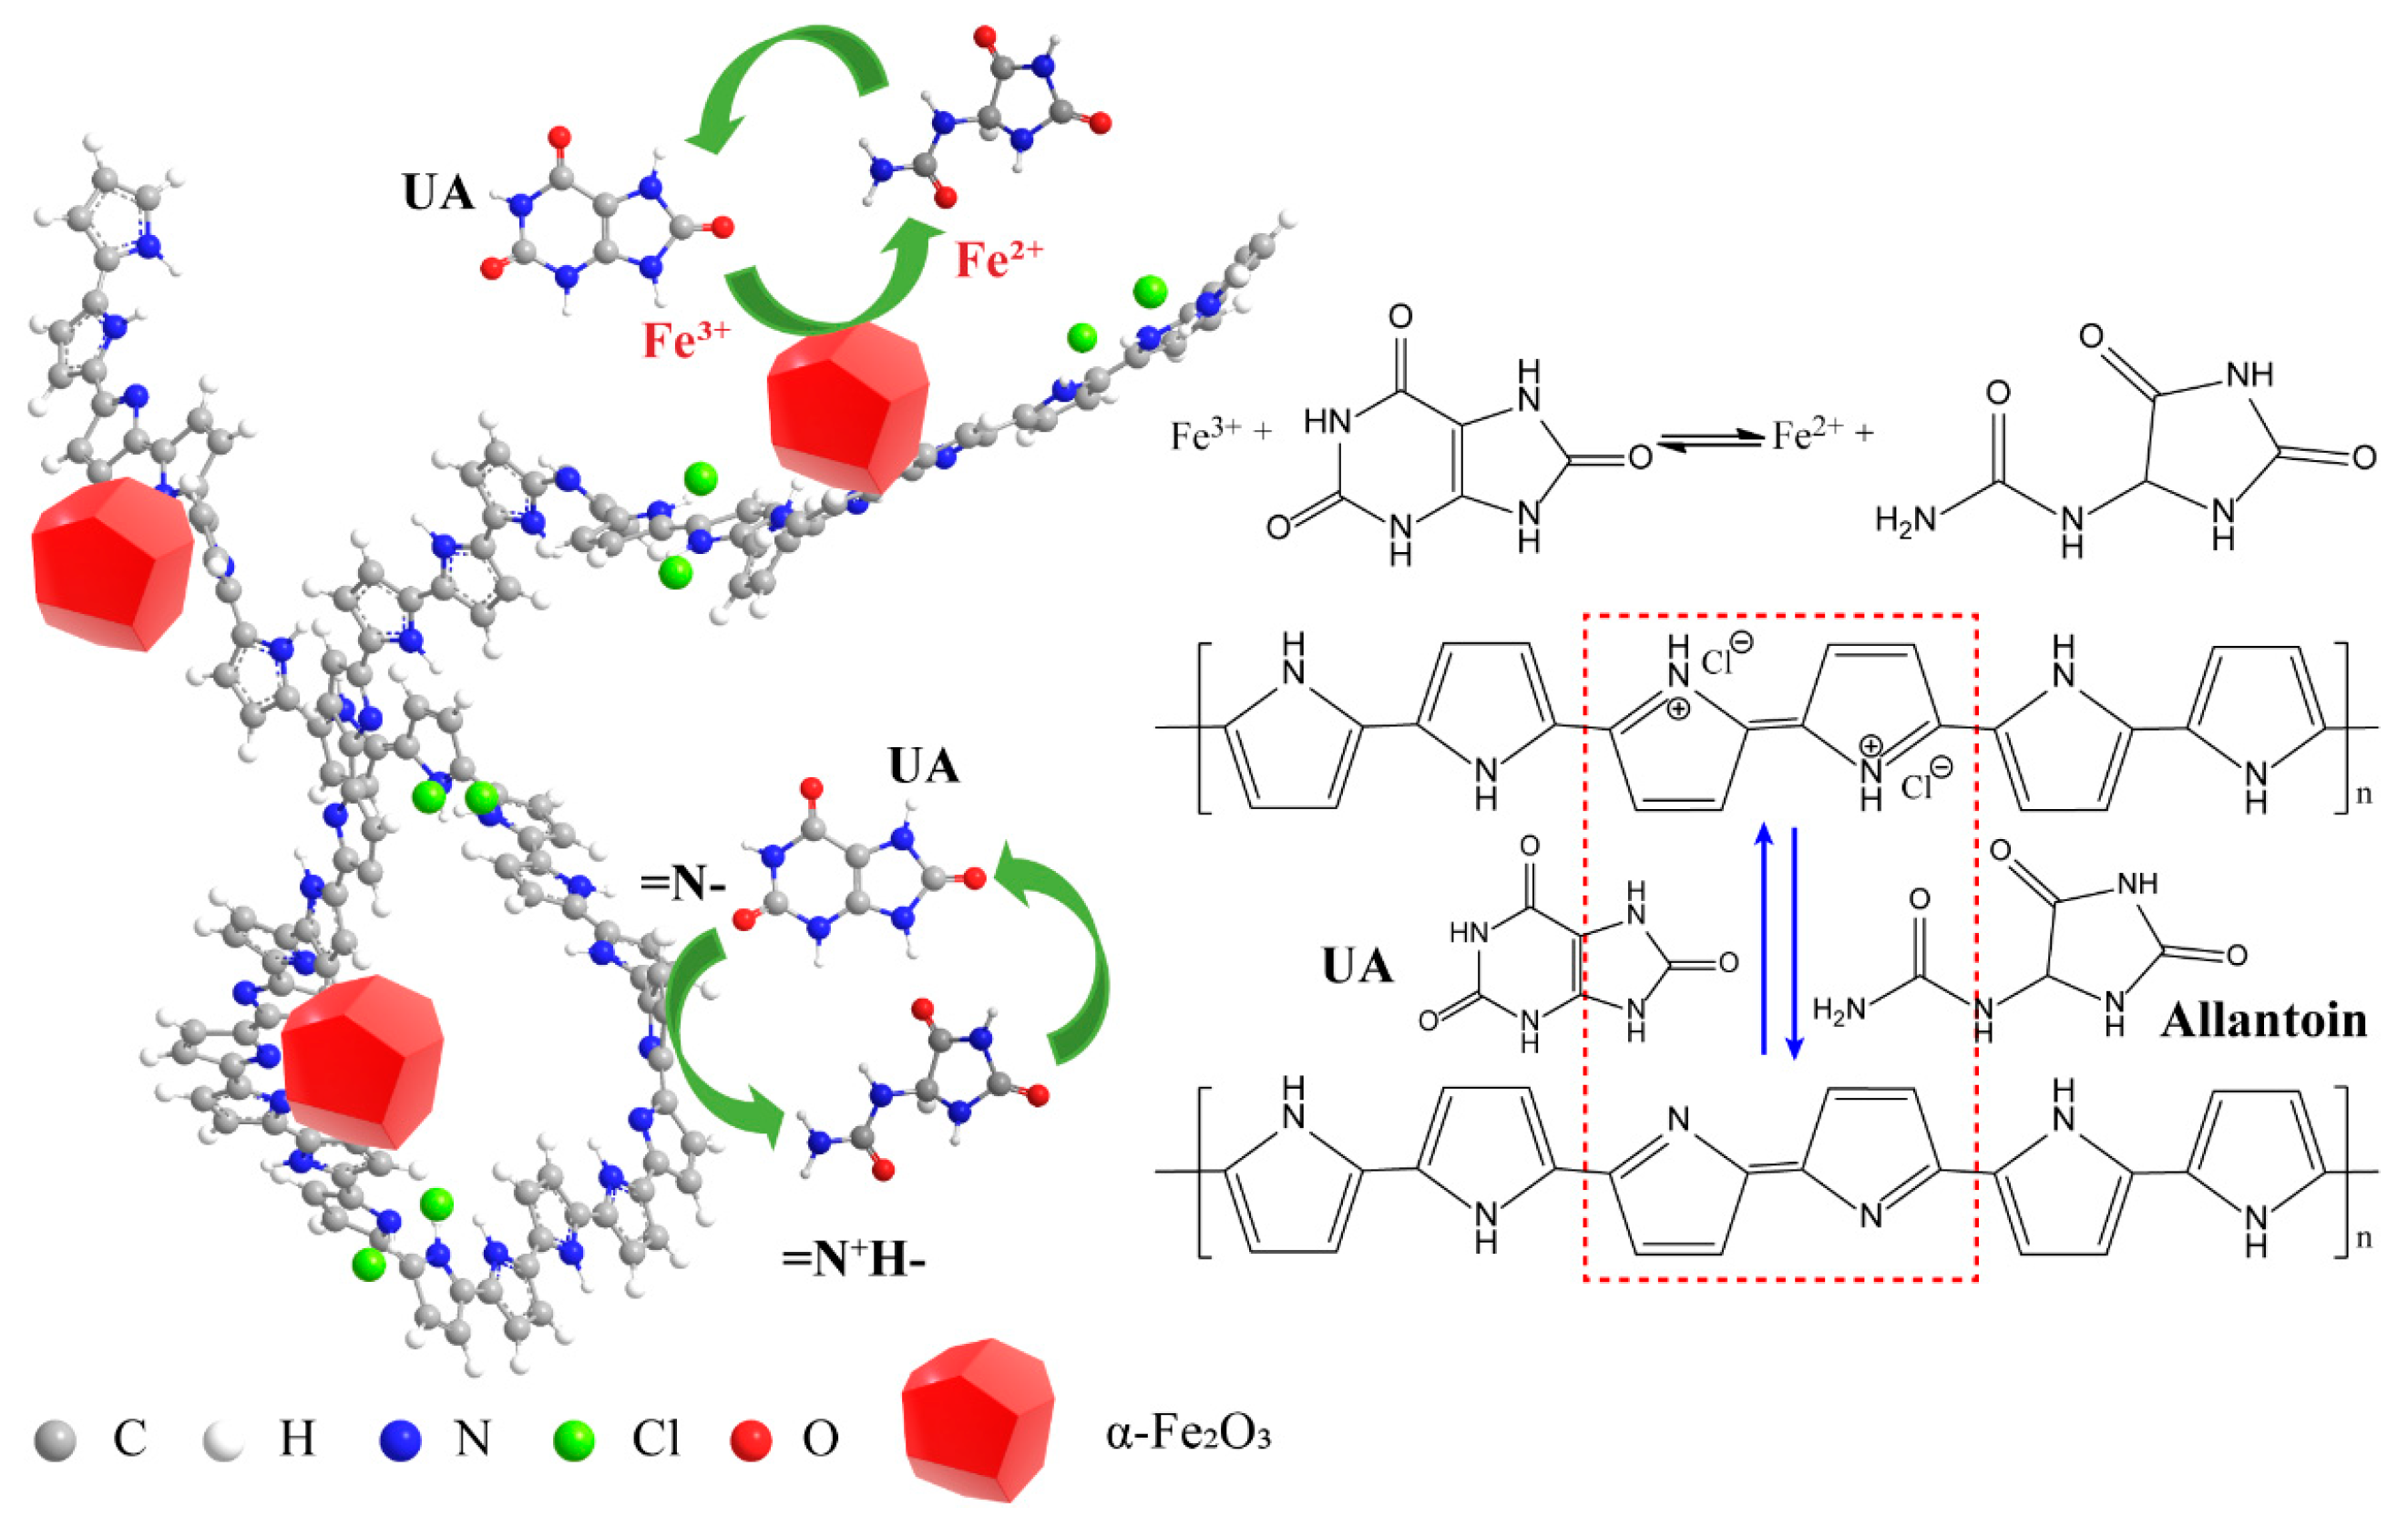
The sensor detection is based on the REDOX reaction of the UA molecule on the sensor surface. As illustrated in Figure 7, the oxidation of UA occurs through a double electron transfer process involving one proton. In the anode reaction, Fe3+ ions on the working electrode undergo reduction to Fe2+, while UA is oxidized to form allantoin, resulting in the release of one proton and two electrons. The liberated electrons generate an induced current on the electrode surface, whose magnitude depends on the concentration of UA. The charged polaronic nitrogen (=HN+−) and neutral pyrrolylium nitrogen (=N−) in PPy also possess the capability to participate in a two-electron, one-proton exchange reaction with UA. This explains why bare α-Fe2O3 and pure PPy exhibit a certain level of sensing response towards UA. According to previous test results, it can be observed that compounding PPy and α-Fe2O3 significantly enhances the electrical signal of the UA REDOX reaction. This enhancement can be attributed to the hydrogen bond formation between the −NH and C=O functional groups of UA with the −NH functional groups of PPy, which strengthens the interaction between UA and the composite material and promotes its REDOX reaction on the surface of PPy/α-Fe2O3 electrodes. Additionally, the introduction of PPy greatly improves the charge transport performance of α-Fe2O3, thereby enhancing the REDOX reaction efficiency for UA. Furthermore, combining PPy with α-Fe2O3 effectively reduces the agglomeration of α-Fe2O3 NPs and increases active centers within the composite material; this provides more active sites for REDOX reactions involving UA. The synergistic effect between PPy and α-Fe2O3 significantly enhances the sensing performance for detecting UA using PPy/α-Fe2O3 electrodes.

4. Conclusions

In summary, we present the fabrication and characterization of PPy/α-Fe2O3 composites, which exhibit promising potential as UA sensors. The incorporation of PPy/α-Fe2O3 not only enhances the charge transport performance but also increases the number of active sites for the UA reaction, thereby improving the sensing capability towards UA. By optimizing the ratio between PPy and α-Fe2O3 in the hybrids, an optimal proportion was determined (the sample PPy/α-Fe2O3−2). The modified electrode had an LOD of the UA, based on the DPV technique, of approximately 1.349 μM, with a linear concentration range spanning from 5 μM to 200 μM. Although the fabricated sensor in this paper was prepared based on cost-effective materials, it had a lower LOD than some recently reported UA sensors. Our findings validate its potential as a sensor for detecting ultra-low concentrations of UA in real samples.

Supplementary Materials

The following supporting information can be downloaded at: https://www.mdpi.com/article/10.3390/coatings14020227/s1, Figure S1. EDS mapping of PPy/α-Fe2O3 composite. Figure S2. The XPS spectra of α-Fe2O3, PPy, and PPy/α-Fe2O3 composite. Figure S3. CV curves and the dependence plots of anodic peak current vs. square root of scan rate of (a,b) PPy, (c,d) α-Fe2O3, (e,f) PPy/α-Fe2O3−1, (g,h) PPy/α-Fe2O3−2, (i,j) PPy/α-Fe2O3−3, and (k,l) PPy/α-Fe2O3−4 in 0.1 M KCl solution containing 5 mM [Fe(CN)6]3-/4-. Figure S4. The probable reaction mechanisms of UA on PPy/α-Fe2O3 electrode. Figure S5. (a) Storage stability of the PPy/α-Fe2O3 electrode tested by CV for 180 days. (b) DPV curves of the PPy/α-Fe2O3 electrode were obtained in a solution containing 0.5 mM UA, and 0.3 mM DA their mixtures, respectively.

Author Contributions

Validation, S.L., X.S., K.J., Y.H., Q.C., W.M., L.T., Y.R. and S.X.; Formal analysis, Y.H. and Q.C.; Investigation, S.L., X.S. and K.J.; Resources, W.M., Y.R. and S.X.; Data curation, X.S., K.J. and L.T.; Writing—original draft, R.W. and S.L.; Writing—review & editing, R.W., Q.C., W.M., L.T., Y.R. and S.X.; Supervision, R.W.; Funding acquisition, R.W. All authors have read and agreed to the published version of the manuscript.

Funding

This research was funded by the National Natural Science Foundation of China (32000388), the Natural Science Foundation of Henan University of Technology (2021BS006), the Natural Science Project of the Science and Technology Department of Henan Province (232102310010), and the Cultivation Programme for Young Backbone Teachers at the Henan University of Technology (21421210).

Institutional Review Board Statement

Not applicable.

Informed Consent Statement

Not applicable.

Data Availability Statement

Data are contained within the article and supplementary materials.

Conflicts of Interest

The authors declare that they have no conflict of interest.

References

  1. Yang, Y.; Zhou, W.; Wang, Y.; Zhou, R. Gender-Specific Association between Uric Acid Level and Chronic Kidney Disease in the Elderly Health Checkup Population in China. Ren. Fail. 2019, 41, 197–203. [Google Scholar] [CrossRef]
  2. Motshakeri, M.; Phillips, A.R.J.; Kilmartin, P.A. Application of Cyclic Voltammetry to Analyse Uric Acid and Reducing Agents in Commercial Milks. Food Chem. 2019, 293, 23–31. [Google Scholar] [CrossRef] [PubMed]
  3. Cooper, N.; Khosravan, R.; Erdmann, C.; Fiene, J.; Lee, J.W. Quantification of Uric Acid, Xanthine and Hypoxanthine in Human Serum by HPLC for Pharmacodynamic Studies. J. Chromatogr. B 2006, 837, 1–10. [Google Scholar] [CrossRef] [PubMed]
  4. Saadati, A.; Farshchi, F.; Hasanzadeh, M.; Seidi, F. A Microfluidic Paper-Based Colorimetric Device for the Visual Detection of Uric Acid in Human Urine Samples. Anal. Methods 2021, 13, 3909–3921. [Google Scholar] [CrossRef] [PubMed]
  5. Wang, X.; Yao, Q.; Tang, X.; Zhong, H.; Qiu, P.; Wang, X. A Highly Selective and Sensitive Colorimetric Detection of Uric Acid in Human Serum Based on MoS2-Catalyzed Oxidation TMB. Anal. Bioanal. Chem. 2019, 411, 943–952. [Google Scholar] [CrossRef]
  6. Zhang, F.; Ma, P.; Deng, X.; Sun, Y.; Wang, X.; Song, D. Enzymatic Determination of Uric Acid Using Water-Soluble CuInS/ZnS Quantum Dots as a Fluorescent Probe. Microchim. Acta 2018, 185, 499. [Google Scholar] [CrossRef] [PubMed]
  7. Kim, I.; Kim, Y.I.; Lee, S.W.; Jung, H.G.; Lee, G.; Yoon, D.S. Highly Permselective Uric Acid Detection Using Kidney Cell Membrane–Functionalized Enzymatic Biosensors. Biosens. Bioelectron. 2021, 190, 113411. [Google Scholar] [CrossRef] [PubMed]
  8. Zhao, J.; Mu, F.; Qin, L.; Jia, X.; Yang, C. Synthesis and Characterization of MgO/ZnO Composite Nanosheets for Biosensor. Mater. Chem. Phys. 2015, 166, 176–181. [Google Scholar] [CrossRef]
  9. Yan, Q.; Zhi, N.; Yang, L.; Xu, G.; Feng, Q.; Zhang, Q.; Sun, S. A Highly Sensitive Uric Acid Electrochemical Biosensor Based on a Nano-Cube Cuprous Oxide/Ferrocene/Uricase Modified Glassy Carbon Electrode. Sci. Rep. 2020, 10, 10607. [Google Scholar] [CrossRef]
  10. Zuo, X.; Chang, K.; Zhao, J.; Xie, Z.; Tang, H.; Li, B.; Chang, Z. Bubble-Template-Assisted Synthesis of Hollow Fullerene-like MoS2 Nanocages as a Lithium Ion Battery Anode Material. J. Mater. Chem. A 2016, 4, 51–58. [Google Scholar] [CrossRef]
  11. Lu, M.; Deng, Y.; Luo, Y.; Lv, J.; Li, T.; Xu, J.; Chen, S.-W.; Wang, J. Graphene Aerogel–Metal–Organic Framework-Based Electrochemical Method for Simultaneous Detection of Multiple Heavy-Metal Ions. Anal. Chem. 2019, 91, 888–895. [Google Scholar] [CrossRef] [PubMed]
  12. Wang, X.; Qi, Y.; Shen, Y.; Yuan, Y.; Zhang, L.; Zhang, C.; Sun, Y. A Ratiometric Electrochemical Sensor for Simultaneous Detection of Multiple Heavy Metal Ions Based on Ferrocene-Functionalized Metal-Organic Framework. Sens. Actuators B Chem. 2020, 310, 127756. [Google Scholar] [CrossRef]
  13. Hu, R.; Zhang, X.; Chi, K.-N.; Yang, T.; Yang, Y.-H. Bifunctional MOFs-Based Ratiometric Electrochemical Sensor for Multiplex Heavy Metal Ions. ACS Appl. Mater. Interfaces 2020, 12, 30770–30778. [Google Scholar] [CrossRef] [PubMed]
  14. Wang, B.; Chen, J.; Tong, H.; Huang, Y.; Liu, B.; Yang, X.; Su, Z.; Tu, X.; Qin, X. Simultaneous Electrochemical Detection of Cd (II) and Pb (II) Based on L-Cysteine Functionalized Gold Nanoparticles/Metal-Organic Frameworks-Graphene Oxide Nanocomposites. J. Electroanal. Chem. 2023, 943, 117573. [Google Scholar] [CrossRef]
  15. Huo, D.; Zhang, Y.; Li, N.; Ma, W.; Liu, H.; Xu, G.; Li, Z.; Yang, M.; Hou, C. Three-Dimensional Graphene/Amino-Functionalized Metal–Organic Framework for Simultaneous Electrochemical Detection of Cd(II), Pb(II), Cu(II), and Hg(II). Anal. Bioanal. Chem. 2022, 414, 1575–1586. [Google Scholar] [CrossRef] [PubMed]
  16. Sanna Jilani, B.; Mruthyunjayachari, C.D.; Malathesh, P.; Mounesh; Sharankumar, T.M.; Reddy, K.R.V. Electrochemical Sensing Based MWCNT-Cobalt Tetra Substituted Sorbaamide Phthalocyanine onto the Glassy Carbon Electrode towards the Determination of 2-Amino Phenol: A Voltammetric Study. Sens. Actuators B Chem. 2019, 301, 127078. [Google Scholar] [CrossRef]
  17. Chaudhary, A.; Khan, M.Q.; Khan, R.A.; Alsalme, A.; Ahmad, K.; Kim, H. Fabrication of CeO2/GCE for Electrochemical Sensing of Hydroquinone. Biosensors 2022, 12, 846. [Google Scholar] [CrossRef]
  18. Tajik, S.; Beitollahi, H.; Garkani Nejad, F.; Sheikhshoaie, I.; Nugraha, A.S.; Jang, H.W.; Yamauchi, Y.; Shokouhimehr, M. Performance of Metal–Organic Frameworks in the Electrochemical Sensing of Environmental Pollutants. J. Mater. Chem. A 2021, 9, 8195–8220. [Google Scholar] [CrossRef]
  19. Dong, W.; Wen, H.; Du, X.; Li, L.; Li, Z. Electrochemical Sensing of Tetracycline Based on Au NPs@MoS2/Ch Hybrid Structures. J. Electroanal. Chem. 2022, 923, 116807. [Google Scholar] [CrossRef]
  20. Mahmood, F.; Sun, Y.; Wan, C. Biomass-Derived Porous Graphene for Electrochemical Sensing of Dopamine. RSC Adv. 2021, 11, 15410–15415. [Google Scholar] [CrossRef] [PubMed]
  21. Alahmadi, N.; El-Said, W.A. Electrochemical Sensing of Dopamine Using Polypyrrole/Molybdenum Oxide Bilayer-Modified ITO Electrode. Biosensors 2023, 13, 578. [Google Scholar] [CrossRef]
  22. Zhao, M.; Li, Z.; Zhang, X.; Yu, J.; Ding, Y.; Li, H.; Ma, Y. Employing the Interfacial Barrier of P-rGO/ZnO Microspheres for Improving the Electrochemical Sensing Performance to Dopamine. Sens. Actuators B Chem. 2020, 309, 127757. [Google Scholar] [CrossRef]
  23. Jalali, M.; Filine, E.; Dalfen, S.; Mahshid, S. Microscale Reactor Embedded with Graphene/Hierarchical Gold Nanostructures for Electrochemical Sensing: Application to the Determination of Dopamine. Microchim. Acta 2020, 187, 90. [Google Scholar] [CrossRef] [PubMed]
  24. Ma, F.; Yang, B.; Zhao, Z.; Zhao, Y.; Pan, R.; Wang, D.; Kong, Y.; Chen, Y.; Huang, G.; Kong, J.; et al. Sonication-Triggered Rolling of Janus Porous Nanomembranes for Electrochemical Sensing of Dopamine and Ascorbic Acid. ACS Appl. Nano Mater. 2020, 3, 10032–10039. [Google Scholar] [CrossRef]
  25. Gao, F.; Yang, Y.; Qiu, W.; Song, Z.; Wang, Q.; Niu, L. Ni 3 C/Ni Nanochains for Electrochemical Sensing of Glucose. ACS Appl. Nano Mater. 2021, 4, 8520–8529. [Google Scholar] [CrossRef]
  26. Wang, Q.; Jia, Q.; Hu, P.; Ji, L. Tunable Non-Enzymatic Glucose Electrochemical Sensing Based on the Ni/Co Bimetallic MOFs. Molecules 2023, 28, 5649. [Google Scholar] [CrossRef] [PubMed]
  27. Xu, F.; Hu, K.; Wang, S.; Chen, X.; Xu, R.; Xiong, X.; Yuan, X.; Zhang, M.; Huang, K. ZIF-8 Derived Ni(OH)2 Hollow Nanocages for Non-Enzymatic Glucose Electrochemical Sensing. J. Mater. Sci. 2022, 57, 18589–18600. [Google Scholar] [CrossRef]
  28. Saeed, U.; Fatima, B.; Hussain, D.; Imran, M.; Jamil, M.; Naeem Ashiq, M.; Najam-ul-Haq, M. Scalable Synthesis of Ce-MOF Derived CeO/C Hierarchical: Efficient Electrochemical Sensing of Uric Acid as Potential Biomarker in Acute Myeloid Leukaemia Patients. Microchem. J. 2022, 181, 107808. [Google Scholar] [CrossRef]
  29. Kulyk, B.; Pereira, S.O.; Fernandes, A.J.S.; Fortunato, E.; Costa, F.M.; Santos, N.F. Laser-Induced Graphene from Paper for Non-Enzymatic Uric Acid Electrochemical Sensing in Urine. Carbon 2022, 197, 253–263. [Google Scholar] [CrossRef]
  30. Hou, T.; Gai, P.; Song, M.; Zhang, S.; Li, F. Synthesis of a Three-Layered SiO2@Au Nanoparticle@polyaniline Nanocomposite and Its Application in Simultaneous Electrochemical Detection of Uric Acid and Ascorbic Acid. J. Mater. Chem. B 2016, 4, 2314–2321. [Google Scholar] [CrossRef]
  31. Li, G.; Xu, C.; Xu, H.; Gan, L.; Sun, K.; Yuan, B. Tunable Graphene Oxide for the Low-Fouling Electrochemical Sensing of Uric Acid in Human Serum. Analyst 2023, 148, 2553–2563. [Google Scholar] [CrossRef] [PubMed]
  32. Eryigit, M.; Kurt Urhan, B.; Dogan, H.O.; Ozer, T.O.; Demir, U. ZnO Nanosheets-Decorated ERGO Layers: An Efficient Electrochemical Sensor for Non-Enzymatic Uric Acid Detection. IEEE Sens. J. 2022, 22, 5555–5561. [Google Scholar] [CrossRef]
  33. Ibrahim, A.A.; Kumar, R.; Umar, A.; Kim, S.H.; Bumajdad, A.; Ansari, Z.A.; Baskoutas, S. Cauliflower-Shaped ZnO Nanomaterials for Electrochemical Sensing and Photocatalytic Applications. Electrochim. Acta 2016, 222, 463–472. [Google Scholar] [CrossRef]
  34. Zhuang, Z.; Chen, Y.; Chen, K.; Liu, Z.; Guo, Z.; Huang, X. In-Situ Synthesis of ZnO onto Nanoporous Gold Microelectrode for the Electrochemical Sensing of Arsenic(III) in near-Neutral Conditions. Sens. Actuators B Chem. 2023, 378, 133184. [Google Scholar] [CrossRef]
  35. Sundar, S.; Venkatachalam, G.; Kwon, S. Biosynthesis of Copper Oxide (CuO) Nanowires and Their Use for the Electrochemical Sensing of Dopamine. Nanomaterials 2018, 8, 823. [Google Scholar] [CrossRef]
  36. Manigandan, R.; Dhanasekaran, T.; Padmanaban, A.; Giribabu, K.; Suresh, R.; Narayanan, V. Bifunctional Hexagonal Ni/NiO Nanostructures: Influence of the Core–Shell Phase on Magnetism, Electrochemical Sensing of Serotonin, and Catalytic Reduction of 4-Nitrophenol. Nanoscale Adv. 2019, 1, 1531–1540. [Google Scholar] [CrossRef]
  37. Hao, C.; Shen, Y.; Wang, Z.; Wang, X.; Feng, F.; Ge, C.; Zhao, Y.; Wang, K. Preparation and Characterization of Fe2O3 Nanoparticles by Solid-Phase Method and Its Hydrogen Peroxide Sensing Properties. ACS Sustain. Chem. Eng. 2016, 4, 1069–1077. [Google Scholar] [CrossRef]
  38. Wu, S.; Xiong, W.; Li, H. Insights into the Fe Oxidation State of Sphere-like Fe2O3 Nanoparticles for Simultaneous Pb2+ and Cu2+ Detection. J. Alloys Compd. 2023, 934, 167863. [Google Scholar] [CrossRef]
  39. Immanuel, S.; Aparna, T.K.; Sivasubramanian, R. A Facile Preparation of Au—SiO2 Nanocomposite for Simultaneous Electrochemical Detection of Dopamine and Uric Acid. Surf. Interfaces 2019, 14, 82–91. [Google Scholar] [CrossRef]
  40. Li, Y.-Y.; Kang, P.; Wang, S.-Q.; Liu, Z.-G.; Li, Y.-X.; Guo, Z. Ag Nanoparticles Anchored onto Porous CuO Nanobelts for the Ultrasensitive Electrochemical Detection of Dopamine in Human Serum. Sens. Actuators B Chem. 2021, 327, 128878. [Google Scholar] [CrossRef]
  41. He, W.; Ye, X.; Cui, T. Flexible Electrochemical Sensor with Graphene and Gold Nanoparticles to Detect Dopamine and Uric Acid. IEEE Sens. J. 2021, 21, 26556–26565. [Google Scholar] [CrossRef]
  42. Priya, C.; Anuja, S.; Babu, R.S.; Narayanan, S.S. Low Potential Determination of Dopamine in the Presence of Ascorbic Acid Using Phenothiazine Dye–Functionalized Graphite Oxide–Modified Electrode. Ionics 2023, 29, 5481–5490. [Google Scholar] [CrossRef]
  43. Husain, A.; Al-Zahrani, S.A.; Al Otaibi, A.; Khan, I.; Mujahid Ali Khan, M.; Alosaimi, A.M.; Khan, A.; Hussein, M.A.; Asiri, A.M.; Jawaid, M. Fabrication of Reproducible and Selective Ammonia Vapor Sensor-Pellet of Polypyrrole/Cerium Oxide Nanocomposite for Prompt Detection at Room Temperature. Polymers 2021, 13, 1829. [Google Scholar] [CrossRef]
  44. Lett, J.A.; Sagadevan, S.; Alshahateet, S.F.; Murugan, B.; Jasni, A.H.; Fatimah, I.; Hossain, M.A.M.; Mohammad, F.; Oh, W.C. Synthesis and Characterization of Polypyrrole-Coated Iron Oxide Nanoparticles. Mater. Res. Express 2021, 8, 025007. [Google Scholar] [CrossRef]
  45. Morsy, R.; Hosny, M.; Reicha, F.; Elnimr, T. Development and Characterization of Multifunctional Electrospun Ferric Oxide-Gelatin-Glycerol Nanofibrous Mat for Wound Dressing Applications. Fibers Polym. 2016, 17, 2014–2019. [Google Scholar] [CrossRef]
  46. Beniwal, A.; Sunny. Novel TPU/Fe2O3 and TPU/Fe2O3/PPy Nanocomposites Synthesized Using Electrospun Nanofibers Investigated for Analyte Sensing Applications at Room Temperature. Sens. Actuators B Chem. 2020, 304, 127384. [Google Scholar] [CrossRef]
  47. Wang, C.; Yang, M.; Liu, L.; Xu, Y.; Zhang, X.; Cheng, X.; Gao, S.; Gao, Y.; Huo, L. One-Step Synthesis of Polypyrrole/Fe2O3 Nanocomposite and the Enhanced Response of NO2 at Low Temperature. J. Colloid. Interface Sci. 2020, 560, 312–320. [Google Scholar] [CrossRef] [PubMed]
  48. Liu, X.-L.; Guo, J.-W.; Wang, Y.-W.; Wang, A.-Z.; Yu, X.; Ding, L.-H. A Flexible Electrochemical Sensor for Paracetamol Based on Porous Honeycomb-like NiCo-MOF Nanosheets. Rare Met. 2023, 42, 3311–3317. [Google Scholar] [CrossRef]
  49. Chen, Y.; Zheng, G.; Shi, Q.; Zhao, R.; Chen, M. Preparation of Thiolated Calix [8]Arene/AuNPs/MWCNTs Modified Glassy Carbon Electrode and Its Electrocatalytic Oxidation toward Paracetamol. Sens. Actuators B Chem. 2018, 277, 289–296. [Google Scholar] [CrossRef]
  50. Abrori, S.A.; Septiani, N.L.W.; Nugraha; Nuruddin, A.; Anshori, I.; Yuliarto, B. Comparison of a 2D/3D Imidazole-Based MOF and Its Application as a Non-Enzymatic Electrochemical Sensor for the Detection of Uric Acid. New J. Chem. 2022, 46, 21342–21349. [Google Scholar] [CrossRef]
  51. Li, F.; Liu, L.; Liu, T.; Zhang, M. Ni-MOF Nanocomposites Decorated by Au Nanoparticles: An Electrochemical Sensor for Detection of Uric Acid. Ionics 2022, 28, 4843–4851. [Google Scholar] [CrossRef]
  52. Dutta, P.; Sharma, V.; Bhardwaj, H.; Agrawal, V.V.; Rajesh; Sumana, G. Fabrication of Electrochemical Biosensor Using Zinc Oxide Nanoflowers for the Detection of Uric Acid. MAPAN 2022, 37, 585–595. [Google Scholar] [CrossRef]
  53. Babu, R.S.; Prabhu, P.; Narayanan, S.S. Selective Electrooxidation of Uric Acid in Presence of Ascorbic Acid at a Room Temperature Ionic Liquid/Nickel Hexacyanoferarrate Nanoparticles Composite Electrode. Colloids Surf. B Biointerfaces 2011, 88, 755–763. [Google Scholar] [CrossRef] [PubMed]
  54. Ipekci, H.H. Holey MoS2-Based Electrochemical Sensors for Simultaneous Dopamine and Uric Acid Detection. Anal. Methods 2023, 15, 2989–2996. [Google Scholar] [CrossRef]
  55. John, J.F.; Dhinasekaran, D.; Subashchandran, S. Cobalt Doped NiFe2O4 on 3D Nickel Foam Substrate for Electrochemical Detection of Uric Acid. Surf. Interfaces 2024, 44, 103629. [Google Scholar] [CrossRef]
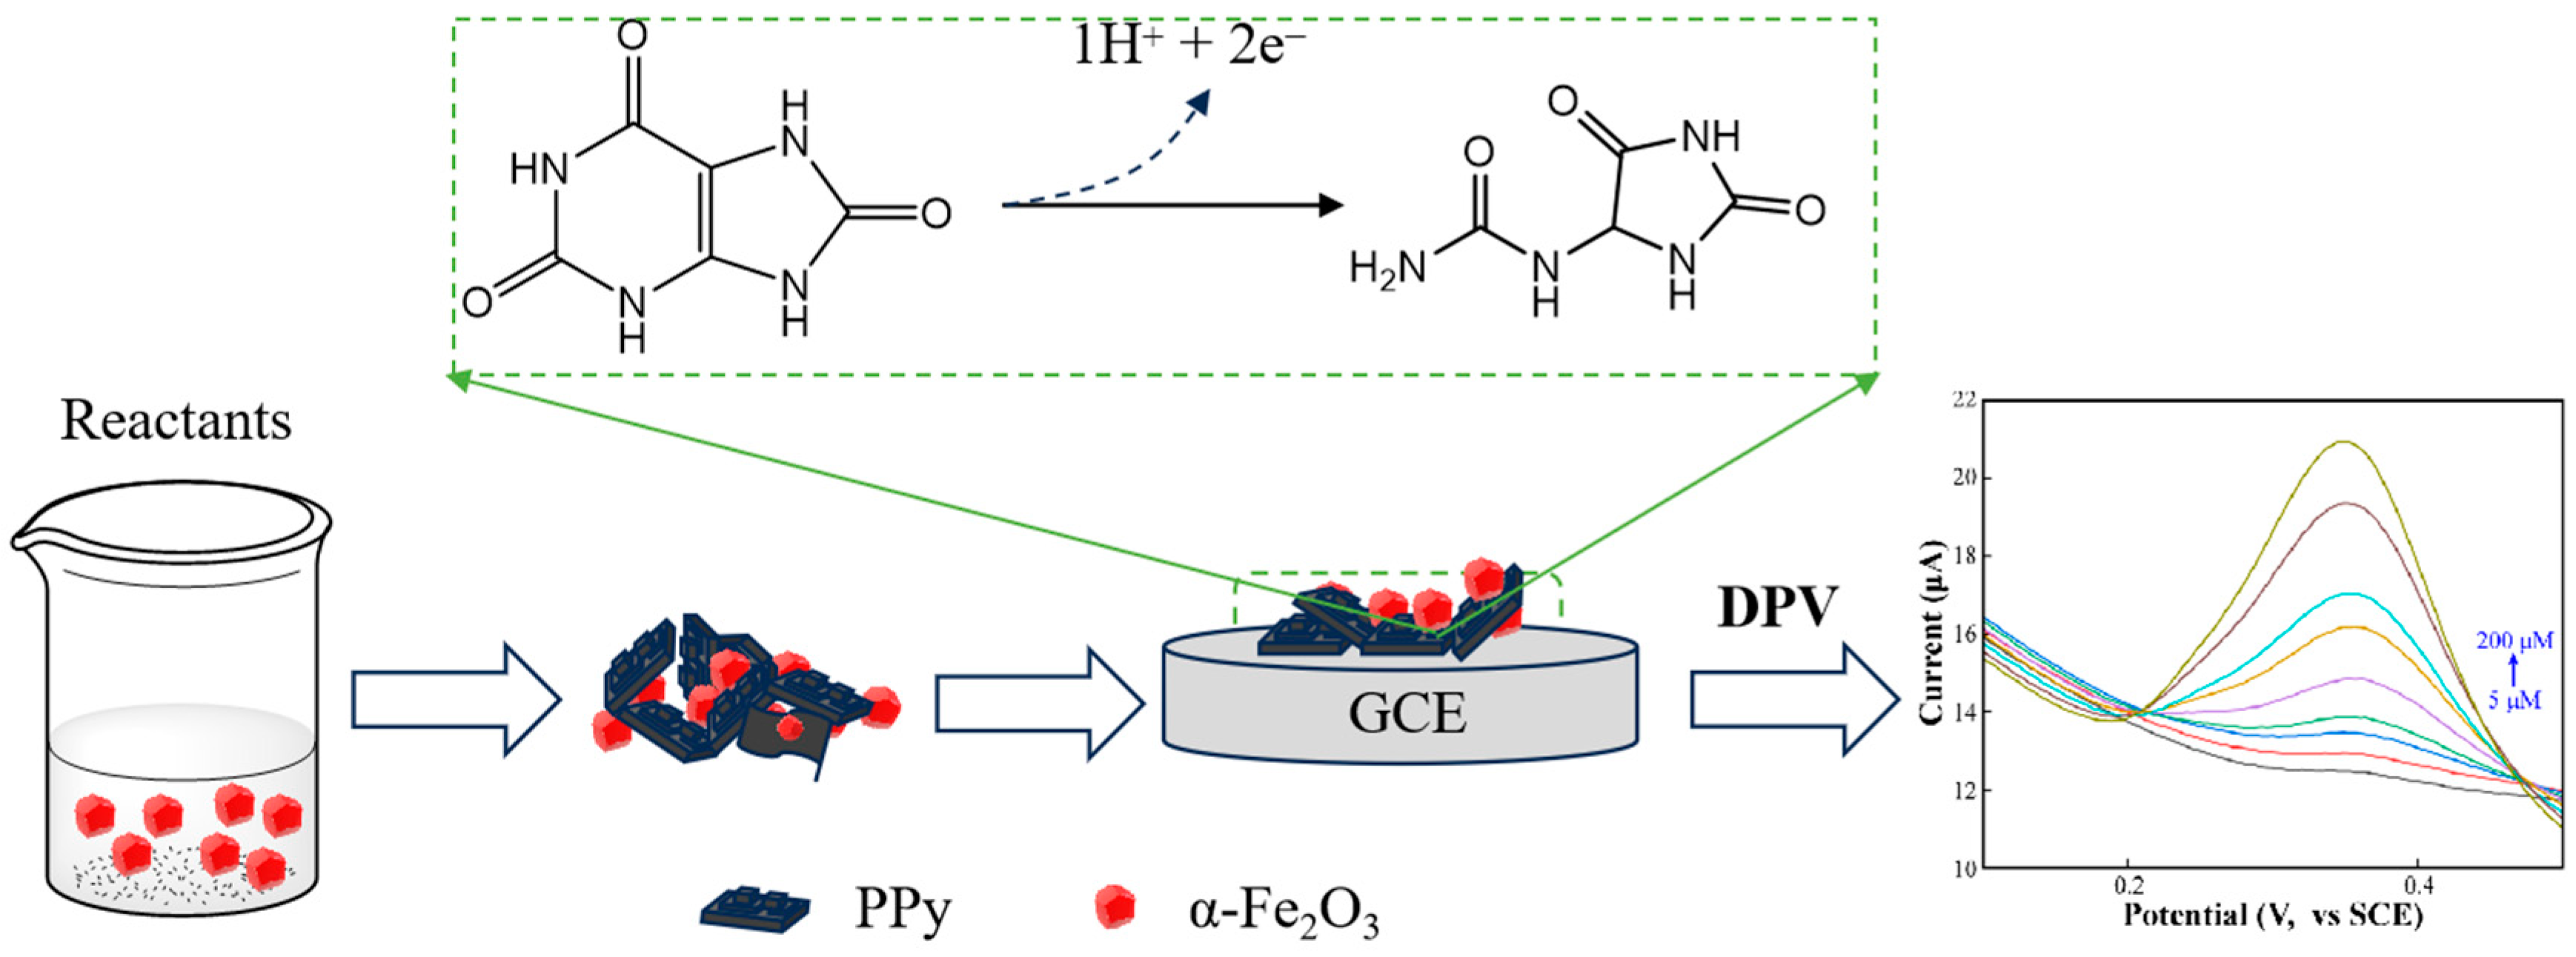
Scheme 1. Procedure for the fabrication of the PPy/α-Fe2O3 hybrids and the detection mechanism of UA.
Coatings 14 00227 sch001
Figure 1. FT-IR spectra (a) and XRD patterns of α-Fe2O3, PPy, and PPy/α-Fe2O3 (b) were obtained. The characteristic peaks of α-Fe2O3 and PPy are represented by blue stars and red triangles, respectively. The orange lines correspond to the standard PDF card of α-Fe2O3 (Color figure online).
Coatings 14 00227 g001
Figure 2. The microstructure and morphology of PPy (a), α-Fe2O3 (b), and PPy/α-Fe2O3 (c,d). The white horizontal lines in each figure represent the scale bars.
Coatings 14 00227 g002
Figure 3. The XPS spectra of the C 1s (a), N 1s (b), O 1s (c), and Fe 2p (d) elements in the PPy/α-Fe2O3 composite.
Coatings 14 00227 g003
Figure 4. CV curves (scan rate of 50 mV/s) (a), the oxidation peak current (b), the Nyquist plots (c), and the resistance of charge transfer (Rct) (d) of PPy, α-Fe2O3, and PPy/α-Fe2O3 hybrids recorded in 0.1 mol/L KCl containing 5 mM [Fe(CN)6]3−/4−. Rs, Rct, CPE1, and W1 in (c) represent the solution resistance, charge transfer resistance, constant-phase element, and diffusion impedance, respectively.
Coatings 14 00227 g004
Figure 5. CV curves of various modified electrodes in the presence of UA (a) and the impact of different proportions of PPy and α-Fe2O3 in the modified materials on the redox peak current of UA (b); comparison of cyclic voltammograms of the PPy/α-Fe2O3−2 electrode and blank electrode before and after adding 0.5 mM UA (c); DPV curves of the PPy/α-Fe2O3−2 electrode collected in 0.1 mol/L PBS containing 50 μmol/L UA with a pH value ranging from 6.0 to 8.0 (d); anodic peak current (e) and the calibration curve of the potential versus the pH (f).
Coatings 14 00227 g005
Figure 6. Cyclic voltammograms of PPy/α-Fe2O3−2 recorded at various scanning rates in a UA solution (a), and the linear correlation between the anodic peak current and the square root of the scanning rate (b); successive DPV responses of PPy/α-Fe2O3−2 with varying concentrations of UA in PBS buffer (c), and the linear correlation between the peak current and UA concentration (d); 100 repeated CV scans of the PPy/α-Fe2O3−2 hybrids in 0.5 mM of UA at a scan rate of 50 mV/s (e), and the stability of the PPy/α-Fe2O3−2 hybrids (f).
Coatings 14 00227 g006
Figure 7. The principles of UA sensing by the PPy/α-Fe2O3 composite.
Coatings 14 00227 g007
Table 1. Detection performance comparison with other sensors.
MatrixDetection RangeLODLOQReferences
W-ZIF-6720–1000 μM3.04 μM9.12 μM[50]
Au/Ni-MOF10–500 μM5.6 μM16.8 μM[51]
UOx/ZnONFs5–750 μM130 μM390 μM[52]
RTIL-NiHCF-NP-Gel1.0–2600.0 μM0.33 μM1 μM[53]
GP5AuNPs520–500 μM1.47 μM4.41 μM[41]
Holey MoS2200–700 μM5.62 μM16.86 μM[54]
Co0.01Ni0.99Fe2O44–5280 μM6.38 μM19.14 μM[55]
PPy/Fe2O35–200 μM1.349 μM4.407 μMThis work
Disclaimer/Publisher’s Note: The statements, opinions and data contained in all publications are solely those of the individual author(s) and contributor(s) and not of MDPI and/or the editor(s). MDPI and/or the editor(s) disclaim responsibility for any injury to people or property resulting from any ideas, methods, instructions or products referred to in the content.