
Enhancing Sulfate Erosion Resistance in Ultra-High-Performance Concrete through Mix Design Optimization Using the Modified Andreasen and Andersen Method

 ,
,
Abstract
1. Introduction
2. Materials and Methods
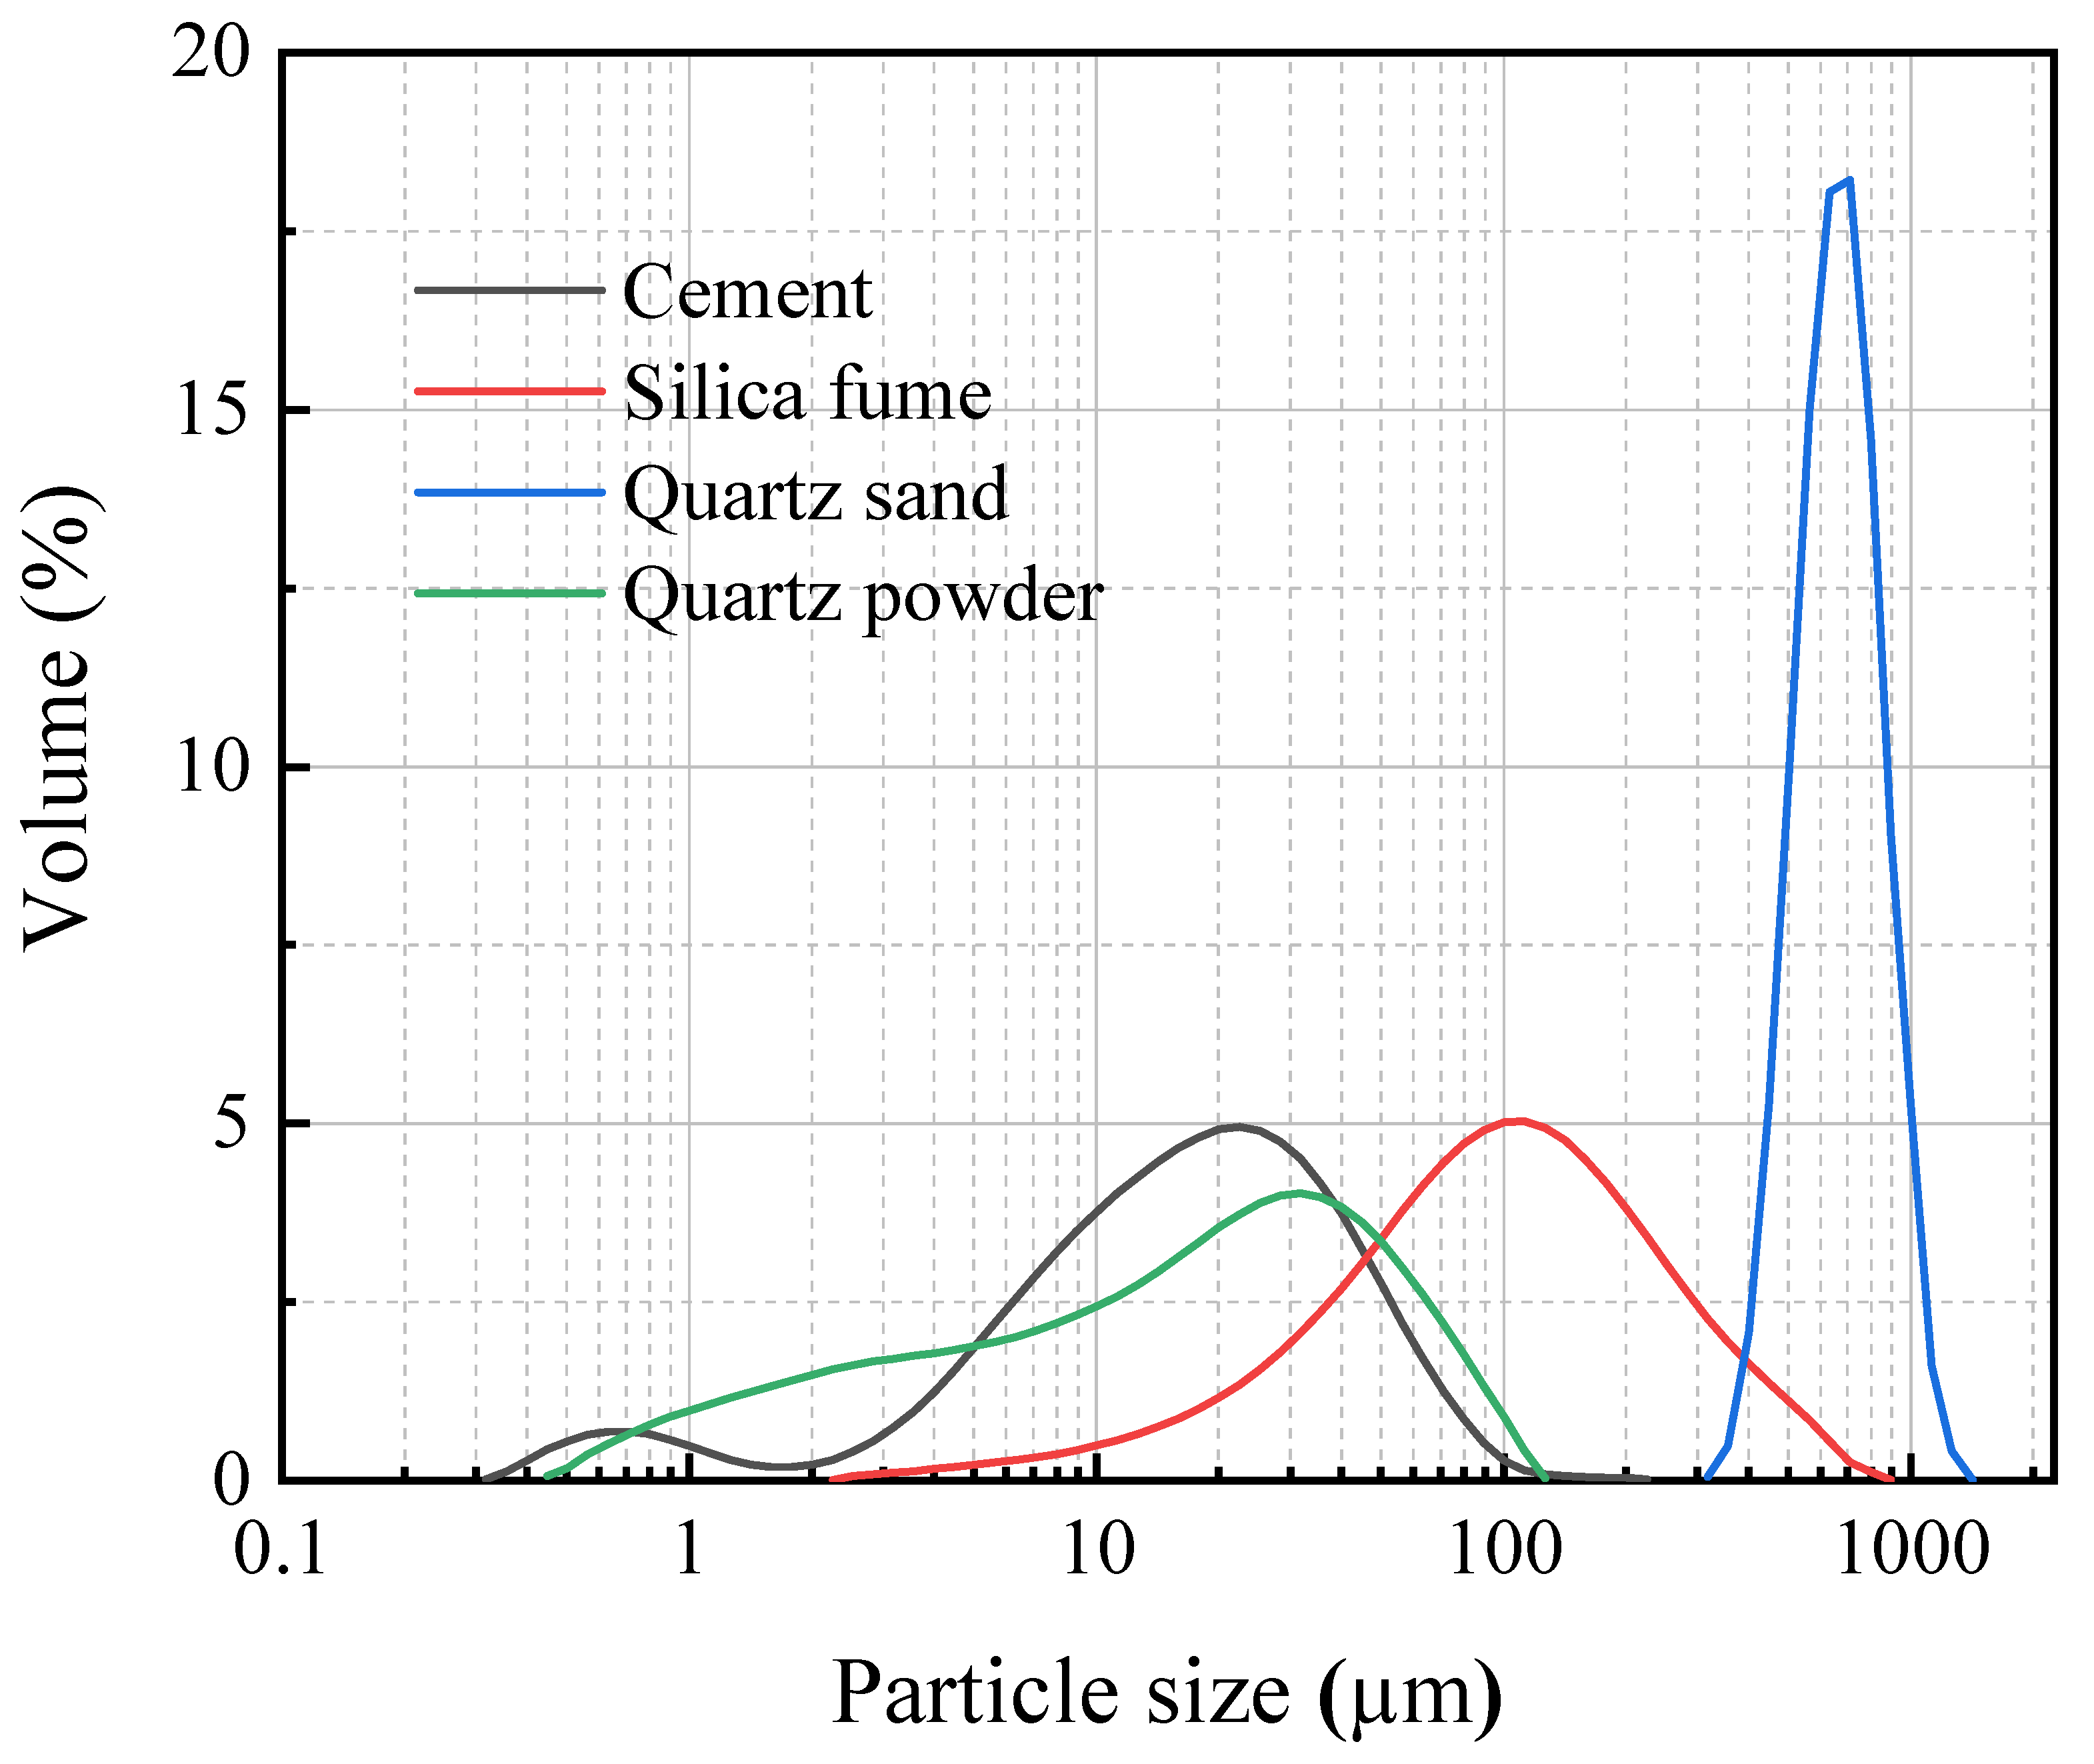
2.1. Materials
2.2. Experimental Methods
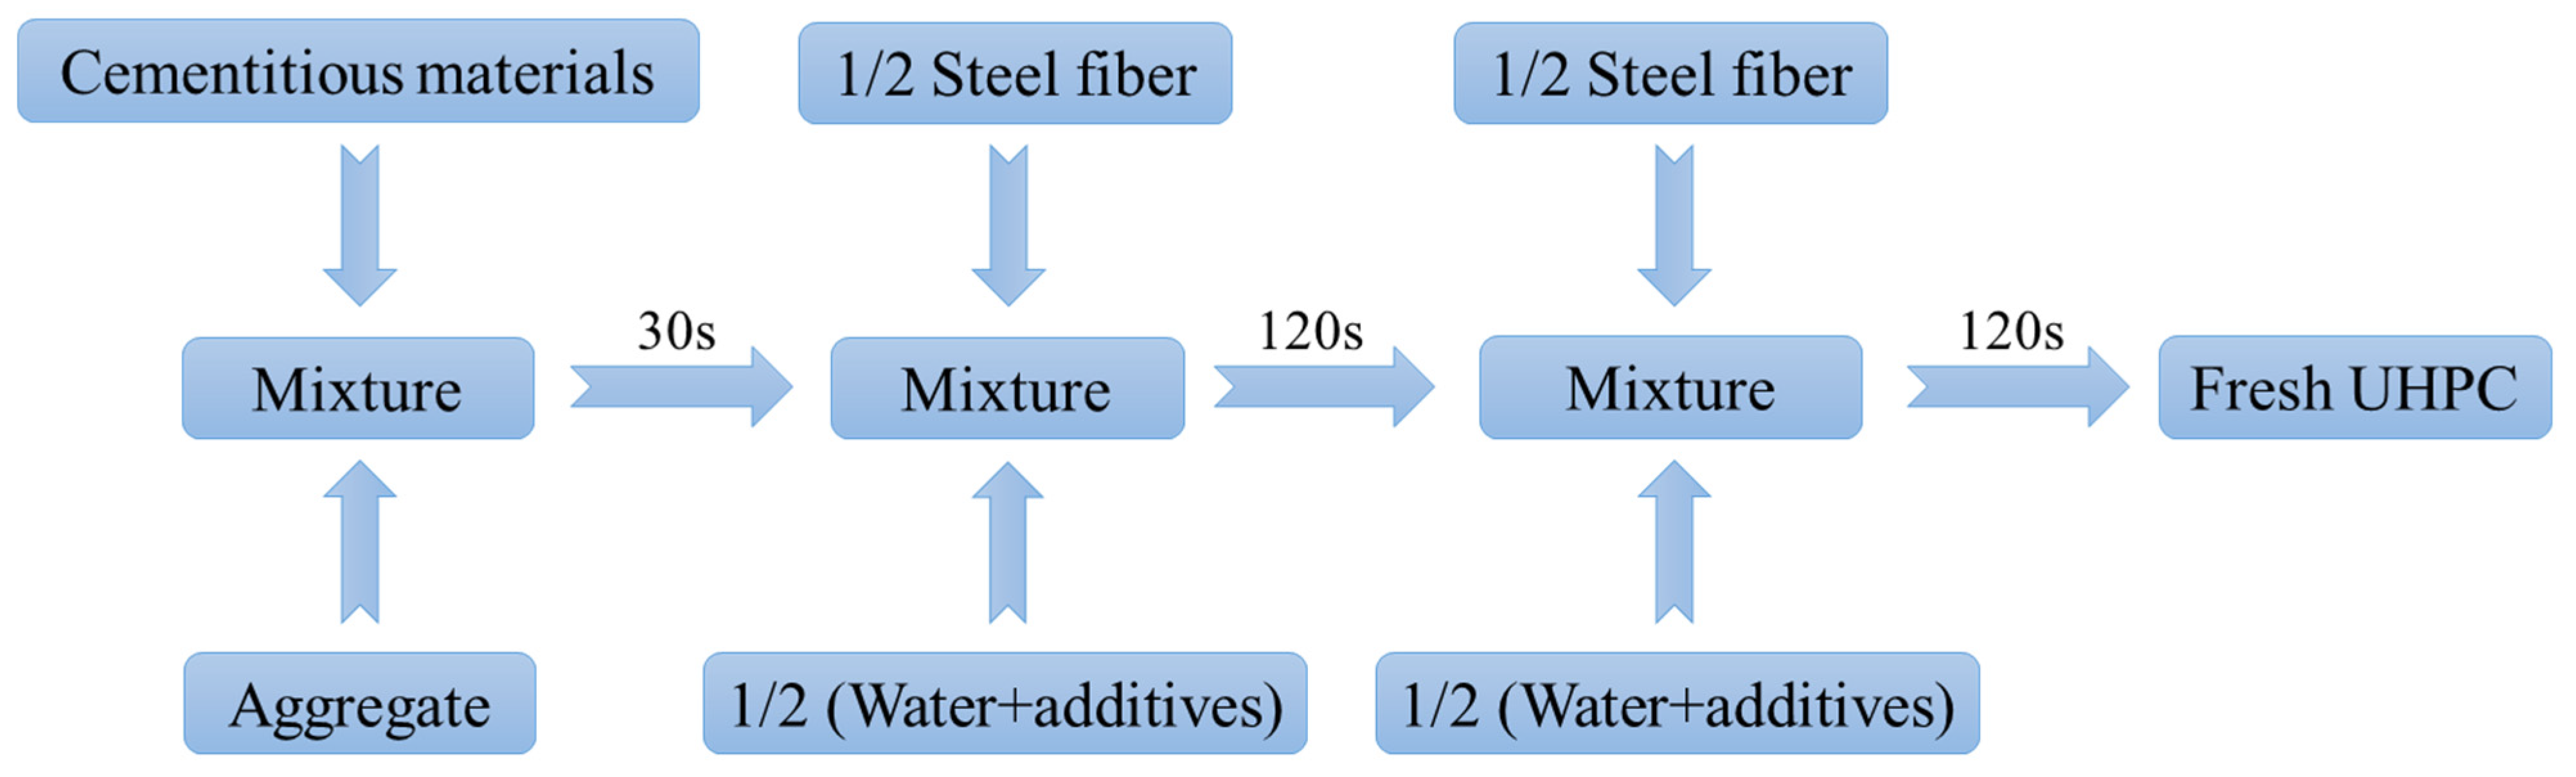
2.2.1. Preparation of the UHPC
2.2.2. Workability of the UHPC
2.2.3. Mechanical Properties of the UHPC
2.2.4. Sulfate Attack Resistance of the UHPC
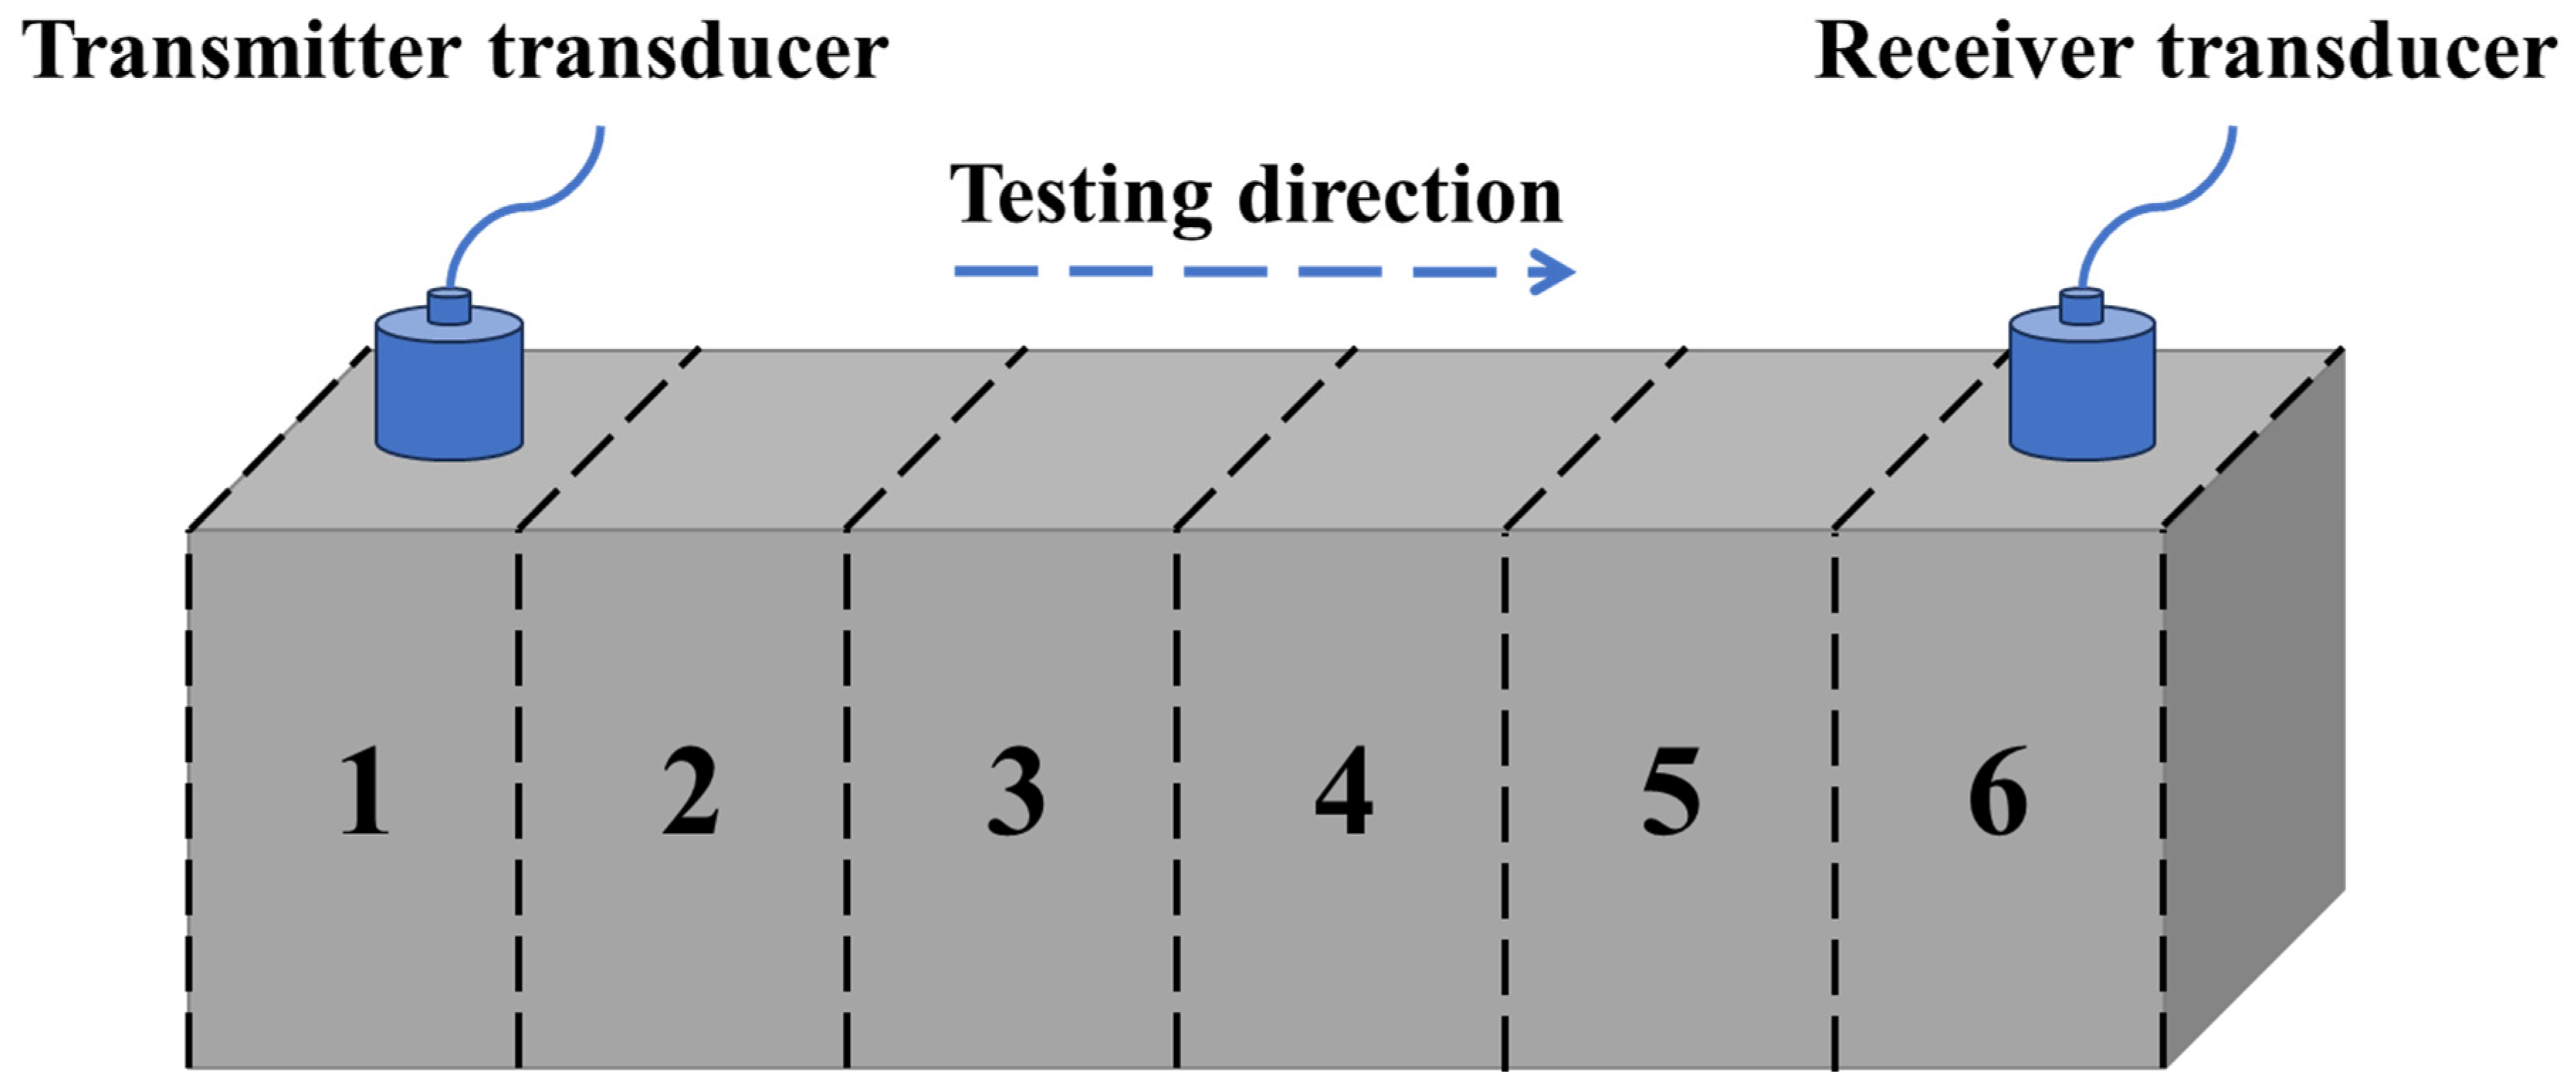
2.2.5. Erosion Layer Thickness and Apparent Morphology of the UHPC
2.2.6. Microscopic Morphology and Element of the UHPC
3. Design of the UHPC Based on MAA
3.1. Design of the UHPC Matrix
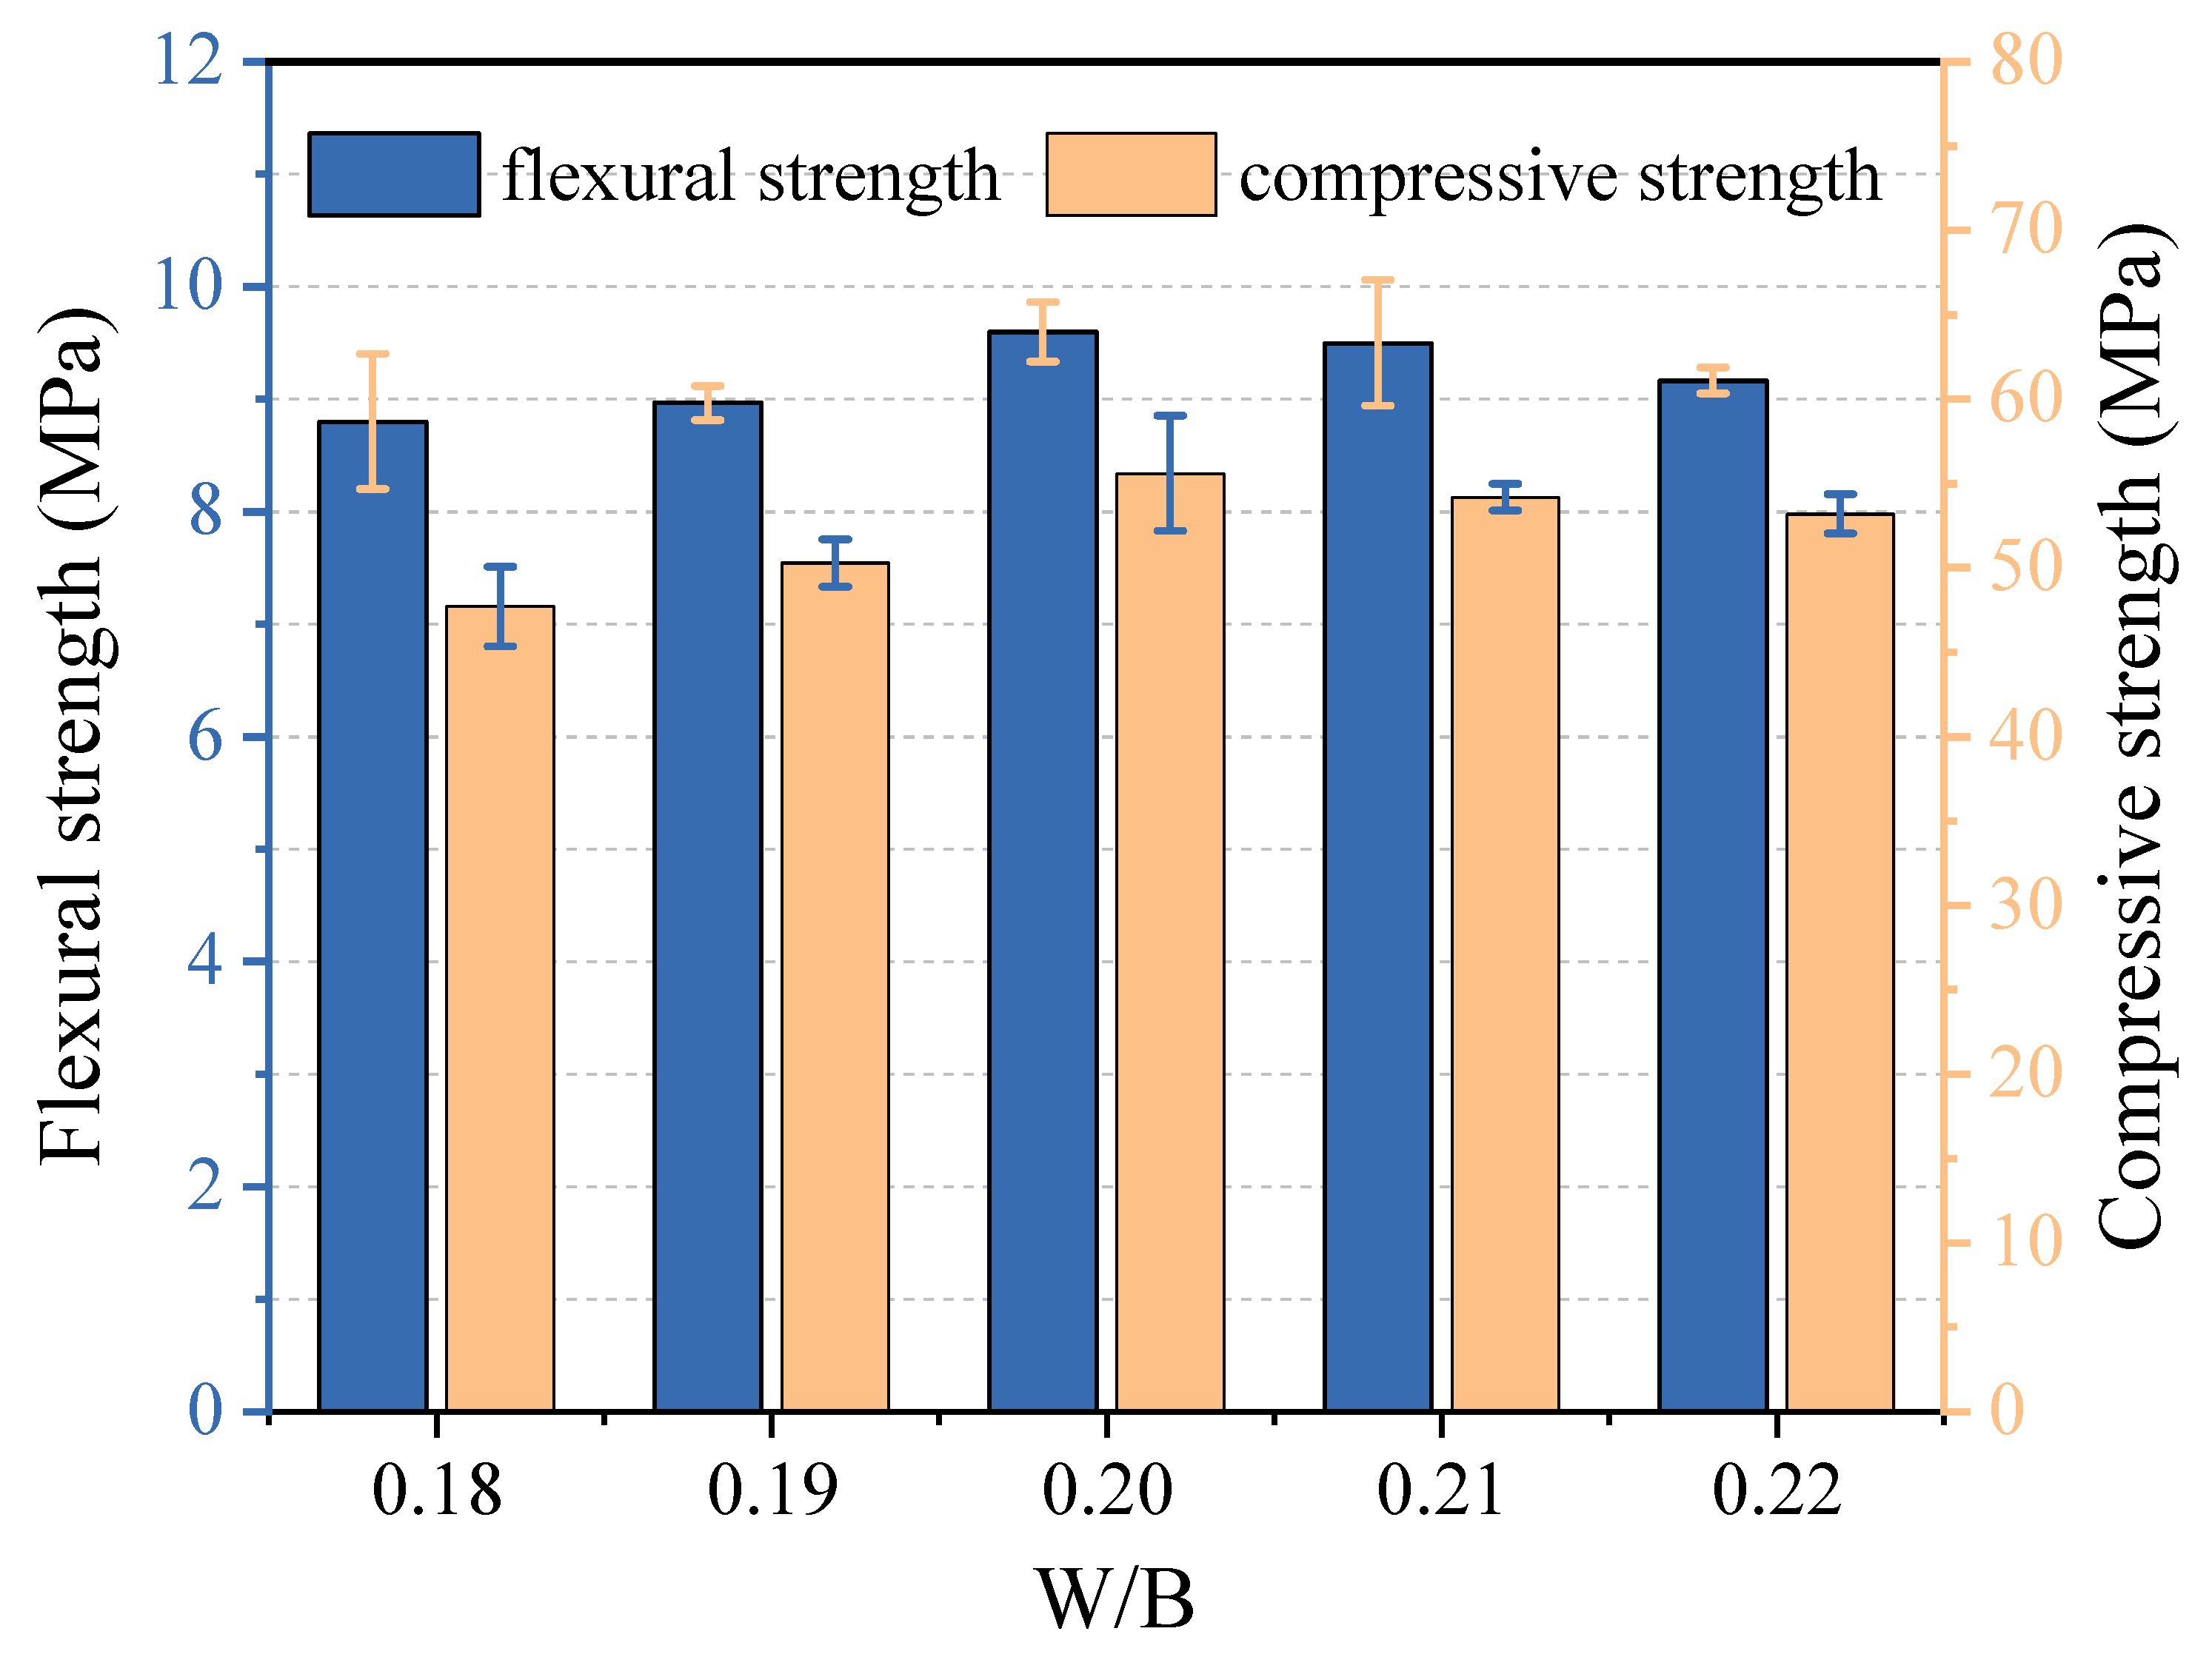
3.2. W/B of the UHPC
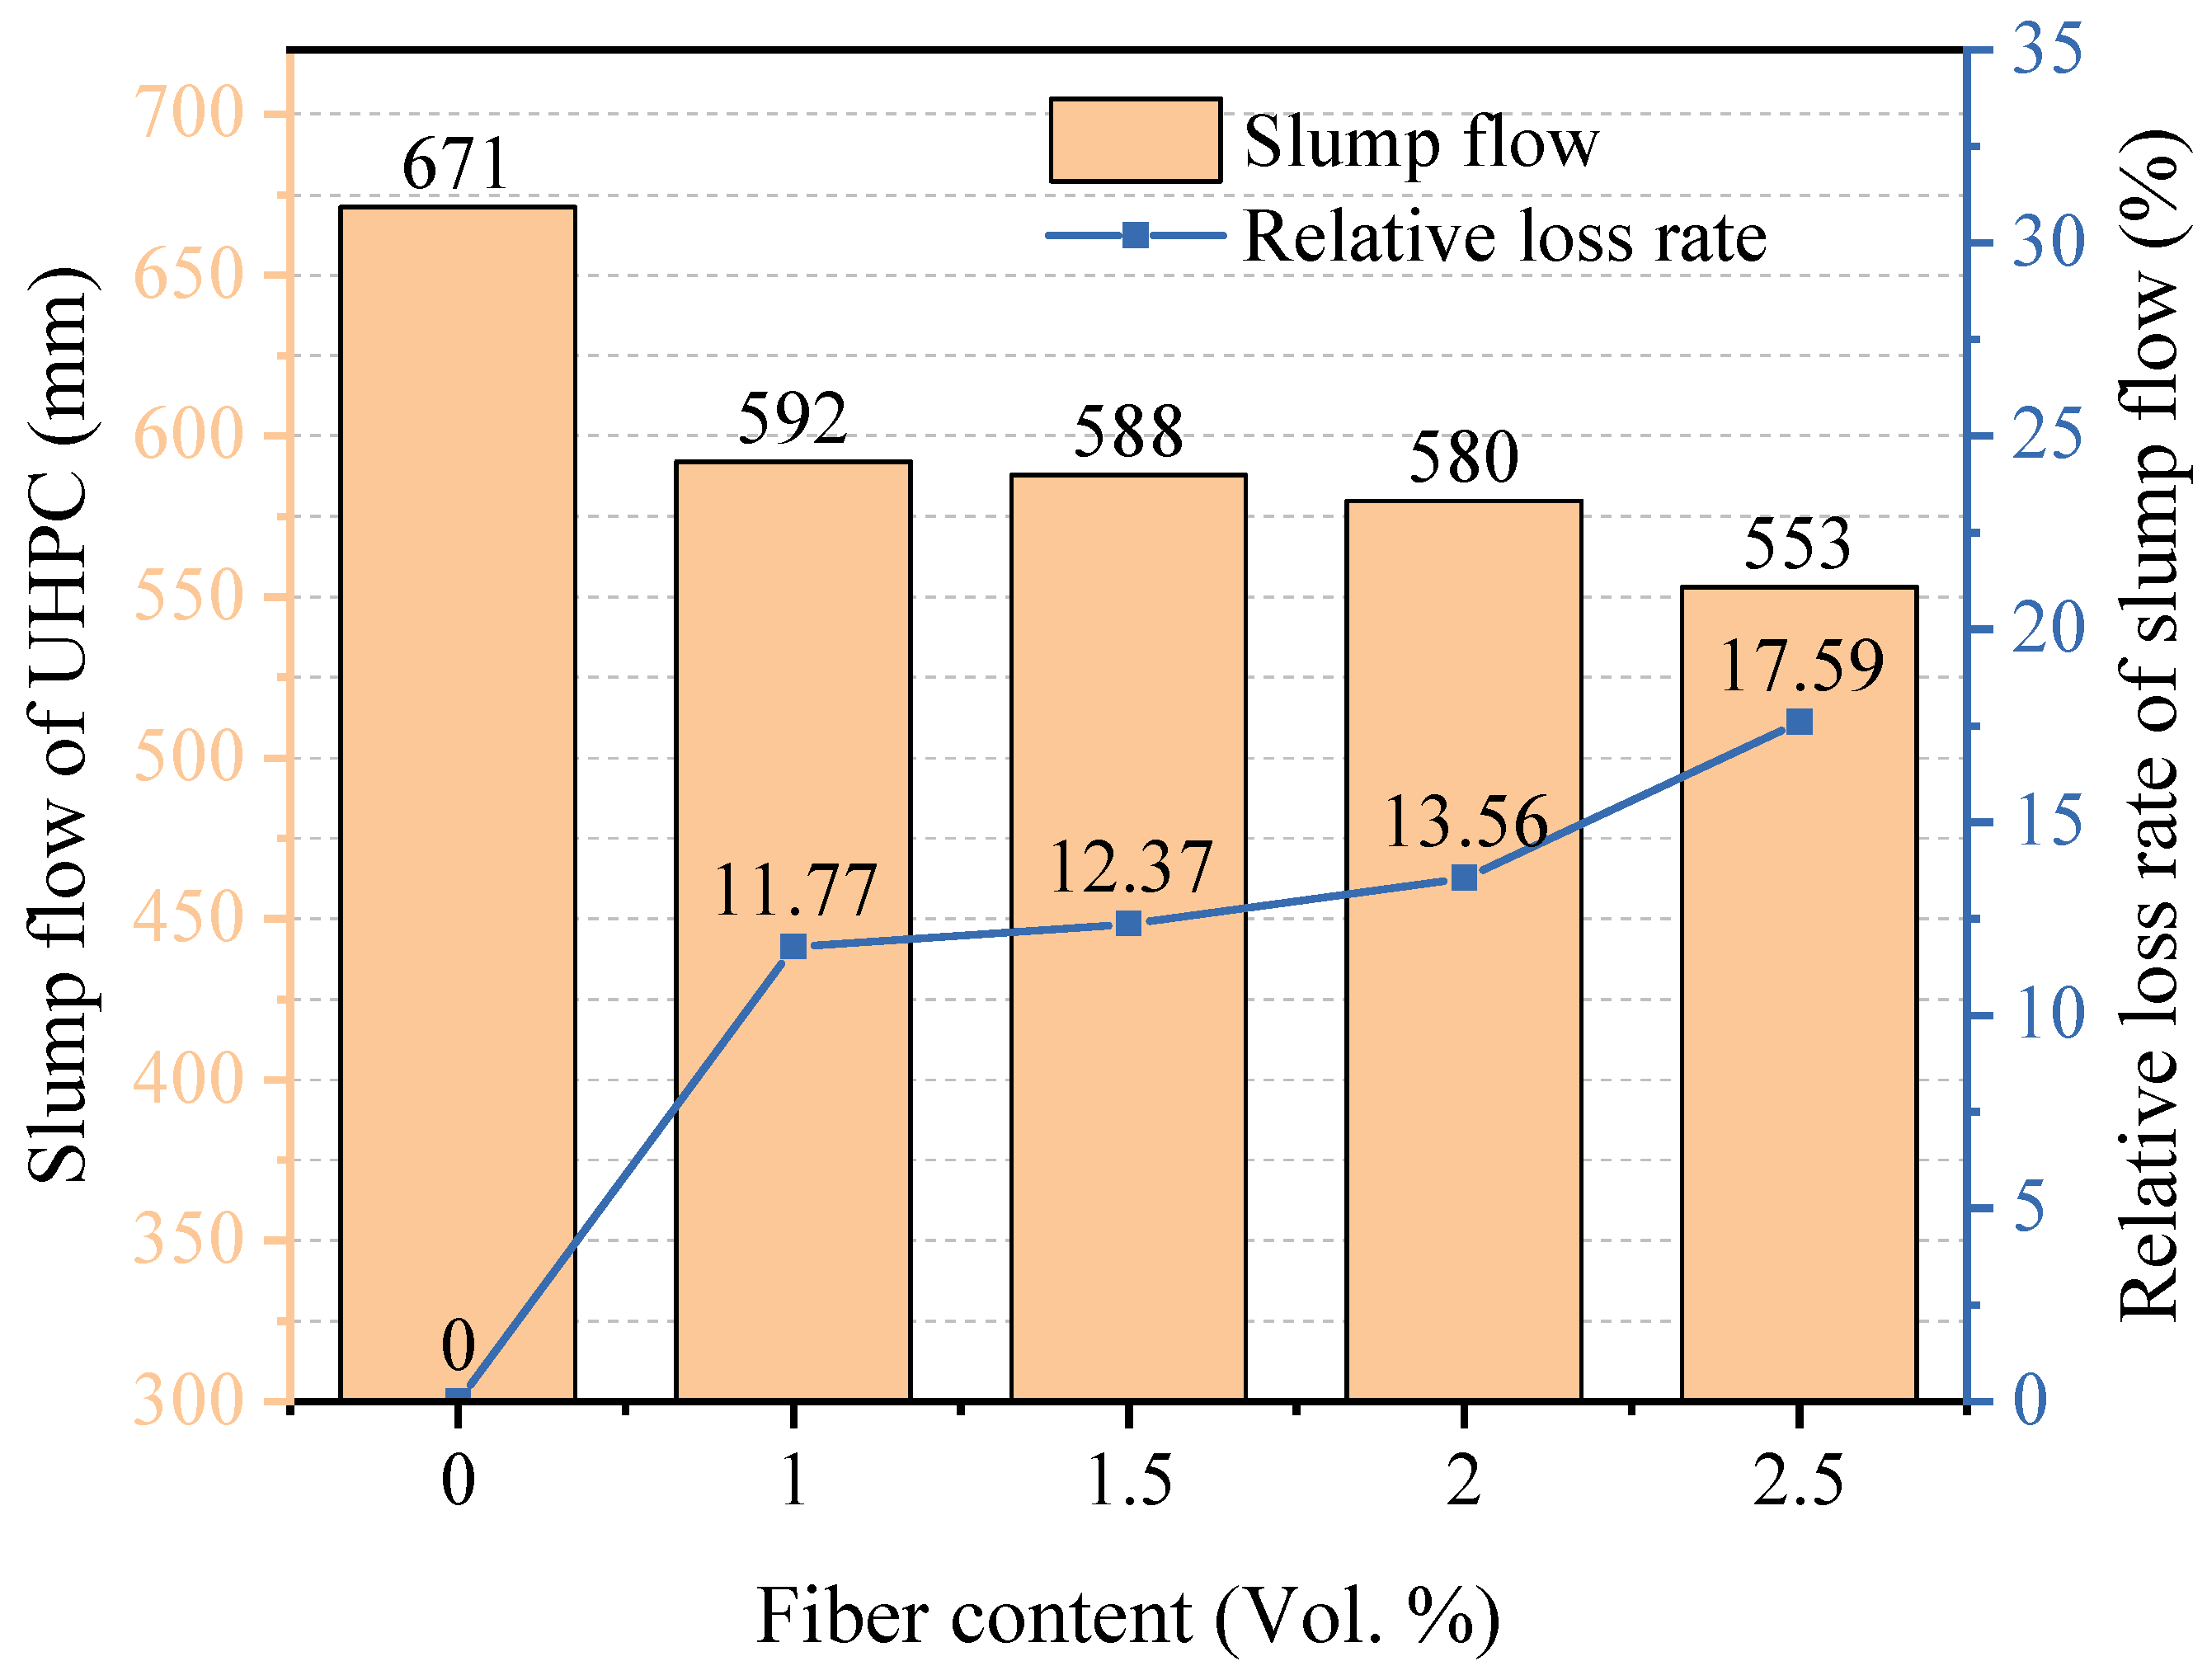
3.3. Steel Fiber Dosage of the UHPC
4. Results and Discussion
4.1. Sulfate Attack Resistance of the UHPC
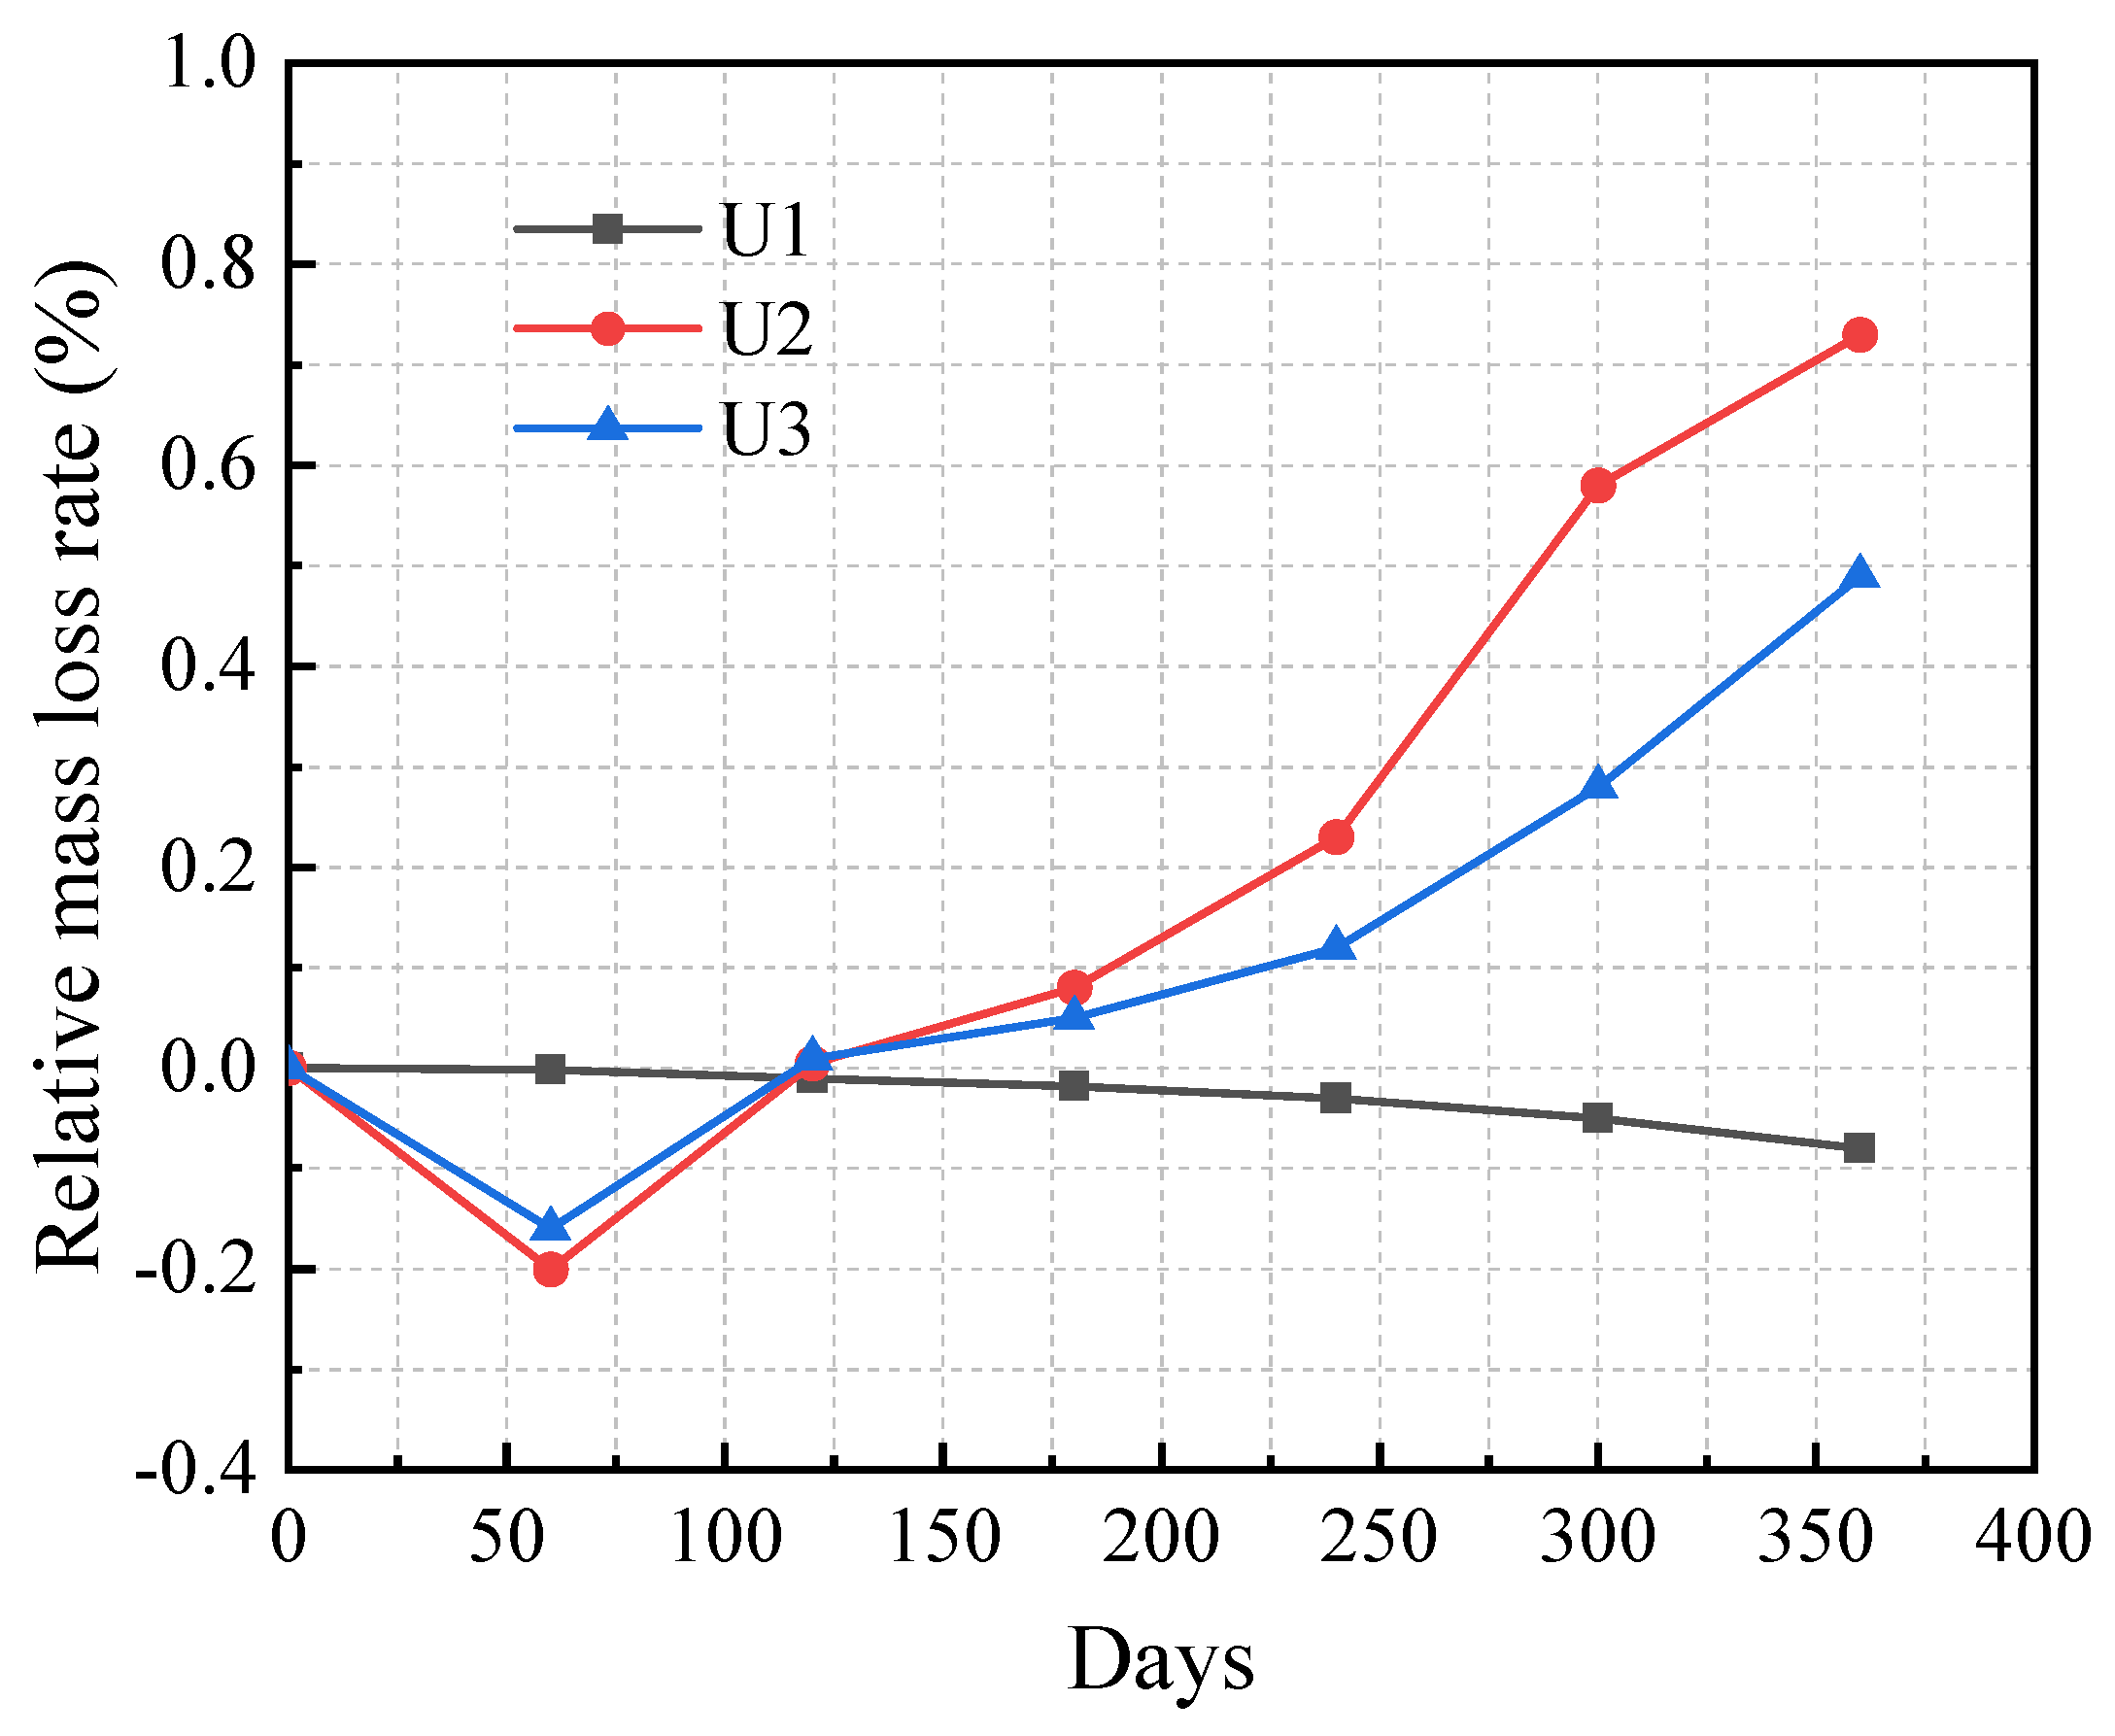
4.1.1. Relative Mass Loss
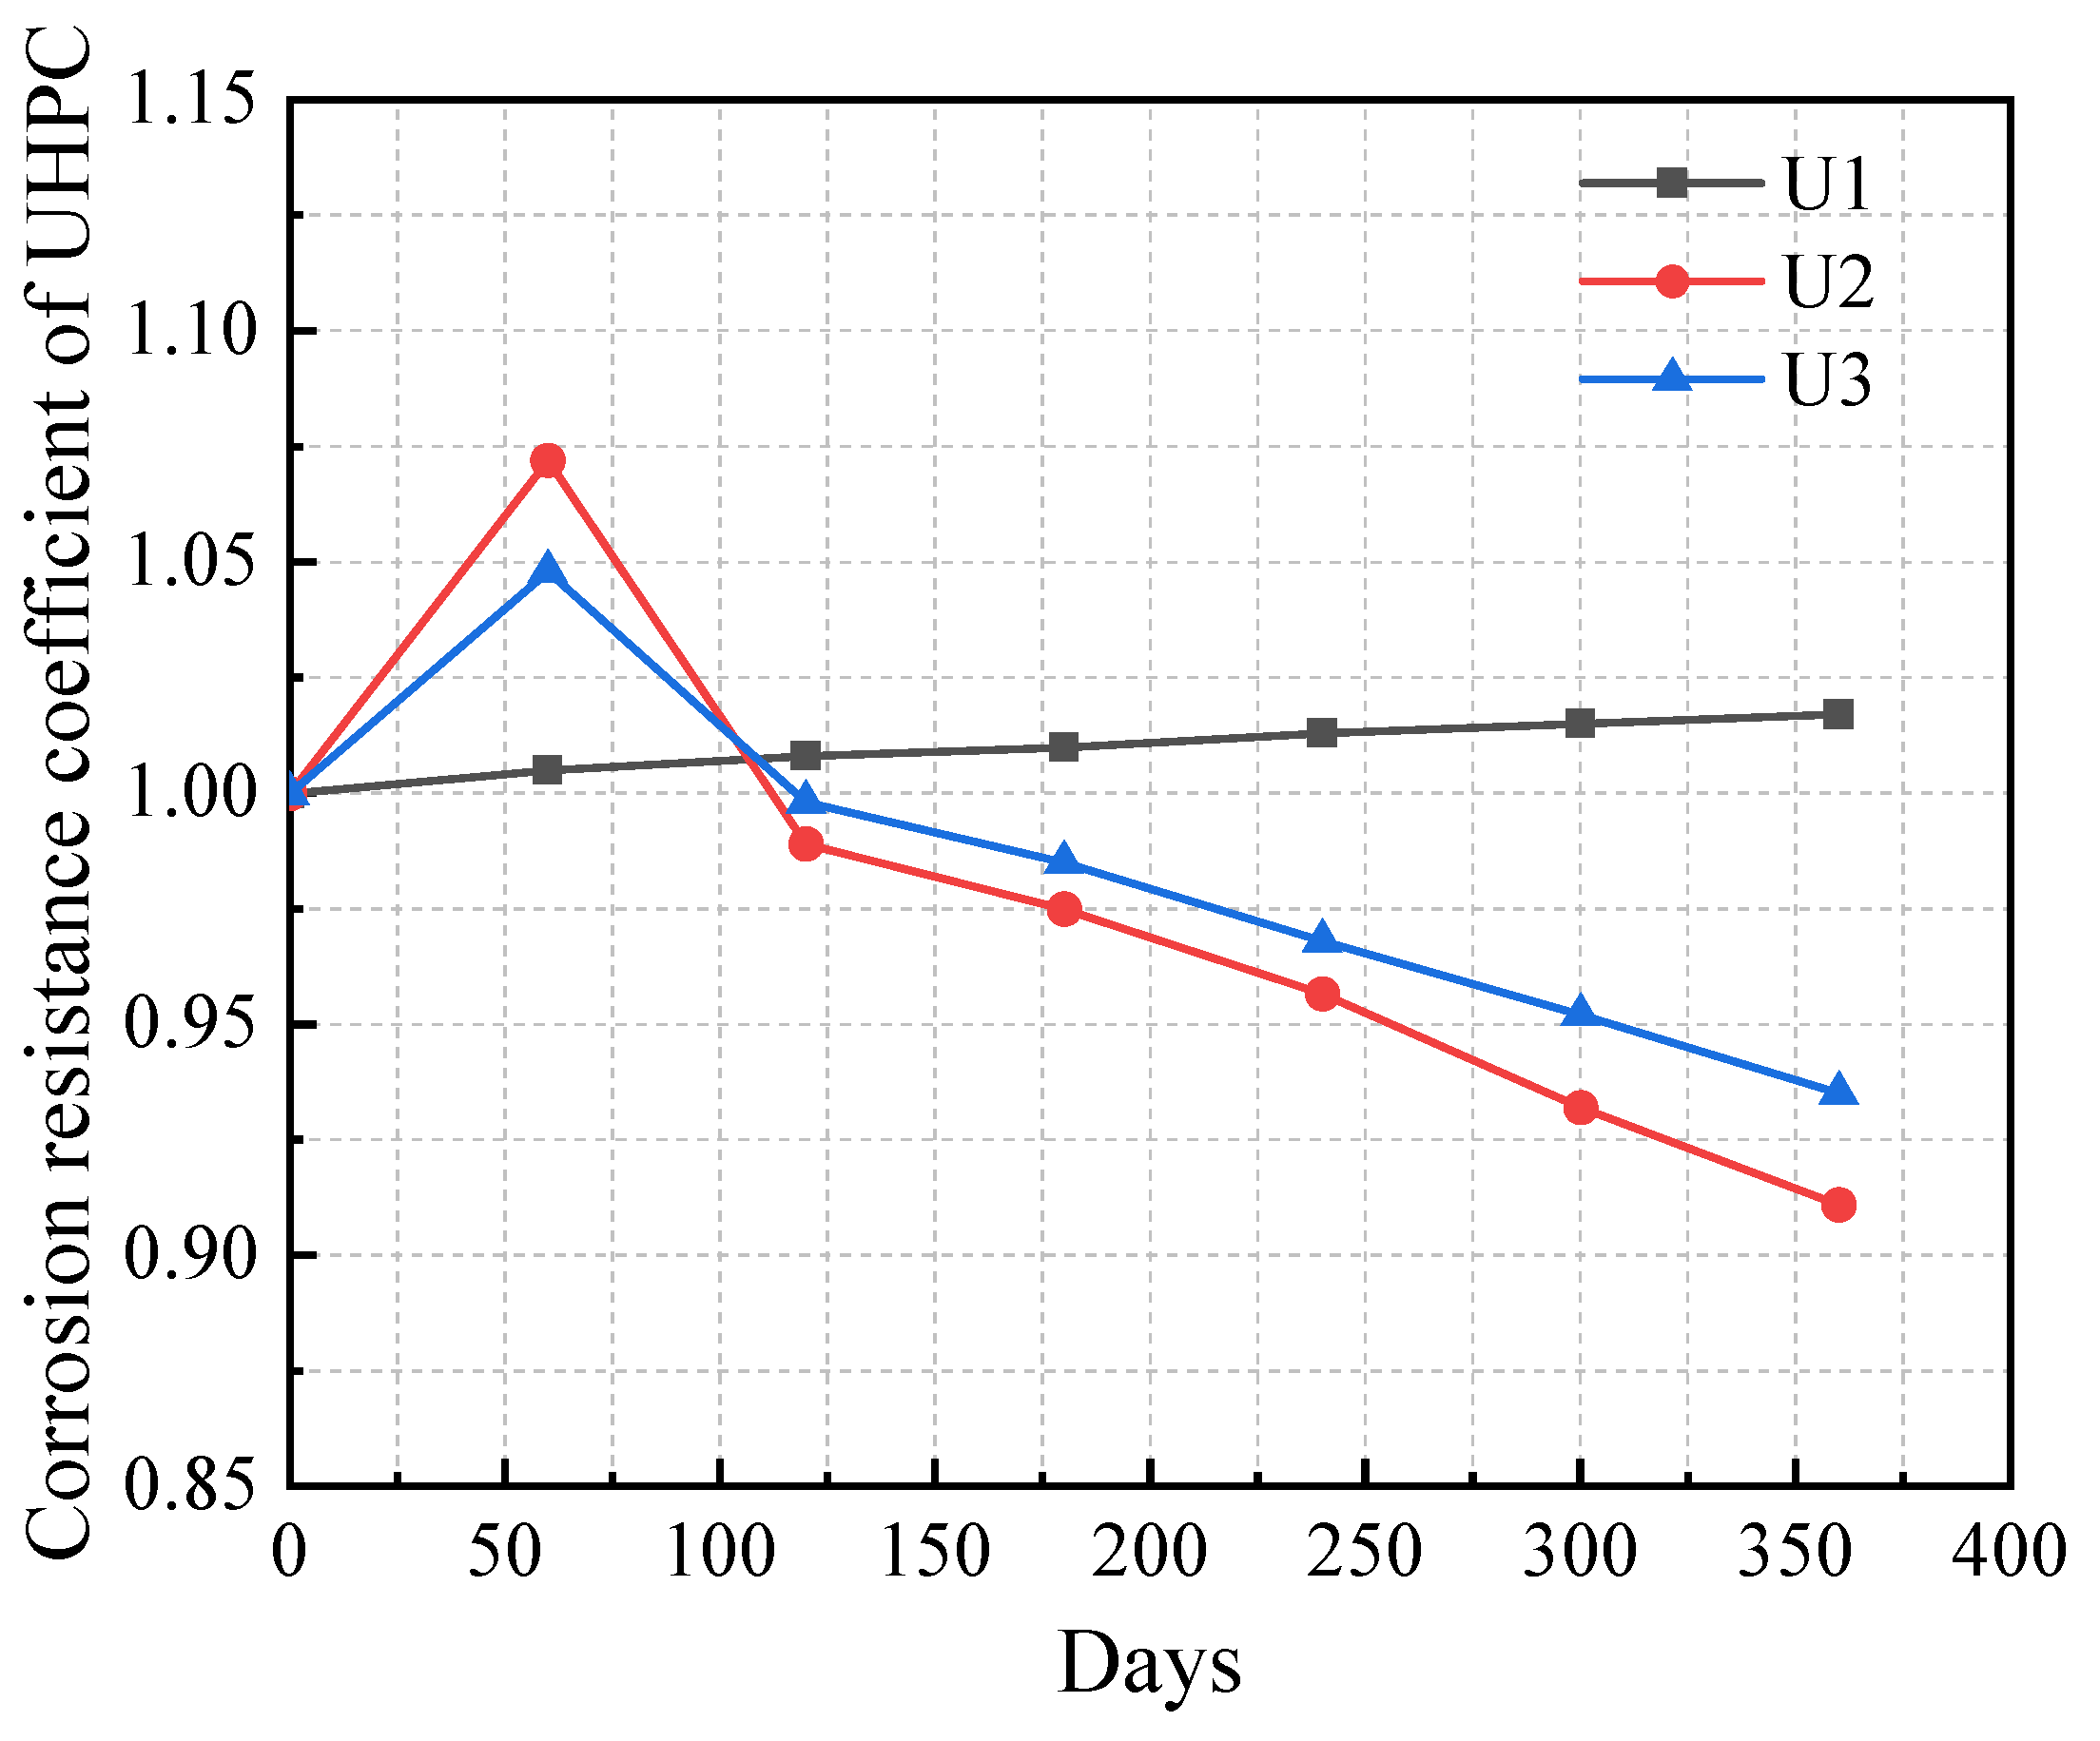
4.1.2. Compressive Strength Corrosion Resistance Coefficient of UHPC
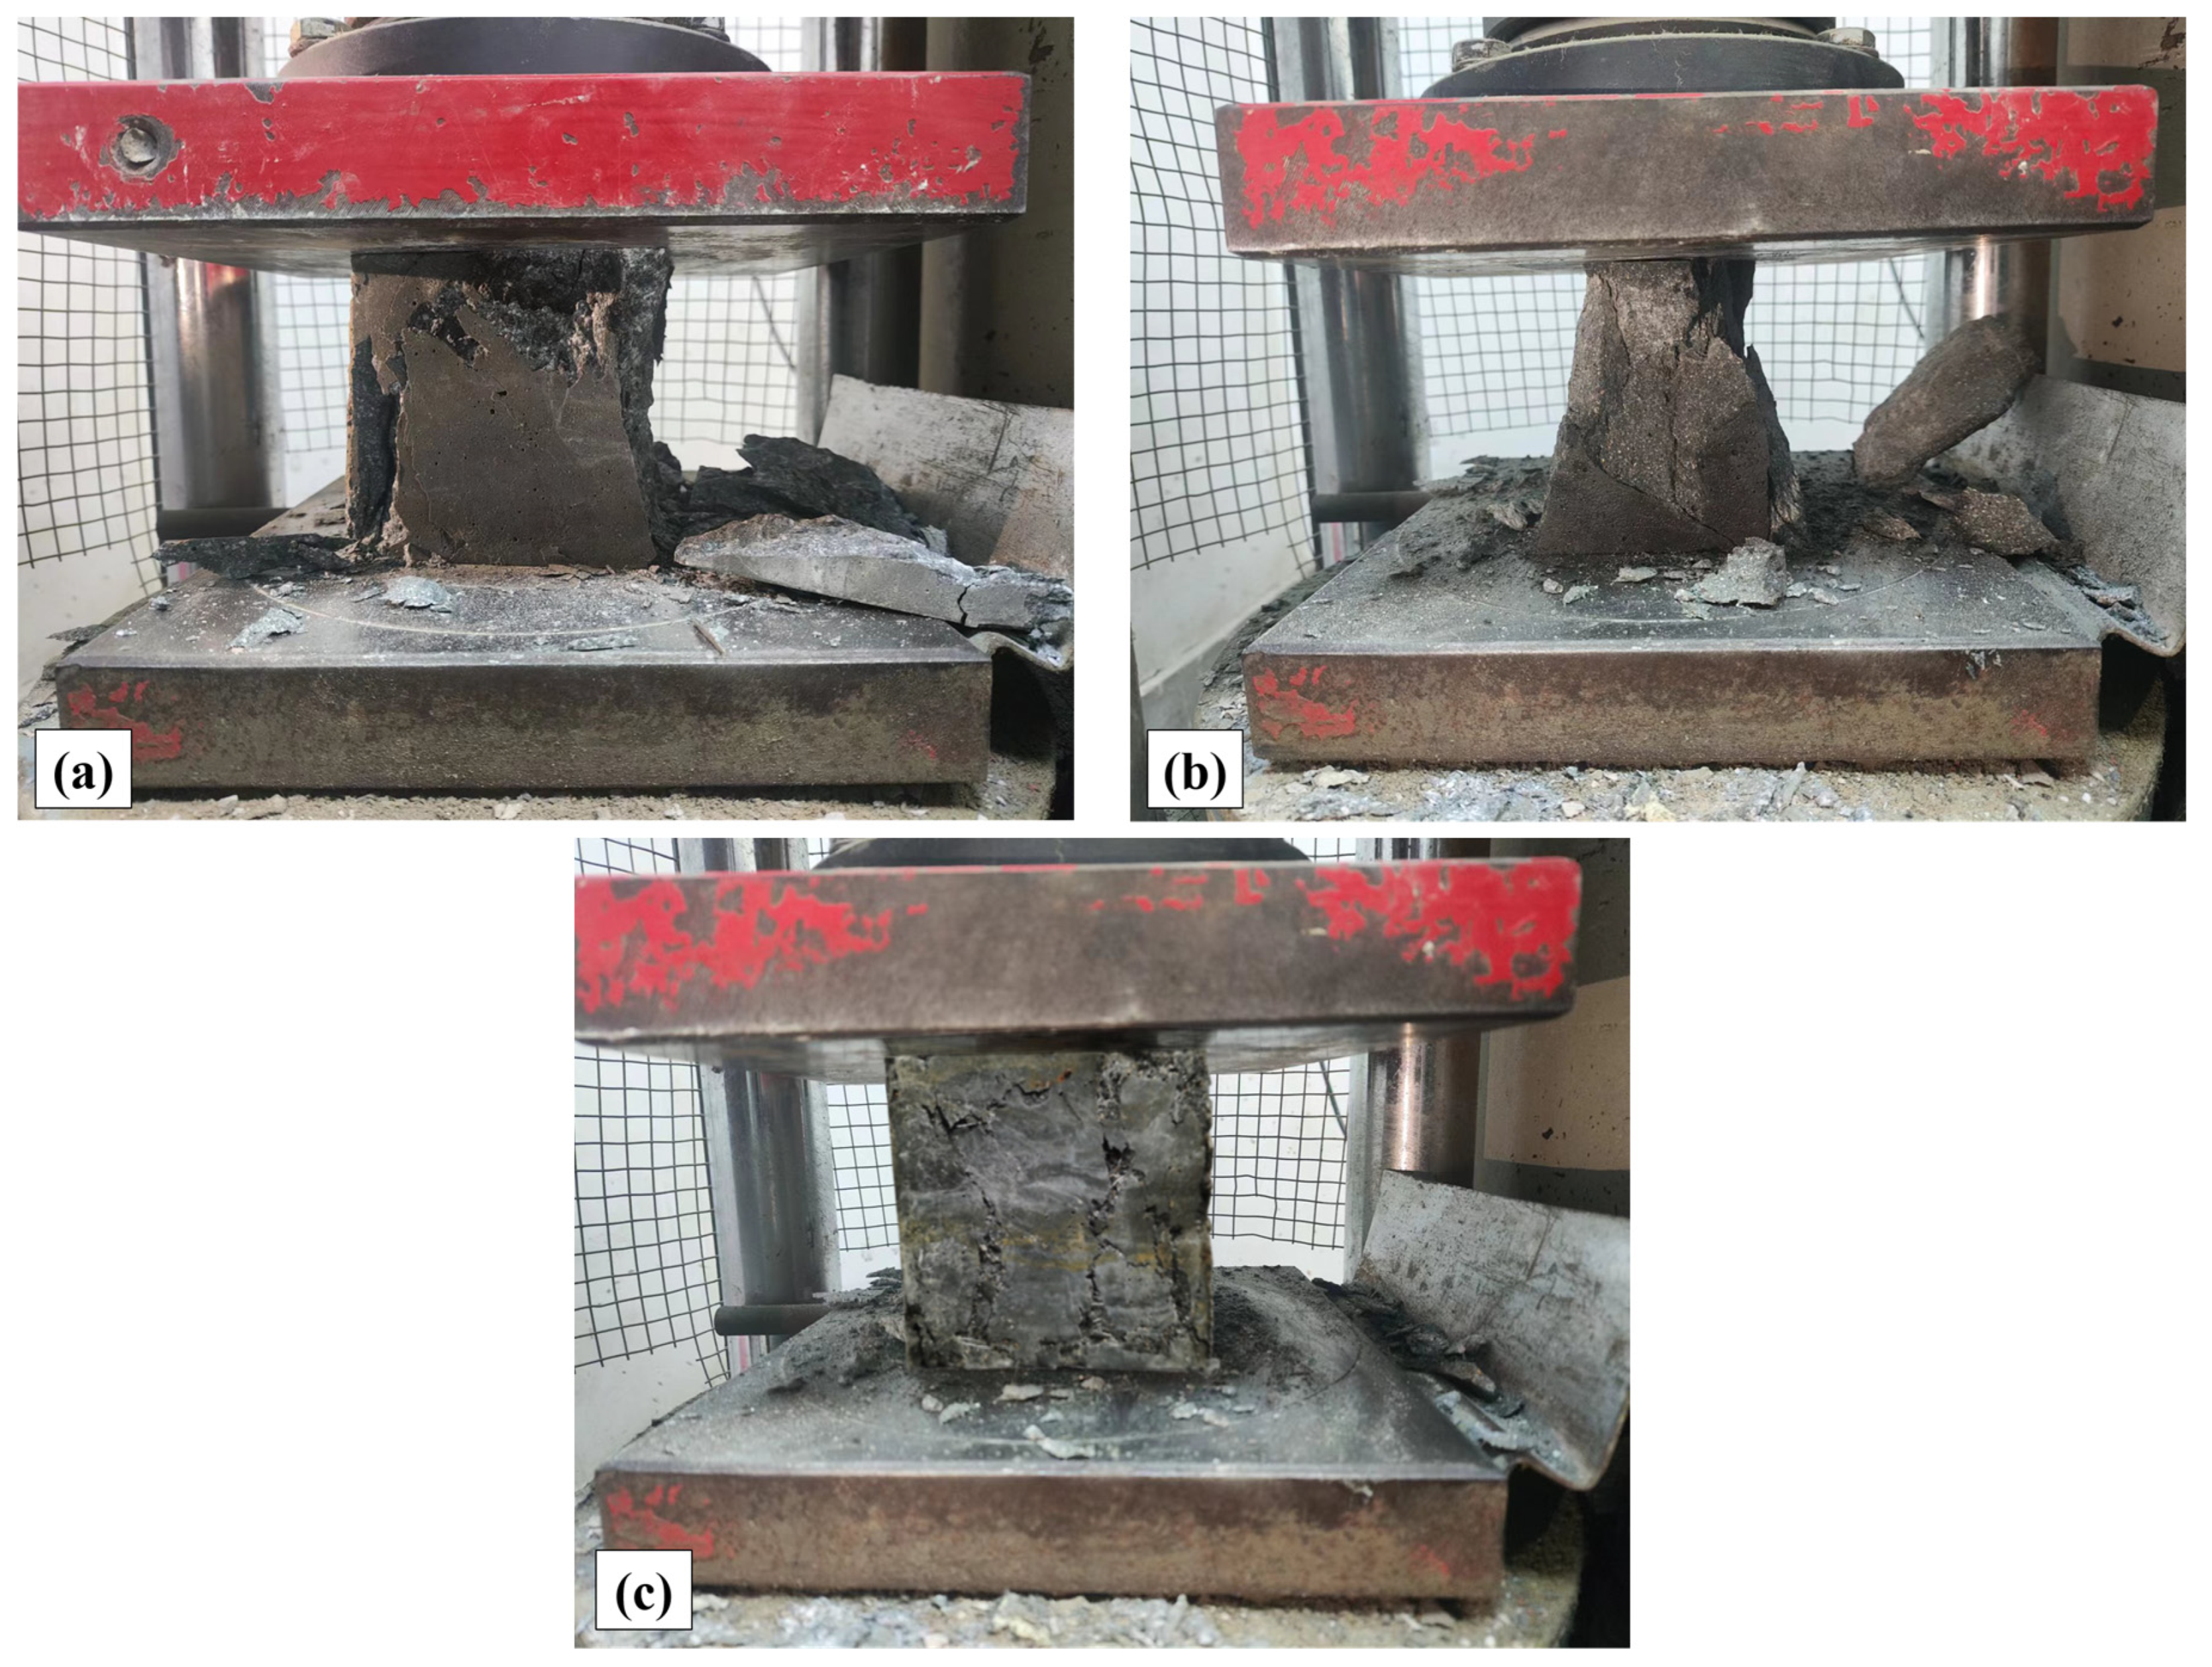
4.1.3. Surface Morphology Analysis of UHPC
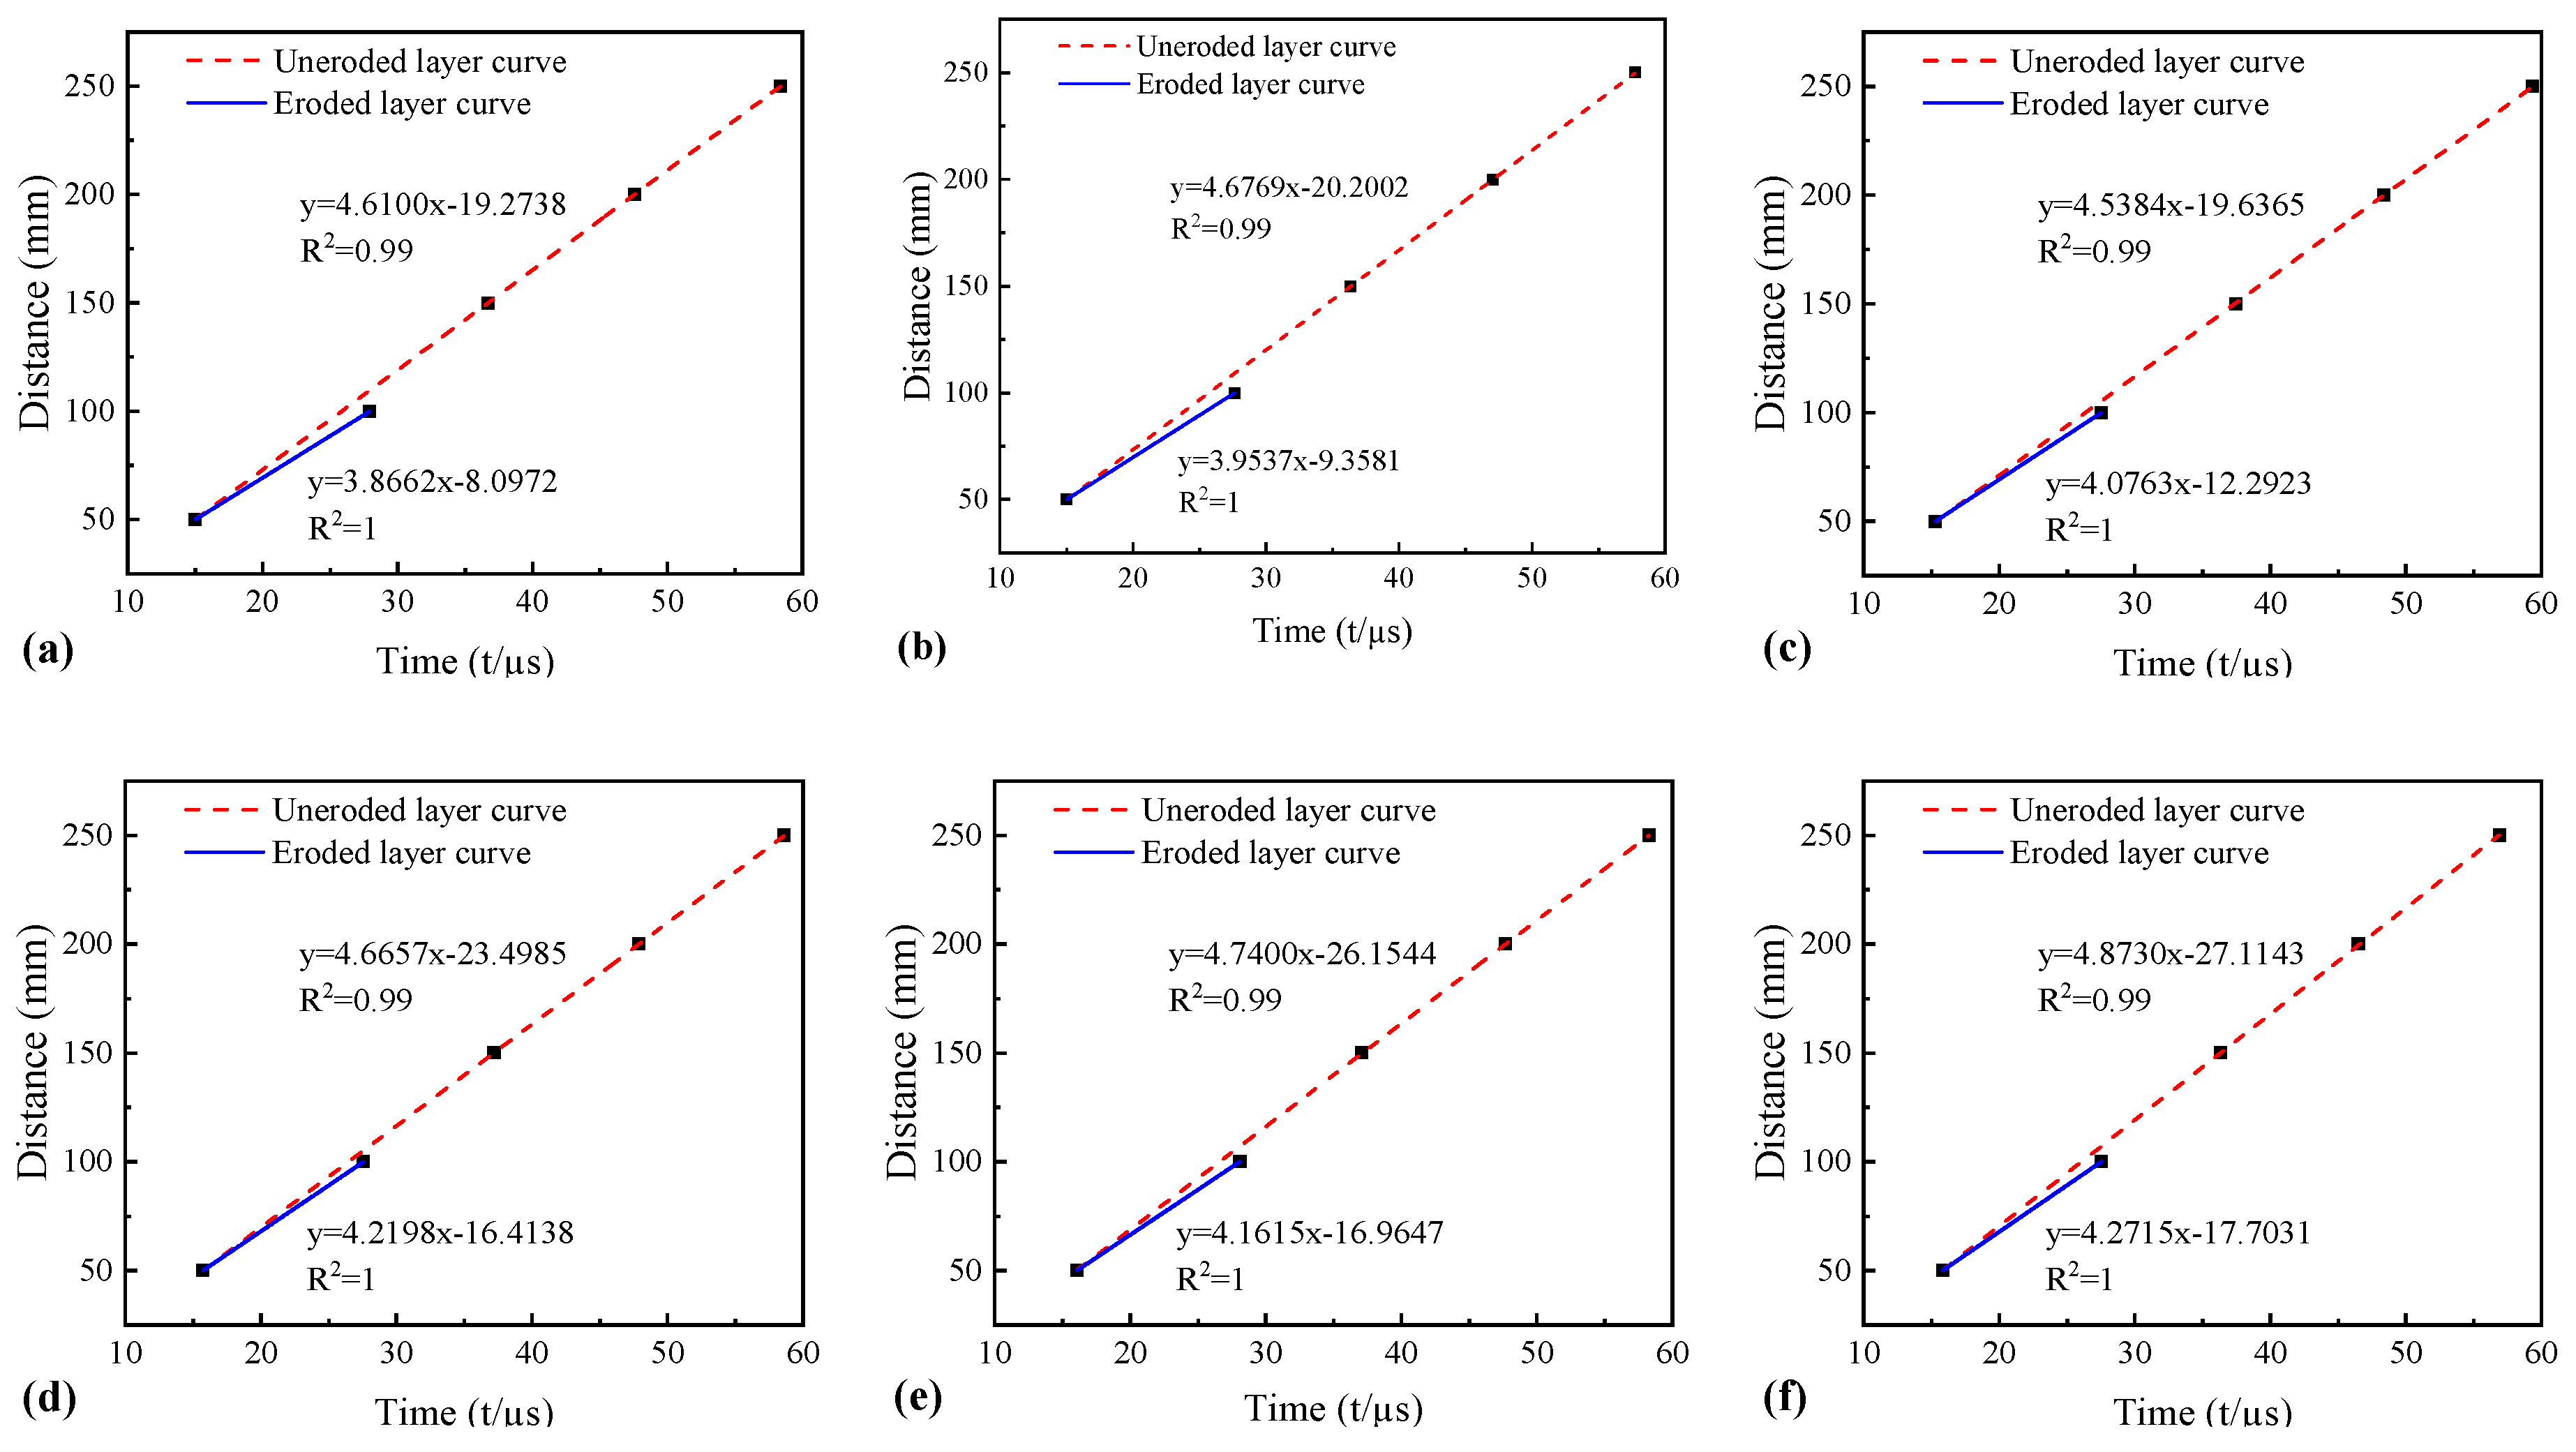
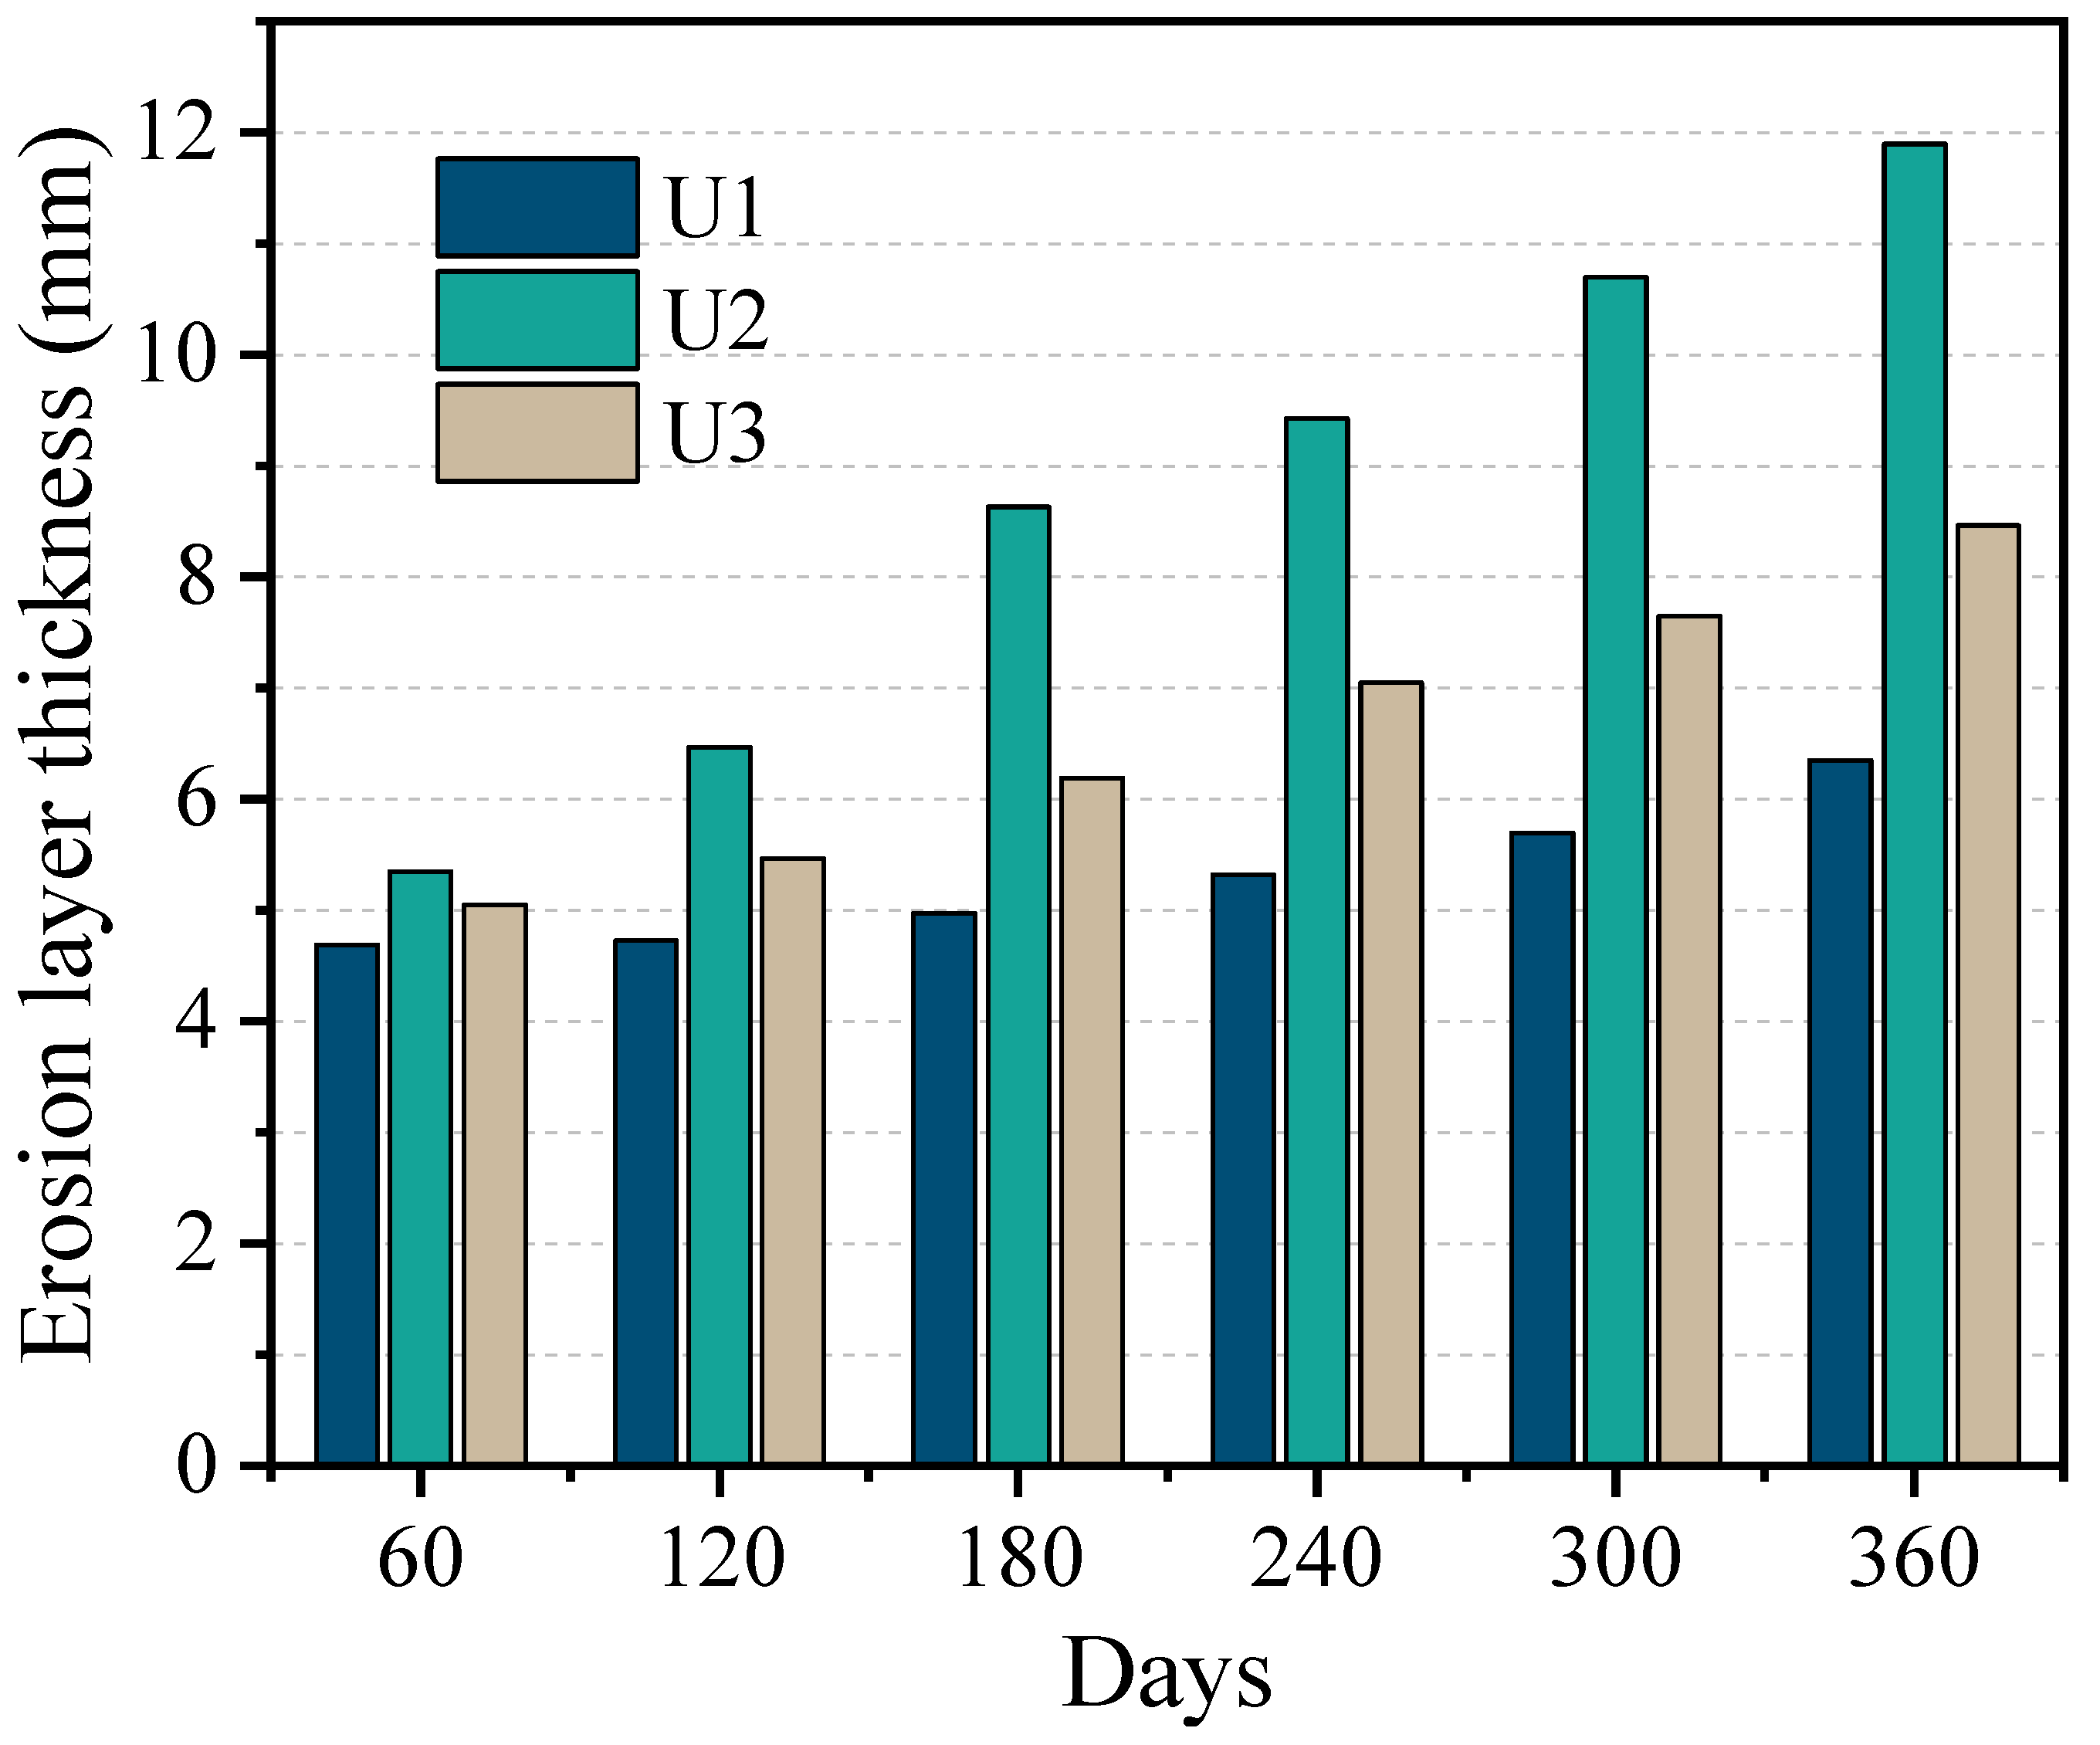
4.1.4. Erosion Layer Thickness Analysis
4.2. Microstructure Analysis of UHPC
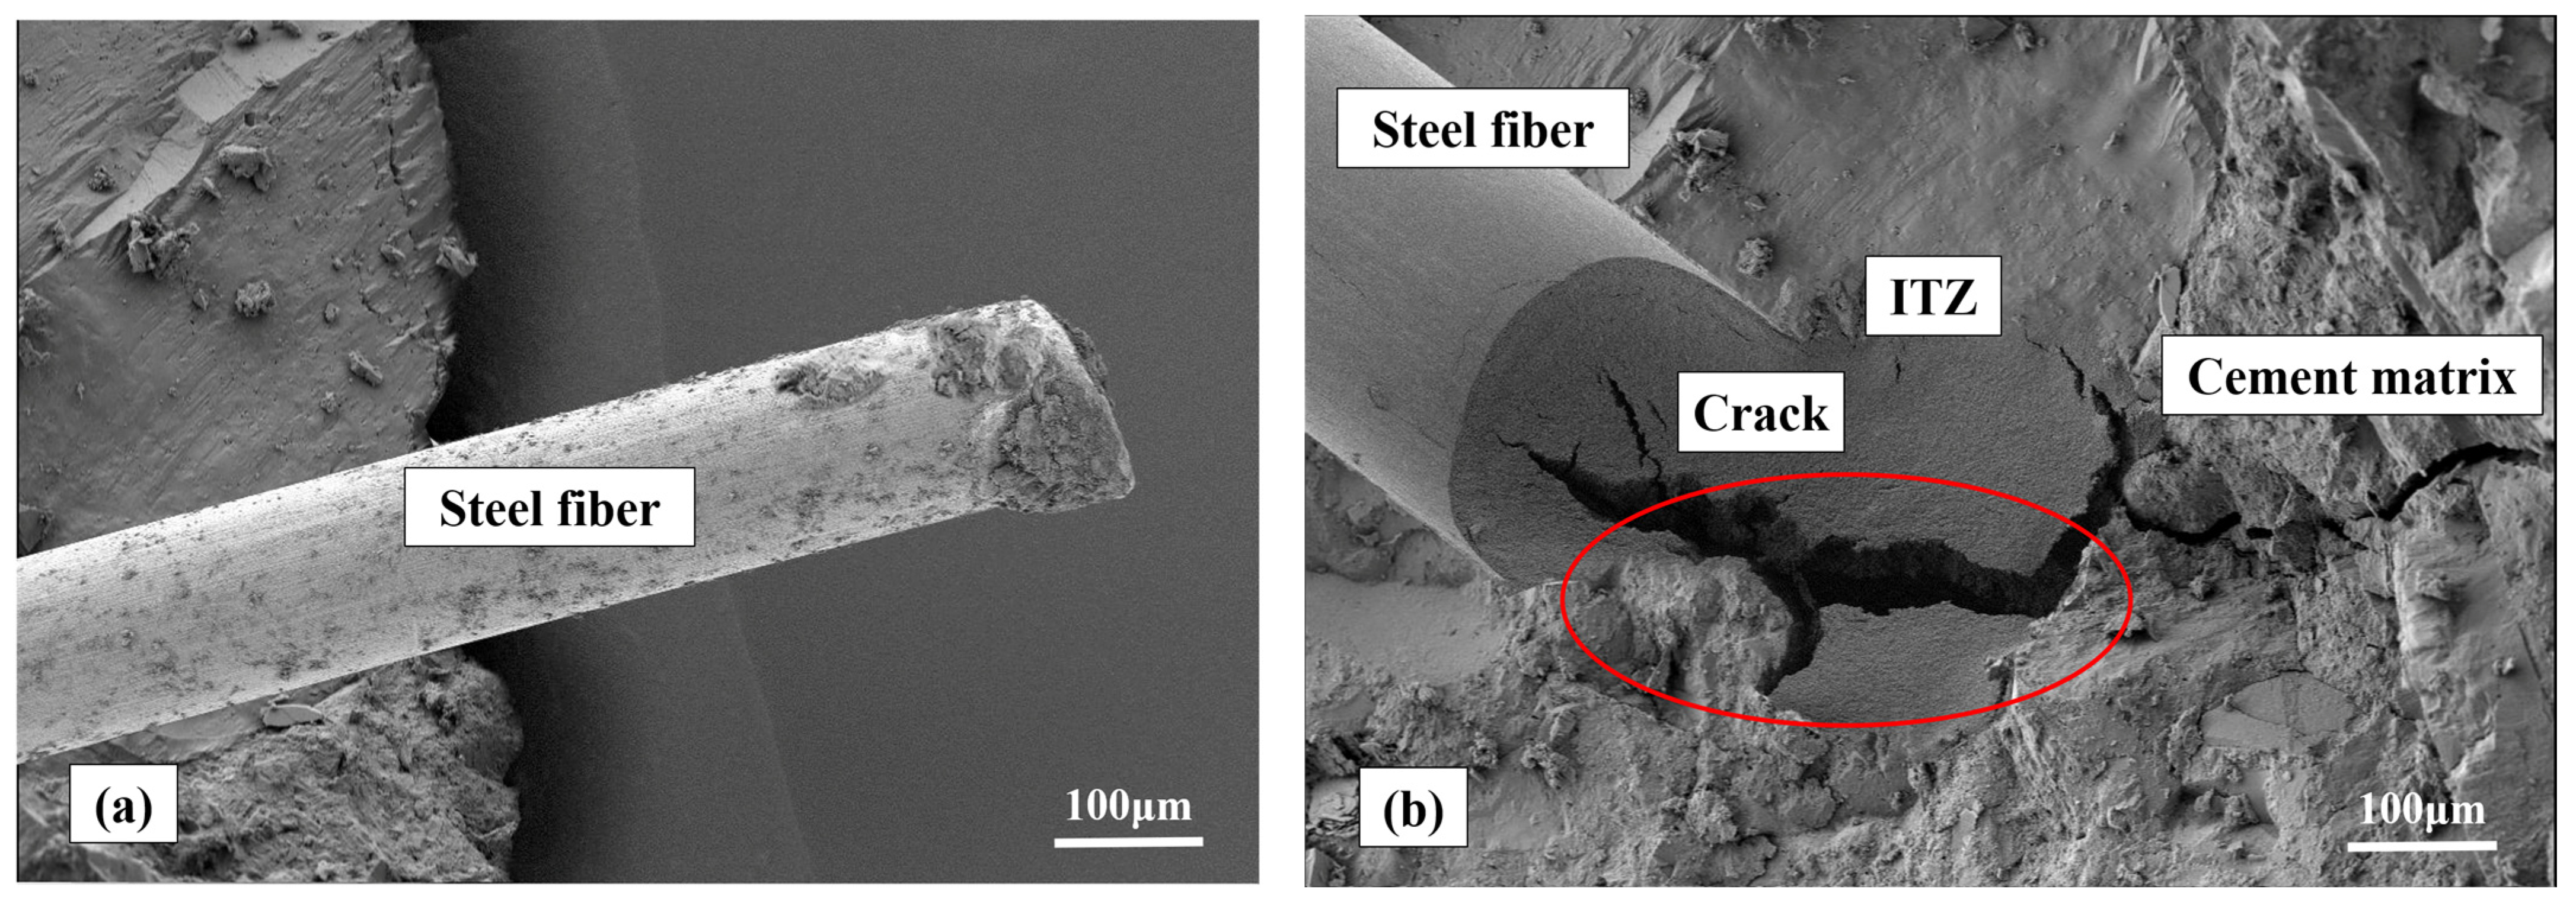
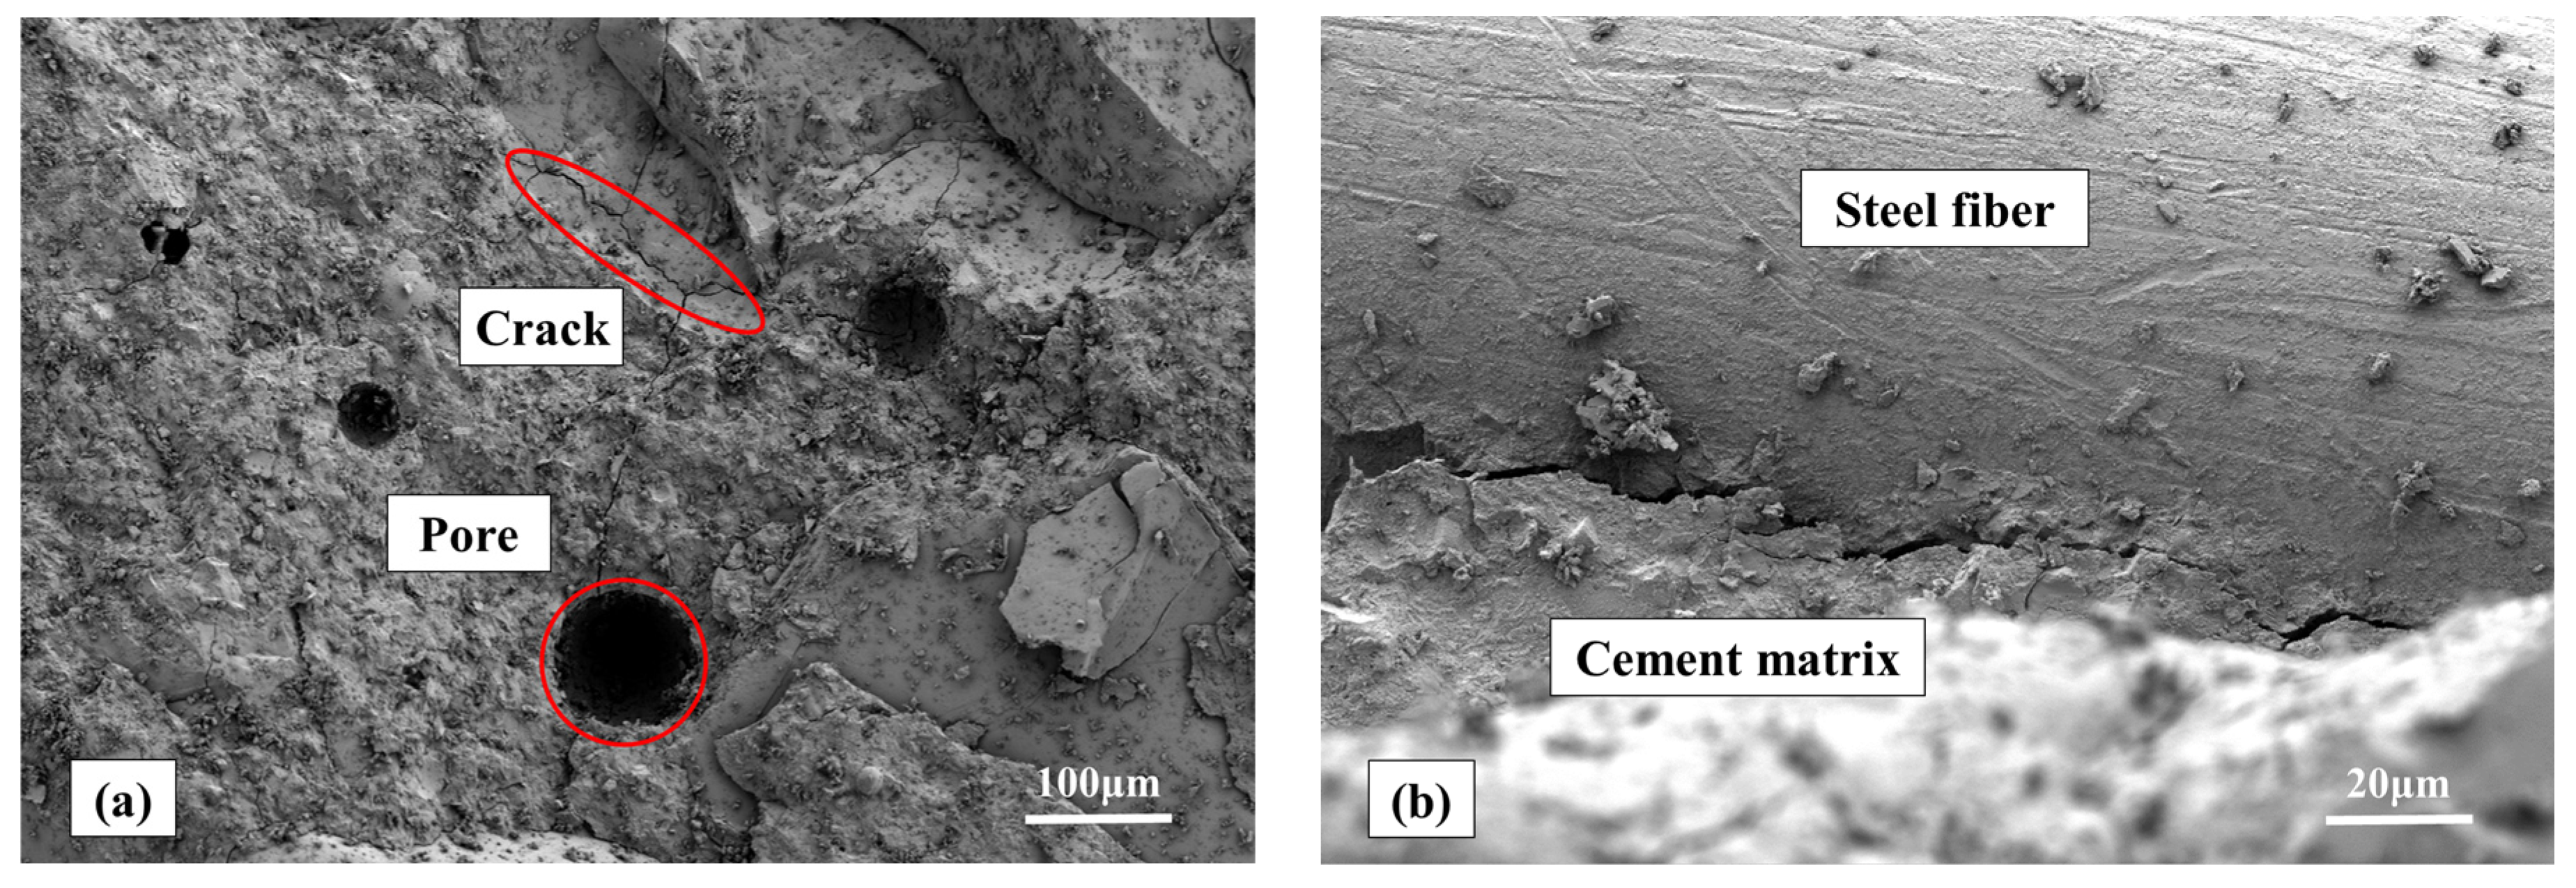
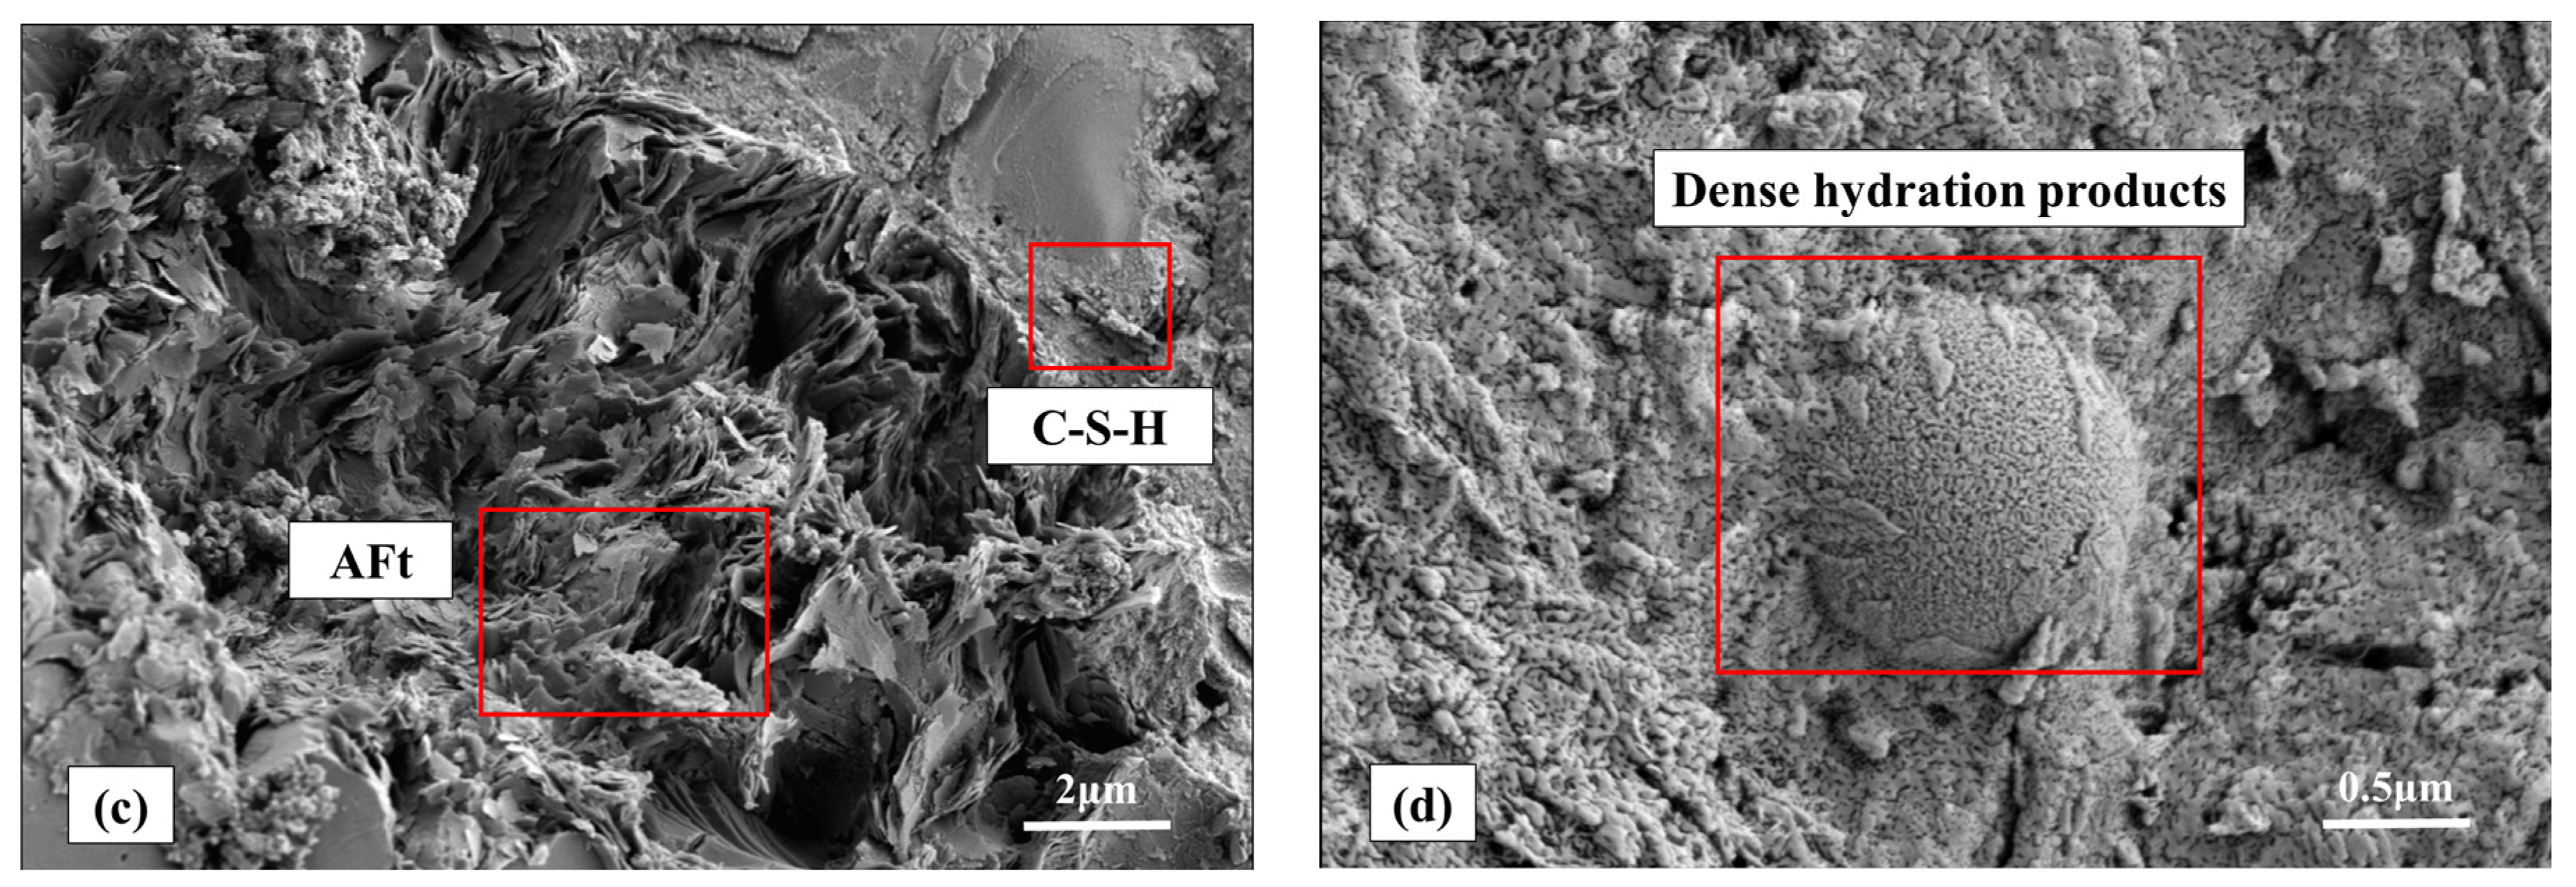
4.2.1. SEM
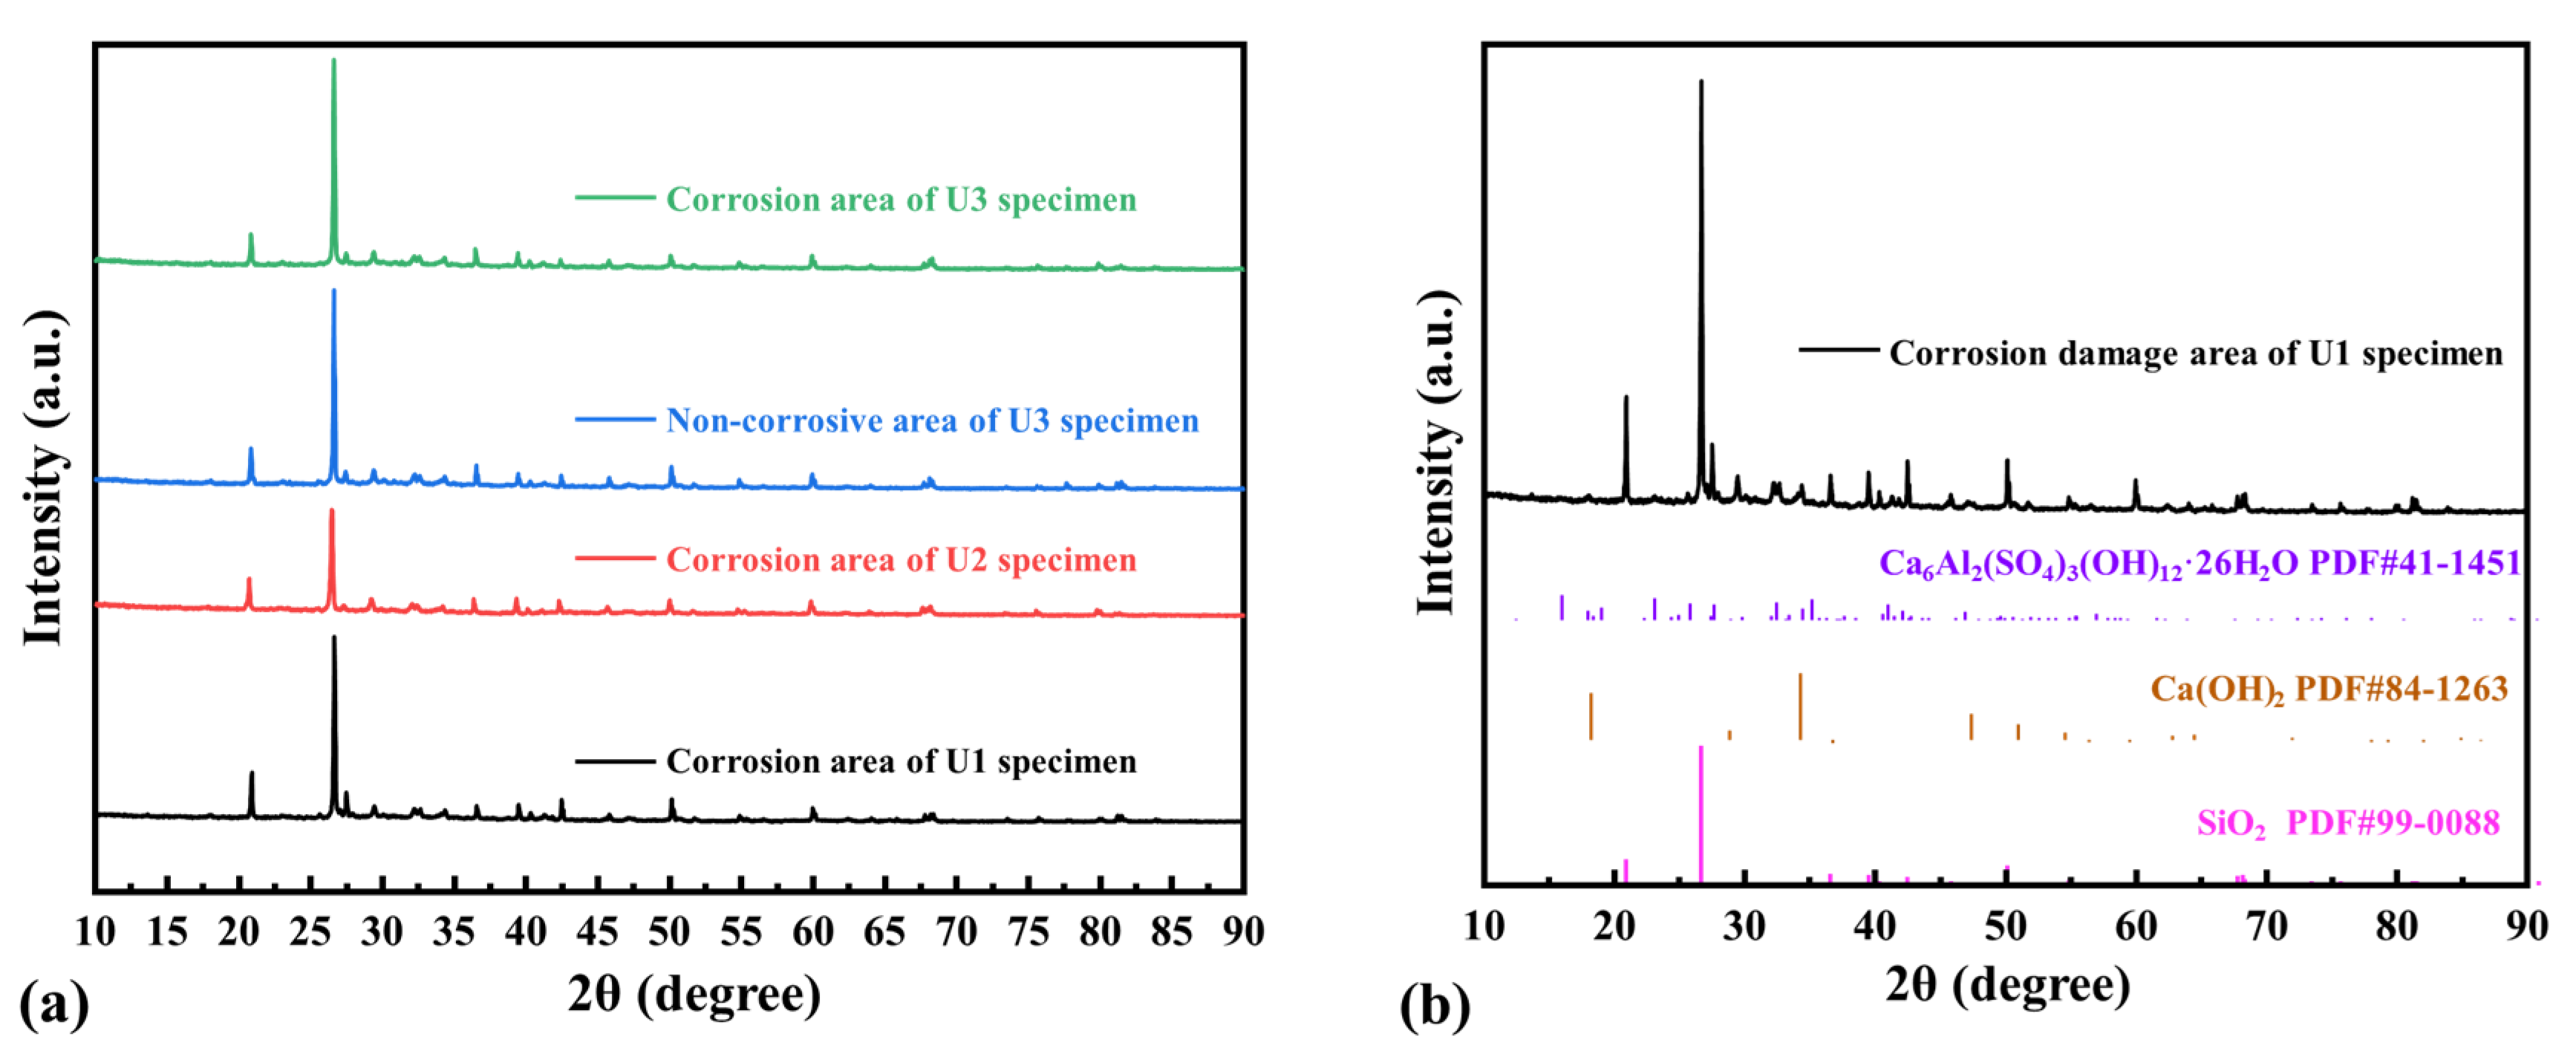
4.2.2. XRD
5. Conclusions
- (1)
- The study shows that when the ratio of cement to silica fume to quartz powder to quartz sand in UHPC is 716:187:416:743, with a water-to-binder ratio (W/B) of 0.20, the mechanical properties and workability of ultra-high-performance concrete (UHPC) are optimal at 3 days. At this point, the flexural strength is 9.6 MPa, the compressive strength is 55.6 MPa, and the slump flow is 227 mm. Additionally, as the volume fraction of steel fibers increases, the slump flow of UHPC decreases while its compressive and flexural strengths increase. With the addition of a 2% volume fraction of steel fibers, the mechanical properties of UHPC significantly improve and its workability remains good, with a 28-day flexural strength of 24.4 MPa, compressive strength of 132.5 MPa, and slump flow of 580 mm.
- (2)
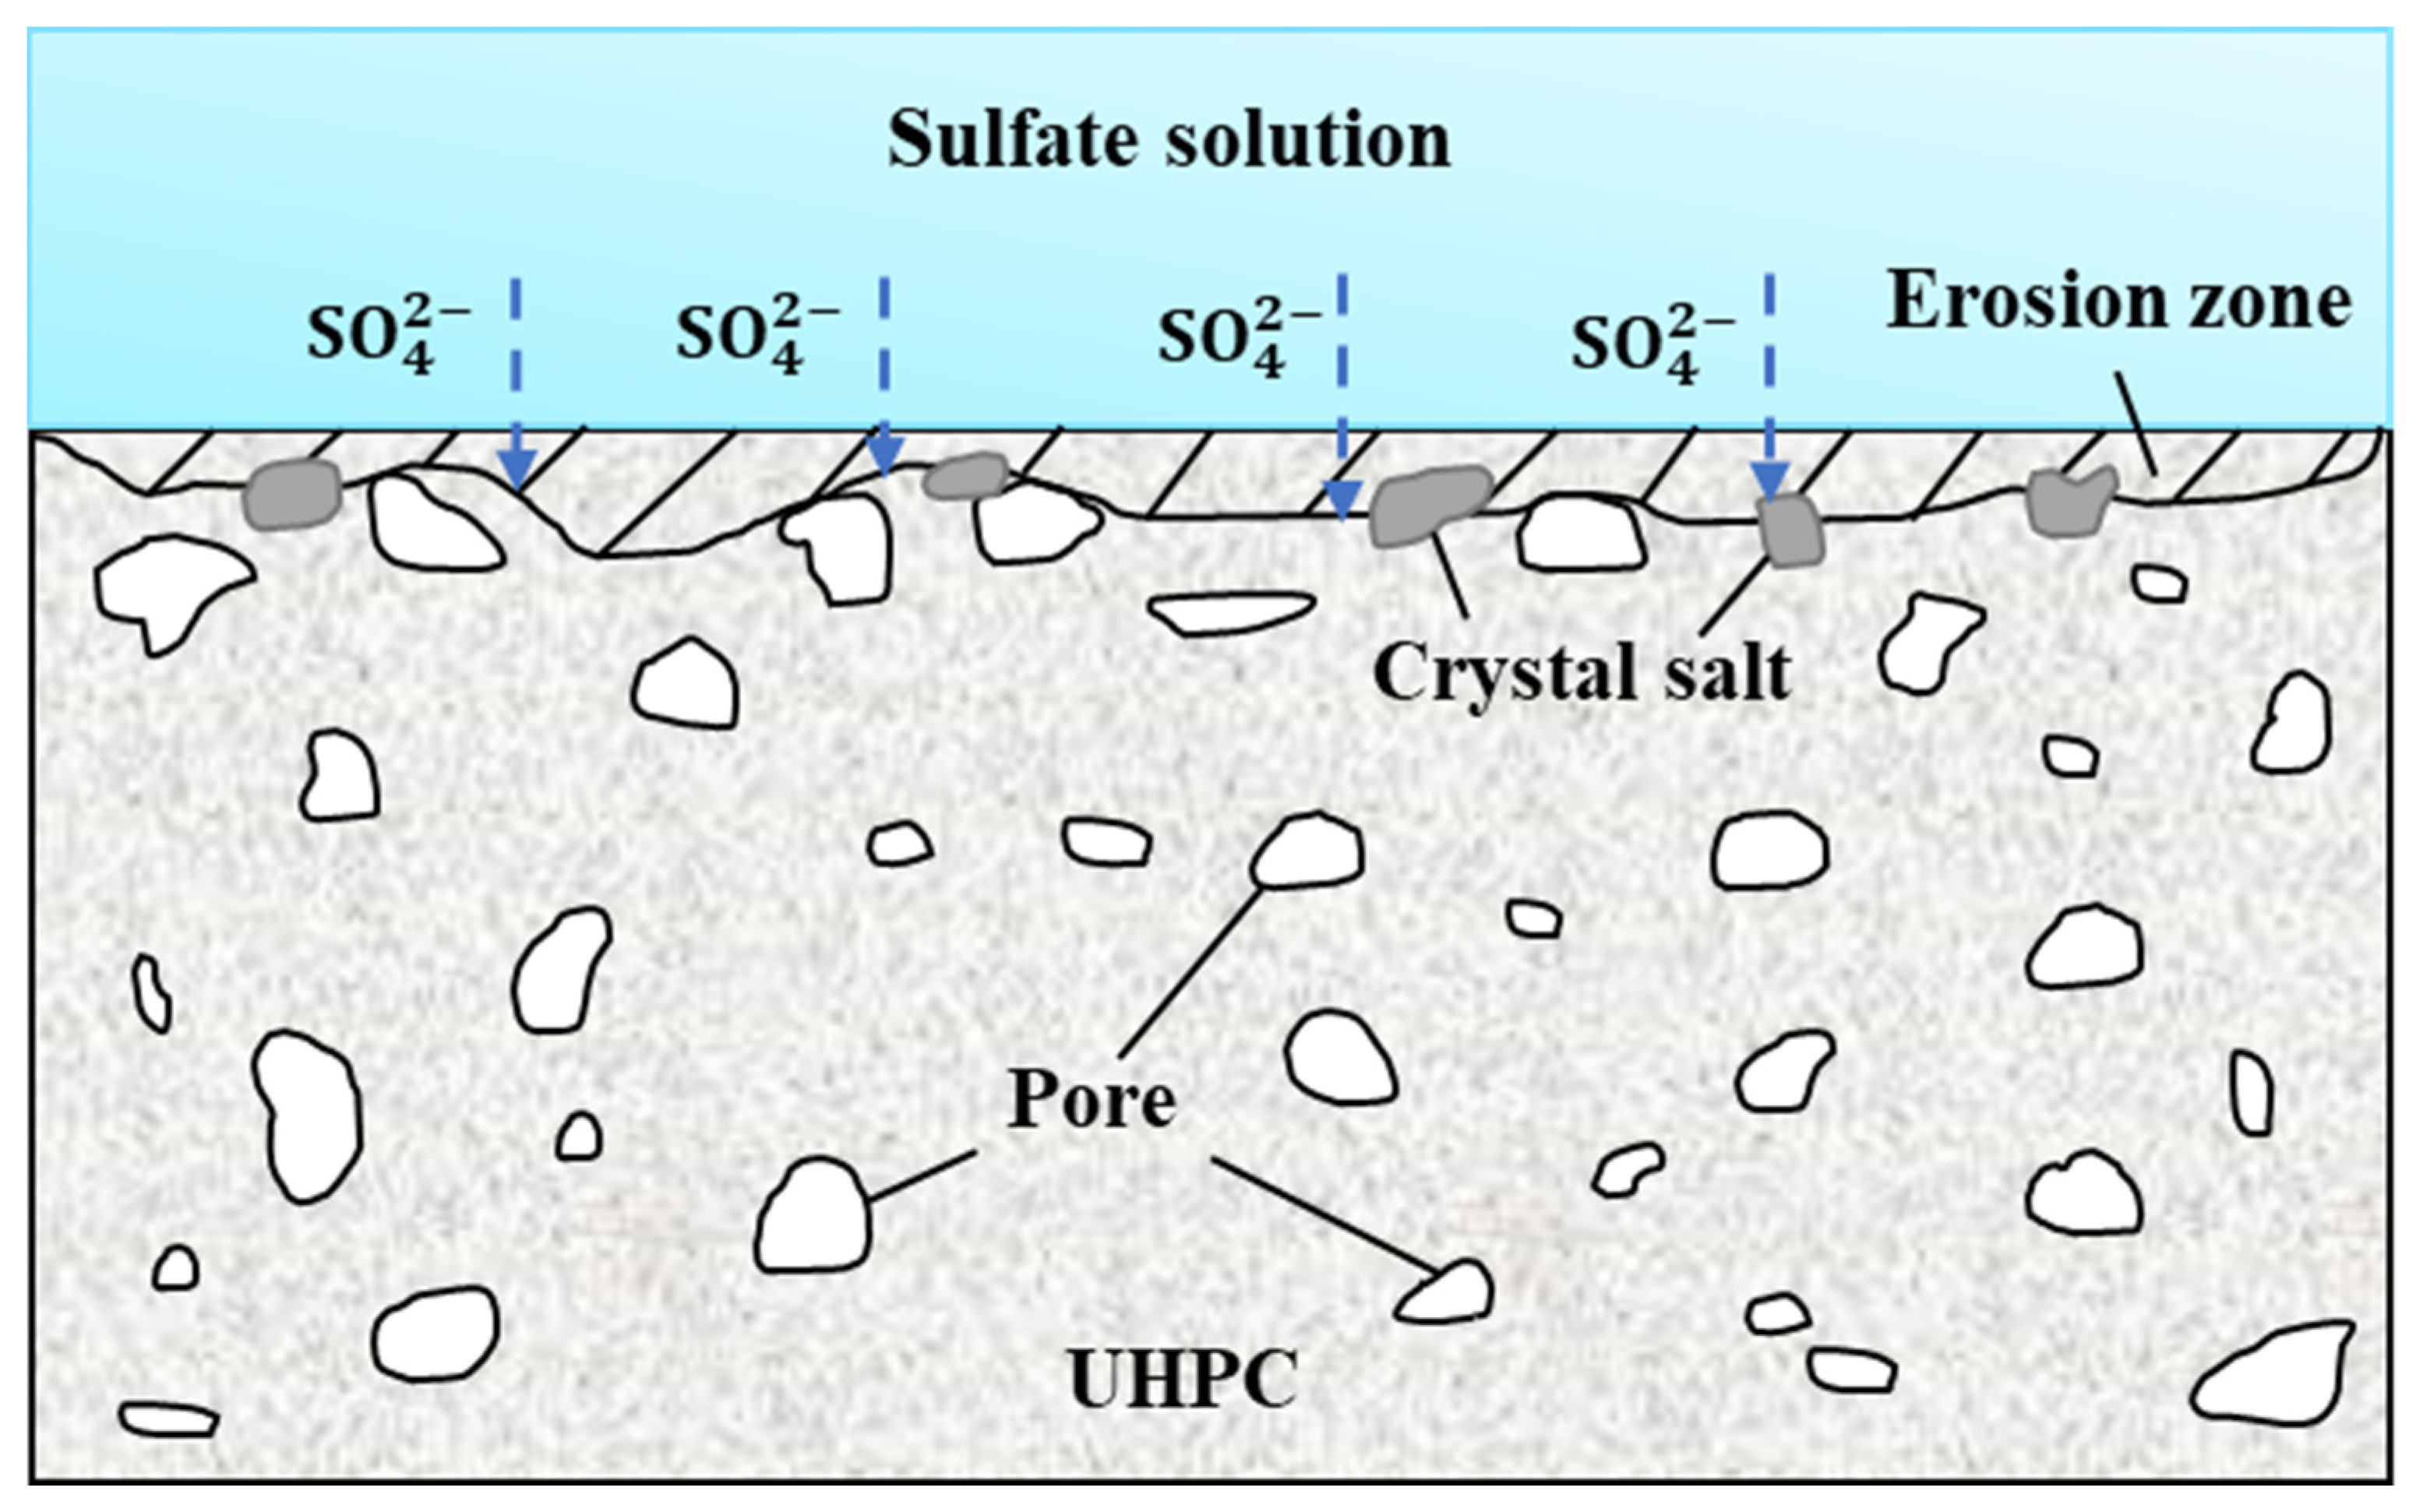
- Under standard curing conditions, the mass of the UHPC specimens gradually increased, with a 0.08% increase by 360 days. Under sulfate attack conditions, the mass and compressive strength corrosion resistance coefficients of two UHPC specimens, U2 and U3, showed a trend of first increasing and then decreasing, with relative mass losses of 0.73% and 0.49% at 360 days, respectively, and the compressive strength corrosion resistance coefficients decreased to 0.911 and 0.935. This is because long-term sulfate attack can induce the formation of ettringite and gypsum, promoting the growth of cracks, leading to specimen spalling, and thereby increasing the relative mass loss. It has been proven that adding fibers to the UHPC matrix can effectively reduce the mass loss caused by sulfate attack.
- (3)
- After 360 days under sulfate attack conditions, the surface of the samples showed an increase in pore area, with these pores interconnecting to form surface cracks, and pore diameters ranging from 0.1 mm to 0.5 mm. Crystalline salts precipitated around these pores have filled some of them to a certain extent, with the pores affected by crystalline salts accounting for about 30% of the total pore proportion.
- (4)
- The erosion layer’s thickness was found to escalate over time, under conditions of standard curing and exposure to sulfate attack. At 360 days, the extent of internal damage due to sulfate erosion was approximately double that observed at 60 days. However, when steel fibers were introduced, the escalation in damage was mitigated, with the rate of increase reducing to approximately 50% of the initial rate.
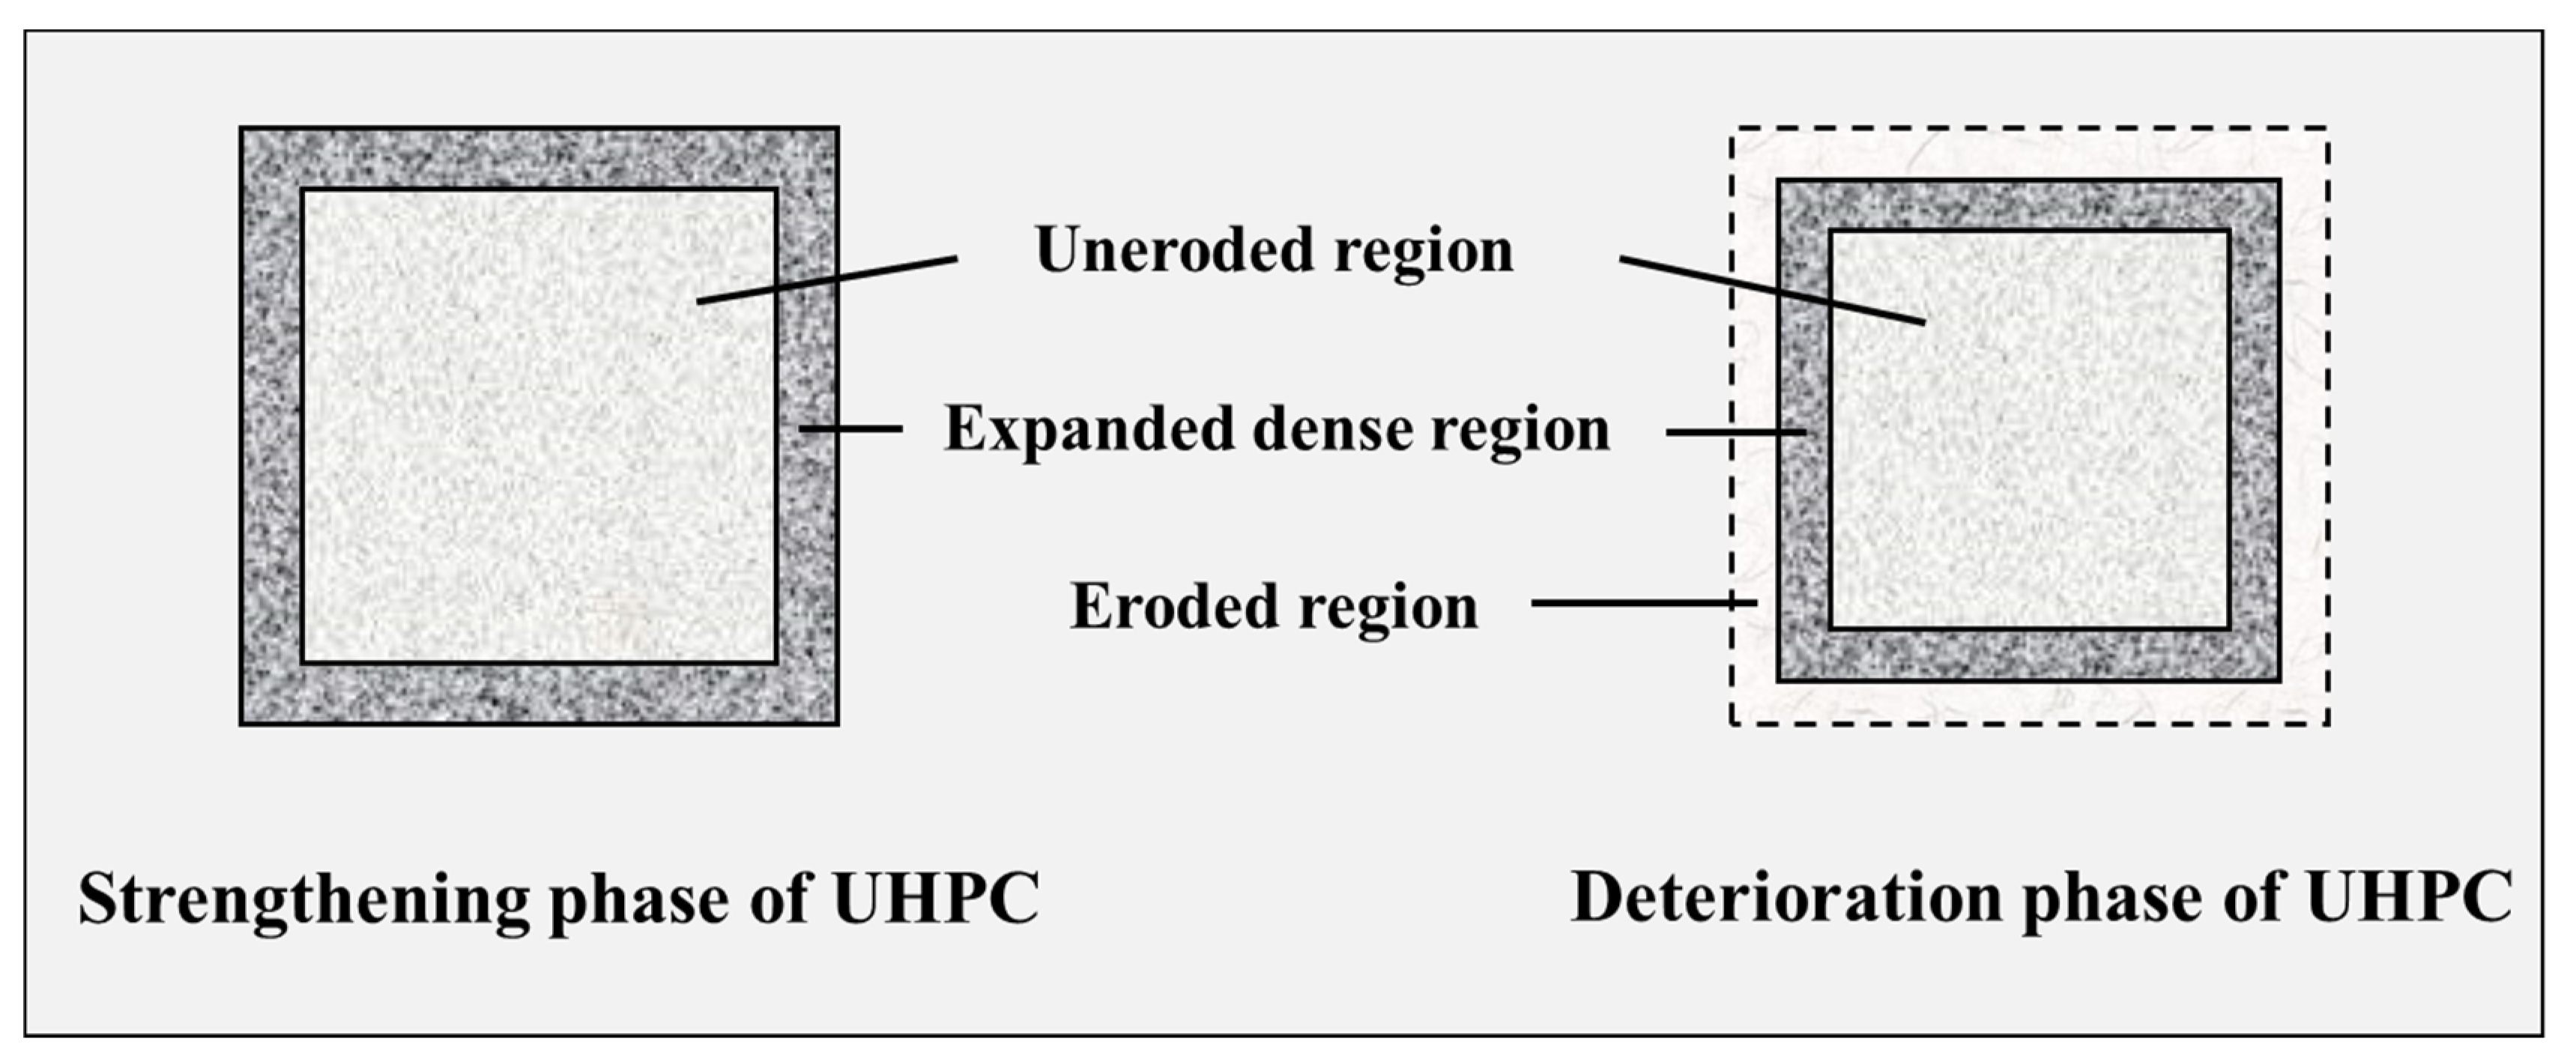
- (5)
- After 360 days, a comparative analysis revealed morphological variances between the erosion and non-erosion zones in each group. Coupled with XRD findings, it was ascertained that the erosion zones underwent a more extensive hydration process than their non-erosion counterparts, even though both shared a similar internal material composition, with a pronounced difference in their content. UHPC specimens, subjected to standard curing, presented a high degree of hydration and structural completeness. Sulfate erosion, however, consumes these hydration products, leading to structural compromise. Importantly, the incorporation of steel fibers into the specimens markedly improves their sulfate erosion resistance.
Author Contributions
Funding
Institutional Review Board Statement
Informed Consent Statement
Data Availability Statement
Acknowledgments
Conflicts of Interest
References
- Han, Y.; Zhou, T. Performance Analysis of High-Performance Concrete Materials in Civil Construction. Materials 2023, 16, 5711. [Google Scholar] [CrossRef] [PubMed]
- Liu, D.; Gong, C.; Tang, Y.; Jian, Y.; Cao, K.; Chen, H. Evaluation of Corrosion Damage in Sulfate-Attacked Concrete by CT, Ultrasonic Pulse Velocity Testing and AHP Methods. Sensors 2022, 22, 3037. [Google Scholar] [CrossRef]
- Sun, X.; Li, T.; Shi, F.; Liu, X.; Zong, Y.; Hou, B.; Tian, H. Sulphate Corrosion Mechanism of Ultra-High-Performance Concrete (UHPC) Prepared with Seawater and Sea Sand. Polymers 2022, 14, 971. [Google Scholar] [CrossRef]
- Heikal, M.; Ali, M.A.; Ghernaout, D.; Elboughdiri, N.; Ghernaout, B.; Bendary, H.I. Prolonging the Durability of Maritime Constructions through a Sustainable and Salt-Resistant Cement Composite. Materials 2023, 16, 6876. [Google Scholar] [CrossRef]
- Zhao, Q.; He, T.; Zhang, G.; Li, Y.; Rong, G.; Ding, Q. Influence of Structural Characterization of C3S-C3A Paste under Sulfate Attack. Materials 2023, 16, 77. [Google Scholar] [CrossRef] [PubMed]
- Li, F.; Lv, T.; Wei, S. Performance, Mechanical Properties and Durability of a New Type of UHPC—Basalt Fiber Reinforced Reactive Powder Concrete: A Review. Polymers 2023, 15, 3129. [Google Scholar] [CrossRef]
- Ning, H.; Ren, H.; Wang, W.; Nie, X. Impact Resistance of Ultra-High-Performance Concrete Composite Structures. Materials 2023, 16, 7456. [Google Scholar] [CrossRef] [PubMed]
- Du, J.; Meng, W.; Khayat, K.H.; Bao, Y.; Guo, P.; Lyu, Z.; Wang, H. New development of ultra-high-performance concrete (UHPC). Compos. Part B Eng. 2021, 224, 109220. [Google Scholar] [CrossRef]
- Guo, P.; Mahjoubi, S.; Liu, K.; Meng, W.; Bao, Y. Self-updatable AI-assisted design of low-carbon cost-effective ultra-high-performance concrete (UHPC). Case Stud. Constr. Mater. 2023, 19, e2625. [Google Scholar] [CrossRef]
- Yoo, D.; Jang, Y.S.; Oh, T.; Banthia, N. Use of engineered steel fibers as reinforcements in ultra-high-performance concrete considering corrosion effect. Cem. Concr. Compos. 2022, 133, 104692. [Google Scholar] [CrossRef]
- Akeed, M.H.; Qaidi, S.; Ahmed, H.U.; Faraj, R.H.; Mohammed, A.S.; Emad, W.; Azevedo, A.R.G. Ultra-high-performance fiber-reinforced concrete. Part II: Hydration and microstructure. Case Stud. Constr. Mater. 2022, 17, e1289. [Google Scholar] [CrossRef]
- Sun, M.; Yu, R.; Jiang, C.; Fan, D.; Shui, Z. Quantitative effect of seawater on the hydration kinetics and microstructure development of Ultra High Performance Concrete (UHPC). Constr. Build. Mater. 2022, 340, 127733. [Google Scholar] [CrossRef]
- Yang, L.; Fulin, Y.; Gaozhan, Z. Synergistic effects of sustained loading and sulfate attack on the damage of UHPC based on lightweight aggregate. Constr. Build. Mater. 2023, 374, 130929. [Google Scholar] [CrossRef]
- Shannag, M.J.; Shaia, H.A. Sulfate resistance of high-performance concrete. Cem. Concr. Compos. 2003, 25, 363–369. [Google Scholar] [CrossRef]
- Mbessa, M.; Péra, J. Durability of high-strength concrete in ammonium sulfate solution. Cem. Concr. Res. 2001, 31, 1227–1231. [Google Scholar] [CrossRef]
- Lee, S.T.; Moon, H.Y.; Swamy, R.N. Sulfate attack and role of silica fume in resisting strength loss. Cem. Concr. Compos. 2005, 27, 65–76. [Google Scholar] [CrossRef]
- Mangat, P.S.; El-Khatib, J.M. Influence of initial curing on sulphate resistance of blended cement concrete. Cem. Concr. Res. 1992, 22, 1089–1100. [Google Scholar] [CrossRef]
- Park, Y.; Suh, J.; Lee, J.; Shin, Y. Strength deterioration of high strength concrete in sulfate environment. Cem. Concr. Res. 1999, 29, 1397–1402. [Google Scholar] [CrossRef]
- Aydın, S.; Baradan, B. Sulfate resistance of alkali-activated slag and Portland cement based reactive powder concrete. J. Build. Eng. 2021, 43, 103205. [Google Scholar] [CrossRef]
- Indhumathi, S.; Praveen Kumar, S.; Pichumani, M. Reconnoitring principles and practice of Modified Andreasen and Andersen particle packing theory to augment Engineered cementitious composite. Constr. Build. Mater. 2022, 353, 129106. [Google Scholar] [CrossRef]
- Yu, R.; Spiesz, P.; Brouwers, H.J.H. Mix design and properties assessment of Ultra-High Performance Fibre Reinforced Concrete (UHPFRC). Cem. Concr. Res. 2014, 56, 29–39. [Google Scholar] [CrossRef]
- Wang, J.N.; Yu, R.; Xu, W.Y.; Hu, C.Y.; Shui, Z.H.; Qian, D.; Wang, X.P. A novel design of low carbon footprint Ultra-High Performance Concrete (UHPC) based on full scale recycling of gold tailings. Constr. Build. Mater. 2021, 304, 124664. [Google Scholar] [CrossRef]
- Fuller, W.B.; Thompson, S.E. The Laws of Proportioning. Concrete. Trans. Am. Soc. Civ. Eng. 1907, 59, 67–143. [Google Scholar] [CrossRef]
- Shi, Y.; Long, G.; Zen, X.; Xie, Y.; Shang, T. Design of binder system of eco-efficient UHPC based on physical packing and chemical effect optimization. Constr. Build. Mater. 2021, 274, 121382. [Google Scholar] [CrossRef]
- Darvishmotevalli, M.; Zarei, A.; Moradnia, M.; Noorisepehr, M.; Mohammadi, H. Optimization of saline wastewater treatment using electrochemical oxidation process: Prediction by RSM method. MethodsX 2019, 6, 1101–1113. [Google Scholar] [CrossRef] [PubMed]
- Bellotti, D.; Cassettari, L.; Mosca, M.; Magistri, L. RSM approach for stochastic sensitivity analysis of the economic sustainability of a methanol production plant using renewable energy sources. J. Clean. Prod. 2019, 240, 117947. [Google Scholar] [CrossRef]
- Cihan, M.T.; Güner, A.; Yüzer, N. Response surfaces for compressive strength of concrete. Constr. Build. Mater. 2013, 40, 763–774. [Google Scholar] [CrossRef]
- Moseson, A.J.; Moseson, D.E.; Barsoum, M.W. High volume limestone alkali-activated cement developed by design of experiment. Cem. Concr. Compos. 2012, 34, 328–336. [Google Scholar] [CrossRef]
- DeRousseau, M.A.; Kasprzyk, J.R.; Srubar, W.V. Computational design optimization of concrete mixtures: A review. Cem. Concr. Res. 2018, 109, 42–53. [Google Scholar] [CrossRef]
- Ghafari, E.; Costa, H.; Júlio, E. Statistical mixture design approach for eco-efficient UHPC. Cem. Concr. Compos. 2015, 55, 17–25. [Google Scholar] [CrossRef]
- Wang, X.; Yu, R.; Song, Q.; Shui, Z.; Liu, Z.; Wu, S.; Hou, D. Optimized design of ultra-high performance concrete (UHPC) with a high wet packing density. Cem. Concr. Res. 2019, 126, 105921. [Google Scholar] [CrossRef]
- Park, S.; Wu, S.; Liu, Z.; Pyo, S. The Role of Supplementary Cementitious Materials (SCMs) in Ultra High Performance Concrete (UHPC): A Review. Materials 2021, 14, 1472. [Google Scholar] [CrossRef] [PubMed]
- Soliman, N.A.; Tagnit-Hamou, A. Partial substitution of silica fume with fine glass powder in UHPC: Filling the micro gap. Constr. Build. Mater. 2017, 139, 374–383. [Google Scholar] [CrossRef]
- Sun, C.; Wang, K.; Liu, Q.; Wang, P.; Pan, F. Machine-Learning-Based Comprehensive Properties Prediction and Mixture Design Optimization of Ultra-High-Performance Concrete. Sustainability 2023, 15, 15338. [Google Scholar] [CrossRef]
- Zhou, X.; Shi, Y.; Hu, Q.; Zhang, S.; Zhang, X.; Meng, L. Discrete Element Simulation of the Relationship between Composition, ITZ Property, and Tensile Behavior of Eco-Friendly UHPC Matrix. Materials 2023, 16, 3844. [Google Scholar] [CrossRef] [PubMed]
- GB/T 50080-2016; Standard for Test Method of Performance on Ordinary Fresh Concrete. Ministry of Housing and Urban-Rural Development of the People’s Republic of China: Beijing, China, 2016. (In Chinese)
- GB/T 50081-2019; Standard for Test Methods of Concrete Physical and Mechanical Properties. Ministry of Housing and Urban Rural Development of the People’s Republic of China: Beijing, China, 2019. (In Chinese)
- GB/T 50082-2009; Standard for Test Methods of Long-Term Performance and Durability of Ordinary Concrete. Ministry of Housing and Urban-Rural Development of the People’s Republic of China: Beijing, China, 2009. (In Chinese)
- GB/T 31387-2015; Reactive Powder Concrete. Ministry of Housing and Urban-Rural Development of the People’s Republic of China: Beijing, China, 2015. (In Chinese)
- Li, T.; Sun, X.; Shi, F.; Zhu, Z.; Wang, D.; Tian, H.; Hou, B. The Mechanism of Anticorrosion Performance and Mechanical Property Differences between Seawater Sea-Sand and Freshwater River-Sand Ultra-High-Performance Polymer Cement Mortar (UHPC). Polymers 2022, 14, 3105. [Google Scholar] [CrossRef] [PubMed]
- Yin, T.; Yu, R.; Liu, K.; Wang, Z.; Fan, D.; Wang, S.; Shui, Z. Precise mix-design of Ultra-High Performance Concrete (UHPC) based on physicochemical packing method: From the perspective of cement hydration. Constr. Build. Mater. 2022, 352, 128944. [Google Scholar] [CrossRef]
- Shao, J.; Zhu, H.; Xue, G.; Yu, Y.; Mirgan Borito, S.; Jiang, W. Mechanical and restrained shrinkage behaviors of cement mortar incorporating waste tire rubber particles and expansive agent. Constr. Build. Mater. 2021, 296, 123742. [Google Scholar] [CrossRef]
- Şahmaran, M.; Li, V.C. Durability properties of micro-cracked ECC containing high volumes fly ash. Cem. Concr. Res. 2009, 39, 1033–1043. [Google Scholar] [CrossRef]
- Xu, S.; Zheng, M.; Yuan, P.; Wu, P.; Shao, R.; Liu, Z.; Wu, C. Experimental study of mechanical properties of G-UHPC against sodium sulfate attack at elevated temperature. Constr. Build. Mater. 2023, 396, 132387. [Google Scholar] [CrossRef]


| Material | Chemical Composition (%) | ||||||||
|---|---|---|---|---|---|---|---|---|---|
| SiO2 | Fe2O3 | Al2O3 | CaO | MgO | K2O | Na2O | SO3 | Other | |
| Cement | 20.30 | 4.12 | 4.91 | 64.8 | 1.05 | 0.51 | 0.16 | 1.75 | 2.4 |
| SF | 95.00 | 0.13 | 0.37 | 0.49 | 0.31 | 0.47 | 0.09 | 0.91 | 2.23 |
| QP | 99.13 | 0.21 | 0.19 | 0.13 | 0.08 | 0.21 | 0.01 | — | 0.04 |
| Material | Specific Density (g/cm−3) | Specific Surface Area (m2/g) | D10 (µm) | D50 (µm) | D90 (µm) |
|---|---|---|---|---|---|
| Cement | 3.20 | 1.070 | 3.67 | 15.92 | 44.88 |
| SF | 2.71 | 0.128 | 23.21 | 92.40 | 284.40 |
| QP | 2.66 | 1.230 | 1.69 | 15.65 | 54.71 |
| QS | 2.55 | 0.009 | 461.37 | 628.74 | 858.88 |
| Lengths (mm) | Diameter (mm) | Aspect Ratio (mm) | Tensile Strength (MPa) | Modulus of Elasticity (GPa) | Density (g/cm3) |
|---|---|---|---|---|---|
| 16 | 0.2 | 80 | 2870 | 230 | 7.8 |
| Material | Volume Fraction (%) | Mass Fraction (%) |
|---|---|---|
| Cement | 30.5 | 35.0 |
| SF | 9.0 | 9.0 |
| QP | 20.0 | 20.0 |
| QZ | 40.5 | 36.0 |
| W/B | kg/m3 | Slump Flow (mm) | |||||
|---|---|---|---|---|---|---|---|
| Cement | SF | QP | QS | Water | Water Reducer | ||
| 0.18 | 716 | 187 | 416 | 743 | 237 | 13 | 196 |
| 0.19 | 716 | 187 | 416 | 743 | 251 | 13 | 217 |
| 0.20 | 716 | 187 | 416 | 743 | 264 | 13 | 227 |
| 0.21 | 716 | 187 | 416 | 743 | 277 | 13 | 235 |
| 0.22 | 716 | 187 | 416 | 743 | 290 | 13 | 227 |
| Sample ID | kg/m3 | Fiber Content (Vol. %) | |||||
|---|---|---|---|---|---|---|---|
| Cement | SF | QP | QS | Water | Water Reducer | ||
| U1 | 716 | 187 | 416 | 743 | 264 | 13 | 0 |
| U2 | 716 | 187 | 416 | 743 | 264 | 13 | 0 |
| U3 | 716 | 187 | 416 | 743 | 264 | 13 | 2 |
Disclaimer/Publisher’s Note: The statements, opinions and data contained in all publications are solely those of the individual author(s) and contributor(s) and not of MDPI and/or the editor(s). MDPI and/or the editor(s) disclaim responsibility for any injury to people or property resulting from any ideas, methods, instructions or products referred to in the content. |
© 2024 by the authors. Licensee MDPI, Basel, Switzerland. This article is an open access article distributed under the terms and conditions of the Creative Commons Attribution (CC BY) license (https://creativecommons.org/licenses/by/4.0/).
Share and Cite
Wang, G.; Chen, W.; Shen, X.; Ren, X.; Niu, J.; Pan, S.; Huang, Y.; Wu, J. Enhancing Sulfate Erosion Resistance in Ultra-High-Performance Concrete through Mix Design Optimization Using the Modified Andreasen and Andersen Method. Coatings 2024, 14, 274. https://doi.org/10.3390/coatings14030274
Wang G, Chen W, Shen X, Ren X, Niu J, Pan S, Huang Y, Wu J. Enhancing Sulfate Erosion Resistance in Ultra-High-Performance Concrete through Mix Design Optimization Using the Modified Andreasen and Andersen Method. Coatings. 2024; 14(3):274. https://doi.org/10.3390/coatings14030274
Chicago/Turabian StyleWang, Guan, Wenlin Chen, Xiangyu Shen, Xin Ren, Jiawei Niu, Sihang Pan, Yifan Huang, and Jinliang Wu. 2024. "Enhancing Sulfate Erosion Resistance in Ultra-High-Performance Concrete through Mix Design Optimization Using the Modified Andreasen and Andersen Method" Coatings 14, no. 3: 274. https://doi.org/10.3390/coatings14030274
APA StyleWang, G., Chen, W., Shen, X., Ren, X., Niu, J., Pan, S., Huang, Y., & Wu, J. (2024). Enhancing Sulfate Erosion Resistance in Ultra-High-Performance Concrete through Mix Design Optimization Using the Modified Andreasen and Andersen Method. Coatings, 14(3), 274. https://doi.org/10.3390/coatings14030274