Article

Effect of Anodic Oxidation Pulse Voltage on Antibacterial Properties and Biocompatibility of Ti-Ag Alloy

1
Heilongjiang Provincial Key Laboratory of Oral Biomedical Materials and Clinical Applications, Jiamusi University, Jiamusi 154007, China
2
School of Materials Science and Engineering, Northeastern University, Shenyang 110819, China
3
Zhejiang Wanfeng Technology Development Co., Ltd., Shaoxing 312499, China
4
College of Pharmacy, Jiamusi University, Jiamusi 154007, China
*
Authors to whom correspondence should be addressed.
Coatings 2024, 14(4), 405; https://doi.org/10.3390/coatings14040405
Submission received: 14 March 2024 / Revised: 27 March 2024 / Accepted: 27 March 2024 / Published: 29 March 2024
(This article belongs to the Special Issue Ceramic and Metallic Biomaterials. Application in Medical Sciences)

Abstract

:
For the application of titanium and titanium alloys in orthopedic implant materials, the antibacterial properties and cell biocompatibility determine whether the implant surgery is successful. In this study, a functional anodic oxidation (AO) coating was successfully prepared to modify the surface of Ti-Ag alloy. The surface characteristics of the anodized Ti-Ag alloy were analyzed using techniques such as X-ray diffraction (XRD), scanning electron microscopy (SEM), X-ray photoelectron spectroscopy (XPS), and contact angle measurements. The corrosion characteristics of Ti-Ag samples were tested by an electrochemical workstation. In addition, the antibacterial properties and cell activity were studied by the plate count method and MC3T3-E1 cell staining. The results indicate that the AO process can generate a multi-functional TiO2/Ag2O coating with a large number of block and flower-like structures on the surface of a Ti-Ag alloy. When the AO voltage of the sample is 120 V, the maximum roughness is 0.73 μm and the minimum wetting degree is 23°, which improves the biocompatibility. The corrosion test results show that AO treatment can improve the corrosion resistance of a Ti-Ag alloy. The oxidation voltage is 20 V and the coating has the best corrosion resistance. The corrosion open circuit potential (Eocp) is 107.621 mV and the corrosion current density (icorr) is 2.241 × 10⁻⁸ A·cm−2. This coating can promote ion release and show more than 99% of a strong antibacterial ability against S. aureus. The results of the compatibility evaluation by cultured cells showed that the multifunctional coating formed by the anodic oxidation process did not cause cytotoxicity and promoted the adhesion of MC3T3-E1 cells.

1. Introduction

Titanium (Ti) and Ti alloys are commonly utilized in orthopedic implant materials due to their exceptional mechanical properties, favorable biocompatibility, low toxicity, and cost-effectiveness [1,2]. However, traditional Ti alloy implants do not have antibacterial properties and have infection problems during and after implantation. In addition, the inadequate disinfection of implants and surgical instruments and postoperative wound contamination can also aggravate infection [3]. The above factors can lead to implantation failure and even cause fatal damage to the human body, increasing medical costs and patient suffering.
The main reason for the failure of implantation surgery is that bacterial strains adhere to the surface of Ti and Ti alloy implants, proliferate, and form bacterial biofilms, which can lead to infection [4,5,6]. In addition, the long-term use of high-dose antibiotics by some patients can lead to bacterial mutations, strong drug resistance, and the formation of superbugs, exacerbating the infection process [7,8,9,10,11]. If the surface of the implant has excellent antibacterial properties, it will prevent bacteria from adhering to the surface of the implant, thereby preventing the formation and expansion of the biofilm [12,13]. Therefore, creating a stable and long-lasting antibacterial environment around the implant is of great significance for inhibiting bacterial attachment and biofilm formation [14].
To improve the antibacterial properties of Ti and Ti alloys, material scientists have tried to change the antibacterial properties of the surface and the antibacterial properties of the material itself to prevent bacterial adhesion and inhibit the formation of biofilms. At present, the antibacterial and antiviral properties of organic and inorganic antibacterial agents have been widely recognized [15]. Among them, organic antibacterial agents mainly include antibacterial proteins, polysaccharides, and antibacterial peptides, which inactivate bacteria by inhibiting bacterial adhesion and destroying extracellular structures [16]. However, organic antibacterial agents have the disadvantages of a short duration and poor stability [17]. Inorganic antibacterial agents are mainly metal element antibacterial agents, such as Ag, Cu, Zn, etc., [18]. They can kill bacteria by binding to bacterial proteins and changing the state of bacterial membranes [19,20]. They have a wide antibacterial spectrum, high antibacterial efficiency, and good safety [21]. Therefore, considering the complexity of the human implantation environment and the safety of antibacterial agents, the development of Ti alloys containing inorganic antibacterial agents is considered a suitable method for Ti alloys to achieve antibacterial properties and inhibit biofilm formation [22].
The methods of developing Ti alloys composite inorganic antibacterial implants mainly include the surface modification technology and the manufacture of antibacterial Ti alloys [23]. Surface modification is mainly to prepare coatings doped with inorganic antibacterial agents on the surface of Ti alloys by electrophoretic deposition (EPD), anodic oxidation (AO), micro-arc oxidation (MAO), and other technologies to enhance the antibacterial properties and biocompatibility [24]. M. H et al. [25] deposited a Cu-containing hydroxyapatite (HAp) coating on the TC4 alloy by the EPD process. But, the coating has a poor inhibitory effect on Staphylococcus aureus (S. aureus). Hou et al. [26] prepared Ag-doped TiO2 nanotubes by the anodic oxidation method and the implanted samples had good antibacterial properties. K. M et al. [27] deposited nano-silver on the anodic oxidation surface of pure Ti for modification and observed that the osteoblast adhesion and proliferation were enhanced by the coating, showing higher biocompatibility. However, the antibacterial coating prepared by surface modification technology has defects such as coating shedding and dissolution, and it will be difficult for it to maintain continuous antibacterial properties and biological activity [28].
Due to their excellent mechanical processing properties and long-lasting antibacterial properties, antibacterial metal materials have been used as antibacterial alloy materials in many studies [23]. Antibacterial alloy materials are usually made by adding inorganic antibacterial agents containing metallic elements and through processes such as powder metallurgy, vacuum sintering, and arc melting [29,30]. Zhang et al. [31] utilized arc melting technology to fabricate titanium alloys with varying copper contents. The antibacterial efficacy of the as-cast titanium–copper alloys against S. aureus was found to be 37%. In a separate study, Chen et al. [23] employed powder metallurgy technology to prepare a Ti-Ag alloy. The results indicated that alloys with a 5 wt% Ag content exhibited an antibacterial rate ranging from 60% to 80% against S. aureus. The observed antibacterial activity was highly dependent on the Ag content, as well as the presence and distribution of the Ti2Ag phase. It has been proved that Ti alloys containing inorganic antibacterial agents have certain antibacterial properties. However, the antibacterial properties of antibacterial metal materials still need to be further improved [32]. In addition, a Ti alloy is a bio-inert material that requires high biocompatibility and corrosion resistance when implanted into the human body [33].
Generally, surface modification techniques are used to improve antibacterial properties and biocompatibility. Hu et al. [34] utilized ultrasonic-MAO technology to create a coating on the Ti-3Cu alloy, exhibiting robust long-term antibacterial properties and promoting early cell adhesion. Schwartz et al. [35] prepared TiO2 and HAp bioactive coatings by plasma electrolytic oxidation in aqueous electrolytes and molten salts, and cleaned the coatings with autoclave (A), ultraviolet light (UV), radio frequency (RF), air plasma (P), and UV-ozone cleaner (O), providing an effective and mild surface modification treatment method for cleaning and disinfecting organic pollutants on the surface of bioactive coatings. Through the research of Liu et al. [10], a multifunctional TiO2/Cu2O coating was prepared on the Ti-5Cu alloy by the AO process. The coating improvement significantly enhances the antibacterial properties of the alloy, has no cytotoxicity, and is beneficial to accelerate cell adhesion. Cao et al. [8], by anodizing Ti-5Cu, found that the double-layer-structure oxide coating formed on the Ti-5Cu improves the corrosion resistance by ten times, and the antibacterial rate is improved. In addition, studies have shown that anatase TiO2 formed on the Ti alloys by AO treatment is consistent with HAp, showing higher bone conductivity [36]. To date, the majority of prior investigations have consistently demonstrated that surface modification techniques applied to antibacterial Ti alloys can concurrently improve both the antibacterial properties and biocompatibility of the alloys. This dual enhancement holds significant promise for the broader utilization of antibacterial Ti alloys.
For many antibacterial metal ions, the antibacterial and antiviral properties of Ag have been widely considered to be one of the best and most effective antibacterial agents [13]. Silver interacts with sulfhydryl groups in enzymes and proteins to form reactive oxygen species and destroys the regulatory system of reactive oxygen species in bacteria, resulting in high oxidative stress in bacteria and the inactivation of strains. Ti alloys containing a metal Ag antibacterial agent will provide antibacterial properties for its implants. However, the antimicrobial properties and bioactivities of the antimicrobial Ti-Ag alloy have been rarely reported.
In this paper, the anodic oxidation technology was innovatively applied to a Ti-Ag antibacterial titanium alloy. Scanning electron microscopy (SEM), X-ray photoelectron spectroscopy (XPS), X-ray diffraction (XRD), an electrochemical analysis workstation, ion release, contact angle, plate counting method, and cell culture were used to detect. The effects of an anodizing voltage on the corrosion resistance, antibacterial properties, and biocompatibility of the Ti-Ag alloy were studied. The results indicate that the anodic oxidation process can significantly enhance the antibacterial properties of the Ti-Ag alloy, TiO2/Ag2O’s, multi-functional coating, and the coating exhibits higher corrosion resistance. No cytotoxicity was found, and cell adhesion and proliferation were accelerated. In addition, the antibacterial mechanism of the film was also discussed. Therefore, anodic oxidation may be an effective surface modification method.

2. Materials and Methods

2.1. Preparation and AO Treatment of Ti-Ag Samples

Ti-5 wt% Ag (referred to as Ti-Ag) rods were synthesized using high-purity Ti (99.9 wt%) and Ag (99.9 wt%) in a high vacuum arc furnace. Additional information about the alloy is available in Ref. [37]. A sample measuring Φ15 mm × 2 mm was obtained from the bar using a wire-cutting machine. Ti-Ag samples were polished with 80, 400, 600, 1200, and 2000 particle sizes of SiC sandpaper (Yingpai, Foshan, Guangdong, China) in turn, and polished to the surface mirror state with polishing liquid. For the next step, the samples were cleaned and dried with ultrapure water and anhydrous ethanol. The sample was soaked in 120 g/L NaOH (Merck KGaA, Shanghai, China) solution for 10 min to remove the oil on the sample. Activation treatment was performed in a mixed solution with a volume ratio of HF (Merck KGaA, Shanghai, China): HNO3 (Kermel, Tianjin, China): H2O = 1:2:10 for 10 s. Finally, the samples were washed with high-purity water and dried.
The AO treatment was carried out in a solution of 0.1 mol/L H3PO4 (Kermel, Tianjin, China) for 5 min. Various voltage values, specifically 20 V, 40 V, 60 V, 80 V, and 120 V, were applied sequentially. The experimental procedure is illustrated in Figure 1. The sample names were AO-20 V, AO-40 V, AO-60 V, AO-80 V, and AO-120 V, and compared with the untreated sample (AO-0 V).

2.2. XRD and Microstructure Characterization

The phase composition on the surface of Ti-Ag alloy subjected to various AO voltages was analyzed using XRD (D8 Advance, Bruker AXS, Karlsruhe, Germany) with copper Kα radiation. MDI Jade 6.5 software’s database was employed for data interpretation and analysis. The scanning range was 30° < 2θ < 90° and step scanning mode was used. The surface morphology of Ti-Ag samples subjected to various AO voltages was examined using cold-field-emission scanning electron microscopy (SEM). Additionally, the elemental composition was analyzed through energy dispersive spectrometry (EDS). The coating thickness gauge (LS225+N1500, Linshang, Shenzhen, China) is used to measure the coating at five different positions, and the relationship between coating thickness and voltage is measured.

2.3. XPS Analysis

The elemental species and chemical states on the coating surface following anodic oxidation of the Ti-Ag samples were investigated using X-ray photoelectron spectroscopy (XPS, Axis Supra, Kratos, Stretford, UK). To eliminate surface impurities, the samples were pre-treated before the analysis. Full spectrum scans and high-resolution scans for Ti, Ag, and O were conducted. The binding energy of C 1s was calibrated at 284.6 eV using standard data, and peak fitting was carried out using XPS Peak 41 software.

2.4. Corrosion Resistance

The electrochemical properties of Ti-Ag samples with different AO voltages in 0.9% NaCl (Kermel, Tianjin, China) solution were tested by an electrochemical workstation (Versa STAT 300, AMETEK, CA, USA) at 37 ± 1 °C. The standard three-electrode apparatus was used. The reference electrode, counter electrode, and working electrode were saturated calomel electrode (SCE, INESA, Shanghai, China), platinum electrode (INESA, Shanghai, China), and sample to be tested, respectively. The open circuit potential measurement time was 3600 s. Electrochemical impedance spectroscopy (EIS) tests were performed at frequencies of 0.01–105 Hz. Then, the potentiodynamic polarization test was carried out within the range of −0.5~0.5 mV.

2.5. Surface Roughness and Water Wetting Angle

The surface morphology of the sample was examined using laser confocal microscopy (OLS4100, OLYMPUS, Tokyo, Japan), capturing both two-dimensional (2D) and three-dimensional (3D) images. Five different 100 μm × 100 μm regions were selected for measurement. Surface roughness (Ra) data for the samples were acquired using LEXT OLS4000 software. The contact angle measuring instrument (FCA2000A3E, Aifeisi, Shanghai, China) was employed to assess the hydrophilicity of the samples with different AO voltages. Using the hanging drop method, 1.5 μL of laboratory-grade deionized water was deposited on the sample surface, and measurements were taken at a minimum of three different positions, documented through photographs. Surface contact angles were calculated using software, and mean values along with standard deviations were determined for analysis.

2.6. Ion Release

The specimens labeled as AO-0 V, AO-20 V, AO-40 V, AO-60 V, AO-80 V, and AO-120 V were immersed in 5.5 mL of NaCl solution (surface area/volume ratio 2 cm2/mL) for 24 h at a constant temperature of 37 °C. The concentration of Ag+ in the solution was determined using inductively coupled plasma mass spectrometry (Optima 7300DV, Perkin Elmer, MA, USA).

2.7. Antibacterial Property

2.7.1. Plate Count Method

Staphylococcus aureus (S. aureus, ATCC 6538) is a commonly used bacterium for evaluating the antibacterial properties of implant materials. According to GB/T 31402-2015 [34], the antibacterial properties of the samples were determined by plate counting method. Before the experiment, all necessary samples and utensils underwent sterilization at 120 °C/0.15 MPa for 30 min. In each experimental group, three sets of parallel samples were selected for the experiment. According to the standard procedure, nutrient broth (NB, Chinese Medicine Reagents, Shanghai, China) and physiological agar (Xiya Reagent, Linyi, China) were used to culture bacteria, and cp-Ti was used as the control group. To ensure the sterile state of the samples, all samples were exposed to ultraviolet light for 1 h for sterilization. Subsequently, 100 μL of bacterial suspension with a concentration of 104 cfu/mL was uniformly coated on the sample to avoid the bacterial liquid overflowing the sample range during the dropping process. The samples were then placed in an incubator for 24 h. After incubation, 2 mL of normal saline and 100 μL of trypsin were added to each well and shaken for 5 min to ensure that all the bacteria fell into the solution. From each well, 100 μL of bacterial droplets were taken on the nutrient agar plate and evenly smeared using a triangular glass rod. Excess liquid was removed from the surface until no obvious liquid remained, followed by another 24 h incubation period. An automatic colony counter (Shineso V3, China) was employed to enumerate the viable bacteria following the guidelines of the Chinese national standard GB/T 4789.2-2010 [34]. The antibacterial rate was calculated using Equation (1):
AR = (Ncontrol − Nsample)/Ncontrol × 100%
where Ncontrol and Nsample represent the count of colonies on both the control and test samples. As per the Chinese national standard GB/T 4789.2-2010, an antibacterial rate (AR) of ≥90% suggests antibacterial properties, while an AR of ≥99% indicates strong antibacterial properties.

2.7.2. Live/Dead Staining

Following a 24 h incubation period on the sample surface, the bacteria were stained using the LIVE/DEAD® BacLightTM bacterial activity kit (Thermo Fisher, MA, USA) in accordance with the provided instructions. The dye was applied to the sample surface and allowed to incubate for 15 min at room temperature in the dark. Subsequently, the bacteria were washed twice with normal saline to eliminate the influence of excess dye. The stained bacteria were then examined using a fluorescence microscope (Olympus BX51, Olympus, Tokyo, Japan). Living bacteria emitted green fluorescence, while the fluorescent signal from dead bacteria appeared red.

2.8. Cell Compatibility In Vitro

2.8.1. Cell Viability and Cytotoxicity

In in vitro cytotoxicity evaluation experiment, MC3T3-E1 cells were used for evaluation according to ISO 10993-5 standard [10], and blank control and control groups (cp-Ti) were set up. All samples underwent sterilization at 121 °C/0.15 MPa. Following sterilization, the samples were placed in a 24-well plate and 500 μL of cell suspension with a concentration of 2 × 10⁴ cells/mL was added to each well. After that, the plates were incubated at 37 °C in a humid environment of 5% CO2 for 1 day, 3 days, and 5 days, respectively. At each designated time point, 200 μL of MTT solution (Pricella, Wuhan, China) was added to each well and incubated at 37 °C for 4 h. Afterward, the MTT solution was removed and 300 μL of DMSO solution (Pricella, Wuhan, China) was added, followed by transfer to a 96-well plate for measurement. The optical density (OD) values were measured using an enzyme-labeled instrument (iMark, Bio-Rad, CA, USA). The relative cell growth rate (RGR) was calculated according to Equation (2):
RGR = (ODsample − ODcontrol)/(ODnegative − ODcontrol) × 100%
where ODsample, ODcontrol, and ODnegative represent the optical density values of the test sample, the cp-Ti, and the blank control group (negative sample), respectively. Cytotoxicity was deemed non-existent when the RGR was equal to or exceeded 75%.

2.8.2. Cell Adhesion and Morphology

As described in Section 2.8.1, MC3T3-E1 cells were seeded onto the surface of the test samples and incubated for 1, 4, and 24 h, followed by PBS (SCIENTIFIC, Shanghai, China) washing. To fix the cells and permeabilize the cell membrane, a 4% paraformaldehyde (PFA, SCIENTIFIC, Shanghai, China) solution and a 0.5% Triton X-100 solution (SCIENTIFIC, Shanghai, China) were applied to the samples at 37 °C. After another round of PBS washing, the samples were treated with the fluorescently labeled cyclic peptide. Subsequently, the cells were incubated in the dark for 30 min. Following this, DAPI (4,6-diamino-2-phenylindole, G-CLONE, Beijing, China) treatment was applied for 2 min. Lastly, the cell samples underwent blocking with an anti-fluorescence attenuation blocker. For additional information, please refer to other available sources [8]. The samples were placed under a fluorescence microscope to observe and record cell morphology.

2.9. Statistical Analysis

The biological outcomes were replicated three times, and the results are presented as the mean ± standard deviation. Representative results underwent quantitative statistical analysis to determine statistical significance, with p < 0.05 considered as statistically significant.

3. Results

3.1. Surface Morphology

Figure 2 presents the appearance of anodized Ti-Ag samples with different AO voltages. After AO treatment, the surface coating is uniform. When the AO voltage is 20 V, the color of the coating is dark blue. Upon increasing the voltage to 40 V, the color of the coating is khaki. As the voltage continues to rise, the color of the AO-60 V becomes magenta. When the voltage increases to 80 V, the color of the coating is dark cyan. Finally, upon increasing the voltage to 120 V, the color of the coating is light purple. The anodization voltage exerts a notable influence on the coloration of the resulting anodic oxide film.

3.2. Phase Identification

Figure 3 presents the phase patterns of anodized Ti-Ag samples with different AO voltages. According to Figure 3, AO-0 V represents the Ti-Ag sample without AO treatment, which is mainly composed of α-Ti and Ti2Ag phases. The diffraction peak of the Ti2Ag phase overlaps with that of α-Ti [23]. The phase composition of samples treated by AO with different voltages was semi-quantitatively analyzed using the Rietveld Refinement method; the results are shown in Table 1. Ti and Ag oxides were not detected on the AO-treated samples and the oxide film was thin.

3.3. Microstructure and EDS
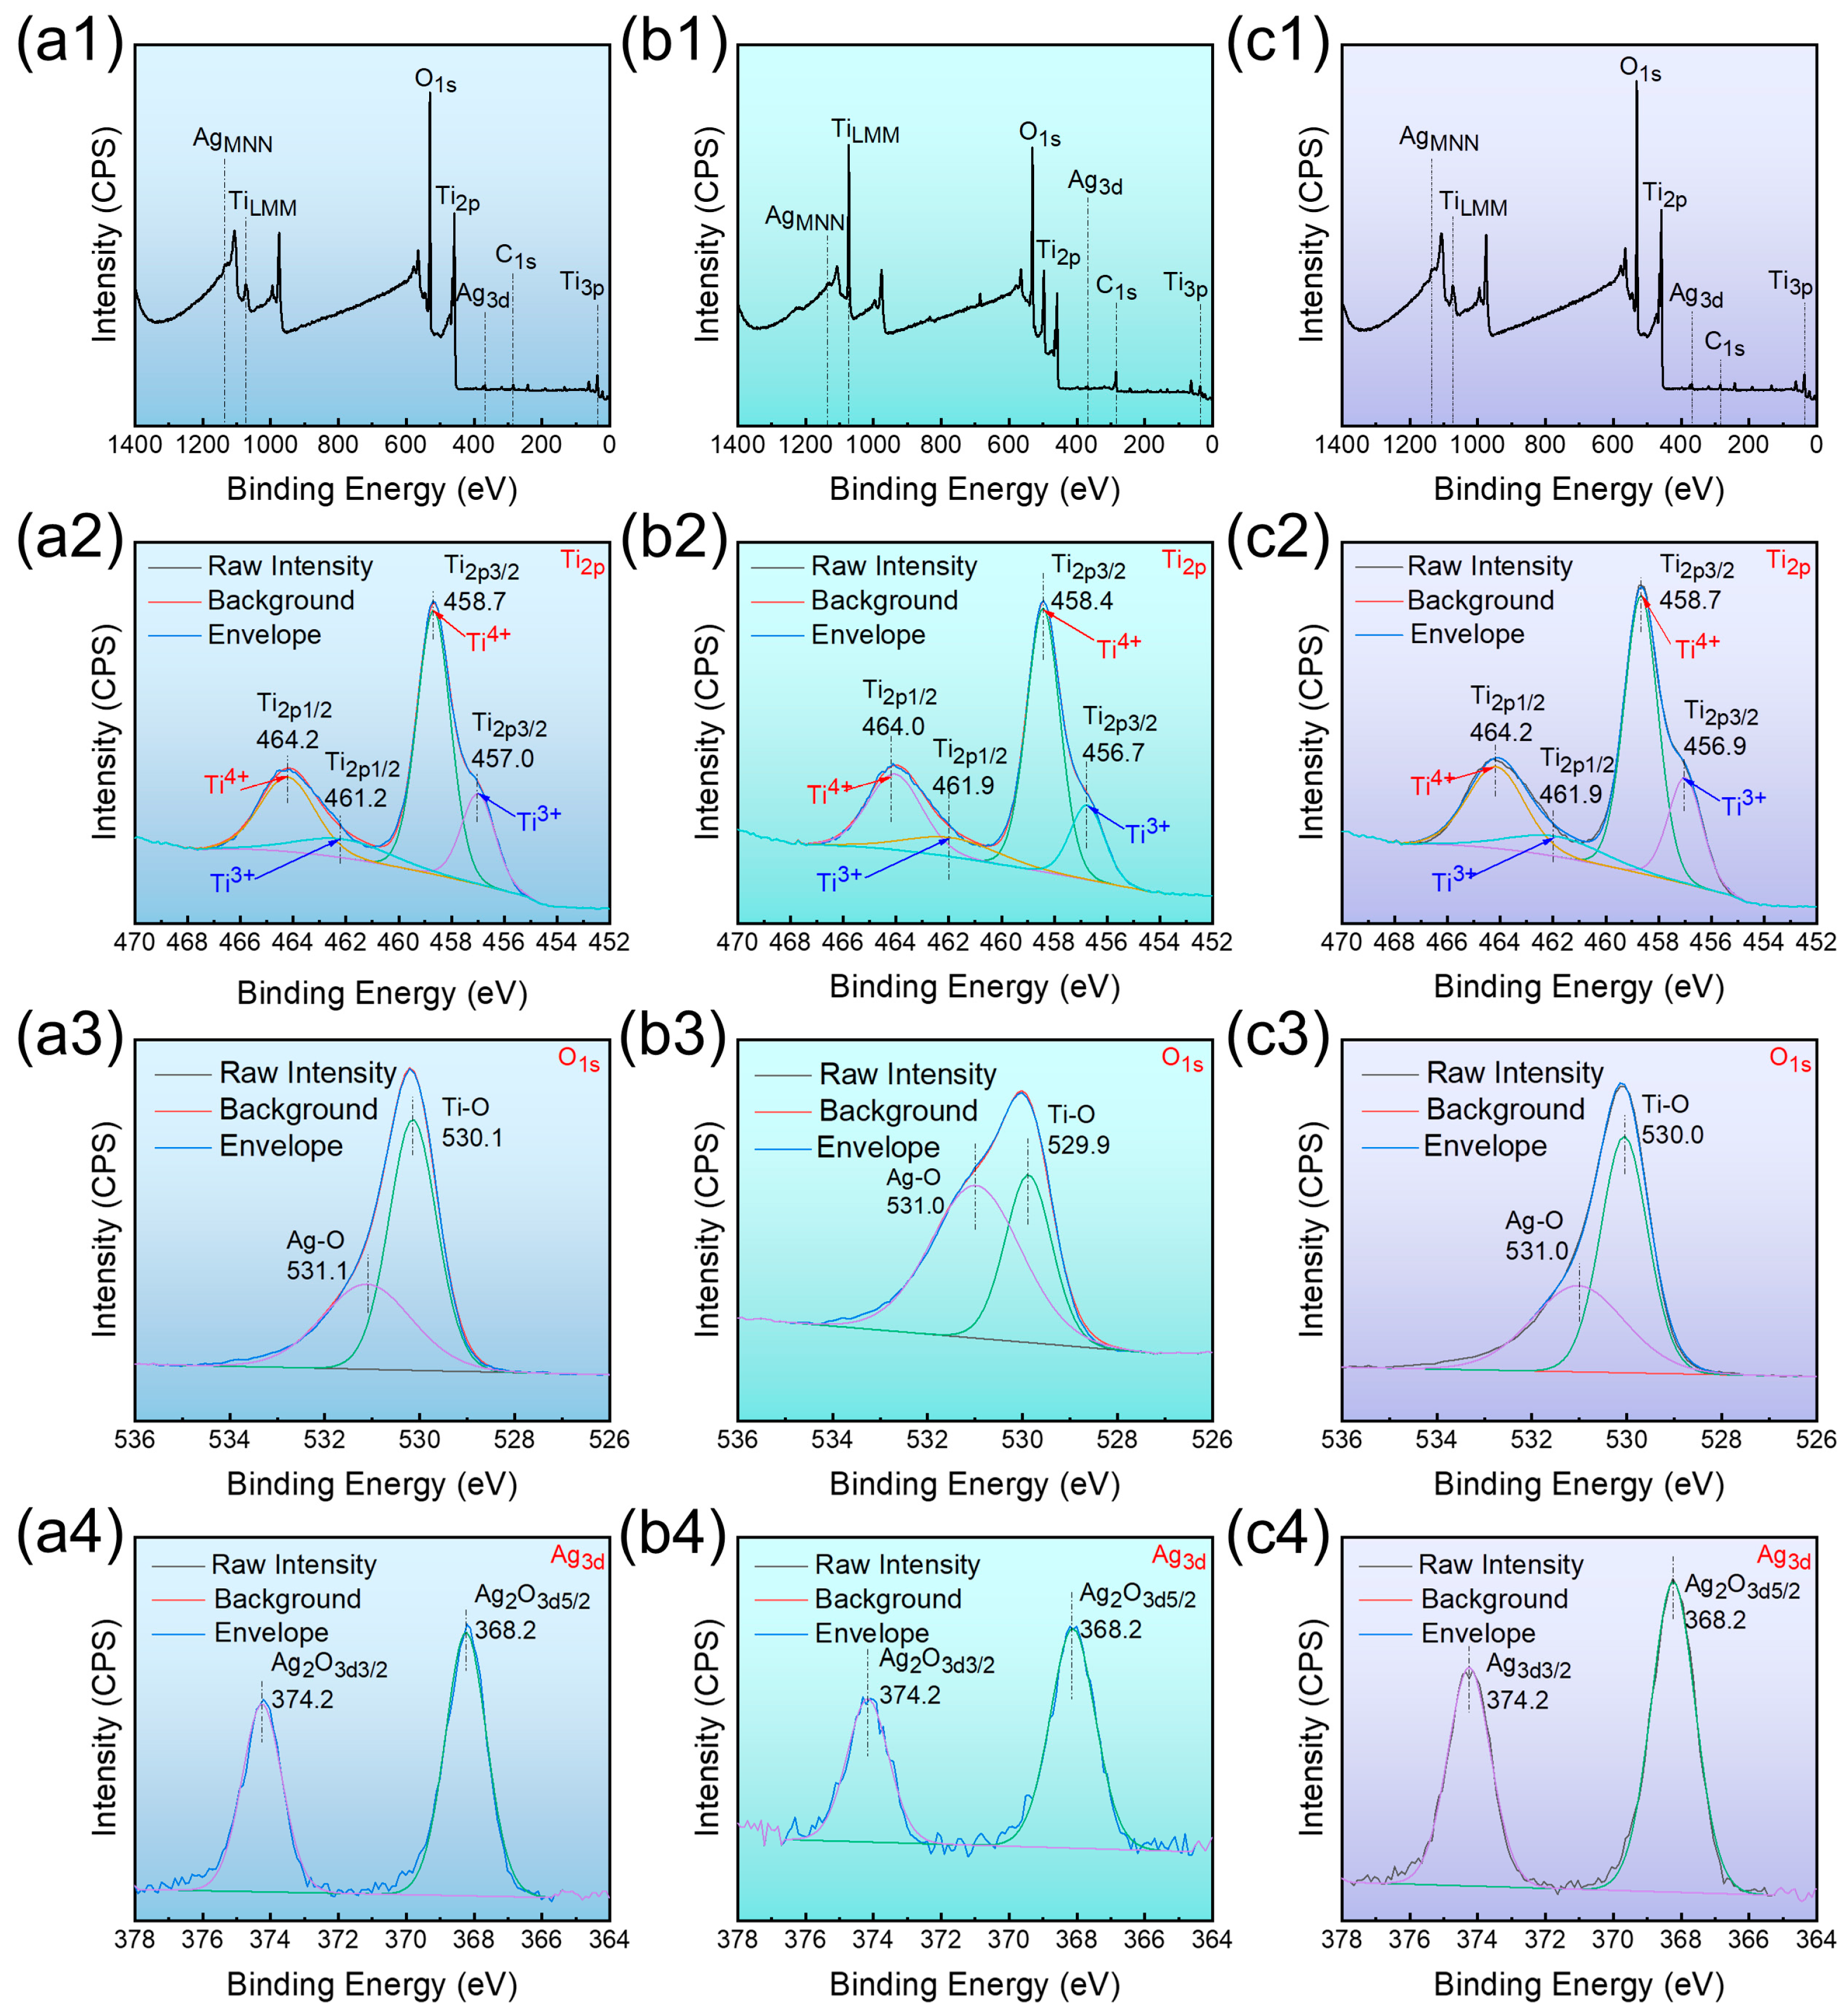
Figure 4 presents the microstructure of Ti-Ag samples with different AO voltages. In Figure 4a, the coating surface is uniform when the oxidation voltage is 20 V. As the voltage increases, when the voltage reaches 40 V, as shown in Figure 4b, the surface is smoother and denser. As shown in Figure 4c, a large number of white block structures appear on the surface of AO-60 V. After local amplification, the block structure is aggregated, the shape is regular, and the size is <1 μm. Upon continuously increasing the voltage to 80 V, as shown in Figure 4d, the block structure is partially converted into a flower-like structure with a small amount of a petal structure. With the further increase in the voltage to 120 V, as shown in Figure 4e, there are many grooves on the surface, and the bulk structure is completely transformed into a flower-like structure with a size ranging from approximately 1~2 μm. Figure 4f shows the coating thickness of AO-treated samples with different voltages. With the increase in the AO treatment voltage, the oxide film on the surface of the sample becomes thicker. The thickness reaches the maximum at 120 V and the size is about 2.7 μm.
Table 2 shows the EDS analysis results of Ti-Ag samples with different AO voltages. The EDS analysis results of point A–I in Figure 4, revealing the presence of Ti and O elements, and the content of Ag is low. With the increase in the voltage, the content of the Ti element in the coating decreases from the highest value of 79.0% of AO-20 V to 52.4% of AO-120 V. However, the content of the O element in the coating increased with the increase in the oxidation voltage, up to 45.0%. The bulk structure and flower-like structure in the coating were analyzed by EDS. The bulk structure shown in F point in Figure 4c was compared with the matrix E point. The content of the Ag element in the bulk structure reached 7.9% and the enrichment of the Ag element appeared. However, when the anodizing voltage increased to 120 V, the flower-like structure shown at the J point in Figure 4e was tested by EDS, and the content of the Ag element was only 2.6%. The research shows that excessive voltage will cause the burning of Ag elements and the content of Ag in the coating will decrease.

3.4. XPS

Figure 5 depicts the XPS full spectrum of Ti-Ag samples along with the high-resolution spectra of Ti, O, and Ag under the AO-20 V, AO-60 V, and AO-120 V processes. In the comprehensive spectrum (Figure 5(a1–c3)), the presence of Ti, Ag, and O elements was identified in the anodic oxidation coating of Ti-Ag samples, aligning with the EDS element detection results detailed in Table 2. In the high-resolution spectrum of the Ti element, as shown in Figure 5(a2–c2), the peaks of Ti 2p1/2 are detected at 464.0 eV and 464.2 eV, and the peaks of Ti 2p3/2 are detected at 458.4 eV and 458.7 eV, corresponding to the Ti-O bond in TiO2 [38]. Simultaneously, the peak energy of Ti 2p1/2 is about 5.9 eV higher than that of Ti 2p3/2, indicating that the element Ti mainly exists in the oxidation coating in the form of TiO2 crystal. The binding energies of Ti 2p1/2 at 461.2 eV and 461.9 eV and Ti 2p3/2 at 457.0 eV, 456.7 eV, and 456.9 eV correspond to the Ti-O bond in Ti2O3. It can be seen from the diffraction intensity that Ti mainly exists in TiO2 and a small amount of Ti2O3 oxide colloid exists [8,23].
In the high-resolution O 1s spectrum presented in Figure 5(a3–c3), it becomes evident that the bonding of Ti, Ag, and O elements within the coating is further confirmed. The O 1s spectrum is composed of Ti-O bonds with peaks of 530.1 eV, 529.9 eV, and 530.0 eV and Ag–O bonds with peaks of 531.1 eV and 531.0 eV. In Figure 5(a4–c4), the high-resolution spectra of Ag 3d are presented. The peaks corresponding to Ag 3d3/2 and Ag 3d5/2 are observed at 374.2 eV and 368.2 eV, respectively, indicating the existence of an Ag+ oxidation state. With the increase in the oxidation voltage, no significant variation is observed in the spectrum. Based on the above analysis, the coating is mainly composed of TiO2 and Ag2O.

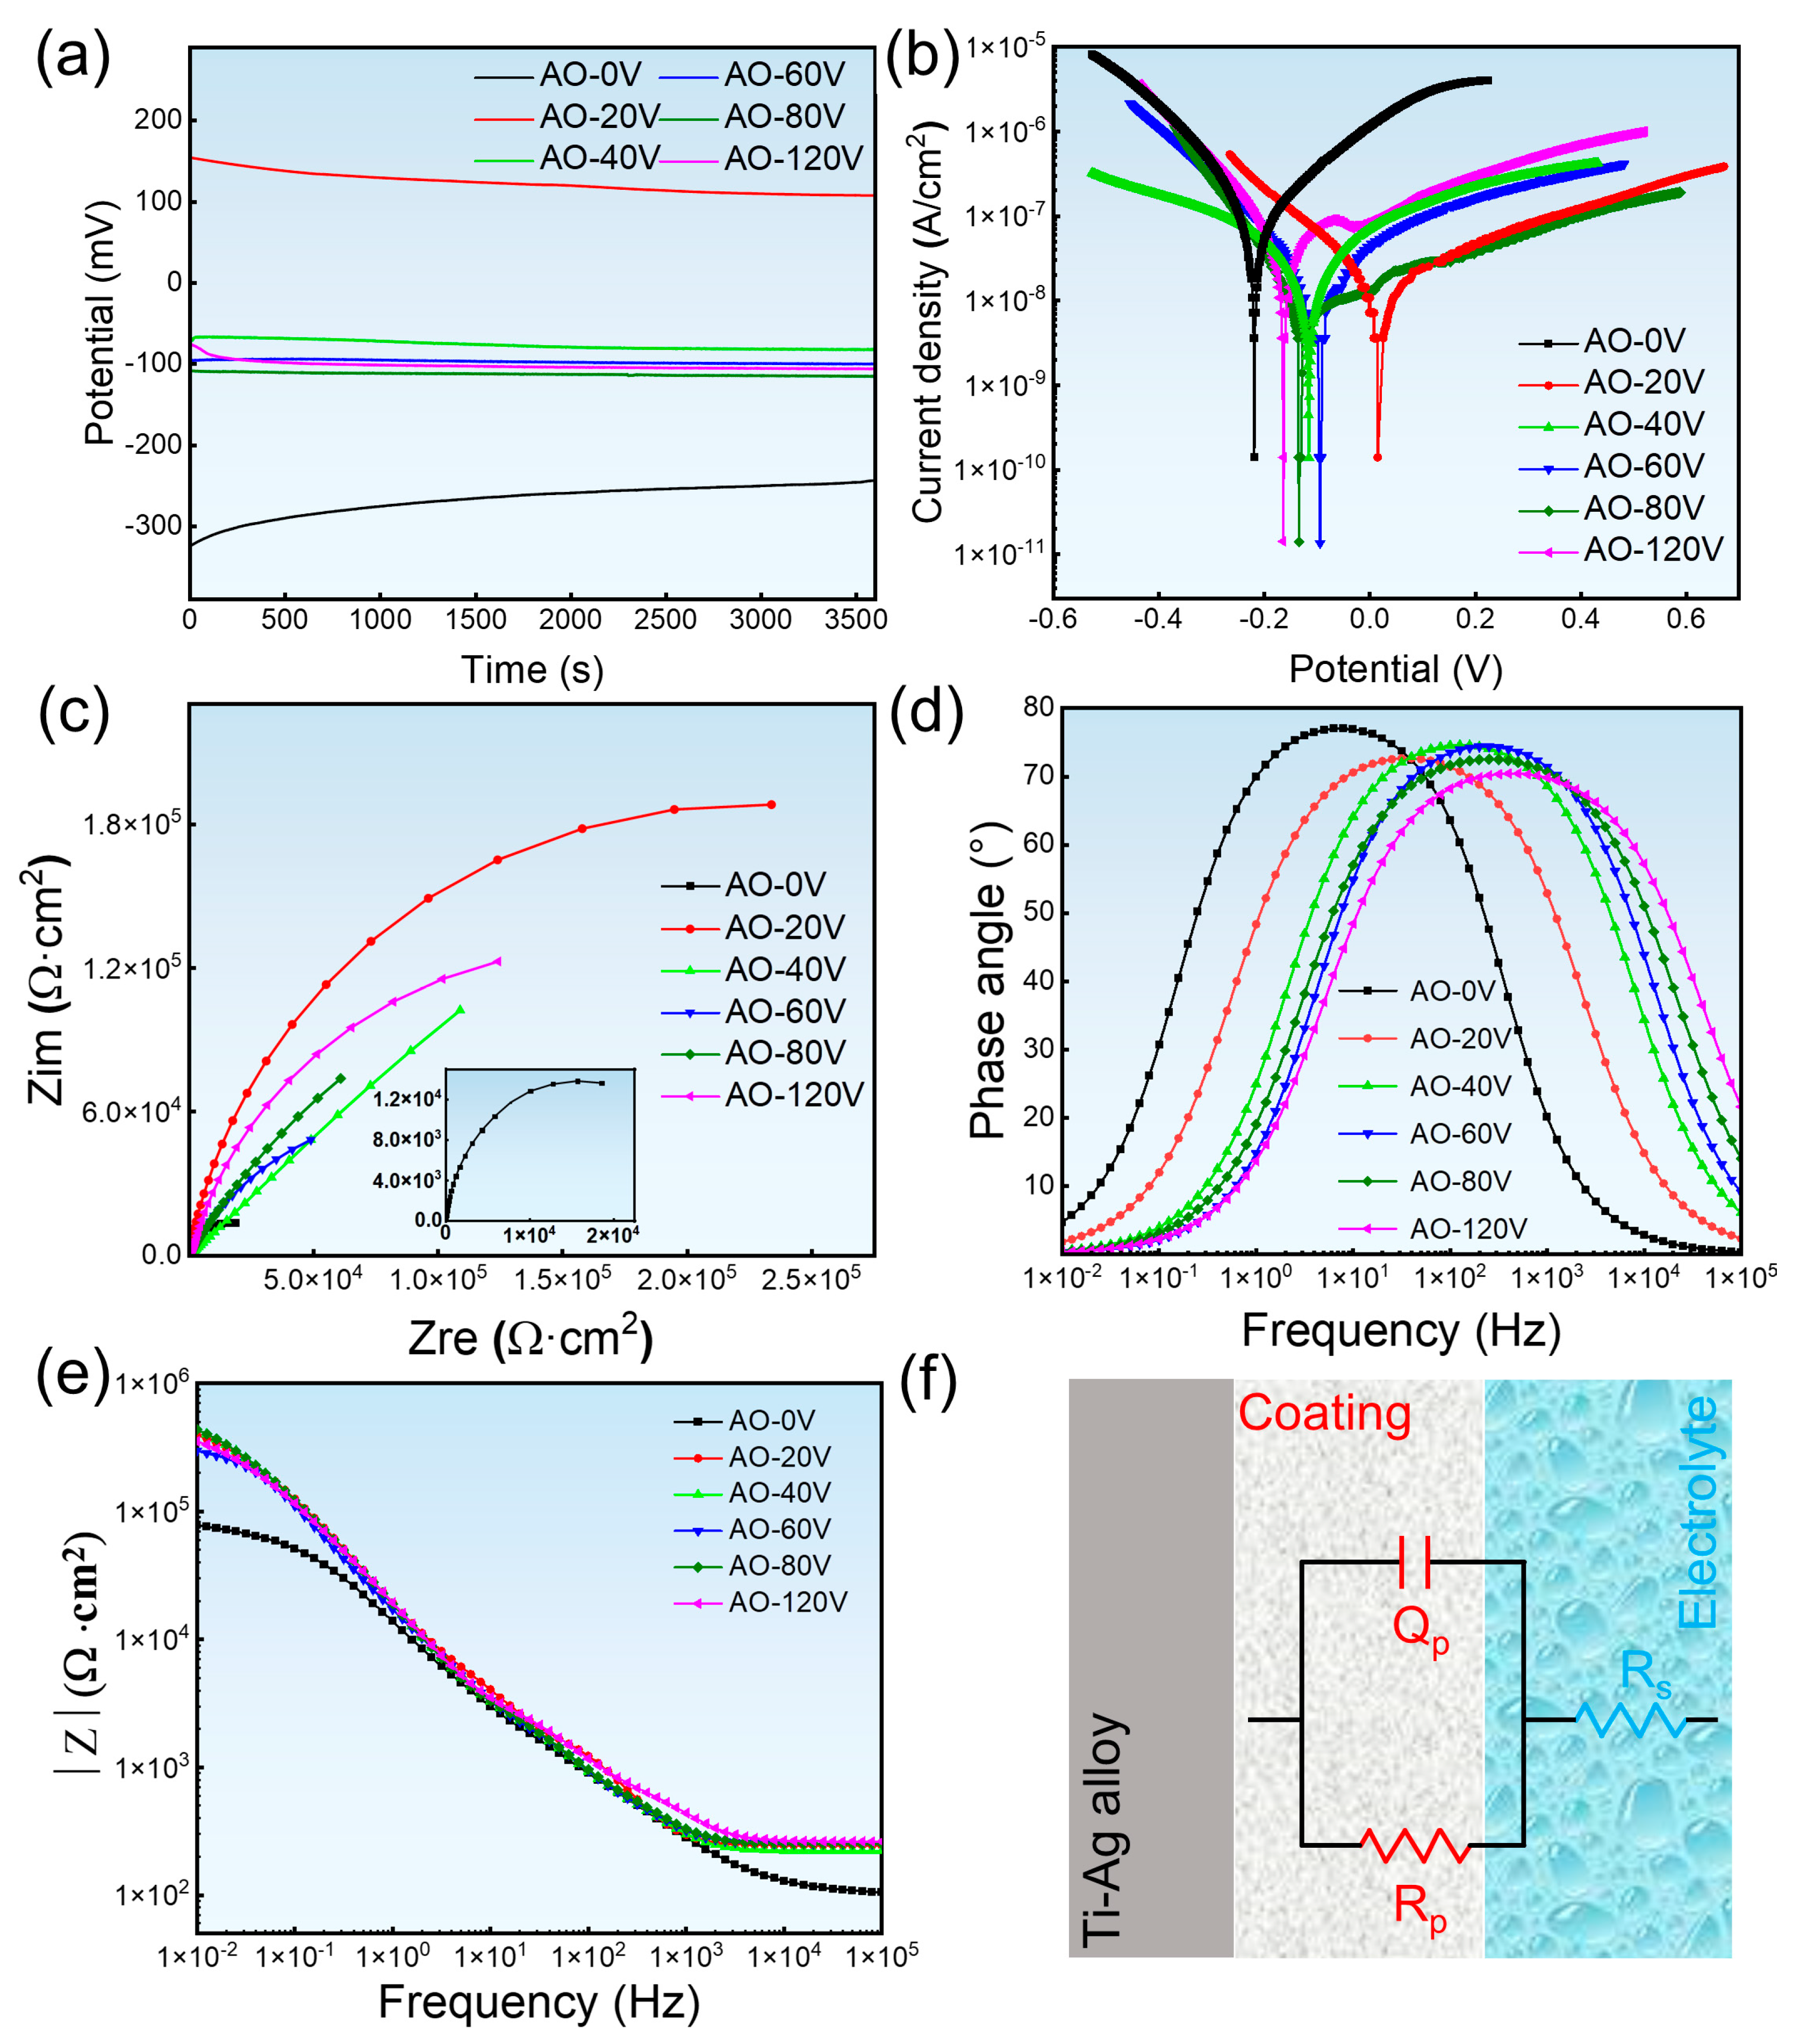
3.5. Corrosion Resisting Property

Figure 6 shows the corrosion-resisting property of the Ti-Ag samples with different AO voltages, where Figure 6a–e is the electrochemical analysis and Figure 6f is the equivalent circuit diagram. From the corrosion open circuit potential (Eocp) curve shown in Figure 6a, the potential of the Ti-Ag alloy after AO treatment is significantly higher than AO-0 V. It can be seen from the Eocp data in Table 3 that when the oxidation voltage is 20 V, Eocp reaches a maximum of 107.621 mV. Compared with AO-0 V, Eocp increases by 351.759 mV. The test results show that AO treatment reduces the corrosion failure tendency of the Ti-Ag alloy, and the oxide film formed on the surface has high thermodynamic stability. Hence, at an oxidation voltage of 20 V, the Ti-Ag sample exhibits the least susceptibility to corrosion. The corrosion tendencies of the Ti-Ag alloy can be deduced from the Tafel curve in Figure 6b, wherein the Tafel curve shifts towards positive potential and a lower corrosion current density. The Tafel curve was fitted and calculated and the self-corrosion potential (Ecorr) and self-corrosion current density (icorr) of the sample were obtained. The polarization resistance (Rp0) of the sample is calculated by the Stern–Geary Equation. The calculation formula is shown in Equation (3):
Rp0 = βaβc/(2.303(βa + βc)) icorr
Among them, Rp0, βa, βc, and icorr are polarization resistance, anode slope, cathode slope, and corrosion current density, respectively. The test results are shown in Table 3. Through AO treatment, the Ecorr of the Ti-Ag samples was greater than −220.091 mV of AO-0 V. Among them, the Ecorr reaches a maximum of 17.035 mV at a voltage of 20 V. It can be seen from the icorr data in Table 3 that compared with 21.477 × 10⁻⁸ A/cm2 of AO-0 V, the Ti-Ag samples treated by AO showed a lower corrosion current density. When the oxidation voltage is 20 V, the icorr of the Ti-Ag sample is the smallest, which is 2.241 × 10⁻⁸ A/cm2. The data indicate that AO treatment can significantly increase the polarization resistance of the sample. At the same time, the AO treatment markedly lowers the corrosion current density or raises the corrosion potential, thereby enhancing the corrosion resistance of the Ti-Ag samples. However, when the anodizing voltage reaches a maximum of 120 V, the icorr of the sample increases, which may be related to the surface state of the sample and the size of the surface petal-like structure.
Figure 6c presents the Nyquist curves for Ti-Ag samples at varying AO voltages. The AO-treated sample has a larger capacitive arc radius than the AO-0 V sample. The polarization resistance of the passivation film can be inferred from the diameter of the semicircle, indicating that the AO-treated coating has a higher anti-polarization ability at the interface. Figure 6d,e shows the Bode curves of Ti-Ag samples, including the relationship between frequency and phase (Figure 6d) and the relationship between frequency and impedance amplitude (|Z|) (Figure 6e). In Figure 6d, the frequency corresponding to the maximum phase angle is only one, which means that there is only one obvious time constant in the electrochemical process. As the oxidation voltage of AO treatment increases, the frequency corresponding to the maximum phase angle moves to the high-frequency region, indicating that the charge transfer reaction in the electrochemical process becomes faster. In the intermediate frequency region (0.1~100 Hz) of Figure 6e, only a linear slope of about −1 is observed, which is a typical EIS monolayer structure. Therefore, a simple equivalent circuit RS(QPRP) is used to fit the model of the passivation film. In this representation, RS denotes the solution resistance, QP signifies the capacitance, and RP represents the resistance of the passivation film. Table 4 presents the electrochemical parameters computed using the equivalent circuit.

3.6. Surface Roughness and Wetting Angle
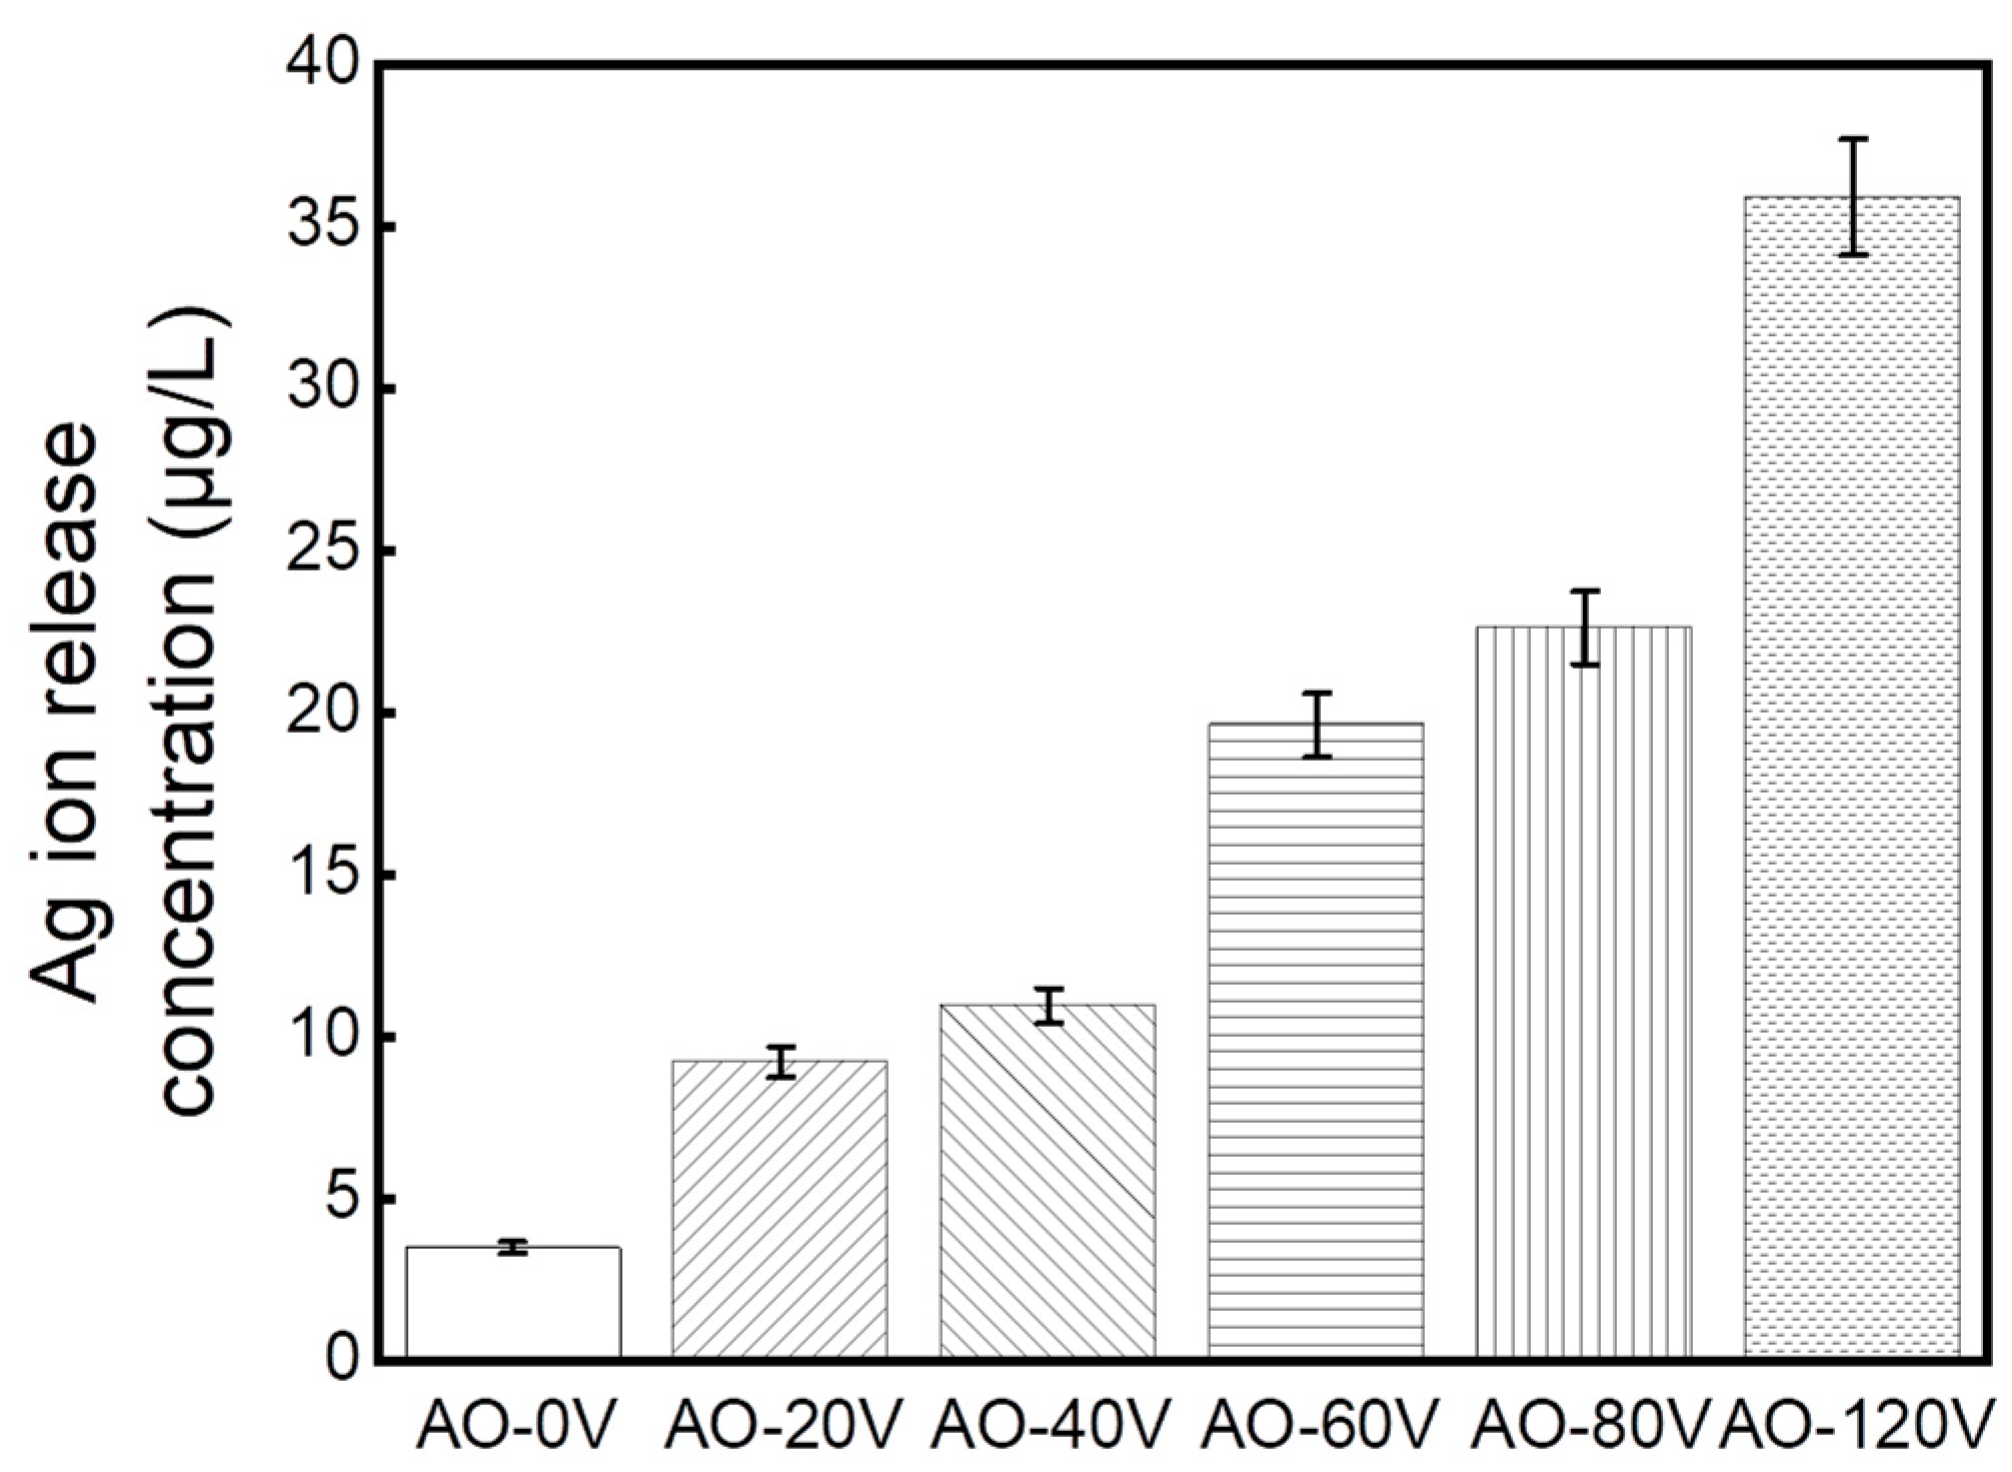
Figure 7 illustrates the surface roughness and water contact angle of Ti-Ag samples at various AO voltages. The impact of the anodic oxidation process on the biocompatibility and hydrophilicity of the samples was assessed. In Figure 7a, the surface roughness of the sample is approximately 0.10 μm after sandpaper grinding and polishing. With the increase in the oxidation voltages, the roughness increases obviously. When the oxidation voltage of AO treatment is 20 V, the surface roughness is 0.31 μm, which is 0.21 μm higher than that of AO-0 V. The surface roughness of AO-40 V is 0.25 μm. With the further increase in the voltages to 60 V and 80 V, the roughness of the sample is 0.42 μm and 0.51 μm. The surface roughness value reached a maximum of about 0.73 μm at an oxidation voltage of 120 V, and the roughness value continued to rise, increasing the possibility of cell adhesion during implantation.
Figure 7b illustrates the surface water contact angle of Ti-Ag samples at different AO voltages. The contact angle of the sample without AO treatment is approximately 60°. When the AO treatment voltage is between 20 and 80 V, the water contact angle is significantly reduced, but it does not change with the voltage, which is about 36~38°. When the oxidation voltage is 120 V, the lowest water contact angle is about 23°, indicating that the wetting angle decreases with the increase in voltage and AO treatment can improve the hydrophilicity of Ti-Ag samples.

3.7. Ion Release

Figure 8 shows the dissolution amount of Ag+ with different AO voltages. The concentration of Ag+ ions in the untreated sample was 3.48 μg/L. When the oxidation voltage was 20 V, the dissolution of Ag+ reached 9.21 μg/L. Upon increasing the voltage to 40 V, the ion release was 10.94 μg/L. Upon continuously increasing the voltage to 60 V and 80 V, the ion release was 19.6 μg/L and 22.6 μg/L. Finally, upon increasing the maximum voltage to 120 V, the release of Ag+ reaches a maximum of 35.9 μg/L. The bactericidal behavior of Ag-containing alloys is mainly due to the contribution of the long-term stable release of Ag+. The concentration of Ag+ increased with the increase in the oxidation voltage, indicating that AO treatment had a significant effect on the dissolution of Ag+. Therefore, AO treatment can enhance the antibacterial properties of the Ti-Ag alloy.

3.8. Antibacterial Property

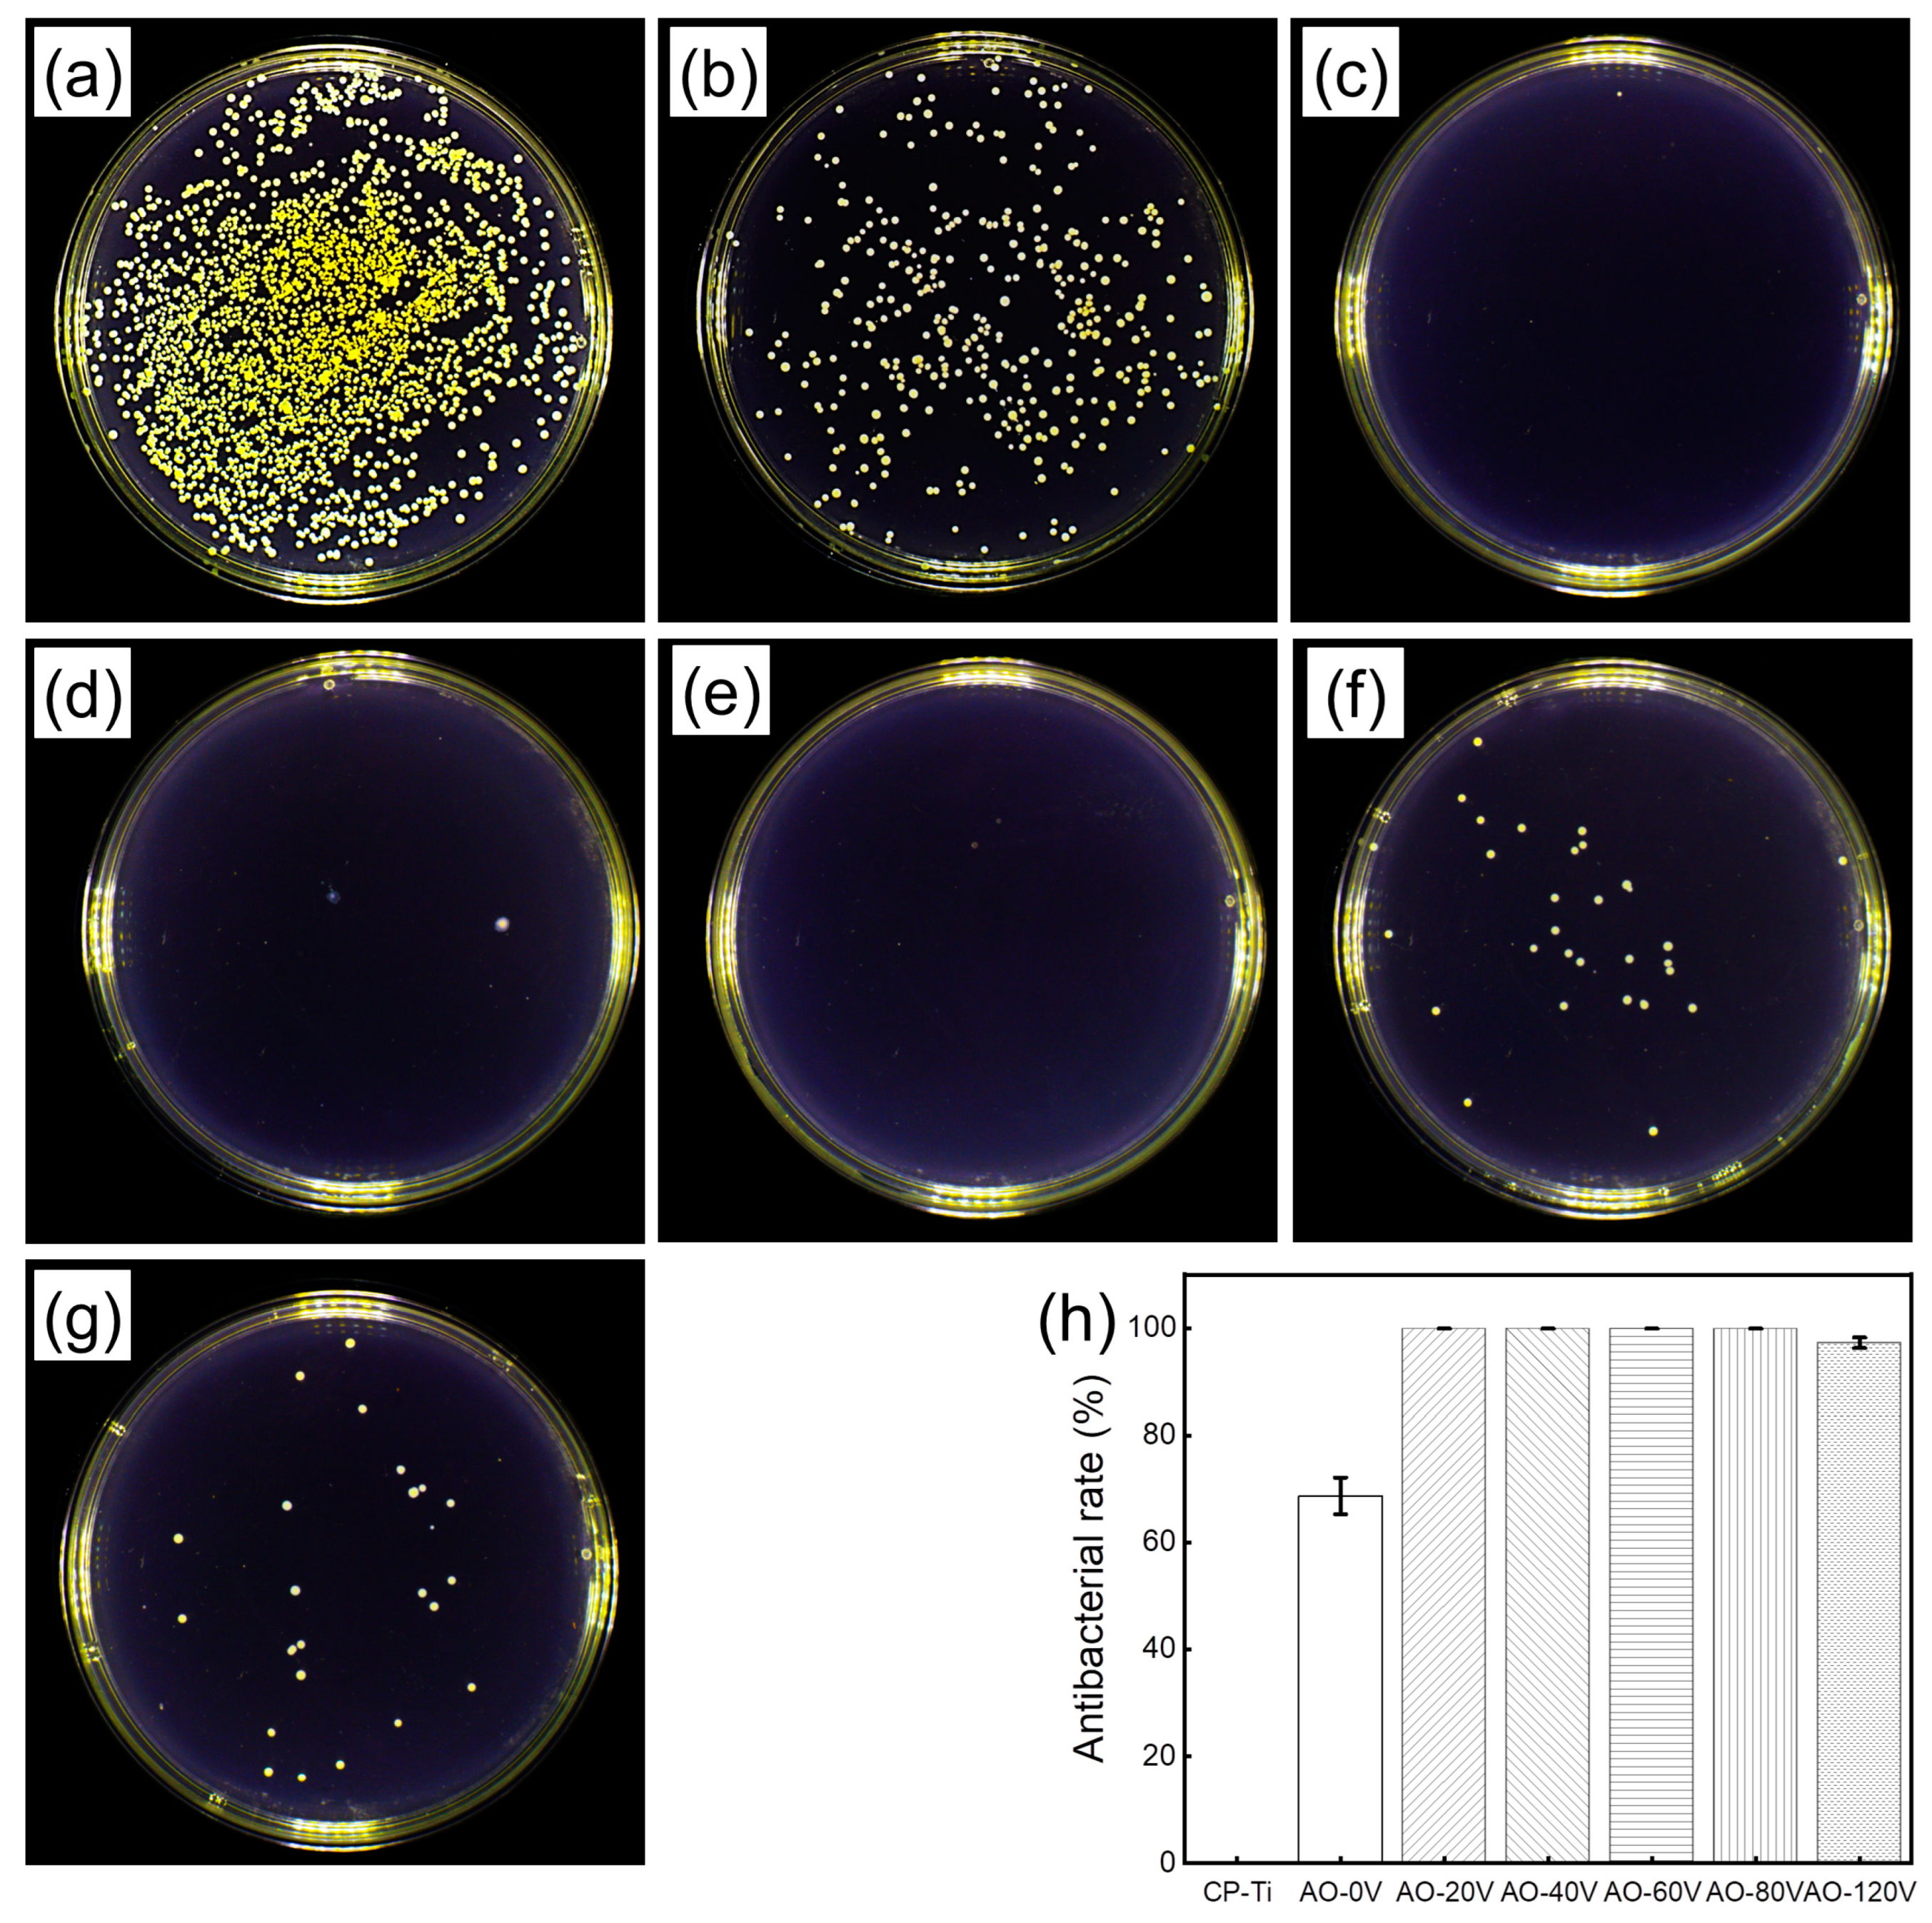
3.8.1. Antibacterial Rate

Figure 9 displays the bacterial colonies and antibacterial rates of Ti-Ag samples at various AO voltages, determined through plate counting. A large number of S. aureus colonies were distributed on the cp-Ti as the blank control sample, as shown in Figure 9a, which confirmed that cp-Ti did not have antibacterial activity. However, the Ti-Ag control sample exhibited a reduction in the number of colonies compared to the number observed on the cp-Ti colonies, resulting in an antibacterial rate of approximately 68%. The antibacterial properties of the Ti-Ag alloy need further enhancement. Notably, only a few colonies were observed on the Ti-Ag samples after AO treatment, signifying that AO can substantially improve antibacterial properties. Ti-Ag samples subjected to anodic oxidation, as depicted in Figure 9c–f, all demonstrated an antibacterial rate exceeding 99% against S. aureus, highlighting the significant improvement in the antibacterial capability achieved through anodic oxidation. However, when the oxidation voltage reached 120 V, the number of colonies increased compared with other oxidation voltages. As shown in Figure 9g, the antibacterial rate was about 97%.

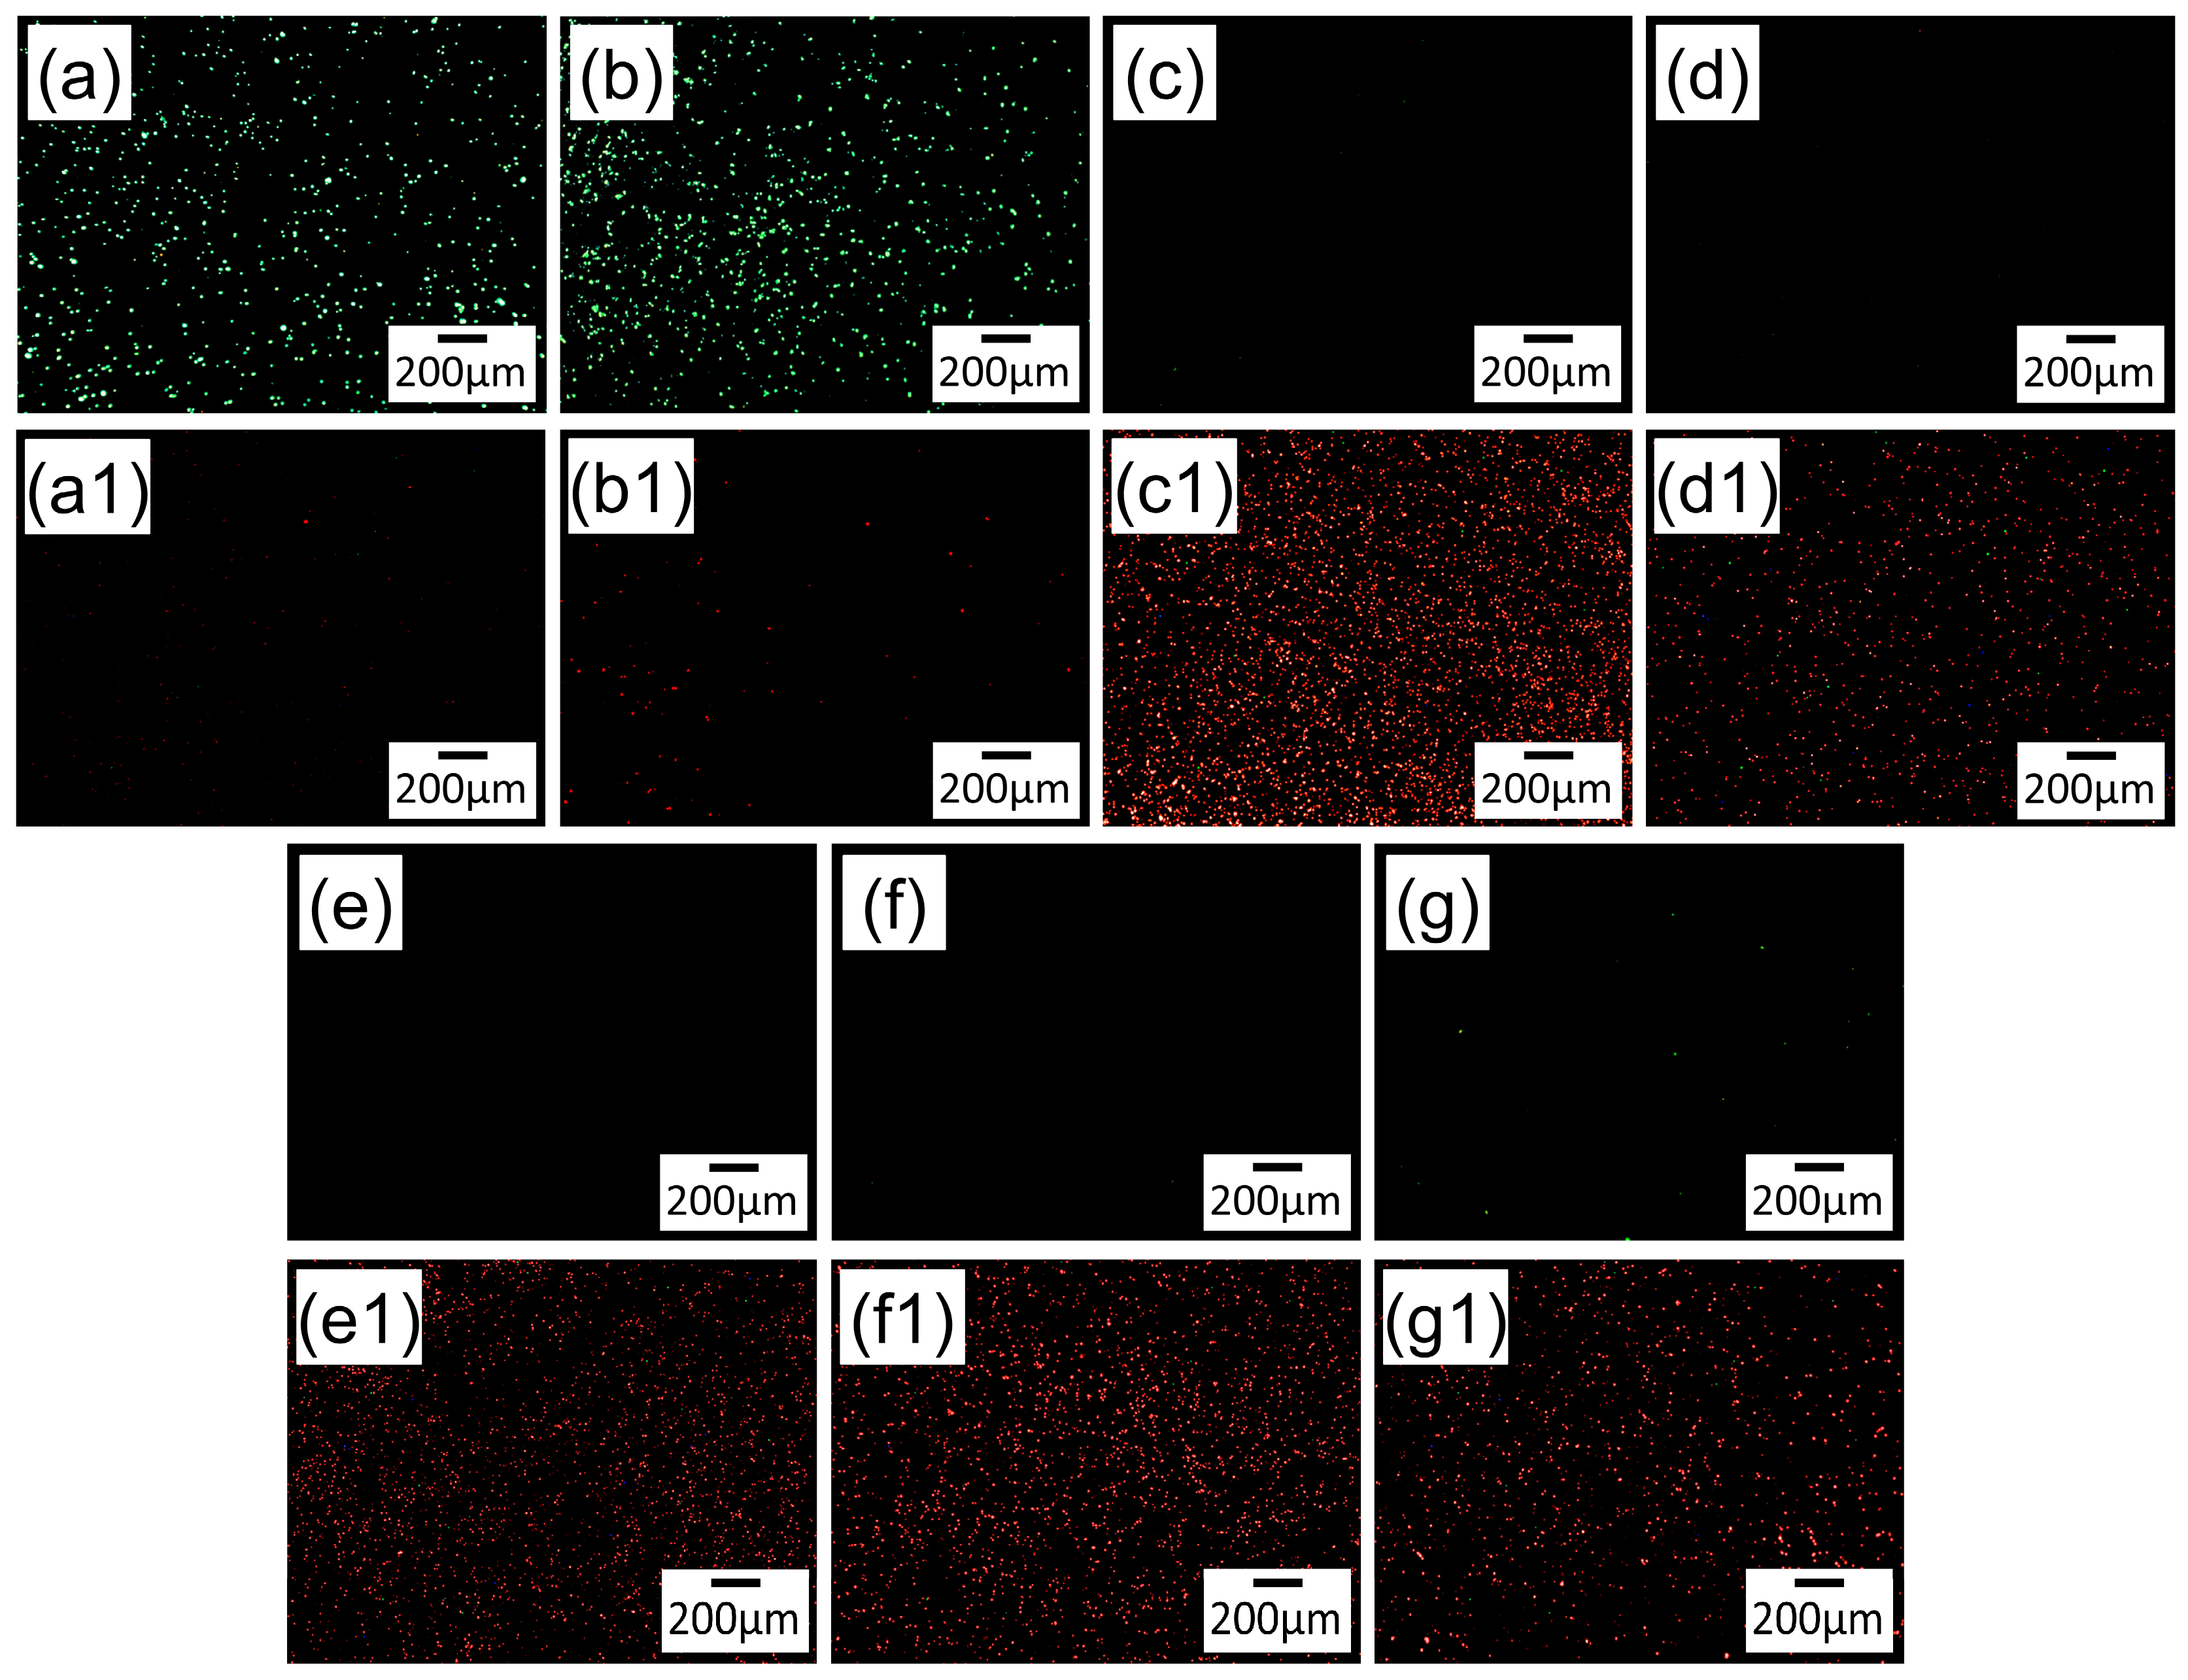
3.8.2. Live/Dead Fluorescence Staining

Figure 10 presents the live/dead fluorescence staining of S. aureus performed after 24 h of culture on Ti-Ag samples subjected to different AO voltages. On the surfaces of cp-Ti and Ti-Ag control samples, a substantial amount of green fluorescence and a limited amount of red fluorescence were observed. The green fluorescence represents live bacteria, while the red fluorescence indicates dead bacteria. This suggests the presence of numerous live bacteria on the sample surfaces, indicative of a weak antibacterial ability. In contrast, the surface of the Ti-Ag samples treated with AO exhibited a significant amount of red fluorescence, confirming the improved antibacterial properties achieved through AO treatment. These results are consistent with those calculated in the 3.8.1 plate counting experiment.

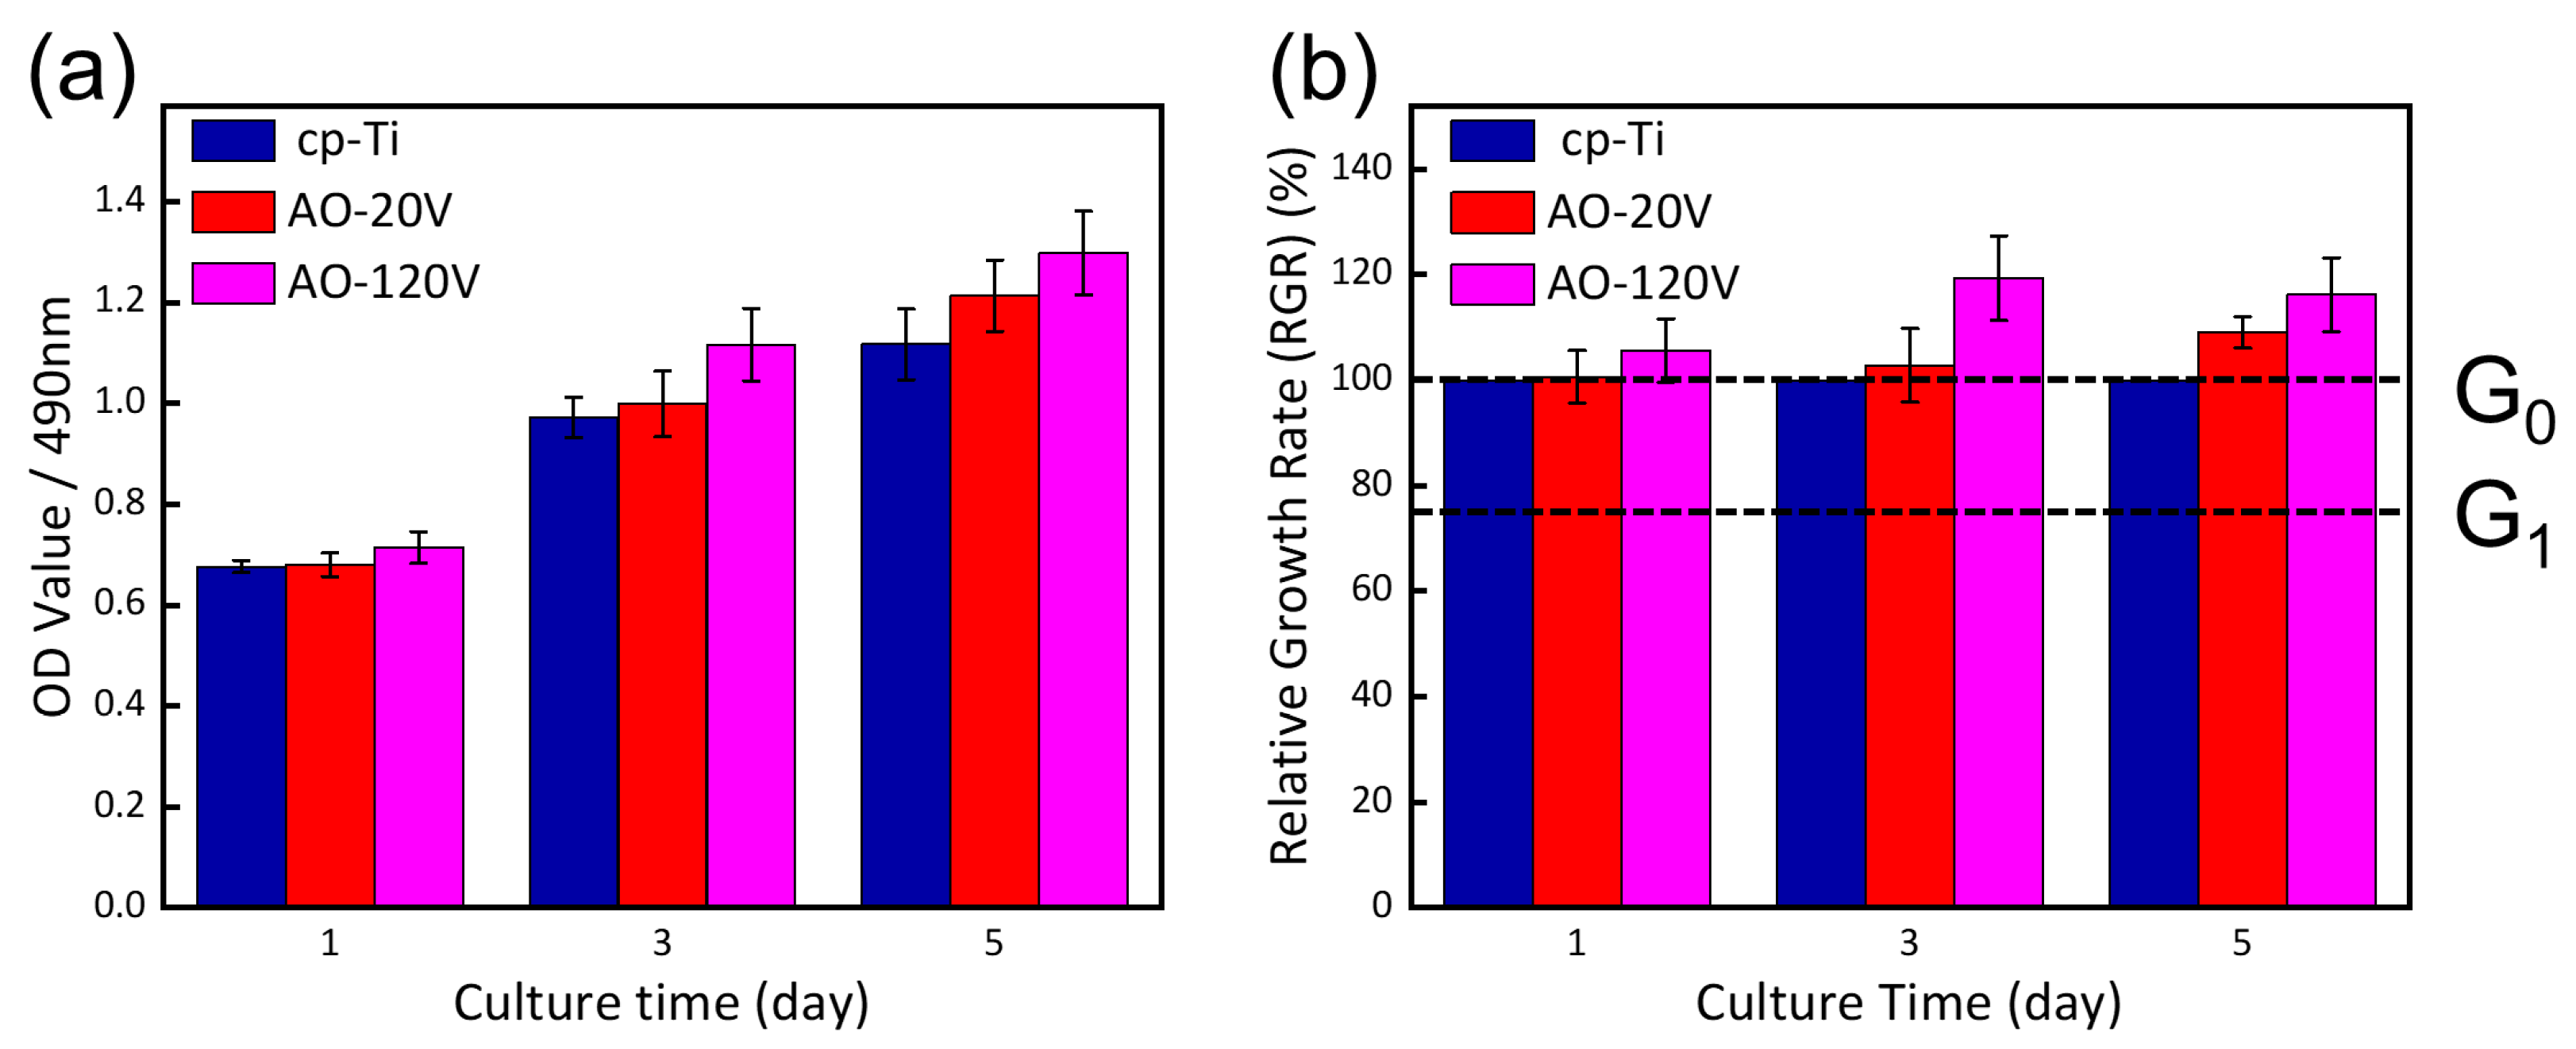
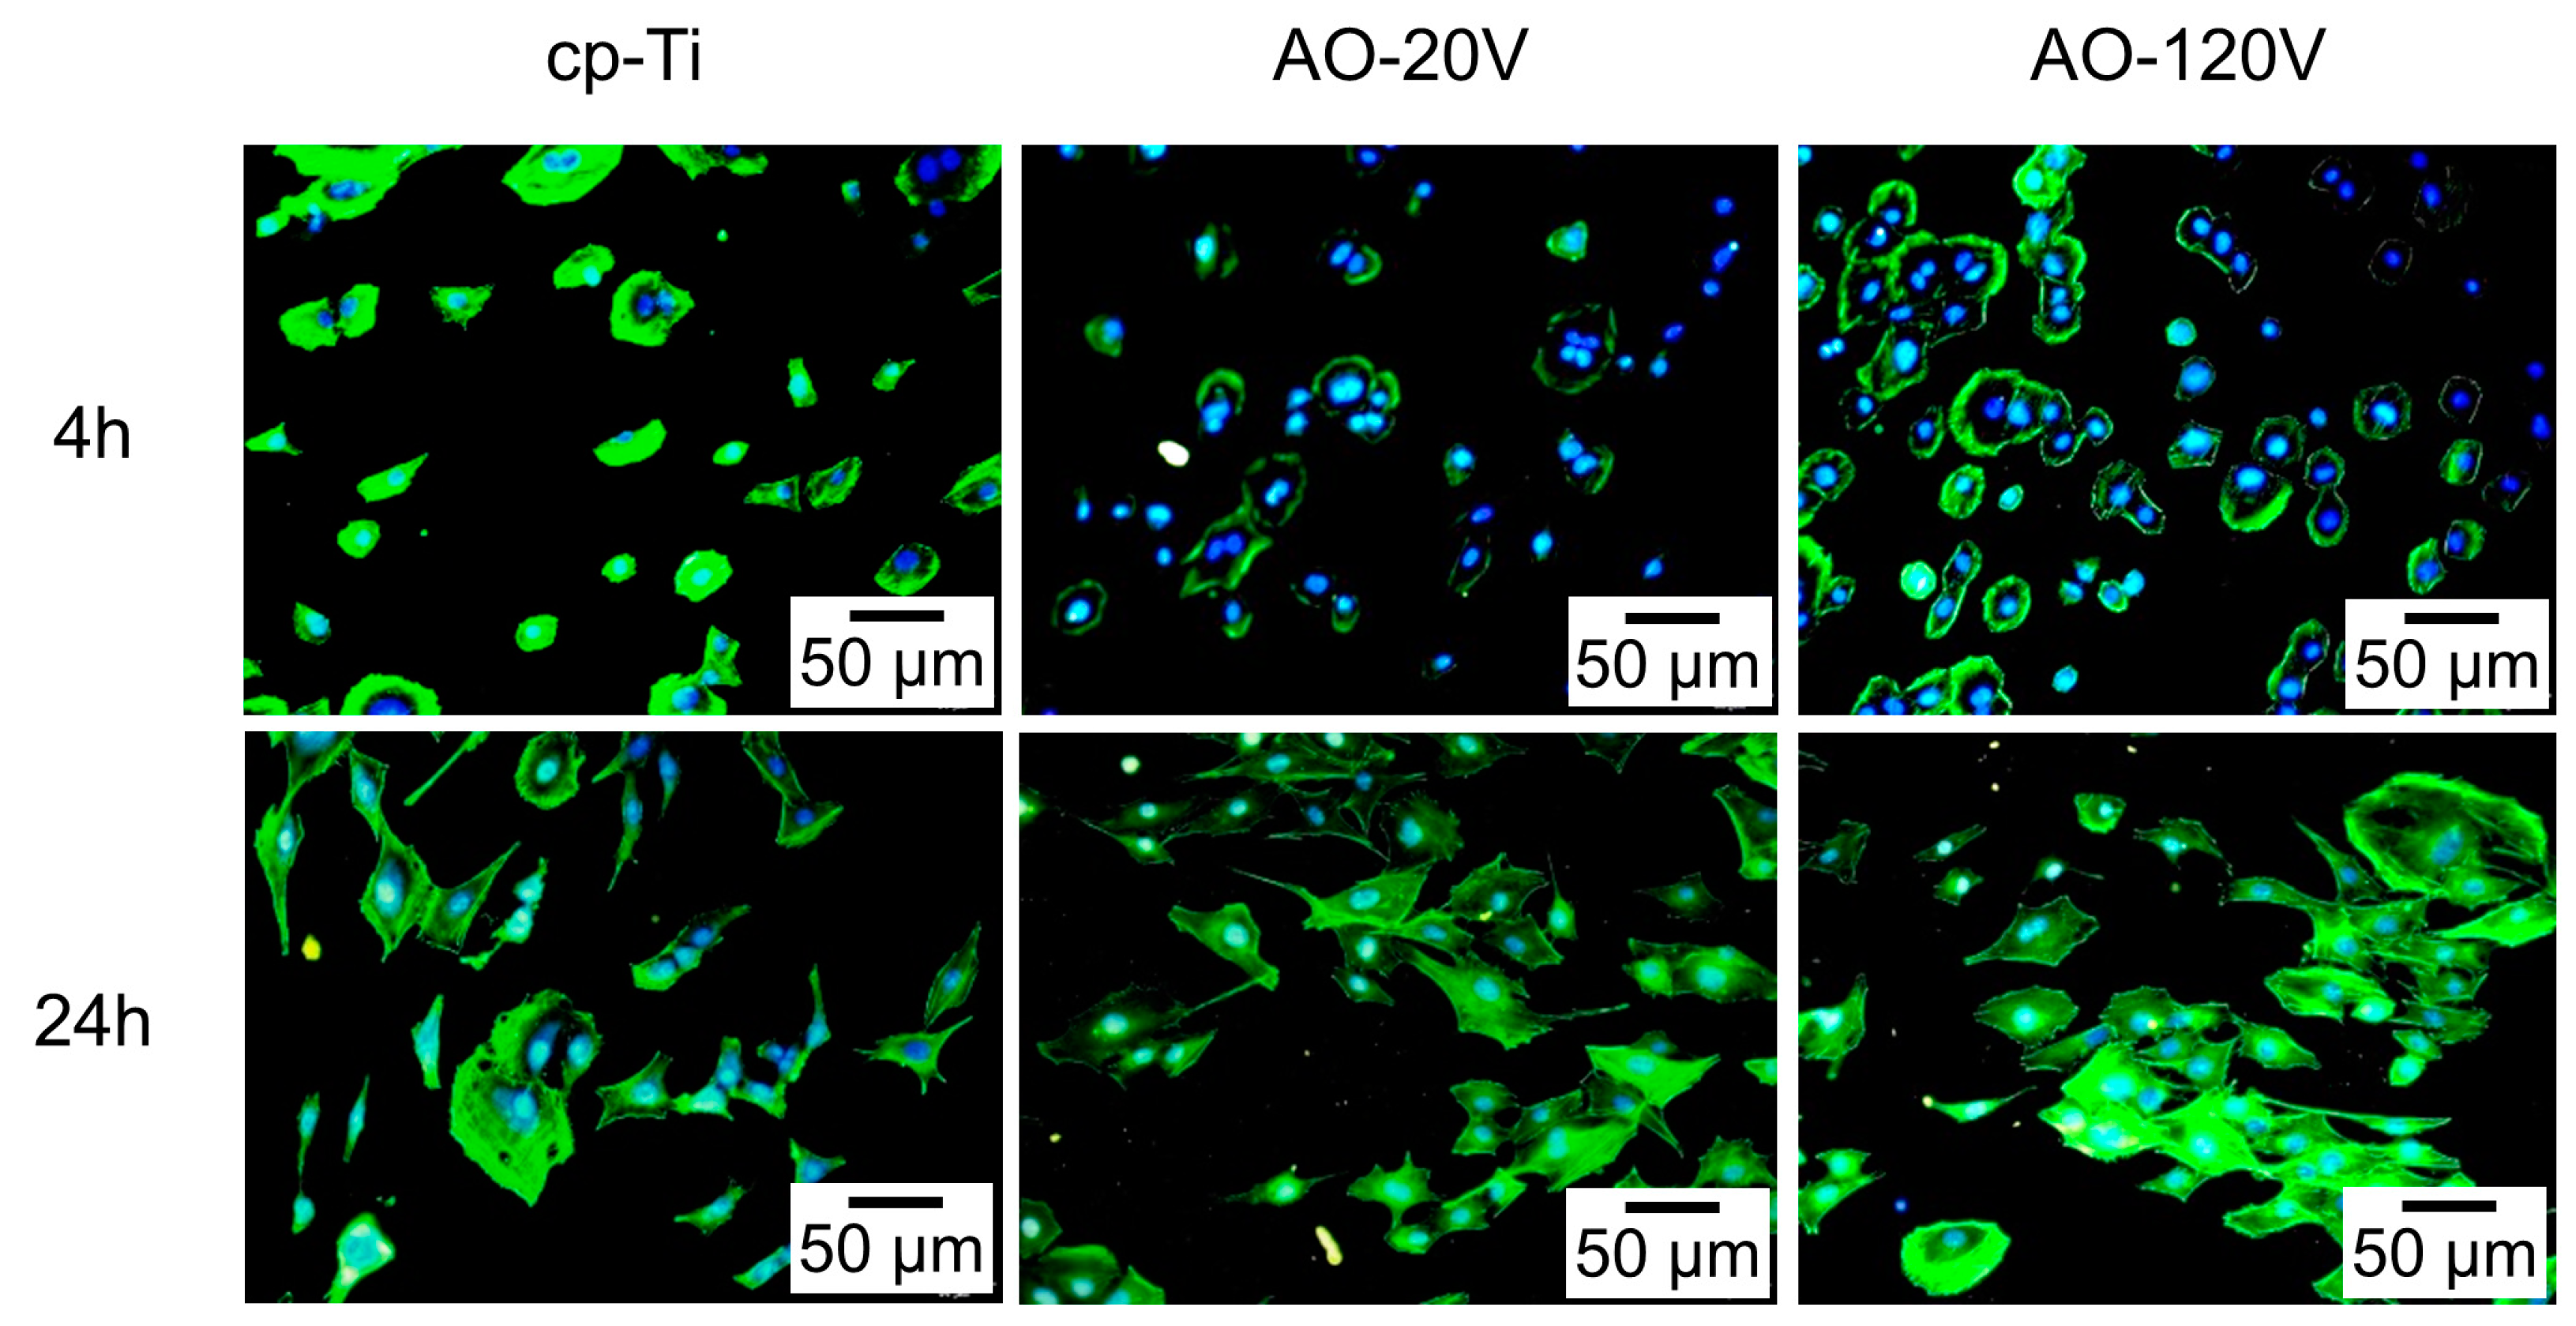
3.9. Cell Experiment

Figure 11 illustrates the chart depicting the cell proliferation and relative growth rate (RGR) of MC3T3-E1 cells when cultured with cp-Ti, AO-20 V, and AO-40 V sample extracts for 1, 3, and 5 days. In Figure 11a, it is evident that the OD value increased with the extension of the culture time, indicating healthy cell growth on the sample surface with an increasing cell count. At 1 day of culture, there was no significant difference in the OD value between AO-treated samples and cp-Ti. After 3 days of culture, the OD value of the AO-120 V sample was noticeably higher than that of the cp-Ti sample, while the OD values of AO-20 V and cp-Ti were not significantly different. Following 5 days of culture, the OD value of the AO-treated samples consistently exceeded that of cp-Ti. The calculated RGR results are shown in Figure 11b. After 3 and 5 days of culture, the RGR for the samples exceeded 100%, indicating Grade 0 cytotoxicity. These results suggest that AO-treated Ti-Ag samples exhibit no cytotoxicity to MC3T3-E1 cells.
Figure 12 shows the adhesion state of MC3T3-E1 cells obtained by staining on cp-Ti, AO-20 V, and AO-120 V specimens for 4 h and 24 h. After 4 h of culture, the cell size on the AO-120 V sample was larger than that on the AO-20 V sample, and the cells showed a flat spherical shape. When the culture time was increased to 24 h, the cells grew pseudopods and cytoskeleton, and the cells were distributed on the sample in a large area.

4. Discussion

4.1. Surface Physicochemical Performance

The anodic oxidation reaction induces alterations in the surface morphology and composition of Ti alloys [39]. The formation of anodic oxide film is formed by extracting O2− and matrix metal from the plating solution under the action of the electrode [8]. As depicted in Figure 2a–e, the anodizing voltage markedly influences the staining of the AO film. The color of the oxide is largely determined by the thickness of the oxide [40]. The thickness of Ti oxide formed under natural conditions is only 6 nm [41]. The mixed oxide film formed by anodic oxidation is more uniform and has good adhesion to the alloy surface [42]. The change in the oxidation voltage has no obvious effect on the surface phase composition of the film, as shown in Figure 3. However, the scanning results in Figure 4a–e show that when the oxidation voltage is 60 V, a large number of block structures appear on the surface. EDS analysis shows that the Ag content of the block structure is higher than that of the matrix, and AO treatment can accelerate the enrichment of Ag-containing phases on the surface of the alloy [43]. When the voltage increases to 120 V, the ‘flower-like structure’ of the oxide coating is the manifestation of the dielectric breakdown of the coating [44]. However, the dielectric breakdown phenomenon caused by too high voltage will cause the burning loss of Ag element, resulting in the decrease of the Ag element content in the coating. Ultimately, the XPS results in both Figure 2 and Figure 5 indicate the formation of the AO coating on the α-Ti and a small quantity of Ti2Ag substrates. The coating is comprised of TiO2 and Ag2O. Consequently, it can be concluded that the oxidation voltage has a limited impact on the chemical composition and phase composition of the film.
In the initial stage of anodic oxidation, the surface of the sample undergoes a violent hydrolysis reaction under a constant applied voltage, which increases the pH value around the sample and produces a large amount of free OH. The reaction is shown in Equation (4):
2H2O + 2e → H2↑ + 2OH
Ti → Ti4+ + 4e
As the hydrolysis reaction proceeds, when the OH in the solution reaches a certain concentration, under the action of the electric field, OH reacts with the α-Ti and Ti2Ag substrates, as shown in the Equations (6) and (7):
Ti2Ag + 10OH → Ti(OH)4 + Ag(OH)2 + 9e
Ti4+ + 4OH → Ti(OH)4
Subsequently, the reactions in Equations (8) and (9) occur on the surface, resulting in a large amount of Ag+ migrating outward to form oxides. When the voltage is large, a white block structure is formed on the surface, as shown in Figure 4c.
2Ag(OH)2− → Ag2O + H2O + 2OH
2Ti(OH)4 + 3e → Ti2O3 + 2H2O + 3OH
As the oxidation proceeds further, a new film will be formed outside [8]. When the voltage reaches the critical breakdown voltage, the white block structure appears as a gap and transforms into a flower-like structure. With the increase in the voltage and time, the coating size continues to thicken, and the size of the flower-like structure increases, as shown in Figure 4e,f, and with the progress of the reactions in Equations (10) and (11), the burning loss of the Ag element occurs. Finally, the formation rate and dissolution rate of the oxide film are balanced, and the surface is composed of oxides of TiO2 and Ag2O.
Ag2O + 2H2O → 2Ag+ + 2H+ + 2e
2Ti2O3 + O2 → 4TiO2
The roughness and wetting angle are important criteria for evaluating the biocompatibility of Ti alloy implant materials [45]. Osteoblasts are more likely to adhere to the rougher Ti alloys’ surface [46]. As depicted in Figure 7a, AO treatment markedly enhances the surface roughness of Ti-Ag samples. This manifestation indicates that the flower-like structure formed on the sample surface due to electron migration and bonding has a significant impact on cell adhesion and proliferation. In Figure 7b, the reduction in the wetting angle suggests that the alloy possesses high surface energy. At the same time, the ceramic oxide layer formed by AO treatment, especially TiO2, has high ionic properties and shows increased wettability [47]. The above results indicate that the coating formed by AO treatment promotes cell adhesion and proliferation.

4.2. Corrosion Resistance and Ion Release

The corrosion characteristics and ion release of implant materials play a pivotal role in the durability, efficacy, and biocompatibility of these materials. The results of Figure 6, Table 2, and Table 3 show that the TiO2/Ag2O coating formed on the Ti-Ag alloy by AO treatment enhances its corrosion resistance. The dense oxide layer formed by AO treatment can effectively prevent the erosion of the solution [48]. With the increase in the AO treatment voltage, the polarization resistance of the passivation film increases first and then decreases, which further reflects the protection of the coating for the substrate, as shown in Figure 6c. The phase angle and impedance values are higher than those of the Ti-Ag substrate in the whole frequency range, as shown in Figure 6d,e. The peak phase angle at a high frequency describes the dielectric properties of the TiO2/Ag2O coating grown by AO treatment, while the peak phase angle at a medium frequency represents a dense oxide film [49]. Enhancing corrosion resistance can mitigate the occurrence of pitting or stress corrosion in implant materials under the combined influence of bodily fluids and stress. This, in turn, reduces the risk of material fracture failure and enhances the safety of internal implant materials during use [34]. However, from the potentiodynamic polarization curve, with the increase in the AO treatment voltage, the AO-120 V sample showed a higher corrosion current density, which may be related to the formation of a surface ‘flower-like structure’, and the formation of protrusions provides the possibility of corrosion [50].
Although the coating formed on the surface after AO treatment can significantly enhance the corrosion resistance of the alloy, it also increases the surface content of Ag. The unstable Ag2O formed on the surface is more likely to accelerate the accelerated release of Ag+ and ionize in aqueous solution. The form is as in Equation (10), where the NaCl solution will accelerate the reaction. At the same time, the surface microstructure of the alloy is a critical factor influencing the release behavior of metal ions [51]. With the increase in the oxidation voltage, the flower-like structure formed on the surface increases the contact area between the film and the NaCl solution, which is the reason for promoting the release of Ag+.

4.3. Antibacterial Property

The strong antibacterial property of the Ti-Ag alloy against S. aureus is mainly attributed to the release of Ag+ [52]. At present, the research on the antibacterial mechanism of silver shows that silver can bind to bacteria [53], penetrate bacterial cell membranes [54], produce a large amount of reactive oxygen species (ROS) [55], and act as a regulator of microbial signal transduction pathways [56], and so it has received extensive attention in the study of the new generation of antibacterial drugs [57]. The above antibacterial properties of Ag are attributed to the oligodynamic effect of Ag, which enables Ag to target the microbial membrane and bind to it, thereby destroying its structural morphology and integrity [58,59,60]. Secondly, the abnormal structure of the microbial membrane can block the microbial outflow/inflow pump [61], which hurts the transport of microbial cells and leads to the loss of cell viability [62]. It can also target the mitochondria in the cytoplasm to produce ROS [63] until some serious DNA damage is induced [64], which then leads to mutations and genotoxic effects, thereby killing bacteria. At the same time, the precipitation of the Ti2Ag phase and Ag-rich phase in Ti-Ag can also lead to the rupture of bacterial cell membranes and the death of bacteria [36,65]. The anodic oxidation coating on the Ti-Ag sample isolated the direct contact between the Ti2Ag phase and the bacteria, thereby reducing the antibacterial ability. However, as shown in Figure 9, the coating treated with AO showed an antibacterial rate of up to 99.99%, manifesting that AO treatment restrained the growth of bacteria.
It has been reported that a Ag2O coating can effectively inhibit the growth of S. aureus and E. coli [66]. Ali [67] et al. prepared Ag2O nanoparticles by the green synthesis method and showed an excellent antibacterial ability against E. coli, S. aureus, and P. aeruginosa. It can be seen that the Ag2O coating on the sample after AO treatment can inhibit bacterial proliferation and thus achieve an antibacterial effect. Based on the above analysis, the antibacterial mechanism of Ti-Ag alloy anodic oxidation is illustrated in Figure 13. Although the maximum release of Ag+ in this experiment remains below the minimum antibacterial concentration of Ag+ at 5.4 ppm [68], AO treatment significantly enhances the release of Ag+, contributing to the antibacterial effect of free Ag+ and nano-Ag2O particles. However, when the oxidation voltage reaches 120 V, the release of Ag+ is at its peak, but the antibacterial rate slightly decreases, possibly due to the reduction of the Ag content in the Ti-Ag matrix. Therefore, the antibacterial properties of AO-treated Ti-Ag samples are primarily attributed to the synergistic action of the presence of Ag2O and the release of Ag+.

4.4. Cytotoxicity

Low cytotoxicity and good biocompatibility are the basic requirements to ensure the clinical application of biomedical implant materials and surface modification. Figure 10 illustrates the outcomes of the interaction between MC3T3-E1 cells and the samples. The AO-treated samples exhibited higher cell viability compared to the control samples, and the viability of all AO-treated Ti-Ag samples exceeded 75%, indicating the absence of cytotoxicity compared to the cp-Ti samples. The cytoskeleton staining shown in Figure 11 showed that the cell morphology after AO treatment showed a typical polygon. In comparison to cp-Ti, cells on AO samples exhibited more filamentous pseudopods, with interconnected ends forming a network structure. The cell morphology of the AO-120 V samples was better than that of AO-20 V samples. The cells displayed a robust spreading and adhesion state on the sample, indicating a healthy and thriving growth condition.
Silver is an effective antibacterial agent and is generally considered to be cytocompatible at low concentrations [69,70]. When the concentration of Ag+ exceeds 5.4 ppm, it will produce cytotoxicity [71]. AgNPs themselves or Ag+ can produce ROS in cells, resulting in DNA damage, protein denaturation, and thus apoptosis [72,73]. At the same time, Ag accumulates in the mitochondria of the cell, resulting in the decline of mitochondrial membrane potential (MMP), promoting the production of ROS, and causing mitochondrial dysfunction [74]. These pathways can lead to the cytotoxicity of the Ag+ released from Ti-Ag samples. Even though AO treatment can increase the release of silver ions, the maximum release concentration of Ti-Ag samples in 0.9% NaCl solution for 24 h is still far less than the minimum concentration of cytotoxicity.
The surface microstructure, physicochemical state of the coating surface, and the composition of the oxide coating have different effects on the adhesion and growth of cells on the Ti alloys. The block and flower-like structures formed on the surface after AO treatment made a great contribution to the improvement of the roughness and hydrophilicity of the TiO2/Ag2O coating. At the same time, both anatase and rutile TiO2 contained in the coating have good bioactivity and osteoinductivity [75].
In summary, AO treatment can obtain lower cytotoxicity and higher biocompatibility on the surface of Ti-Ag samples. The surface structure and composition of the TiO2/Ag2O coating are beneficial to antibacterial and cell proliferation. However, the antibacterial properties of Ag, the controllability of ion release, and in vivo biocompatibility still need more research in the future.

5. Conclusions

The impact of the AO process on the corrosion resistance, antibacterial properties, and biocompatibility of a Ti-Ag alloy was investigated by manipulating the surface composition and structure of the alloy through variations in the anodic oxidation voltage. This is of great significance for the application of the Ti-Ag alloy in the field of antibacterial titanium alloy bone implant materials. The following experimental conclusions can be drawn:
(1)
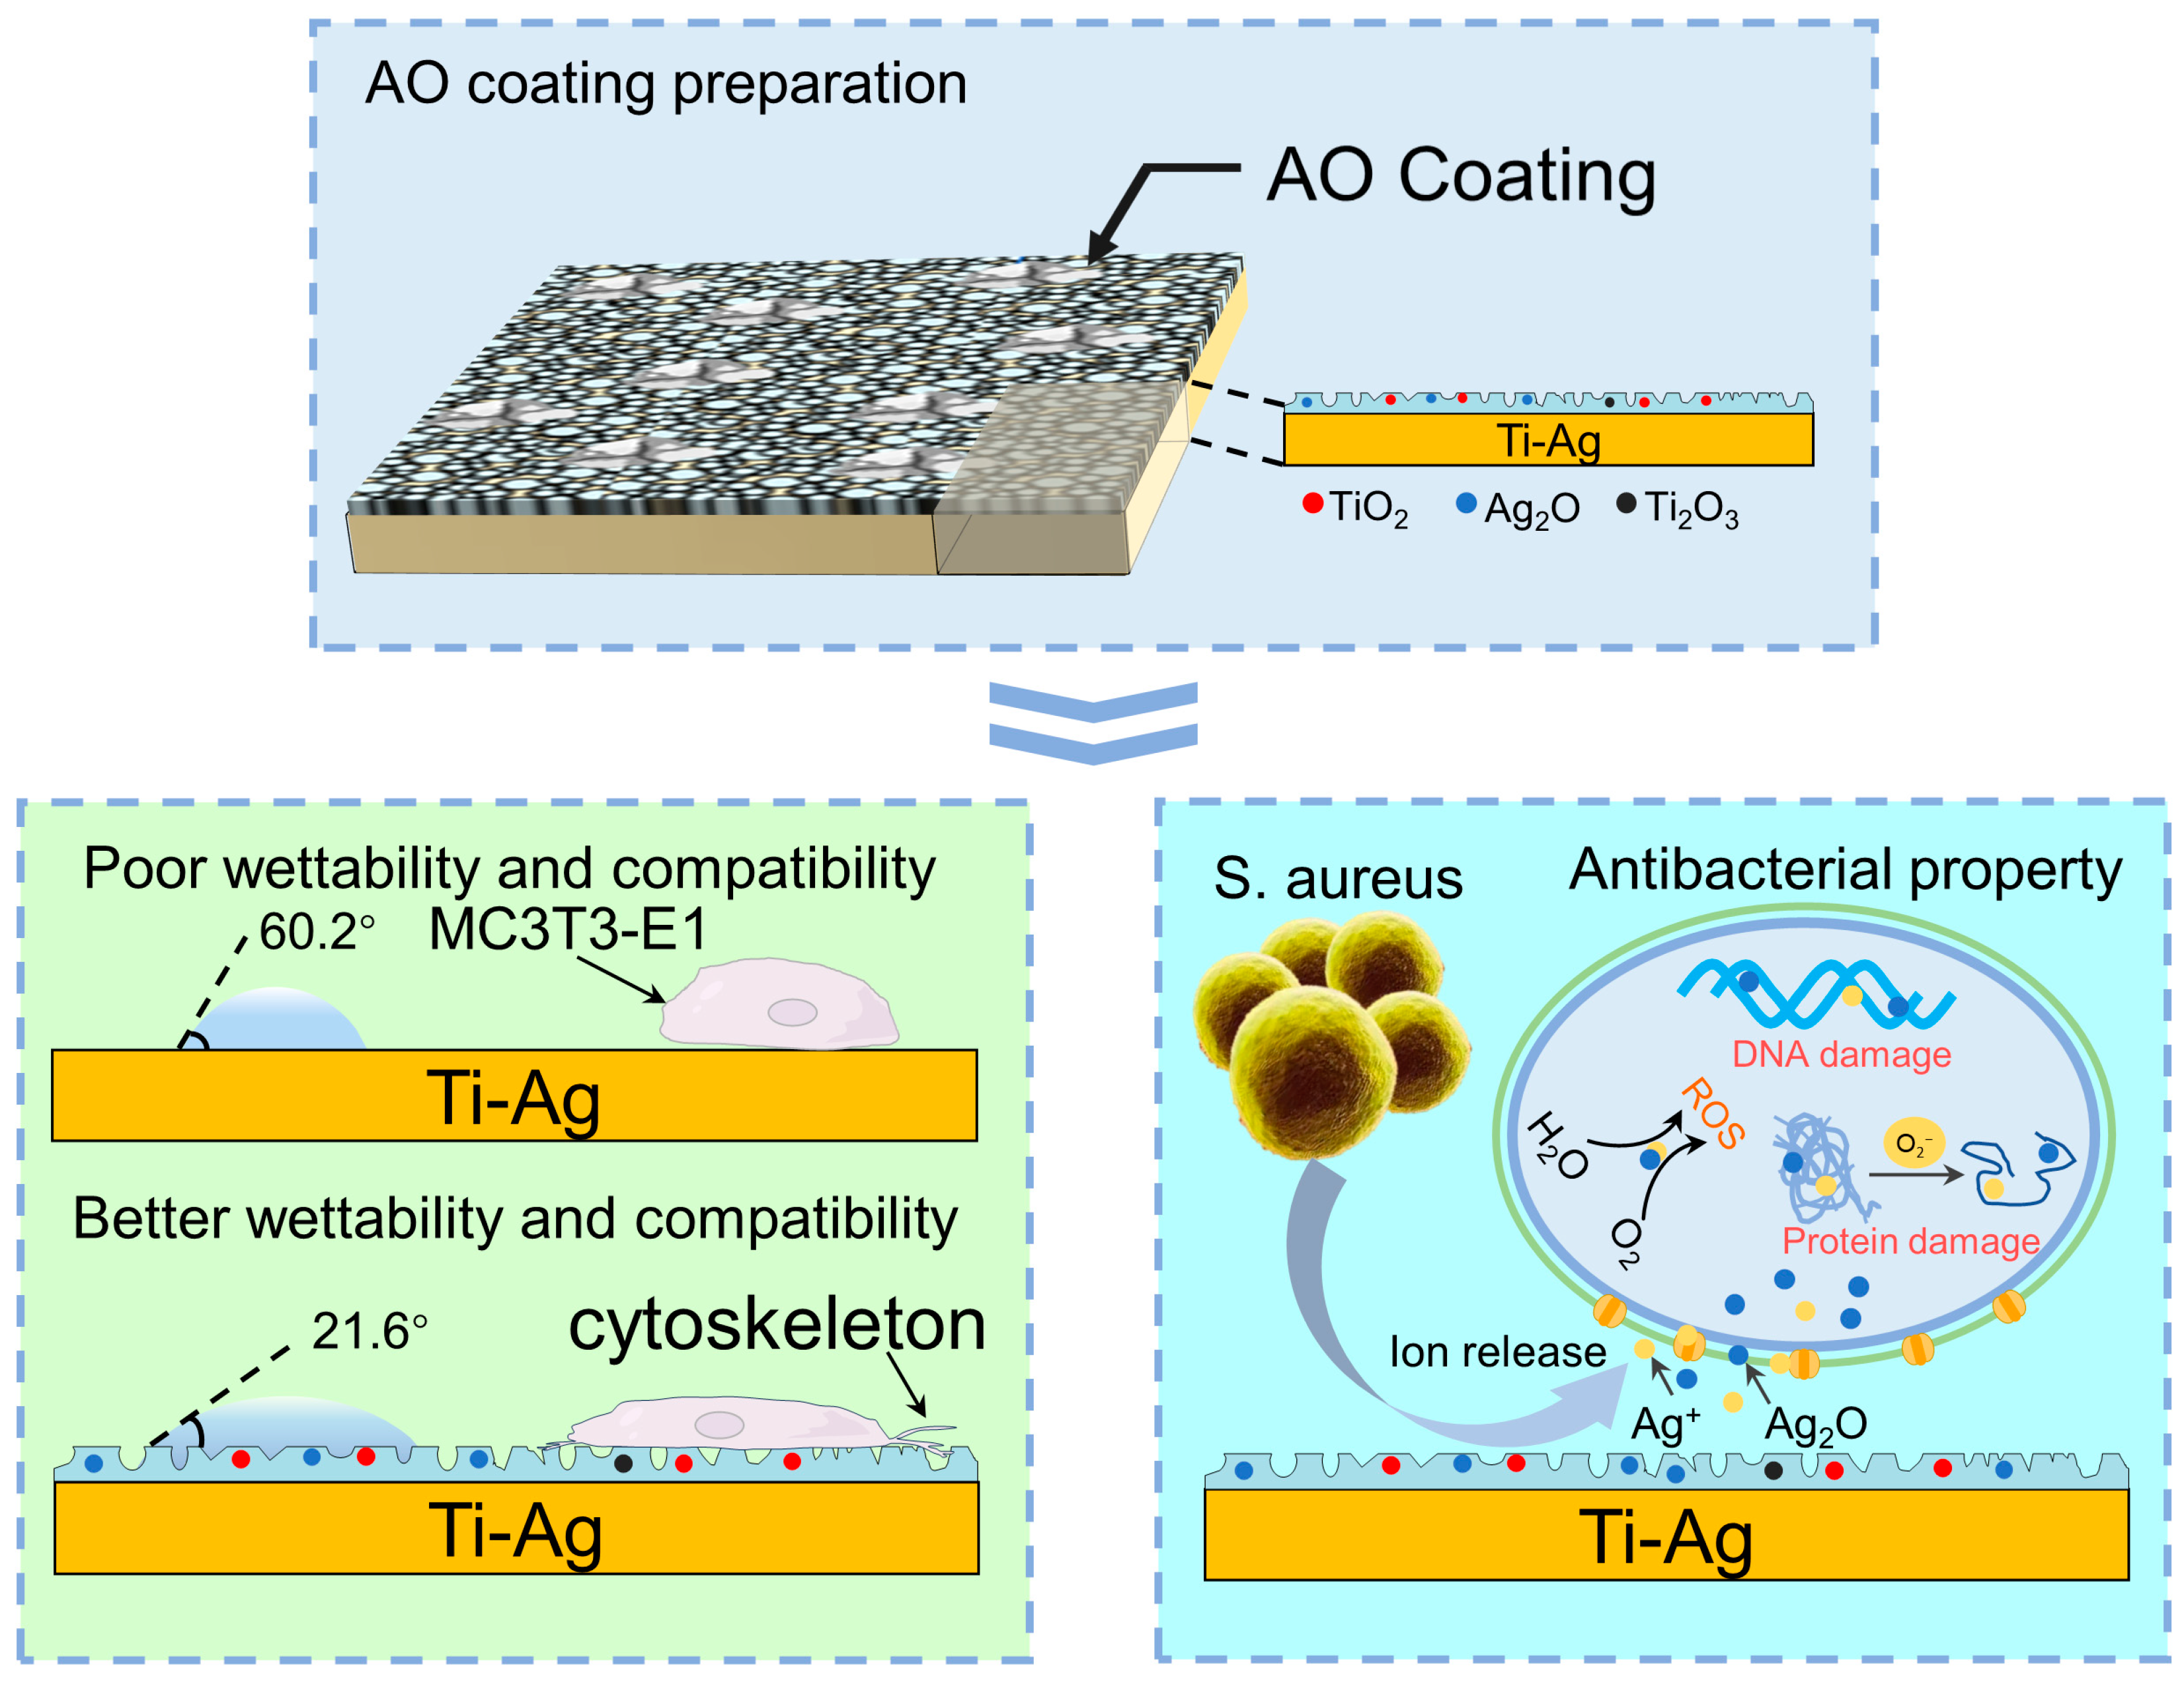
Different voltage AO treatments can change the microstructure of the Ti-Ag alloy and form a multi-functional coating with an irregular flower-like structure with a size of 1~2 μm on the surface. The coating is mainly composed of Ag2O and TiO2. The change in voltage has no obvious effect on the XRD test results of the samples, but too high a voltage will cause the burning loss of Ag.
(2)
After the AO treatment of the Ti-Ag alloy, the oxide film formed on the surface of the alloy improves the corrosion resistance and the corrosion resistance is higher than that of untreated samples. However, with the increase in the AO voltage, the corrosion resistance decreases. When the AO voltage is 20 V, the maximum Eocp is 107.621 mV, the maximum Ecorr is 17.035 mV, the minimum icorr is 2.241 × 10⁻⁸ A·cm−2, and the corrosion tendency and corrosion rate are the smallest.
(3)
AO treatment enhanced the antibacterial properties of the Ti-Ag alloy and the antibacterial rate was more than 99%. The increase in the AO voltage can promote the release of Ag+ and the improvement of the antibacterial performance is mainly attributed to the release of the Ag2O and Ag+ formed on the surface. However, the change in voltage has no obvious effect on the antibacterial performance.
(4)
With the increase in the AO treatment voltage, the surface roughness can be increased, the wetting angle can be reduced, and the biocompatibility of the Ti-Ag alloy can be improved. When the AO voltage is 120 V, the maximum roughness is 0.73 μm and the minimum wetting angle is 23°, showing better cell compatibility and no cytotoxicity.
Therefore, in the face of the complex physiological environment of the human body, higher requirements are put forward for the performance of implant materials such as a Ti-Ag alloy. In the future, it is of great significance to study the long-term stability of implant materials, investigate a wider range of alloy systems, and carry out a comprehensive evaluation of the biological properties of implant materials in vivo.

Author Contributions

Z.M.: Software, Methodology, Validation, Investigation, Writing—original draft. Y.Y.: Software, Methodology, Formal analysis, Writing—original draft, Investigation. C.S.: Visualization, Investigation, Software. K.D.: Visualization, Investigation. J.X.: Visualization, Investigation. Q.L.: Visualization, Investigation. L.M.: Project administration, Supervision. J.Z.: Visualization, Investigation. J.H.: Resources, Software, Data curation. E.Z.: Software, Conceptualization, Supervision, Funding acquisition, Writing—review and editing. All authors have read and agreed to the published version of the manuscript.

Funding

This research was funded by the Heilongjiang Province Natural Science Foundation of China (No. YQ2022E042); the Postdoctoral Funding Project in the Heilongjiang Province (No. LBH-Z23297); the Heilongjiang Provincial Department of the Education Basic Research Business Fee Basic Research Project (No. 2023-KYYWF-0585); the Heilongjiang Provincial Key Laboratory of Oral Biomedical Materials and Clinical Applications Open Project (No. KQSW202302); and the Doctoral Special Research Fund Project of Jiamusi University (No. JMSUBZ2021-09).

Institutional Review Board Statement

Not applicable.

Informed Consent Statement

Not applicable.

Data Availability Statement

Data are unavailable due to privacy or ethical restrictions.

Conflicts of Interest

Authors Zhen Ma and Jianming Zheng were employed by the company Zhejiang Wanfeng Technology Development Co., Ltd. The remaining authors declare that the research was conducted in the absence of any commercial or financial relationships that could be construed as a potential conflict of interest.

References

  1. Alves, A.C.; Sendao, I.; Ariza, E.; Toptan, F.; Ponthiaux, P.; Pinto, P.M.A. Corrosion behaviour of porous Ti intended for biomedical applications. J. Porous Mater. 2016, 23, 1261–1268. [Google Scholar] [CrossRef]
  2. Huang, Y.; Song, G.; Chang, X.; Wang, Z.; Zhang, X.; Han, S.; Su, Z.; Yang, H.; Yang, D.; Zhang, X. Nanostructured Ag+-substituted fluorhydroxyapatite-TiO2 coatings for enhanced bactericidal effects and osteoinductivity of Ti for biomedical applications. Int. J. Nanomed. 2018, 13, 2665–2684. [Google Scholar] [CrossRef]
  3. Cai, D.G.; Zhao, X.T.; Yang, L.; Wang, R.X.; Qin, G.W.; Chen, D.F.; Zhang, E.L. A novel biomedical titanium alloy with high antibacterial property and low elastic modulus. J. Mater. Sci. Technol. 2021, 81, 13–25. [Google Scholar] [CrossRef]
  4. Gallo, G.; Schillaci, D. Bacterial metal nanoparticles to develop new weapons against bacterial biofilms and infections. Appl. Microbiol. Biotechnol. 2021, 105, 5357–5366. [Google Scholar] [CrossRef] [PubMed]
  5. Zhang, W.; Zhang, S.Y.; Liu, H.; Ren, L.; Wang, Q.; Zhang, Y. Effects of surface roughening on antibacterial and osteogenic properties of Ti-Cu alloys with different Cu contents. J. Mater. Sci. Technol. 2019, 48, 278–284. [Google Scholar] [CrossRef]
  6. Campos, P.A.D.; Sabrina, R.; Batistao, D.W.D.F.; Bruuna, F.A.; Queiroz, L.L.; Brito, S.S.; Paulo, P.G.F.; Ribas, R.M. Multidrug resistance related to biofilm formation in Acinetobacter baumannii and klebsiella pneumoniae clinical strains from different pulsotypes. Curr. Microbiol 2016, 72, 617–627. [Google Scholar] [CrossRef] [PubMed]
  7. Wang, R.; Shi, M.S.; Xu, F.Y.; Qiu, Y.; Zhang, P.; Shen, K.L.; Zhao, Q.; Yu, J.G.; Zhang, Y.F. Graphdiyne-modified TiO2 nanofibers with osteoinductive and enhanced photocatalytic antibacterial activities to prevent implant infection. Nat. Commun. 2020, 11, 4465. [Google Scholar] [CrossRef] [PubMed]
  8. Cao, S.; Zhang, Z.-M.; Zhang, J.Q.; Wang, R.X.; Yang, L.; Chen, D.F.; Qin, G.W.; Zhang, E.L. Improvement in antibacterial ability and cell cytotoxicity of Ti-Cu alloy by anodic oxidation. Rare Met. 2022, 41, 594–609. [Google Scholar] [CrossRef]
  9. Maharubin, S.; Hu, Y.B.; Sooriyaarachchi, D.; Cong, W.L.; Tan, G.Z. Laser engineered net shaping of antimicrobial and biocompatible titanium-silver alloys. Mater. Sci. Eng. C 2019, 105, 110059. [Google Scholar] [CrossRef] [PubMed]
  10. Liu, S.; Zhang, Z.M.; Zhang, J.Q.; Qin, G.W.; Zhang, E.L. Construction of a TiO2/Cu2O multifunctional coating on Ti-Cu alloy and its influence on the cell compatibility and antibacterial properties. Surf. Coat. Technol. 2021, 421, 127438. [Google Scholar] [CrossRef]
  11. Sadowska, J.M.; Genoud, K.J.; Kelly, D.J.; Brien, F.J. Bone biomaterials for overcoming antimicrobial resistance: Advances in non-antibiotic antimicrobial approaches for regeneration of infected osseous tissue. Mater. Today 2021, 46, 136–154. [Google Scholar] [CrossRef]
  12. Ren, L.; Memarzadeh, K.; Zhang, S.Y.; Sun, Z.Q.; Yang, C.G.; Ren, G.G.; Robert, P.A.; Yang, K. A novel coping metal material CoCrCu alloy fabricated by selective laser melting with antimicrobial and antibiofilm properties. Mater. Sci. Eng. C 2016, 67, 461–467. [Google Scholar] [CrossRef] [PubMed]
  13. Alejandra, R.-C.; Diego, T.; Belal, R.; Monica, O.H.; Maria, P.G.; Jose, A.C.; Jose, M.M.; Elisa, R. Bioactivity and antibacterial properties of calcium and silver-doped coatings on 3D printed titanium scaffolds. Surf. Coat. Technol. 2021, 421, 127476. [Google Scholar] [CrossRef]
  14. Feng, J.; Cheng, L.; Zhou, X.D.; Xu, H.H.K.; Michael, D.W.; Markus, M.; Hans, M.; Li, Q.; Hannig, M.; Rupf, S. In situ antibiofilm effect of glass-ionomer cement containing dimethyllaminododecyl methacrylate. Dent. Mater. 2015, 31, 992–1002. [Google Scholar] [CrossRef]
  15. Liang, Y.; Song, Y.Y.; Wang, L.; Wei, C.; Zhou, X.; Feng, Y.H. Research progress on antibacterial activity of medical titanium alloy implant materials. Odontology 2023, 111, 813–829. [Google Scholar] [CrossRef] [PubMed]
  16. Arciola, C.R.; Campoccia, D.; Montanaro, L. Implant infections: Adhesion, biofilm formation and immune evasion. Nat. Rev. Microbiol. 2018, 16, 397–409. [Google Scholar] [CrossRef] [PubMed]
  17. Chen, C.H.; Lu, T.K. Development and challenges of antimicrobial peptides for therapeutic applications. Antibiotics 2020, 9, 24. [Google Scholar] [CrossRef] [PubMed]
  18. Jeannine, H. Rational approaches towards inorganic and organometallic antibacterials. Biol. Chem. 2022, 403, 363–375. [Google Scholar] [CrossRef]
  19. Dizaj, S.M.; Lotfipour, F.; Mohammad, B.J.; Mohammad, H.Z.; Khosro, A. Antimicrobial activity of the metals and metal oxide nanoparticles. Mater. Sci. Eng. C 2014, 44, 278–284. [Google Scholar] [CrossRef] [PubMed]
  20. Kim, J.D.; Yun, H.; Kim, G.C.; Lee, C.W.; Choi, H.C. Antibacterial activity and reusability of CNT-Ag and GO-Ag nanocomposites. Appl. Surf. Sci. 2013, 283, 227–233. [Google Scholar] [CrossRef]
  21. Saidin, S.; Jumat, A.M.; Amin, M.A.A.N.; Abdullah, S.S.A.H. Organic and inorganic antibacterial approaches in combating bacterial infection for biomedical application. Mater. Sci. Eng. C 2021, 118, 111382. [Google Scholar] [CrossRef]
  22. Luo, J.H.; Mamat, B.; Yue, Z.H.; Zhang, N.Y.; Xu, X.J.; Li, Y.L.; Su, Z.; Ma, C.; Zang, F.Z.; Wang, Y.B. Multi-metal ions doped hydroxyapatite coatings via electrochemical methods for antibacterial and osteogenesis. Colloid Interface Sci. Commun. 2021, 43, 100435. [Google Scholar] [CrossRef]
  23. Chen, M.; Zhang, E.L.; Zhang, L. Microstructure, mechanical properties, bio-corrosion properties and antibacterial properties of Ti-Ag sintered alloys. Biol. Adv. 2016, 62, 350–360. [Google Scholar] [CrossRef] [PubMed]
  24. Chouirfa, H.; Bouloussa, H.; Migonney, V.; Daudre, C.F. Review of titanium surface modification techniques and coatings for antibacterial applications. Acta Biomater. 2019, 83, 37–54. [Google Scholar] [CrossRef] [PubMed]
  25. Hadidi, M.; Bigham, A.; Saebnoori, E.; Tabrizi, S.A.H.; Rahmati, S.; Alizadeh, Z.M.; Nasirian, V.; Rafienia, M. Electrophoretic-deposited hydroxyapatite-copper nanocomposite as an antibacterial coating for biomedical applications. Surf. Coat. Technol. 2017, 321, 171–179. [Google Scholar] [CrossRef]
  26. Hou, X.G.; Mao, D.; Ma, H.Y.; Ai, Y.K.; Zhao, X.L.; Deng, J.H.; Li, D.J.; Liao, B. Antibacterial ability of Ag-TiO2 nanotubes prepared by ion implantation and anodic oxidation. Mater. Lett. 2015, 161, 309–312. [Google Scholar] [CrossRef]
  27. Kaczmarek, M.; Jurczyk, K.; Purwin, D.; Koper, J.K.; Romaniuk, A.; Lipinska, N.; Jakubowicz, J.; Jurczyk, M.U. Molecular analysis of biocompatibility of anodized titanium with deposited silver nanodendrites. Biol. Adv. 2018, 93, 437–444. [Google Scholar] [CrossRef]
  28. Xu, J.Y.; Zhang, J.W.; Shi, Y.F.; Tang, J.C.; Huang, D.N.; Yan, M.; Dargusch, M.S. Surface modification of biomedical Ti and Ti alloys: A review on current advances journal of metals. Materials 2022, 15, 1749. [Google Scholar] [CrossRef] [PubMed]
  29. Zhang, E.L.; Zhao, X.T.; Hu, J.L.; Wang, R.X.; Fu, S.; Qin, G.W. Antibacterial metals and alloys for potential biomedical implants. Bioact. Mater. 2021, 6, 2569–2612. [Google Scholar] [CrossRef]
  30. Zhang, L.C.; Chen, L.Y. A Review on Biomedical Titanium Alloys: Recent Progress and Prospect. Adv. Eng. Mater. 2019, 21, 18012115. [Google Scholar] [CrossRef]
  31. Zhang, E.L.; Ren, J.; Li, S.Y.; Yang, L.; Qin, G.W. Optimization of mechanical properties, biocorrosion properties and antibacterial properties of as-cast Ti-Cu alloys. Biomed. Mater. 2016, 11, 065001. [Google Scholar] [CrossRef] [PubMed]
  32. Andrii, L.; Cecilia, F.; Oleksii, S.; Fabrizia, G.; Dario, B.; Raymond, J.T. Comparison of Antimicrobial and Antibiofilm Activity of Proflavine Co-crystallized with Silver, Copper, Zinc, and Gallium Salts. ACS Appl. Bio Mater. 2022, 5, 4203–4212. [Google Scholar] [CrossRef]
  33. Wang, H.; Gao, W.W.; Zhang, X.Y.; LI, Y.; Zhang, S.Y.; Ren, L.; Yang, K. Enhanced Corrosion Resistance and Biological Properties of Ultrafine-Grained Ti15Zr5Cu Alloy. Metals 2022, 12, 1144. [Google Scholar] [CrossRef]
  34. Hu, J.L.; Li, H.X.; Wang, X.Y.; Yang, L.; Chen, M.; Wang, R.X.; Qin, G.W.; Chen, D.F.; Zhang, E.L. Effect of ultrasonic micro-arc oxidation on the antibacterial properties and cell biocompatibility of Ti-Cu alloy for biomedical application. Biomater. Adv. 2020, 115, 110921. [Google Scholar] [CrossRef]
  35. Schwartz, A.; Kossenko, A.; Zinigrad, M.; Danchuk, V.; Sobolev, A. Cleaning Strategies of Synthesized Bioactive Coatings by PEO on Ti-6Al-4V Alloys of Organic Contaminations. Materials 2023, 16, 4624. [Google Scholar] [CrossRef]
  36. Wang, N.; Li, H.Y.; Lv, W.L.; Li, J.H.; Wang, J.S.; Zhang, Z.T.; Liu, Y.R. Effects of TiO2 nanotubes with different diameters on gene expression and osseointegration of implants in minipigs. Biomaterials 2011, 32, 6900–6911. [Google Scholar] [CrossRef]
  37. Fu, S.; Zhang, Y.; Qin, G.W.; Zhang, E.L. Antibacterial effect of Ti-Ag alloy motivated by Ag-containing phases. Biomater. Adv. 2021, 128, 112266. [Google Scholar] [CrossRef]
  38. Biesinger, M.C.; Lau, L.W.; Gerson, A.R.; Smart, R.S.C. Resolving surface chemical states in XPS analysis of first row transition metals oxides and hydroxides: Sc, Ti, V, Cu and Zn. Appl. Surf. Sci. 2010, 257, 887–898. [Google Scholar] [CrossRef]
  39. Jarosz, M.; Zaraska, L.; Koziel, M.; Simka, W.; Sulka, G. Electrochemical Oxidation of Ti15Mo Alloy-The Impact of Anodization Parameters on Surface Morphology of Nanostructured Oxide Layers. Nanomaterials 2020, 11, 68. [Google Scholar] [CrossRef] [PubMed]
  40. Sul, Y.-T.; Johansson, C.B.; Jeong, Y.; Tomas, A. The electrochemical oxide growth behavior on titanium in acid and alkaline electrolytes. Med. Eng. Phys. 2001, 23, 329–346. [Google Scholar] [CrossRef]
  41. Chan, C.W.; Carson, L.; Smith, G.C.; Alessio, M.; Lee, S. Enhancing the antibacterial performance of orthopaedic implant materials by fibre laser surface engineering. Appl. Surf. Sci. 2017, 404, 67–81. [Google Scholar] [CrossRef]
  42. Han, M.-K.; Im, J.-B.; Hwang, M.-J.; Kim, B.J.; Kim, H.Y.; Park, Y.J. Effect of indium content on the microstructure, mechanical properties and corrosion behavior of titanium alloys. Metals 2015, 5, 850–862. [Google Scholar] [CrossRef]
  43. Mato, S.; Thompson, G.E.; Skeldon, P.; Shimizu, K.; Habazaki, H.; Masheder, D. Enrichment of alloying elements beneath anodic oxides: Investigation of Ta-1.5 at.% Cu alloy. Corros. Sci. 2001, 43, 993–1002. [Google Scholar] [CrossRef]
  44. Yahalom, J.; Zahavi, J. Electrolytic breakdown crystallization of anodic oxide films on A1, Ta and Ti. Electrochim. Acta 1970, 15, 1429–1435. [Google Scholar] [CrossRef]
  45. Zheng, Q.C.; Mao, L.L.; Shi, Y.T.; Fu, W.H.; Hu, Y.H. Biocompatibility of Ti-6Al-4V titanium alloy implants with laser microgrooved surfaces. Mater. Technol. 2022, 37, 2039–2048. [Google Scholar] [CrossRef]
  46. Deligianni, D.D.; Katsala, N.D.; Koutsoukos, P.G.; Missirlis, Y.F. Effect of surface roughness of hydroxyapatite on human bone marrow cell adhesion, proliferation, differentiation and detachment strength. Biomaterials 2001, 22, 87–96. [Google Scholar] [CrossRef]
  47. Bernard, S.A.; Balla, V.K.; Davies, N.M.; Bose, S.; Bandyopadhyay, A. Bone cell-materials interactions and Ni ion release of anodized equiatomic NiTi alloy. Acta Biomater. 2011, 7, 1902–1912. [Google Scholar] [CrossRef] [PubMed]
  48. Prando, D.; Brenna, A.; Bolzoni, F.M.; Diamanti, M.V.; Pedeferri, M.; Ormellesw, P.M. Electrochemical anodizing treatment to enhance localized corrosion resistance of pure titanium. J. Appl. Biomater. Func. 2017, 15, 19–24. [Google Scholar] [CrossRef]
  49. Benea, L.; Ravoiu, A.; Celis, J.-P. Anticorrosion Performance of the Electrochemically Grown Mixed Porous Oxide Films on Titanium Alloy in Biological Solution. ACS Biomater. Sci. Eng. 2019, 5, 5925–5934. [Google Scholar] [CrossRef]
  50. Kumar, S.; Chattopadhyay, K.; Singh, V. Effect of surface nanostructuring on corrosion behavior of Ti-6Al-4V alloy. Mater. Charact. 2016, 121, 23–30. [Google Scholar] [CrossRef]
  51. Wan, Y.Q.; Wang, Y.; Liu, Z.M.; Qu, X.; Han, B.X.; Bei, J.Z.; Wang, S.G. Adhesion and proliferation of OCT-1 osteoblast-like cells on micro- and nano-scale topography structured poly(L-lactide). Biomaterials 2005, 26, 4453–4459. [Google Scholar] [CrossRef] [PubMed]
  52. Shi, A.Q.; Zhu, C.S.; Fu, S.; Wang, R.X.; Qin, G.W.; Chen, D.W.; Zhang, E.L. What controls the antibacterial activity of Ti-Ag alloy, Ag ion or Ti2Ag particles? Biomater. Adv. 2020, 109, 110548. [Google Scholar] [CrossRef] [PubMed]
  53. Wang, G.K.; Hou, H.M.; Wang, S.L.; Yan, C.L.; Liu, Y.F. Exploring the interaction of silver nanoparticles with lysozyme: Binding behaviors and kinetics. Colloids Surf. B 2017, 157, 138–145. [Google Scholar] [CrossRef]
  54. Shang, L.; Nienhaus, K.; Nienhaus, G.U. Engineered nanoparticles interacting with cells: Size matters. J. Nanobiotechnol. 2014, 12, 5. [Google Scholar] [CrossRef] [PubMed]
  55. Avalos, A.; Haza, A.I.; Mateo, D.; Paloma, M. Cytotoxicity and ROS production of manufactured silver nanoparticles of different sizes in hepatoma and leukemia cells. J. Appl. Toxicol. 2014, 34, 413–423. [Google Scholar] [CrossRef] [PubMed]
  56. Prasher, P.; Singh, M.; Mudila, H. Oligodynamic Effect of Silver Nanoparticles: A Review. BioNanoScience 2018, 8, 951–962. [Google Scholar] [CrossRef]
  57. Loo, C.-Y.; MRohanizadeh, R.; Young, P.M.; Traini, D.; Cavaliere, R.; Cynthia, B.W.; Lee, W.H. Combination of Silver Nanoparticles and Curcumin Nanoparticles for Enhanced Anti-biofilm Activities. J. Agric. Food Chem. 2016, 64, 2513–2522. [Google Scholar] [CrossRef]
  58. Tripathi, D.K.; Tripathi, A.; Shweta; Singh, S.; Singh, Y.; Vishwakarma, K.; Yadav, G.; Sharma, S.; Singh, V.K.; Mishra, R.K.; et al. Uptake, Accumulation and Toxicity of Silver Nanoparticle in Autotrophic Plants, and Heterotrophic Microbes: A Concentric Review. Front. Microbiol. 2017, 8, 243339. [Google Scholar] [CrossRef]
  59. Rahisuddin; Thabaiti, S.A.; Khan, Z.; Manzoor, N. Biosynthesis of silver nanoparticles and its antibacterial and antifungal activities towards Gram-positive, Gram-negative bacterial strains and different species of Candida fungus. Bioproc. Biosyst. Eng. 2015, 38, 1773–1781. [Google Scholar] [CrossRef] [PubMed]
  60. Phanjom, P.; Ahmed, G. Effect of different physico-chemical conditions on the synthesis of silver nanoparticles using fungal cell filtrate of Aspergillus oryzae (MTCC No. 1846) and their antibacterial effect. Adv. Nat. Sci. Nanosci. Nanotechnol. 2017, 8, 045016. [Google Scholar] [CrossRef]
  61. Hao, Y.; Winans, S.C.; Glick, B.R.; Charles, T.C. Identification and characterization of new LuxR/LuxI-type quorum sensing systems from metagenomic libraries. Environ. Microbiol. 2010, 12, 105–117. [Google Scholar] [CrossRef] [PubMed]
  62. Lara, H.H.; Trevino, E.N.G.; Turrent, L.L.; Singh, D.K. Silver nanoparticles are broad-spectrum bactericidal and virucidal compounds. J. Nanobiotechnol. 2011, 9, 30. [Google Scholar] [CrossRef] [PubMed]
  63. Wang, J.; Shu, K.H.; Zhang, L.; Si, Y.B. Effects of Silver Nanoparticles on Soil Microbial Communities and Bacterial Nitrification in Suburban Vegetable Soils. Pedosphere 2017, 27, 482–490. [Google Scholar] [CrossRef]
  64. Pramanik, S.; Chatterjee, S.; Saha, A.; Devi, P.S.; Kumar, G.S. Unraveling the Interaction of Silver Nanoparticles with Mammalian and Bacterial DNA. J. Phys. Chem. B 2016, 120, 5313–5324. [Google Scholar] [CrossRef] [PubMed]
  65. Cui, S.S.; Liu, S.; Nie, J.J.; Chen, D.F.; Wu, X.B.; Qin, G.W.; Zhang, E.L. Design and preparation of a biomedical titanium alloy with low elastic modulus and high antibacterial property based on Ti-Mo-Ag system. J. Alloys Compd. 2022, 908, 164639. [Google Scholar] [CrossRef]
  66. Patel, H.; Joshi, J. Green and chemical approach for synthesis of Ag2O nanoparticles and their antimicrobial activity. J. Sol-Gel Sci. Technol. 2023, 105, 814–826. [Google Scholar] [CrossRef]
  67. Fayyadh, A.A.; Alzubaidy, M.H.J. Green-synthesis of Ag2O nanoparticles for antimicrobial assays. J. Mech. Behav. Mater. 2021, 30, 228–236. [Google Scholar] [CrossRef]
  68. Heidenau, F.; Mittelmeier, W.; Detsch, R.; Haenle, M.; Stenzel, F.; Ziegler, G.; Gollwitzer, H. A novel antibacterial titania coating: Metal ion toxicity and in vitro surface colonization. J. Mater. Sci. Mater. Med. 2005, 16, 883–888. [Google Scholar] [CrossRef]
  69. Hardes, J.; Streitburger, A.; Ahrens, H.; Nusselt, T.; Gebert, C.; Winkelmann, W.; Battmann, A.; Gosheger, G. The influence of elementary silver versus titanium on oste-oblasts behavior in vitro using human osteosarcoma cell lines. Sarcoma 2007, 2007, 26539. [Google Scholar] [CrossRef]
  70. Qin, H.; Cao, H.L.; Zhao, Y.C.; Zhu, C.; Cheng, T.; Wang, Q.J.; Peng, X.C.; Cheng, M.Q.; Wang, J.X.; Jin, G.D.; et al. In vitro and in vivo anti-biofilm effects of silver nanoparticles immobilized on titanium. Biomaterials 2021, 269, 120315. [Google Scholar] [CrossRef]
  71. Greulich, C.; Braun, D.; Peetsch, A.; Diendorf, J.; Siebers, B.; Epple, M.; Manfred, K. The toxic effect of silver ions and silver nanoparticles towards bacteria and human cells occurs in the same concentration range. RSC Adv. 2012, 2, 6981–6987. [Google Scholar] [CrossRef]
  72. Akter, M.; Sikder, M.T.; Rahman, M.M.; Ullah, A.K.M.; Hossain, K.F.B.; Banik, S.; Hosokawa, T.; Saito, T.; Kurasaki, M. A systematic review on silver nanoparticles-induced cytotoxicity: Physicochemical properties and perspectives. J. Adv. Res. 2018, 9, 1–16. [Google Scholar] [CrossRef]
  73. Hamad, A.; Khashan, K.S.; Hadi, A. Silver Nanoparticles and Silver Ions as Potential Antibacterial Agents. J. Inorg. Organomet. Polym. 2020, 30, 4811–4828. [Google Scholar] [CrossRef]
  74. Liao, C.Z.; Li, Y.C.; Tiong, S. Bactericidal and Cytotoxic Properties of Silver Nanoparticles. Int. J. Mol. Sci. 2019, 20, 449. [Google Scholar] [CrossRef]
  75. Xing, J.H.; Xia, Z.B.; Hu, J.F.; Zhang, Y.H.; Zhong, L. Time dependence of growth and crystallization of anodic titanium oxide films in potentiostatic mode. Corros. Sci. 2013, 75, 212–219. [Google Scholar] [CrossRef]
Figure 1. Preparation process of anodic oxidation coating.
Coatings 14 00405 g001
Figure 2. The coloring effect of Ti-Ag samples with different AO voltages: (a) AO-20 V; (b) AO-40 V; (c) AO-60 V; (d) AO-80 V; (e) AO-120 V.
Coatings 14 00405 g002
Figure 3. XRD patterns of Ti-Ag samples with different AO voltages.
Coatings 14 00405 g003
Figure 4. SEM morphology of (a) AO-20 V, (b) AO-40 V, (c) AO-60 V, (d) AO-80 V, (e) AO-120 V; (f) Coating thickness; Points A–I represent sampling points for EDS analysis.
Coatings 14 00405 g004
Figure 5. XPS analysis spectra of survey spectrum, Ti 2p, O 1s, Ag 3d: (a1a4) AO-20 V; (b1b4) AO-60 V; (c1c4) AO-120 V.
Coatings 14 00405 g005
Figure 6. Electrochemical correlation curves of Ti-Ag samples at various AO voltages: (a) OCP curve, (b) Tafel curve, (c) Nyquist curve, (d,e) Bode plots, (f) Equivalent circuit model of samples.
Coatings 14 00405 g006
Figure 7. The surface roughness of Ti-Ag samples with different AO voltages: (a) surface roughness, (b) surface water contact angle.
Coatings 14 00405 g007
Figure 8. The release of Ag+ from Ti-Ag alloy with different AO voltages immersed in 0.9% NaCl solution for 24 h.
Coatings 14 00405 g008
Figure 9. The number of colonies and antibacterial rate of S.aureus cultured for 24 h on Ti-Ag samples with different AO voltages: (a) cp-Ti; (b) AO-0 V; (c) AO-20 V; (d) AO-40 V; (e) AO-60 V; (f) AO-80 V; (g) AO-120 V; (h) antibacterial rates.
Coatings 14 00405 g009
Figure 10. Live/dead fluorescence staining of S. aureus colonies on Ti-Ag samples: (a,a1) cp-Ti; (b,b1) AO-0 V; (c,c1) AO-20 V; (d,d1) AO-40 V; (e,e1) AO-60 V; (f,f1) AO-80 V; (g,g1) AO-120 V.
Coatings 14 00405 g010
Figure 11. Cell viabilities of MC3T3-E1 cells after 1, 3, and 5 days of incubation on Ti-Ag samples: (a) OD Values at 490 nm, (b) RGR of cells on different samples.
Coatings 14 00405 g011
Figure 12. Cytoskeleton of MC3T3-E1 cells cultured on cp-Ti, AO-20 V, and AO-120 V specimens for 4 h and 24 h.
Coatings 14 00405 g012
Figure 13. Formation and antibacterial mechanism of anodic oxidation of Ti-Ag alloy.
Coatings 14 00405 g013
Table 1. Semi-quantitative calculation results of coating phase composition.
Sampleα-Ti/wt%Ti2Ag/wt%Rwp/%
AO-0 V96.6 ± 1.23.4 ± 0.28.26
AO-20 V97.3 ± 0.92.7 ± 0.49.12
AO-40 V96.1 ± 1.43.9 ± 0.39.36
AO-60 V96.3 ± 1.13.7 ± 0.610.26
AO-80 V97.6 ± 0.82.4 ± 0.412.42
AO-120 V98.5 ± 0.61.5 ± 0.58.37
Table 2. EDS analysis results of point A–I in Figure 4.
Oxidation
Potential
PointElement (wt%)σ
TiOAgTiOAg
AO-20 VA79.0 ± 0.116.4 ± 0.14.6 ± 0.20.50.50.2
B73.4 ± 0.222.4 ± 0.34.2 ± 0.10.20.20.1
AO-40 VC75.5 ± 0.119.9 ± 0.14.6 ± 0.30.40.40.2
D68.8 ± 0.322.0 ± 0.19.1 ± 0.10.40.50.2
AO-60 VE73.0 ± 0.222.7 ± 0.24.3 ± 0.20.40.40.1
F63.9 ± 0.328.3 ± 0.17.8 ± 0.10.30.40.3
AO-80 VG64.9 ± 0.226.5 ± 0.34.1 ± 0.10.40.20.1
H64.9 ± 0.127.2 ± 0.17.9 ± 0.30.40.40.2
AO-120 VI64.0 ± 0.232.1 ± 0.23.8 ± 0.10.40.40.1
J52.4 ± 0.145.0 ± 0.12.6 ± 0.10.30.30.1
Table 3. Electrochemical data on OCP and Tafel curves of Ti-Ag samples.
SamplesEocp/mV
(vs. SCE)
Ecorr/mV
(vs. SCE)
icorr/(10−8 A·cm−2)Rp0/104 Ω·cm2
AO-0 V−244.138−220.091 ± 0.01221.477 ± 0.0311.55 ± 0.23
AO-20 V107.62117.035 ± 0.0162.241 ± 0.02833.3 ± 0.16
AO-40 V−82.112−115.281 ± 0.0143.661 ± 0.01519.8 ± 0.19
AO-60 V−99.991−94.963 ± 0.0192.969 ± 0.03218.2 ± 0.13
AO-80 V−115.687−136.163 ± 0.0132.378 ± 0.01612.6 ± 0.24
AO-120 V−106.042−164.884 ± 0.0179.411 ± 0.02220.2 ± 0.15
Table 4. Electrochemical data of Ti-Ag samples in 0.9% NaCl solution from Nyquist and Bode.
SamplesRS/Ω·cm2QP/10−5 F·cm−2nRP/104 Ω·cm2
AO-0 V105.7 ± 0.632.4 ± 0.120.915 ± 0.0057.81 ± 0.12
AO-20 V158.2 ± 0.92.48 ± 0.070.889 ± 0.00244.82 ± 0.09
AO-40 V112.3 ± 0.52.59 ± 0.030.828 ± 0.00330.12 ± 0.17
AO-60 V145.4 ± 0.87.95 ± 0.030.700 ± 0.00629.28 ± 0.15
AO-80 V115.6 ± 0.95.91 ± 0.050.669 ± 0.00428.73 ± 0.17
AO-120 V149.9 ± 0.77.71 ± 0.060.649 ± 0.00532.67 ± 0.16
Disclaimer/Publisher’s Note: The statements, opinions and data contained in all publications are solely those of the individual author(s) and contributor(s) and not of MDPI and/or the editor(s). MDPI and/or the editor(s) disclaim responsibility for any injury to people or property resulting from any ideas, methods, instructions or products referred to in the content.

