Article

Galvanic Corrosion Behavior of the X80 Steel Welded Joint

1
Zhejiang Engineering Research Center of Advanced Water Conservancy Equipment, Zhejiang University of Water Resources and Electric Power, Hangzhou 310018, China
2
School of Materials Science and Engineering, China University of Petroleum (East China), Qingdao 266580, China
*
Author to whom correspondence should be addressed.
Coatings 2024, 14(5), 528; https://doi.org/10.3390/coatings14050528
Submission received: 2 April 2024 / Revised: 20 April 2024 / Accepted: 22 April 2024 / Published: 24 April 2024
(This article belongs to the Special Issue Manufacturing and Surface Engineering IV)

Abstract

:
Wire beam electrode techniques and classical electrochemical techniques were used to investigate the effect of the area ratio of each part of the welded joint on the galvanic corrosion behavior. The results showed that the order of the corrosion current density of the different regions in the simulated X80 steel welded joint was as follows: coarse-grained heat-affected zone > fine-grained heat-affected zone > intercritical heat-affected zone > base metal > weld metal. As the area ratio of weld metal increased, the galvanic potential shifted positively, the maximum anode galvanic current density increased and the main anode galvanic effect increased. On the other hand, as the area ratio of the base metal and the heat-affected zone decreased, the coupled potential shifted negatively and the maximum anode galvanic current density decreased. The galvanic corrosion intensity of the simulated X80 steel welded joint increased as the area ratio of the weld metal decreased and increased as the area ratio of the heat-affected zone and base metal increased. To enhance corrosion resistance, it is advisable to choose a shape with a larger groove to increase the WM area in the welded joint. Additionally, selecting a welding method with lower heat input and a higher energy density can help reduce the HAZ area in the welded joint.

1. Introduction

The natural gas produced in oil and gas fields is often accompanied by contaminants such as water, carbon dioxide and organic acids [1,2]. These contaminants combine to form a highly corrosive service environment. Pipeline transportation is the primary means of transporting oil and gas. Welding is the most important and widely used jointing method in pipeline construction. Welding is a non-equilibrium, instantaneous and non-uniform physical-chemical metallurgical process. A welded joint is a heterogeneous structure consisting of base metal (BM), weld metal (WM), and heat-affected zone (HAZ) [3]. Differences exist in the composition, microstructure, and electrochemical properties of each part of the welded joint after the welding process of uneven heating and cooling. Welded joints are often the weakest link in the pipeline under the combined conditions of the internal corrosion environment, the load and the residual stress. Localized corrosion in welded joints has been cited as the primary factor in numerous pipeline failures [4,5,6].
Pagotto et al. [7] investigated the corrosion behavior of a 20-carbon steel welded joint in a NaCl solution using electrochemical impedance spectroscopy. Their study found that both BM and WM exhibited single capacitive reactance arc characteristics. The charge transfer resistance of BM initially increased and then decreased with increasing immersion time due to the formation of corrosion products, which are loose and porous, and the limited protection of the substrate. However, the charge transfer resistance of WM showed a fluctuating trend during immersion caused by the equilibrium between the formation and dissolution reactions of corrosion products. The corrosion of the welded joint consists of both macroscopic and microscopic corrosion cells. As a result, its corrosion process is highly localized and exhibits changes and transitions over time [8]. Traditional electrochemical testing techniques, such as EIS, provide average information for each part of a weld but do not provide specific electrochemical data for different regions [9,10].
The initiation and development of local corrosion take place in small areas; therefore, it is necessary to use research methods with smaller spatial resolution, such as wire-beam electrode techniques [11] and micro-electrochemical techniques [12]. da Silva et al. [13] investigated galvanic coupling effects and micro-electrochemical activity of the welded joint in friction stir-welded 2098-T351 Al-Cu-Li alloy using an efficient combination of SVET and SECM. SVET maps revealed that the HAZ behaved anodic to the welded joint and was more prone to the development of severe localized corrosion sites compared to the welded joint, and SECM revealed that intense acidification appeared at the severe localized corrosion sites in the HAZ. Fushimi et al. [14] cut the welded joint of low-carbon steel into nine electrodes with a working area of 1.0 cm2 according to the different zones of the welded joint and then reconstructed it. The distribution characteristics of the galvanic current were obtained by the multi-channel electrode test system. The polarity of the BMs was found to be related to their distance from the WM, the concentration of the solution, and the soaking time. Liu et al. [15] cut the TA2 welded joint to prepare a simulated welded joint with a BM, HAZ, and WM electrode area ratio of 4:2:1. The wire beam electrode results showed that WM was the main anode accelerating corrosion, while at high flow rates, the current polarity of WM was reversed.
In the above work, the HAZ electrode specimen was obtained by directly cutting the HAZ of the original welded joint. However, because the proportion of HAZ in the weld is small, the mixed structure of the HAZ and the weld metal or base metal may be obtained by cutting; moreover, the HAZ can be further divided into coarse-grained heat-affected zone (CGHAZ), fine-grained heat-affected zone (FGHAZ) and intercritical heat-affected zone (ICHAZ) due to different thermal cycling processes, and the heterogeneity of the microstructure in different partial zones is ignored by the direct cutting. In addition, numerous researchers have conducted extensive studies on galvanic corrosion behavior and the effect of the cathode/anode area ratio [16,17,18,19]. However, limited research has been conducted on the effect of the area ratio of each component of the welded joint on its localized corrosion behavior.
In this paper, discrete, thermal simulation, and modular reconstruction methods were used to simulate and reconstruct the X80 steel welded joints. The effect of the area ratio of each part of the welded joint on the galvanic corrosion behavior was investigated using the array electrode testing technique. This study aims to provide a better understanding of the corrosion of the welded joint and the vital information needed for engineering decisions regarding corrosion protection strategies.

2. Materials and Methods

2.1. Experimental Materials

The experimental material was X80 pipeline steel. Two pieces of X80 steel with a thickness of 21.4 mm were welded by shielded metal arc welding technology for the preparation of the X80 steel welded joint. The chemical compositions (mass%) of the X80 steel BM and the WM are shown in Table 1.
The HAZ specimens used were treated with the help of a Gleeble-3500 thermal/mechanical simulation test machine on BM specimens of X80 steel, and the microstructure samples of each HAZ subzone were prepared. The thermal simulation process was as follows: The peak temperatures were 1100 °C, 950 °C and 800 °C, respectively, at a heating rate of 130 °C/s; the dwell time at high temperatures is 1 s; the cooling time (t8/5) and then the thermal simulation samples of the CGHAZ, FGHAZ and ICHAZ were obtained by cooling at a rate of t8/5 to 15 s. An area of 10 mm × 1.0 mm × 15 mm of each array electrode was fabricated by wire cutting. An array electrode with a size of 10 mm × 1.0 mm × 15 mm was obtained by wire cutting, and the simulated welded joint of X80 steel was prepared by the modular method.
As shown in Figure 1, two simulated welded joints of X80 steel with different area ratios, including BM:HAZ:WM = 17:4:4 and BM:HAZ:WM = 17:3:4, were prepared in this paper to study the influence of medium factors and different area ratios on the corrosion behavior of simulated welded joints of X80 steel. Using the array electrode testing system for electrode coupling/uncoupling control, the welded joint of BM:HAZ:WM = 17:3:3 and BM:HAZ:WM = 8:3:4 can be obtained through the welded joint of BM:HAZ:WM = 17:3:4. The simulated welded joint of X80 steel with BM:HAZ:WM = 17:4:4 consists of 25 microelectrodes; from right to left, the first four are WM microelectrodes, and the adjacent ones are 4 HAZ microelectrodes, including 2 CGHAZ microelectrodes, 1 FGHAZ microelectrode and 1 ICHAZ microelectrode, and the rest are BM microelectrodes. The simulated welded joint of X80 steel with BM:HAZ:WM = 17:3:4 consists of 24 microelectrodes; from right to left, the first 4 are WM microelectrodes, and the adjacent ones are 3 HAZ microelectrodes, including 1 CGHAZ microelectrode, 1 FGHAZ microelectrode and 1 ICHAZ microelectrode, and the rest are BM microelectrodes.
The coupling/uncoupling states of the microelectrodes were controlled by high-speed matrix switches to obtain simulated welded joints of X80 steel with different area ratios. The surface of the simulated X80 steel welded joint specimens was gradually ground with silicon carbide papers from 400 to 1000 grit, step by step, then washed with deionized water, cleaned with acetone and absolute ethanol to remove grease, dehydrated and dried with cold air.

2.2. Solution

The solution used was a 3% NaCl solution saturated with CO2. The experiments were carried out at atmospheric pressure and 40 ± 1 °C in a thermostatic bath. Before testing, N2 was introduced into the solution for 4 h to fully deoxidize it and then CO2 was introduced for 4 h to fully saturate it. The electrolytic cell was sealed after the sample was immersed and CO2 was introduced into the electrolytic cell every 8 h during the immersion period to ensure saturation of CO2 in the test solution.

2.3. Test Method

Classical electrochemical measurements were performed using a typical three-electrode system, with a saturated calomel electrode (SCE, 0.241 V vs. SHE) as the reference electrode and a platinum gauze as the counter electrode. The dimensions of the BM and WM specimens were 10 mm × 10 mm × 2.5 mm, which were cut from the X80 steel welded joint. Cutting from the center of the X80 steel thermal simulation samples, the dimensions of the CGHAZ, FGHAZ, and ICHAZ specimens were 10 mm × 10 mm × 2.5 mm. The exposed surface area of each BM, ICHAZ, FGHAZ, CGHAZ and WM specimen was 1.0 cm2. These electrodes were ground with 400, 600, 800 and 1000 grit silicon carbide papers, and then the electrodes were rinsed with deionized water, degreased in ethanol, and air-dried. After immersion in the solution for 30 min, the open circuit potential (OCP) was recorded for 30 min to ensure a steady state was achieved. The potential of the potentiodynamic polarization tests was scanned from −0.25 to +0.25 V (vs. OCP) at a scanning rate of 0.333 mV·s−1.
The potential and galvanic current (Ig) of the simulated X80 steel welded joints were measured using an array electrode testing system [20]. The testing system was controlled and programmed by LabVIEW 2018. The array electrode testing system was established on a PXI/PXIe hardware platform, including a NI PXIe 4081 digital multimeter module, a NI PXI 4022 weak current amplifier, and a NI PXI 2535 high-speed matrix switch module.

2.4. Galvanic Corrosion Characterization

The galvanic effect (γ) (Equation (1)) can directly reflect the degree of dissolution acceleration caused by electrical contact between the anode metal and the cathode metal in the galvanic couple [21].
γ = i a i corr
where ia and icorr denote the corrosion current density of the anode metal before and after coupling, respectively.
In addition, in galvanic corrosion, the area ratio of the cathode and anode in the galvanic couple and the maximum galvanic current density of the anode were found to affect the galvanic corrosion intensity. Therefore, based on the standard deviation and coefficient of variation (Cv) in statistics, the galvanic corrosion intensity factor (g) shown in Equation (2) was used to characterize the intensity of galvanic corrosion [22].
g = j = 1 N a i g , max i g , j 2 N a 1 1 i g , max N c N t
where ig,max and ig,j represent the maximum anode galvanic current density and the anode galvanic current density at a given time, respectively, Nc represents the number of cathodic electrodes, Nt represents the total number of electrodes, and Na represents the number of anodic electrodes.

3. Results and Discussion

3.1. Microstructures of the Simulated X80 Steel Welded Joint

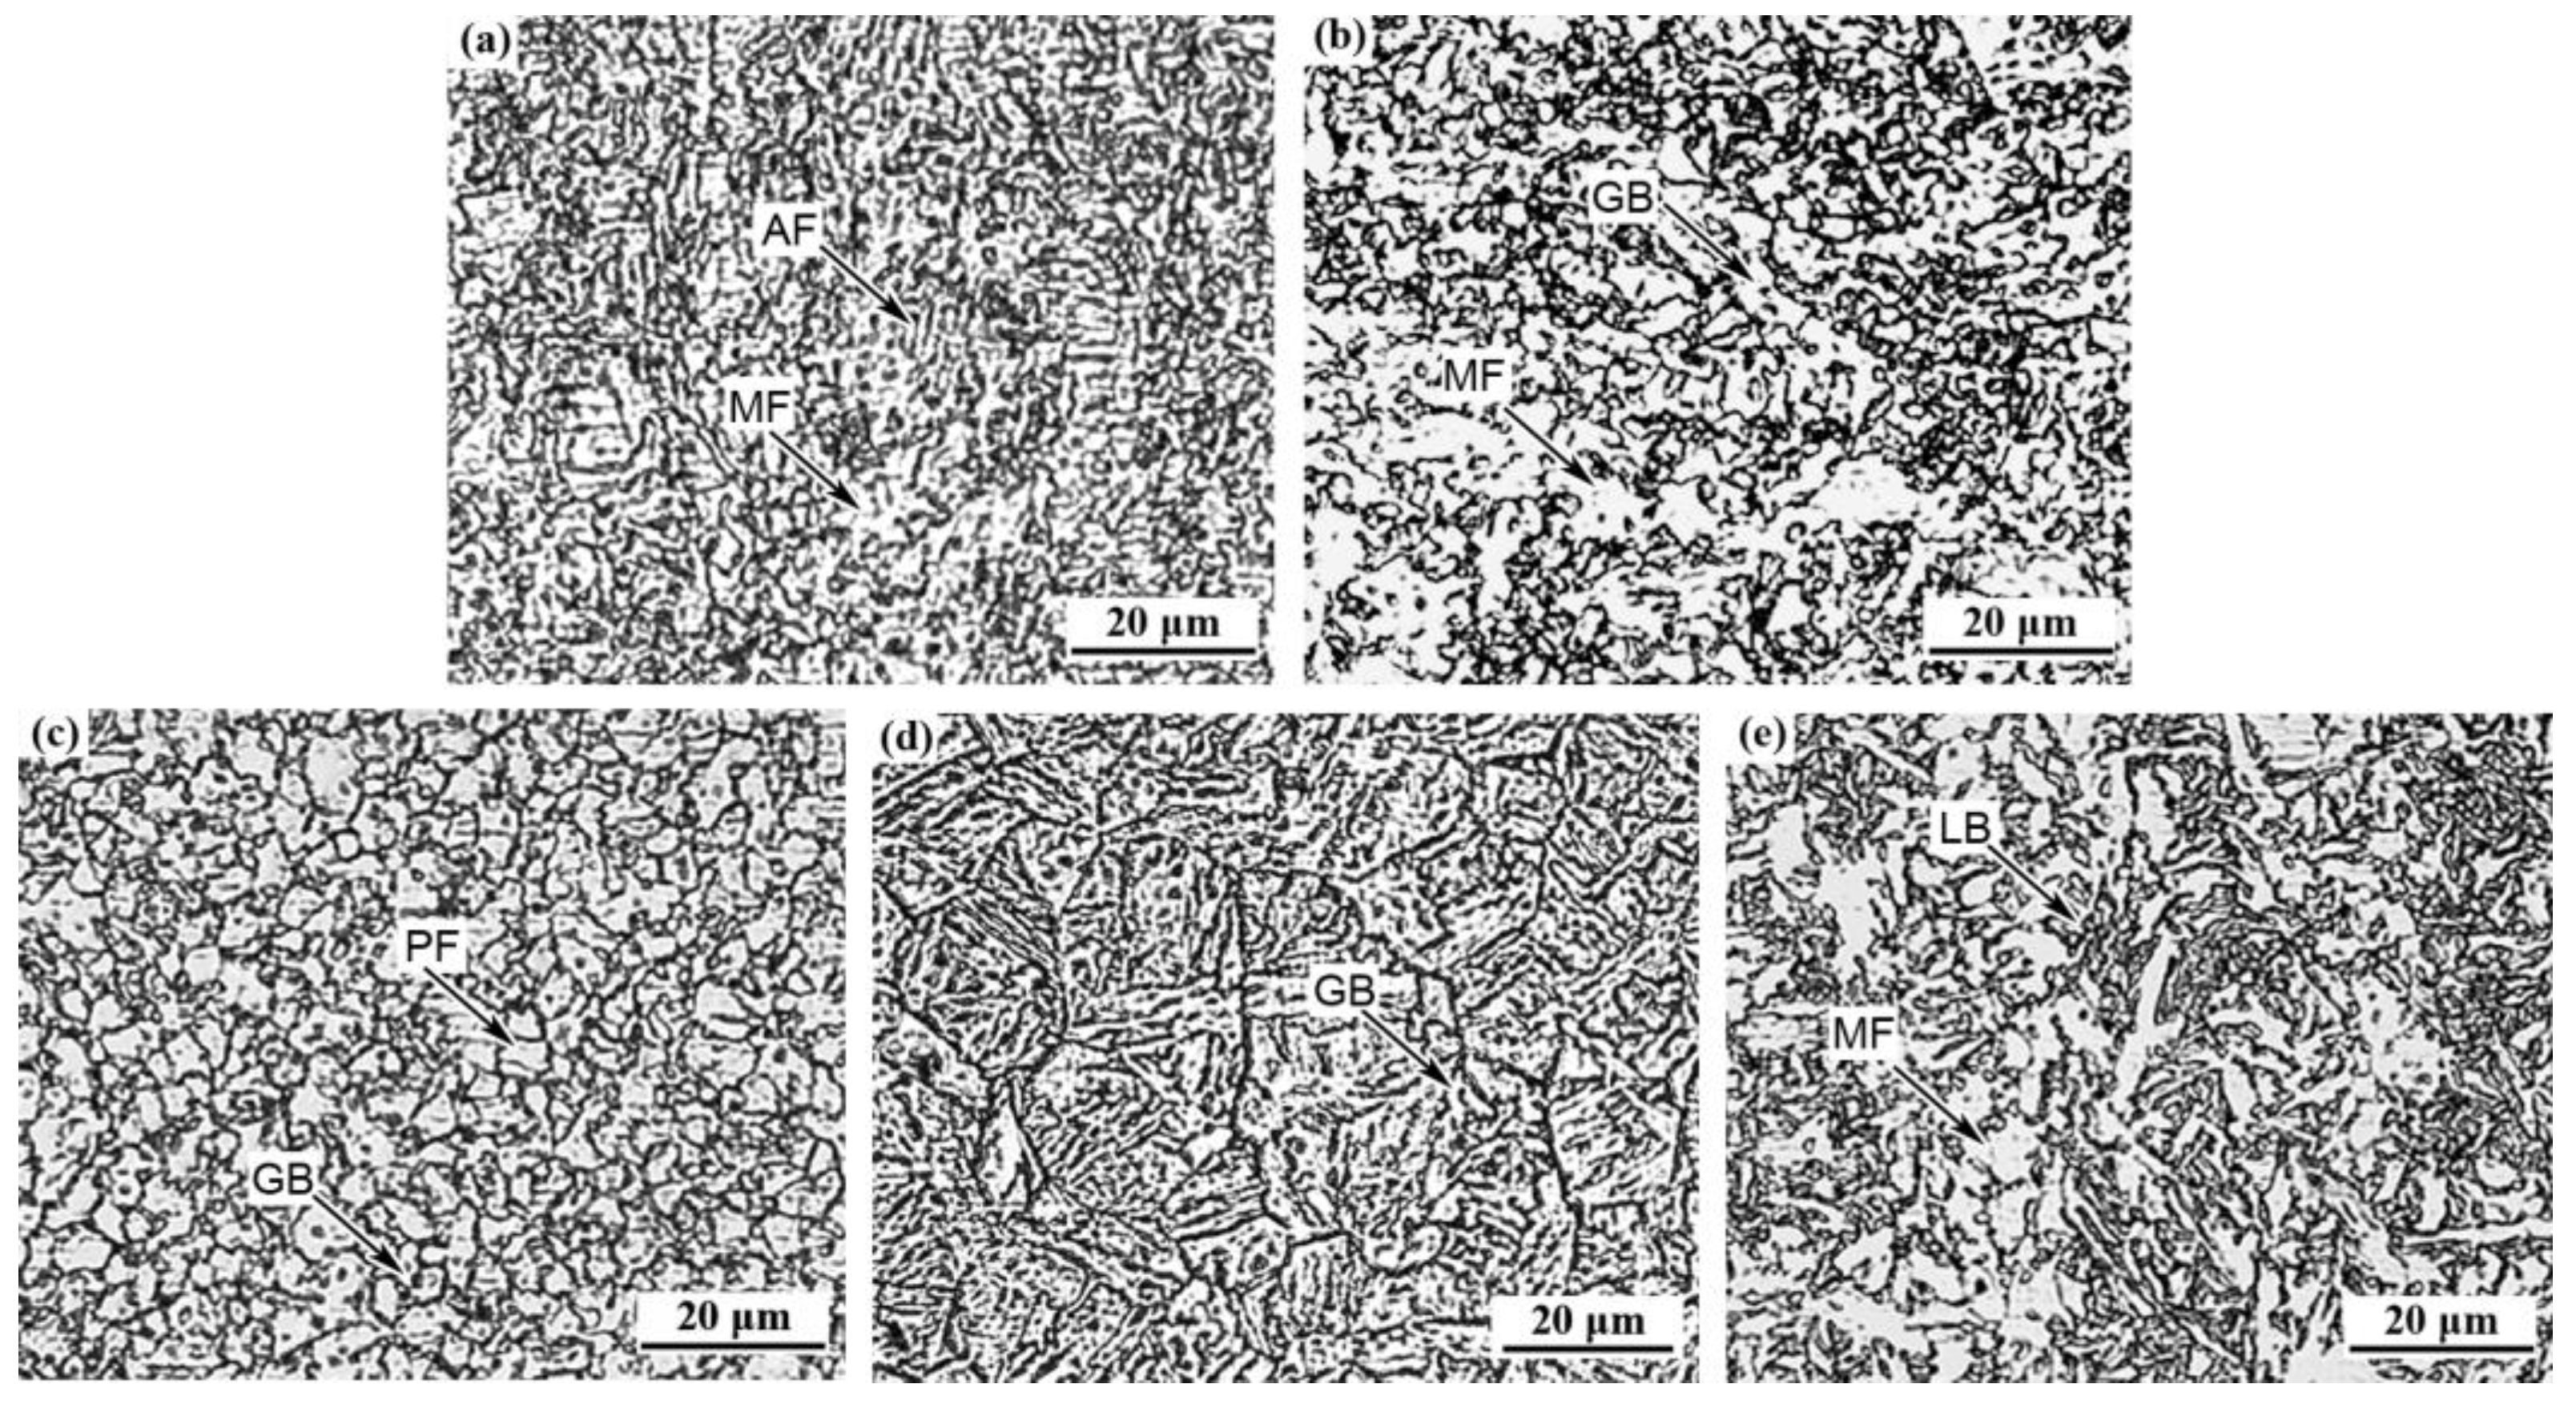
Figure 2 shows the microstructures of the simulated X80 steel welded joint. The microstructure of the BM (Figure 2a) consisted of acicular ferrite and massive ferrite. The microstructure of ICHAZ (Figure 2b) was primarily composed of massive ferrite and granular bainite, while that of FGHAZ (Figure 2c) was composed of polygonal ferrite and granular bainite. At higher heating temperatures, the microstructure of the CGHAZ (Figure 2d) was mainly characterized by a distribution of granular bainite with relatively coarse prior austenite grain size, while the microstructure of the WM (Figure 2e) was mainly composed of massive ferrite and grain boundary ferrite. Microstructural inhomogeneity results in different electrochemical properties in different regions, and X80 steel welded joints were prone to galvanic corrosion [23,24].

3.2. Polarization Behavior of the Simulated X80 Steel Welded Joint

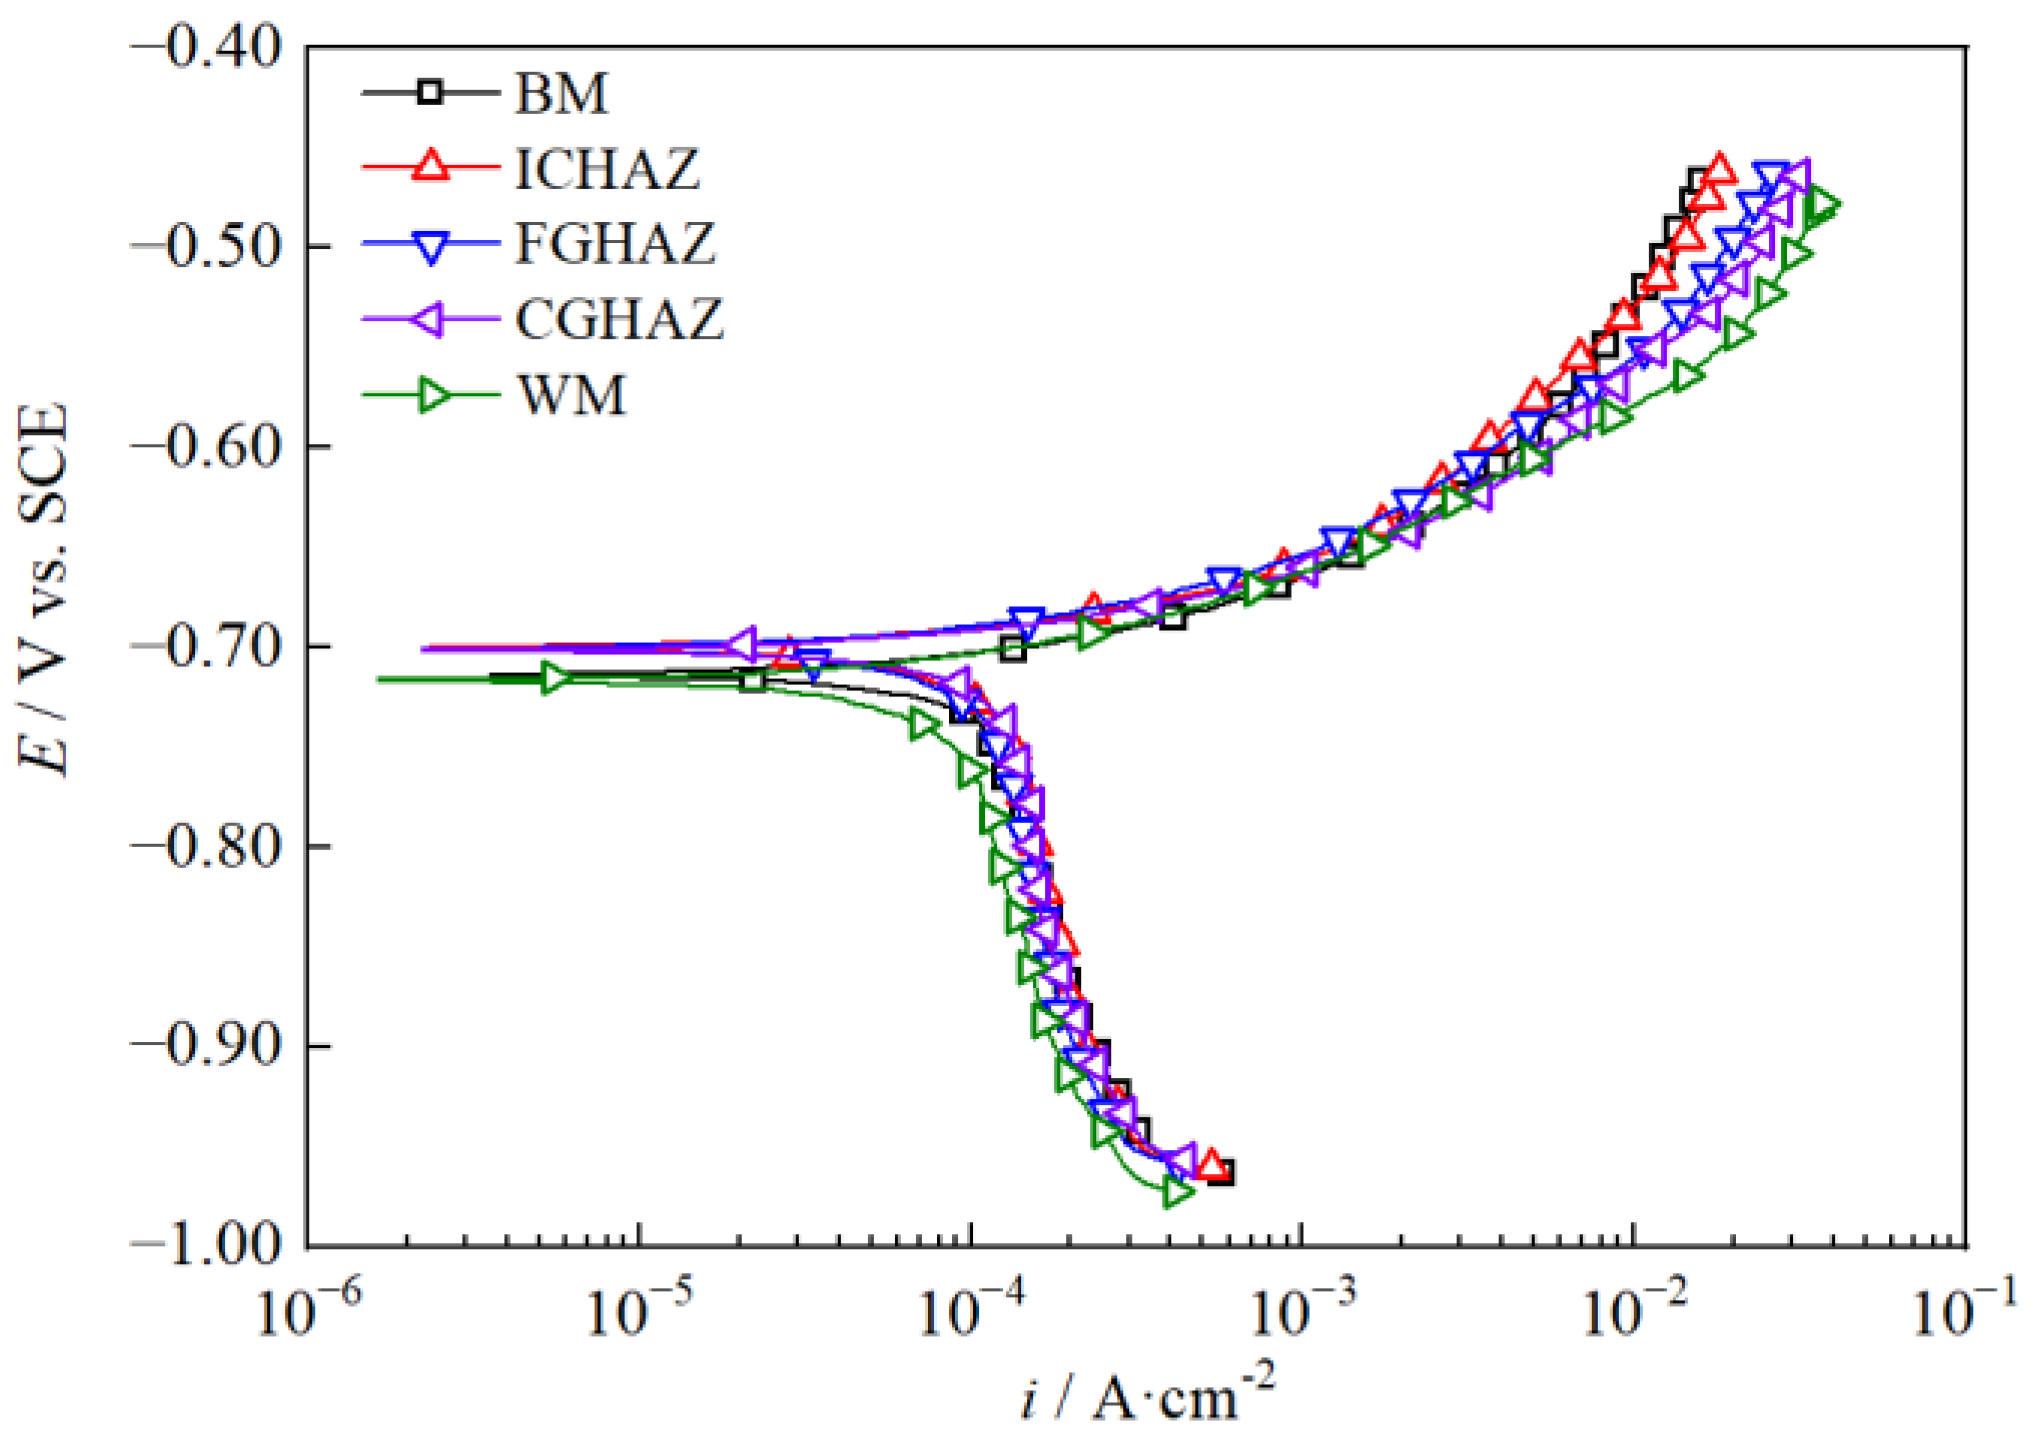
The potentiodynamic polarization curves of the isolated regions of the simulated X80 pipeline steel welded joint in CO2-saturated solution are shown in Figure 3. As a weak acid, H2CO3 partially dissociates to give hydrogen ions, that is, H2CO3 acts as a “reservoir” of hydrogen ions [25].
CO 2 + H 2 O H + + HCO 3
H + + HCO 3 H 2 CO 3
H 2 CO 3 H + + HCO 3
HCO 3   H + + CO 3 2
The cathodic reaction of steel in an acidic solution is the reduction of hydrogen ions [26]:
2 H + + 2 e H 2
This realization indicates that the anodic processes of different regions are activated, while the cathodic branch exhibits mixed control. As mentioned above, the concentration of H+ ions and their related transport to the electrode surface greatly affect the cathodic process.
Table 2 shows the corrosion potential (Ecorr), the anodic Tafel slope (ba), the corrosion current density (icorr), and the limiting current density (iL) of the isolated regions in the X80 steel welded joint, which were obtained from the potentiodynamic polarization curves by employing the Tafel extrapolation method [27]. The maximum potential difference over the surface of the welded joint was 16 mV, which indicates that the polarization of these regions was weak. Ecorr was the most positive in FGHAZ and ICHAZ and the most negative in WM. Compared to the BM and HAZ, the composition of the WM showed a low content of Cr and Ni, which results in relatively lower potential [28,29]. This result shows that WM had the lowest corrosion current density, and HAZ had a higher corrosion current density than BM and WM. This indicates that the microstructures of granular bainite and ferrite had the highest corrosion current density compared to grain boundary ferrite and acicular ferrite.
Minor differences exist in both corrosion current density and corrosion potential between subregions in the HAZ. Moreover, the cathodic branch of the subregions in the HAZ was almost identical. The anodic Tafel slope of the WM was smaller than that of the other regions, indicating that the WM can be polarized more easily. When the same potential difference is applied to different regions in the X80 steel welded joint, the changes in current density of the WM are more obvious than those in the other regions. With different Ecorr values, galvanic effects occur between different regions when immersed in the electrolyte. The results show that, in the test solution, BM and HAZ have the potential to act as cathodes relative to the WM.

3.3. Effect of Area Ratio on Potential

Figure 4 shows the galvanic potential (Eg) and potential distribution of each microelectrode in a 3% NaCl solution saturated with CO2. The study focused on simulated X80 steel welded joints with varying area ratios, tested at 40 °C, and with different coupling times. The potential distributions of each region of the simulated X80 steel welded joints were different, in which the WM potential was the most negative and the potentials of FGHAZ, ICHAZ, CGHAZ, and BM were relatively positive. With the prolongation of immersion time, the potential of HAZ was gradually positive compared to that of BM. The potential of the simulated X80 steel welded joints shifted positively with increasing immersion time and was stable after 24 h due to the formation of protective corrosion scales, reducing the corrosion tendency [30].
In Figure 4a, the maximum potential difference between the microelectrodes of the simulated X80 steel welded joint with BM:HAZ:WM = 17:4:4 was 21.9 mV and stabilized at 17 mV with increasing immersion time, and after 36 h, the Eg value was −0.696 V. In Figure 4b, the maximum potential difference between the microelectrodes of the simulated X80 steel welded joint with BM:HAZ:WM = 17:3:4 was 20.9 mV and stabilized at 20.0 mV with increasing immersion time, and after 36 h, the Eg was −0.701 V. In Figure 4c, the maximum potential difference between the microelectrodes of the simulated X80 steel welded joint with BM:HAZ:WM = 17:3:3 was 22.7 mV and stabilized at 18.3 mV with increasing immersion time, and after 36 h, the Eg was −0.699 V. In Figure 4d, the maximum potential difference between the microelectrodes of the simulated X80 steel welded joint with BM:HAZ:WM = 17:3:3 was 21.0 mV and stabilized at 14.0 mV with increasing immersion time, and after 36 h, the Eg was −0.703 V. Comparing Figure 4a with Figure 4b, it can be seen that the area of CGHAZ in HAZ was reduced by 0.1 cm2, and the galvanic potential of the simulated X80 steel welded joint had a negative shift of about 5 mV. According to mixed potential theory, the anode metal and the cathode metal are polarized toward each other [31]. The galvanic potential of the simulated X80 steel welded joint is between the most positive potential and the most negative potential. The CGHAZ potential was greater than that of the simulated X80 steel welded joint, and the area of CGHAZ decreased, resulting in a negative Eg value. When comparing Figure 4b,c, it can be seen that the area of WM in the simulated X80 steel welded joint decreased by 0.1 cm2, and Eg was positively shifted by 2 mV. Comparing Figure 4b with Figure 4d, it can be seen that the area of BM in the simulated X80 steel welded joint was reduced by 0.9 cm2 and the Eg value was negatively shifted by 2 mV. Changes in Eg value show that the area changes of WM and HAZ in the simulated X80 steel welded joint have a greater influence on the Eg value than in the other regions.

3.4. Effect of Area Ratio on Galvanic Current Density

Figure 5 shows the galvanic current density distribution of each microelectrode in a 3% NaCl solution saturated with CO2 for the simulated X80 steel welded joints with different area ratios at 40 °C and different coupling times. The galvanic current density of WM in the simulated X80 steel welded joint was anodic, and the galvanic current density of BM and HAZ was cathodic. The WM acted as the anode of the simulated X80 steel welded joint, whereas the HAZ and BM acted as cathodes. The galvanic current density of all parts of the simulated welded joint of X80 steel decreased with increasing immersion time, and the maximum galvanic current density of the anode appeared at the junction of WM and HAZ.
Comparison of Figure 5a with Figure 5b shows that the area of the HAZ was reduced by 25%, i.e., the area of the cathodic metal in the galvanic couple was reduced, the maximum anodic galvanic current density on the surface of the simulated X80 steel welded joint was reduced by 15%, and the total galvanic current density was reduced.
Comparison of Figure 5b and Figure 5c shows that the area of WM in the simulated X80 steel welded joint was reduced by 25%, i.e., the area of anodic metal in the galvanic couple was reduced, the maximum anodic galvanic current density on the surface of the simulated X80 steel welded joint increased by 38%, and the total galvanic current density increased. By comparing Figure 5b and Figure 5d, the area of BM in the simulated X80 steel welded joint was reduced by 53%, that is, the area of cathodic metal in the galvanic pair was reduced, and the maximum anodic galvanic current density on the surface of the simulated X80 steel welded joint was reduced by 17%.
It can be concluded that WM and HAZ in the simulated X80 steel welded joint had a greater influence on the maximum anodic current density from the variation of the maximum anodic current density on the surface of the simulated X80 steel welded joint. As the cathode area increased, the maximum anode galvanic current density increased, the cathode area decreased, the maximum anode galvanic current density decreased. As the anode area decreased, the maximum anode galvanic current density increased. The variation was consistent with the law of influence of change in anode-cathode area ratio on galvanic corrosion [32]. When there is a risk of galvanic corrosion, increasing the ratio between the anode and cathode areas can help mitigate detrimental effects on the material. The change in area of the anode and cathode near the anode-cathode interface has a more significant impact on galvanic corrosion compared to the cathode part that is farther away from the anode. In the research system of this paper, it was found that increasing the WM and reducing the HAZ area can effectively decrease the galvanic corrosion intensity of welded joints.

3.5. Effect of Area Ratio on Galvanic Corrosion Intensity

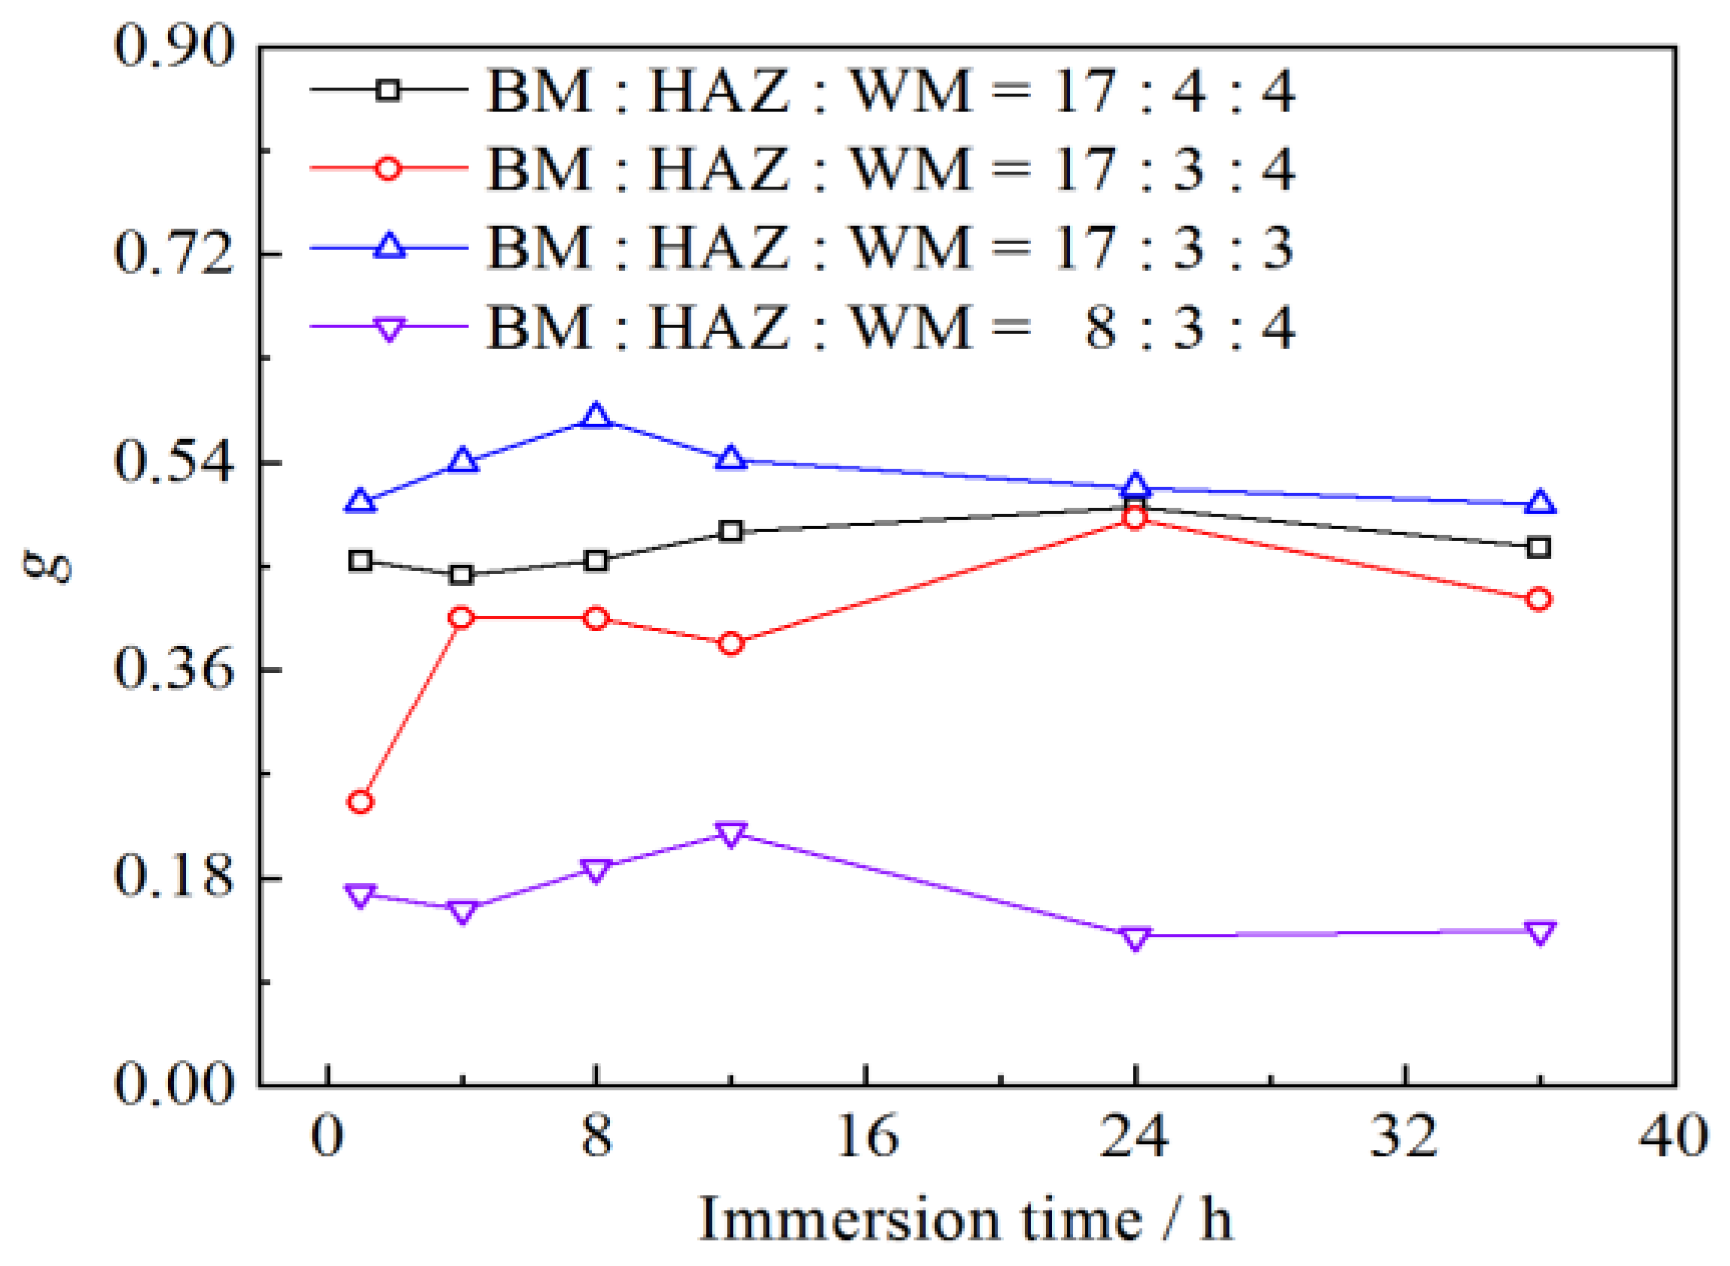
g was used to quantify the influence of the area ratio of different regions in the simulated X80 steel welded joint on galvanic corrosion, as shown in Figure 6. The galvanic corrosion intensity of the simulated X80 steel welded joint with different area ratios generally increased initially, then decreased and tended to stabilize. For BM:HAZ:WM = 17:3:3, the galvanic corrosion of the simulated X80 steel welded joint was the worst, and the value of g was always greater than 0.5. For BM:HAZ:WM = 8:3:4, the galvanic corrosion of the simulated weld of X80 steel was the most minimal and the value of g was always less than 0.3. From the changes in the value of g, it can be seen that as the area of WM decreases, the galvanic corrosion intensity increases, while the area of BM and HAZ decreases, the galvanic corrosion intensity decreases. The area changes in WM have a greater influence on galvanic corrosion.
Table 3 shows the galvanic effect of the main anode (microelectrode with maximum galvanic current density) of the simulated X80 steel welded joint with different area ratios under different coupling times. It can be concluded from Table 3 that the galvanic effect of the main anode of the simulated X80 steel welded joint with BM:HAZ:WM = 17:4:4 was stable between 1.7 and 1.9, the galvanic effect of the main anode of the simulated X80 steel welded joint with BM:HAZ:WM = 17:3:4 was stable about 1.7, the galvanic effect of the main anode of the simulated X80 steel welded joint with BM:HAZ:WM = 17:3:3 was stable around 2.0, and the galvanic effect of the main anode of the simulated X80 steel welded joint with BM:HAZ:WM = 8:3:4 was stable around 1.6.
Consistent with the conclusion illustrated in Figure 6, the area of the WM acting as an anode decreases, leading to an increase in the galvanic effect of the main anode. Conversely, the area of the BM and HAZ acting as cathodes decreases, resulting in a decrease in the galvanic effect of the main anode in the simulated X80 steel welded joint. It is important to note that the area of the WM is directly influenced by the type and size of the groove, with a larger groove leading to a larger WM area in the welded joint [33]. The area of the HAZ is primarily determined by the heat input, which is influenced by welding current, welding voltage, welding speed, and welding method [34]. Heat input increases with welding current and voltage but decreases with welding speed. Welding methods with a higher energy density tend to have lower heat input values. To minimize the area of the HAZ, it is advisable to use a welding method with lower heat input and a higher energy density.

4. Conclusions

Wire beam electrode techniques and classical electrochemical techniques were employed to study the galvanic corrosion behavior of the X80 steel welded joint. The results showed that the order of the corrosion current density of the different regions in the simulated X80 steel welded joint was as follows: CGHAZ > FGHAZ > ICHAZ > BM > WM. The WM acted as the anode of the simulated X80 steel welded joint, while the HAZ and BM acted as cathodes. The following conclusions are drawn:
(1)
As the anode area decreased, the galvanic potential shifted positively, the maximum galvanic current density increased, the galvanic corrosion intensity increased, and the galvanic effect of the main anode decreased. The impact of the cathode area was contrary.
(2)
The variation of the area of the WM and the HAZ has a greater influence on the intensity of the galvanic corrosion.
(3)
To enhance corrosion resistance, it is advisable to choose a shape with a larger groove to increase the WM area in the welded joint. Additionally, selecting a welding method with lower heat input and a higher energy density can help reduce the HAZ area in the welded joint.

Author Contributions

Conceptualization Y.L.; Data curation J.S.; Methodology, Y.Y. and G.F.; Supervision J.P.; Writing—original draft Y.L. and F.L.; Writing—review and editing, Y.L. and F.L. All authors have read and agreed to the published version of the manuscript.

Funding

This work was supported by Zhejiang Provincial Natural Science Foundation of China (No. LY21E010001) and College Student Innovation and Entrepreneurship Training Program (S202311481059).

Institutional Review Board Statement

Not applicable.

Informed Consent Statement

Not applicable.

Data Availability Statement

Data are available from the corresponding author upon reasonable request.

Conflicts of Interest

The authors declare no conflicts of interests.

References

  1. Xu, X.; Zhu, M.; Wang, C.; Zhang, J.; Liu, C.; Song, Y.; Wang, Y.; Gu, S.; Li, Y. Effect of FeCO3 corrosion product scale on hydrogen adsorption and permeation of pipeline steel in gaseous hydrogen-blended natural gas transportation. Corros. Sci. 2024, 229, 111880. [Google Scholar] [CrossRef]
  2. Zhang, G.; Cheng, Y. Localized corrosion of carbon steel in a CO2-saturated oilfield formation water. Electrochim. Acta 2011, 56, 1676–1685. [Google Scholar] [CrossRef]
  3. Li, Y.; Tang, X.; Li, Y. Research progress of localized corrosion of welded joints. Mater. Rev. 2017, 31, 158–165. [Google Scholar]
  4. Zhang, D.; Liu, R.; Liu, Y.; Xing, S.; Yang, L.; Wei, E.; Dou, X. Multiscale characterization of seawater pipe erosion of B10 cop-per–nickel alloy welded joints. Sci. Rep. 2022, 12, 2164. [Google Scholar] [CrossRef] [PubMed]
  5. Zhang, S.; Xie, F.; Li, X.; Luo, J.; Su, G.; Zhu, L.; Chen, Q. Failure analysis of the leakage in girth weld of bimet-al composite pipe. Eng. Fail. Anal. 2023, 143, 106917. [Google Scholar]
  6. Kosturek, R.; Wachowski, M.; Sniezek, L.; Gloc, M. The influence of the post-weld heat treatment on the microstructure of in-conel 625/carbon steel bimetal joint obtained by explosive welding. Metals 2019, 9, 246. [Google Scholar] [CrossRef]
  7. Pagotto, J.F.; Montemor, M.F.; Recio, F.J.; Motheo, A.J.; Simões, A.M.; Herrasti, P. Visualisation of the galvanic effects at welds on carbon steel. J. Brazil. Chem. Soc. 2015, 26, 667–675. [Google Scholar] [CrossRef]
  8. Zhu, J.; Xu, L.; Feng, Z.; Frankel, G.; Lu, M.; Chang, W. Galvanic corrosion of a welded joint in 3Cr low alloy pipeline steel. Corros. Sci. 2016, 111, 391–403. [Google Scholar] [CrossRef]
  9. Bastos, A.C.; Simões, A.; Ferreira, M. Corrosion of electrogalvanized steel in 0.1 M NaCl studied by SVET. Port. Electrochim. Acta 2002, 21, 371–387. [Google Scholar] [CrossRef]
  10. Maqbool, A.; Zaman Khan, N. Microstructure and corrosion behavior of thermo-mechanically processed rare earth Mg alloy: Effect of friction stir processing. Mater. Lett. 2024, 359, 135934. [Google Scholar] [CrossRef]
  11. Dou, X.; He, Z.; Zhang, X.; Liu, Y.; Liu, R.; Tan, Z.; Zhang, D.; Li, Y. Corrosion behavior and mechanism of X80 pipeline steel welded joints under high shear flow fields. Colloid Surface A 2023, 665, 131225. [Google Scholar] [CrossRef]
  12. Li, Q.; Yao, Q.; Sun, L.; Ma, H.; Zhang, C.; Wang, N. Effect of micro-galvanic corrosion on corrosion fatigue cracking of the weld joint of high strength bridge steel. Int. J. Fatigue 2023, 170, 107568. [Google Scholar] [CrossRef]
  13. da Silva, R.M.P.; Izquierdo, J.; Milagre, M.X.; Betancor-Abreu, A.M.; de Oliveira, L.A.; Antunes, R.A.; Souto, R.M.; Costa, I. On the local corrosion behavior of coupled welded zones of the 2098-T351 Al-Cu-Li alloy produced by Friction Stir Welding (FSW): An amperometric and potentiometric microelectrochemical. Electrochim. Acta 2021, 373, 137910. [Google Scholar] [CrossRef]
  14. Fushimi, K.; Naganuma, A.; Azumi, K.; Kawahara, Y. Current distribution during galvanic corrosion of carbon steel welded with type-309 stainless steel in NaCl solution. Corros. Sci. 2008, 50, 903–911. [Google Scholar] [CrossRef]
  15. Liu, R.; Liu, Y.; Zhang, D. Multiscale characterization of erosion of TA2 titanium alloy welded joints. Front. Mater. 2022, 9, 910319. [Google Scholar] [CrossRef]
  16. Shi, L.; Song, Y.; Zhao, P.; Wang, H.; Dong, K.; Shan, D.; Han, E. Variations of galvanic currents and corrosion forms of 2024/Q235/304 tri-metallic couple with multivariable cathode/anode area ratios: Experiments and modeling. Electrochimi. Acta 2020, 359, 136947. [Google Scholar] [CrossRef]
  17. Okonkwo, B.; Ming, H.; Wang, J.; Han, E.; Rahimi, E.; Davoodi, A.; Hosseinpour, S. A New method to determine the synergistic effects of area ratio and microstructure on the galvanic corrosion of LAS A508/309L/308L SS dissimilar metals weld. J. Mater. Sci. Technol. 2021, 78, 38–50. [Google Scholar] [CrossRef]
  18. Nakatsugawa, I.; Chino, Y. Effect of area ratio on the galvanic corrosion of AZX611 magnesium alloy/A6N01 aluminum alloy joint. J. Jpn. I. Met. 2021, 62, 1764–1770. [Google Scholar]
  19. Huang, Y.; Zhang, J.; Xuan, F.; Ma, Y. Modeling and prediction of galvanic corrosion for an overlaying welded structure. J. Mater. Eng. Perform. 2023. [Google Scholar] [CrossRef]
  20. Tang, X.; Li, J.; Wu, Y.; Hu, H. Electrochemical formation mechanism of micro-droplets on pure iron. Front. Chem. 2021, 9, 610738. [Google Scholar] [CrossRef]
  21. Li, Y.; Li, Y.; Yang, R.; Tang, X. Reconstruction of X80 pipeline steel welded joints and corrosion behavior in NACE solution. J. China Univ. Pet. Ed. Nat. Sci. 2018, 42, 153–160. [Google Scholar]
  22. Li, Y.; Li, Q.; Tang, X.; Li, Y. Reconstruction and characterization of galvanic corrosion behavior of X80 pipeline steel welded joints. Acta Metall. Sin. 2019, 55, 801–810. [Google Scholar]
  23. Tian, H.; Cui, Z.; Ma, H.; Zhao, P.; Yan, M.; Wang, X.; Cui, H. Corrosion evolution and stress corrosion cracking behavior of a low carbon bainite steel in the marine environments: Effect of the marine zones. Corros. Sci. 2022, 206, 110490. [Google Scholar] [CrossRef]
  24. Wang, X.; Huang, F.; Hu, Q.; Zhang, J.; Liu, J. Galvanic corrosion behavior of welded joint in marine atmosphere environment based on capillary microcell. NPJ Mater Degrad. 2024, 8, 1–12. [Google Scholar] [CrossRef]
  25. Kahyarian, A.; Schumaker, A.; Brown, B.; Nesic, S. Acidic corrosion of mild steel in the presence of acetic acid: Mechanism and prediction. Electrochim. Acta 2017, 258, 639–652. [Google Scholar] [CrossRef]
  26. Li, Y.; Xu, N.; Guo, X.; Zhang, G. The role of acetic acid or H+ in initiating crevice corrosion of N80 carbon steel in CO2-saturated NaCl solution. Corros. Sci. 2017, 128, 9–22. [Google Scholar] [CrossRef]
  27. McCafferty, E. Validation of corrosion rates measured by the Tafel extrapolation method. Corros. Sci. 2005, 47, 3202–3215. [Google Scholar] [CrossRef]
  28. Lu, Y.; Jing, H.; Han, Y.; Feng, Z.; Xu, L. Recommend design of filler metal to minimize carbon steel weld metal preferential corrosion in CO2-saturated oilfield produced water. Appl. Surf. Sci. 2016, 389, 609–622. [Google Scholar] [CrossRef]
  29. Yu, K.; Feng, S.; Ding, C.; Yu, P.; Huang, M. Improving anti-corrosion properties of CoCrFeMnNi high entropy alloy by introducing Si into nonmetallic inclusions. Corros. Sci. 2022, 208, 110616. [Google Scholar] [CrossRef]
  30. Zou, Y.; Wang, J.; Zheng, Y. Electrochemical techniques for determining corrosion rate of rusted steel in seawater. Corros. Sci. 2011, 53, 208–216. [Google Scholar] [CrossRef]
  31. Zeszut, R.; Landau, U. Determination of redox currents in electroless systems: Correct application of mixed potential analysis. J. Electrochem. Soc. 2019, 166, 737–741. [Google Scholar] [CrossRef]
  32. Jia, J.; Song, G.; Atrens, A. Influence of geometry on galvanic corrosion of AZ91D coupled to steel. Corros. Sci. 2006, 48, 2133–2153. [Google Scholar] [CrossRef]
  33. Bi, Z.; Wang, R.; Jing, X. Grooving corrosion of oil coiled tubes manufactured by electrical resistance welding. Corros. Sci. 2012, 57, 67–73. [Google Scholar] [CrossRef]
  34. Han, Y.; Zhong, S.; Tian, L.; Fei, J.; Sun, Y.; Zhao, L.; Xu, L. Welding heat input for synergistic improvement in toughness and stress corrosion resistance of X65 pipeline steel with pre-strain. Corros. Sci. 2022, 206, 110478. [Google Scholar] [CrossRef]
Figure 1. Schematics of the simulated X80 steel welded joint.
Coatings 14 00528 g001
Figure 2. Microstructures of the simulated X80 steel welded joint. (a) base metal (BM), (b) intercritical heat affected zone (ICHAZ), (c) fine grain heat affected zone (FGHAZ), (d) coarse grain heat affected zone (CGHAZ), (e) weld metal (WM).
Coatings 14 00528 g002
Figure 3. Potentiodynamic polarization curves of the simulated X80 steel welded joint in CO2-saturated 3% NaCl solution at 40 °C.
Coatings 14 00528 g003
Figure 4. Galvanic potential and potential distribution of simulated X80 steel welded joint at different immersion time at 40 °C (a) BM:HAZ:WM = 17:4:4, (b) BM:HAZ:WM = 17:3:4, (c) BM:HAZ:WM = 17:3:3, (d) BM:HAZ:WM = 8:3:4.
Coatings 14 00528 g004
Figure 5. Galvanic current density distribution of simulated X80 steel welded joint at different immersion times at 40 °C (a) BM:HAZ:WM = 17:4:4, (b) BM:HAZ:WM = 17:3:4, (c) BM:HAZ:WM = 17:3:3, (d) BM:HAZ:WM = 8:3:4.
Coatings 14 00528 g005
Figure 6. Galvanic corrosion intensity factor of the simulated X80 steel welded joint for different area ratios at 40 °C.
Coatings 14 00528 g006
Table 1. Chemical compositions of the X80 steel welded joint (mass%).
RegionsCSiMnPSCrNiNbMoCuFe
BM0.0660.1901.660.0060.0020.2220.1870.0600.1270.128balanced
WM0.0660.5321.290.0120.0090.0460.0340.0060.0120.028balanced
Table 2. Electrochemical parameters of the simulated X80 steel welded joint in CO2-saturated 3% NaCl solution at 40 °C.
Regionsba (mV·dec−1)Ecorr (VSCE)iL (mA·cm−2)icorr (mA·cm−2)
BM58−0.7030.1190.136
ICHAZ58−0.7010.1200.146
FGHAZ61−0.7010.1240.147
CGHAZ61−0.7020.1280.159
WM55−0.7170.1040.107
Table 3. Galvanic effect of the simulated X80 steel welded joint with different area ratio at different coupled times.
Coupled Time/h148122436
BM:HAZ:WM = 17:4:42.601.941.671.691.731.87
BM:HAZ:WM = 17:3:42.362.252.201.661.681.73
BM:HAZ:WM = 17:3:32.882.772.342.492.071.95
BM:HAZ:WM = 8:3:42.131.811.711.801.641.61
Disclaimer/Publisher’s Note: The statements, opinions and data contained in all publications are solely those of the individual author(s) and contributor(s) and not of MDPI and/or the editor(s). MDPI and/or the editor(s) disclaim responsibility for any injury to people or property resulting from any ideas, methods, instructions or products referred to in the content.