Abstract
The aim of this study was to investigate the effect of different mix ratios on the mechanical properties of steel fiber-reinforced concrete (LSFRC) and to determine an optimum mix ratio. The effects of four factors, namely, fly ash content, volume fraction of steel fibers, water–cement ratio, and sand rate, on the mechanical properties of LSFRC were investigated through orthogonal experiments. The microstructure of LSFRC at different mix ratios was analyzed using scanning electron microscopy (SEM), and an optimal mix ratio was derived. The results showed that the water–cement ratio and the volume fraction of steel fibers were the main factors affecting the mechanical properties of LSFRC. When the water–cement ratio was 0.38 and 0.42, the combined mechanical properties of concrete were superior. Steel fiber content between 0.6% and 1% had a significant effect on the splitting tensile strength of concrete. The effect of sand rate on compressive and splitting tensile strengths was consistent, with a significant effect on both at a sand rate of 40%. In terms of microstructure, 20% fly ash content promotes the hydration of concrete. The optimum LSFRC mix ratio determined was 0.42 water–cement ratio, 0.6% steel fiber content, 40% sand rate, and 20% fly ash content. Experimental verification using this mix ratio showed that the compressive, flexural, and split tensile strengths were increased by 3%, 19%, and 33%, respectively, when compared to ordinary concrete.
1. Introduction
With the continuous development of the road industry, some prefabricated road panels have also set higher standards for the performance of concrete. Although traditional concrete can meet the requirements of compressive strength, its ability to split tensile strength and flexural strength is relatively weak. Some scholars [1,2,3] have added steel fibers to concrete to improve its mechanical properties by adding an appropriate amount of steel fibers. Ramadoss P et al. [4] studied the effects of different steel fiber contents on the mechanical properties of steel fiber-reinforced concrete and conducted numerical simulations. Amit Deb Nath et al. [5] experimentally evaluated the effect of different diameters of recycled steel fibers on the properties of recycled aggregate concrete and found the optimal RSF solution for a specific RCA replacement ratio. Some scholars [6,7,8] have also explored the varying degrees of influence of different factors on the mechanical properties of steel fiber-reinforced concrete with different contents. The excellent mechanical properties of steel fiber-reinforced concrete make it widely used in various engineering fields, such as roads, water conservancy, bridges, buildings, explosion resistance, and seismic resistance. However, the high cost of steel fiber in engineering applications, unsuitable admixture ratios, and their fluctuating influence on mechanical properties and work performance present significant challenges [9]. To promote the widespread application of steel fiber-reinforced concrete in prefabricated road panels, it is necessary to reduce the production cost of steel fibers while considering their superior performance in practical applications. Therefore, some scholars [10,11,12] have proposed a new structural form—layered steel fiber-reinforced concrete (LSFRC). This type of concrete structure is divided into three layers, with the surface layer and bottom layer being steel fiber-reinforced concrete and the middle layer being plain concrete, as shown in Figure 1. LSFRC can maintain the advantages of the mechanical properties of fully fiber-reinforced concrete while reducing the amount of steel fibers used and improving the utilization of various materials in concrete. Since the theory of LSFRC (also known as composite steel fiber-reinforced concrete) was proposed [13], its excellent mechanical properties and relatively low cost have received widespread attention from scholars. Yang Jiujun [14] studied the effect of fiber gradient on the mechanical properties of concrete through concrete mechanical property tests. The results showed that the fiber gradient distribution can significantly improve the flexural and compressive strength of concrete and mortar and greatly reduce the amount of fibers used, saving costs. Lu Han [15] replaced ordinary concrete with internal steel fiber-reinforced concrete in the tensile zone of 1/3 of the beam height. The results showed that compared with the ordinary reinforced concrete beam, the cracking load, yield load, and ultimate load of the local steel fiber-reinforced and steel-reinforced composite beam increased by 47.6%, 13.2%, and 11.5%, respectively. Guo Zan [16] established an experimental model for internal cracks in layered steel fiber-reinforced concrete and hybrid steel fiber-reinforced concrete and obtained the relationship curve between load and crack development. Peng O [17] and foreign scholar Inmaculada Martínez-Pérez et al. [18] compared the mechanical properties of layered steel fiber-reinforced concrete beams, steel fiber-reinforced concrete beams, and ordinary concrete beams. The study showed that the bending capacity of each beam is basically the same, and the deflection of the LSFRC beam is slightly smaller than that of the solid beam. Suddeepong Apichat [19] experimentally investigated the effect of NRL on the mechanical properties and fatigue life of concrete and, based on the research results, proposed a cost-effective design method for NRL concrete pavements, aiming to promote the sustainable application of NRL in concrete pavements. While previous studies have demonstrated the effectiveness of LSFRC at a structural level, there is a recognized gap in optimizing mix proportions to balance mechanical properties, workability, and cost. This research aimed to fill this gap by focusing on the mix proportion design for LSFRC concrete materials. Specifically, we aimed to identify an optimal mix ratio that not only improves the flexural strength of concrete pavements but also considers economic viability. This article mainly focuses on the structural form of layered steel fiber-reinforced concrete, selects different experimental variables, and conducts physical model experiments on LSFRC. Based on the experimental results, various performance design studies were conducted to obtain an LSFRC mix proportion that meets both mechanical and working performance and is economically applicable. It is hoped that this will provide some theoretical basis for the material design of prefabricated road panels in road engineering.
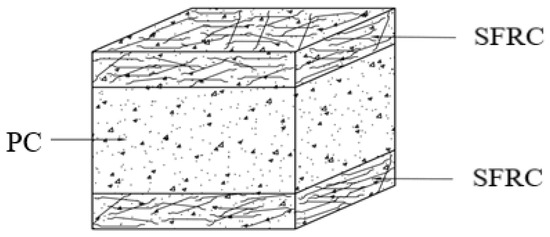
Figure 1.
Layered steel fiber-reinforced concrete, LSFRC. PC—Plain concrete. SFRC—Steel fiber-reinforced concrete.
2. Experimental Raw Materials and Methods
2.1. Experimental Raw Materials
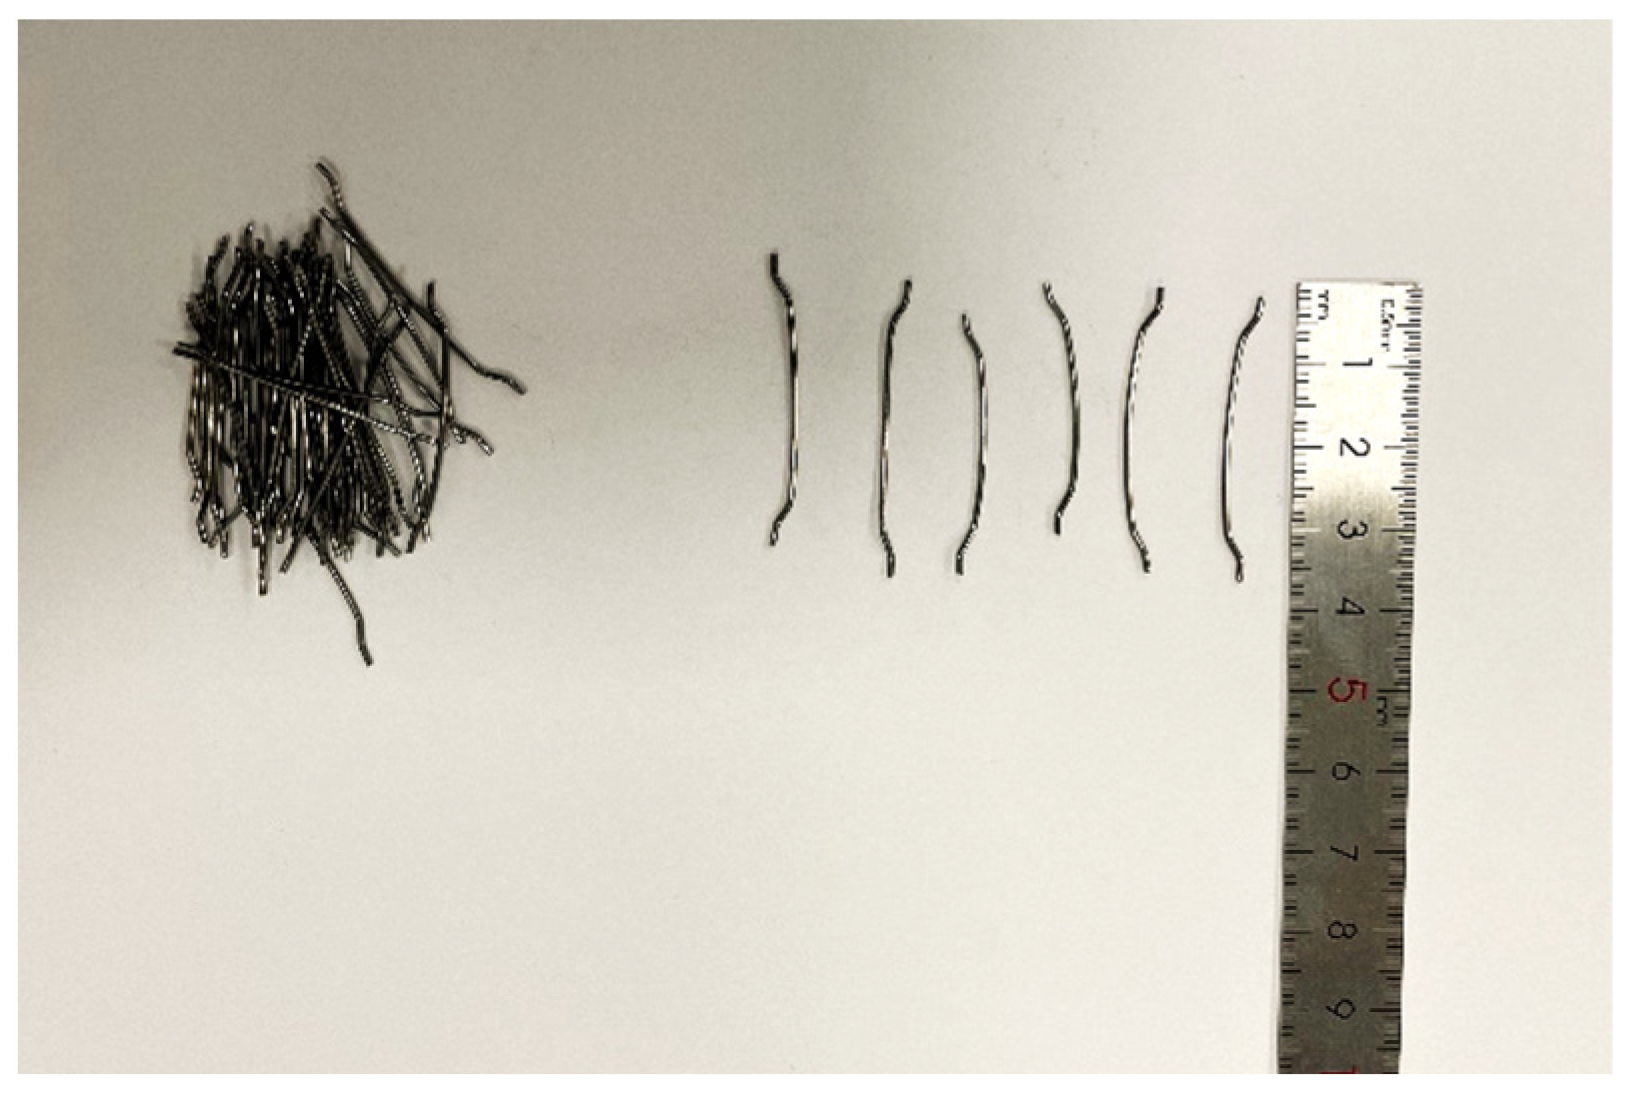
For this experiment, ordinary Portland cement (PO42.5R) produced by a cement factory in Chongqing was used. The sand used was medium sand with a fineness modulus of 2.8. The mixing water was tap water, and the coarse aggregate was a graded crushed stone with a particle size of 5 mm–20 mm. The steel fibers used were hooked-end steel fibers (as shown in Figure 2), and the measured results of various indicators are shown in Table 1. Class I fly ash was used, with a fineness of 16%, a loss on ignition of 2.8%, a water requirement ratio of 92%, a sulfur trioxide content of 2.1%, and a free lime content of 0.85%.
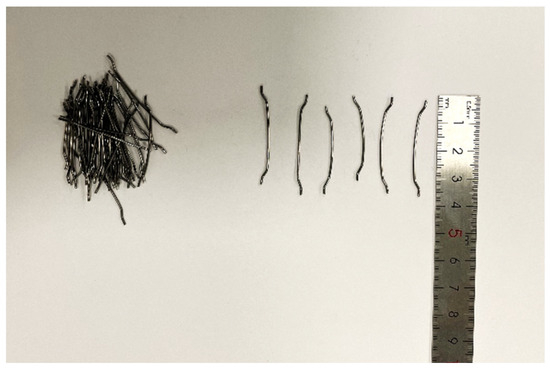
Figure 2.
End-hooked steel fiber.

Table 1.
Performance parameters of steel fibers.
2.2. Orthogonal Experimental Design
In order to study the effect of various factors on the mechanical properties of concrete, four factors were identified for study based on the main materials of steel fiber concrete: water–cement ratio (Factor A), sand ratio (Factor B), steel fiber volume ratio (Factor C), and fly ash content (Factor D). Based on the fineness modulus of the selected sand and on the study of the potential effect of fly ash on the workability and strength development of the concrete, three grades were selected for each factor, and the mix design of LSFRC was carried out; the details of the ratios are shown in Table 2 and Table 3.
Table 2.
Orthogonal experimental factors-level table.
Table 3.
L9(34) Orthogonal experimental design table.
2.3. The Methods of Specimen Fabrication and Testing
- (1)
- Specimen Fabrication
A total of 81 specimens were fabricated for compressive strength, splitting tensile strength, and flexural strength tests. The specimen dimensions were non-standard 100 mm × 100 mm × 100 mm for compressive and splitting tensile strength tests and non-standard 100 mm × 100 mm × 400 mm for flexural strength tests. The fabrication and curing of specimens followed the standard “Test Methods for Physical Properties of Concrete” [20], with steel fiber concrete of 2 cm thickness on both the top and bottom layers.
- (2)
- Mixing Procedure
The constituents were added in the following order: cement, fly ash (where applicable), sand, and water. The mixture was then mixed for a total of 3 min to ensure homogeneity. The steel fibers were added gradually over the last 30 s of mixing to prevent balling and ensure even distribution.
- (3)
- Layered Structure Formation
The plain and fiber-reinforced concrete layers were cast separately, ensuring that each layer achieved the desired thickness. A layer of plain concrete was first cast and allowed to be partially set before the steel fiber-reinforced concrete was placed on top. Care was taken to avoid the intermixing of layers. Vibration was applied to consolidate the layers and ensure proper bonding without disturbing the layered structure.
- (4)
- Conservation conditions and processes
After casting, the specimens are left in a static environment at a temperature of 20 ± 5 °C for one day and night before they are numbered and demolded. Immediately after demolding, it was placed in a standard curing room with a temperature of 20 ± 2 °C and a relative humidity of more than 95% for 28 days.
- (5)
- Testing Methods
In accordance with the “Test Code for Cement and Concrete in Highway Engineering” (JTG E30-2005) [21], compressive strength, splitting tensile strength, and flexural strength tests were conducted on the specimens under load.
3. Analysis of the Influence of Testing Factors on the Performance of Concrete
3.1. Analysis of the Influence of Testing Factors on the Workability of Concrete
- (1)
- Test Results of Slump Test for Steel Fiber Concrete
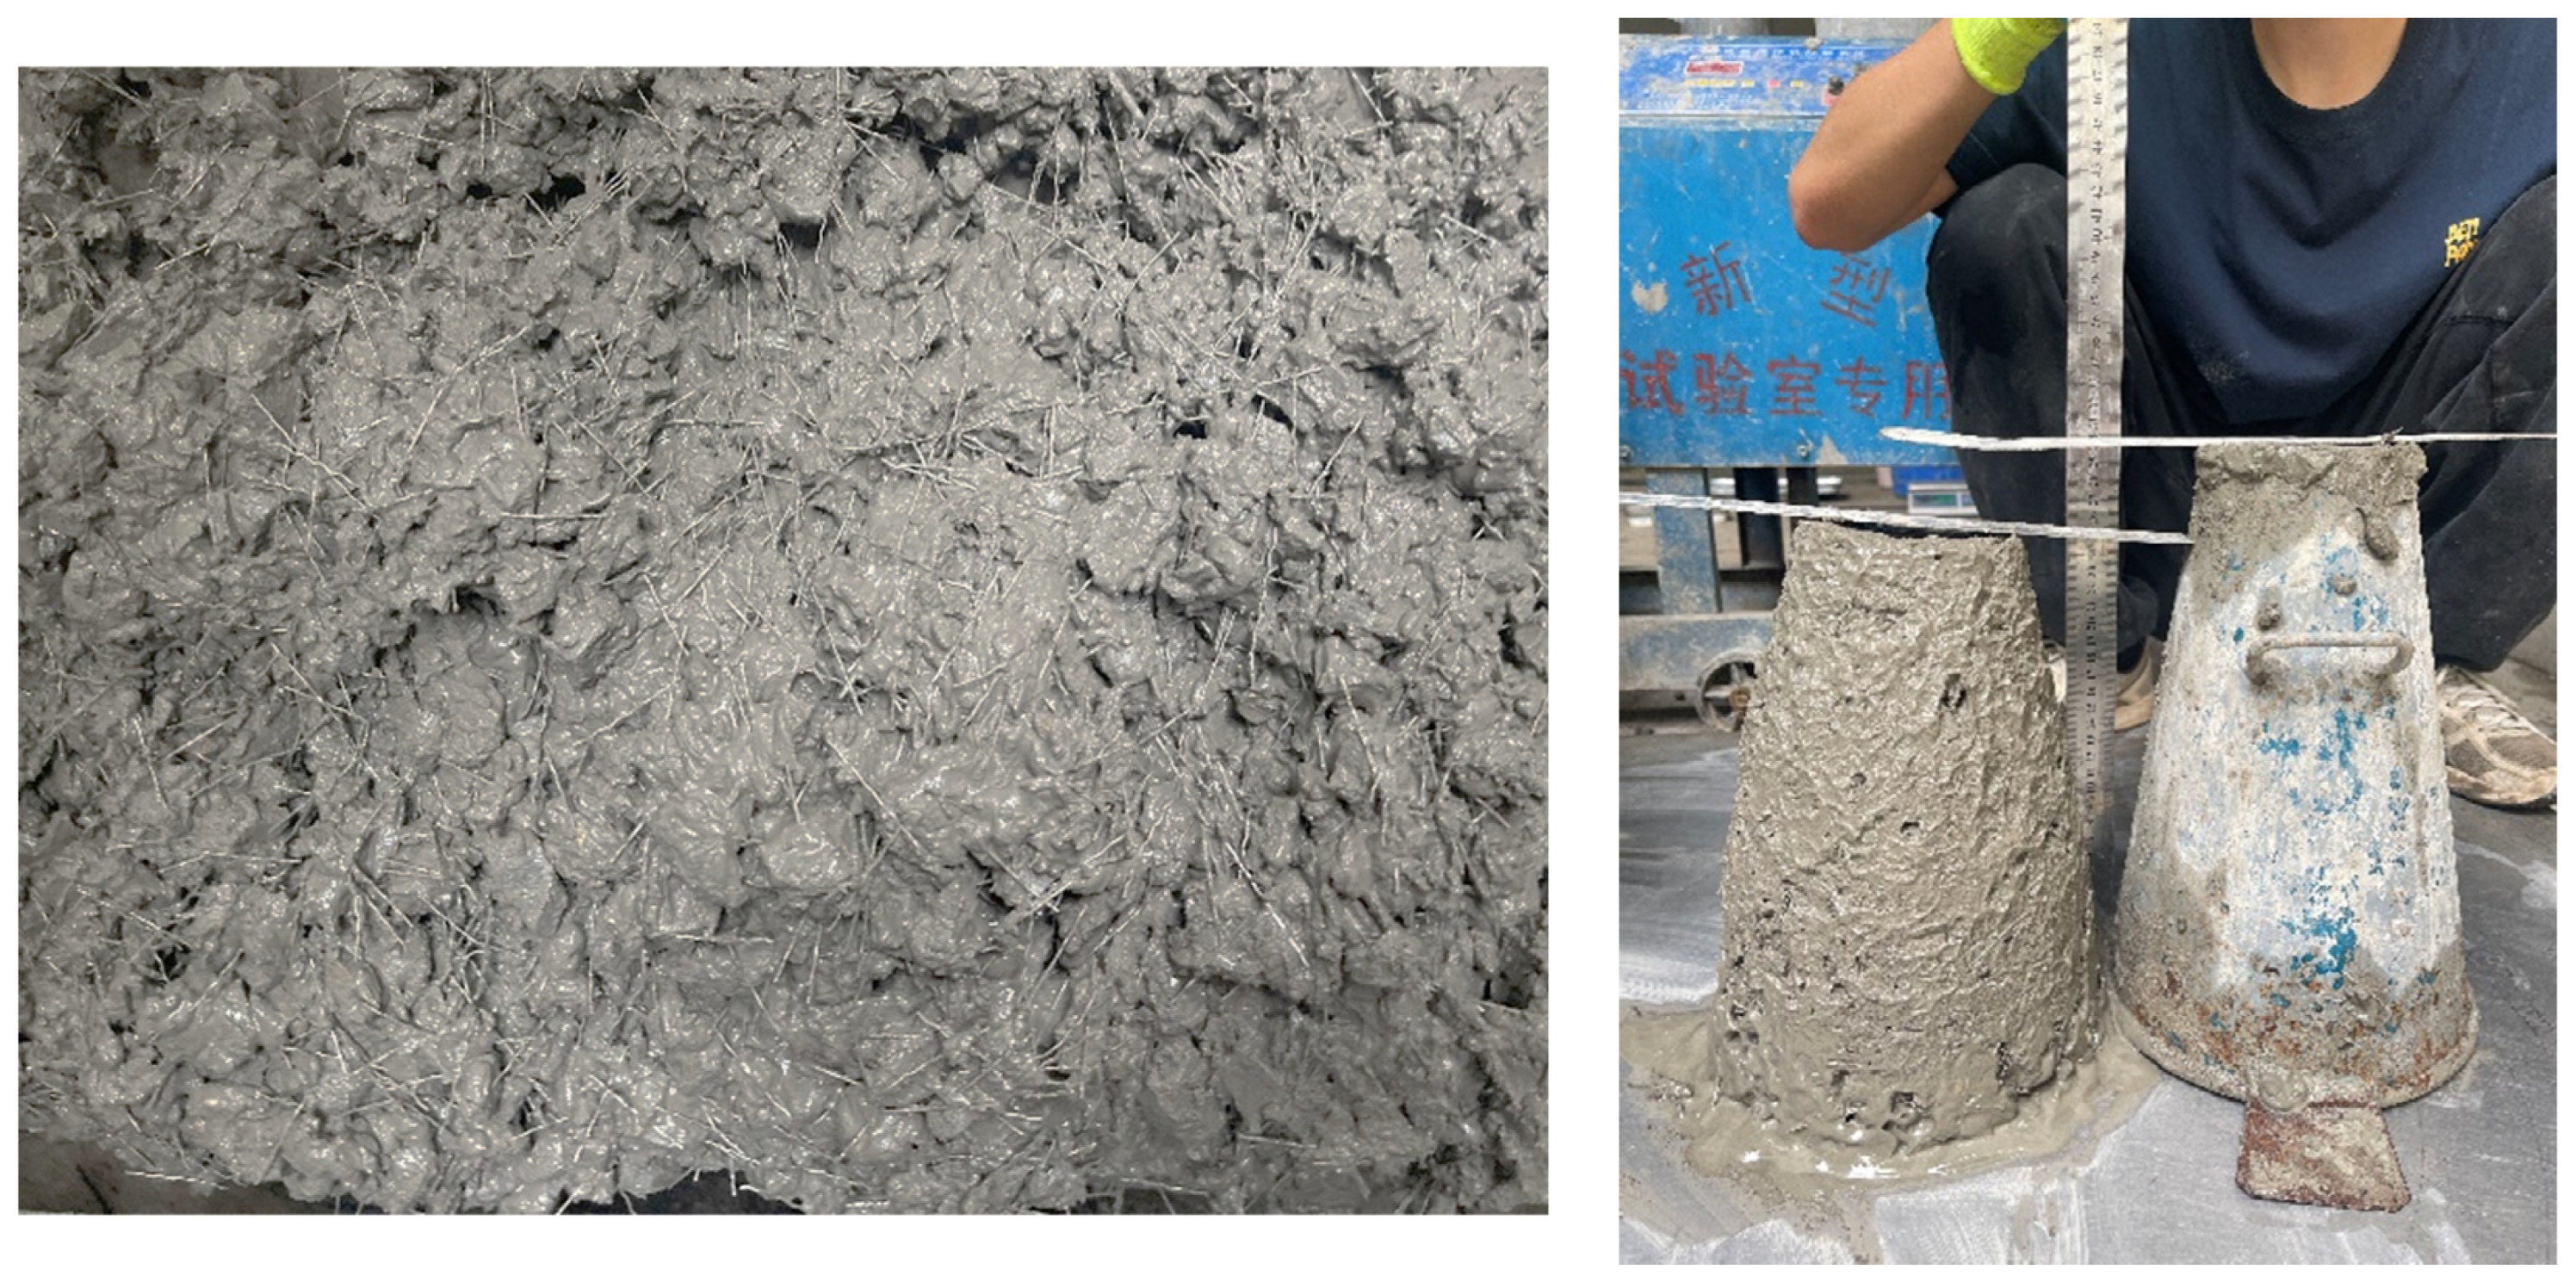
The process of slump test for steel fiber concrete is shown in Figure 3.

Figure 3.
Steel fiber-reinforced concrete slump test. (a) Steel fiber concrete. (b) Slump test for LSFRC.
The results of the orthogonal slump test for steel fiber concrete are presented in Table 4.
Table 4.
Slump value of steel fiber-reinforced concrete.
According to Table 4, the maximum slump value of steel fiber concrete was obtained for combination LS-9, with a slump value of 46 mm. Due to the general requirements of road construction and the pumping requirements, the degree of collapse is required to be below 80 mm and above 20 mm, and all nine groups of collapse in this test meet the requirements. The samples with larger collapse degrees indicate higher mobility. The range analysis of slump results for steel fiber concrete under different combination levels is shown in Table 5.
Table 5.
Analysis of slump range.
From Table 5, it can be observed that the most significant factor affecting the workability of steel fiber concrete was the water–cement ratio, with a range value of 9.67, followed by the volume fraction of steel fibers, with a range value of 5.67. The order of the main factors affecting the slump value of steel fiber concrete is as follows: water–cement ratio (A) > volume fraction of steel fibers (D) > sand ratio (B) > substitution rate of fly ash (C). The water–cement ratio had the greatest effect on the workability of steel fiber concrete; an increase in the water–cement ratio resulted in concrete that flowed more easily but, at the same time, may have reduced the compactness of its internal structure. Fly ash admixture had the least effect on the workability of steel fiber concrete, which indicates that the addition of fly ash hardly affects the flowability of steel fiber concrete.
3.2. Analysis of the Influence of Testing Factors on the Mechanical Properties of Concrete
3.2.1. Range Analysis
- (1)
- Range Analysis of Compressive Strength
The results of the orthogonal compressive strength test for LSFRC are presented in Table 6.
Table 6.
Compressive strength results.
From Table 6, it is evident that the highest compressive strength value was obtained for combination LS-1, with a compressive strength value of 44.9 MPa. The mean and range values of compressive strength for different levels under each factor are shown in Table 7.
Table 7.
Analysis of compressive strength range.
As shown in Table 7, the range values R of compressive strength for LSFRC under each factor indicate that the main factors affecting compressive strength are in the following order: water–cement ratio (A) > volume fraction of steel fibers (C) > substitution rate of fly ash (D) > sand ratio (B).
- (2)
- Range Analysis of Flexural Performance
The results of the orthogonal flexural strength test for LSFRC are presented in Table 8.
Table 8.
Flexural strength results.
From Table 8, it can be seen that the flexural strength range of LSFRC under orthogonal test was between 5.99 MPa and 7.94 MPa, and the maximum flexural strength was obtained for combination LS-1, with a flexural strength value of 7.94 MPa. The mean and range values of flexural strength for different levels under each factor are presented in Table 9.
Table 9.
Analysis of flexural strength range.
From Table 9, it can be observed that the range values R of flexural strength for LSFRC under each factor indicate that the main factors affecting flexural strength are in the following order: water–cement ratio (A) > volume fraction of steel fibers (C) > substitution rate of fly ash (D) > sand ratio (B).
- (3)
- Range Analysis of Splitting Tensile Performance
The results of the orthogonal splitting tensile strength test for LSFRC are presented in Table 10.
Table 10.
Splitting tensile strength value.
From Table 10, it can be seen that the maximum splitting tensile strength value was obtained for combination LS-3, with a splitting tensile strength value of 4.92 MPa. The range values of splitting tensile strength for different combinations are shown in Table 11.
Table 11.
Analysis of splitting tensile strength range.
As shown in Table 11, the range values R of splitting tensile strength for LSFRC under each factor indicate that the main factors affecting splitting tensile strength are in the following order: water–cement ratio (A) > volume fraction of steel fibers (C) > substitution rate of fly ash (D) > sand ratio (B).
3.2.2. Analysis of Factor Indicators
- (1)
- Analysis of Factor Indicators for Compressive Performance
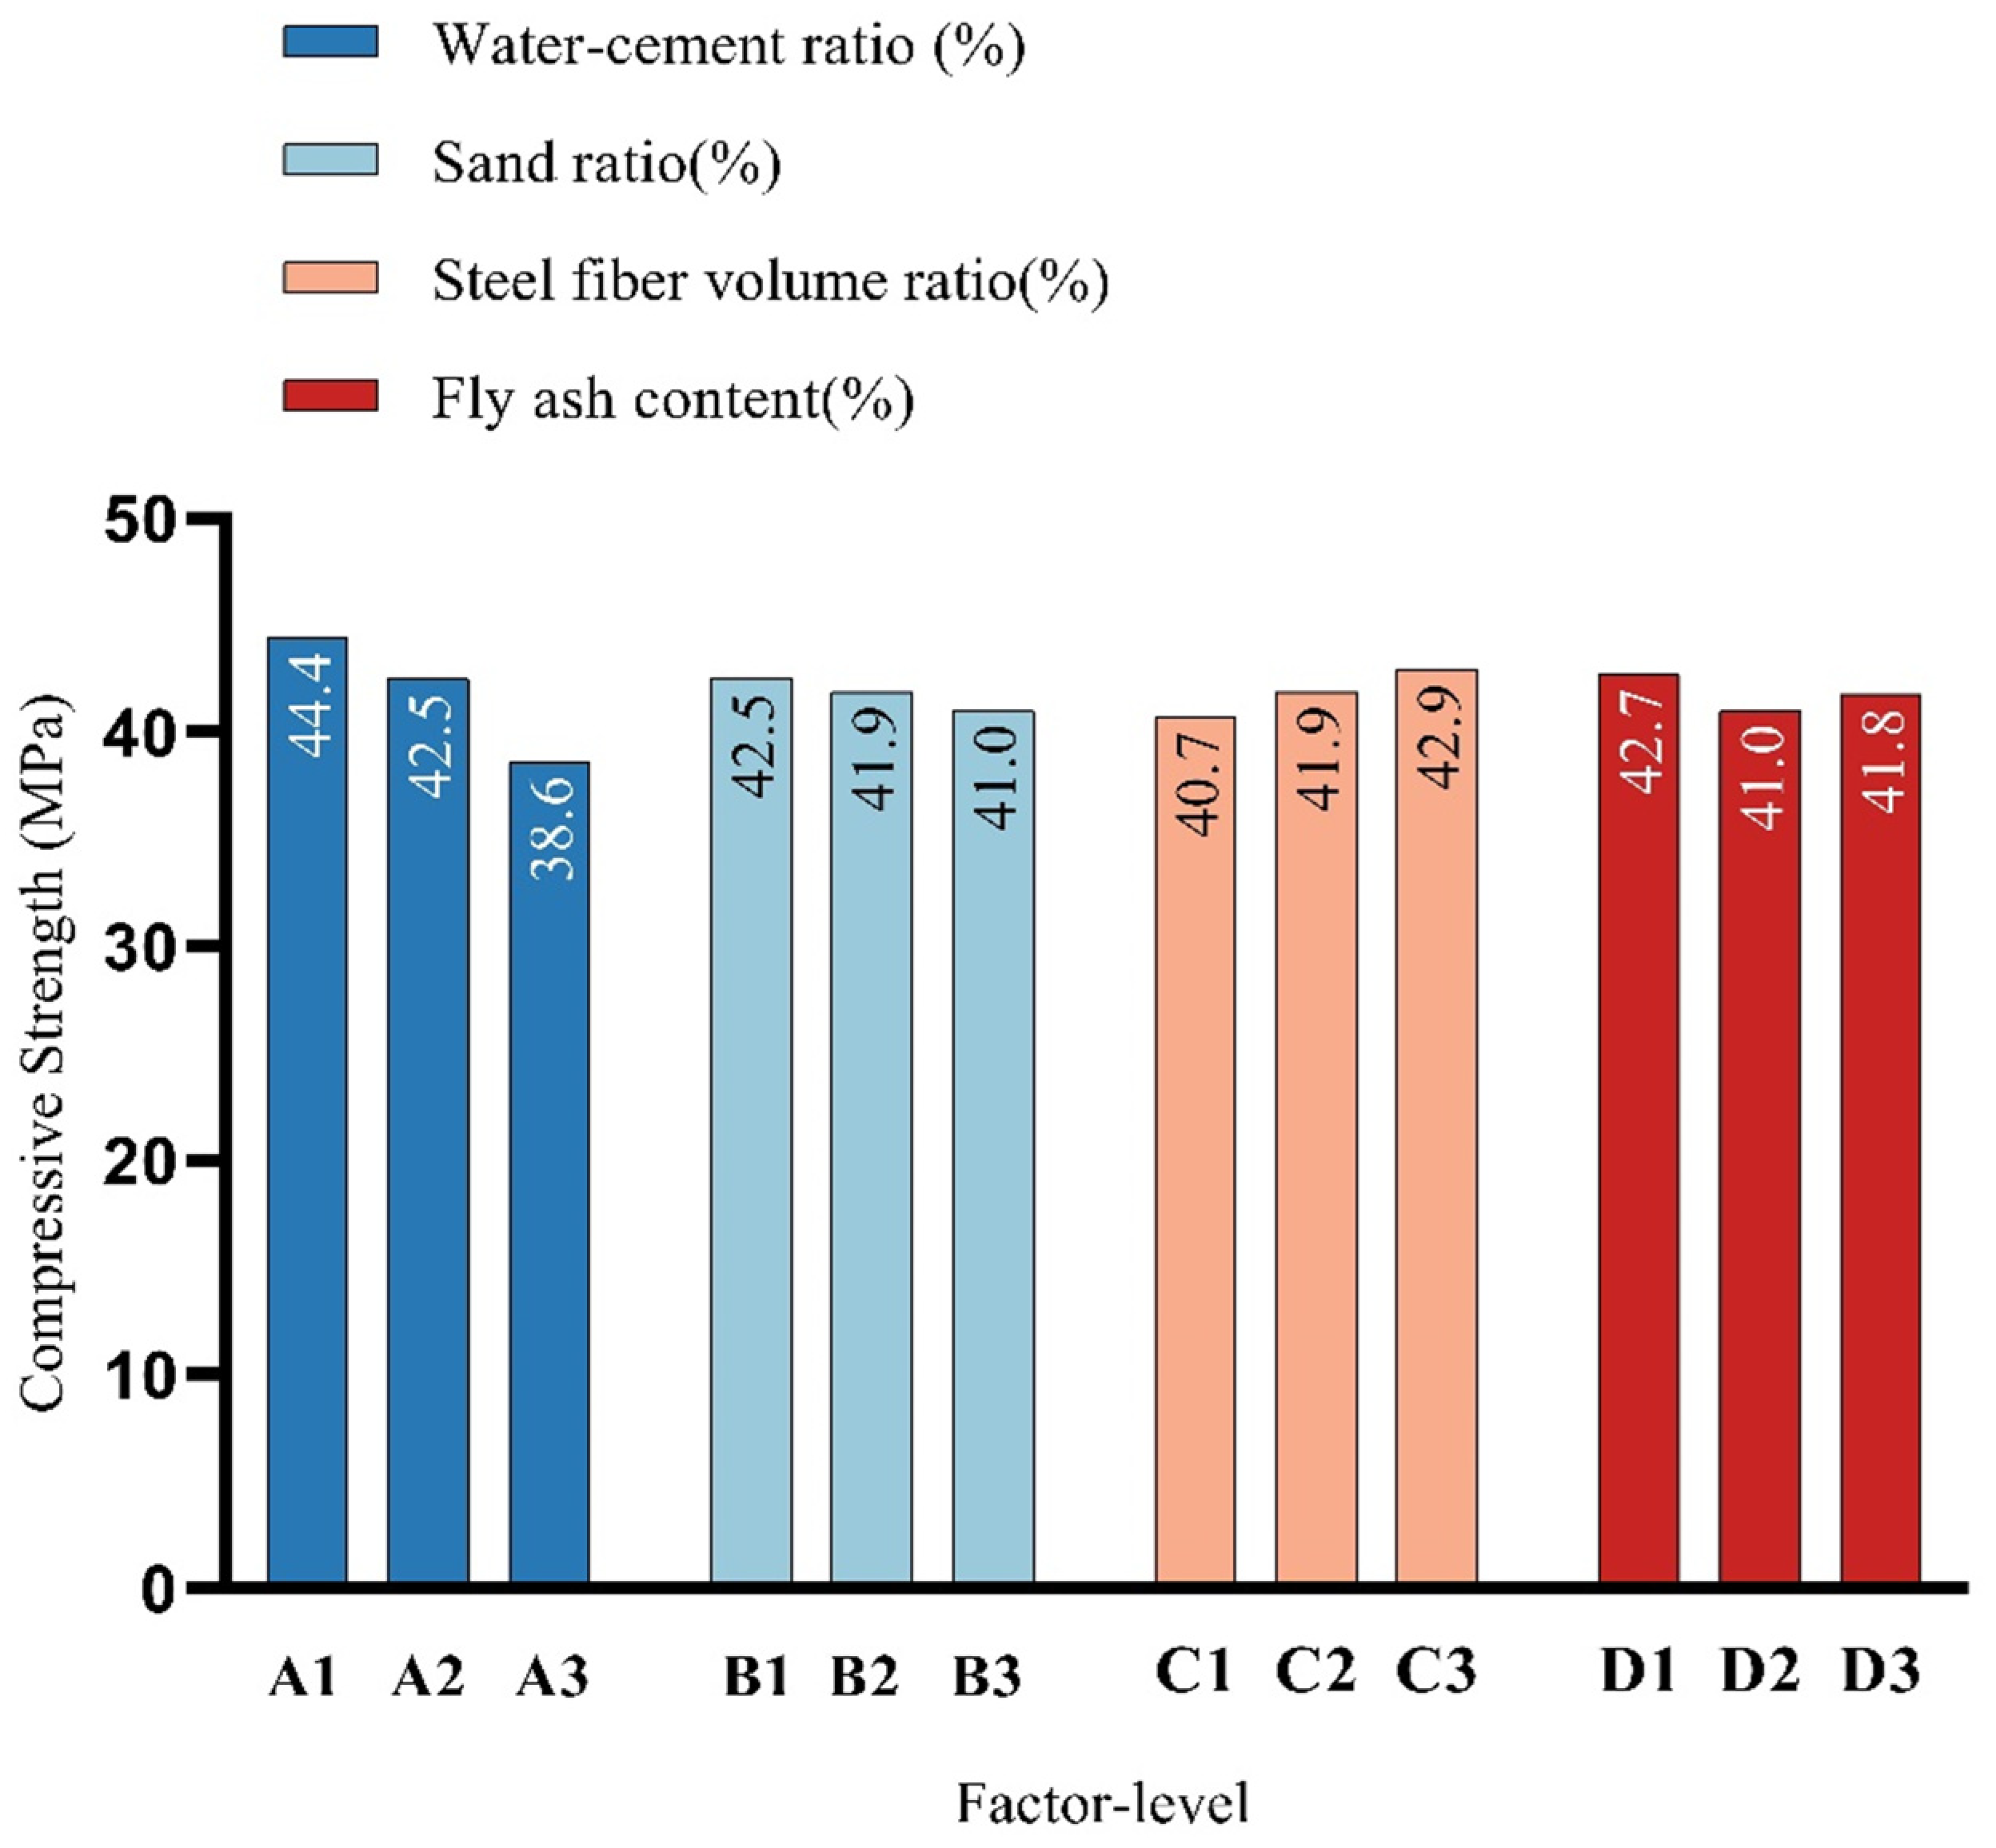
Based on the orthogonal experimental method, compressive strength, flexural strength, and splitting tensile strength of concrete were taken as indicators to analyze the influence of each factor at different levels on the compressive strength of steel fiber concrete. A bar chart was plotted based on the mean compressive strength values , as shown in Figure 4.

Figure 4.
Compressive strength factor index.
From Figure 4, it can be observed that as the water–cement ratio increased, the compressive strength decreased. When the water–cement ratio increased from 0.38 to 0.42, the compressive strength decreased by 4%, and when the water–cement ratio increased from 0.42 to 0.46, the compressive strength decreased by 8%. For the sand ratio, as it increased, the compressive strength showed a decreasing trend, with a decrease of about 2% in compressive strength for every 5% increase in sand ratio. As for the substitution rate of fly ash, the compressive strength was highest when there was no substitution of cement by fly ash, and it was lowest when the substitution rate of fly ash was 10%. The compressive strength was positively correlated with the volume fraction of steel fibers. When the volume fraction of steel fibers was 0.8%, the compressive strength was 5% higher than that of 0.6%, and when the volume fraction of steel fibers was 1%, the compressive strength was 2% higher than that of 0.8%, with a smaller increase.
- (2)
- Analysis of Factors Indicators for Flexural Strength
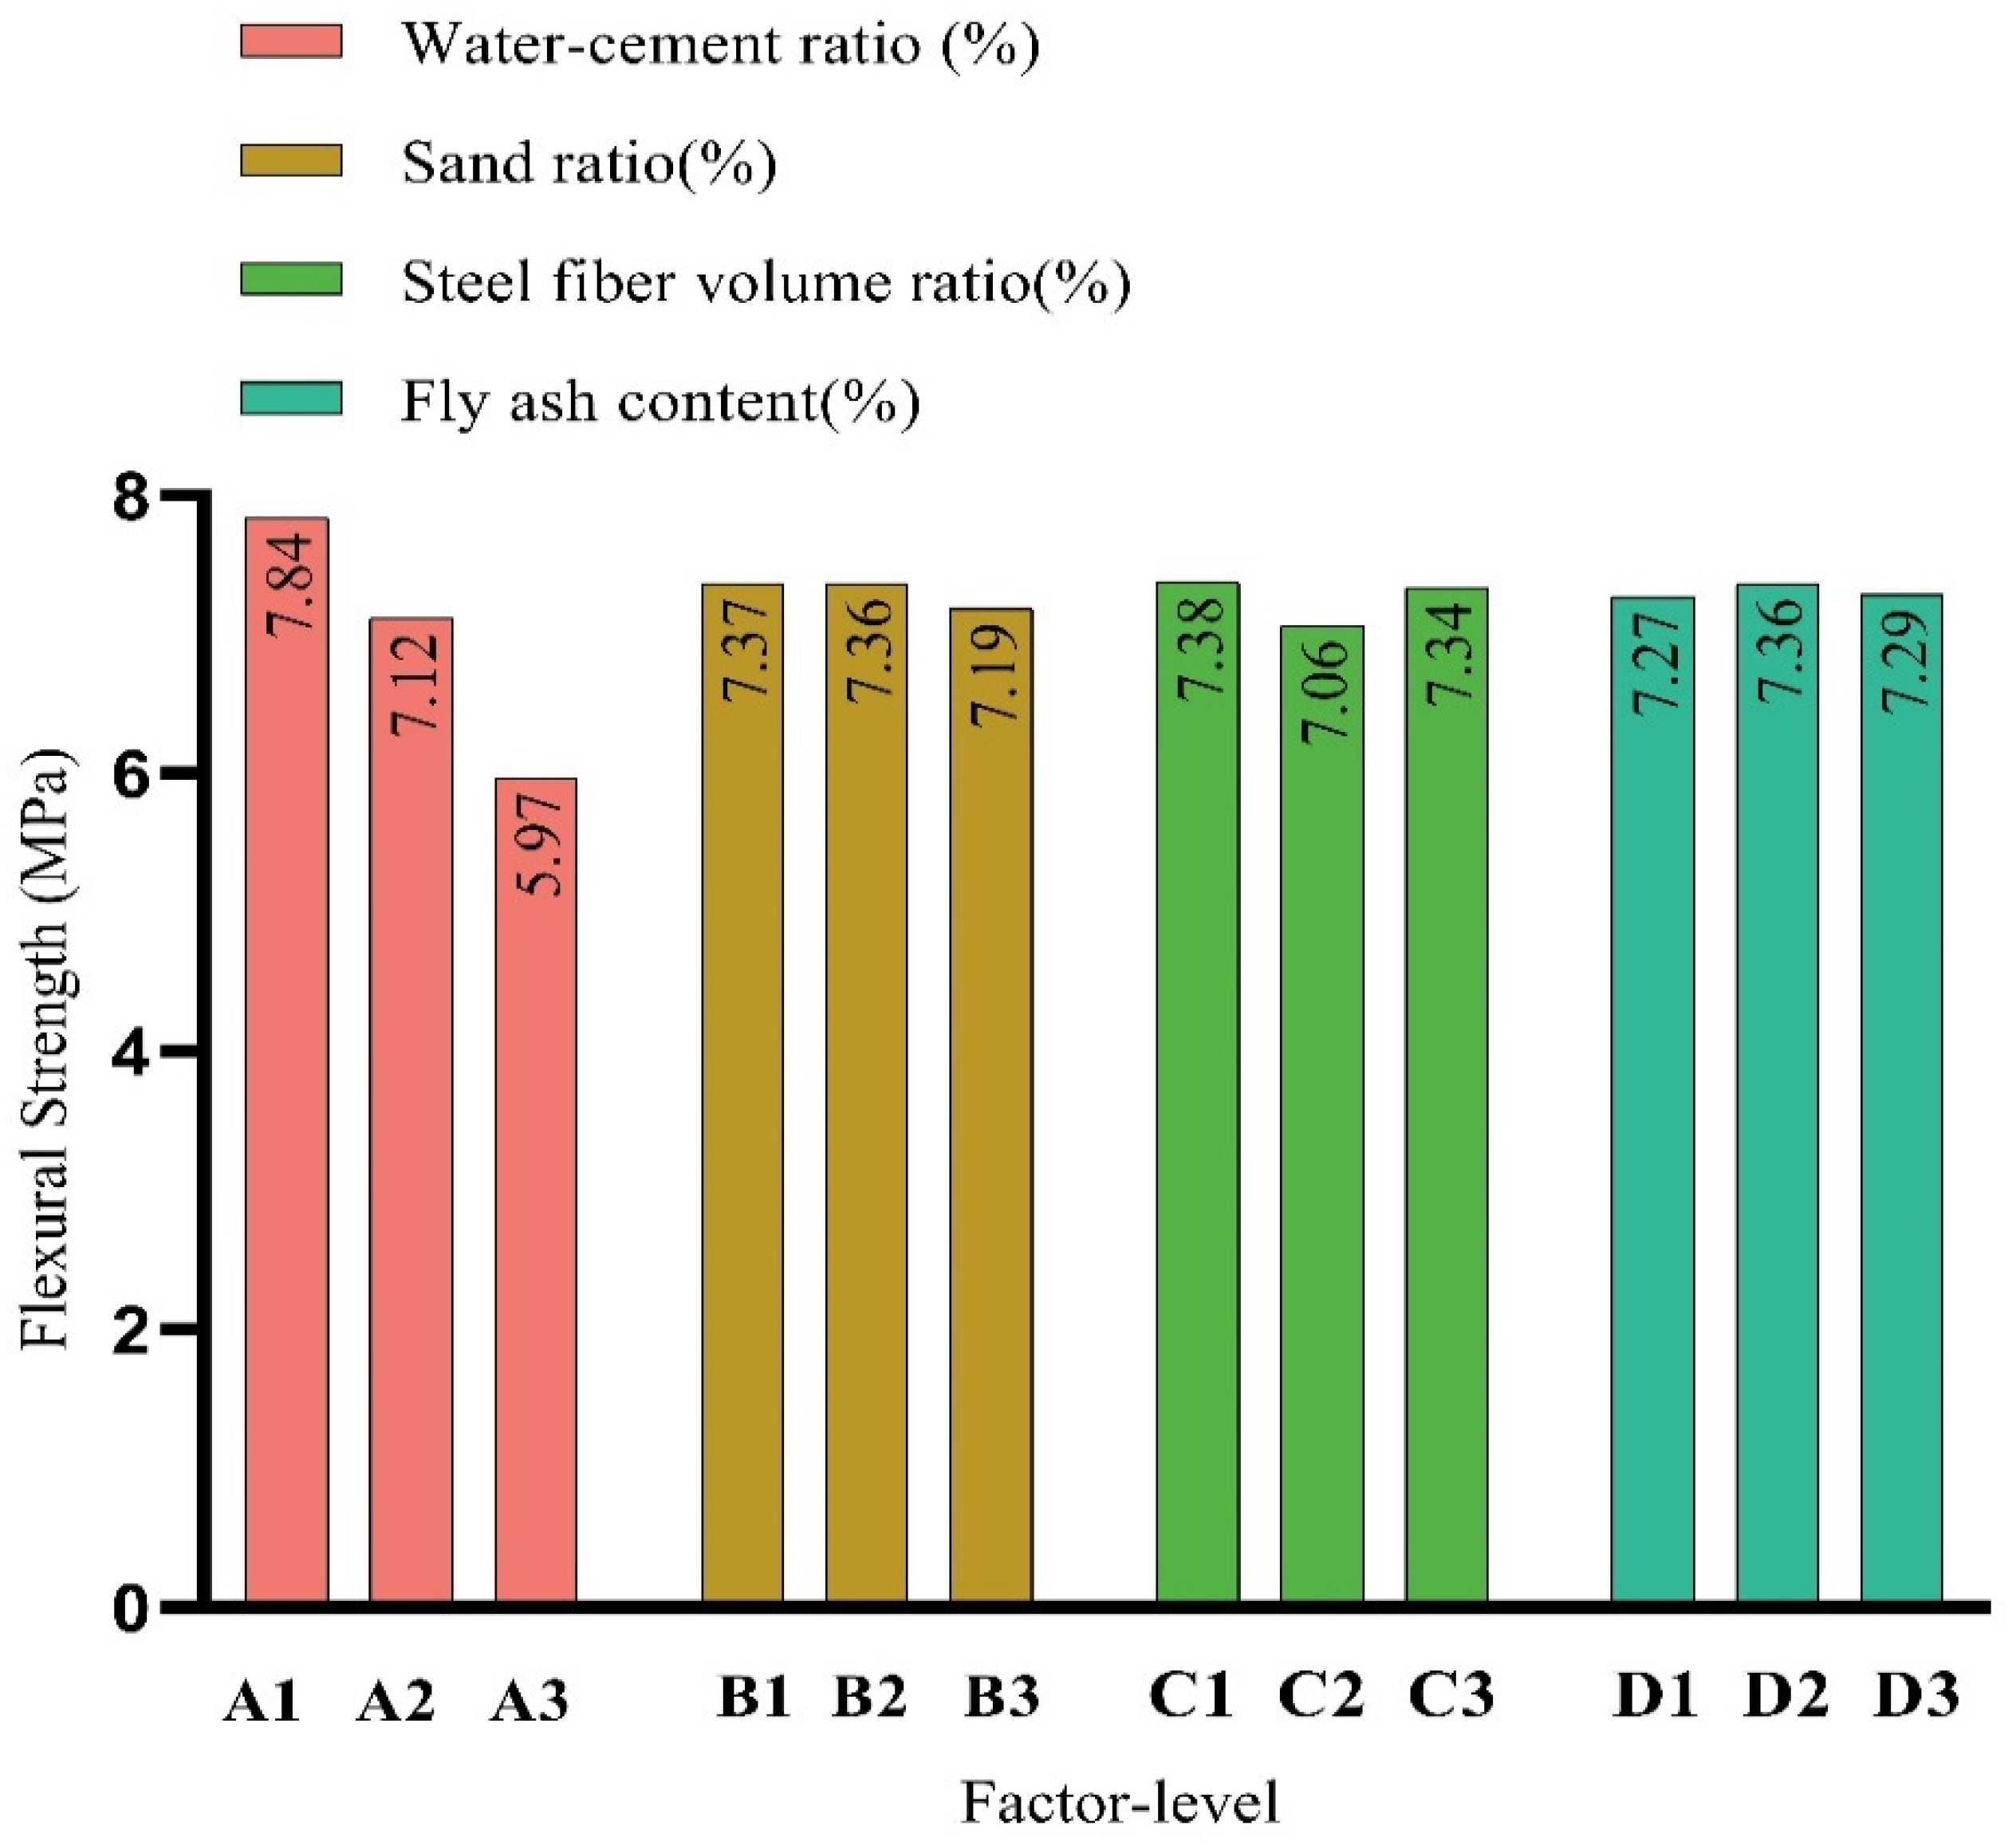
Based on the mean flexural strength values at different levels, a line chart was plotted, as shown in Figure 5.

Figure 5.
Flexural strength factor index.
From Figure 5, it can be inferred that with an increase in the water-to-binder ratio, the decreasing trend in the flexural strength of LSFRC gradually weakened. Compared with a water-to-binder ratio of 0.4, a 10% decrease was observed when compared to a ratio of 0.36, and a decrease of 2% was observed when compared to a ratio of 0.44. The flexural strength gradually decreased with an increase in sand content, but the decreasing trend was relatively small. When compared to a sand content of 0.35, there was no significant change in flexural strength when the sand content was 0.4. However, when compared to a sand content of 0.4, a decrease of 2% was observed when the sand content was 0.45. The replacement rate of fly ash had an impact on the flexural strength of concrete. When the replacement rate of fly ash was 10%, the flexural strength reached its maximum value. On the other hand, when fly ash did not replace cement, the flexural strength was at its minimum. However, the replacement rate of fly ash had a relatively small overall impact on the flexural strength. The flexural strength decreased first and then increased with an increase in the volume fraction of steel fibers. When the volume fraction of steel fibers was 0.6%, the flexural strength was at its maximum, while when the volume fraction of steel fibers was 0.8%, the flexural strength was at its minimum.
- (3)
- Analysis of Splitting Tensile Strength Factors
A bar chart depicting the mean splitting tensile strength values (X) for different level combinations can be seen in Figure 6.
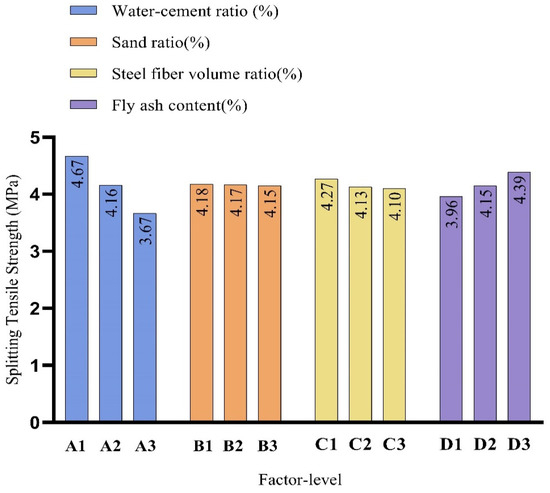
Figure 6.
Splitting tensile strength factor index.
From Figure 6, it can be observed that the splitting tensile strength of LSFRC linearly decreased as the water-to-binder ratio increased. For every increase of 0.04 in the water-to-binder ratio, the splitting tensile strength decreased by approximately 13%. The splitting tensile strength decreased as the sand content increased. When compared to a sand content of 0.35, a decrease of 2% was observed when the sand content was 0.4, and a decrease of 1% was observed when the sand content was 0.45, indicating a relatively small change. The replacement rate of fly ash was negatively correlated with the splitting tensile strength. When the replacement rate of fly ash was 10%, the splitting tensile strength decreased by 5% compared with when fly ash was not used. When the replacement rate of fly ash was 20%, the splitting tensile strength decreased by 4% compared with a rate of 10%. The splitting tensile strength increased as the volume fraction of steel fibers increased. When the volume fraction of steel fibers was 0.8%, the splitting tensile strength improved by 3% compared with a volume fraction of 0.6%. Additionally, the splitting tensile strength improved by 5% when the volume fraction of steel fibers was increased from 0.8% to 1%.
3.2.3. Response Surface Analysis of Significant Influencing Factors
Response surface analysis can effectively analyze the impact of various factors on the dependent variable and determine the optimization direction and range of each factor [22,23,24,25,26,27]. Based on the range analysis of the experimental results shown in Table 12, the three factors that had the greatest impact on the mechanical properties of concrete were selected for response surface analysis. Through this analysis, a reasonable range of values for these three factors in LSFRC concrete was obtained.
Table 12.
Total range table of concrete strength test results.
Through comparison, it can be concluded that the factors that have the greatest overall impact on the strength of concrete are water–cement ratio (A) (R total = 8.3) > steel fiber volume ratio (C) (R total = 3.7) > sand ratio (B) (R total = 2.32) > fly ash content (R total = 2.13). Therefore, the first three significant factors that affect the strength of concrete were determined to be water–cement ratio, steel fiber volume ratio, and sand ratio.
- (1)
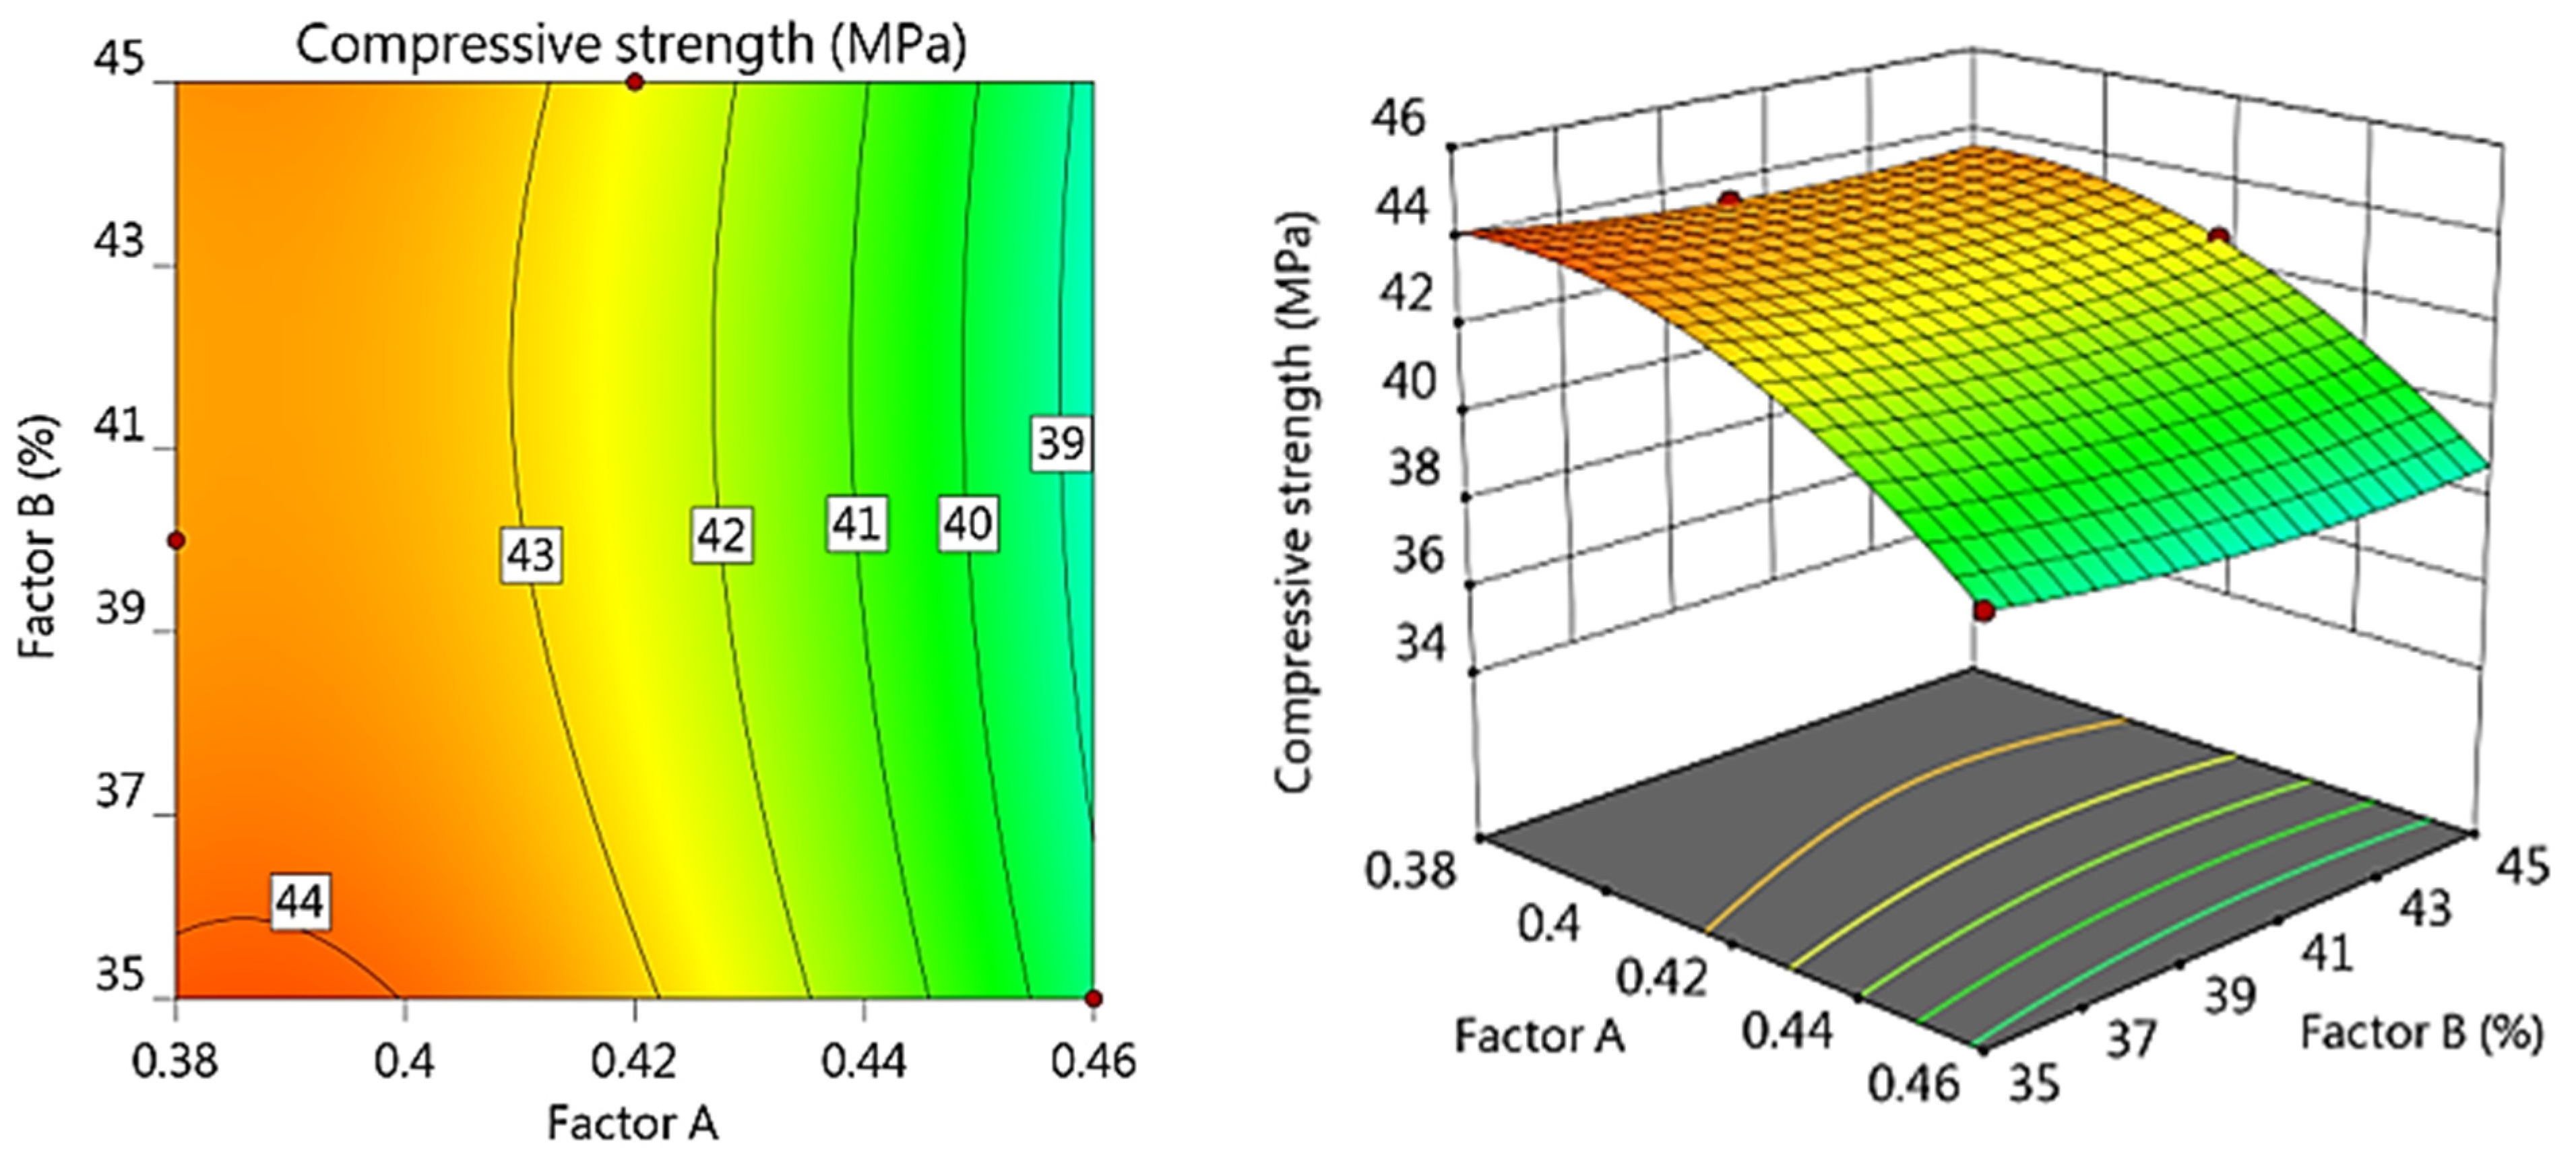
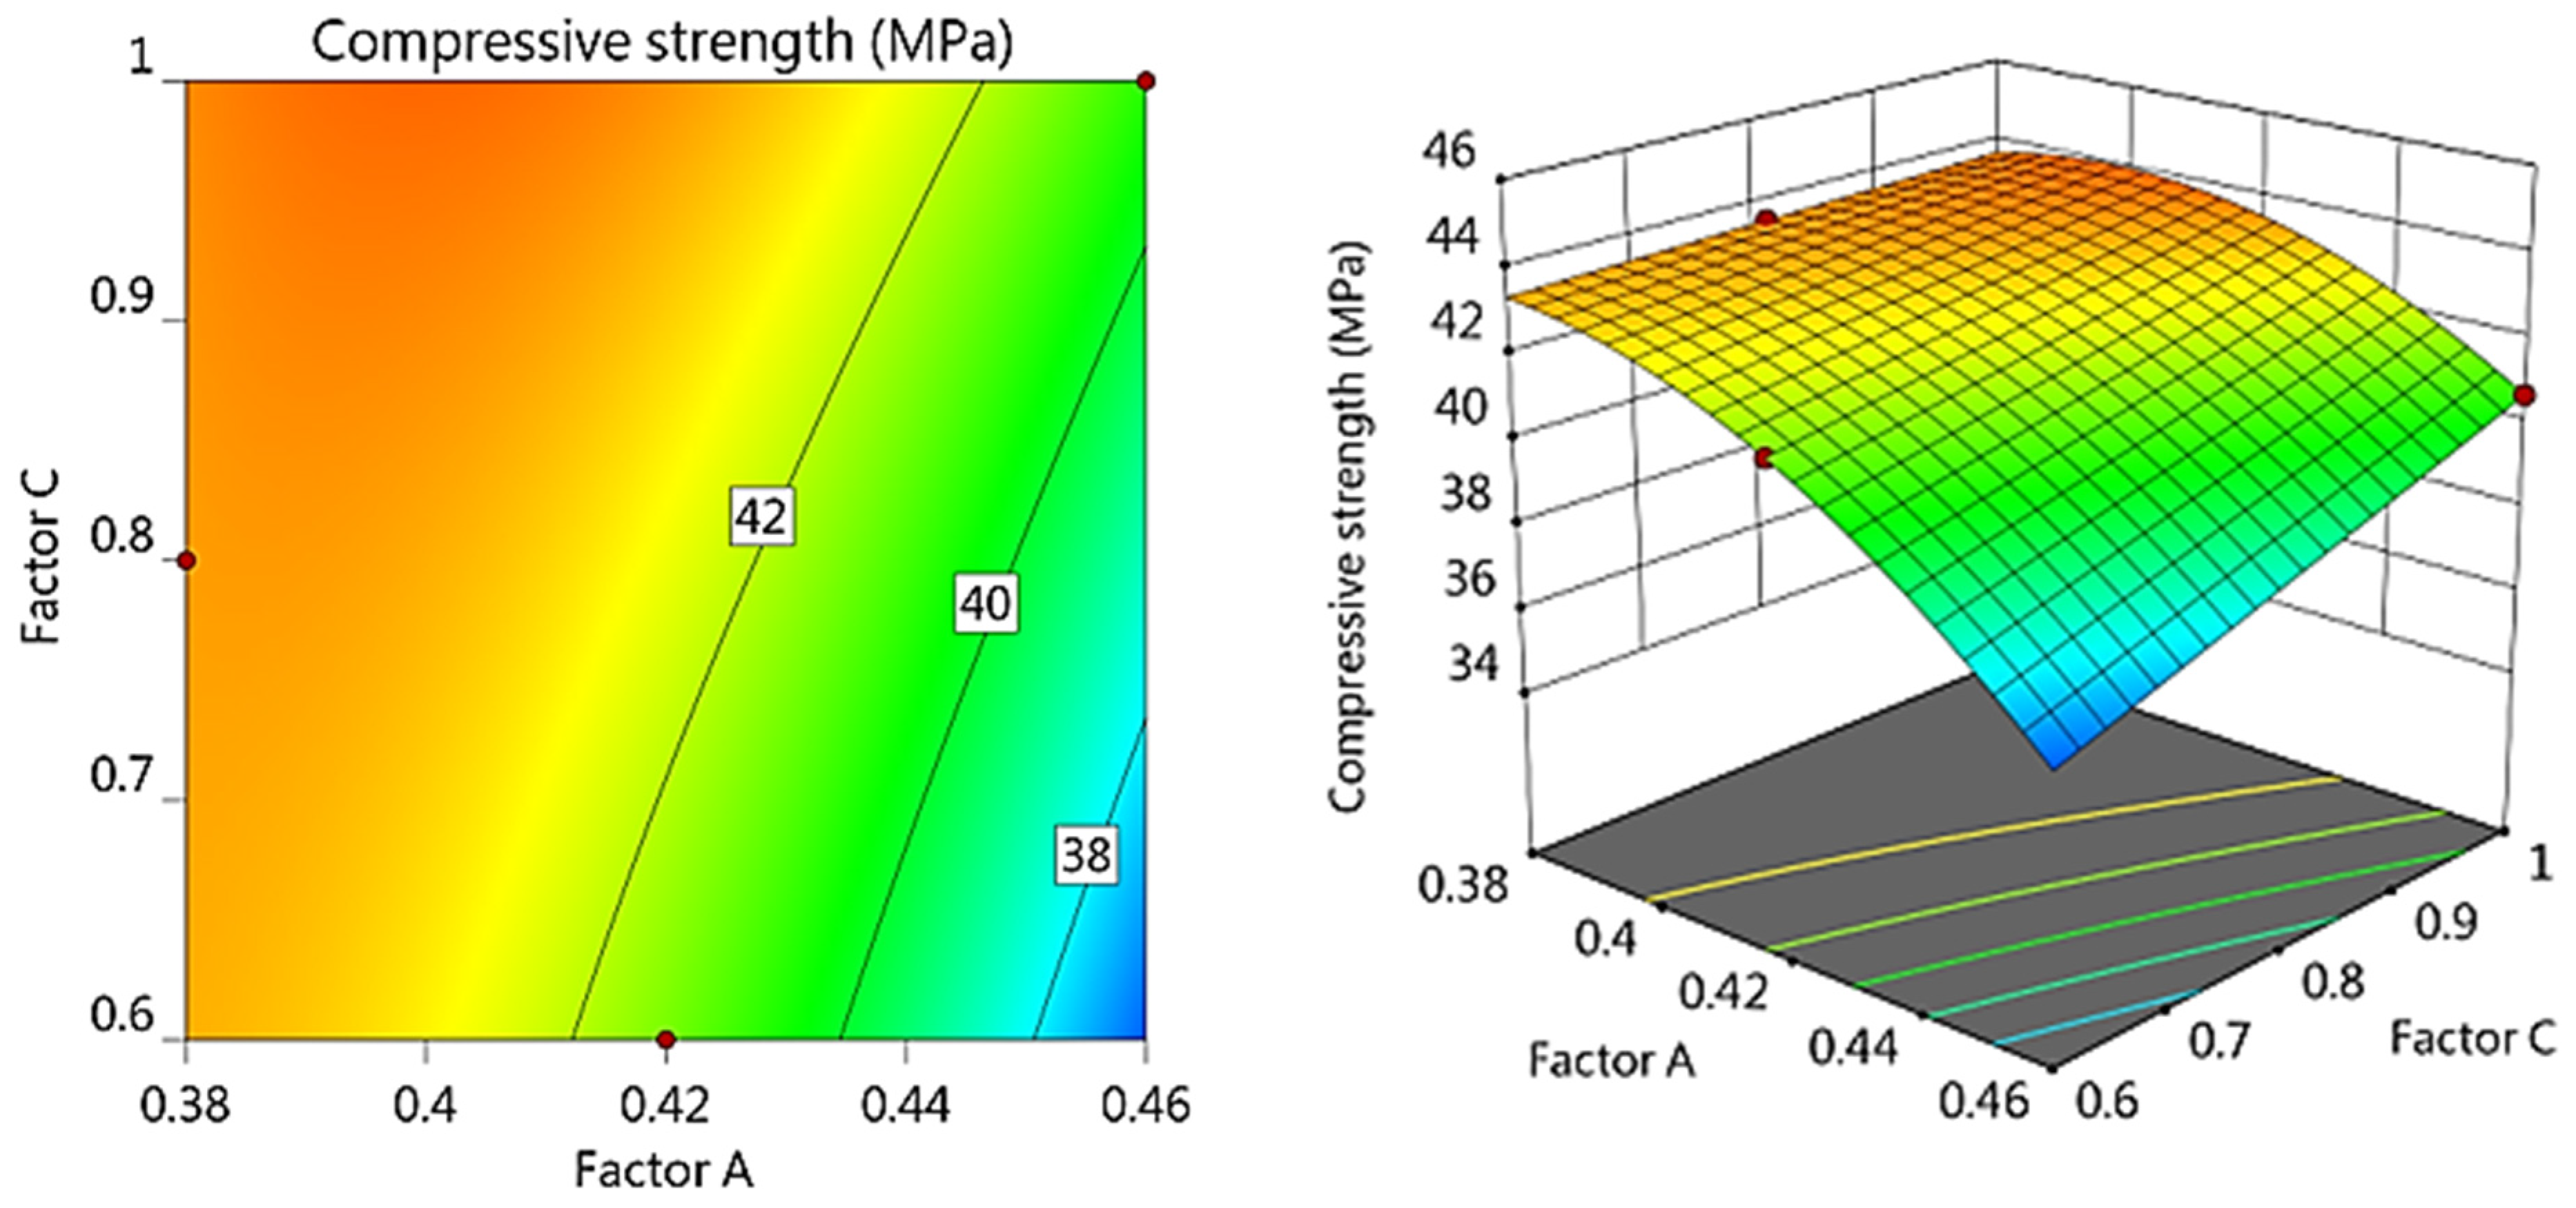
- Response surface analysis of factors influencing compressive strength.
From Figure 7, Figure 8 and Figure 9, it can be observed that when the water–cement ratio was maintained at 0.38, the compressive strength of concrete was higher at a sand ratio of 35%–36%, reaching around 44 MPa. When the sand ratio was maintained at 35%, and the steel fiber volume ratio was kept between 0.6% and 1%, the compressive strength of concrete remained almost constant at around 43 MPa. This also suggests that when the sand ratio is fixed, varying the amount of steel fiber between 0.6% and 1% has a relatively small impact on the compressive strength of concrete. When higher compressive strength is required for concrete, a steel fiber volume ratio between 0.6% and 1%, a water–cement ratio of 0.38, and a sand ratio of 35% would be suitable choices.

Figure 7.
The effect of AB factors on the compressive strength of concrete.
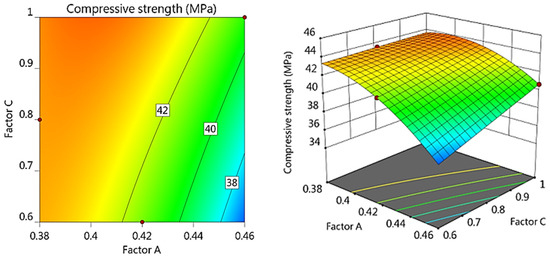
Figure 8.
The effect of BC factors on the compressive strength of concrete.
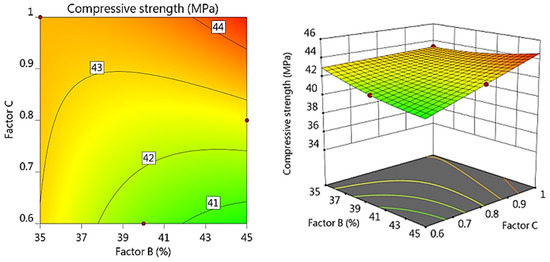
Figure 9.
The effect of AC factors on the compressive strength of concrete.
- (2)
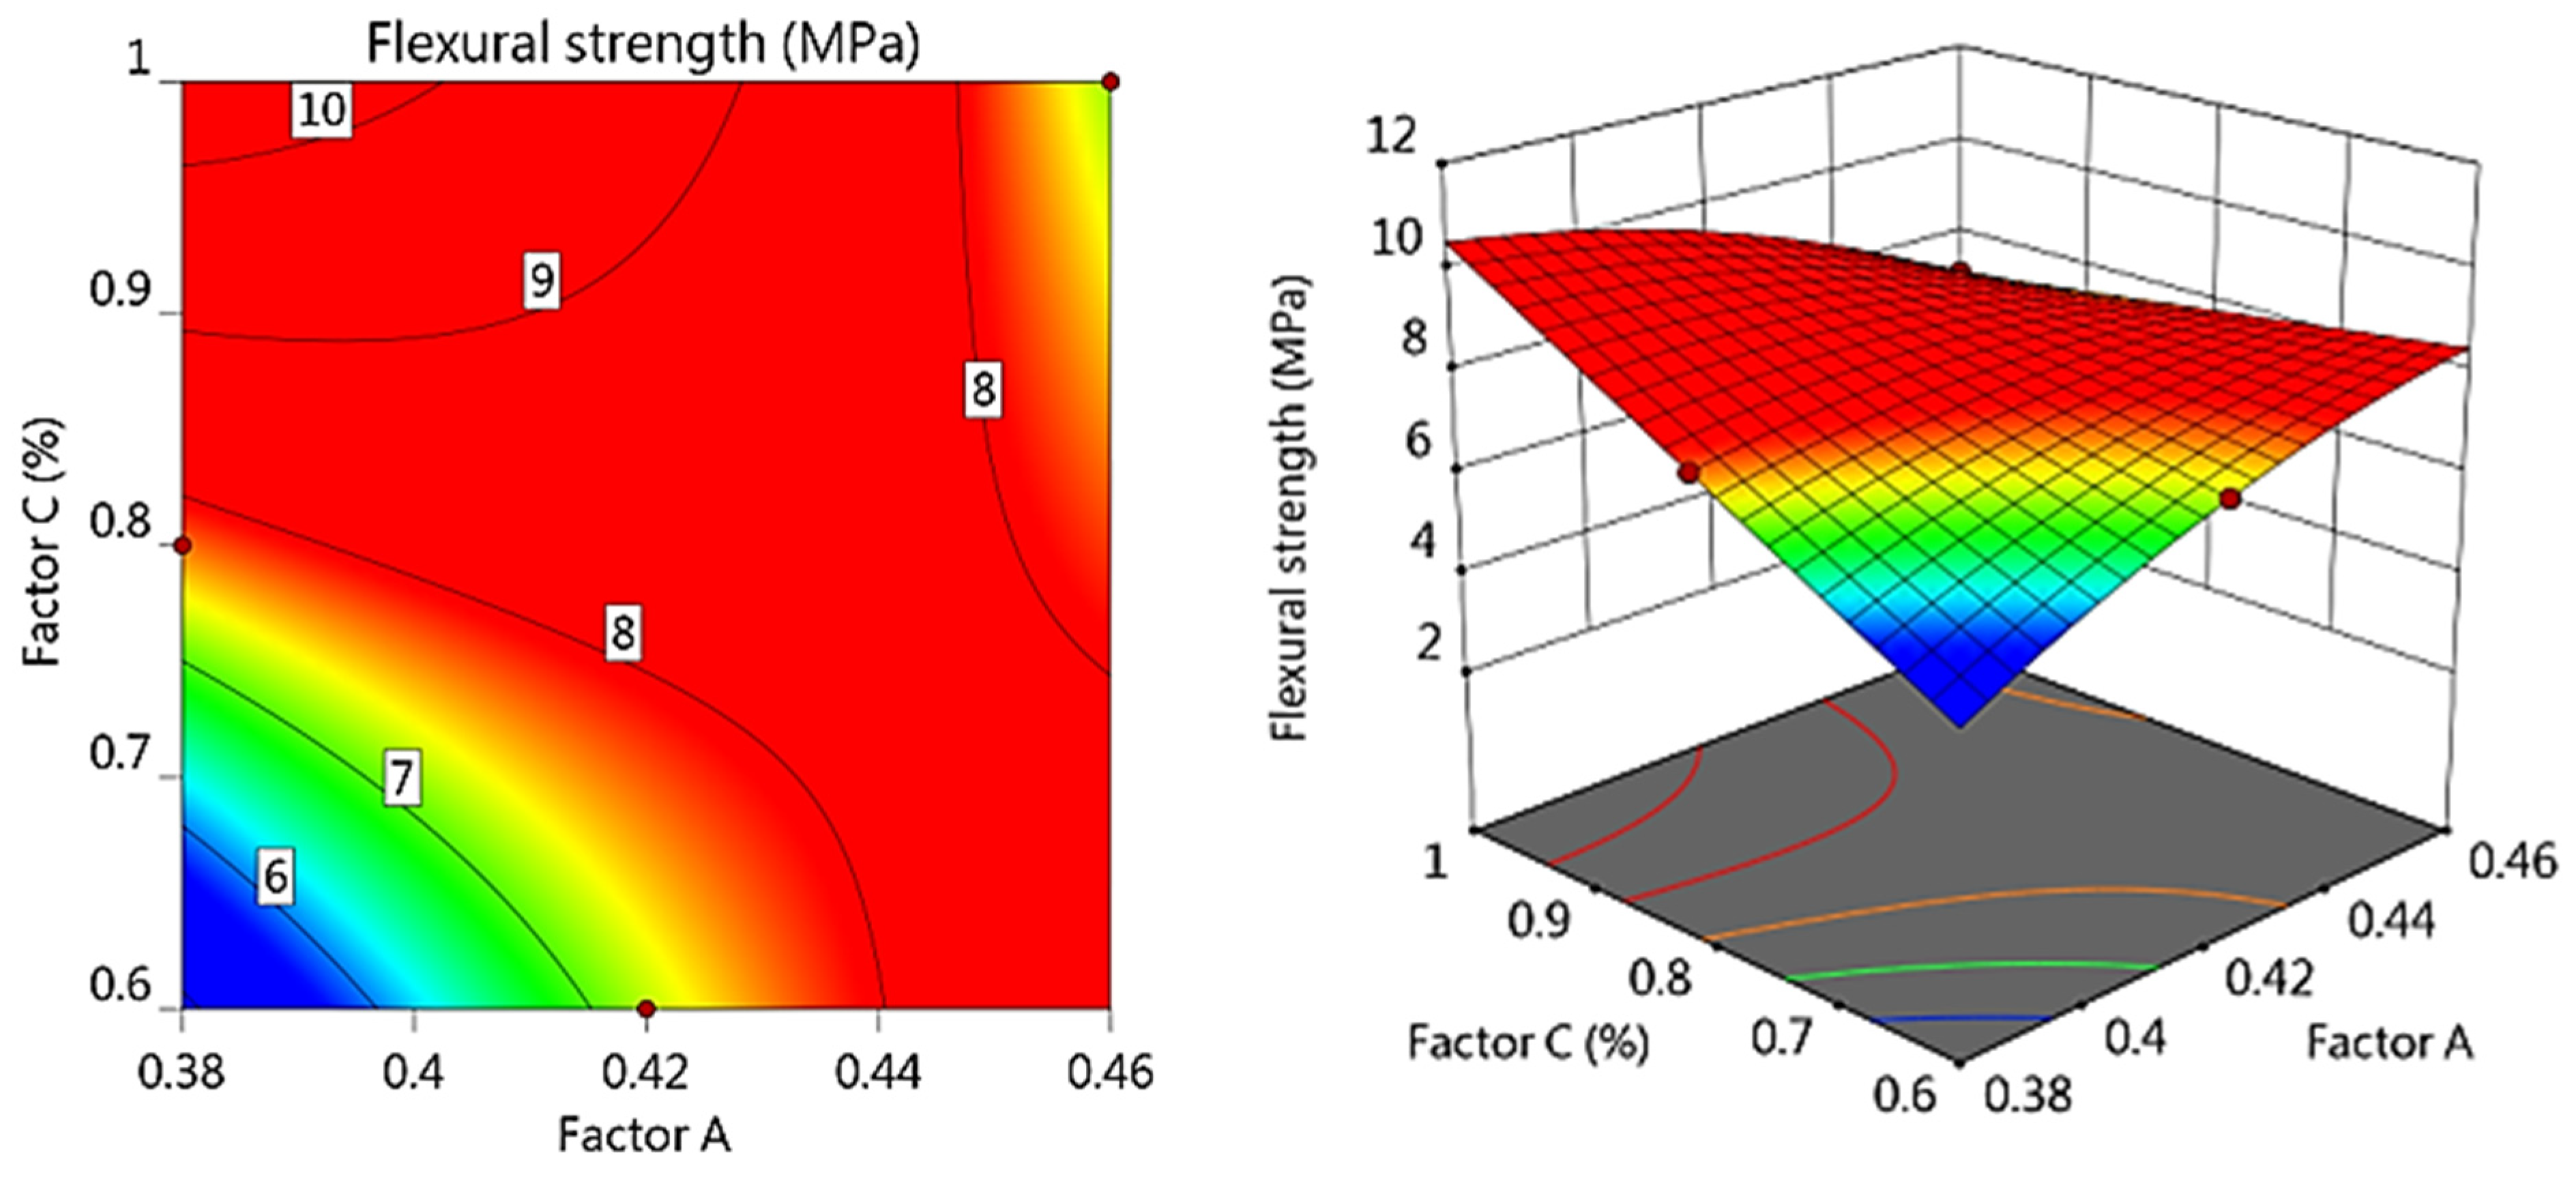
- Response surface analysis of factors influencing flexural strength.
From Figure 10, Figure 11 and Figure 12, it can be observed that the flexural strength of concrete was optimal when the water–cement ratio was between 0.38 and 0.42. At a sand ratio of 35%, the flexural strength of concrete was optimal when the steel fiber volume ratio was between 0.8% and 1%, with values above 7.94 MPa. At a water–cement ratio of 0.42, the flexural strength of concrete was optimal when the steel fiber volume ratio was between 0.8% and 1%, with values above 7.94 MPa. Therefore, to achieve the optimal flexural strength, the water–cement ratio can be selected as 0.38 or 0.42, the steel fiber volume ratio can be selected as 0.6% or 1%, and the sand ratio can be between 35% and 40%. However, when the steel fiber volume ratio is selected as 0.6%, the water–cement ratio should be around 0.42.
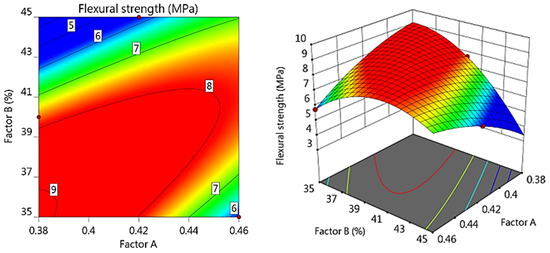
Figure 10.
The effect of AB factors on the flexural strength of concrete.
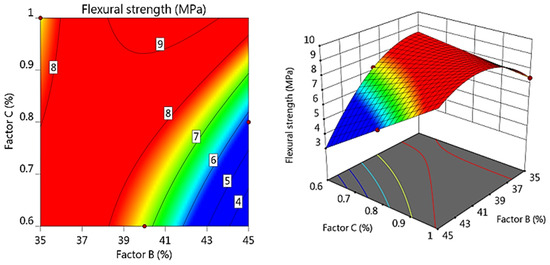
Figure 11.
The effect of BC factors on the flexural strength of concrete.

Figure 12.
The effect of AC factors on the flexural strength of concrete.
- (3)
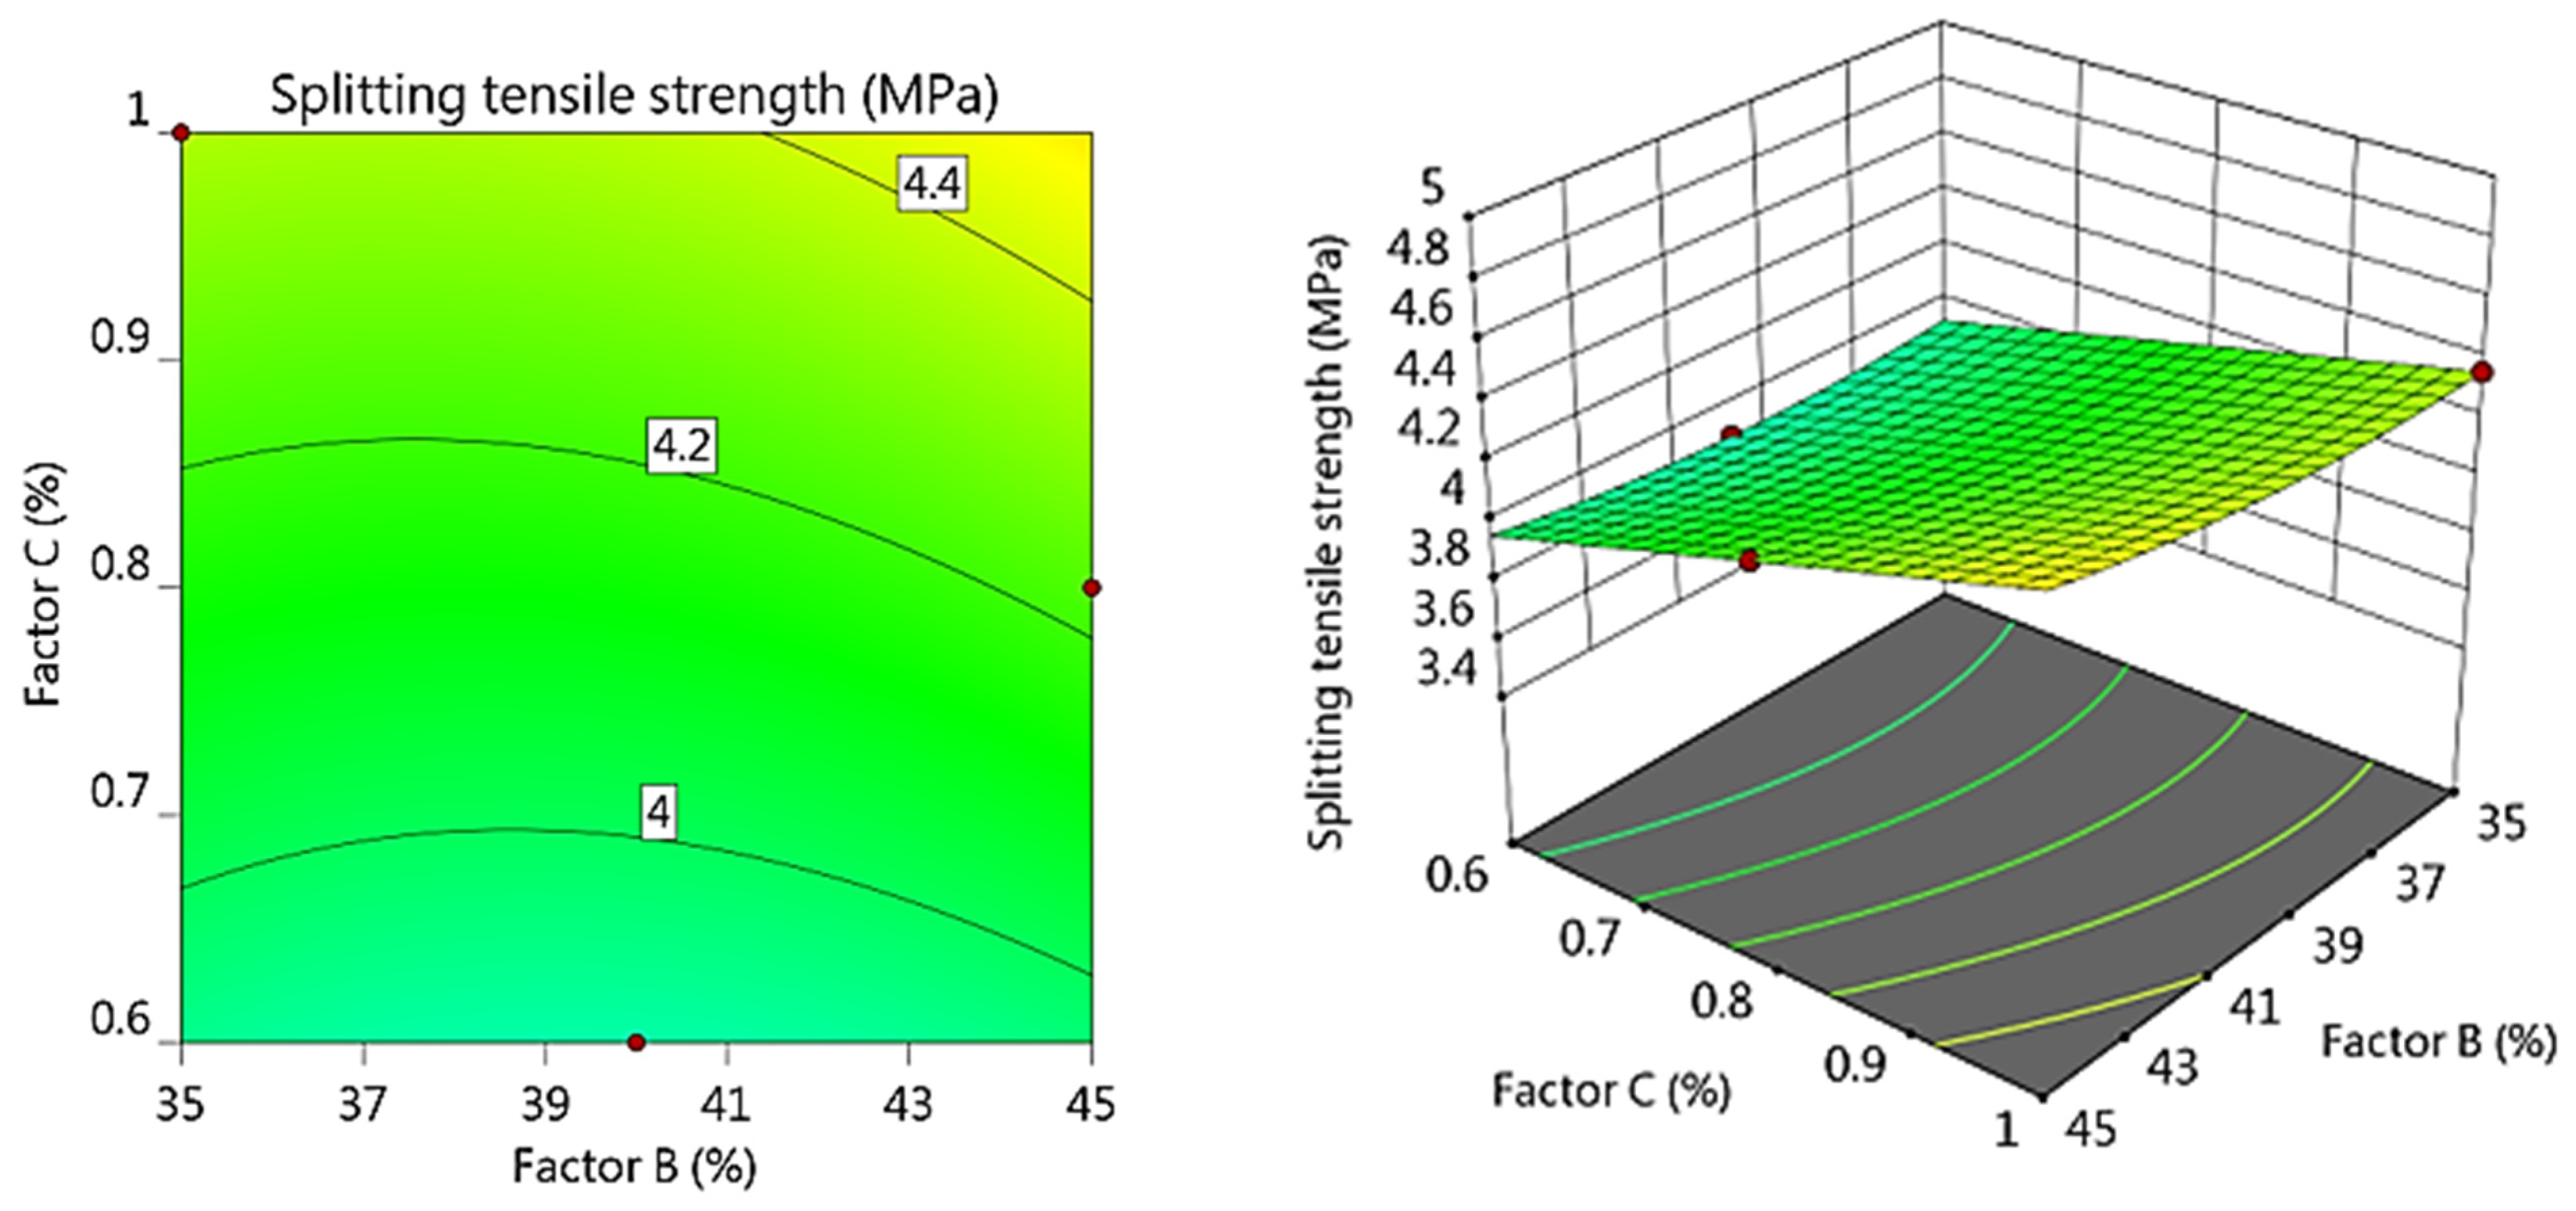
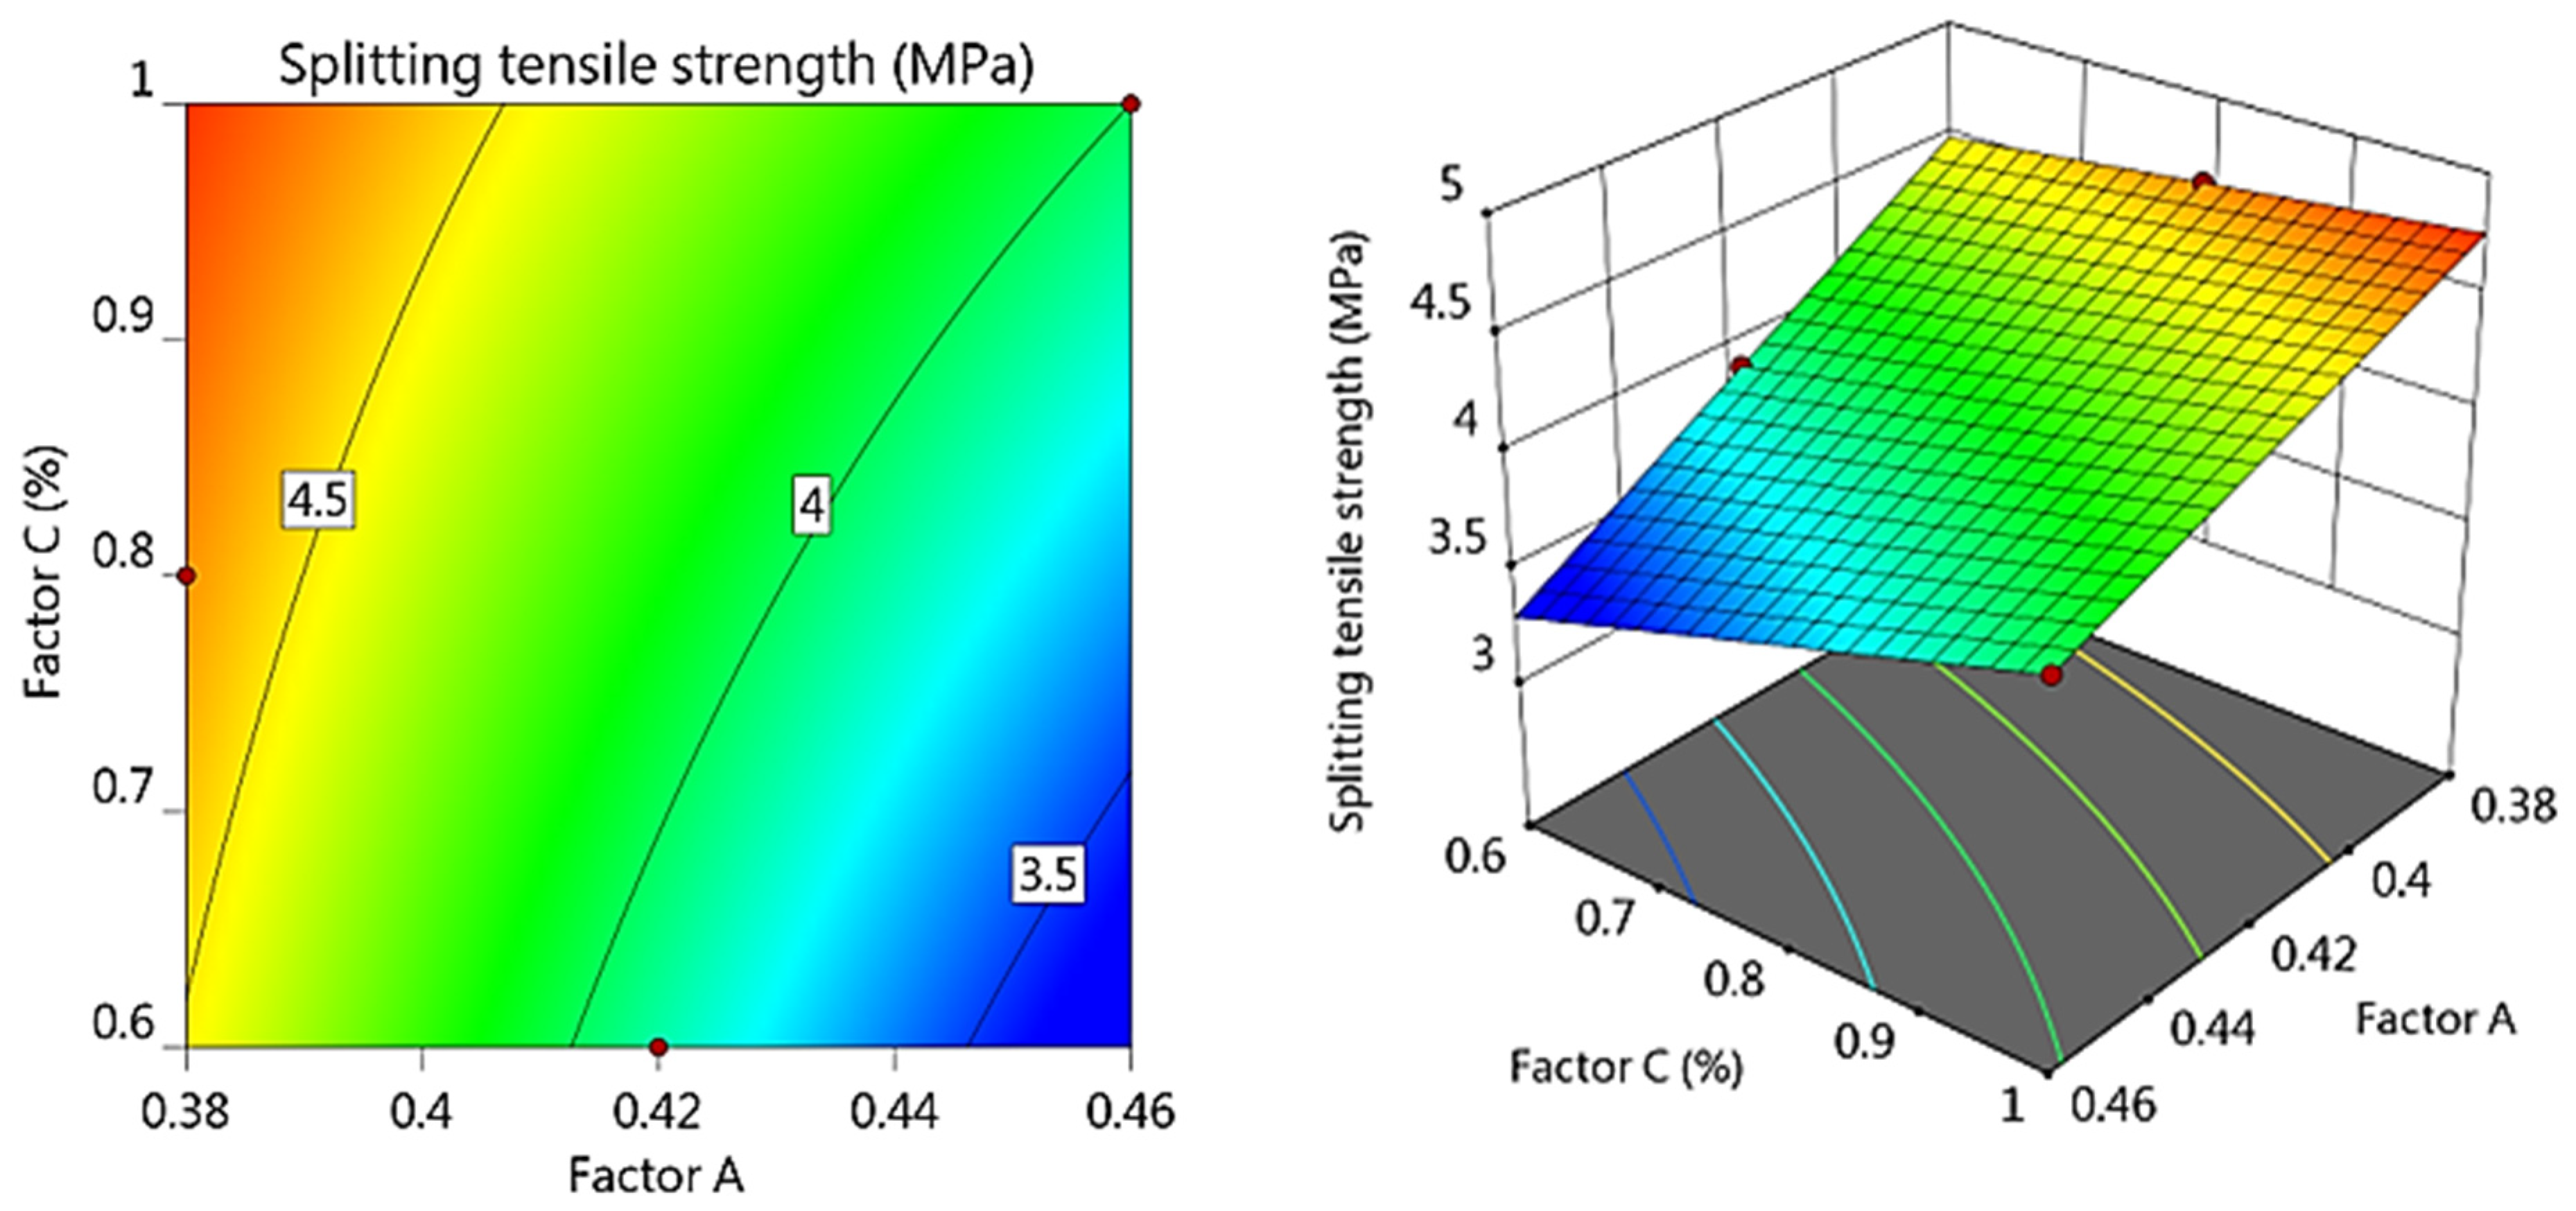
- Response surface analysis of factors influencing splitting tensile strength.
From Figure 13, Figure 14 and Figure 15, it can be observed that when the water–cement ratio was maintained at 0.38, the splitting tensile strength of concrete was optimal at a sand ratio between 35% and 45%, with values above 4.6 MPa. At a sand ratio of 40%–45%, the splitting tensile strength of concrete was optimal when the steel fiber volume ratio was 1%, with values above 4.4 MPa. At a water–cement ratio of 0.38, the splitting tensile strength of concrete was optimal when the steel fiber volume ratio was between 0.6% and 1%, with values above 4.5 MPa. Therefore, to achieve the optimal splitting tensile strength, the water–cement ratio can be selected as 0.38, the steel fiber volume ratio can be between 0.6% and 1%, and the sand ratio can be between 35% and 40%.
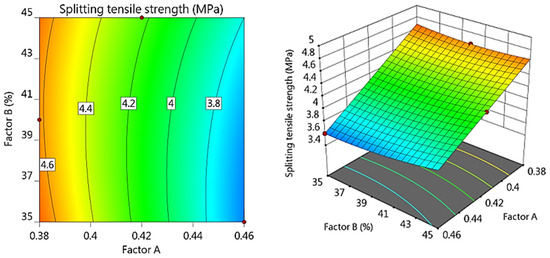
Figure 13.
The effect of AB factors on the splitting tensile strength of concrete.

Figure 14.
The effect of BC factors on the splitting tensile strength of concrete.
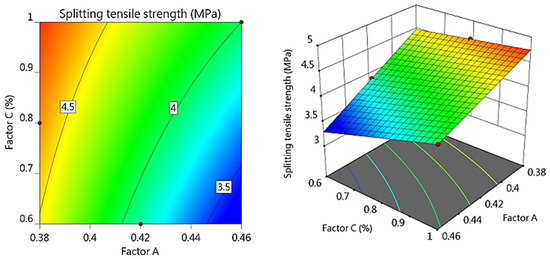
Figure 15.
The effect of AC factors on the splitting tensile strength of concrete.
3.2.4. Analysis of Factor Indicators
The results of the data from the extreme variance analysis are usually used in the next step of the hierarchical analysis, where the volatility and dispersion of the data can be detected. When making decisions, the results of the extreme variance analysis can be used to determine which factors have a greater impact on the results so that higher weights and priorities can be given in the AHP analysis, which in turn leads to more accurate decisions and planning.
The factor level weights of collapse compressive strength, flexural strength, and split tensile strength can be obtained by analyzing the results of the extreme variance analysis through the AHP hierarchical analysis method, and the calculated data are as follows in Table 13, Table 14, Table 15 and Table 16.
Table 13.
Collapse factor level weights.
Table 14.
Compressive strength factor level weights.
Table 15.
Flexural strength factor level weights.
Table 16.
Split tensile strength factor level weights.
From Table 13, we can see that the influence weight from high to low is water–cement ratio > steel fiber admixture > sand rate > fly ash content. It can be seen that when the water–cement ratio was 0.46, the sand rate was 40 percent, and the steel fiber admixture was 0.6, the flowability of steel fiber concrete was the best, and the effect of fly ash content on flowability was negligible.
From Table 14, it can be obtained that the influence weights from high to low are water–cement ratio > steel fiber admixture > fly ash content > sand rate. It can be seen that when the water–cement ratio was 0.38, the sand rate was 35 percent, the steel fiber admixture was 1.0, and the fly ash content was 0, the compressive performance of steel fiber concrete was optimal.
From Table 15, it can be obtained that the influence weights from high to low are water–cement ratio > steel fiber admixture > sand rate > fly ash content. It can be seen that when the water–cement ratio was 0.38, the sand rate was 40 percent, the steel fiber admixture was 0.8, and the fly ash content was 20, the flexural performance of steel fiber concrete was optimal.
From Table 16, it can be obtained that the influence weights from high to low are water–cement ratio > steel fiber admixture > fly ash content > sand rate. It can be seen that when the water–cement ratio was 0.38, the sand rate was 35 percent, the steel fiber admixture was 1.0, and the fly ash content was 0, the splitting tensile properties of steel fiber concrete were optimal.
4. Optimal Mix Proportion Selection and Experimental Verification
4.1. Mix Proportion Selection
After considering that the road slab is mainly subjected to bending failure, as well as mechanical properties, microstructure, and economic costs, the final selected optimal mix proportion is shown in Table 17.
Table 17.
Optimal mix ratio combination.
To investigate the improvement in the mechanical properties of concrete under the optimal mix proportion, an experiment was designed with a blank control group where the steel fiber content was 0 kg/m3, and the fly ash content was 0 kg/m3, while other factors remained constant. The 28-day mechanical properties were studied.
From Figure 16, it is evident that compared with ordinary concrete, the compressive, flexural, and splitting tensile strengths of the optimal proportioned steel fiber-reinforced concrete increased by 3%, 19%, and 33%, respectively.
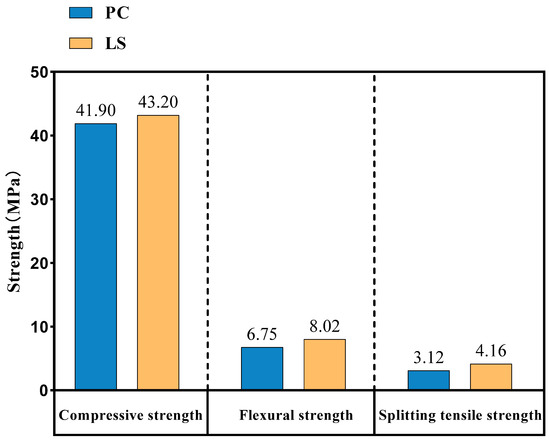
Figure 16.
Comparison verification.
Moderate water–cement ratios and sand rates, due to their low cost, make this concrete not too expensive. The only part of the material that brings a high price is effectively controlled by using a minimum amount of steel fibers. Fly ash, as the main solid waste from coal-fired power plants, is much cheaper. Therefore, the price of steel fiber concrete produced by this mix is well suited to the market demand, which reduces the cost of its possible application to roads.
4.2. Analysis of Optimal Proportioning Strength at Different Ages
In addition, in order to verify the suitability of the ratio, a total of five groups of nine specimens each were made according to the optimum ratio and cured under standard conditions for 3, 7, 28, 60, and 90 days, and strength tests were conducted at these different ages. The mechanical properties of this concrete were analyzed at each age.
The variation of LSFRC compressive strength, flexural strength, and split tensile strength with the increase in the age of maintenance can be obtained from the measured data; see Figure 17, Figure 18 and Figure 19.
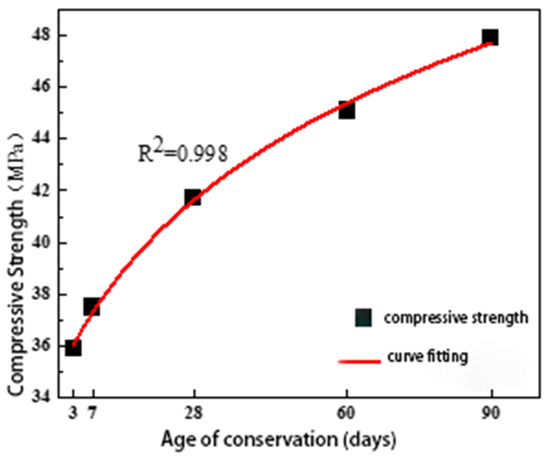
Figure 17.
Relationship between age of maintenance and compressive strength of LSFRC.

Figure 18.
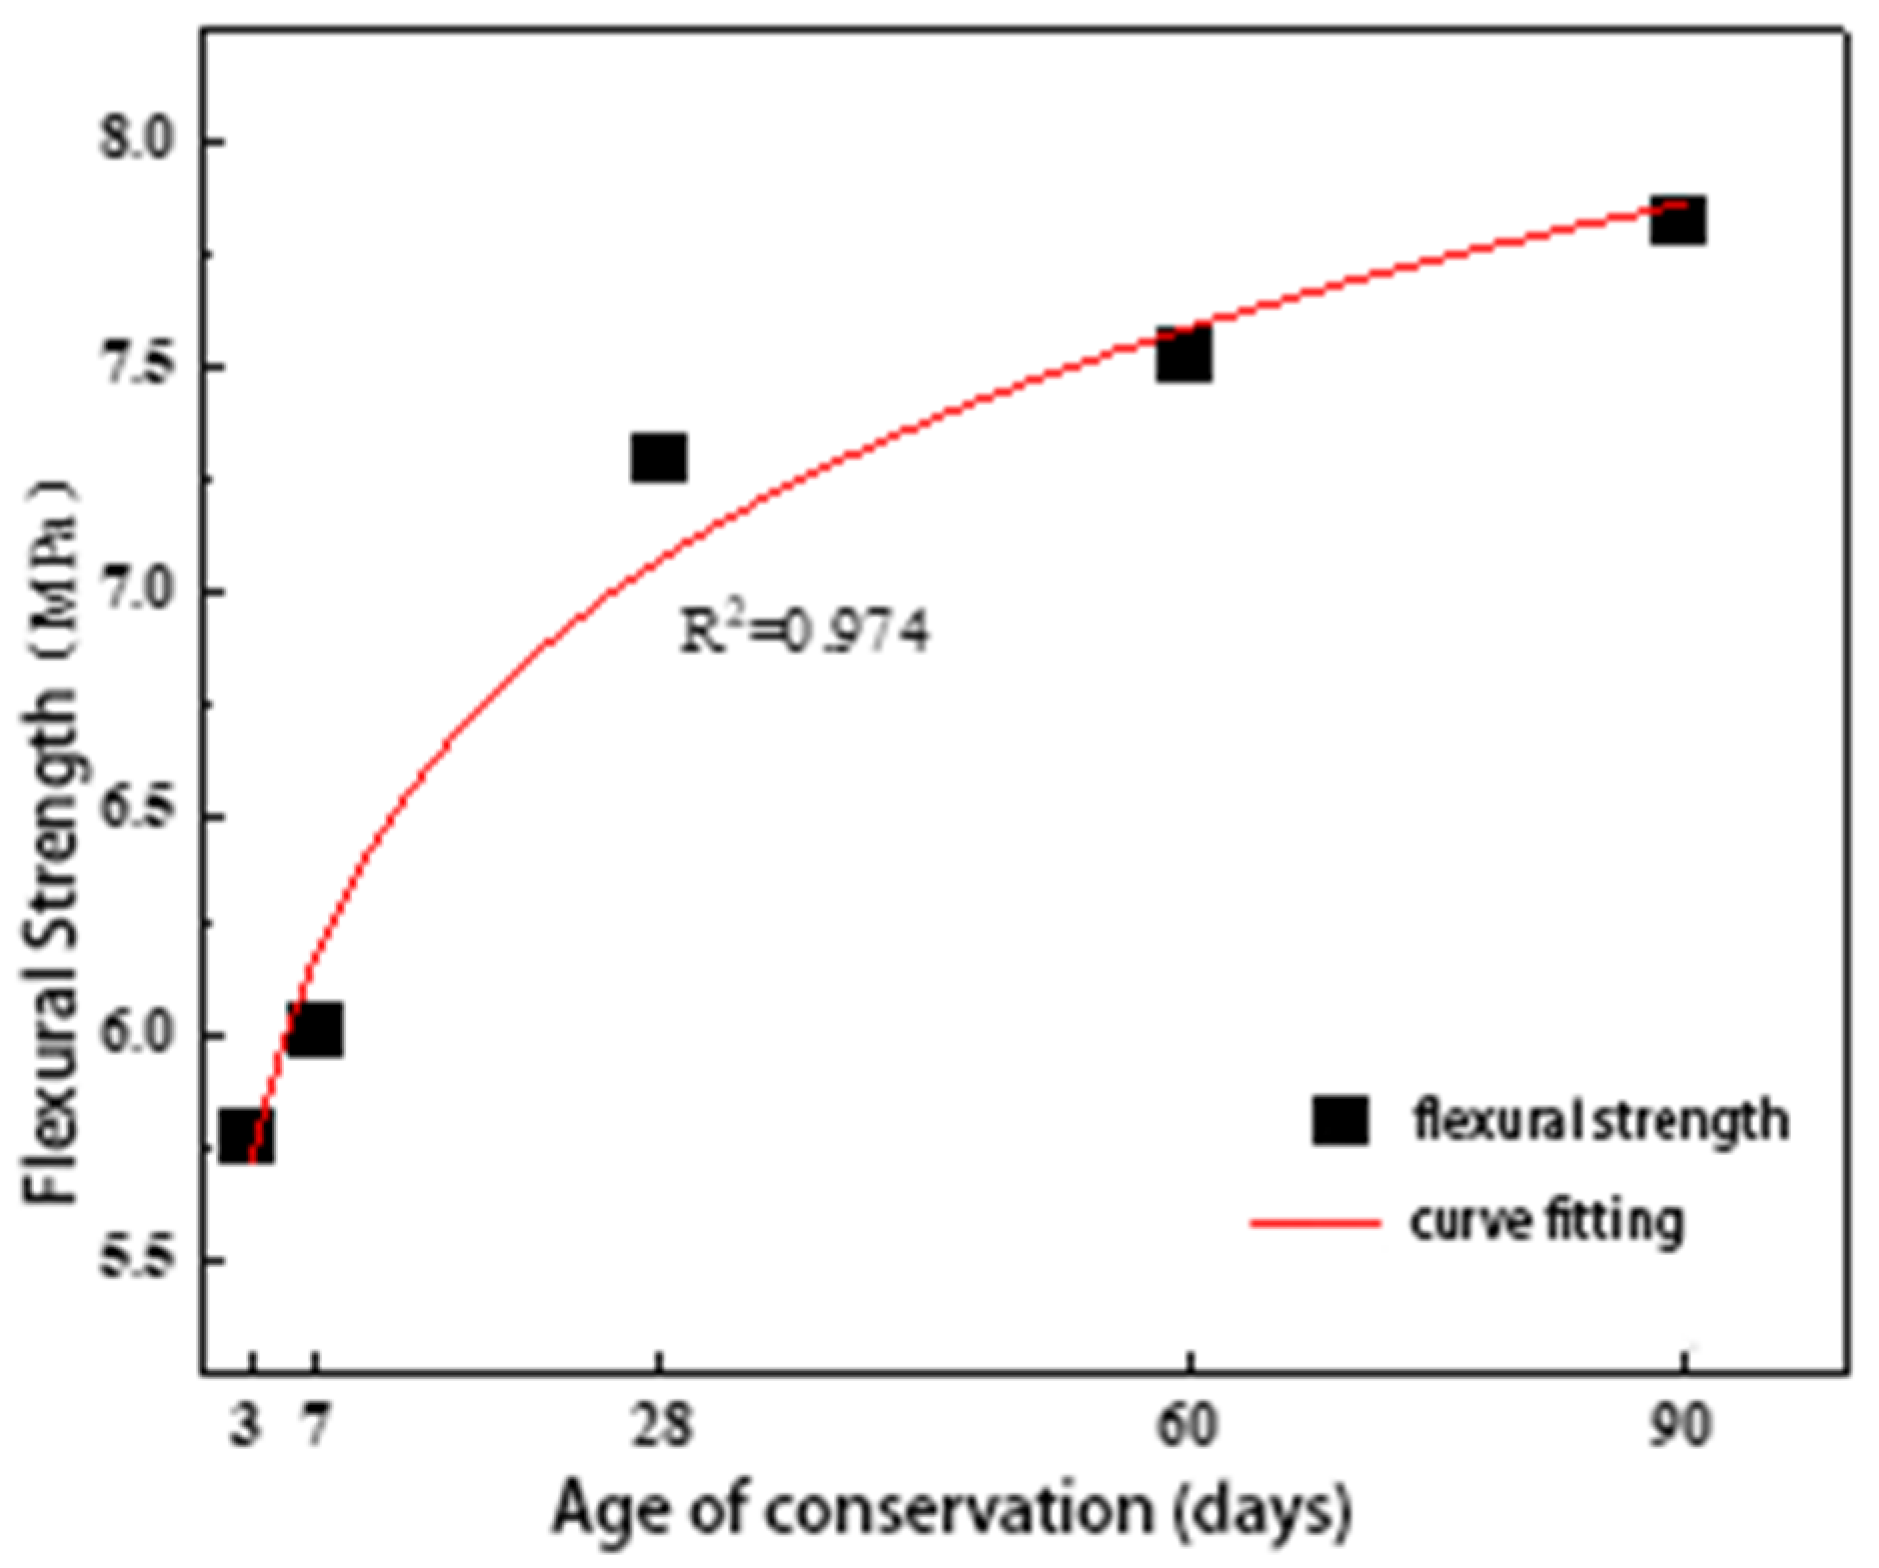
Relationship between age of maintenance and flexural strength of LSFRC.

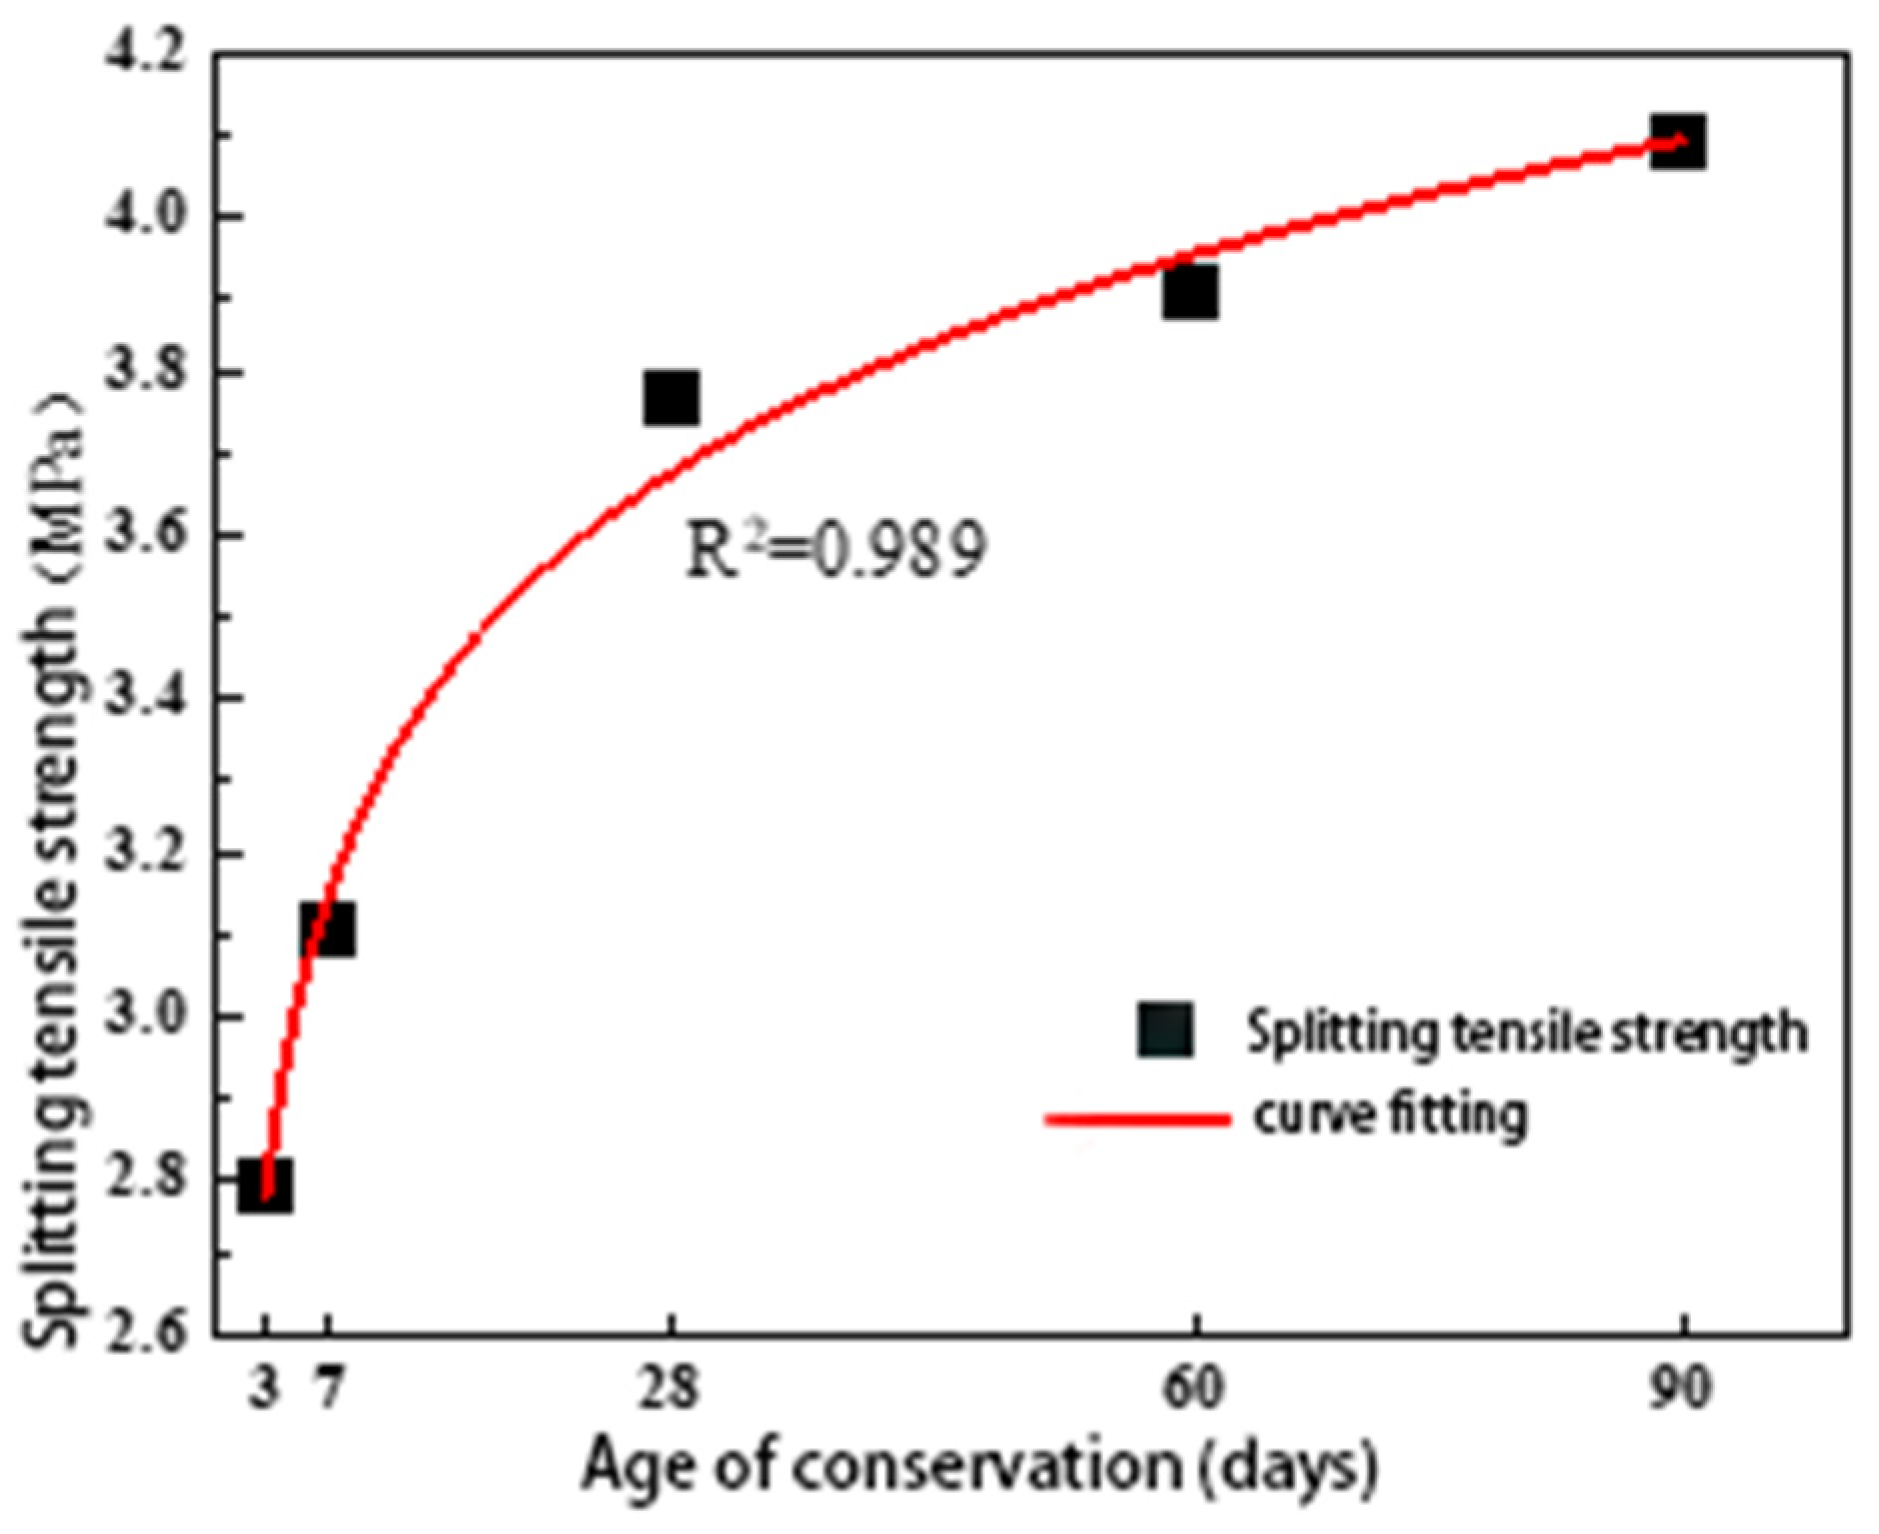
Figure 19.
Relationship between age of maintenance and splitting strength of LSFRC.
Based on the data in Table 18 and the representation of Figure 17, Figure 18 and Figure 19, it can be inferred that the compressive strength of LSFRC at the age of 28 days with the standard curing period decreased by 5.8 MPa and 4.8 MPa, respectively, when the curing period was 3 days and 7 days. This indicates that the compressive strength of LSFRC at the early ages of 3 days and 7 days, respectively, reached 86% and 90% of the standard curing period compressive strength. Moreover, when the curing period was extended to 60 days and 90 days, the compressive strength of LSFRC increased by 3.4 MPa and 5.2 MPa, respectively, compared with the standard curing period strength value (41.7 MPa), exceeding the standard curing period compressive strength by 8% and 15%. The splitting tensile strength values of LSFRC decreased by 0.98 MPa and 0.66 MPa, and the splitting tensile strength of LSFRC decreased by 35% and 21%. This means that the compressive strength of LSFRC at the early ages of 3 days and 7 days, respectively, reached 65% and 79% of the standard curing period compressive strength. When the curing period was extended to 60 days and 90 days, the compressive strength of LSFRC increased by 0.13 MPa and 0.32 MPa, respectively, compared with the standard curing period strength value (3.77 MPa), exceeding the standard curing period splitting tensile strength by 3% and 8%. The flexural strength values of LSFRC decreased by 1.75 MPa and 1.28 MPa, and the splitting tensile strength of LSFRC decreased by 24% and 18%. This means that the compressive strength of LSFRC at the early ages of 3 days and 7 days, respectively, reached 76% and 82% of the standard curing period compressive strength. When the curing period was extended to 60 days and 90 days, the compressive strength of LSFRC increased by 0.23 MPa and 0.53 MPa, respectively, compared with the standard curing period strength value (3.77 MPa), exceeding the standard curing period flexural strength by 3% and 7%.
Table 18.
Mechanical performance strength values of LS-5 at different ages.
4.3. Microscopic Analysis
Concrete material is a non-homogeneous three-phase composite material; its internal structure contains more pores. Environment, time, and other factors have a significant impact on its performance and chemical composition. The microstructure and the strength of concrete are inextricably linked, so the changes in the internal microstructure of concrete are also a prerequisite for the macroscopic performance of the strength of the changes in the prerequisites and bases.
On the basis of the compressive damage test, suitable concrete particles were selected for electron microscope scanning, and SEM electron microscope scanning photographs of steel fiber concrete with representative curing age (7 d, 28 d, 90 d) were selected for comparative analysis, to analyze the changes in the number of pores and cracks in the interfacial transition zone of the hydration products of concrete and the performance enhancement mechanism with the evolution of time.
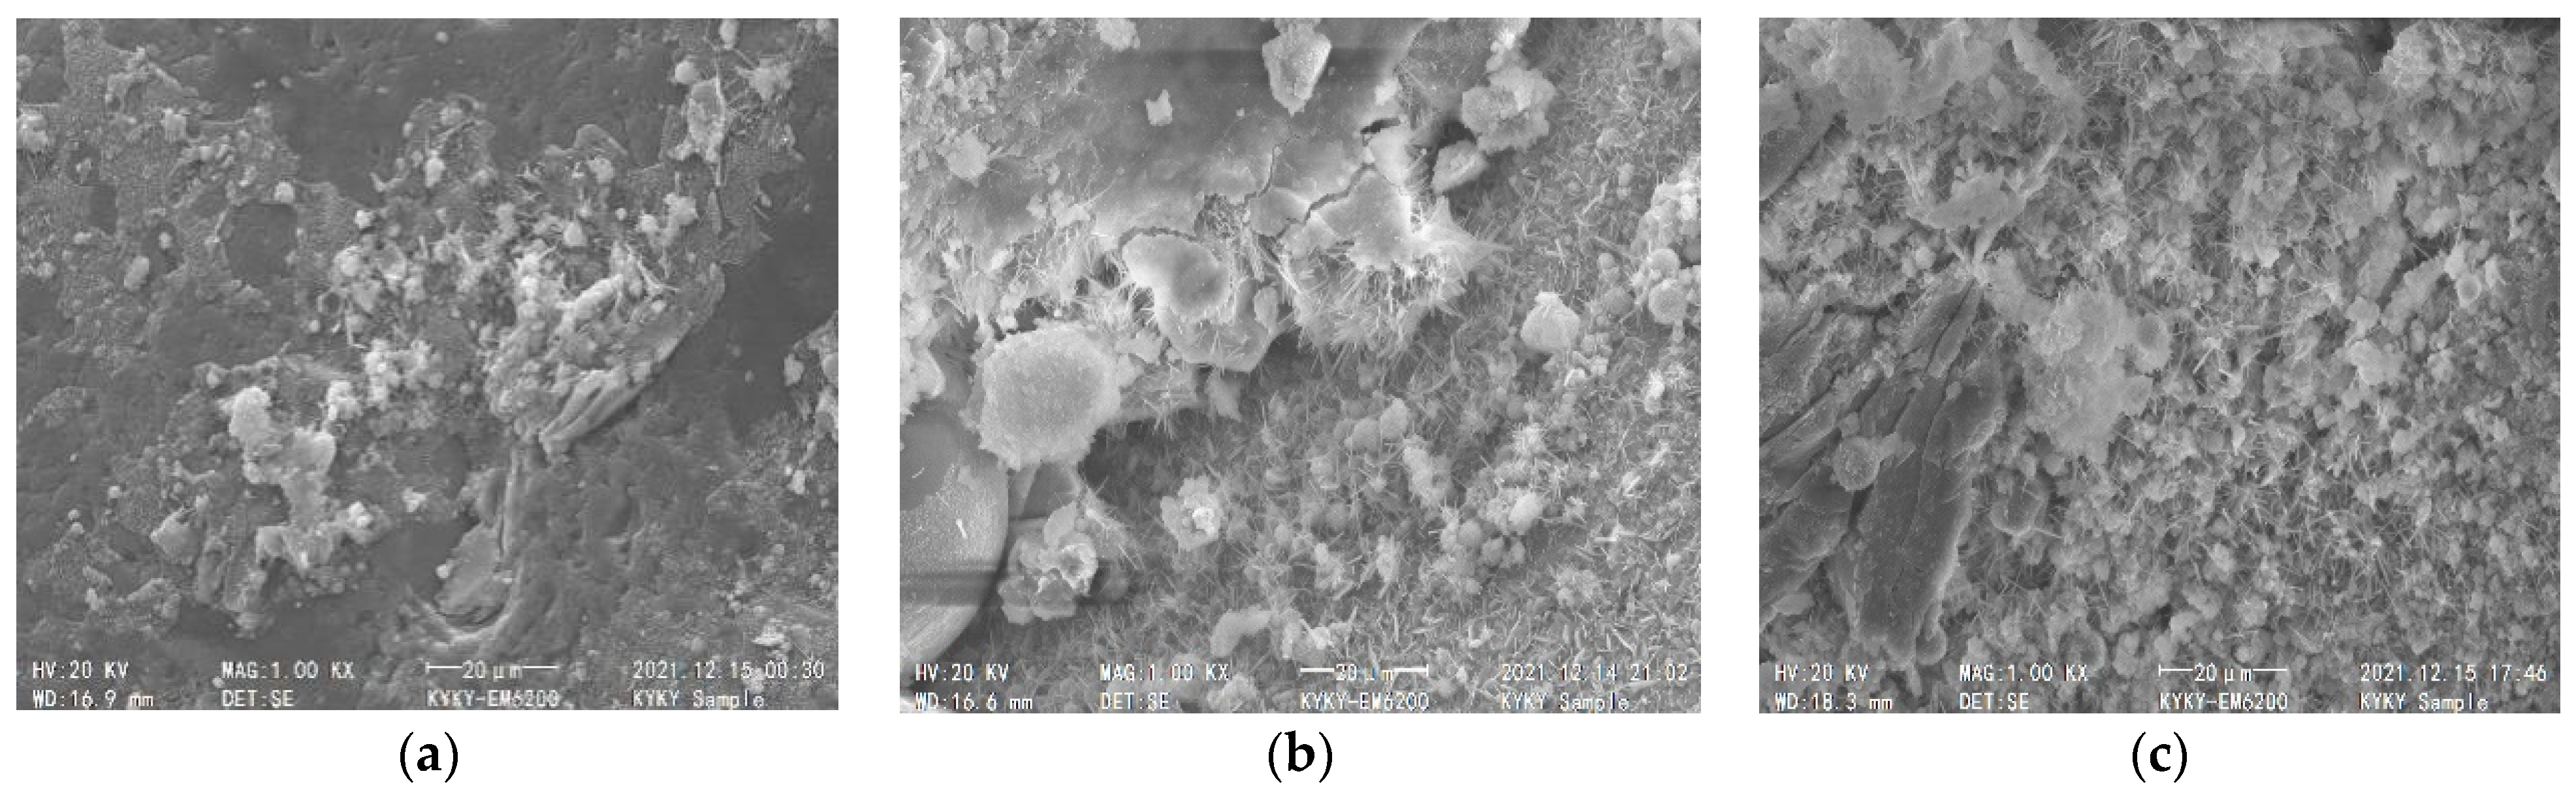
From Figure 20a, it can be seen that the hydration products produced at 7 d curing age were relatively small; Figure 20b shows that the number of hydration products at the age of 14 days was improved compared with that of 7 days, and the honeycomb structure and flocculent products were stacked and overlapped, resulting in intersecting mesh structure, which improves the mechanical occlusion effect and connectivity between the cohesive bodies; Figure 20c shows that the hydration products at the age of 90 d were more than those produced by 28 d, indicating that the degree of hydration in the sample was still improved even after reaching the age of concrete. Products were more than those produced at 28 d, indicating that the degree of hydration in the samples was still increasing even after the concrete reached the age, and the compactness of the concrete was improved to a certain extent because the internal pores of the concrete were filled so that the concrete became a homogeneous and dense continuum.
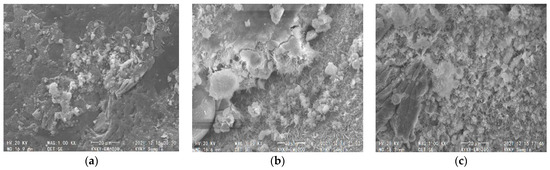
Figure 20.
Hydration products at different ages. (a) 7 d. (b) 28 d. (c) 90 d.
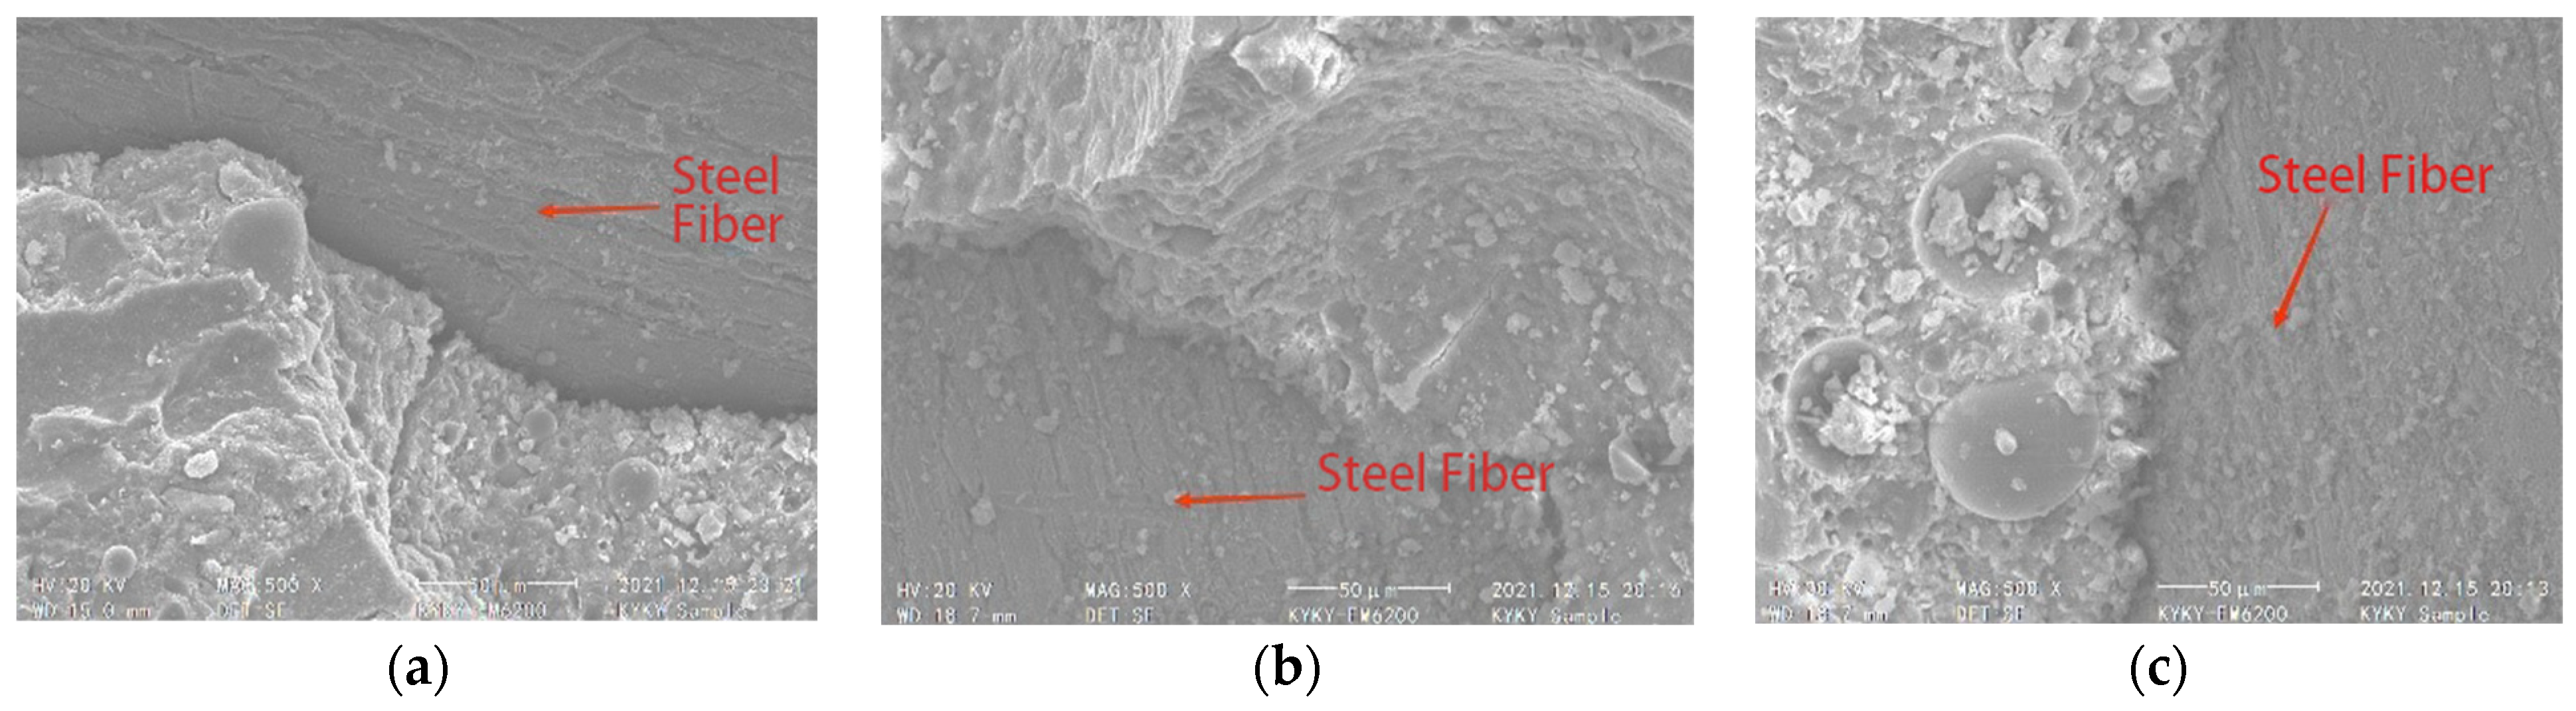
As can be seen in Figure 21a, the transition zone of steel fiber-cement paste at the age of 7 d curing appeared obvious crack gaps on the surface of the fiber, and the steel fiber appeared to be loose in the structure after dialing out the damage, and more obvious vertical cracks appeared at the paste. As can be seen in Figure 21b, there was no obvious gap between the steel fibers and the paste, and there was a good adhesion between the paste and the steel fibers. After the destruction of the concrete, only a few micro-cracks were produced; from Figure 21c, it can be seen that with the increase in age, the connection between the steel fibers and the slurry is tighter, so that the mechanical properties and density of the concrete as a whole are also enhanced.
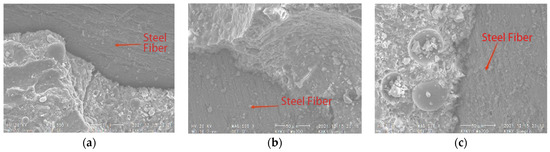
Figure 21.
Cracks in the fiber–cement slurry transition zone at different ages. (a) 7 d. (b) 28 d. (c) 90 d.
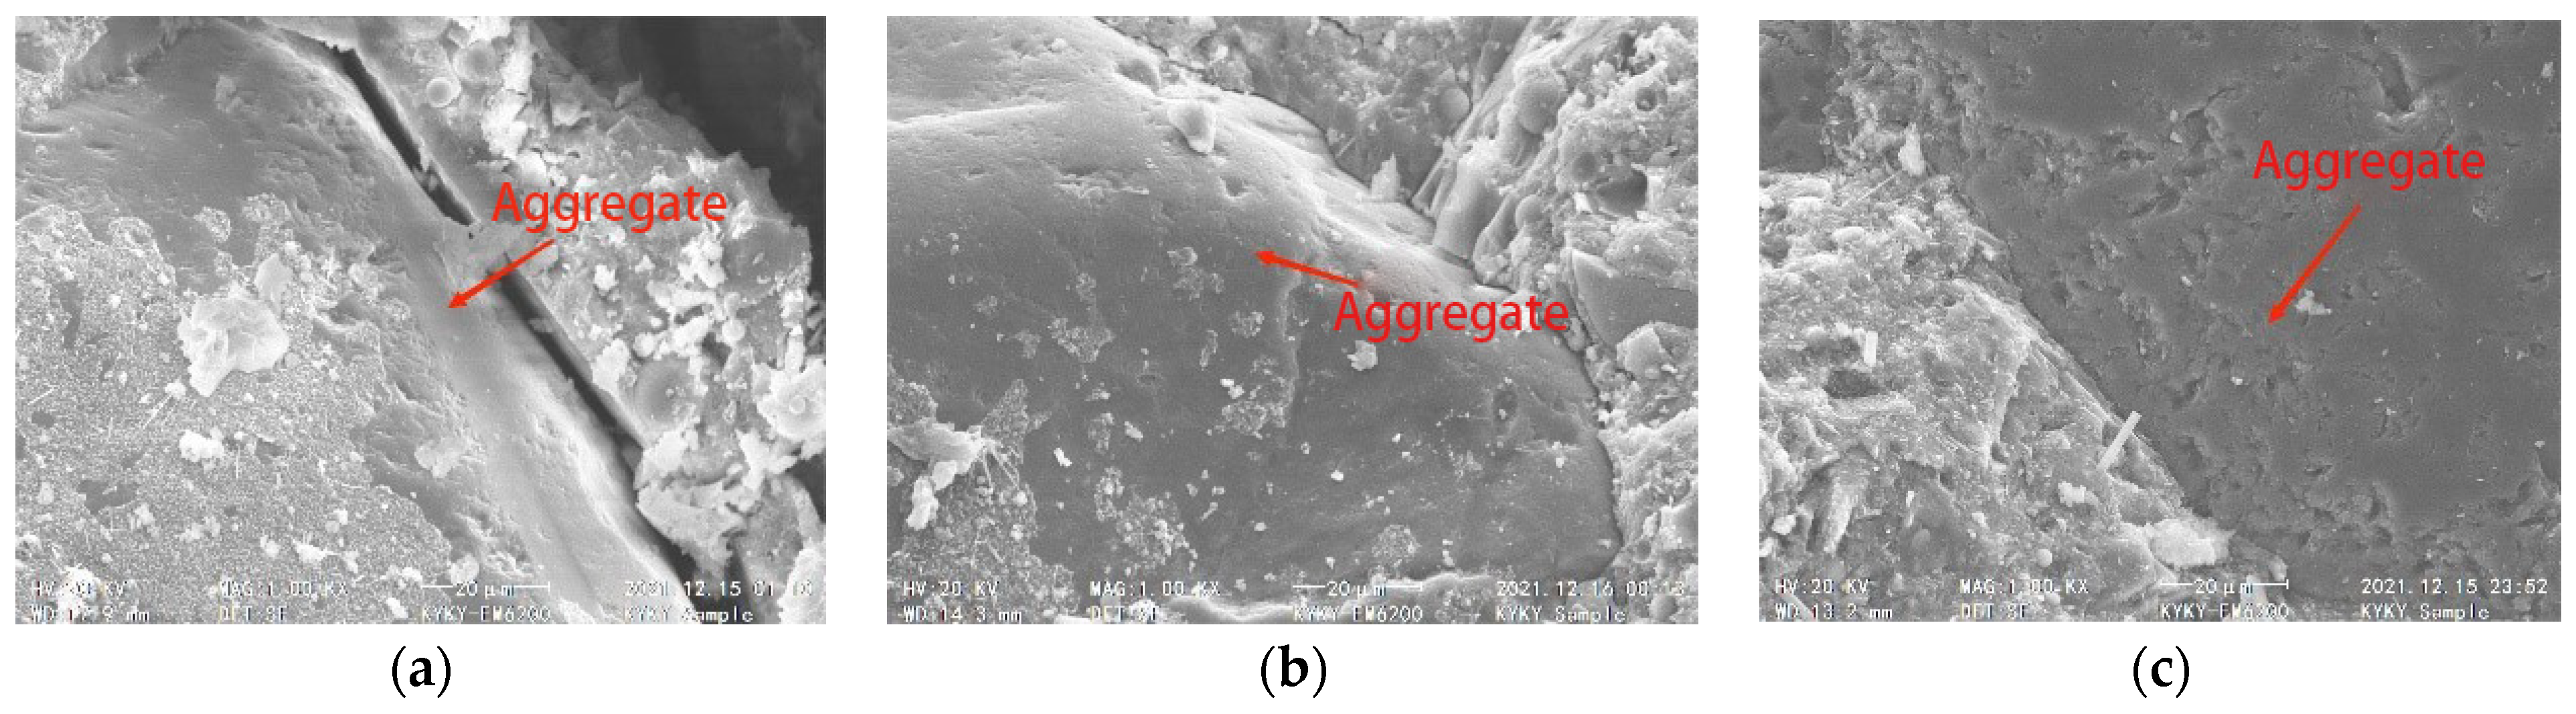
As can be seen from Figure 22a, more obvious gaps appeared in the aggregate–cement paste transition zone; the distribution of gel was also sparse, and there were no obvious hydration products around. As can be seen from Figure 22b, the adequate bonding between aggregate and mortar was revealed, the porosity was low, and the width of cracks was smaller than that of the 7 d age. As can be seen from Figure 22c, the aggregate–cement paste transition zone between the bond was tight, the transition zone could not see obvious gaps, and fine voids and cracks were more in the region with less gel generation; in the presence of external loads on the concrete, the densification of the internal structure will delay the generation of cracks in the transition zone of the interface, and there is a certain degree of improvement in the strength of concrete.

Figure 22.
Cracks in the aggregate–cement slurry transition zone at different ages. (a) 7 d. (b) 28 d. (c) 90 d.
The degree of hydration in LSFRC increases as the age of maintenance increases. The increasing degree of hydration brings about more hydration products attached to the fiber surface, which in turn leads to a tighter connection between the steel fiber ends and the aggregate, an increase in the roughness of the fiber surface, and an enhancement of the overall mechanical properties and density. This is consistent with the previous pattern of mechanical properties increasing with age.
5. Conclusions
This article is based on the orthogonal experimental method for LSFRC mix design and experimental verification, with the 28 d age mechanical properties as the indicator for analysis. The following conclusions were drawn regarding the four influencing factors of water–cement ratio, sand ratio, fly ash replacement ratio, and steel fiber content:
- (1)
- The strength of steel fiber-reinforced concrete is significantly affected not only by the water–cement ratio but also by the steel fiber and fly ash content. When the steel fiber content was between 0.6% and 1%, the fluctuation range of the compressive, flexural, and splitting tensile strength of the concrete was 5% (38 MPa to 42 MPa), 5% (6 MPa to 10 MPa), and 10%(3.5 MPa to 4.5 MPa), respectively. Among them, the optimal steel fiber content for the flexural strength of concrete was 0.6%, and the influence of fly ash and sand ratio on the strength of concrete at 28 d age was relatively small.
- (2)
- Taking into account the comprehensive factors of mechanical performance, workability, and economic applicability, an optimal mix ratio was ultimately obtained: a water–cement ratio of 0.42, a steel fiber content of 0.6%, a sand ratio of 40%, and a fly ash content of 20%. Compared with ordinary concrete of the same age, the compressive, flexural, and splitting tensile performance of the concrete was improved by 3%, 19%, and 33%, respectively.
- (3)
- In conjunction with the effect of age on the mechanical properties of LSFRC, the longer the curing period, the better mechanical properties LSFRC will have. In particular, after reaching a curing duration of 28 days, LSFRC is fully capable of being applied directly to the project. Therefore, more than 28 days in advance, through the factory prefabrication of steel fiber concrete components and the use of the assembly construction process during construction, may be able to significantly shorten the construction cycle.
Author Contributions
Methodology, Z.W., X.Y. and W.L.; Software, L.W.; Validation, Z.W.; Formal analysis, X.Y.; Investigation, W.L.; Data curation, H.L.; Writing – original draft, H.L.; Writing – review & editing, Z.W.; Supervision, B.Z. and L.W.; Project administration, B.Z.; Funding acquisition, A.H. All authors have read and agreed to the published version of the manuscript.
Funding
This research was funded by the Natural Science Foundation of Chongqing, China (Grant Nos. CSTB2022NSCQMSX0975 and CSTB2023NSCQMSX0208). Supported by the Science and Technology Research Program of Chongqing Municipal Education Commission (Grant Nos. KJZD202204001, KJQN202304004 and KJQN202304008), Chongqing Construction Science and Technology Plan Project (Grant No. Chengkezi 2023 No. 3-No. 5), Chongqing Higher Education Teaching Reform Research Project (Grant No. 233447), Chongqing University of Science and Technology Undergraduate Education Teaching Reform Research Project (Grant No. 202342).
Institutional Review Board Statement
Not applicable.
Informed Consent Statement
Not applicable.
Data Availability Statement
Data are contained within the article.
Conflicts of Interest
Author Wenyu Luo was employed by the company Chongqing Zhengcheng Biaoyan Engineering Testing Co., Ltd. Author Anlin Hu was employed by the company CISDI Engineering Co., Ltd. The remaining authors declare that the research was conducted in the absence of any commercial or financial relationships that could be construed as a potential conflict of interest.
References
- Fan, C. Research on Mechanical Properties of Mixed Steel Fiber Concrete. Master’s Thesis, Zhengzhou University, Zhengzhou, China, 2017. [Google Scholar]
- Hussain, A.; Wankhade, R.L.; Singh, H. Enhancing the Properties of Self-Compacting Concrete by Using Steel and Polypropylene Fibers. Pract. Period. Struct. Des. Constr. 2024, 29, 04024037. [Google Scholar] [CrossRef]
- Shen, D.; Wen, C.; Kang, J.; Shi, H.; Xu, Z. Early-age stress relaxation and cracking potential of High-strength concrete reinforced with Bar chip fiber. Constr. Build. Mater. 2020, 258, 119538. [Google Scholar] [CrossRef]
- Ramadoss, P.; Li, L.; Fatima, S.; Sofi, M. Mechanical performance and numerical simulation of high-performance steel fiber reinforced concrete. J. Build. Eng. 2023, 64, 105424. [Google Scholar] [CrossRef]
- Nath, A.D.; Hoque, M.I.; Datta, S.D.; Shahriar, F. Various recycled steel fiber effect on mechanical properties of recycled aggregate concrete. Int. J. Build. Pathol. Adapt. 2024, 42, 448–468. [Google Scholar] [CrossRef]
- Zhang, W.; Bao, C.; Kong, X. Study on the effect of mixed fiber content on mechanical properties of recycled concrete. Sci. Technol. Eng. 2016, 16, 106–112+123. [Google Scholar]
- Yu, A.; Qin, Q.; Shi, M. Analysis of the influence of steel fiber on the mechanical properties of concrete. In Proceedings of the 25th Annual Conference of Beijing Institute of Mechanics, Beijing, China, 25–27 March 2019; Beijing Institute of Mechanics, Beijing Society of Mechanics: Beijing, China, 2019; pp. 635–636. [Google Scholar]
- Zhang, Y.; Chen, B.; Wang, Y. Experimental study on basic mechanical properties of steel fiber concrete. Concrete 2020, 4, 74–77. [Google Scholar]
- Hao, Y.; Hao, H. Impact test analysis of spiral steel fiber concrete. J. Tianjin Univ. (Nat. Sci. Eng. Technol. Ed.) 2016, 49, 355–360. [Google Scholar]
- Ye, Y.; Wang, Z.; Xie, F. Mechanical properties of steel fiber reinforced high-strength light aggregate concrete. J. Build. Mater. 2021, 24, 63–70. [Google Scholar]
- Xue, G.; Wang, C.; Zhang, J.; Liu, Z.; Zhang, T.; Zhang, Y. Effect of steel fiber shape on properties of high-performance concrete. AMCS 2021, 38, 4313–4324. [Google Scholar]
- Sun, J.; Xu, J.; Luo, G. Research on compacted composite steel fiber concrete pavement. In Proceedings of the 4th National Conference on Fiber Cement and Fiber Concrete (I), Nanjing, China, 9–12 November 1992; pp. 196–199. [Google Scholar]
- Huang, W.; Xu, G. Analysis of mechanical properties and failure characteristics of padded steel fiber concrete. Highway 2015, 60, 22–26. [Google Scholar]
- Yang, J.; Dong, Y. Effect of fiber gradient distribution on mechanical properties of concrete. Henan Sci. 2002, 645–648. [Google Scholar] [CrossRef]
- Lu, H.; He, X. Study on bending performance of local steel fiber-reinforced concrete composite beam. J. Highw. Transp. Sci. Technol. (Appl. Technol. Ed.) 2016, 12, 223–225. [Google Scholar]
- Guo, Z. Study on Reinforcement Mechanism of Laminated Steel Fiber and Hybrid Fiber Concrete. Master’s Thesis, Wuhan University of Technology, Wuhan, China, 2006. [Google Scholar]
- Peng, O. Study on Mechanical Properties of Composite and Layered Steel Fiber High-Strength Concrete. Master’s Thesis, Guangzhou University, Guangzhou, China, 2019. [Google Scholar]
- Martínez-Pérez, I.; Valivonis, J.; Šalna, R.; Cobo-Escamilla, A. Experimental study of flexural behaviour of layered steel fibre reinforced concrete beams. J. Civ. Eng. Manag. 2017, 23, 806–813. [Google Scholar] [CrossRef]
- Suddeepong, A.; Buritatum, A.; Hoy, M.; Horpibulsuk, S.; Takaikaew, T.; Horpibulsuk, J.; Arulrajah, A. Natural Rubber Latex–Modified Concrete Pavements: Evaluation and Design Approach. J. Mater. Civ. Eng. 2022, 34, 04022215. [Google Scholar] [CrossRef]
- GB/T50081-2019; Standard for Test Methods for Physical and Mechanical Properties of Concrete. National Standard of the People’s Republic of China: Beijing, China, 2019.
- JTG E30-2005; Technical Code for Construction of Highway Cement Concrete Pavement. Ministry of Transport Scientific Research Institute: Beijing, China, 2005.
- Abubakar, A.; Idongesit, U.R.; Konitufe, C.; Mohammed, A. Prediction of Strength Properties of Concrete Containing Calcined Black Cotton Soil Using Response Surface Methodology. Am. J. Mater. Synth. Process. 2020, 5, 17–25. [Google Scholar] [CrossRef]
- Busari, A. Response Surface Analysis of the Compressive Strength of Metakoalin Self-Compacting Concrete. Adv. Sci. Technol. Res. J. 2019, 13, 7–13. [Google Scholar] [CrossRef] [PubMed]
- Sridhar, J.; Balaji, S.; Jegatheeswaran, D.; Awoyera, P. Prediction of the Mechanical Properties of Fibre-Reinforced Quarry Dust Concrete Using Response Surface and Artificial Neural Network Techniques. Adv. Civ. Eng. 2023, 2023, 8267639. [Google Scholar] [CrossRef]
- Muthukumar, M.; Mohan, D. Optimization of Mechanical Properties of Polymer Concrete and Mix Design Recommendation Based on Design of Experiments. J. Appl. Polym. Sci. 2004, 94, 1107–1116. [Google Scholar] [CrossRef]
- Shi, X.; Schillings, P.; Boyd, D. Applying artificial neural networks and virtual experimental design to quality improvement of two industrial processes. Int. J. Prod. Res. 2004, 42, 101–118. [Google Scholar] [CrossRef]
- Luo, W. Mechanical Properties of Prefabricated LSFRC Road Panels. Master’s Thesis, Chongqing University of Science & Technology, Chongqing, China, 2022. [Google Scholar]


Disclaimer/Publisher’s Note: The statements, opinions and data contained in all publications are solely those of the individual author(s) and contributor(s) and not of MDPI and/or the editor(s). MDPI and/or the editor(s) disclaim responsibility for any injury to people or property resulting from any ideas, methods, instructions or products referred to in the content. |
© 2024 by the authors. Licensee MDPI, Basel, Switzerland. This article is an open access article distributed under the terms and conditions of the Creative Commons Attribution (CC BY) license (https://creativecommons.org/licenses/by/4.0/).