Abstract
This paper proposes a new type of gangue filling body (GFB) to address the issues of the low stability, strength, poor shrinkage performance, and inadequate seepage resistance of paste filling materials in overburdened mining conditions, as well as the challenge of fully utilizing solid waste gangue. The coal gangue (CG), U-expanding agent (UEA), and amount of water added were kept constant, and the mass ratio of the various components was adjusted to the design. The standard for filling was assessed using slump tests, uniaxial compression tests, shrinkage tests, and penetration tests. A further microscopic analysis of the pastes with an optimal filling performance was conducted using SEM. The support pressure and overburden migration patterns in the GFBs were evaluated using Flac3D. The results indicate that the GFB with ratio 4 performed best, highlighting the significant role of Portland cement (OPC). The GFB with ratio 3 demonstrated the second-best performance, suggesting that GFBs with a higher early strength should be chosen to fill hollow zones for an effective filling outcome. This study introduced a new type of paste filling material and confirmed the rock transport law of this material under overburdened conditions using Flac3D, offering significant insights for the engineering field.
1. Introduction
Coal mining faces a series of engineering challenges, including surface subsidence, surrounding rock deformation, and solid waste disposal. The production of coal gangue (CG), a significant solid waste issue, remains high [,]. The gangue filling body (GFB) technique involves mixing CG with binders, water, and other solid wastes to create a paste that is pumped into mining airspaces. Paste filling technology is now considered the most reliable, thorough, and environmentally friendly method for managing CG. It effectively controls rock movement and surface subsidence [,,,] and also mitigates the environmental impact of coal mining, thus enhancing economic, environmental, and social benefits. This approach provides a new perspective for constructing green mines [,,,,].
The filling material’s stability, strength, shrinkage properties, and impermeability can greatly affect the quality and efficiency of the mining operation []. Zhang et al. [] conducted a series of experiments, including uniaxial compression tests and scanning electron microscopy (SEM) observations, on filling specimens with various gangue gradations and fly ash (FA) ratios, aiming to optimize the mix for fill mining. However, the use of solid wastes besides common paste filling materials such as FA and CG remains minimal, leading to a limited diversity and availability of backfill materials []. Zheng et al. [] undertook relevant studies to address issues such as the low moisture strength in cemented aerial sand (AS)–fly ash backfill (CAFB) mixes. Although using AS as a backfill material effectively addresses the shortage, its long transportation distance and high freight costs limit its paste filling applications. Consequently, selecting suitable backfill materials has become a critical topic in paste filling research. GFBs’ strength must be regulated within a certain range to realize paste-filled mining at different filling rates. The cement dosage in a GFB can be used to adjust its strength [,]. Zhang [] et al. evaluated the stability (water seepage and permeability) of HPMC by incorporating hydroxypropylmethylcellulose (HPMC) into a coarse-tailings cemented filling body (CTCB). However, relatively few studies have been conducted on the stability and permeability of CFBs. Generally, the low water content and poor amenability of GFBs complicate pump and pipeline transportation, potentially causing clogs [,]. At the same water content, however, adding a polycarboxylate water reducer (PCE) significantly enhances the performance of backfill materials [,,]. Moreover, U-expanding agents (UEAs) can effectively minimize shrinkage creep in filling materials [], and their combined use with other materials can compensate for shrinkage. Nonetheless, studies on PCEs and UEAs for paste filling materials are relatively scarce.
Recently, Flac3D numerical simulation has been extensively used to analyze the destabilization mechanisms of roadways and the deformation and damage mechanisms of surrounding rocks. For instance, Yu et al. [] conducted a fill mining test in the northern Yuyang coal mine. They established a mechanical model for the stability analysis of coal columns and used Flac3D simulations to study these structures’ stability, aiming to minimize the disturbance to overlying rock layers caused by coal mining. Using the actual geological conditions of the 1302 working face in the Zhaolou Coal Mine as the backdrop, Liu et al. [] developed a mechanical calculation and analysis model for deep and loose coal seams and performed dynamic mining simulations with Flac3D to target the roof breakage issues in these seams.
This paper describes GFBs prepared with different compositional mass ratios using ordinary Portland cement (OPC), CG, gypsum, FA, a PCE, and a UEA. The preparation was based on a constant CG content, UEA content, and water volume. Gypsum (a coal-based solid waste) was added as a backfill material to activate the FA. This study focused on the paste’s fluidity, compressive strength, shrinkage, and impermeability, optimizing it for downhole filling. Additionally, the surface morphologies of the hardened paste samples were analyzed using SEM microanalysis to investigate the intrinsic reasons for the optimal mixing ratio’s enhanced performance. This study proposes a new type of paste filling material, whose supporting pressure and overburden transport law under overburden action were verified using Flac3D, marking a significant contribution to the engineering field.
2. Raw Materials and Methods
2.1. Raw Materials and Mixture Proportion
The cement used in this study was P.O 42.5 ordinary Portland cement (OPC), which conformed to the general silicate cement standard GB 175-2007. The coal gangue (CG), sourced from the Fuxin coal mine, was sieved to obtain 4.75–25 mm sized particles, with a mass ratio of 4.75–16 mm to 20–25 mm at 2:1. The gypsum was purchased from the Xidayao Town White Ash Factory, with a relative density of 2.96 g/cm3, a fineness of 10.0% (a 0.2 mm sieve residue), an initial setting time of at least 6 min, and a final setting time of at least 30 min. The additives employed included a polycarboxylate water reducer (PCE), a U-type expansion agent (UEA), and fly ash (FA). The PCE, sourced from a building materials plant in Shenyang, offered a water reduction rate and strength improvement of 30%, a slump loss of 6%, and a cement saving rate of 16% at a dosage of 0.4% to 2.0%. The UEA, also from a Shenyang plant, was used at a 6% to 8% dosage. The FA was second-grade with a ≤30% sieve residue, procured from a trading company in Xingtai City, and its main chemical composition is shown in Table 1. The abbreviations and acronyms used throughout this paper are listed in Table 2.

Table 1.
Fly ash (FA) chemical composition.
Table 2.
Abbreviations and Acronyms.
Coarse and fine particles accounted for 60% to 85% of the total mass of solid raw materials in the gangue mass, with a ratio of 18:80. The cementitious materials, consisting of OPC and gypsum, represented 10% to 30% of the solid raw materials’ mass. The quality mixing ratios of the PCE and UEA additives were 0.5% and 0.7% of the total mass of the cementitious materials, respectively.
Several mass ratios were selected to keep the CG content, UEA content, and amount of water added constant: 3:5 and 5:5 for FA–CG, 1:10 and 2:10 for gypsum–CG, 4:25 and 6:25 for OPC–CG, and 1:13 and 2:13 for PCE–OPC and PCE–gypsum. In this case, ratio 1 was taken as the reference group; ratio 2 was set to study FA’s effect on the gangue filling body (GFB); ratio 3 was set to study gypsum’s effect on the GFB; ratio 4 was set to study OPC’s effect on the GFB; and ratio 5 was set to study PCE’s effect on the GFB. Tap water was used in the mixing process for each ratio. The five ratios are detailed in Table 3.
Table 3.
Group Distribution Ratios.
2.2. Sample Preparation
The raw materials were mixed in a mixer, and the CG was crushed using an impact crusher followed by an ultra-fine crusher. Initially, the CG was crushed and decontaminated at the primary level to a size of less than 150 mm. It was then further processed with the ultra-fine crusher into aggregates with a particle size gradation suitable for filling and stored in a buffer silo for later use. Based on the site’s actual needs [,], the final particle size of the CG should be less than 10 mm, with particles smaller than 5 mm constituting more than 80% and those smaller than 0.08 mm approximately 15%.
In this test, the amounts of FA, gypsum, OPC, and UEA were appropriately increased while keeping the contents of CG, UEA, and water constant. Both dry mixing before water addition and mixing after must be completed within a fixed time to ensure the mixing times for the five different ratios are approximately the same and yield highly consistent properties. The powdered materials consisting of OPC, FA, and possibly gypsum were dry-mixed with a mixer at 150 rpm for 4 min. Water was then slowly injected into the dry mix and stirred at 50 rpm for 10 min to ensure thorough mixing. Afterward, the CG was added to the slurry and mixed at 100 rpm. Finally, the PCE and UEA were sequentially added to the slurry and mixed at 300 rpm for 4 min.
The mixed paste was loaded into molds measuring 150 mm × 150 mm × 150 mm and 25 mm × 125 mm × 280 mm for vibration. A release agent was applied before this to facilitate easy demolding. Delaying demolding minimizes mass loss in samples []; hence, the paste was allowed to dry naturally in the mold for 36 h before being removed. Since the paste could not be re-humidified after demolding, it was important to maintain a low humidity during curing. Room temperature was deemed sufficient for curing. From the date of demolding, they were removed from the curing box and tested for mechanical properties after 0 h, 6 h, 12 h, 18 h, 18 h, 24 h, 30 h, 36 h, 7 d, and 28 d.
The freshly mixed slurry was loaded into a test mold with an upper diameter of 70 mm, a lower diameter of 80 mm, and a height of 30 mm and was then demolded after 24 h of curing in the curing box. The demolded specimen continued curing in the curing box until 28 d. Then, the specimen was wrapped with wax to the side of the specimen and immediately loaded into a test mold for the subsequent seepage resistance test.
2.3. Test Methods
2.3.1. Slump Test
A slump test was used to evaluate the fluidity, water-holding capacity, and viscosity of the GFB []. Five different experimental groups of coal mine paste proportions were carried out. It was known that the flow characteristics of the GFB in the pipeline had less relative misalignment in the pipeline conveying process []. A time gradient was set to comprehensively compare the fluidity after the storage time from the beginning of mixing completion to the pipeline conveying process. The slump test was conducted per GB/T 50080-2016. The mixed gangue paste slurry was poured three times into the slump test bucket after water wetting and mixing, with slump tests conducted at 0 min, 15 min, 30 min, 45 min, and 60 min intervals. After loading, the excess mix was scraped off with a trowel, and the mouth of the cylinder was smoothed. The vertical distance from the bottom of the ruler to the highest point of the specimen was measured using a steel ruler, which determined the slump of the concrete mixture. The exact value of the slump was measured from the bottom of the straightedge to the highest point of the specimen, with an accuracy of 1 mm. Each group of procedures was repeated three times to ensure the accuracy and correctness of the test data, and the average value was taken as the final result of the slump test. The schematic diagram of the slump test is shown in Figure 1.
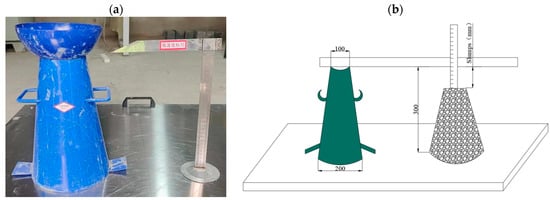
Figure 1.
Schematic diagram of slump test: Collapse bucket and collapse ruler (a) and test measurement (b).
2.3.2. Compressive Strength Test
The NYL-300 universal material pressure testing machine was used to determine the specimens’ uniaxial compressive strength. A uniaxial compression test was performed on 150 × 150 × 150 mm3 cube specimens at a loading rate of 0.3 to 0.5 mm/min [], utilizing an automated computerized control system. Each group of specimens was tested five times. After excluding data with a relative deviation exceeding ±15%, the average values were recorded as the experimental results. In this study, the compressive strength test was conducted per the GB/T50081-2019 standard.
2.3.3. Shrinkage Test
In this study, GFBs with different ratios were prepared into hardened specimens measuring 25 × 25 × 280 mm3. The drying shrinkage strain test was conducted using the specific length meter method. The specimen and the specific length meter are shown in Figure 2. The specimens standardly cured for 1 d were immersed in water at 20 ± 1 °C for 48 h. The initial length of each specimen was then measured using a specific length meter. Subsequently, the specimens were stored in a room with a temperature of 20 ± 1 °C and a humidity of 50% ± 3%, and the change in the length of each specimen after 28 d was measured. A mortar drying shrinkage test was performed according to ASTM C596-18. The goal was to comprehensively evaluate the drying shrinkage performance of the GFBs, which was calculated using the following equation:
where S28 is the drying shrinkage of the hardened specimen at 28 days; L0 and L28 are the initial and actual lengths at 28 days in mm, respectively; and 250 is the effective length of the tested specimen in mm.
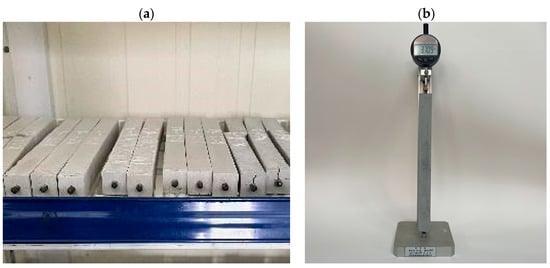
Figure 2.
Dry shrinkage test diagram: dry shrinkage sample (a) and specific length meter (b).
2.3.4. Penetration Test
GFBs possess a certain degree of compactness and strength. However, their permeability differs from that of soil, making it unreasonable to assess the permeability of GFBs using traditional soil permeability tests. Therefore, this study employed a permeability tester to examine the GFBs’ permeability properties. The permeability meter applied Pascal’s principle, i.e., the liquid in the static sealing container had equal pressure at all points (the water level difference was ignored), using a pressurization system to apply the water pressure and a pressure control system to control the pressure level to enable the water at the base of the specimen mold bottom-up to penetrate the specimen and then determine the mortar’s permeability properties. The equipment pressure maintained an allowable error of ±0.05 MPa. The schematic diagram of the tester is shown in Figure 3. Initially, the specimens were dried in a dryer set at 50 °C to prevent cracking due to thermal contraction. Subsequently, the permeability test was conducted at a pressure of 1.2 MPa for 8 h. The pressure at which water began to seep was recorded.
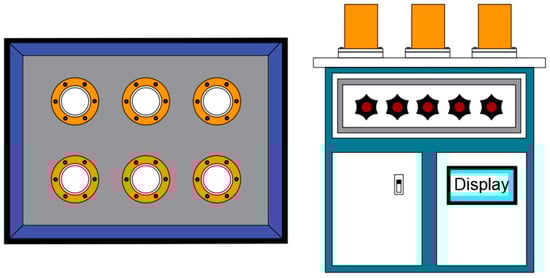
Figure 3.
Schematic diagram of the GFB penetration tester.
2.3.5. Microscopic Property
Based on the macroscopic experiments of the GFBs, SEM was used to observe the morphologies of the samples preserved for 28 days. These selected samples were the formulated pastes that performed better in the macroscopic experiments. This analysis was conducted to investigate the main factors contributing to the improved performance of the GFBs.
2.3.6. Simulation of Paste Filling Based on Flac3D
Flac3D was used to simulate and analyze the mechanical properties of the overlying rock layer affected by the paste filling. Moreover, this simulation investigated how the GFB’s strength influenced the movement and deformation of the overlying rock as well as the stress distribution. In the coal mine void area, the joint support of the GFB, coal pillar, and surrounding rock prevents the collapse of the overlying rock layer. A fissure zone and a bending subsidence zone appear, and the rock body remains as a continuous medium, making it suitable for simulation studies using Flac3D [,].
This study analyzes a mine with a mineable coal seam in Changzhi City, Shanxi Province. The mine spans 13.4 km from north to south and 4.9 km wide from east to west, covering an area of 65.059 km². The terrain is flat and covered by loess at the new boundary. The main mineable coal seams are the 3# and 15# seams. No trapped pillars or faults are found within the area of the filling workings. The mine includes four mineable coal seams: No.3, No.9, No.14, and No.15, all of which are of the stabilized type (Type I), with No.3 being the primary seam for mining. The mine is divided into six sections: east first pan, east second pan, east third pan, west first pan, west second pan, and west third pan. Paste filling mining initially targets the coal pillar protection area in the village within the south wing of the east first pan area to conduct industrialization tests. The filling face is 38 m long, with an average coal seam thickness of 5.14 m and an advancing length of 124 m. The coal body density is calculated at 1.4 t/m3, with a recoverable reserve of 883,400 tons. The filling face supports the return roadway system of the roof-placing comprehensive coal mining face. The ground elevation of the filling face and its comprehensive coal mining range is from +910.42 m to +922.243 m. The elevation of the coal seam’s bottom plate ranges from +474.423 m to +529.749 m, and the depth of the coal bed varies from 408.29 m to 437.6 m. The existing geological data indicated that the dimensions of the coal mine’s filling quarry in the X-, Y-, and Z-directions were 100 m, 80 m, and 80 m, respectively. Based on the actual coal mining footage, a filling step of 2 m was chosen to analyze the force characteristics of the GFB under the previously studied overburden. Simplifying the model in the numerical simulation process was necessary due to the complexity and variability of the overburden’s stratigraphic structure and lithology. The basic assumptions for the simplification of the numerical simulation model were as follows:
Due to the complexity and variability of the overburden’s stratigraphic structure and lithology, it is necessary to simplify the model in the numerical simulation process. The basic assumptions for the simplification of the numerical simulation model are as follows:
- (1)
- Each rock layer was considered a uniform isotropic elastic–plastic body;
- (2)
- When weak interlayers were present in the rock layers, they were integrated into a single main rock layer;
- (3)
- The influence of the geological structure of the mining area on the rock layers was neglected, and each layer was treated as flat.
The modeling diagram is shown in Figure 4. The model consists of 173,640 units and 195,436 nodes. Specific boundary conditions were imposed to enhance the accuracy of the calculations: The top surface of the model was set as a free boundary. The displacements on the four side surfaces—the front, back, left, and right—were limited to horizontal movements, while both horizontal and vertical displacements were restricted on the bottom surface. A uniform load was applied to the top of the model to simulate the weight of the overlying rock layer and mitigate the effects of model height restrictions. Field practice indicates that when the filling rate in the void area reaches 80% to 95%, the movement and deformation of the overlying rock can be effectively controlled. Therefore, the filling rate of the GFB was assumed to be 80%, and the filling step was maintained constant to simulate the evolution of the supporting pressure of the GFB and the transportation law of the overlying rock.
Figure 4.
Model Schematic.
Simplified experimental methods were used to analyze the overburden movement and mineral pressure manifestation law under conventional mining conditions. The calculation parameters were based on the field measurement data summarized in Table 4, the ‘Calculation Parameters Table’.
Table 4.
Calculation parameters.
3. Results and Discussion
3.1. Filling Material Fluidity
Slump is an important index used to describe the fluidity of a GFB, alongside its pumpability and plasticization, which are critical for evaluating the filling process. The slump test results for the five groups of matched GFBs are shown in Table 5. The results are plotted as a graph to conveniently visualize the change rule of the measured data, with the change in slump over time depicted in Figure 5. According to the experimental results, Group 4 had the lowest slump value at 172 mm. Initially, Groups 1, 2, and 5 displayed higher slump values; however, they experienced greater slump loss over time than the other groups. The slump differences between the five groups after 30 min were insignificant. Ratio 5 paste is more evident in the subsequent trend, where its slump decreases dramatically. The late-stage slump values for Groups 1, 2, and 4 were more ideal, while the changes in Group 3 were gentler than those in the other groups. The analysis concluded that the PCE significantly influences the slump. Increasing the dosage of OPC and gypsum reduces the fluidity of the GFB. Increasing the FA dosage can moderately improve the slump compared with OPC and gypsum.
Table 5.
The time-dependent slump of backfill pastes.
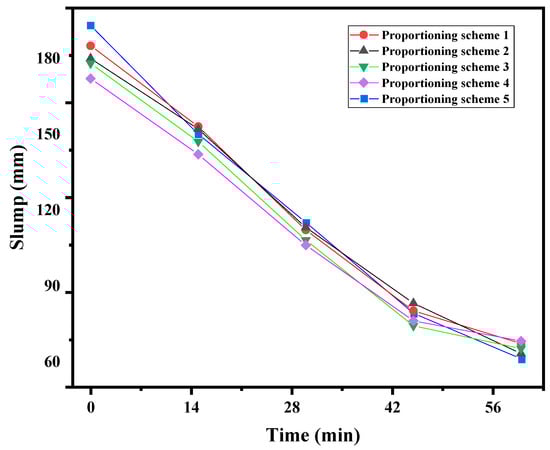
Figure 5.
Collapse degree of GFBs with different ratios.
3.2. Compressive Strength of Filling Material
Compressive strength is an important parameter for measuring the quality of GFBs. The experimental data are shown in Table 6. The data were plotted as a curve, as shown in Figure 6a, showing that OPC was the most significant factor affecting the compressive strength of the GFB, influencing both its early and late strength. Additionally, increasing the amount of FA reduced the GFB’s compressive strength to some extent. The analysis concluded that although the fine particles of FA can act as a microaggregate and auxiliary cementitious material in a GFB, enhancing its fluidity and late mechanical properties, the low OPC dosage in the GFB designed in this study resulted in less calcium hydroxide being produced after hydration. This reduction limited the pozzolanic reaction of FA, thereby constraining its potential to enhance the late strength. Therefore, the FA’s promotional effect on GFB’s late strength was limited. There is a significant marginal effect of FA on GFB []. The OPC dosage was the most critical factor affecting the GFB’s compressive strength. In addition to the compressive strength of the ratio 2 paste, the other ratio paste 36 h compressive strength reached 0.8 MPa. The compressive strength of pastes 3 and 4 at 28 d is greater, meeting the requirements of the compressive strength of the GFBs [] and supporting the role of the pressure of the upper rock layer in the short term and preventing settlement of the ground surface in the long term.
Table 6.
Results of compressive strength tests.
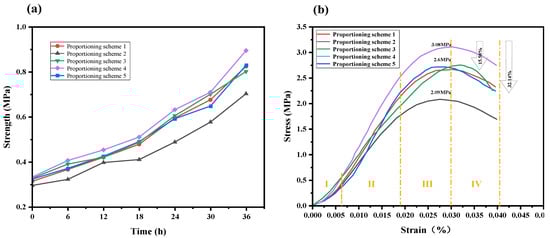
Figure 6.
Comparison of compressive test results: early strength comparison (a) and stress–strain curve comparison (b).
Figure 6b displays the stress–strain curves for five GFBs with different ratios during uniaxial compression. These curves were categorized into four stages: compaction (I), elastic deformation (II), plastic deformation (III), and post-peak damage (IV). The compressive strengths of ratios 1 and 2 were 15.58% and 32.14% lower than that of ratio 4, respectively. In stages I and II, the GFBs for each ratio exhibited similar stress–strain behaviors, with the curves largely overlapping, indicating that the GFBs underwent similar structural changes during these stages. However, in stages III and IV, the GFB specimens underwent progressive plastic damage, with the curves diverging due to the varying ratios.
3.3. Shrinkage Properties of Filling Materials
The drying shrinkage development patterns for the five formulated GFBs are depicted in Figure 7. This figure illustrates that the drying shrinkage of all five solutions followed a similar trend over time, which can be divided into two phases: a rapid growth phase and a smooth rise phase. In the first 10 days, the drying shrinkage of all GFB samples rapidly increased and then gradually leveled off. The results indicate that ratio 1 had the highest shrinkage rate during the same age period, making it the most susceptible to shrinkage cracks during actual engineering service. Ratio 1 pastes are not suitable for use in mine filling. The use of the PCE in ratio 5 enhanced the GFB’s compactness and reduced the water loss during drying, thereby decreasing its drying shrinkage strain. Based on the drying shrinkage development patterns observed in the GFBs with different ratios, their resistance to shrinkage cracking, in descending order of effectiveness, was ratio 5, ratio 4, ratio 3, ratio 2, and ratio 1. The research results show that the drying shrinkage rate of the paste of ratio 4 and ratio 5 is not more than 0.3%, it has almost no great influence on the filling of the top of the joint, and the application of ratio 4 and ratio 5 to the filling of mines can effectively improve the compactness of the paste, which is conducive to the long-term stability of the GFB.
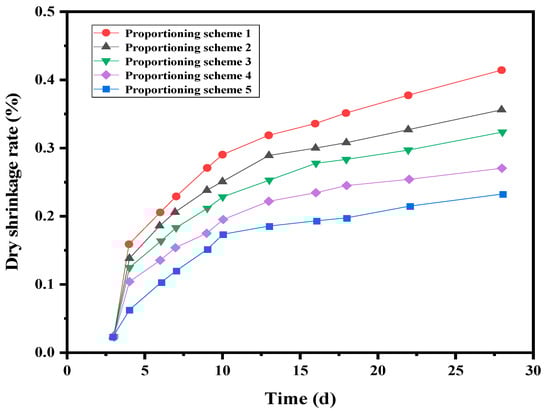
Figure 7.
Shrinkage of Paste Filling Body Material over Time.
3.4. Seepage Resistance of Filling Materials
Studying the permeability of pastes is significant to ensure the safety of groundwater and the mining area’s stability. The experimental results were plotted as curves based on the experimental data. The curve of the test results of the pastes’ permeability is shown in Figure 8.
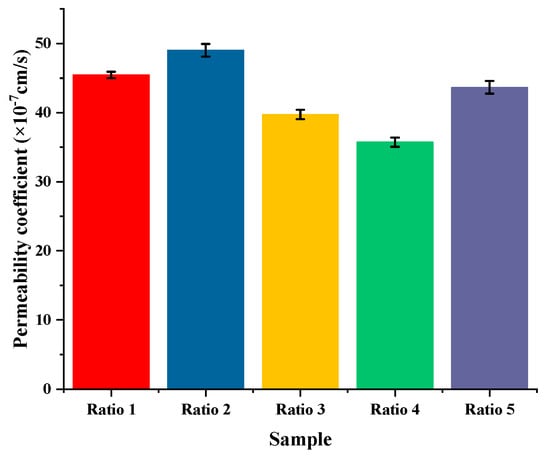
Figure 8.
Results curve of paste permeability test.
The analysis shows that the void inside the paste gradually reduced with the hydration reaction of the OPC, resulting in the permeability coefficient decreasing until it reached a stable state. Furthermore, the existence of pores affected the continuity of the GFB structure and reduced the strength of the GFB [], i.e., the GFB’s compressive strength decreased with the increase in the permeability coefficient. The permeability coefficients of the ratio 1, ratio 2, and ratio 5 pastes were higher, while those of the ratio 3 and ratio 4 pastes were lower. Considering the impermeability and compressive strength of the GFBs, the GFB with ratio 4 had the best test performance.
3.5. Microscopic Property
The microstructure of the sample for ratio scheme 4 after curing for 28 days is shown in Figure 9. Figure 9a illustrates the bonding interface between the cementite matrix and the FA particles. In the alkaline environment of the GFB, the spherical FA particles partially dissolved and underwent a pozzolanic reaction. This reaction generated C-S-H gel hydration products that deposited on the surfaces of the particles, significantly increasing their surface roughness, which enhanced the compatibility of the FA particles with the OPC matrix. However, although the FA particles provided nucleation sites for the hydration reaction and a certain degree of pozzolanic reaction occurred, the low volume content of the OPC in the paste resulted in a low production of calcium hydroxide. Consequently, the extent of the pozzolanic reaction of FA was relatively low, as depicted in Figure 9a,c. This was the primary reason for the decrease in compressive strength with the increased dosage of FA. Figure 9b,d display the microscopic morphology of the hydration products within the GFB. These images reveal that the main hydration products included numerous needle- and rod-shaped Ettringite crystals and C-S-H gels. The high water–cement ratio of the GFB provided an optimal environment for the growth of these hydration product crystals, which filled the voids and pores of the filling paste, thereby increasing the material’s compactness and strength.
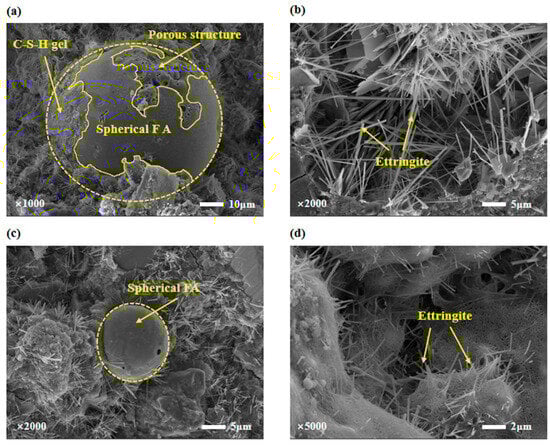
Figure 9.
SEM images of specimens cured for 28 days of age for proportioning scheme 4: spherical FA micrographs (a,c), Ettringite micrographs (b,d).
3.6. Flac3D Simulation of Paste Force Characteristics under Overburdened Rock Action
According to Section 3.2, the GFBs with ratios 3 and 4 were selected to simulate the force characteristics under the action of overburden.
The vertical stress cloud diagram of the compressive strength for the GFBs with ratios 3 and 4 is shown in Figure 10. As the working face advanced, the stress within the rock body around the hollow area gradually increased. The maximum stress within the rock layer changed along with the advancement of the working face, peaking in the middle of the distance covered. The influence of stress also extended over a broader area at this midpoint. Behind the working face, the support pressure first decreased and then followed an increasing trend, correlating with the increase in the GFB’s elastic modulus, and eventually converged to the original rock stress.
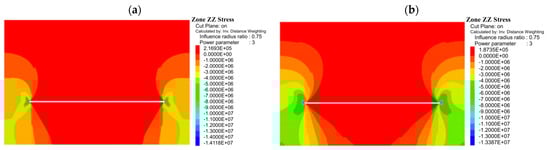
Figure 10.
Vertical stress diagrams for compressive strength of GFBs with different ratios: ratio 3 GFB (a) and ratio 4 GFB (b).
The bearing pressure distribution around the hollow area was similar to that near the coal wall of the working face. However, the peak value of the bearing pressure around the hollow area was higher than that near the coal wall. Despite the greater strength of the GFB with ratio 4, the peak bearing pressure around the hollow area for ratio 4 was lower than for ratio 3. The influence of the bearing pressure around the hollow area was wider than that in front of the working face. Furthermore, the scope of influence and the value of the bearing pressure at the far end of the hollow area tended to approach the stress levels of the original rock.
The strength level and vertical displacement cloud diagrams for the GFBs with ratios 3 and 4 are shown in Figure 11. The displacement of the top plate in the middle of the hollow area gradually increased with the advancement of the working face. Additionally, the maximum displacement of the top rock layer varied with the advancement distance, and this rock layer exhibited a limited range of deformation.
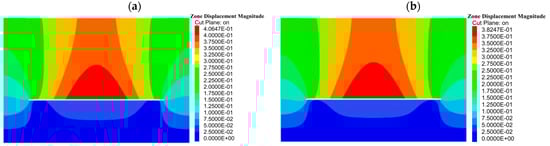
Figure 11.
Strength level and vertical displacement of GFBs with different ratios: ratio 3 GFB (a) and ratio 4 GFB (b).
The curve showing the subsidence under the GFB strengths of ratios 3 and 4 is displayed in Figure 12. It indicates that the subsidence amount of the top plate in paste filling mining decreased as the strength of the GFB increased. The curve for the same GFB strength features an inverted ‘U’ distribution. Moreover, the values of the displacement and subsidence of the rock layer on the roof of the mining area significantly changed with an increase in the distance Z, showing less subsidence at greater distances.
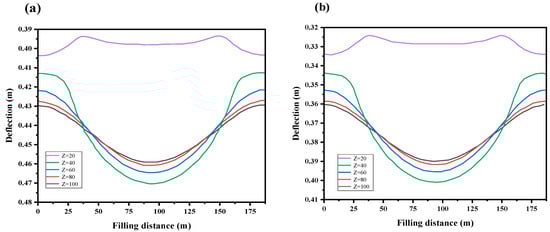
Figure 12.
Mining roof subsidence curves for different ratio GFB strengths: ratio 3 GFB (a) and ratio 4 GFB (b).
Studying the displacement evolution law of overburdened rock under the strength of the GFBs with ratios 3 and 4 demonstrated that the strength of the GFBs during the process of roof subsidence was linear within the range of 40 m behind the working face. Initially, the roof’s strength was higher than that of the GFB, and the variation in the subsidence of the overburdened rock did not exceed 5%. When the GFB’s strength was lower in the early stages, it linearly correlated with the strength of the roof slab, and the subsidence variation was more than 15%. Therefore, a GFB with a high early strength should be selected to fill the hollow area to achieve an effective filling result.
It is advisable to select the ratio 4 GFB with high early strength to provide effective support and stability, particularly where there is a risk of the fill collapsing or caving in before fully hardening, as this may offer better support. However, if the basic roof already has a high degree of stability, choosing a GFB with a lower early strength could better accommodate the surrounding area and reduce stress concentrations caused by mining.
4. Conclusions
In this study, indoor tests and numerical simulations were conducted for GFBs, a new type of GFB was developed by mixing with CG, and the GFB’s mine pressure behavior under coal mine paste filling conditions was investigated. The main conclusions are as follows:
- (1)
- PCE significantly affected the slump, while higher dosages of OPC and gypsum reduced the flow properties of the GFB. Conversely, an increased FA content moderately enhanced the slump of the GFB. Regarding the late slump, ratio 4 exhibited the best flow properties.
- (2)
- In the GFB designed in this study, increasing the FA content resulted in a decrease in the GFB’s compressive strength. The SEM analysis indicated that this was attributed to the low volume content of OPC in the GFB, leading to a reduced production of calcium hydroxide, and the relatively low degree of volcanic ash reaction of FA. Additionally, OPC was the most influential factor affecting the compressive strength of the GFB. The SEM analysis also revealed that the GFB had a high water-to-ash ratio, facilitating the growth of hydration product crystals. This resulted in the formation of acicular calcium aluminate, which filled the voids and pores of the filling paste. Ratio 4 exhibited the highest compressive strengths.
- (3)
- The GFBs’ resistance to shrinkage cracking in descending order was as follows: ratio 5, ratio 4, ratio 3, ratio 2, and ratio 1. The permeability of the GFBs followed Darcy’s law of permeability, and ratio 4 has the best resistance to permeation, making it an excellent material to meet the needs of the filling site.
- (4)
- Numerical simulation tests were carried out on ratios 3 and 4 using the Flac3D 6.0 numerical simulation software. The displacements and stresses under the two different ratios were obtained, where the peak value of the supporting pressure around the cavitation zone of the GFB with ratio 4 was smaller than that of the GFB with ratio 3. The displacement of the roof plate in the middle of the hollow area gradually increased with the advance of the working face. The maximum displacement of the rock layer of the roof plate changed with the advancement distance, and a small deformation of the rock layer appeared. Ratio 4 GFB with a high early strength should be selected to fill the hollow zone to achieve a good filling effect.
- (5)
- The new GFB proposed in this study improves mining operations in terms of stability, strength, shrinkage properties, seepage resistance, and the ecological environment regarding the role of environmental solid waste. Using CG, FA, and gypsum as fillers can reduce the economic cost and provide a reference for green mine production. However, this study’s limitation is that the effects of ambient temperature and humidity on the performance of GFBs were not considered, and additional considerations are needed for operation in high-temperature and -humidity environments. In future studies, the effects of the external environment should be incorporated into the system.
Author Contributions
Conceptualization, P.W. and Z.G.; Methodology, P.W. and J.J.; Software, P.W.; Validation, Z.G. and F.L.; Formal analysis, P.W., Z.G. and T.L.; Investigation, Y.L. and T.L.; Data curation, P.W. and F.L.; Writing—original draft, P.W. and Z.G.; Writing—review & editing, Z.G.; Visualization, Y.L.; Supervision, J.J. All authors have read and agreed to the published version of the manuscript.
Funding
This research was funded by Shenyang Science and Technology Program Project Fund (23-407-3-19) and National Natural Science Foundation of China (contract Nos. 52274206 and 52074143).
Institutional Review Board Statement
Not applicable.
Informed Consent Statement
Not applicable.
Data Availability Statement
The original contributions presented in the study are included in the article, further inquiries can be directed to the corresponding author.
Conflicts of Interest
The authors declare no conflict of interest.
References
- Zhang, Y.; Li, L. Experimental Study on the Natural Mixing Behaviour of Waste Rocks Poured in a Paste Backfill. Int. J. Min. Reclam. Environ. 2023, 37, 953–977. [Google Scholar] [CrossRef]
- Wu, J.; Jing, H.; Yin, Q.; Yu, L.; Meng, B.; Li, S. Strength Prediction Model Considering Material, Ultrasonic and Stress of Cemented Waste Rock Backfill for Recycling Gangue. Int. J. Min. Reclam. Environ. 2023, 10, 953–977. [Google Scholar] [CrossRef]
- Yang, K.; Zhao, X.; Wei, Z.; Zhang, J. Development Overview of Paste Backfill Technology in China’s Coal Mines: A Review. Environ. Sci. Pollut. Res. Int. 2021, 28, 67957–67969. [Google Scholar] [CrossRef] [PubMed]
- Guo, J.; Yu, L.; Feng, G.; Guo, Y.; Dias, D.; Bai, J.; Qi, T.; Wen, X.; Zhang, J. Damage Evolution and Failure Characteristics of a Cemented Gangue Backfill Considering Direct Shear and Dynamic Tests. Constr. Build. Mater. 2024, 415, 135099. [Google Scholar] [CrossRef]
- He, X.; He, S.; Yang, K.; Wei, Z.; Liu, B.; Zhang, C. Compaction Characteristics and Energy Dissipation of Crushed Gangue with Different Particle Sizes under Mining Stress. Environ. Earth Sci. 2023, 82, 310. [Google Scholar] [CrossRef]
- Zhang, M.; He, H.; Jin, X.; Qu, Y.; Guo, H.; Hualei, Z.; Zhang, H. Research on Key Factors Influencing Surface Subsidence of Paste Backfilling Mining in Thick Coal Seam of Deep Mine. Adv. Civ. Eng. 2021, 2021, 6634331. [Google Scholar] [CrossRef]
- Guo, Y.; Zhao, Y.; Feng, G. Creep and Strength Characteristics of Cemented Gangue Back Ll under Coupling Effect of Load and Acid Corrosion. Environ. Sci. Pollut. Res. 2023, 43, 97281–97297. [Google Scholar] [CrossRef] [PubMed]
- Zhang, J.; Zhang, Q.; Spearing, A.J.S.S.; Miao, X.; Guo, S.; Sun, Q. Green Coal Mining Technique Integrating Mining-Dressing-Gas Draining-Backfilling-Mining. Int. J. Min. Sci. Technol. 2017, 27, 17–27. [Google Scholar] [CrossRef]
- Zhang, Y.; Ling, T.-C. Reactivity Activation of Waste Coal Gangue and its Impact on the Properties of Cement-Based Materials—A Review. Constr. Build. Mater. 2020, 234, 117424. [Google Scholar] [CrossRef]
- Qiu, J.; Zhu, M.; Zhou, Y.; Guan, X. Effect and Mechanism of Coal Gangue Concrete Modification by Fly Ash. Constr. Build. Mater. 2021, 294, 123563. [Google Scholar] [CrossRef]
- Jin, J.; Li, M.; Liu, T.; Chen, Y.; Qin, Z.; Liu, Q.; Liang, B.; Zhao, J.; Zuo, S. Insights into Factors Influencing Coal Gangue-Filled Backfill Cemented by Self-Consolidating Alkali-Activated Slag Grouts. Constr. Build. Mater. 2024, 411, 134422. [Google Scholar] [CrossRef]
- Li, L.G.; Zhuo, Z.Y.; Zhu, J.; Kwan, A.K.H. Adding Ceramic Polishing Waste as Paste Substitute to Improve Sulphate and Shrinkage Resistances of Mortar. Powder Technol. 2020, 362, 149–156. [Google Scholar] [CrossRef]
- Zhang, L.; Lai, X.; Pan, J.; Shan, P.; Zhang, Y.; Zhang, Y.; Xu, H.; Cai, M.; Xi, X. Experimental Investigation on the Mixture Optimization and Failure Mechanism of Cemented Backfill with Coal Gangue and Fly Ash. Powder Technol. 2024, 440, 119751. [Google Scholar] [CrossRef]
- Zheng, Z.; Yang, B.; Gu, C.; Yang, F.; Liu, H. Experimental Investigation into the Proportion of Cemented Aeolian Sand-Coal Gangue-Fly Ash Backfill on Mechanical and Rheological Properties. Minerals 2023, 13, 1436. [Google Scholar] [CrossRef]
- Zhang, Z.; Li, J. Experimental Investigation on Strength and Failure Characteristics of Cemented Paste Backfill. Front. Mater. 2021, 8, 792561. [Google Scholar] [CrossRef]
- Feng, G.; Liu, W.; Du, X.; Wang, J.; Li, X.; Zheng, Y. Crack Evolution Characteristics of Cemented-Gangue–Fly-Ash Backfill with Different Proportions of Fly Ash and Cement. Constr. Build. Mater. 2023, 385, 131498. [Google Scholar] [CrossRef]
- Zhang, Q.; Qiu, J.; Jiang, H.; Kong, X.; Guo, Z.; Xiang, J.; Sun, X. Effect of Hydroxypropyl Methyl Cellulose on Coarse Tailings Cemented Backfill: Rheology, Stability, Strength and Microstructure. Constr. Build. Mater. 2024, 425, 136042. [Google Scholar] [CrossRef]
- Xu, W.; Zhang, Y.; Zuo, X.; Hong, M. Time-Dependent Rheological and Mechanical Properties of Silica Fume Modified Cemented Tailings Backfill in Low Temperature Environment. Cem. Concr. Compos. 2020, 114, 103804. [Google Scholar] [CrossRef]
- Zhang, S.; Yang, L.; Ren, F.; Qiu, J.; Ding, H. Rheological and Mechanical Properties of Cemented Foam Backfill: Effect of Mineral Admixture Type and Dosage. Cem. Concr. Compos. 2020, 112, 103689. [Google Scholar] [CrossRef]
- Cihangir, F.; Akyol, Y.; Marco, C.; Cannas, M. Effect of Desliming of Tailings on the Fresh and Hardened Properties of Paste Backfill Made From Alkali-Activated Slag. Adv. Mater. Sci. Eng. 2020, 2020, 4536257. [Google Scholar] [CrossRef]
- Ouattara, D.; Mbonimpa, M.; Yahia, A.; Belem, T. Assessment of Rheological Parameters of High Density Cemented Paste Backfill Mixtures Incorporating Superplasticizers. Constr. Build. Mater. 2018, 190, 294–307. [Google Scholar] [CrossRef]
- Yang, L.; Yilmaz, E.; Li, J.; Liu, H.; Jiang, H. Effect of Superplasticizer Type and Dosage on Fluidity and Strength Behavior of Cemented Tailings Backfill with Different Solid Contents. Constr. Build. Mater. 2018, 187, 290–298. [Google Scholar] [CrossRef]
- Jia, Z.; Zhang, Z.; Jia, L. Effect of Different Expansive Agents on the Early Age Structural Build-Up Process of Cement Paste. Cem. Concr. Compos. 2023, 144, 105282. [Google Scholar] [CrossRef]
- Yu, Y.; Ma, L. Application of Roadway Backfill Mining in Water-Conservation Coal Mining: A Case Study in Northern Shaanxi, China. Sustainability 2019, 11, 3719. [Google Scholar] [CrossRef]
- Liu, W.; Pang, L.; Xu, B.; Sun, X. Study on Overburden Failure Characteristics in Deep Thick Loose Seam and Thick Coal Seam Mining. Geomat. Nat. Hazards Risk 2020, 11, 632–653. [Google Scholar] [CrossRef]
- Deng, X.; Klein, B.; Tong, L.; de Wit, B. Experimental Study on the Rheological Behavior of Ultra-Fine Cemented Backfill. Constr. Build. Mater. 2018, 158, 985–994. [Google Scholar] [CrossRef]
- Li, B.; Zhang, J.; Yan, H.; Zhou, N.; Li, M. Experimental Investigation into the Thermal Conductivity of Gangue-Cemented Paste Backfill in Mine Application. J. Mater. Res. Technol. 2022, 16, 1792–1802. [Google Scholar] [CrossRef]
- Amir, H.; Behravan, A.; Quinn, K.O.; Robertson, B.; Ley, M.T. Impact of Early Formwork Removal on Concrete Drying and Chloride Ion Diffusion. J. Mater. Civ. Eng. 2023, 7, 4023171. [Google Scholar]
- Hu, Y.; Li, K.; Zhang, B.; Han, B. Development of Cemented Paste Backfill with Superfine Tailings: Fluidity, Mechanical Properties, and Microstructure Characteristics. Materials 2023, 16, 1951. [Google Scholar] [CrossRef]
- Yang, B.; Wang, X.; Yin, P.; Gu, C.; Yin, X.; Yang, F.; Li, T. The Rheological Properties and Strength Characteristics of Cemented Paste Backfill with Air-Entraining Agent. Minerals 2022, 12, 1457. [Google Scholar] [CrossRef]
- Wang, Z.; Zou, D.; Liu, T.; Zhou, A. Influence of Paste Coating Thickness on the Compressive Strength, Permeability, and Mesostructure of Permeable Concrete. Constr. Build. Mater. 2021, 299, 123994. [Google Scholar] [CrossRef]
- Tatsuya, M.; Hashiguchi, K. Numerical Analysis of Footing Settlement Problem by Subloading Surface Model. Soils Found. 2009, 2, 207–220. [Google Scholar]
- Sitharam, T.G.; Maji, V.B.; Verma, A.K. Practical Equivalent Continuum Model for Simulation of Jointed Rock Mass Using Flac3D. Int. J. Geomech. 2007, 7, 389–395. [Google Scholar] [CrossRef]
- Qiu, H.; Zhang, F.; Sun, W.; Liu, L.; Zhao, Y.; Huan, C. Experimental Study on Strength and Permeability Characteristics of Cemented Rock-Tailings Backfill. Front. Earth Sci. 2022, 10, 802818. [Google Scholar] [CrossRef]
- Zhang, C.; Wang, J.; Song, W.; Fu, J. Pore Structure, Mechanical Behavior and Damage Evolution of Cemented Paste Backfill. J. Mater. Res. Technol. 2022, 17, 2864–2874. [Google Scholar] [CrossRef]
Disclaimer/Publisher’s Note: The statements, opinions and data contained in all publications are solely those of the individual author(s) and contributor(s) and not of MDPI and/or the editor(s). MDPI and/or the editor(s) disclaim responsibility for any injury to people or property resulting from any ideas, methods, instructions or products referred to in the content. |
© 2024 by the authors. Licensee MDPI, Basel, Switzerland. This article is an open access article distributed under the terms and conditions of the Creative Commons Attribution (CC BY) license (https://creativecommons.org/licenses/by/4.0/).