Article

Research on the Skidding Resistance and Attenuation Characteristics of Asphalt Pavement Based on Image Recognition-Analysis Strategy

1
School of Business, Fuyang Normal University, Fuyang 236041, China
2
School of Civil Architecture, Anhui University of Science & Technology, Huainan 232001, China
3
School of Highway, Chang’an University, Xi’an 710064, China
4
Fuyang Traffic Energy Investment Co., Ltd., Fuyang 236001, China
*
Author to whom correspondence should be addressed.
Coatings 2024, 14(6), 749; https://doi.org/10.3390/coatings14060749
Submission received: 12 May 2024 / Revised: 10 June 2024 / Accepted: 11 June 2024 / Published: 13 June 2024
(This article belongs to the Section Environmental Aspects in Colloid and Interface Science)

Abstract

:
To accurately evaluate the skidding resistance of asphalt pavements, a texture imaging device was developed to realize the standardized acquisition of pavement images. Based on the gray-level co-occurrence matrix and multifractal theory of texture structure, the influence of segregation degree and gradation type on the texture properties of asphalt pavement was studied. Meanwhile, a comprehensive evaluation index of skidding resistance was proposed for asphalt pavement. Furthermore, the attenuation characteristics of the anti-skidding performance for asphalt mixture were explored, and the corresponding attenuation model of asphalt pavement was established. The results show that the segregation degree and gradation type significantly affected the texture parameters and anti-skidding performance of asphalt mixture. Specially, with an increase in the segregation degree of coarse aggregate, the parameters of energy, entropy, and multifractal spectrum width gradually increased, whereas the inertial moment gradually decreased. The variation range of the multifractal spectrum difference initially increased and subsequently decreased. For the texture parameters such as energy, entropy, inertial moment, and multifractal spectrum width Δα, the values of the asphalt mixture with larger nominal maximum particle were higher than those of the mixture with smaller nominal maximum particle, whereas the multifractal spectrum difference value showed the opposite law. In addition, the texture parameters of energy, entropy, and multifractal spectrum width exhibited good linear correlation with the texture depth (TD) of asphalt mixtures with various segregation levels and gradation types. The index based on the texture parameters of energy, entropy, and multifractal spectrum width effectively evaluated the skidding resistance of asphalt pavements, which showed the same trend as the TD with the increase of the abrasion number. The achievement provides an effective solution for the evaluation of skidding resistance and attenuation characteristics of asphalt mixtures.

1. Introduction

The anti-skidding performance is an important factor affecting the driving safety on asphalt pavements. The degree of friction between the wheel and the pavement depends on the properties of the texture structure, which determines the skidding resistance of the pavement surface [1,2]. In recent years, vehicle overload has accelerated the attenuation of pavement skidding resistance, thereby seriously reducing the travel safety [3,4]. To effectively improve the anti-skidding performance and enhance road traffic safety, Chen et al. [5] developed a set of measuring equipment and proposed a multi-scale representation method for texture features using a 3D laser scanner. Chen et al. [6] discussed the measurement parameters of the close-range photogrammetry (CRP) method and further optimized the collection of texture features. Zelelew et al. [7] characterized the macroscopic textural properties of asphalt pavements using the wavelet analysis method. Miller et al. [8] recommended a method for characterizing the texture of asphalt pavements and calculated the mean profile depth (MPD) and mean texture depth (MTD). Dan et al. [9] designed an algorithm for a discrete element model (DEM) to simulate the evolution of the surface texture of an asphalt mixture caused by the abrasion of aggregates and the deformation of asphalt mortar under repeated loads. Based on the designed Gaussian filtering algorithm, Hu et al. [10] separated the macrotexture and microtexture, extracted three texture features from three-dimensional macro-texture data, and constructed a correlation analysis model between the macrotexture parameters and friction coefficient. Hoang et al. [11] developed an advanced image processing method and selected an extreme randomization tree (ERT) and a deep neural network (DNN) to analyze the features extracted from the above-mentioned methods. He et al. [12] utilized unmanned aerial vehicle (UAV) to capture images of pavement damage and then combined with gray level co-occurrence matrix (GLCM) algorithm and cloud model theory to develop the pavement damage identification and evaluation model.
Furthermore, in the evaluation of the skidding resistance of asphalt pavements based on texture features, Lu et al. [13] discussed evaluation indicators by executing generative adversarial networks (GANs) to quantitatively estimate the diversity of the reconstructed textures. Hu et al. [14] evaluated the influence of macrotextural features on the anti-skidding performance of asphalt mixtures with different gradations based on the Bayesian light GBM model. Roy et al. [15] analyzed various image texture analysis methods and proposed reliable texture indicators for asphalt pavements. Sun et al. [16] studied the surface properties of asphalt pavements prepared with different aggregates using a walking friction tester (WFT) and a two-dimensional image texture analysis method (2D-ITAM). Zhang et al. [17] proposed an evaluation method for aggregate distribution uniformity for asphalt pavements based on digital image processing (DIP) technology and established an evaluation standard for aggregate distribution uniformity. Using filtered 3D data to generate a 3D virtual model of pavement texture, Liang et al. [18] proposed a reference area integral method to evaluate pavement MTD. Dan et al. [19] proposed a multi-view stereo reconstruction method based on deep learning to calculate the texture depth of asphalt pavement, so as to accurately evaluate the skidding resistance of asphalt pavement.
Additionally, to explore the attenuation characteristics of the skidding resistance of asphalt pavements, Wang et al. [20] proposed a novel attenuation model to predict the skidding resistance of asphalt pavements and analyzed the influence of different factors on the attenuation properties of skidding resistance. Salehi et al. [21] provided the commonly used method of a laboratory abrasion tester (LAT100) and studied the influence of the aggregate type and temperature on the attenuation characteristics of the skidding resistance of asphalt mixtures. Based on the accelerated loading test method, Yu et al. [22] studied the attenuation properties of the anti-skidding performance of SBS modified asphalt mixture at high temperatures. Wu et al. [23] analyzed the attenuation of asphalt mixtures under various loading numbers and deduced the attenuation mechanism of skidding resistance. Wang et al. [24] established a grey model based on three-dimensional texture by quadratic fitting, which is beneficial for an in-depth analysis of the anti-skidding attenuation properties of asphalt pavement. Hu et al. [25] established a prediction model of friction coefficient based on improved grey wolf optimization (IGWO) and natural gradient boosting (NGBoost) to forecast the skidding resistance.
However, there is a lack of standardized process for acquiring the pavement surface texture when evaluating the skidding resistance of asphalt pavements in previous studies. The relevant indicators cannot fully reflect the texture condition of asphalt pavement and rarely involve the utilization of texture structure properties to comprehensively evaluate the attenuation characteristics of skidding resistance.
Therefore, this study developed an imaging device to achieve the standardized acquisition of texture structures on asphalt pavements. Based on digital image processing technology, the texture structure properties of asphalt mixtures with different degrees of segregation and gradation types were evaluated. Meanwhile, a comprehensive index of H composed of the texture parameters of energy, entropy, and multifractal spectrum width was proposed to evaluate the skidding resistance of asphalt pavement, and the feasibility of H was verified. In addition, the attenuation characteristics of the anti-skidding performance of the asphalt mixture based on texture parameters were explored using an accelerated abrasion tester. The research results are helpful for laboratory evaluation of texture properties of asphalt mixture and predict the attenuation characteristics of the skidding resistance of asphalt pavements.

2. Materials and Methods

2.1. Raw Materials

The 70# base asphalt provided by Anhui Maocheng Road and Bridge Engineering Co., Ltd. (Fuyang, China) was used. The main technical indicators are listed in Table 1.
In addition, to analyze the texture properties of asphalt pavement with various segregation degrees, the rutting plate of AC-20 asphalt mixture with five standard segregation degrees such as fine aggregate segregation (FL), no segregation (N), light segregation (L), moderate segregation (M), and high segregation (H) were designed [17,26], with aggregate gradation curves as shown in Figure 1a. In addition, rutting plate specimens of asphalt mixtures with gradations of AC-13, AC-16, AC-20, and SMA-13 were formed to explore the influence of the gradation type on the texture structure of the asphalt pavement, and the aggregate gradation curves are shown in Figure 1b.
Moreover, to study the attenuation characteristics of skidding resistance of asphalt pavement and further verify the feasibility of proposed evaluation index based on texture parameters, the rutting plate specimens of AC-13 (Ⅰ), AC-13 (Ⅱ), SMA-13 (Ⅰ), SMA-13 (Ⅱ), and SMA-16 asphalt mixture were formed, which aggregate gradation curves as shown in Figure 2. The optimum asphalt content of all mixtures was determined using the Marshall method, as shown in Table 2. The performance of the asphalt mixture satisfied the requirements of the related specifications [27].

2.2. Test Methods

2.2.1. Sand Patch Method

The sand patch method is also known as the volume method. During the test, a fixed volume of standard sand was laid on the surface of the asphalt pavement, and the sand was spread in a circular shape, as shown in Figure 3. The texture depth of the pavement surface could then be obtained by calculating the ratio of the sand volume to the paving area. The calculation formula of texture depth is TD = 1000 V/(πd2/4), where d is the sand-paving diameter, and V is the sand volume.

2.2.2. Skidding Resistance of Asphalt Pavement Based on Texture Structure

Image Acquisition and Processing of Asphalt Pavement

(1)
Standardized image acquisition
The developed image acquisition device for the texture structure of the asphalt pavement is shown in Figure 4 [17,28].
The device included a camera of charge coupled device (CCD), device frame, shading adjustment mechanism, height adjustment rod, LED light source, and light controller. After setting up the height frame, the shading adjustment mechanism, brightness, and height of the light source, the image acquisition of the texture structure for asphalt pavement under different conditions can be performed. The specific steps for collecting images of the surface texture of asphalt mixture were as follows:
(1) Place the light-shading box on the image acquisition area of the sample, with the imaging port directly above the image acquisition area.
(2) Turn on the LED lights, adjust the height of the third LED light on the spiral rod so that the camera and the light source are at a side angle of 30° to 45° to achieve optimal image imaging effect.
(3) Extend the lens of the CCD camera into the box through the imaging port, adjust the camera parameters, and determine the reasonable parameter combination.
(4) Utilize the CCD camera to capture the texture images of the sample surface.
(5) Move the light-shading box to the next image acquisition area and capture the texture images of the sample.
(2)
Image processing
Based on the texture features extracted from the gray-level co-occurrence matrix, the surface images of asphalt pavement with better effects were selected and converted into 256-level grayscale images. Then, the collected images were preprocessed by MATLAB 2022a software, including image cropping, noise reduction, segmentation, and morphologization. Subsequently, the gray levels of the images were quantized to 16 levels and the gray-level co-occurrence matrix of the images was further obtained [29]. Since the GLCM is usually related to the distribution of pixels in the actual image, if the gray level and pixel value of the image are too large, the corresponding calculation may be more complicated, resulting in increased computation time. In the process of practical application, the pixel spacing of the image was set to 1, and 4 angles of 0°, 45°, 90°, and 135° were selected to shorten the calculation time.
(3)
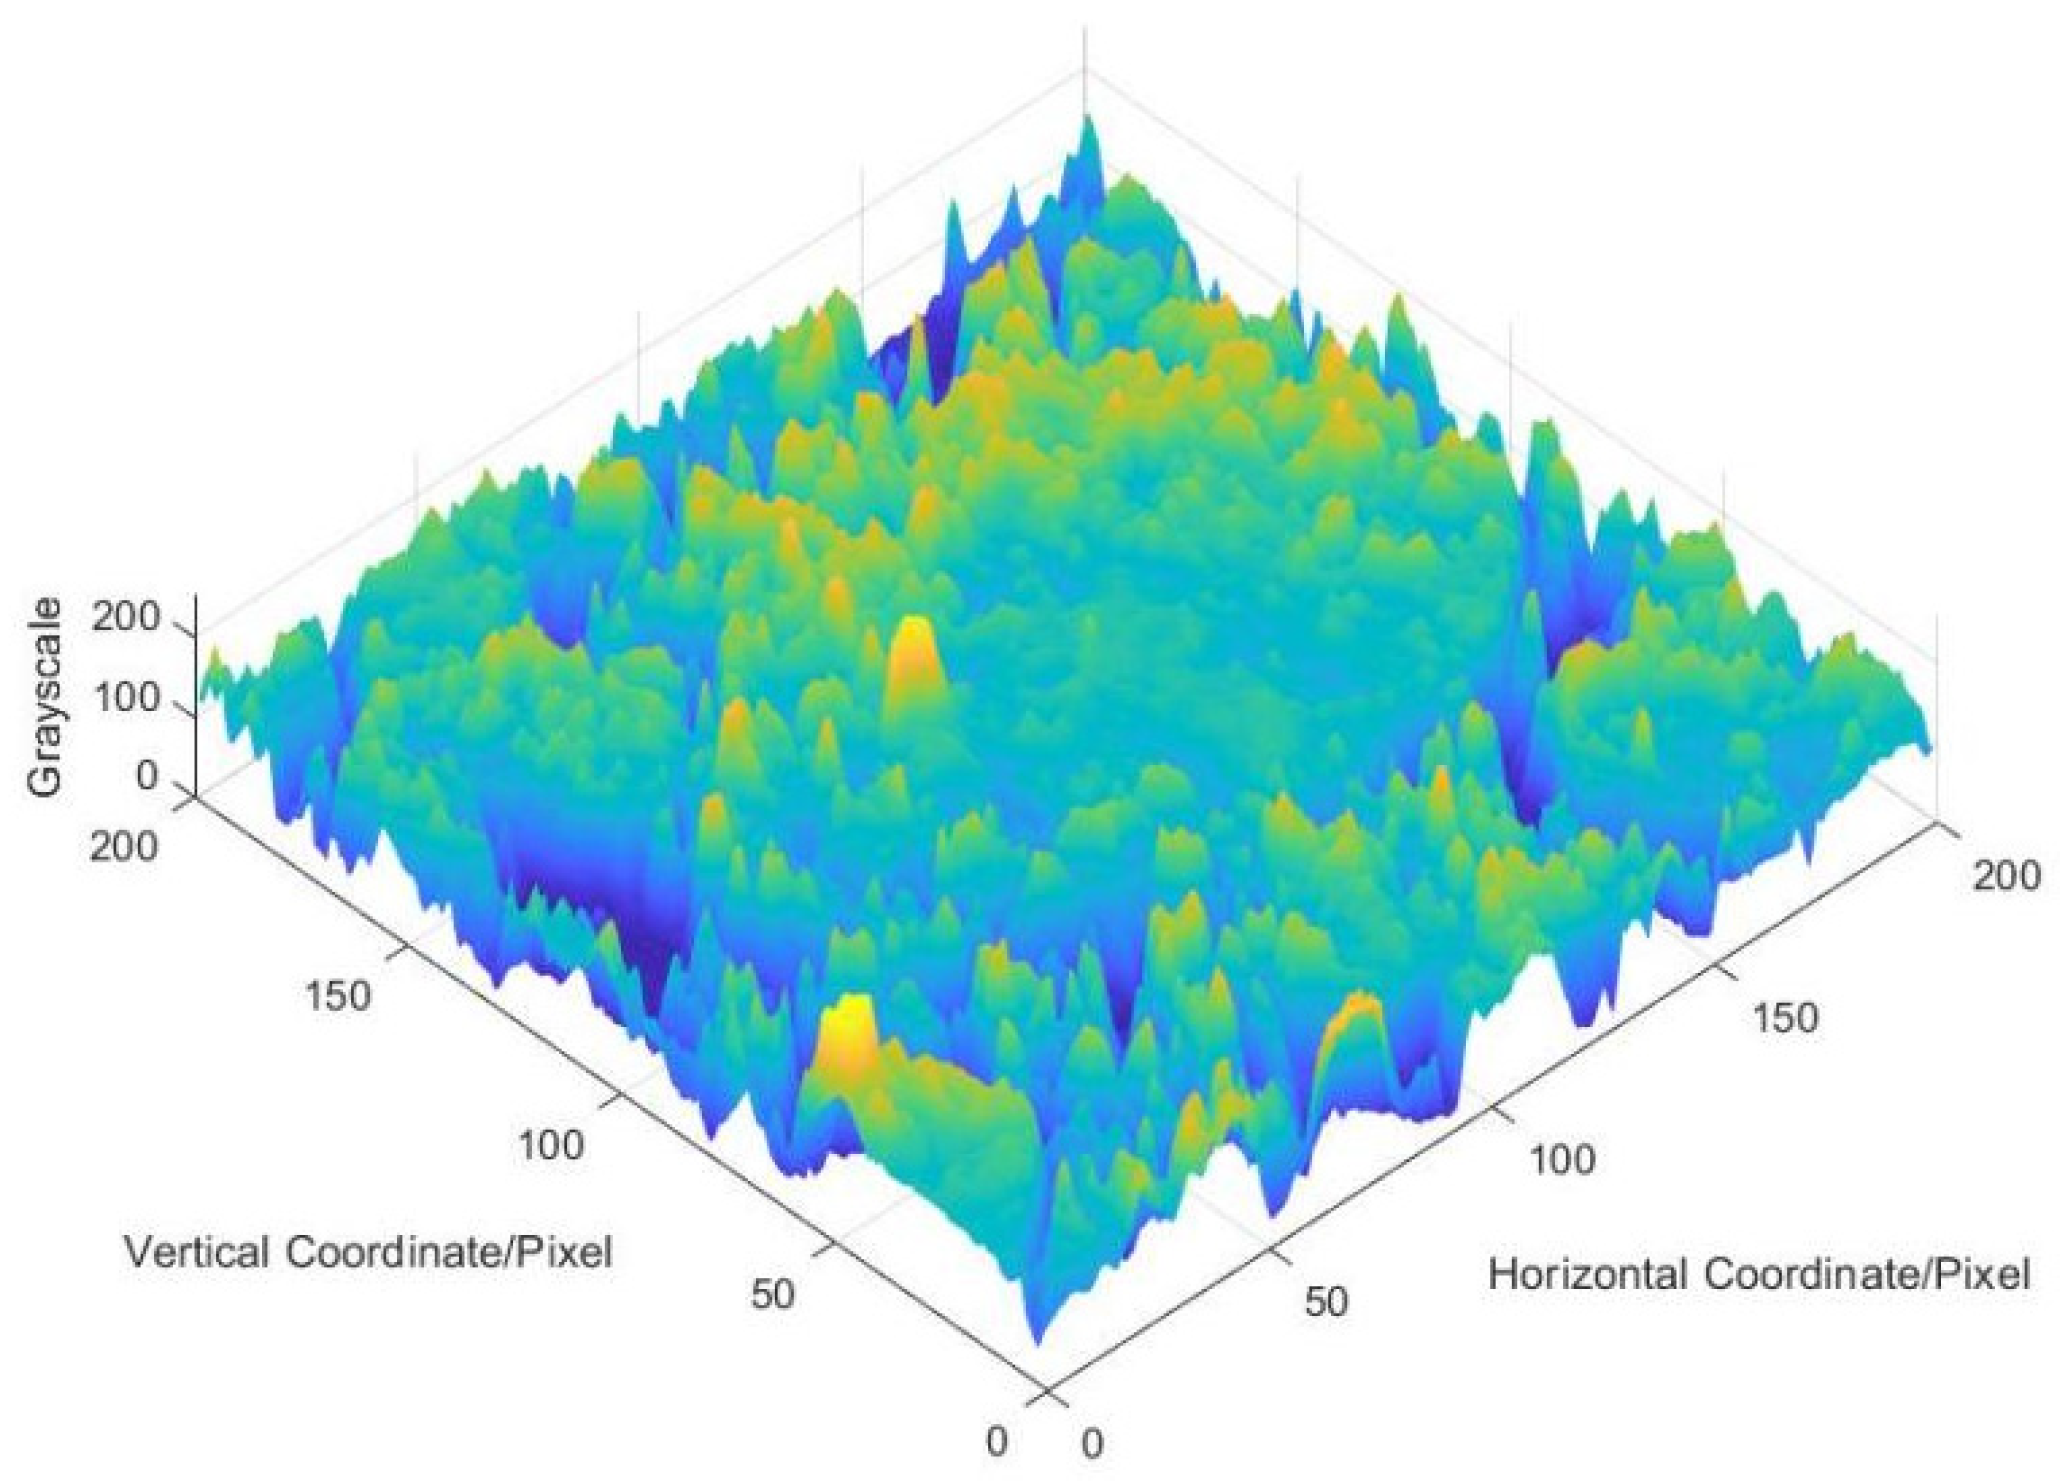
Three-dimensional reconstruction of texture image
Based on the principle of shape from shading (SFS), the two-dimensional images were reconstructed according to the corresponding algorithm to obtain the three-dimensional morphology of the texture structure [30]. The preprocessed gray image was analyzed using MATLAB to obtain the corresponding coordinates and gray levels, and a three-dimensional texture model was constructed, as shown in Figure 5.

Texture Parameters Based on Gray-Level Co-Occurrence Matrix

Texture image information has complex and diverse properties; therefore, it is necessary to analyze and evaluate texture information completely and comprehensively. In this study, the influence of texture information extraction and classification was fully considered in the statistics based on the gray-level co-occurrence matrix. Four statistical parameters of energy, entropy, inertial moment, and correlation were selected to analyze the information features of the texture image [31,32].
(1)
Energy
The energy Asm is the sum of the squares of all the element values of the gray-level co-occurrence matrix, also known as the angular second moment, as shown in Equation (1). The energy transformation indicates the uniformity of the gray distribution and texture roughness of the image.
A sm = i j p ( i , j ) 2
p ( i , j ) = n i n i
Here, ni is the number of pixels in each gray level.
(2)
Entropy
Entropy (Ent) is a random measure of the amount of information contained in an image and is often used to reflect the content randomness of the image, as shown in Equation (3). The entropy value indicates the complexity of the gray distribution in the image. The larger the entropy value is, the more complex the image will be.
E n t = i j p ( i , j ) × log p ( i , j )
(3)
Inertial moment
The inertial moment Con is also known as the contrast, reflecting the clarity and depth of the texture structure of the selected image, as shown in Equation (4).
C o n = i j i j 2 p ( i , j )
(4)
Correlation
The correlation Corr is mainly used to describe the similarity of the gray level of the image in the row or column direction, the size of which directly reflects the change range of different positions in the image, as shown in Equation (5).
C o r r = i j i × j × p ( i , j ) μ x × μ y σ x × σ y
Here, μx and μy are the mean values of p(i,j), and σx and σy are the variances of p(i,j). The specific expressions are as follows:
μ x = i i j p ( i , j )
μ y = i j j p ( i , j )
σ x = i ( i u ) 2 j p ( i , j )
σ y = i ( j u y ) 2 j p ( i , j )

Texture Parameters Based on Multifractal Theory

According to the multifractal theory, the multifractal spectrum α-f(α) is a measure of complexity, irregularity, and inhomogeneity from the perspective of fractal structure. In the application, the preprocessed image is binarized and transformed into a measurement space, and the research object is then divided into N small regions. Suppose that the scale of the i-th small region is εi, then the probability measure of this region distribution is Pi. The characterization of the probability measure Pi and εi by the different scale index αi will satisfy the following relationship.
P i ( ε i ) = ε i α i
The partition function was defined as χ q ( ε ) = i = 1 N ( ε ) P i ( ε ) q . Here, q is the order, which ranges from −100 to 100.
To improve the computational efficiency, the calculation method proposed by Chhabra et al. was used to orthogonalize the probability measure [33].
u i ( q , ε ) = P i q ( ε ) i = 1 N ( ε ) P i q ( ε )
Then, the calculation formula of multifractal spectrum is as follows:
α ( q ) = lim ε 0 i = 1 N ( ε ) u i ( q , ε ) l n P ( ε ) ln ε
f ( q ) = lim ε 0 i = 1 N ( ε ) u i ( q , ε ) ln u i q , ε ln ε
The α(q) and f(q) were selected as independent and dependent variables, respectively, corresponding to the α-f(α) coordinates, and the multifractal spectrum of the three-dimensional morphology of asphalt pavement could be obtained. The corresponding parameters of multifractal spectrum width ∆α and spectral difference ∆f can be calculated by the Formulas (14) and (15), both of which are commonly used to evaluate the three-dimensional texture characteristics of asphalt pavement [28].
Δ α = α max α min
Δ f = f ( α min ) f ( α max )
Here, the multifractal spectrum width Δα represents the degree of uneven distribution of probability measures on all fractal structures, whereas the multifractal spectrum difference Δf reflects the amount proportion of the maximum and minimum probability units.

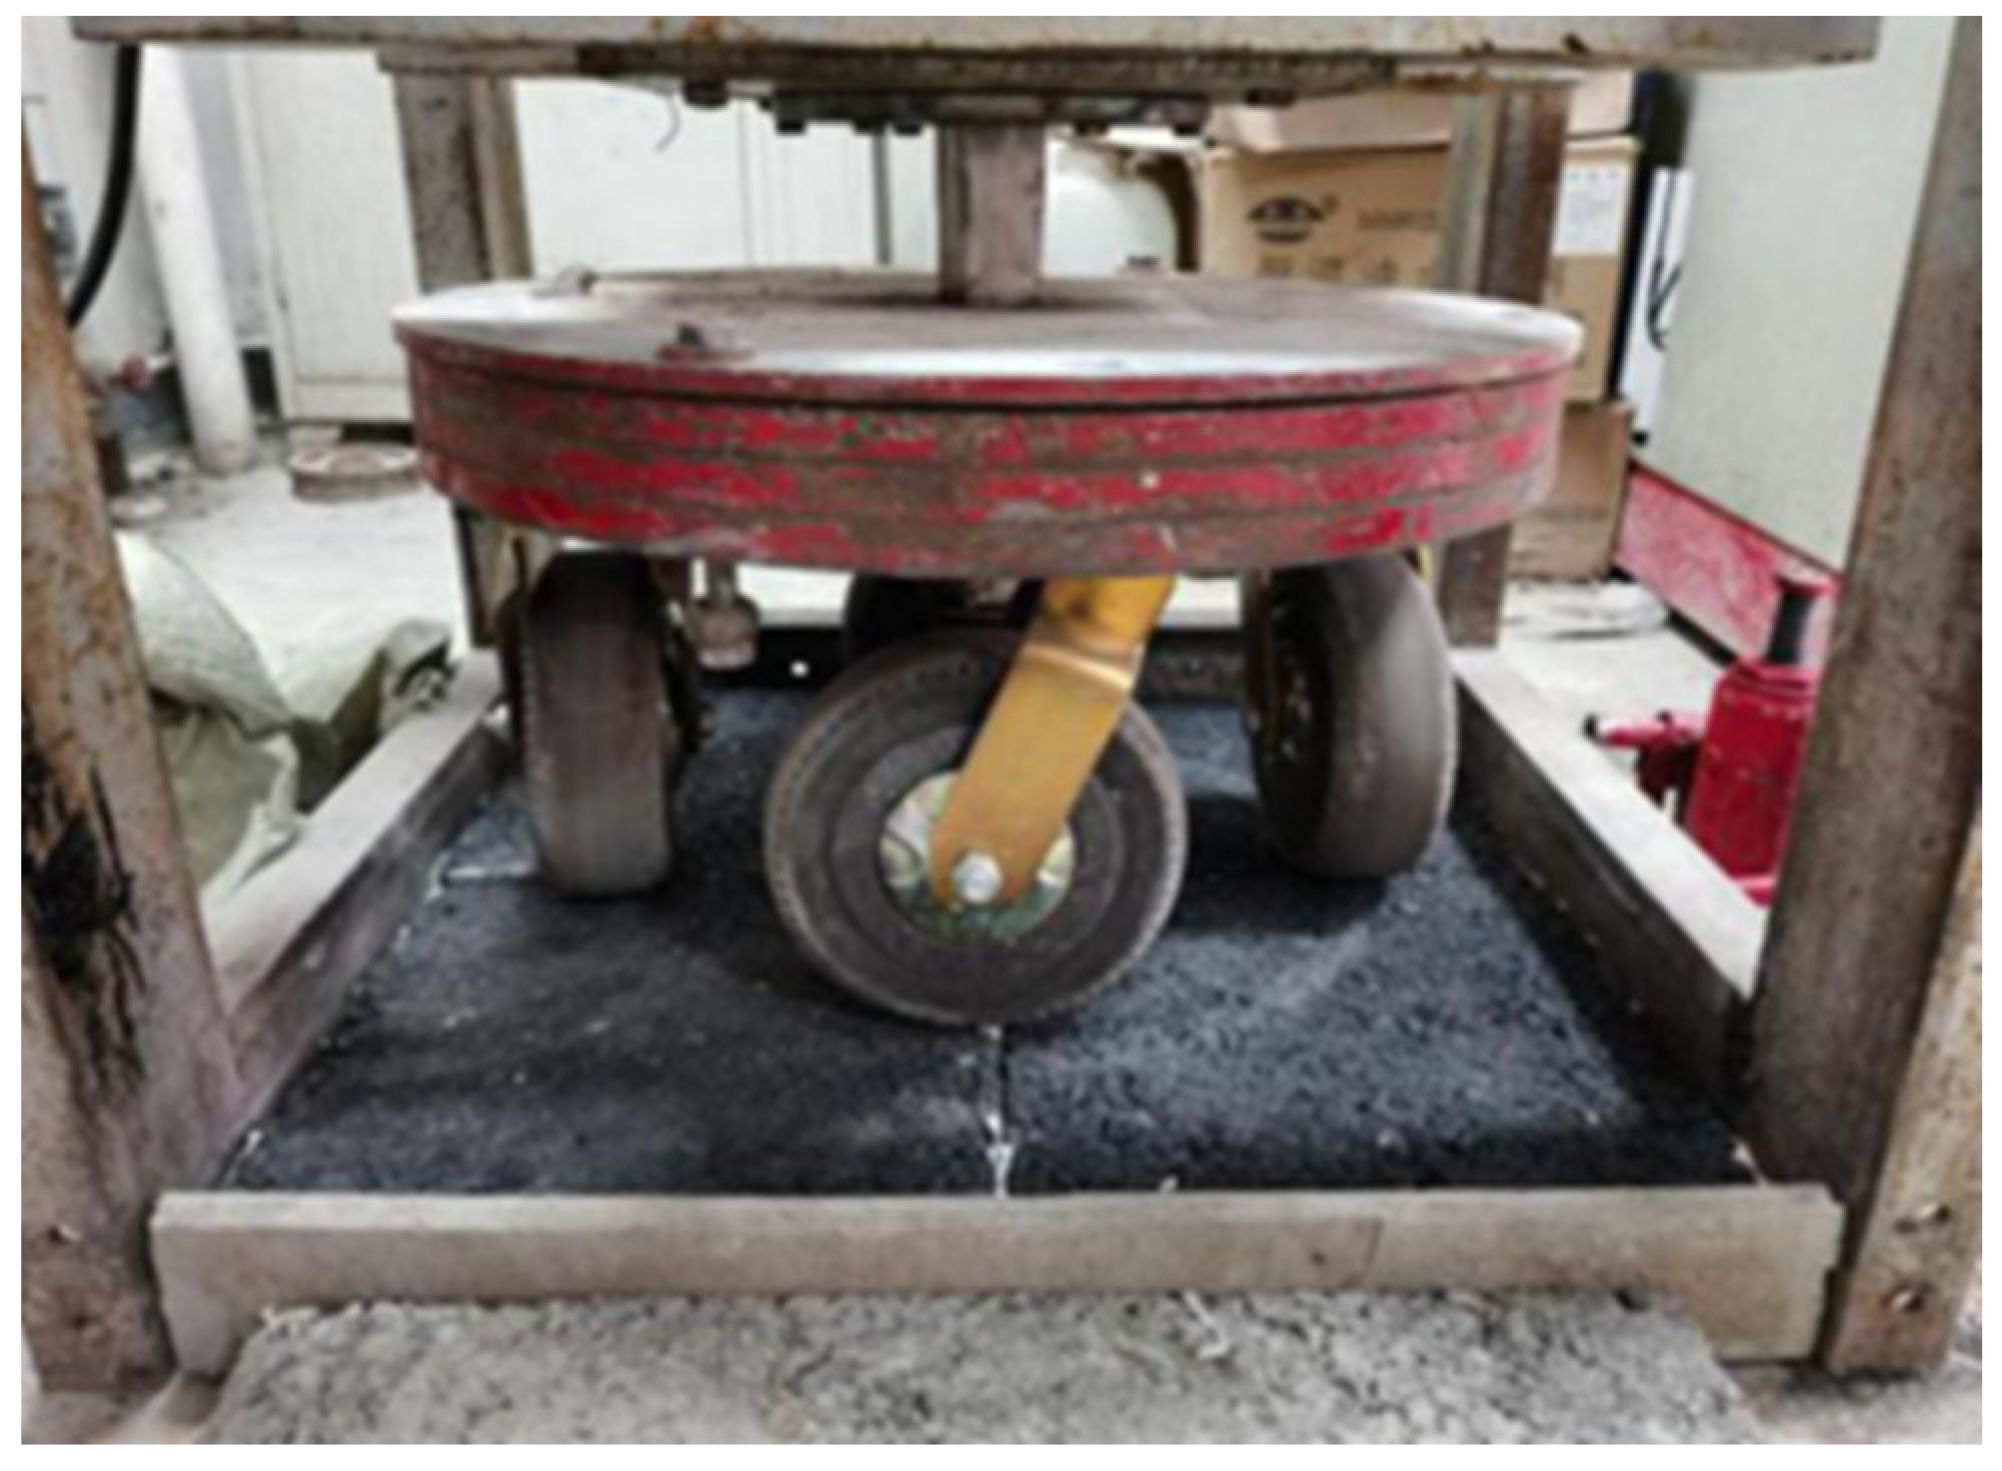
2.2.3. Attenuation Test of Skidding Resistance for Asphalt Pavement

To effectively and accurately simulate the abrasion condition of asphalt pavement, the pavement-accelerated abrasion device developed by Chang’an University was used to treat the rutting plates of the AC-13 (I), AC-13 (II), SMA-13 (I), SMA-13 (II), and SMA-16 asphalt mixtures, as shown in Figure 6 [34]. The device included the frame, power system, control system, transmission system, loading wheel, load regulation system, specimen fixing system, and signal collector. The specimen included four rutting plates, and each plate showed a 1/4 ring track on the surface after abrasion treatment by the loading wheel. Specifically, the accelerated abrasion test was conducted at a room temperature of 25 °C, and the rutting specimen was in a dry state. The number of loadings for each specimen was 50,000 times. The load on the wheels was 0.7 MPa.
After the accelerated abrasion treatment of the rutting specimen, the comprehensive evaluation index H of the anti-skidding performance was calculated based on image processing technology. The specific process was as follows: obtain the pavement surface image, cut the fixed area in the region of the wheel track, convert the color image into a gray image, and calculate the index H of the target area by using MATLAB software.

3. Results and Discussion

3.1. Evaluation of Texture Properties of Asphalt Pavement

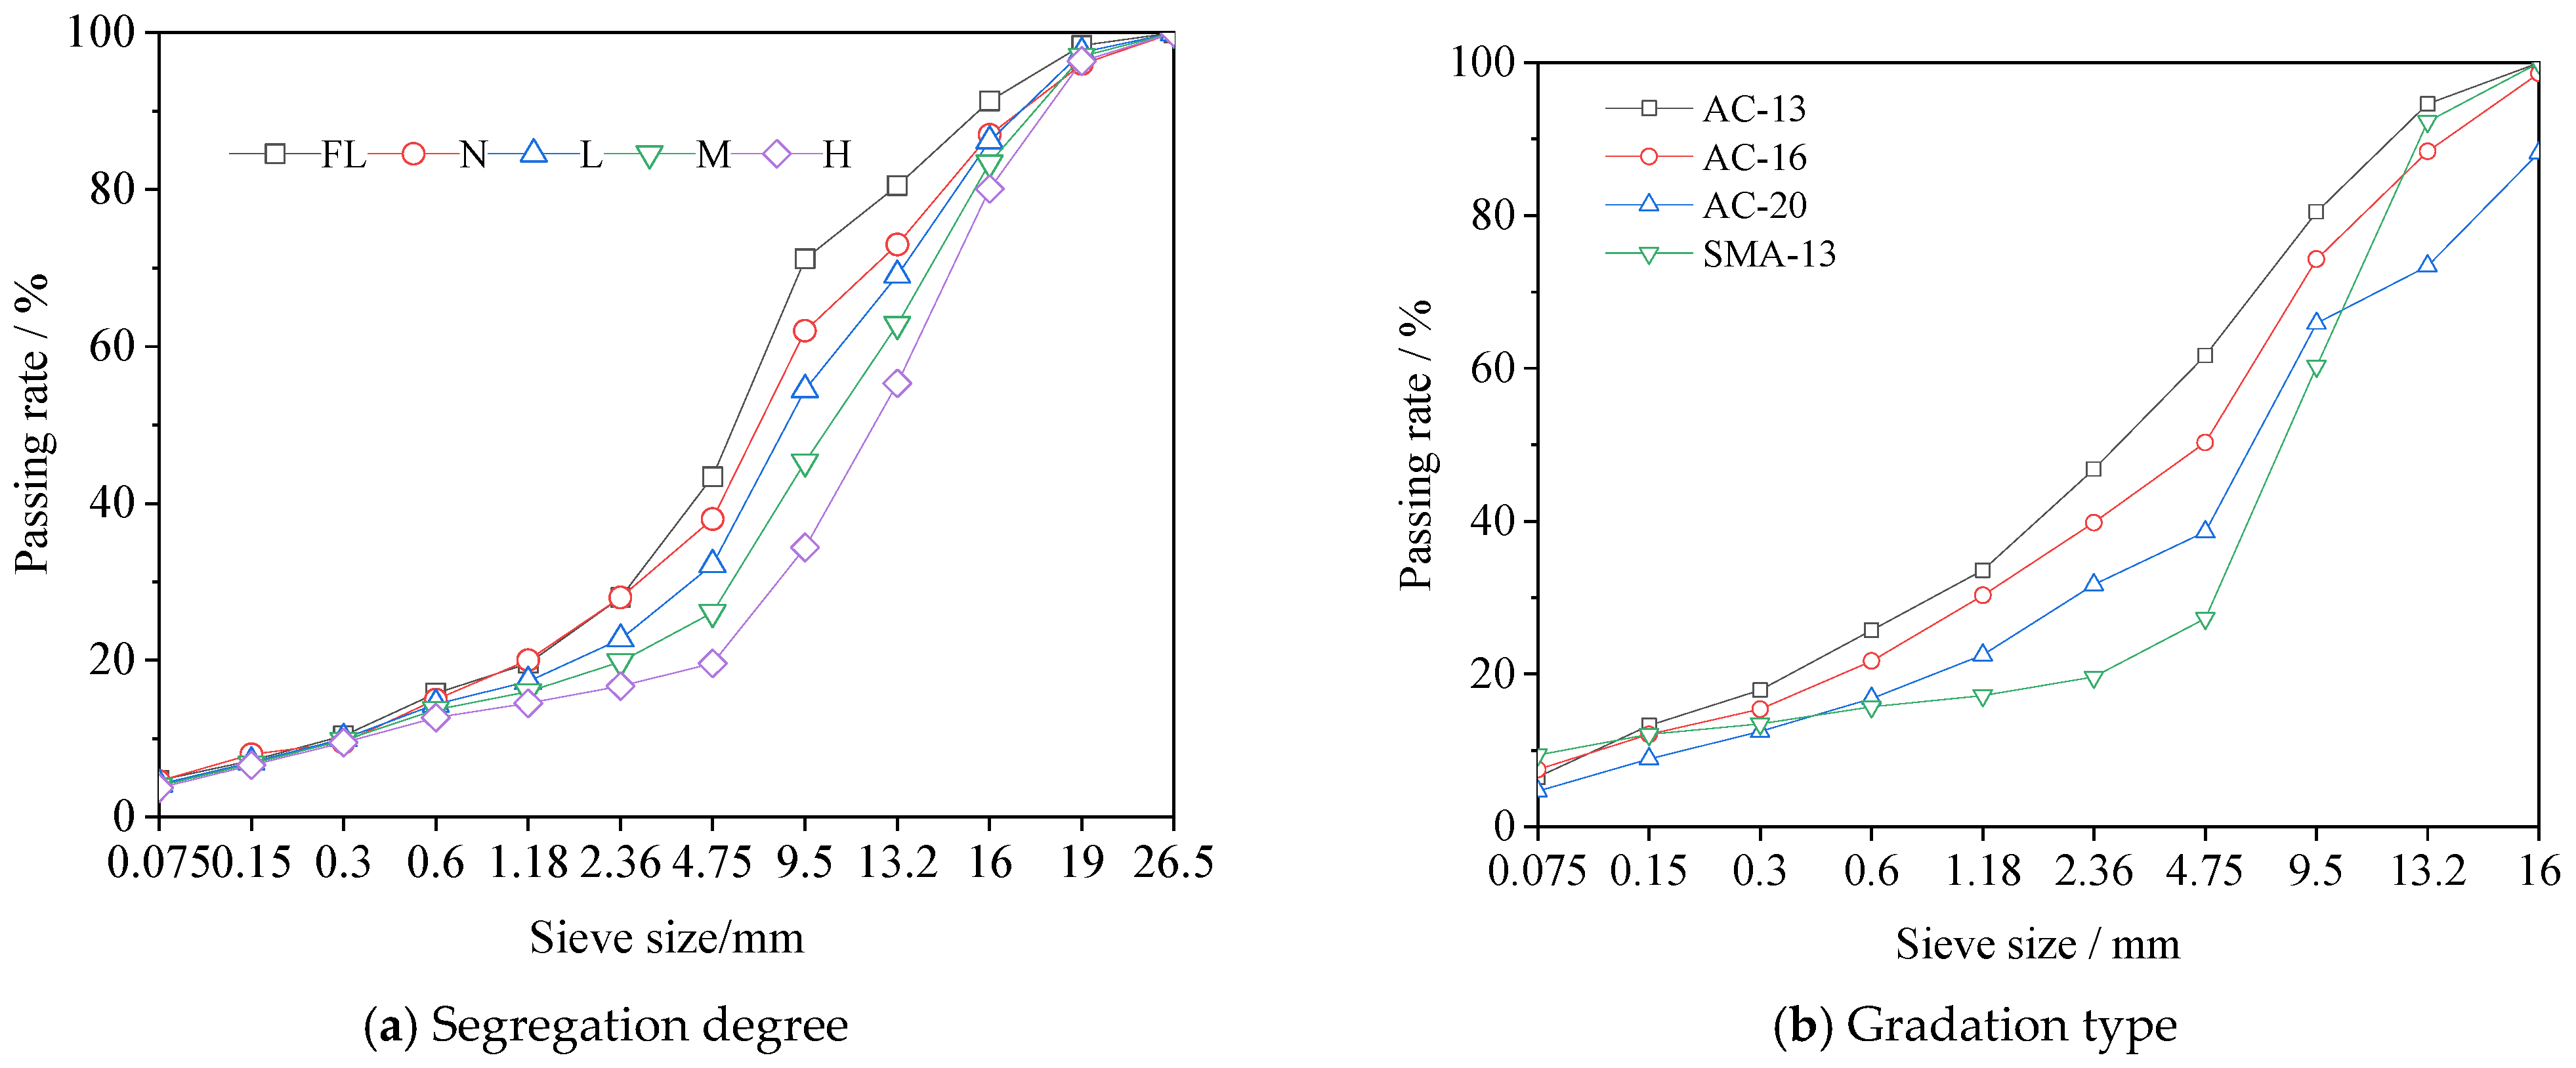
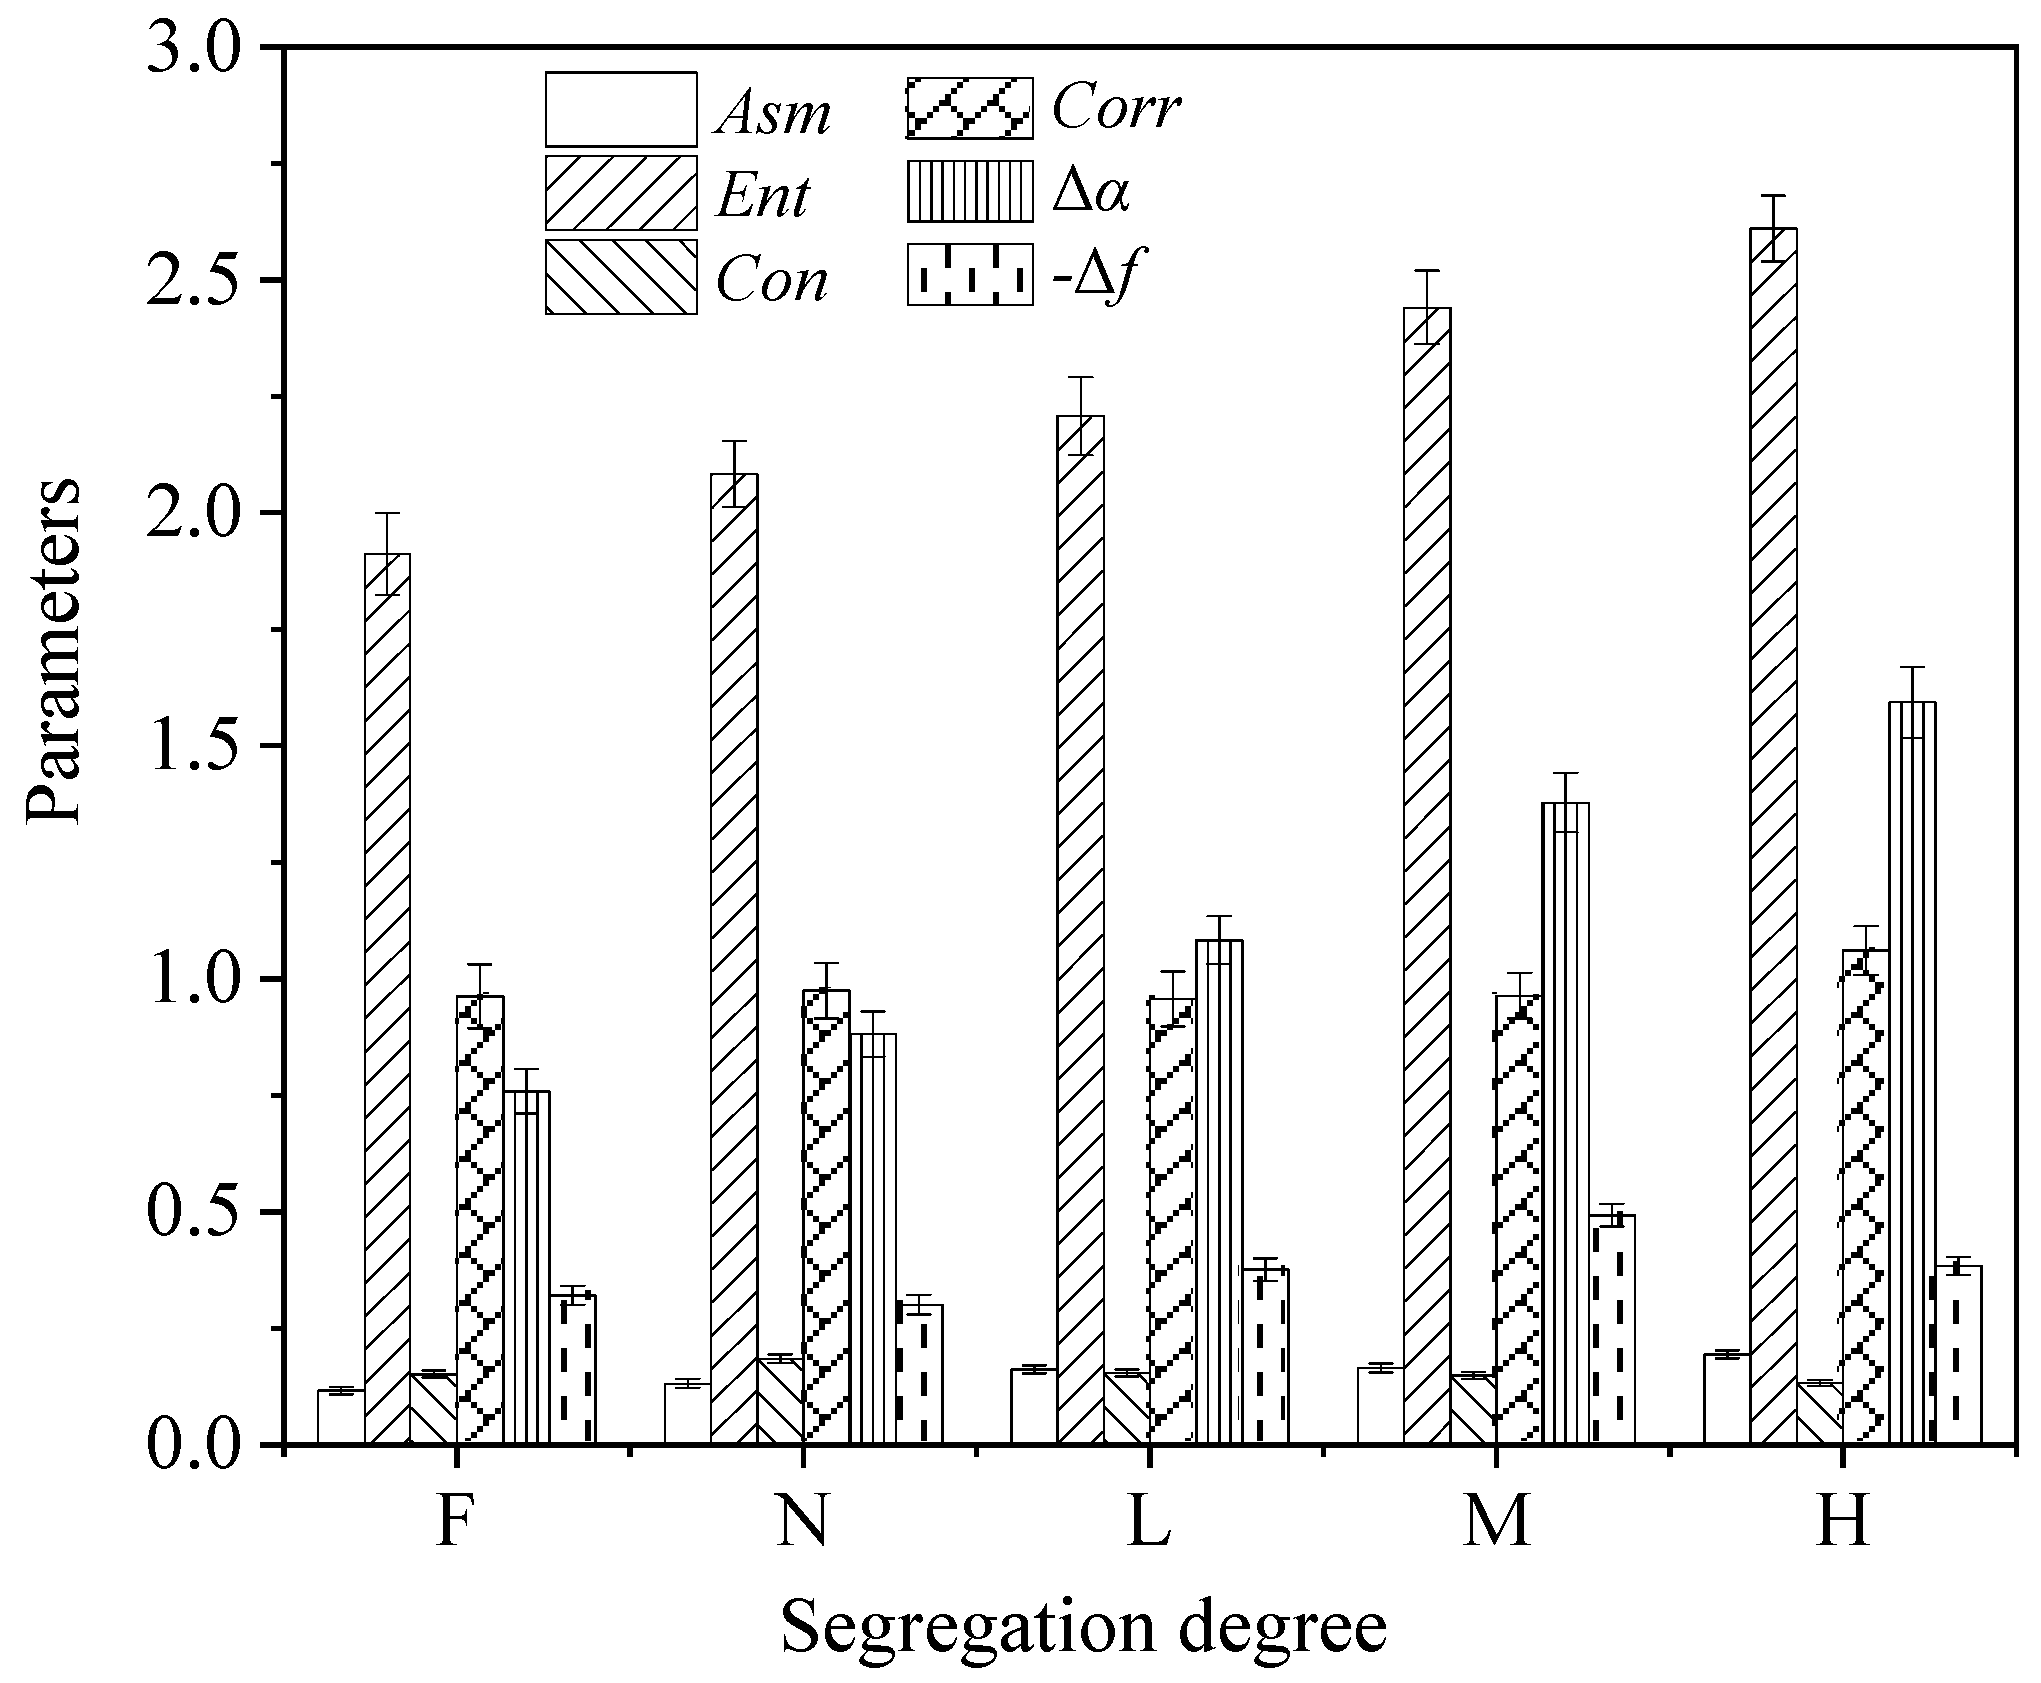
3.1.1. Texture Properties of Asphalt Pavement with Various Segregation Degrees

Surface images of the rutting plates of the AC-20 asphalt mixture with five segregation degrees of FL, N, L, M, and H were selected. The parameters of energy, entropy, inertial moment, correlation, multifractal spectrum width, and spectral difference of each specimen image were calculated using MATLAB software. The results are shown in Figure 7.
As shown in Figure 7, the texture parameters of the asphalt mixtures with different segregation levels changed to varying degrees when compared to the non-segregated mixture. Specifically, with an increase in the degree of coarse segregation, the energy, entropy, and multifractal spectrum width gradually increased, whereas the inertial moment gradually declined. The variation ranges of multifractal spectrum difference Δf first increased and subsequently decreased, and the change trend of the correlation was not evident. When fine-aggregate segregation occurs in an asphalt mixture, various parameters decrease to different degrees. Among several parameters of texture structure, the multifractal spectrum width Δα is sensitive to the change of segregation degree of coarse aggregate, and the corresponding variation range is the largest. The increase in the range of the multifractal spectrum width of the asphalt mixture with the segregation level H reaches 80.8%. The variation range of the correlation among the specimens with various degrees of segregation is typically 3%. After the fine aggregate segregation of the asphalt mixture, the reduction ranges of the inertial moment and multifractal spectrum width are larger, whereas the change ranges of the correlation and multifractal spectrum difference are smaller.
Furthermore, after comparing the rutting plate images of the segregated asphalt mixture in Figure 7, it can be considered that the aggregate segregation was serious, corresponding to the large values of energy, entropy based on the gray-level co-occurrence matrix, and spectrum width based on multifractal theory. At this point, the gap between the aggregate particles was large. In other words, when the texture was rougher, the anti-skidding performance was better. Compared with fine aggregate segregation and non-segregation, the surface texture of the asphalt mixture with segregation levels of L and M is relatively rougher [35], which is superior to that of other segregated asphalt mixtures in terms of overall texture properties, showing good skidding resistance.

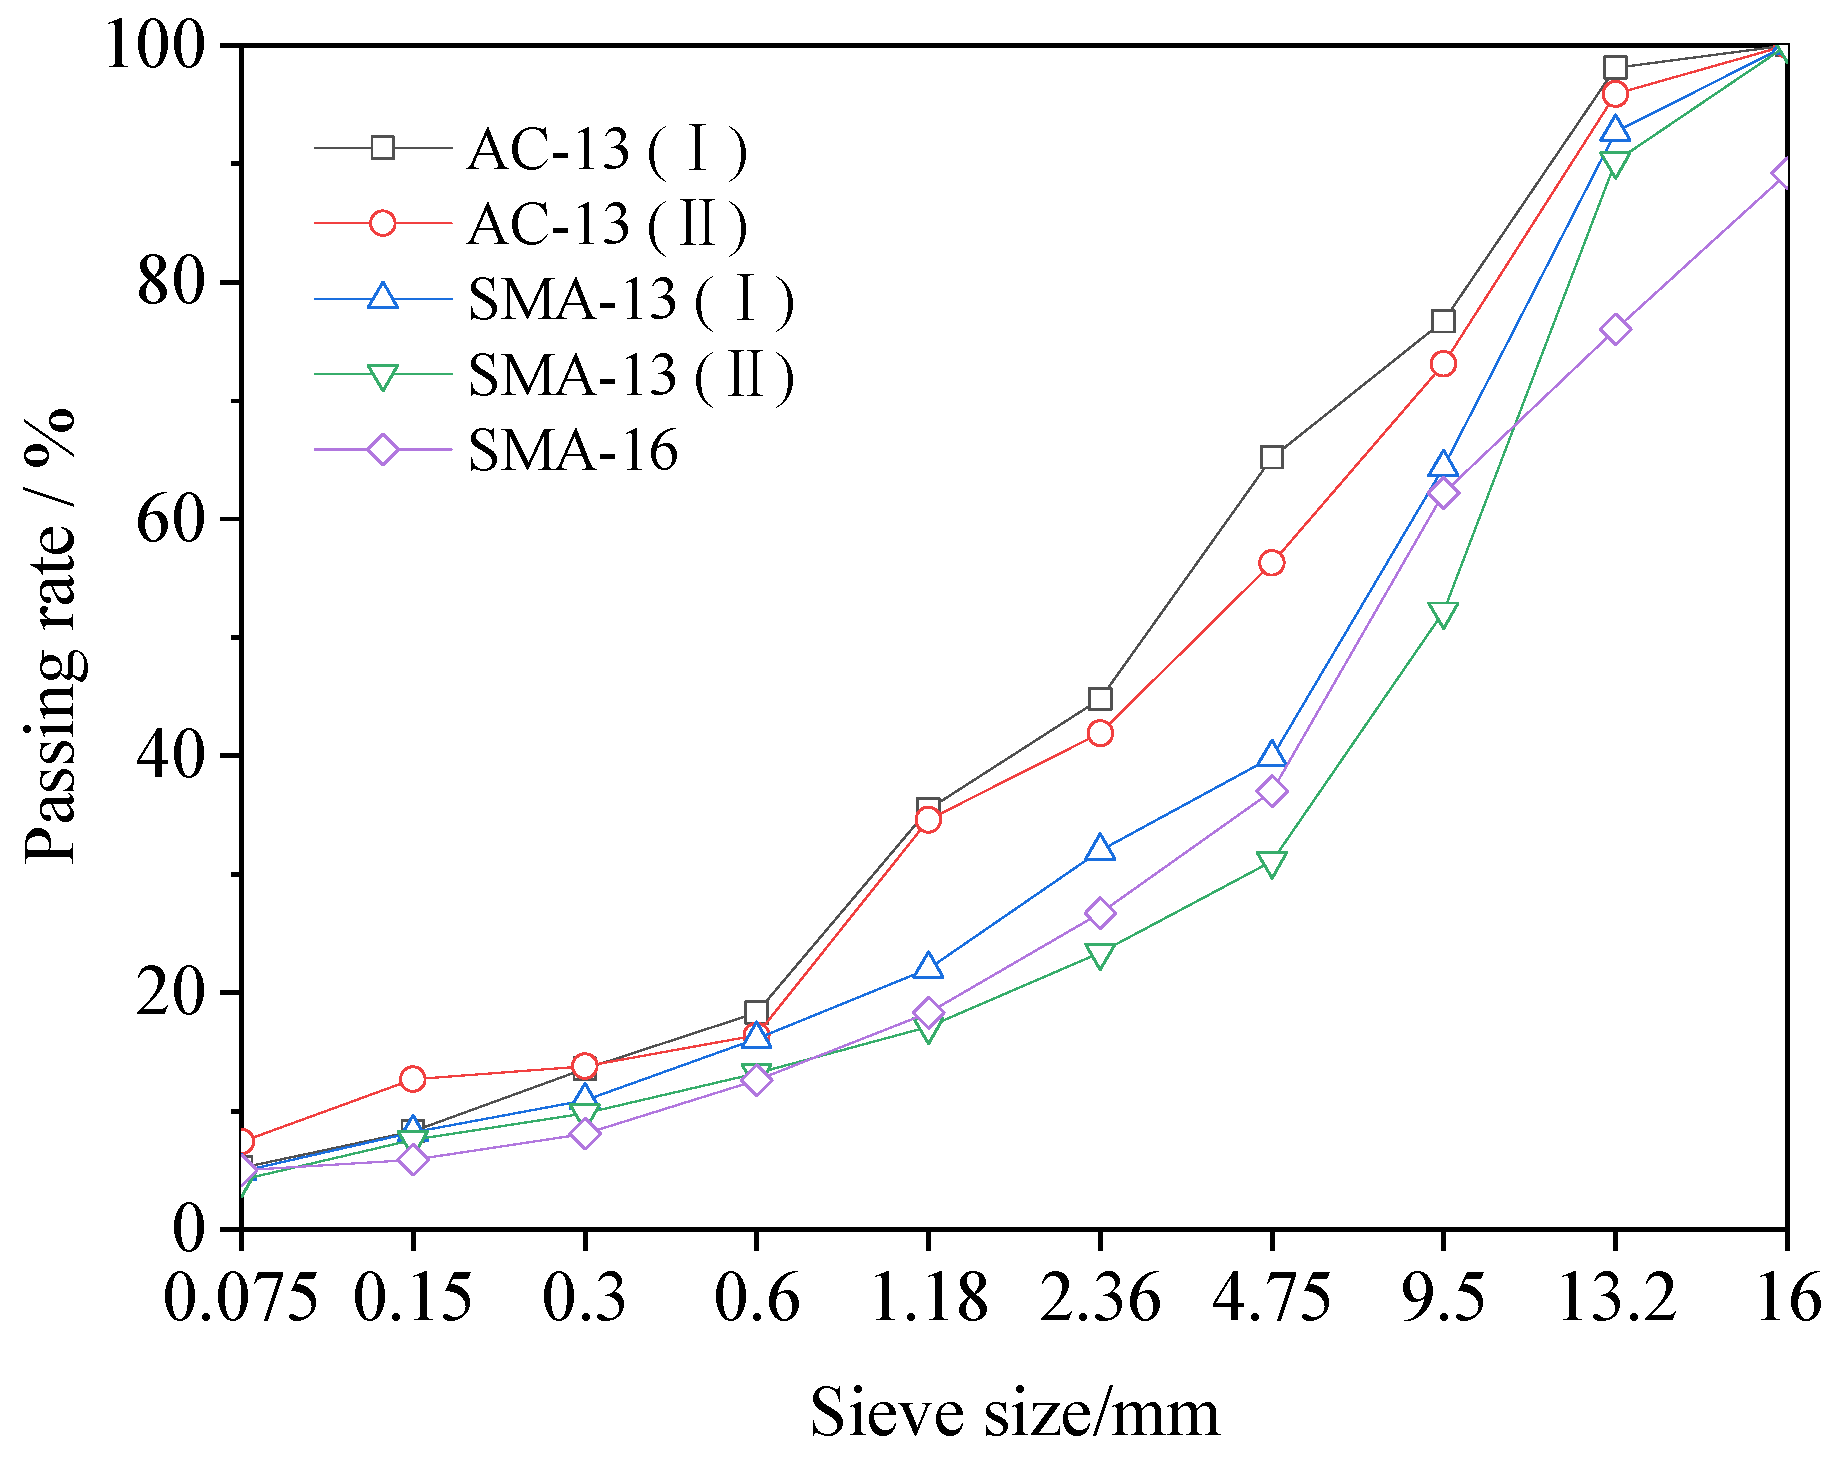
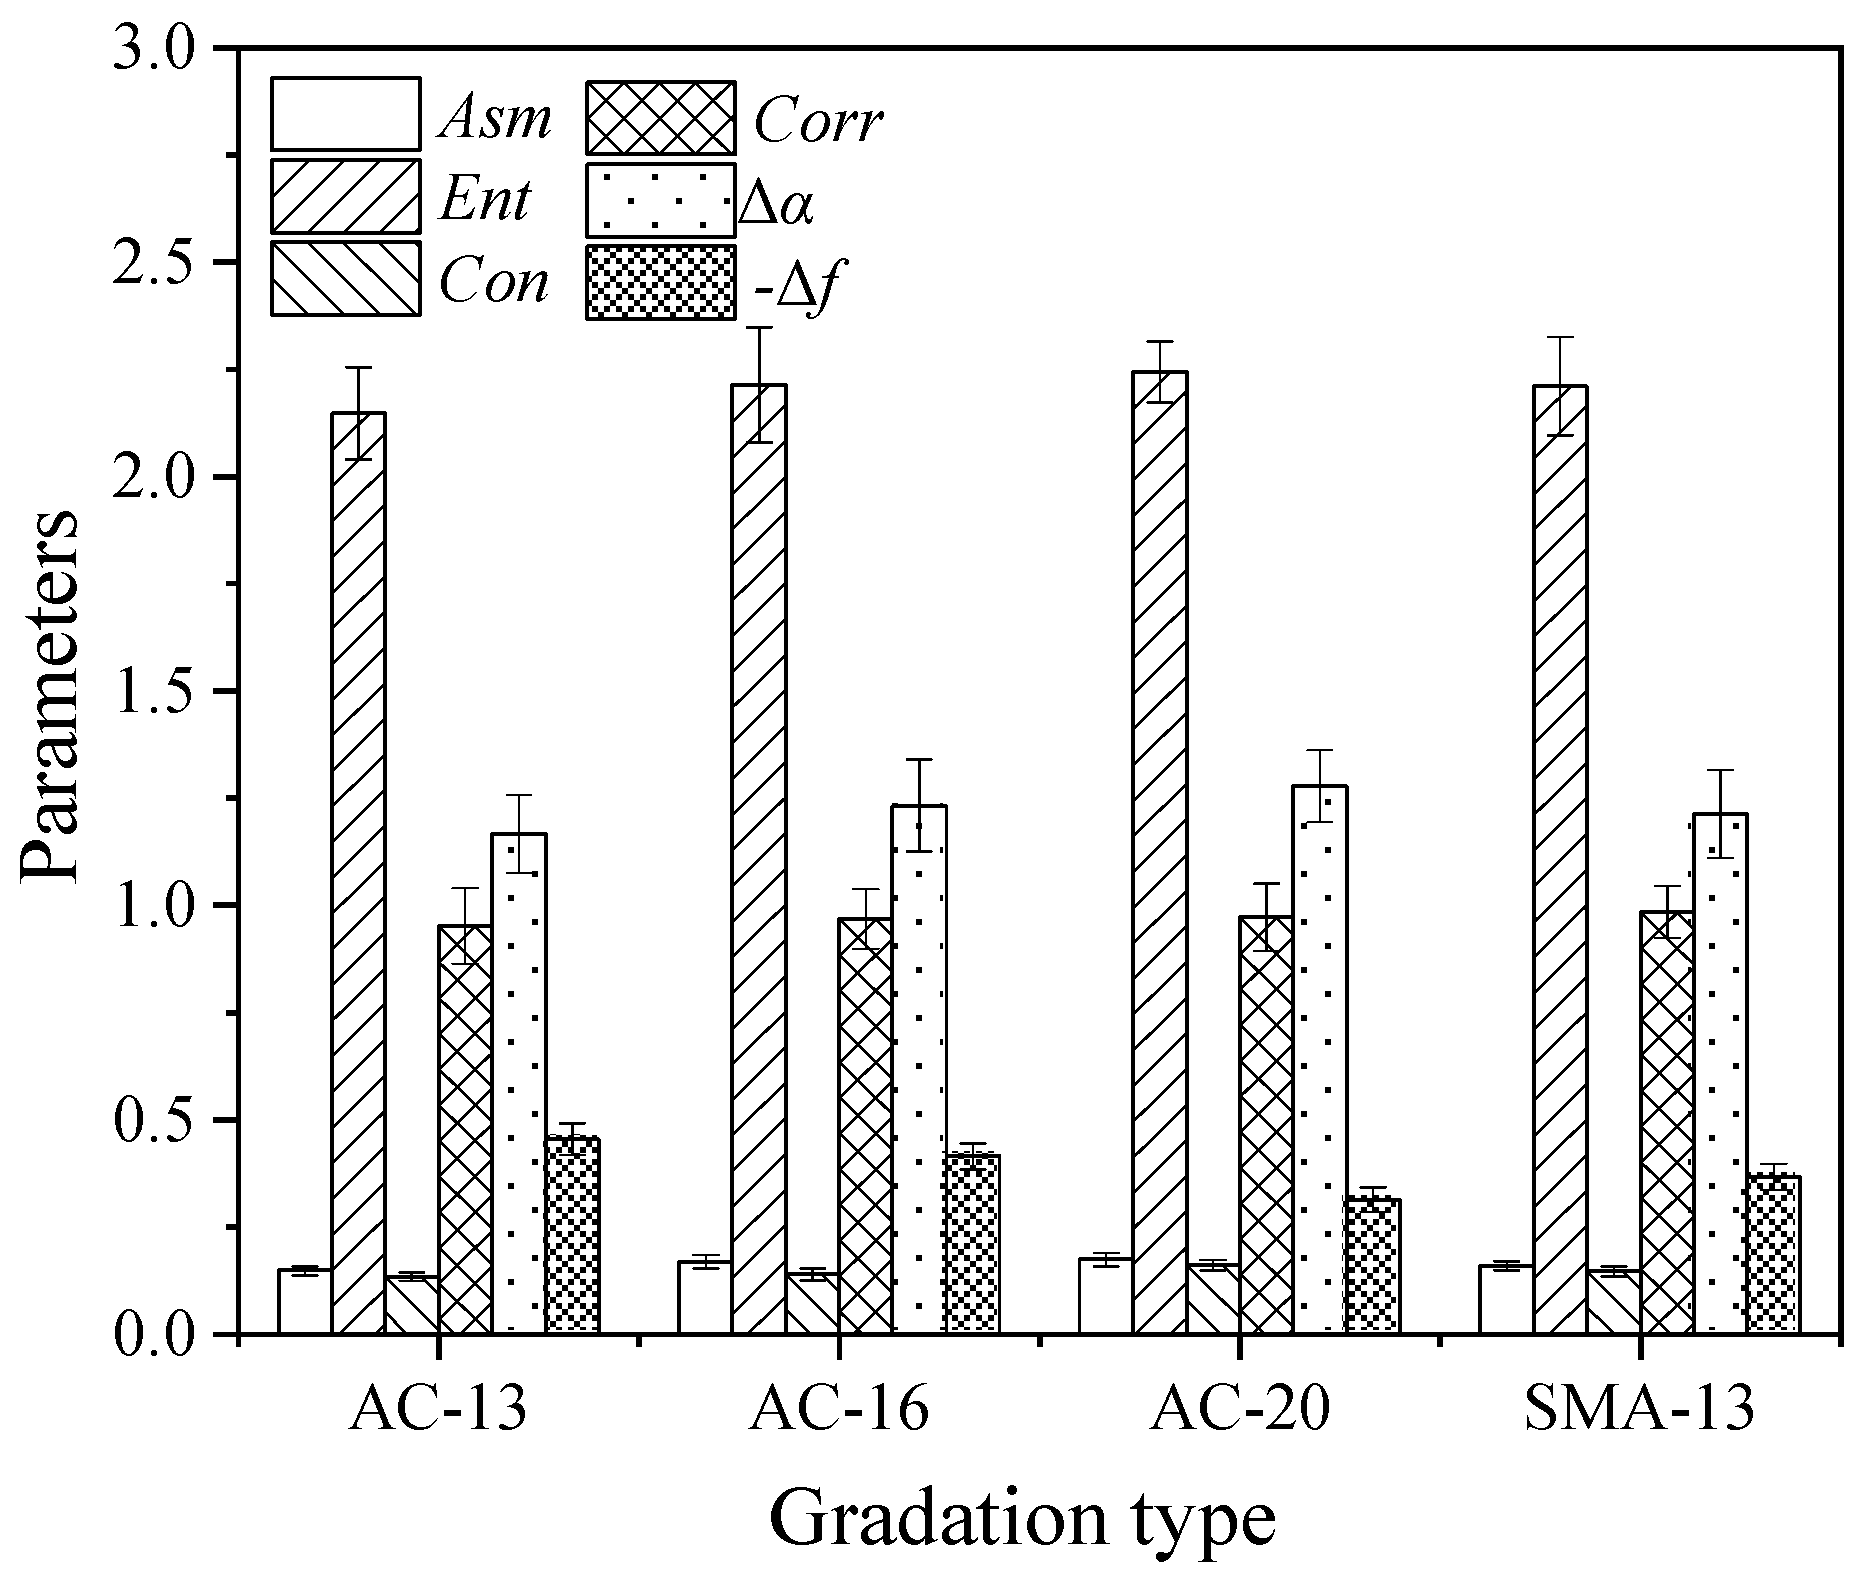
3.1.2. Texture Properties of Asphalt Pavement with Various Gradation Types

In addition to the degree of segregation, the gradation type is also an important factor affecting the textural properties of asphalt pavements. Rutting specimens with four different gradations of AC-13, AC-16, AC-20, and SMA-13 were prepared. Energy, entropy, inertial moment, correlation, multifractal spectrum width, and spectral difference parameters were calculated. The results are shown in Figure 8.
As shown in Figure 8, for AC dense asphalt mixture, the parameter values of texture energy, entropy, inertial moment, and multifractal spectrum width Δα of asphalt mixture with larger nominal maximum particle size were higher than those of asphalt mixture with smaller nominal maximum particle size. Specifically, the order of the texture parameters in the numerical values is AC-13 < AC-16 < AC-20. This is mainly because the texture features presented in the surface image are clearer, and it is easier to extract relevant information when the nominal maximum particle size of the asphalt mixture is larger and the coarse aggregate content is higher. Nevertheless, compared with other parameters, the values of the multifractal spectrum difference Δf showed the opposite regulation, which is illustrated as AC-13 > AC-16 > AC-20. This is related to the definition of Δf. This represents the proportion of the maximum and minimum probability units in the texture image. For the correlation parameter, there was no significant change with an increase in the nominal maximum particle size, and the variation ranges of several AC dense asphalt mixtures were less than 2%, which was basically the same as the variation in specimens with different segregation degrees. In practical engineering, under the condition of the same gradation type, the larger the nominal maximum particle size is, the more prone it is to gradation segregation of the asphalt mixture [36], and the texture characteristics of the pavement surface are more significant.
For the same nominal maximum particle size, the texture parameters of energy, entropy, moment of inertia, correlation, and multifractal spectrum width of the SMA-13 asphalt mixture were larger than those of the AC-13 asphalt mixture. This was because the fine aggregate content in the AC-13 asphalt mixture was relatively higher, whereas the coarse aggregate content in the SMA-13 asphalt mixture was higher than that in AC-13, and the coarse and fine aggregates formed a discontinuous gradation [37,38]. In practical engineering, the degree of aggregate segregation of the AC mixture is smaller than that of the SMA mixture. Consequently, the texture characteristics of SMA-13 asphalt mixture are more evident. Furthermore, the variation range of the texture parameters of the AC-13 asphalt mixture is smaller than those of the SMA-13 and other AC dense asphalt mixtures with larger nominal maximum particle sizes. Indeed, the difference in skidding resistance between asphalt mixtures with different nominal maximum particle sizes of the same gradation is more significant than that between asphalt mixtures with different gradation types with the same nominal maximum particle size.

3.2. Evaluation of Skidding Resistance of Asphalt Pavement Based on Texture Properties

3.2.1. Correlation Analysis between Texture Parameters and Anti-Skidding Performance

Based on the gray-level co-occurrence matrix and multi-fractal theory, the texture parameters of the plate specimens of the AC-20 asphalt mixture with five segregation degrees and four gradation types of AC-13, AC-16, AC-20, and SMA-13 were calculated. The TD of the corresponding rutting specimens was measured using the sand patch method. The texture parameters used in the correlation analysis are the mean values of four parallel samples. The correlation between the texture parameters and TD of various asphalt mixtures are shown in Figure 9.
It can be observed from Figure 9 that parameters such as the energy, entropy, and multifractal spectrum width of asphalt mixtures with different segregation degrees and gradation types had a good linear correlation with the texture depth, and the correlation coefficients of R2 were all above 0.83. Apparently, the texture properties such as uniformity, roughness, complexity, and three-dimensional morphology significantly affected the skidding resistance of asphalt pavements. Based on the analysis results of the gray-level co-occurrence matrix, the fitting effect of the texture parameters of energy and entropy was better and showed a positive correlation trend. This indicates that the texture depth of the asphalt pavement was smaller when the element values in the pavement image were similar. Virtually, the corresponding anti-skidding performance of the asphalt pavements was worse. For the parameters of inertial moment and correlation, the linear fitting effect with the texture depth was poor, which was mainly caused by the properties of the asphalt pavement itself. The color of the asphalt pavement was relatively single, and the difference in the gray values in various regions in the pavement image was small. The degree of segregation and gradation type had little impact on the inertial moment and correlation, resulting in a low linear correlation among the inertial moment, correlation, and texture depth.
After the image analysis based on the multifractal theory, the linear correlation between the multifractal spectrum width Δα and texture depth was close to 0.90. The multifractal spectrum width effectively reflects the difference between the maximum and minimum probabilities of three-dimensional topography height. With the rise of segregation degree and nominal maximum particle size, the texture depth of asphalt pavement increased, and the spectrum width Δα of pavement texture morphology also increased, which was consistent with the actual situation. However, the linear fitting effect of multifractal spectrum difference Δf and the texture depth were poor. The Δf reflects the relative proportion of the number of different undulating regions such as the highest and lowest points in the surface topography. The influence mechanism of ‘convex peak’ and ‘concave valley’ on the texture depth of pavement surface is still unclear [39]. Consequently, the spectrum difference of three-dimensional pavement topography and texture depth lacks a good correlation.

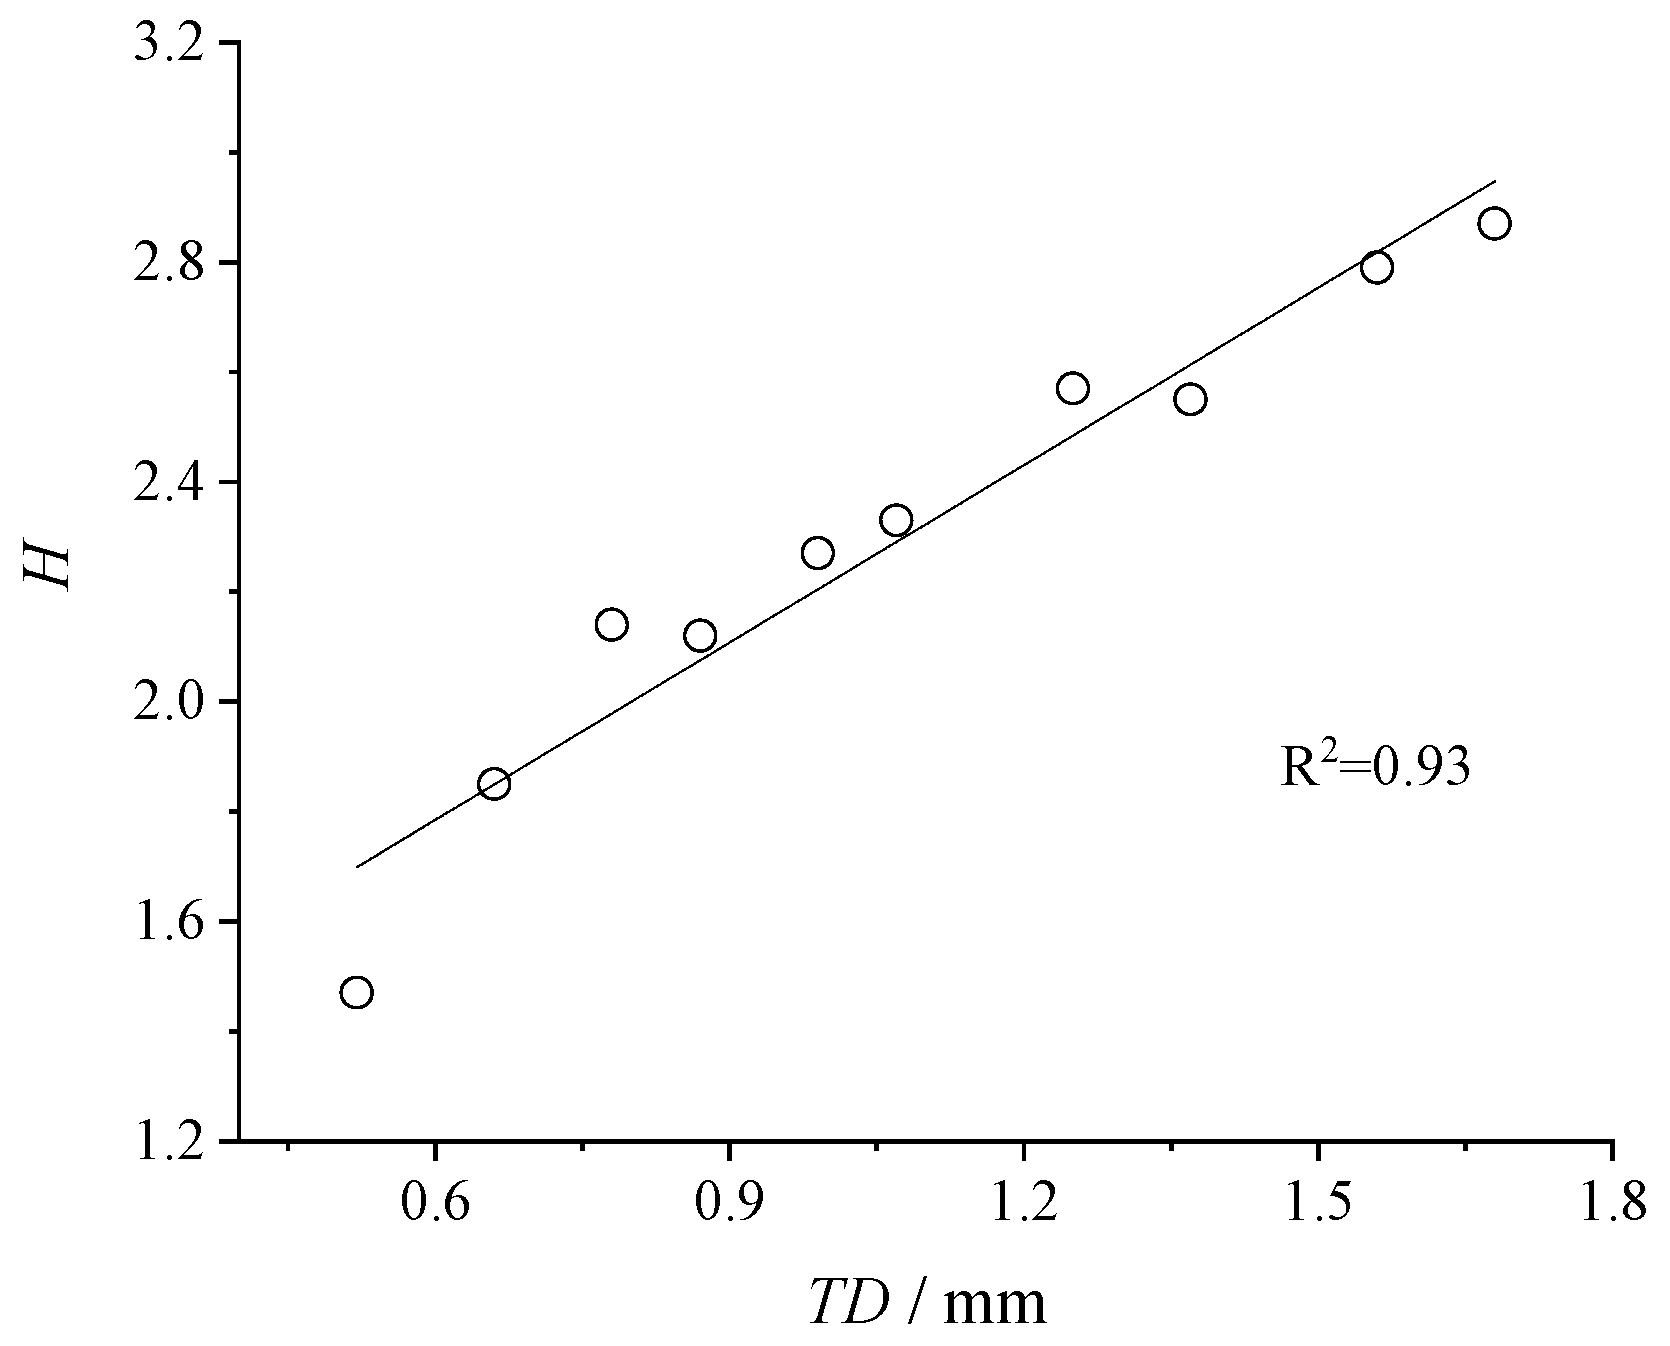
3.2.2. Evaluation Index of Anti-Skidding Performance of Asphalt Pavement

In previous studies, the evaluation index of the skidding resistance of asphalt pavements has mostly adopted a single parameter of the texture properties. However, a single parameter of the evaluation index for skidding resistance has limitations [14,40]. For example, the analysis based on the gray-level co-occurrence matrix merely reflects the two-dimensional texture information of the pavement image, that is, the projection of the texture morphology on the horizontal plane. The projections of different 3D texture morphologies onto the horizontal plane may be the same. Evidently, the evaluation of skidding resistance for asphalt pavements relies only on a single texture parameter, such as energy, and entropy is not comprehensive. In addition, although the linear fitting effect of the multifractal spectrum width and structural depth is good, it is affected by factors such as imaging conditions and processing effects. Indeed, the evaluation of the skidding resistance of asphalt pavement only using multifractal spectrum width Δα is easy to produce large errors.
Therefore, considering that the energy, entropy, and multifractal spectrum width had good linear correlation with the texture depth, the comprehensive evaluation index of skidding resistance of asphalt pavement based on texture parameters of energy, entropy, and multifractal spectrum width ∆α was recommended to detect and evaluate the anti-skidding performance more reasonably. Specifically, according to the data of texture parameters of asphalt mixture with different segregation degrees and gradation types, the calculation formula of comprehensive evaluation index of anti-skidding performance based on energy, entropy, and multifractal spectrum width Δα was recommended as Formula (16).
H = c 1 A s m + c 2 E n t + c 3 Δ α
where H is the comprehensive evaluation index of anti-skidding performance; Asm is energy; Ent is entropy; ∆α is multifractal spectrum width; c1, c2, and c3 are the weight coefficients of texture parameters Asm, Ent, and ∆α, respectively. These three aspects are considered equally important, and the weight coefficient is generally 1/3.
To verify the feasibility and reliability of the comprehensive evaluation index of skidding resistance based on laboratory test results, 10 points were randomly selected in areas with different degrees of segregation on Xiaguang Avenue and Fuxing Avenue of Fuyang City, and texture images of the pavement surface were acquired and processed. Then, the evaluation index H was calculated by MATLAB, and the texture depth TD of the corresponding area was measured using the sand patch method. The correlation between the comprehensive evaluation index H and the texture depth TD of the asphalt pavement is shown in Figure 10.
The field test results in Figure 10 show that the comprehensive evaluation index H for the skidding resistance of asphalt pavement based on texture parameters of energy, entropy, and multi-fractal spectrum width Δα had a good linear correlation with texture depth, and the correlation coefficient of R2 reached above 0.93, which was higher than that between the single texture parameter with texture depth. Evidently, the comprehensive evaluation index H for skidding resistance can better characterize the texture depth of asphalt pavements in practice. In comparison to the traditional test method for skidding resistance of asphalt pavement, the calculation of the H index enables automated processing, significantly enhancing evaluation efficiency and reducing human errors. Therefore, the comprehensive evaluation index H can replace the texture depth in evaluating the skidding resistance of asphalt pavements.

3.3. Attenuation Characteristics of Anti-Skidding Performance of Asphalt Pavement

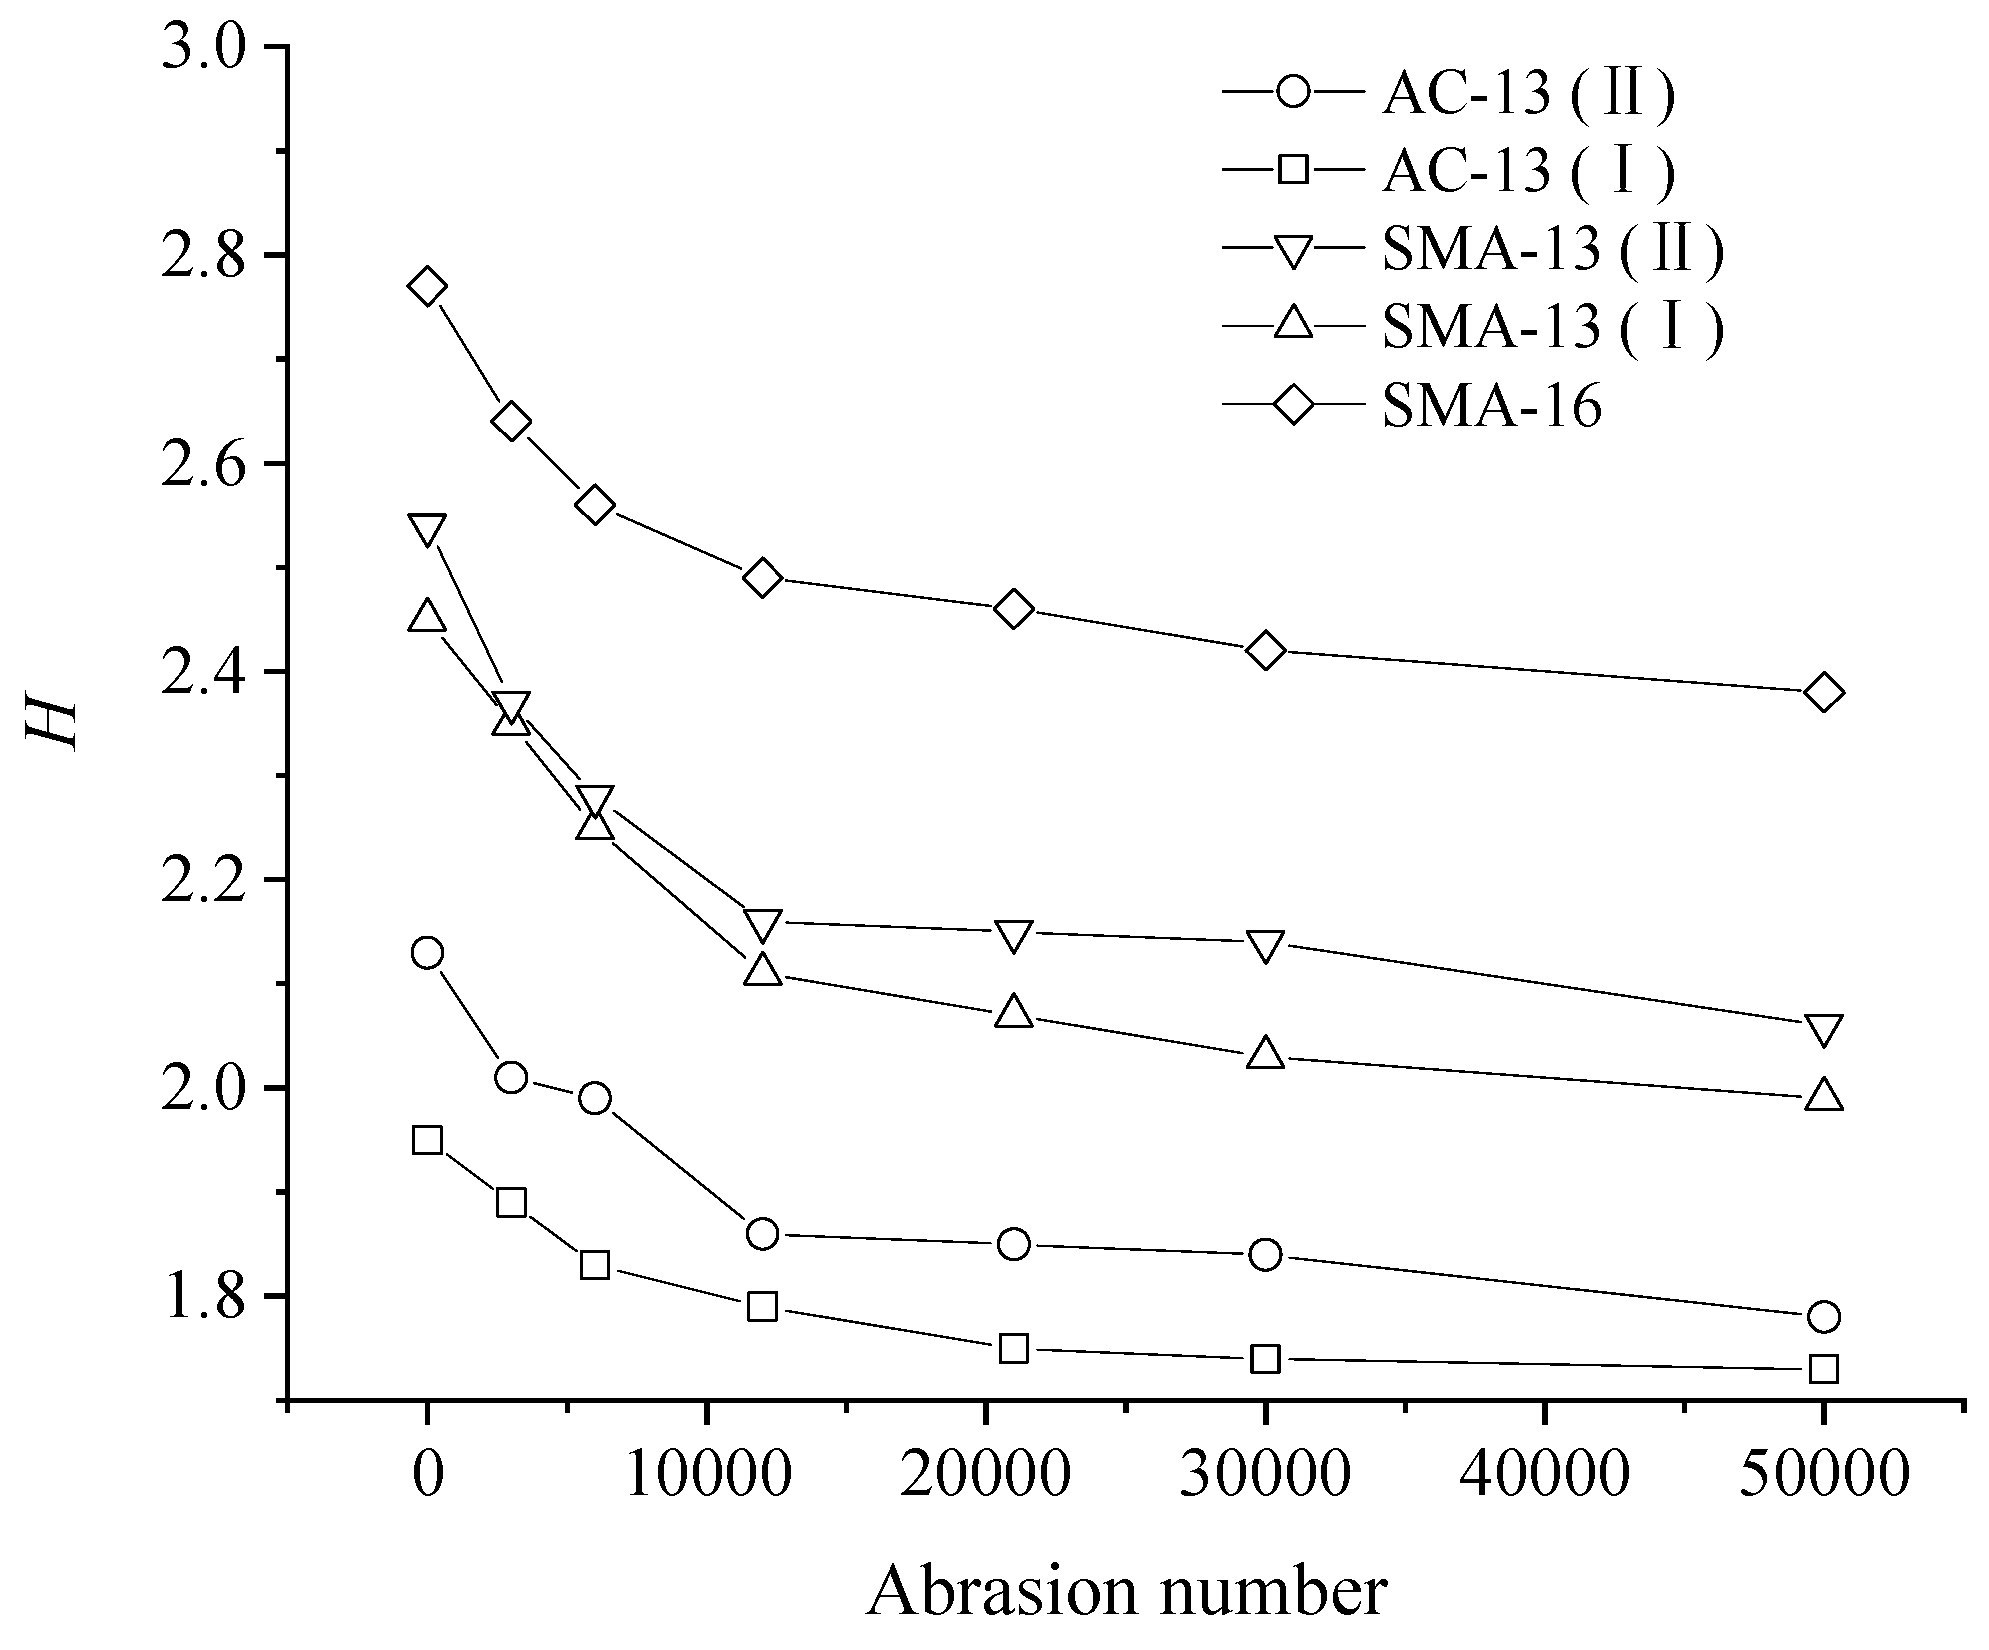
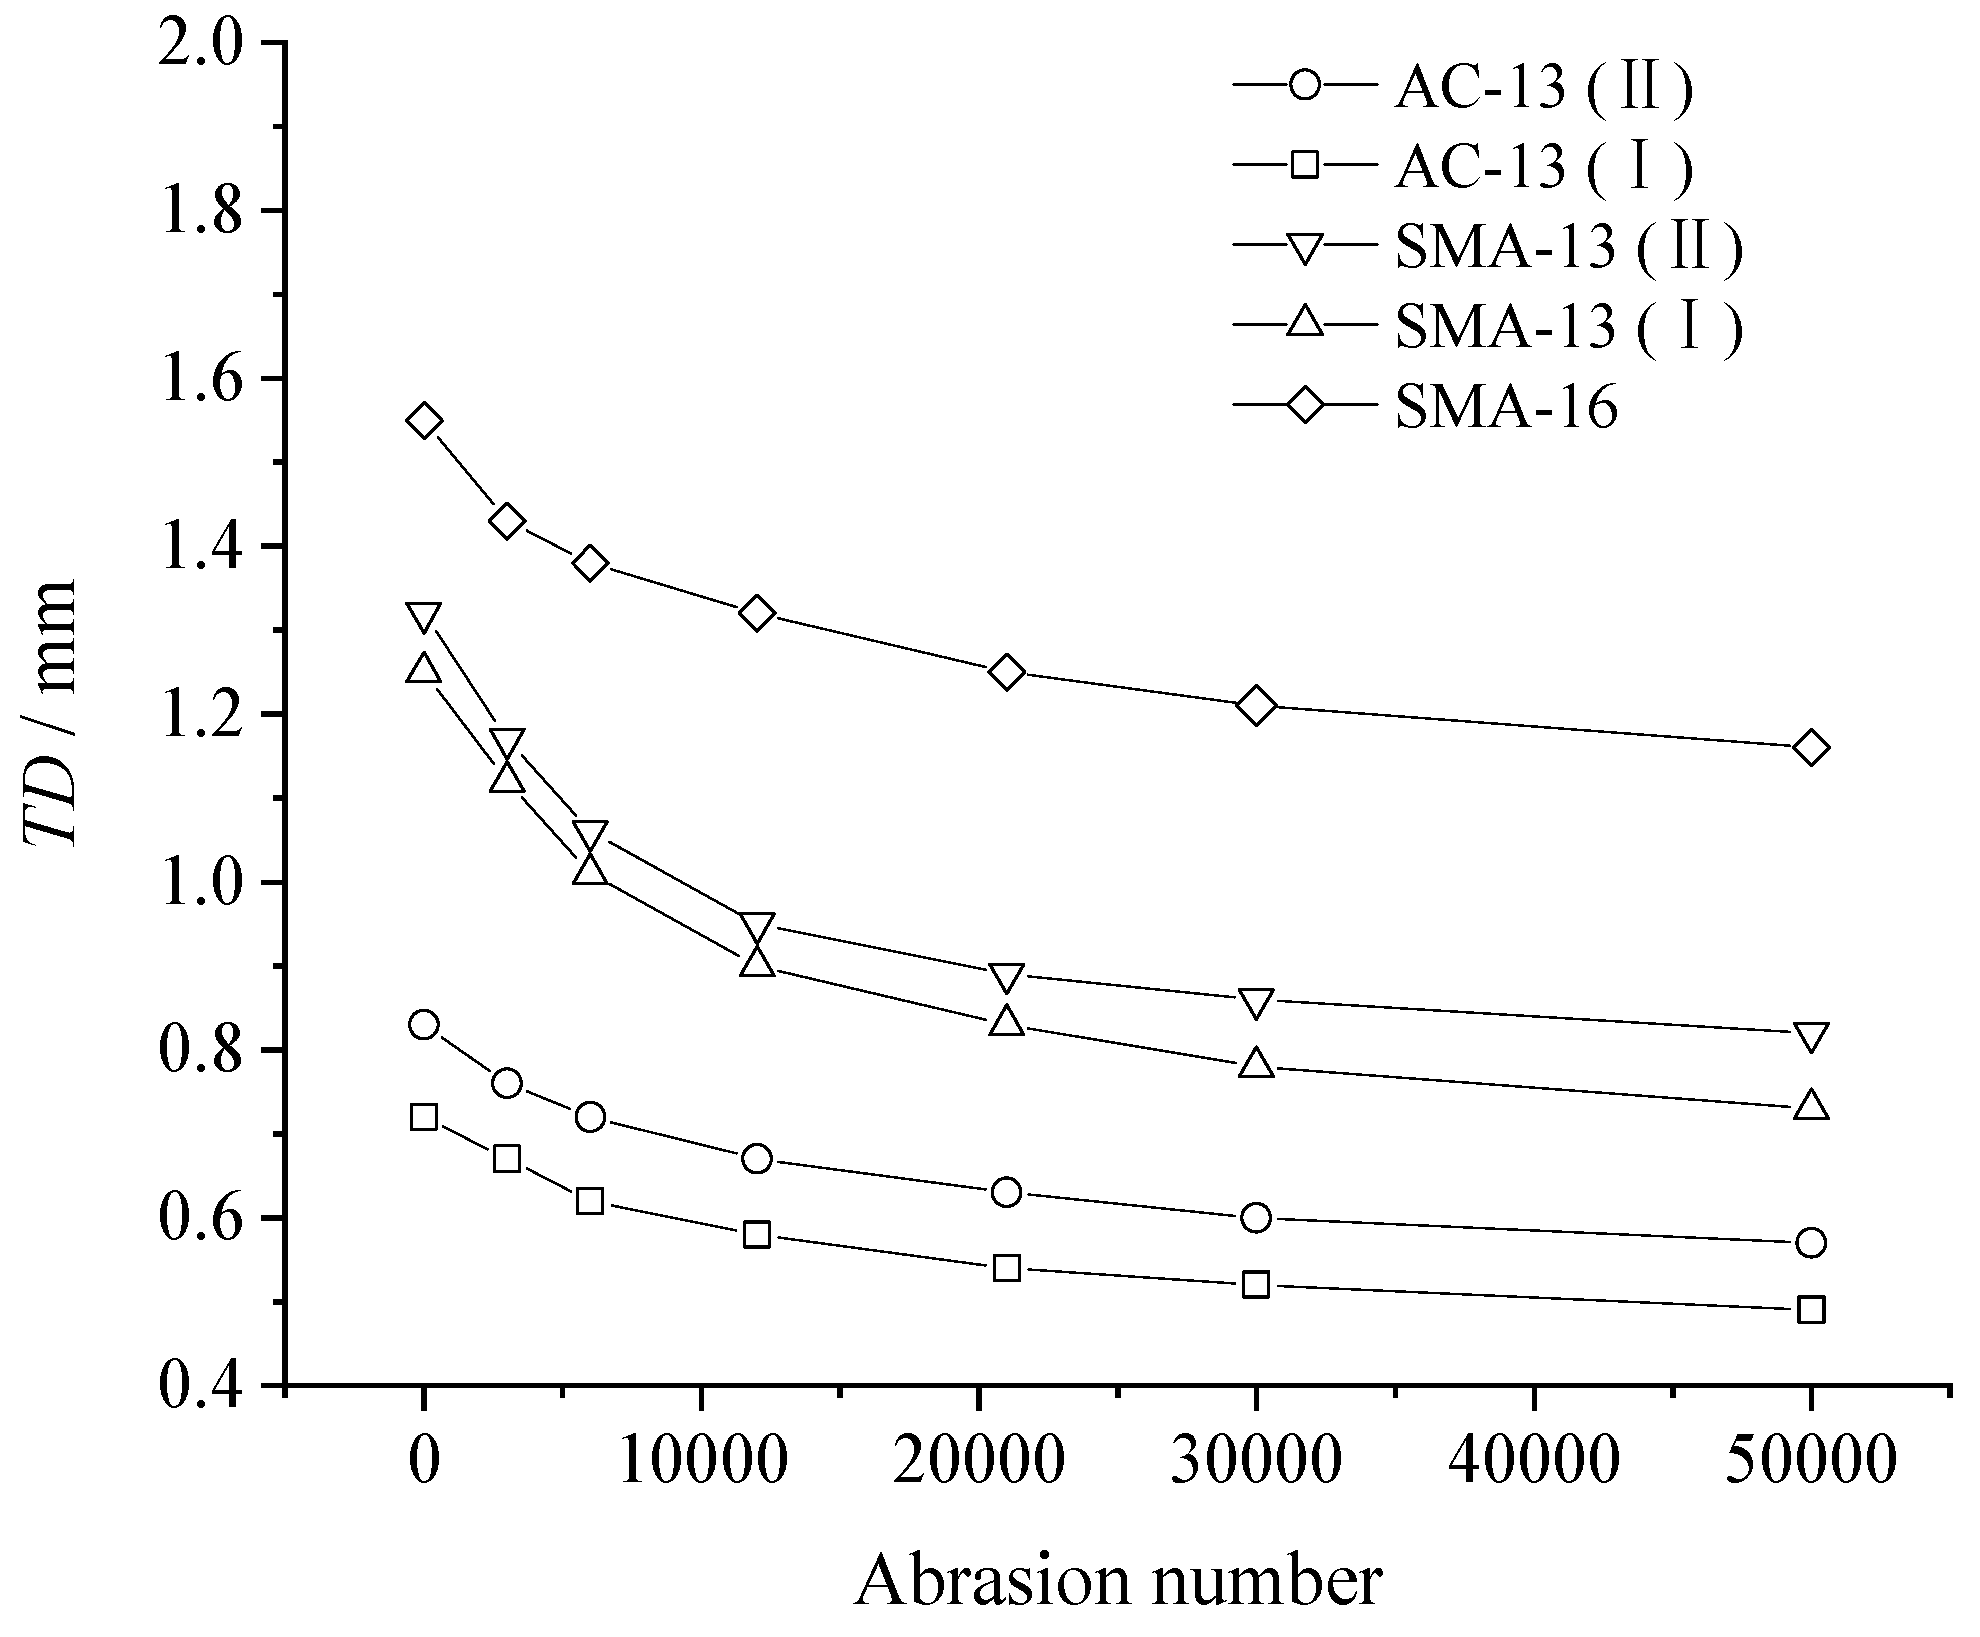
3.3.1. Attenuation Characteristics of Skidding Resistance for Asphalt Pavement

The rutting specimens of asphalt mixture with five gradation types of AC-13 (Ⅰ), AC-13 (Ⅱ), SMA-13 (Ⅰ), SMA-13 (Ⅱ), and SMA-16 were formed. A pavement accelerated abrasion tester was selected to accelerate the abrasion of the rutting specimens by 0, 3000, 6000, 12,000, 21,000, 30,000, and 50,000 times. The texture depth of the rutting specimens after the specified abrasion number was measured, and the corresponding images were acquired to calculate the comprehensive evaluation index H. The variation in the comprehensive evaluation index H and texture depth with the abrasion number is shown in Figure 11 and Figure 12.
As shown in Figure 11 and Figure 12, with an increase in the abrasion number, the changing trend of the comprehensive evaluation index H was consistent with the traditional index of texture depth TD, which further confirms that the comprehensive evaluation index H can be selected to analyze the attenuation characteristics of the skidding resistance of asphalt pavements. Among these, the evaluation index of H and the texture depth of the asphalt mixture with five gradation types all gradually declined as the accelerated abrasion number increased, and the anti-skidding attenuation trend showed apparent regularity. Indeed, the attenuation characteristics of the skidding resistance of the asphalt mixture could be divided into three stages with the increase of accelerated abrasion number, the rapid decline, transition, and relatively stable stages. Specifically, the accelerated abrasion number of 0–12,000 times belonged to the rapid decline stage, the abrasion number of 12,000–30,000 times corresponded to the transition stage, and the abrasion number of more than 30,000 times belonged to the relatively stable stage. This is mainly because the aggregate on the surface of the rutting plate was wrapped by asphalt mortar, which was significantly worn in the early stages of accelerated abrasion, and the skidding resistance index decreased rapidly. Aggregates gradually appeared when the asphalt mortar was worn off. At this time, the skidding resistance of the asphalt pavement was mainly borne by the aggregates, and the decay process was relatively gentle.
Simultaneously, the gradation type has a significant influence on the anti-skidding durability of asphalt mixtures. For the same nominal maximum particle size, the values of comprehensive evaluation index H and texture depth of the SMA asphalt mixture are significantly higher than those of the AC dense asphalt mixture at different stages. There is no significant difference in skidding resistance durability between SMA-13 (Ⅰ) and SMA-13 (Ⅱ) asphalt mixture with the same gradation type. The difference between AC-13 (Ⅰ) and AC-13 (Ⅱ) asphalt mixtures is more evident than SMA-13 (Ⅰ) and SMA-13 (Ⅱ). SMA utilizes a discontinuously graded coarse aggregate skeleton, with coarse aggregate content exceeding 70%. These coarse aggregates are tightly embedded together by the asphalt mastic, which consists of asphalt, mineral powder, and fiber stabilizer, forming a stable skeleton structure. This unique structure results in a higher internal friction angle of aggregates in the SMA mixture and a surface texture depth [23], ultimately enhancing pavement skidding resistance. On the other hand, AC employs continuously graded aggregates with lower coarse aggregate content and smaller surface texture depth, which somewhat restricts the enhancement of skidding resistance [41]. Consequently, the SMA asphalt mixture demonstrates superior skidding resistance durability compared to the AC asphalt mixture. Moreover, the skidding resistance durability of AC-13 (Ⅱ) mixture is better than that of AC-13 (Ⅰ). This is mainly attributed to the higher content of coarse aggregate in the AC-13 (Ⅱ) mixture compared to AC-13 (Ⅰ), resulting in lower asphalt content and a higher void ratio in the AC-13 (Ⅱ) mixture, as illustrated in Table 2. Consequently, this leads to a rougher surface texture, enhancing skidding resistance durability.
In addition, even when the aggregate gradation type is the same, there are certain differences in the anti-skidding durability of asphalt mixtures with different nominal maximum particle sizes. After accelerated abrasion, the skidding resistance of the SMA asphalt mixture with a larger nominal maximum particle size is better than that of the asphalt mixture with a smaller nominal maximum particle size. This may be because the larger nominal maximum particle size and higher coarse aggregate content are beneficial for the structural stability of the asphalt mixture [42], thereby improving the durability of the skidding resistance of the asphalt mixture.

3.3.2. Attenuation Fitting Model of Skidding Resistance for Asphalt Mixture

The process of anti-skidding attenuation of asphalt mixtures reflects the variation in skidding resistance during the service of asphalt pavements [22]. Based on the accelerated abrasion test results, the initial values of the comprehensive evaluation index and texture depth are significantly influenced by the gradation type of asphalt mixture. These values will attenuate under repeated abrasion from wheel loads. In the later stages of attenuation, although there may be small fluctuations within a limited range, it basically tends to the equilibrium stable state and reaches the final attenuation value. The attenuation amplitude reflects the difference between the initial attenuation value and the stable attenuation value. The relative percentage gradient of attenuation reflects the speed of the skidding attenuation curve from the initial value to the stable value. During the attenuation of skidding resistance, various types of asphalt mixtures have different attenuation amplitudes and attenuation rates. The above characteristics of skid properties can be fitted by mathematical model, especially the Asymptotic model, as shown in Equation (17). Relevant studies have also confirmed that the Asymptotic model is a suitable model to fit the relationship between pavement skidding resistance and abrasion number [43,44].
Y = a e b N + c
where Y is the evaluation index of skidding resistance, a is the attenuation amplitude, b is the relative percentage gradient of attenuation, c is the final stable value of attenuation, and N is the number of accelerated abrasions.
When the value of parameter a is high, it indicates a significant decrease in skidding resistance. In other words, the pavement initially exhibits good anti-skid performance, but as time passes or the number of loadings increases, the anti-skid performance deteriorates to a poor state. A high value of parameter b results in a faster decay rate, leading to a rapid decrease in anti-skid performance with an increase in loading cycles. This suggests that the pavement loses a substantial amount of skidding resistance within a relatively short period. On the other hand, a high value of parameter c means that, despite the attenuation in anti-skid performance, it can still be maintained at a satisfactory level.
By importing the data of the comprehensive evaluation index H and texture depth TD for asphalt mixtures with different gradation types into MATLAB software, the parameter values of a, b, and c in the formula can be fitted. The concrete fitting process is as follows: First, the accelerated abrasion number was defined as x, and the corresponding comprehensive evaluation index H or texture depth TD after the accelerated abrasion test was defined as y. The data were then imported into the cftool toolbox and fitted to the exponential equation. The values of the parameters a, b, and c in the formula are listed in Table 3.
As shown in Table 3, the attenuation model of the evaluation indexes of anti-skidding performance of the asphalt mixture and accelerated abrasion number based on the asymptotic mathematical model has good reliability, and the correlation coefficients of asphalt mixtures of different types are all above 0.91. Furthermore, the difference in the attenuation amplitude and attenuation rate among asphalt mixtures with various gradation types is evident. Because the decay amplitude and final decay value in the test are introduced into the fitting relationship to calculate the parameters of the asymptotic model, the established model is not only consistent with the laboratory test but also conforms to the actual skidding resistance attenuation of the asphalt mixture. The attenuation fitting model can effectively predict the attenuation characteristics of the skidding resistance of asphalt pavement in the service process.

4. Conclusions

The degree of segregation had a significant influence on the texture parameters of asphalt mixture. With an increase in the segregation degree of coarse aggregate, the parameters of energy, entropy, and multifractal spectrum width gradually increased, whereas the inertial moment gradually decreased. The variation range of the multifractal spectrum difference initially increased and subsequently decreased. The changing trends of the correlation parameter were not evident. For the asphalt mixture with fine aggregate segregation, several parameters all decreased to varying degrees.
For the texture parameters such as energy, entropy, inertial moment, and multifractal spectrum width Δα, the values of the asphalt mixture with larger nominal maximum particle were higher than those of the mixture with smaller nominal maximum particle size, whereas the multifractal spectrum difference value showed the opposite law with the increase of nominal maximum particle size. Under the condition of the same nominal maximum particle, except for multifractal spectrum difference Δf, the texture parameters of SMA asphalt mixture were larger than those of AC dense asphalt mixture.
The energy and entropy of the texture parameters based on the gray-level co-occurrence matrix had good linear correlation with the texture depth of the asphalt mixture with different segregation degrees and gradation types, and the correlation coefficients were all above 0.85. However, for the inertial moment and correlation parameters, the linear fitting effect with texture depth was relatively poor. Combined with the characteristics of the pavement images, energy and entropy are recommended as the evaluation parameters for the skidding resistance of asphalt pavement.
The surface morphology of the asphalt pavements exhibited good multifractal characteristics. The correlation coefficient between the texture depth and the multifractal spectrum width Δα was close to 0.90, while the correlation between the texture depth and the spectrum difference Δf was poor. The parameter spectrum width Δα based on multifractal theory reflects three-dimensional characteristics of asphalt pavement from the degree of fluctuation. It is also recommended to adopt the multifractal spectrum width Δα as the evaluation parameter of skidding resistance for asphalt pavement.
To detect and evaluate the skidding resistance of asphalt pavement more reasonably, based on the texture parameters of energy, entropy, and multifractal spectrum width Δα, the comprehensive evaluation index of anti-skidding performance for asphalt pavement is recommended as H = 1 3 A s m + 1 3 E n t + 1 3 Δ α , which has a good linear correlation with texture depth. The established model of anti-skidding evaluation index and accelerated abrasion number have good reliability and can effectively predict the attenuation characteristics of the skidding resistance of asphalt pavement.
In the future, the skidding resistance of the asphalt pavement, after being in use for a period of time, will be evaluated based on the coating ratio/percentage of aggregate particles with bitumen [45]. Meanwhile, the attenuation fitting model of skidding resistance for asphalt mixture will be adjusted to account for factors like climatic conditions and wheel load on asphalt pavement.

Author Contributions

Conceptualization, K.Z. and W.Z.; methodology, K.Z.; software, Y.Z.; validation, D.X., Y.Z. and W.X.; formal analysis, D.X.; investigation, Y.Z.; resources, K.Z.; data curation, J.G.; writing—original draft preparation, D.X.; writing—review and editing, K.Z.; visualization, J.G.; supervision, W.Z.; project administration, W.X.; funding acquisition, K.Z. All authors have read and agreed to the published version of the manuscript.

Funding

The study is supported by Key project of Natural Science Research of Anhui Provincial Department of Education (2023AH052853, 2022AH052823), National Natural Science Foundation of China (52278426, 51878061), Quality Engineering Project of Colleges and Universities in Anhui Province (2023jyxm1024, 2022kcsz218), Provincial Natural Science Foundation of Anhui (1908085QE217), Key Project of Excellent Youth Talent Program in Anhui Universities (gxyqZD2022101), Industrial Chain Research and Innovation Team of Fuyang Normal University (CYLTD202211), and Research Projects Funded by Enterprises (HX2022067000, HX2022084000, HX2023015000). The authors gratefully acknowledge their financial support.

Institutional Review Board Statement

Not applicable.

Informed Consent Statement

Not applicable.

Data Availability Statement

The data presented in this study are available on request from the corresponding author.

Conflicts of Interest

Author Jiantao Gao was employed by the company Fuyang Traffic Energy Investment Co., Ltd. The remaining authors declare that the research was conducted in the absence of any commercial or financial relationships that could be construed as a potential conflict of interest.

References

  1. Pranjić, I.; Deluka-Tibljaš, A. Pavement Texture–Friction relationship establishment via image analysis methods. Materials 2022, 15, 846. [Google Scholar] [CrossRef]
  2. Dell’Annunziata, G.N.; Adiletta, G.; Farroni, F.; Sakhnevych, A.; Timpone, F. Tire wear sensitivity analysis and modeling based on a statistical multidisciplinary approach for high-performance vehicles. Lubricants 2023, 11, 269. [Google Scholar] [CrossRef]
  3. Guo, R.; Liu, S.; He, Y.; Xu, L. Study on vehicle-road interaction for autonomous driving. Sustainability 2022, 14, 11693. [Google Scholar] [CrossRef]
  4. Liu, Y.; Qian, Z.; Hu, H.; Shi, X.; Chen, L. Developing a skid resistance prediction model for newly built pavement: Application to a case study of steel bridge deck pavement. Road Mater. Pavement Des. 2022, 23, 2334–2352. [Google Scholar] [CrossRef]
  5. Chen, B.; Xiong, C.; Li, W.; He, J.; Zhang, X. Assessing surface texture features of asphalt pavement based on three-dimensional laser scanning technology. Buildings 2021, 11, 623. [Google Scholar] [CrossRef]
  6. Chen, J.; Yuan, X.; Liu, Q.; Zhao, C.; Zhou, R.; Huang, J. Identifying texture and friction of asphalt pavement surface with optimized close-range photogrammetry method. J. Test. Eval. 2023, 51, 3081–3094. [Google Scholar] [CrossRef]
  7. Zelelew, H.; Khasawneh, M.; Abbas, A. Wavelet-based characterization of asphalt pavement surface macro-texture. Road Mater. Pavement Des. 2014, 15, 622–641. [Google Scholar] [CrossRef]
  8. Miller, T.; Swiertz, D.; Tashman, L.; Tabatabaee, N.; Bahia, U. Characterization of asphalt pavement surface texture. Transp. Res. Rec. 2012, 2295, 19–26. [Google Scholar] [CrossRef]
  9. Dan, H.; Gao, L.; Wang, H.; Tang, J. Discrete-element modeling of mean texture depth and wearing behavior of asphalt mixture. J. Mater. Civ. Eng. 2022, 34, 04022027. [Google Scholar] [CrossRef]
  10. Hu, Y.; Sun, Z.; Han, Y.; Hao, X.; Pei, L. Pavement skidding resistance evaluation based on hyperopt-NGBoost fusion model using non-contact measurement of 3D macrotexture data. Arab. J. Sci. Eng. 2023, 48, 5507–5524. [Google Scholar] [CrossRef]
  11. Hoang, N.D.; Tran, V.; Tran, X.L. Image processing-based classification of pavement fatigue severity using extremely randomized trees, deep neural network, and convolutional neural network. Int. J. Pavement Eng. 2023, 24, 2201902. [Google Scholar] [CrossRef]
  12. Lu, J.; Pan, B.; Ren, W.; Liu, Q.; Liu, P.; Oeser, M. Regeneration of pavement surface textures using M-sigmoid-normalized generative adversarial networks. Comput. Aided Civ. Infrastruct. Eng. 2023, 38, 2225–2241. [Google Scholar] [CrossRef]
  13. He, J.; Shao, L.; Li, Y.; Wang, K.; Liu, W. Pavement damage identification and evaluation in UAV-captured images using gray level co-occurrence matrix and cloud model. J. King Saud Univ. Comput. Inf. Sci. 2023, 35, 101762. [Google Scholar] [CrossRef]
  14. Hu, Y.; Sun, Z.; Han, Y.; Li, W.; Pei, L. Evaluate pavement skidding resistance performance based on bayesian-Light GBM using 3D surface macrotexture data. Materials 2022, 15, 5275. [Google Scholar] [CrossRef] [PubMed]
  15. Roy, N.; Kuna, K.K. Image texture analysis to evaluate the microtexture of coarse aggregates for pavement surface courses. Int. J. Pavement Eng. 2023, 24, 2099854. [Google Scholar] [CrossRef]
  16. Sun, P.; Zhang, K.; Sen, H.; Xiao, Y. Aggregate geometrical features and their influence on the surface properties of asphalt pavement. Materials 2022, 15, 3222. [Google Scholar] [CrossRef]
  17. Zhang, K.; Sun, P.; Li, L.; Zhao, Y.; Zhao, Y.; Zhang, Z. A novel evaluation method of aggregate distribution homogeneity for asphalt pavement based on the characteristics of texture structure. Constr. Build. Mater. 2021, 306, 124927. [Google Scholar] [CrossRef]
  18. Liang, J.; Gu, X.; YChen, Z.; Ni, F.; Zhang, T. A novel pavement mean texture depth evaluation strategy based on three-dimensional pavement data filtered by a new filtering approach. Measurement 2020, 166, 108265. [Google Scholar] [CrossRef]
  19. Dan, H.; Lu, B.; Li, M. Evaluation of asphalt pavement texture using multiview stereo reconstruction based on deep learning. Constr. Build. Mater. 2024, 412, 134837. [Google Scholar] [CrossRef]
  20. Wang, Y.; Liu, Y.; Cheng, Y.; Xue, J. Evaluation of the decay characteristics of pavement skidding resistance using three-dimensional texture from accelerated abrasion test. J. Transp. Eng. Part B Pavements 2020, 146, 04020073. [Google Scholar] [CrossRef]
  21. Salehi, M.; Noordermeer, J.W.M.; Reuvekamp, L.A.E.M.; Blume, A. Characterization of counter-surface substrates for a laboratory abrasion tester (LAT100) compared with asphalt and concrete to predict car tire performance. Lubricants 2022, 10, 8. [Google Scholar] [CrossRef]
  22. Yu, Y.; Tang, S.; Xu, G.; Fan, Y.; Wu, Y.; Wang, H.; Yang, J. Investigations on the long-term skidding resistance of epoxy asphalt mixture based on accelerated loading test. Constr. Build. Mater. 2023, 365, 130150. [Google Scholar] [CrossRef]
  23. Wu, X.; Zheng, N.; Lei, J. Influencing factors and mechanism for the attenuation of the skidding resistance for bauxite clinker-asphalt mixtures. Constr. Build. Mater. 2021, 283, 122670. [Google Scholar] [CrossRef]
  24. Wang, P.; Wei, H.; Liu, X.; Ren, R.; Wang, L. Identifying the long-term thermal storage stability of SBS-polymer-modified asphalt, including physical indexes, rheological properties, and micro-structures characteristics. Sustainability 2021, 13, 10582. [Google Scholar] [CrossRef]
  25. Hu, Y.; Sun, Z.; Pei, L.; Han, Y.; Li, W. Evaluate asphalt pavement frictional characteristics based on IGWO-NGBoost using 3D macro-texture data. Expert Syst. Appl. 2024, 242, 122786. [Google Scholar] [CrossRef]
  26. Zhang, K.; Wei, G.; Xie, W.; Yang, B.; Li, W.; Luo, Y. A novel evaluation method of construction homogeneity for asphalt pavement based on the characteristic of component distribution. Materials 2022, 15, 7284. [Google Scholar] [CrossRef] [PubMed]
  27. JTG F40-2004; Technical Specification for Construction of Highway Asphalt Pavements. Ministry of Transport of the People’s Republic of China: Beijing, China, 2004.
  28. Zhang, K.; Wei, G.; Luo, Y.; Zhao, Y.; Zhao, Y.; Zhang, J. Evaluation of aggregate distribution homogeneity for asphalt pavement based on the fractal characteristic of three-dimensional texture. Int. J. Pavement Res. Technol. 2024, 17, 577–594. [Google Scholar] [CrossRef]
  29. Zhao, X.; Xue, L.; Xu, F. Asphalt pavement paving segregation detection method using more efficiency and quality texture features extract algorithm. Constr. Build. Mater. 2021, 277, 122302. [Google Scholar] [CrossRef]
  30. Sun, L.; Wang, Y. Three-dimensional reconstruction of macrotexture and microtexture morphology of pavement surface using six light sources-based photometric stereo with lowrank approximation. J. Comput. Civ. Eng. 2017, 31, 04016054. [Google Scholar] [CrossRef]
  31. Li, Y.; Qin, Y.; Wang, H.; Xu, S.; Li, S. Study of texture indicators applied to pavement wear analysis based on 3D image technology. Sensors 2022, 22, 4955. [Google Scholar] [CrossRef]
  32. Cong, L.; Shi, J.; Wang, T.; Yang, F.; Zhu, T. A method to evaluate the segregation of compacted asphalt pavement by processing the images of paved asphalt mixture. Constr. Build. Mater. 2019, 224, 622–629. [Google Scholar] [CrossRef]
  33. Ashvin, B.; Chhabra, C.; Meneveau, R.V.; Jensen, K.R. Direct determination of the f(α) singularity spectrum and its application to fully developed turbulence. Phys. Rev. A Gen. Phys. 1989, 40, 5284–5294. [Google Scholar]
  34. Luo, Y.; Zhao, X.; Zhang, K.; Shi, X.; Li, G. Research on skid-resistance durability of high viscosity modified asphalt mixture by accelerated abrasion test. Case Stud. Constr. Mater. 2024, 20, e02878. [Google Scholar]
  35. Zeng, S.; Zhang, C.; Zeng, K.; Liang, N.; Song, S. Real-time identification of asphalt mixture segregation during paving process using digital imaging technique and Four-side static moment. Constr. Build. Mater. 2023, 397, 132436. [Google Scholar] [CrossRef]
  36. Wang, H.; Liu, Y.; Yang, J.; Shi, X.; Xu, X.; Luo, S.; Huang, W. Evaluation of anti-skid performance of asphalt mixture based on accelerated loading test. Appl. Sci. 2023, 13, 4796. [Google Scholar] [CrossRef]
  37. Shi, L.; Wang, D.; Jin, C.; Li, B.; Liang, H. Measurement of coarse aggregates movement characteristics within asphalt mixture using digital image processing methods. Measurement 2020, 163, 107948. [Google Scholar] [CrossRef]
  38. Zhu, S.; Ji, X.; Zhang, Z.; Shao, D.; Li, H.; Yun, C. Evolution characteristics of the surface texture of the wearing course on asphalt pavement based on accelerated pavement polishing. Constr. Build. Mater. 2022, 333, 127266. [Google Scholar] [CrossRef]
  39. Ran, M.; Xiao, S.; Zhou, X.; Xiao, W. Evaluation of segregation in asphalt pavement surface using concave multifractal distribution. J. Test. Eval. 2018, 46, 2100–2109. [Google Scholar] [CrossRef]
  40. Dong, S.; Han, S.; Zhang, Q.; Han, X.; Zhang, Z.; Yao, T. Three-dimensional evaluation method for asphalt pavement texture characteristics. Constr. Build. Mater. 2021, 287, 122966. [Google Scholar] [CrossRef]
  41. Zhu, S.; Ji, X.; Yuan, H.; Li, H.; Xu, X. Long-term skid resistance and prediction model of asphalt pavement by accelerated pavement testing. Constr. Build. Mater. 2023, 375, 131004. [Google Scholar] [CrossRef]
  42. Wang, H.; Wang, C.; Bu, Y.; You, Z.; Yang, X.; Oeser, M. Correlate aggregate angularity characteristics to the skid resistance of asphalt pavement based on image analysis technology. Constr. Build. Mater. 2020, 242, 118150. [Google Scholar] [CrossRef]
  43. Yi, Y.; Jiang, Y.; Tian, T.; Fan, J.; Bai, C.; Deng, C.; Xue, J.; Ji, X. Attenuation pattern of skid resistance of heat reflective coatings under the effect of simulated pavement abrasion. Int. J. Pavement Eng. 2023, 24, 10298436. [Google Scholar] [CrossRef]
  44. Li, S.; Xiong, R.; Dong, X.; Sheng, Y.; Guan, B.; Zong, Y.; Xie, C.; Zhai, J.; Li, C. Effect of chemical composition of calcined bauxite aggregates on mechanical and physical properties for high friction surface course. Constr. Build. Mater. 2021, 302, 124390. [Google Scholar] [CrossRef]
  45. Riekstins, A.; Haritonovs, V.; Balodis, A. Evaluation of adhesion between bitumen and aggregate with the digital image processing method. IOP Conf. Ser. Mater. Sci. Eng. 2019, 660, 012047. [Google Scholar] [CrossRef]
Figure 1. Asphalt mixture for the evaluation of texture characteristics.
Coatings 14 00749 g001
Figure 2. Asphalt mixture for the evaluation of anti-skidding attenuation performance.
Coatings 14 00749 g002
Figure 3. Sand patch method.
Coatings 14 00749 g003
Figure 4. Self-developed image acquisition device of the texture structure.
Coatings 14 00749 g004
Figure 5. Three-dimensional reconstruction model of pavement texture.
Coatings 14 00749 g005
Figure 6. Anti-skidding attenuation test of asphalt mixture.
Coatings 14 00749 g006
Figure 7. Texture parameters of asphalt mixture with different segregation degrees.
Coatings 14 00749 g007
Figure 8. Texture parameters of asphalt mixture with different gradation types.
Coatings 14 00749 g008
Figure 9. Relationship between the texture parameters and texture depth.
Coatings 14 00749 g009
Figure 10. Relationship between the comprehensive evaluation index H and texture depth.
Coatings 14 00749 g010
Figure 11. Comprehensive evaluation index after different abrasion numbers.
Coatings 14 00749 g011
Figure 12. Texture depth after different abrasion numbers.
Coatings 14 00749 g012
Table 1. Main technical indexes of 70# base asphalt.
TestResultsRequirements
Penetration (25 °C,100 g, 5 s)/0.1 mm6760–80
Softening point (R & B)/°C50≥46
Ductility (15 °C, 5 cm/min)/cm158≥100
Flash point/°C322≥260
Solubility/%99.7≥99.5
Relative density (25 °C)1.042
Residue after RTFOTMass change/%0.14
Residual penetration ratio (25 °C)/%70.1≥61
Residual ductility (10 °C)/cm102≥6
Table 2. Physical properties of various asphalt mixtures.
Mixture TypeAsphalt Content (%)Void Ratio (%)
AC-20-NL4.253.1
AC-20-N3.984.0
AC-20-L3.528.9
AC-20-M3.1311.4
AC-20-H2.8813.5
AC-134.813.9
AC-164.534.0
AC-204.124.1
SMA-136.193.6
AC-13 (Ⅰ)4.863.9
AC-13 (Ⅱ)4.754.3
SMA-13 (Ⅰ)6.283.5
SMA-13 (Ⅱ)6.024.0
SMA-166.143.7
Table 3. Attenuation fitting model of skidding resistance of asphalt mixture.
Gradation TypeIndexabcR2
AC-13 (I)H0.471.472 × 10−40.370.922
TD0.311.722 × 10−40.460.916
AC-13 (II)H0.491.482 × 10−40.420.975
TD0.321.612 × 10−40.520.964
SMA-13 (I)H0.631.836 × 10−40.540.961
TD0.471.587 × 10−40.660.964
SMA-13 (II)H0.591.766 × 10−40.570.918
TD0.431.673 × 10−40.630.934
SMA-16H0.511.722 × 10−40.640.956
TD0.631.962 × 10−40.710.943
Disclaimer/Publisher’s Note: The statements, opinions and data contained in all publications are solely those of the individual author(s) and contributor(s) and not of MDPI and/or the editor(s). MDPI and/or the editor(s) disclaim responsibility for any injury to people or property resulting from any ideas, methods, instructions or products referred to in the content.

