Article

Influence of Deposition Temperature and WC Concentration on the Microstructure of Electroless Ni-P-WC Nanocomposite Coatings with Improved Hardness and Corrosion Resistance

1
Department of Chemical Engineering, Materials, Environment, Sapienza University of Rome, INSTM Reference Laboratory for Engineering of Surface Treatments, via Eudossiana 18, 00184 Rome, Italy
2
Nuovo Pignone Tecnologie Srl, Baker Hughes, via Felice Matteucci 2, 50127 Florence, Italy
*
Author to whom correspondence should be addressed.
Coatings 2024, 14(7), 826; https://doi.org/10.3390/coatings14070826
Submission received: 8 June 2024 / Revised: 27 June 2024 / Accepted: 1 July 2024 / Published: 2 July 2024
(This article belongs to the Special Issue Smart Coatings)

Abstract

:
This study aims to develop Ni-P coatings with high P content (≥11 wt.%) reinforced with WC nanoparticles on F22 steel substrates. The introduction of conductive WC in the plating solution dramatically increases reactivity of the plating solution, and consequently a tuning of deposition parameters, in terms of temperature and WC concentration, is required to obtain nanocomposite coatings with improved mechanical properties. The coatings’ porosity and incorporation and dispersion of the reinforcing phase as a function of temperature and WC concentration were analyzed by quantitative image analysis from Scanning Electron Microscopy (SEM) micrographs. Increasing the temperature and concentration of nanoparticles leads to a faster plating rate and a dramatic increase in both porosity and agglomeration of the reinforcing phase, with detrimental effects on the coatings’ microhardness. The best compromise between coating parameters was obtained by deposition at 70 °C and 6.5 g/L of WC, with a plating rate ≈ 12 μm/h, porosity lower than 1.5%, and a good combination between particle incorporation and agglomeration. In these conditions, a hardness increase by 34% is achieved in comparison to standard Ni-P. Coatings were then heat treated in air at 200 °C for 2 h, to induce growing stress relaxation, or 400 °C for 1 h, to study effects of crystallization and precipitation. X-Ray Diffraction (XRD) analysis demonstrated that WC introduction does not alter the microstructure of Ni-P coatings, but delays grain growth coarsening of precipitates. Hardness improvement by 6.5% and 45% is registered after treatment at 200 °C and 400 °C, respectively. An increase in elastic modulus, measured by instrumented indentation, was found in WC-reinforced coatings compared with Ni-P. Potentiodynamic polarization tests revealed that both introduction of WC nanoparticles and heat treatment also enhance corrosion resistance.

1. Introduction

Carbon steel is one of the most employed materials in many industrial applications, such as automotive, marine, chemical processes, and energy production. In particular, the Oil and Gas industry makes extensive use of steel components in midstream and downstream operations, because of the advantageous combination between good mechanical properties and relatively low costs. Nevertheless, the operating environment in Oil and Gas applications are typically harsh, and steel elements can undergo accelerated degradation by wear and corrosion phenomena. In this panorama, surface treatments are fundamental to protect components and extend their service life. One of the most widely employed methods for carbon steel protection used to be electrodeposition of hard Cr coatings from Cr(VI) baths. This easy and cost-effective technique produces coatings with good anti-wear and anti-corrosion properties [1]; however, the use of baths containing Cr(VI), which is strongly carcinogenic and hazardous, is currently undergoing several restrictions in the context of REACH regulations [2,3,4].
Electroless Ni-P deposition is considered an environmentally friendly and cost-effective alternative to Cr electrodeposition, since Ni-P coatings show remarkable corrosion and wear resistance [5,6,7,8,9], finding wide applications in aerospace, automotive, energy production, naval, and electronics industries [9,10]. In the electroless process, the controlled reduction of metal ions onto a catalytic substrate is achieved through the introduction of a reducing agent in the plating solution [11]. Anodic and cathodic reactions (i.e., oxidation of the reducing agent and reduction of metal ions) occur on the same surface, which needs to be conductive in order to be to be catalytic. Nevertheless, proper activation procedures allow electroless plating to be initiated also on non-conductive substrates, so that the plating can start on virtually any substrate material and continued deposition is achieved through the catalytic action of the deposit itself [12]. In contrast to electrodeposition, the electroless process does not require external current and dense, uniform and conformal coatings can be produced on any geometry, regardless of the component’s shape. Although Ni-P electrodeposited coatings can nowadays be obtained on nearly any type of substrate [13,14], a very careful anode design is required to restrain the edge-effect-related issues [15], considerably limiting process industrial flexibility. An additional advantage over electroplating is that electroless deposition is a non-line-of sight technique, and uniform coatings can be easily manufactured on any surface that is placed in contact with the plating solution, including internal channels and not exposed areas. This gains much importance when it comes to protecting the complex-shaped components typical of Oil and Gas applications, such as compressor impellers and diaphragms.
In the Ni-P system, hypophosphite ion is used as the reducing agent and a secondary reaction of hypophosphite to elemental phosphorus leads to P incorporation into the nickel matrix. Properties of Ni-P alloys can be tuned according to the phosphorus content, which determines the coatings’ microstructure. Crystalline, mixed amorphous-crystalline, and amorphous structures can be obtained for low P (1–5 wt.%), medium P (6–9 wt.%), and high P (10–13 wt.%) coatings, respectively [16,17,18,19]. Higher P content corresponds to a better corrosion resistance, whereas higher hardness corresponds to crystalline structures with lower P [9,20,21]. Generally, high P coatings are preferred when corrosion resistance is required for the expected application [22] and two strategies can be adopted to increase their hardness: (i) heat treatments or (ii) introduction of functional second-phase particles to create a composite coating. According to literature, the maximum value of hardness is achieved after heat treatment at 400 °C due to precipitation of the Ni3P compound, a very hard phase embedded in the Ni matrix [23,24,25,26,27,28]. As a drawback, Ni crystallization negatively affects corrosion resistance [29], and precipitation of hard and brittle phases may decrease coatings’ fracture toughness [30,31]. Conversely, incorporation of hard solid particles can increase coating hardness without altering microstructure. Nanoparticles can be introduced in the Ni-P matrix by an electroless process, allowing the manufacturing of nanocomposite coatings. Indeed, after their dispersion in the plating solution, nanoparticles can be readily embedded within the coating during its growth. When optimized strategies of both the nanoparticles’ introduction and post-deposition heat treatment are adopted, Ni-P coatings with improved properties can be manufactured to meet the demanding requirements of engineering applications.
Many types of reinforcing particles have been used to produce Ni-P nanocomposite coatings [32,33,34,35,36,37]; however, very few works focused on the use of tungsten carbide (WC) [38,39,40,41,42,43], despite its exceptional tribological properties, corrosion resistance, and widespread use in metallic matrix composites [44]. This is mainly due to some co-deposition issues that can negatively affect coating manufacturing: introduction of conductive nanoparticles in the plating solution is expected to have an influence on deposition mechanisms and, consequently, coating properties [45]. The increase in the catalytic surface area that is active for deposition can have positive effects on plating rate, but also leads to a higher probability of bath decomposition (due to the higher formation of reaction byproducts), increment in porosity, and agglomeration of the reinforcing phase. Manufacturing of Ni-P-WC nanocomposite coatings with improved properties is not straightforward and, to the authors’ knowledge, mechanisms on how WC introduction affects electroless Ni-P deposition is still under debate. This work takes the challenge of investigating the simultaneous effects of WC concentration and deposition temperature on the electroless process, to uncover their influence on deposition and, consequently, on nanocomposite characteristics and properties. For the first time, WC incorporation, particle agglomeration, and coating porosity were simultaneously evaluated as a function of plating conditions and related to coating microhardness. The aim is to provide novel insights on how WC introduction affects the mechanisms of coating formation, and fully understand the combined effect of plating temperature and WC content on the deposition process and coating characteristics. Crucial features of plating rate, porosity, nanoparticle incorporation, and agglomeration were assessed by an original and flexible quantitative image analysis procedure, to provide an objective method to define the best manufacturing parameters and guarantee a correct enhancement of protective properties. The best parameters for the manufacturing of WC-reinforced nanocomposites with improved performances were eventually determined by calculating a response surface by mathematical interpolation procedures, providing additional information compared with experimental data only. Coatings were characterized in terms of microstructure, mechanical properties, and corrosion resistance in the as-deposited state and after thermal treatments, to provide a full characterization of the produced castings and highlight differences with particle-free Ni-P alloys.

2. Materials and Methods

2.1. Coating Preparation

F22 low carbon steel (ASTM 182 [46]) squared specimens with 15 mm lateral dimension and 3 mm thickness were used as substrate material. Before deposition, pre-treatments were performed on substrates according to ASTM designations B 183-79 [47], B 322-99 [48], and B 733-97 [49]. The pre-treatment procedure is based on the following:
1.
Soaking in 1 M NaOH solution at 80 °C for 10 min, for degreasing and removal of liquids for long-term storage.
2.
Sandblasting using mesh 80 corundum as abrasive material, with pressure 6.2 bar, 100 mm blast distance, and performing 10 passes per sample, to increase and uniform substrate roughness. Higher roughness can promote deposition [50] and enhance coating adhesion [51].
3.
Rinsing in acetone and ultrasounds using an Elmasonic S 30 (H) (Elma Schmidbauer GmbH, Singen, Germany) ultrasonic bath for 5 min, to remove any contamination from sandblasting.
4.
Activation by pickling in a solution of HCl 37 wt.% further diluted by 50 vol%, to remove any residual non-catalytic superficial oxide.
Each cleaning step was followed by rinsing in deionized water. All chemicals used in the study were purchased from Thermo Fisher Scientific Inc. (Waltham, MA, USA) and used without any further purification.
Electroless solutions were prepared according to the formulation reported in Table 1, which leads to the deposition of coatings with phosphorus content equal to 11.27 ± 0.41 wt.% (measured by EDS analysis on at least five areas comprising 70% of the coating thickness, starting from the external interface [52,53,54]). The pH of the solution is 4.2, monitored using a METTLER TOLEDO™ Seven Excellence pH-meter model S400 with an InLab® Viscous Pro-ISM sensor (METTLER TOLEDO International Inc., Columbus, OH, USA). Detailed discussion about the plating solution is reported elsewhere [50].
Commercial WC nanoparticles, with size ranging between 100 and 200 nm, were purchased from Sigma-Aldrich (Merck KGaA, St. Louis, MO, USA). The SEM micrograph of as-purchased nanoparticles is reported Figure 1a. Purity of nanoparticles was confirmed by the EDS analysis reported in Figure 1b, in which only W and C peaks can be identified. To better show WC particle size and shape, a higher magnification micrograph of sonicated nanoparticles is reported in Figure 1c. Particle size distribution was calculated from over 200 measures acquired by SEM micrographs and is reported in Figure 1d.
Particles were dispersed in aqueous solutions to obtain a final concentration ranging between 1 g/L and 20 g/L. To break eventual agglomerates and promote dispersion, WC nanoparticles suspensions were sonicated with a Fisher Scientific 505 ultrasonic tip (Fisher Scientific, Hampton, New Hampshire, United States) at 20% intensity for 10 min.
Substrates were immersed in the plating solution only after pre-heating to the desired deposition temperature. The plating process was carried out at a temperature ranging between 70 °C and 90 °C, and the nanoparticles concentration varied between 1 g/L and 20 g/L. Temperatures below 70 °C and above 90 °C were not explored because of activation and stability issues, respectively. Optimization of the process was carried out by varying one parameter at a time (i.e., changing concentration at constant temperature and varying temperature at fixed concentration) to study the combined effect of the two parameters on coating deposition and properties. First, tests were conducted at 90 °C and varying WC concentration. After finding the best concentration in terms of coating properties at 90 °C, concentration was fixed at 3 g/L to study the effect of temperature and gain the best control over the deposition process. Eventually, concentration was varied again at 70 °C fixed temperature, to define the combined effect of the two parameters. Other temperature–concentration pairs were explored to eventually build a response surface and define the best combination of parameters by means of interpolation. Detailed descriptions of how the data were explored are given in the Results and Discussion section and the experimental matrix of the different investigated temperature–concentration points is reported in Table 2. Particle-free deposition at 90 °C was performed to produce reference standard Ni-P coatings [50]. Before immersing the substrates, solutions were pre-heated to the desired deposition temperature using an IKA™ C-MAG HS7 digital hot plate (IKA-Werke GmbH & Co. KG, Staufen, Germany) equipped with an ETS-D5 controller and a PT1000 sensor. Depositions were carried out in a beaker under magnetic stirring at 180 rpm, to guarantee that WC particles are effectively kept in suspension. According to literature results on similar processes, when the stirring speed is lower than 180 rpm, the fluid flow might not be capable of transporting WC particles towards the surface, whereas too high a stirring rate (>200 rpm) can sweep away nanoparticles that loosely adsorb onto the substrate before they can be embedded in the growing coating [39,43]. The bath loading selected for the deposition (defined as the ratio between volume of solution and surface area to be coated) was 55 mL/cm2 and temperature was constantly monitored. Deposition was performed for 90 min when depositing at 90 °C. When depositing at a lower temperature, deposition time was adjusted to obtain coatings with comparable thickness.

2.2. Coating Characterization

Surface morphology, coating thickness, and particle dispersion and distribution were evaluated with a Field Emission Gun–Scanning Electron Microscope (FEG-SEM) Tescan Mira3 (Tescan, Brno, Czech Republic) equipped with an Edax Octane Elect Energy Dispersive X-Ray Spectroscopy (EDS) system (Edax/Ametek Inc., Berwyn, PA, USA). Edax Team v.5 software was used for elementary analysis.
Morphology and surface roughness analysis of standard and nanocomposite samples was conducted using a Talyscan 150 profilometer (Taylor Hobson, Leicester, UK) equipped with a cantilever probe. A total of 600 profiles with a length of 12.5 mm were acquired around the center of the sample, with a resolution 0.5 µm and 10 µm spacing between profiles. Average surface roughness calculations were performed using MountainsMap 10® (Digital Surf, Besançon, France) software, to determine the average and standard deviation of Ra value (according to ISO 21920-2:2021 [55]). Three-dimensional representations of each investigated surface, with dimensions of 1 mm × 1 mm and comprising a 2000 × 200 pixels surface matrix, were also acquired to show morphological features on representative portions around the middle of the sample.
Cross-sectional observation of samples was prepared by mounting in epoxy resin (EpoThin 2, Buehler Ltd., Lake Bluff, IL, USA) and subsequent polishing with SiC papers (P400 grit to P1200 grit) and water-based diamond suspension (up to 1 μm finishing) (Buehler Ltd., Lake Bluff, IL, USA).
The crystalline phases present in the coatings were investigated by X-Ray Diffraction analysis (XRD) with a Philips X’Pert diffractometer (PANalytical BV, Almelo, The Netherlands), operating at 40 KV and 40 mA with CuKα radiation. Scan range of acquisition was 20–80° (2θ) with a feed step of 0.02° and acquisition time of 2 s. The crystallites size was calculated using Scherrer’s equation (Equation (1)) [56]:
D = 0.94 λ β cos ( θ )   ,
where λ is the wavelength of the radiation used, θ is the position of the main peak, and β is the peak broadening at half the maximum intensity. No correction for instrumental broadening was made.
Coatings’ characteristics as a function of temperature and WC ratio were investigated in terms of plating rate (expressed as µm/h), porosity, nanoparticles incorporation in the coating, and their agglomeration. Both porosity and nanocomposite characteristics (i.e., incorporation and agglomeration of particles) were calculated by means of image analysis from SEM back-scattered electrons (BSEs) cross-sectional micrographs, using a specifically developed procedure implemented in MATLAB (v. R2022b, The MathWorks Inc., Natick, MA, USA). The image analysis procedure (schematized in Figure 2) aims to precisely identify porosity or WC nanoparticles in the coating and is based on the compositional contrast between the Ni-P matrix, WC nanoparticles, and porosity. WC appears brighter in BSE images whereas pores have a nearly black color (as can be seen from Figure 2a); binarizing according to the proper color threshold in the grayscale can enable the precise identification of particles (Figure 2b) or porosities (Figure 2c). Figure 2d,e show the process output with red spots corresponding to particles and porosity, respectively, superimposed to the original SEM micrograph, to prove the good matching. Detailed description of the quantitative image analysis procedure is reported in a previous work by the same authors [57]. Porosity and nanoparticles incorporation (i.e., WC content value within the coating) can therefore be quantified and are expressed as area fraction (A%). This parameter is defined as the ratio between the cross-sectional area occupied by porosity or WC nanoparticles (according to which parameter is being measured) and the total analyzed cross-sectional area of the coating. Area fraction can be considered equal to the volume fraction when spherical-like shapes are considered [58], which is the case of both porosity and WC particles. The agglomeration parameter is expressed in terms of mean number of particles per agglomerate. This last parameter is calculated as the ratio between the mean measured size of embedded reinforcement and the mean size of purchased particles (175 nm), and will be indicated with Na: the higher Na, the higher is the degree of nanoparticles agglomeration within the coating.
The presence of through the thickness cracks or defects, which may arise as a consequence of coating growth stresses, nanoparticle introduction, and/or thermal treatments, was investigated by the Ferroxyl reagent test (ASTM B689-97 [59]).

2.3. Thermal Treatments

The optimization process leads to the selection of the best nanocomposites in terms of deposition properties (i.e., plating rate, porosity, nanoparticles incorporation, and agglomeration) and microhardness. Heat treatments at 200 °C for 2 h and 400 °C for 1 h in air were performed on standard Ni-P coatings and optimized WC-reinforced coatings, to study and compare the changes in properties as a function of microstructural evolution upon annealing. The heat treatment at 200 °C for 2 h was performed to reduce hydrogen embrittlement phenomena [23,60,61], to release coating growth stresses, and to initiate grain growth. Duration of the heat treatment was extended to 2 h since many literature studies [23,62] report no microstructural changes after treatment for 1 h. To confirm this, a preliminary study was conducted to compare standard Ni-P coatings in the as-coated condition and after annealing at 200 °C for 1 h: comparison of XRD spectra reported in Figure 3a confirm that no obvious microstructural changes occur and only one broad peak of amorphous Ni is recorded for both coatings. Accordingly, no changes in microhardness are measured, as shown in Figure 3b.
Annealing at 400 °C for 1 h was performed to induce crystallization of the Ni matrix and precipitation of Ni3P hard phases, leading to the maximization of coating hardness [23,24,25,26,27,28]. An increase in the duration of exposure at 400 °C would lead to excessive grain growth and precipitate coarsening, thus reducing mechanical properties. A Lenton tube furnace (now Carbolite Gero Ltd., Hope, UK) was used to perform heat treatments and the samples were heated and cooled down to room temperature at a rate of 10 °C/min, to minimize internal stresses.

2.4. Vickers Microhardness Test and Instrumented Indentation Test

Coating microhardness was assessed according to ASTM E384-11 standard [63], using a Leica VMHT (Leica GmbH, Wetzlar, Germany) equipped with a Vickers diamond indenter with 50 gf load and 15 s indentation time. All indentations measurements (at least 20 for each sample) were collected on cross sections, to avoid any influence from surface morphology, with distance between indentations ≥ 30 μm. Coating hardness was investigated on standard (particle-free) and nanocomposite coatings obtained with all the different temperature–WC concentration pairs. Since it is an easy, well-established, and norm-regulated test, Vickers microhardness was used to evaluate coating properties during the optimization process, directly allowing comparison with a big dataset of literature results.
Further investigation on the mechanical properties of optimized coatings, both in the as-deposited and heat-treated state, was evaluated by an instrumented indentation test according to ISO 14577:2016 standard [64] using the Nanotest indenter (MicroMaterials Ltd., Wrexham, UK). A maximum load of 250 mN was applied using a Berkovich indenter. The lower test load and contact at one point guaranteed by Berkovich tip allows the determination of hardness (H) and Young’s modulus (E) with a lower influence of coating defects and no operator bias (which becomes non-negligible in Vickers test at low loads). Depth vs. load hysteresis curves were recorded with a load-controlled method and fixed-time ramp type, with initial load of 0.5 mN, 20 s load/unload time, and 10 s dwell time at maximum load. The surface of samples was mirror polished before testing, to avoid any influence from surface roughness, and 20 indentations were performed for each load. Coating hardness was evaluated according to Equation (2), as described by Oliver and Pharr [65]:
H = P m a x A   ,
where Pmax is the maximum applied load and A is the contact area under the load. Elastic modulus of the coating, E, was calculated starting from the reduced Young modulus (Er), according to Equation (3) [65]:
1 E r = ( 1 ν 2 ) E + ( 1 ν i 2 ) E i   ,
where ν is the Poisson ratio of sample (0.31 [66]), νi is the Poisson ratio of the indenter, and Ei is the elastic modulus of the indenter. In the case of Berkovic’s three-sided pyramidal indenter, the Poisson ratio and elastic modulus are 0.07 and 1141 GPa, respectively [67].

2.5. Potentiodynamic Polarization Test

The influence of WC nanoparticles and thermal treatment on the corrosion behavior of the manufactured samples was studied using a potentiodynamic polarization technique. Tests were performed with a three-electrode system, according to ASTM G59-97 standard (as indicated by specification B733-04) [68]. The test sample with unit exposed area is used as the working electrode, a saturated standard calomel electrode (SCE) works as the reference electrode, and a platinum mesh is the counter electrode. Tests were performed at 20 °C in open air in a cell containing 3.5 wt.% NaCl solution using a PARSTAT 3 potentiostat/galvanostat (Princeton Applied Research, Oak Ridge, TN, USA) with scan rate of 0.1666 mV/s within the potential range of −0.225 V to +0.425 V with respect to the Open Circuit Potential (OCP). Samples were immersed in testing solutions for 30 min before starting the analysis and OCP was measured for 30 min, to guarantee the reaching of the steady state of the potential. Corrosion potential (Ecorr) and corrosion current density (Icorr) were determined using the Tafel extrapolation method. Polarization resistance Rp was calculated using the Stern–Geary simplified equation (Equation (4)) [69,70]:
R p = β a β c 2.203 I c o r r ( β a + β c ) ,
where βa and βc are the anodic and cathodic Tafel slopes, respectively.

3. Results and Discussion

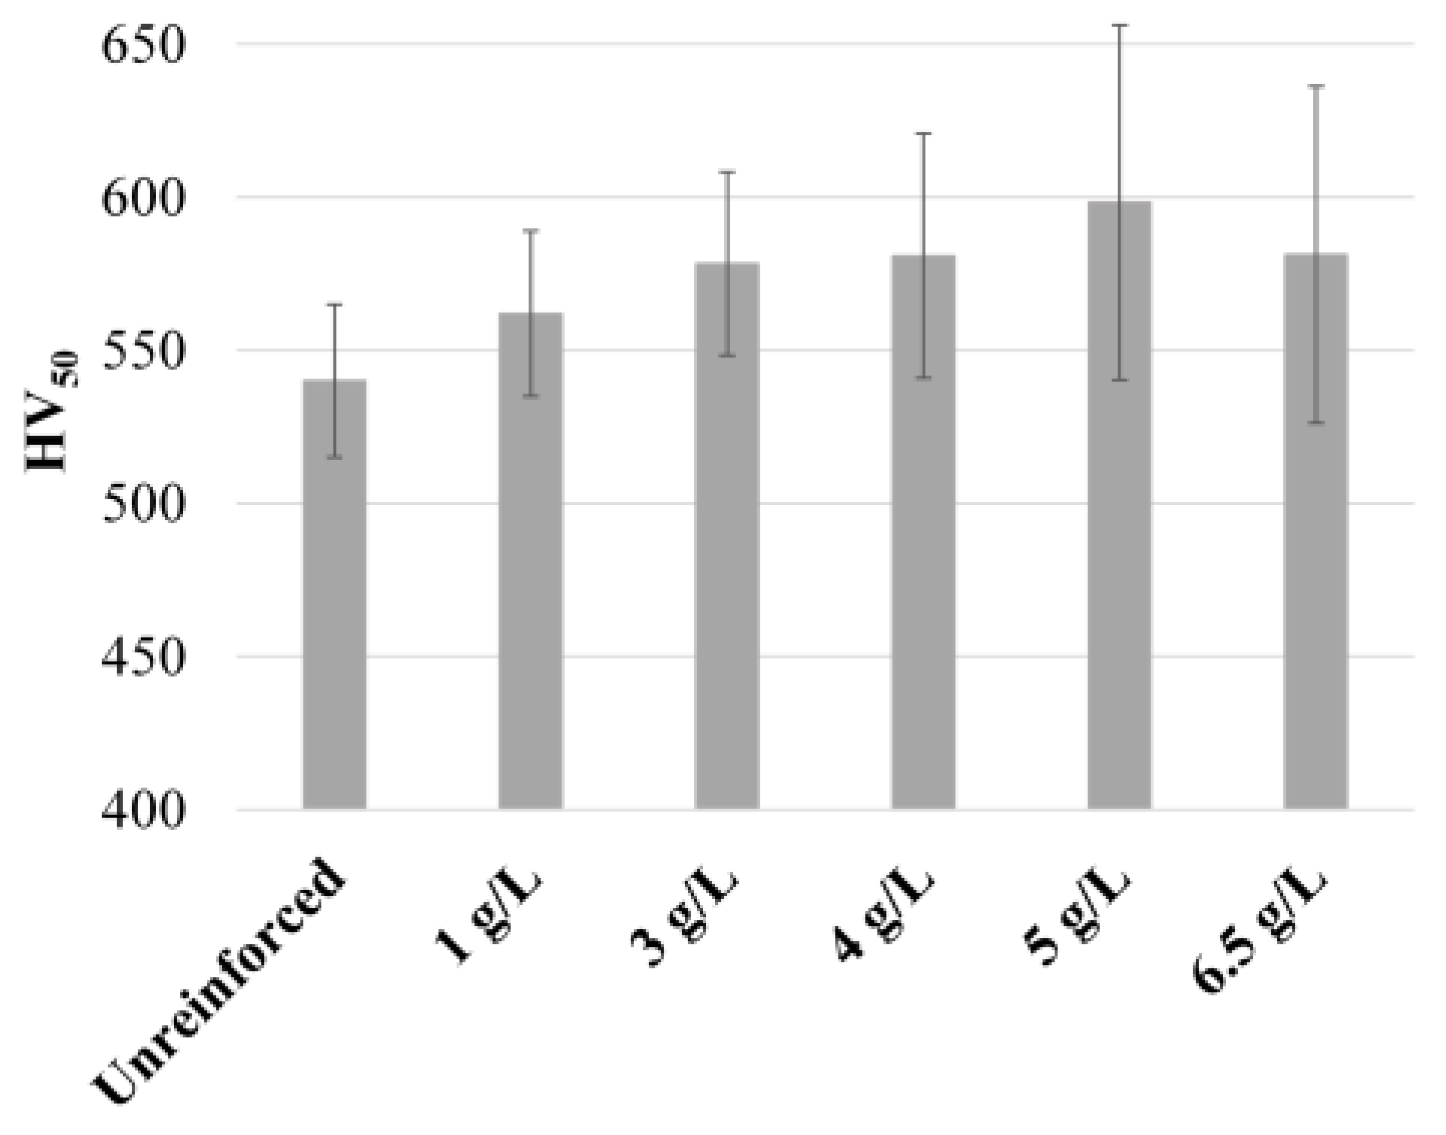
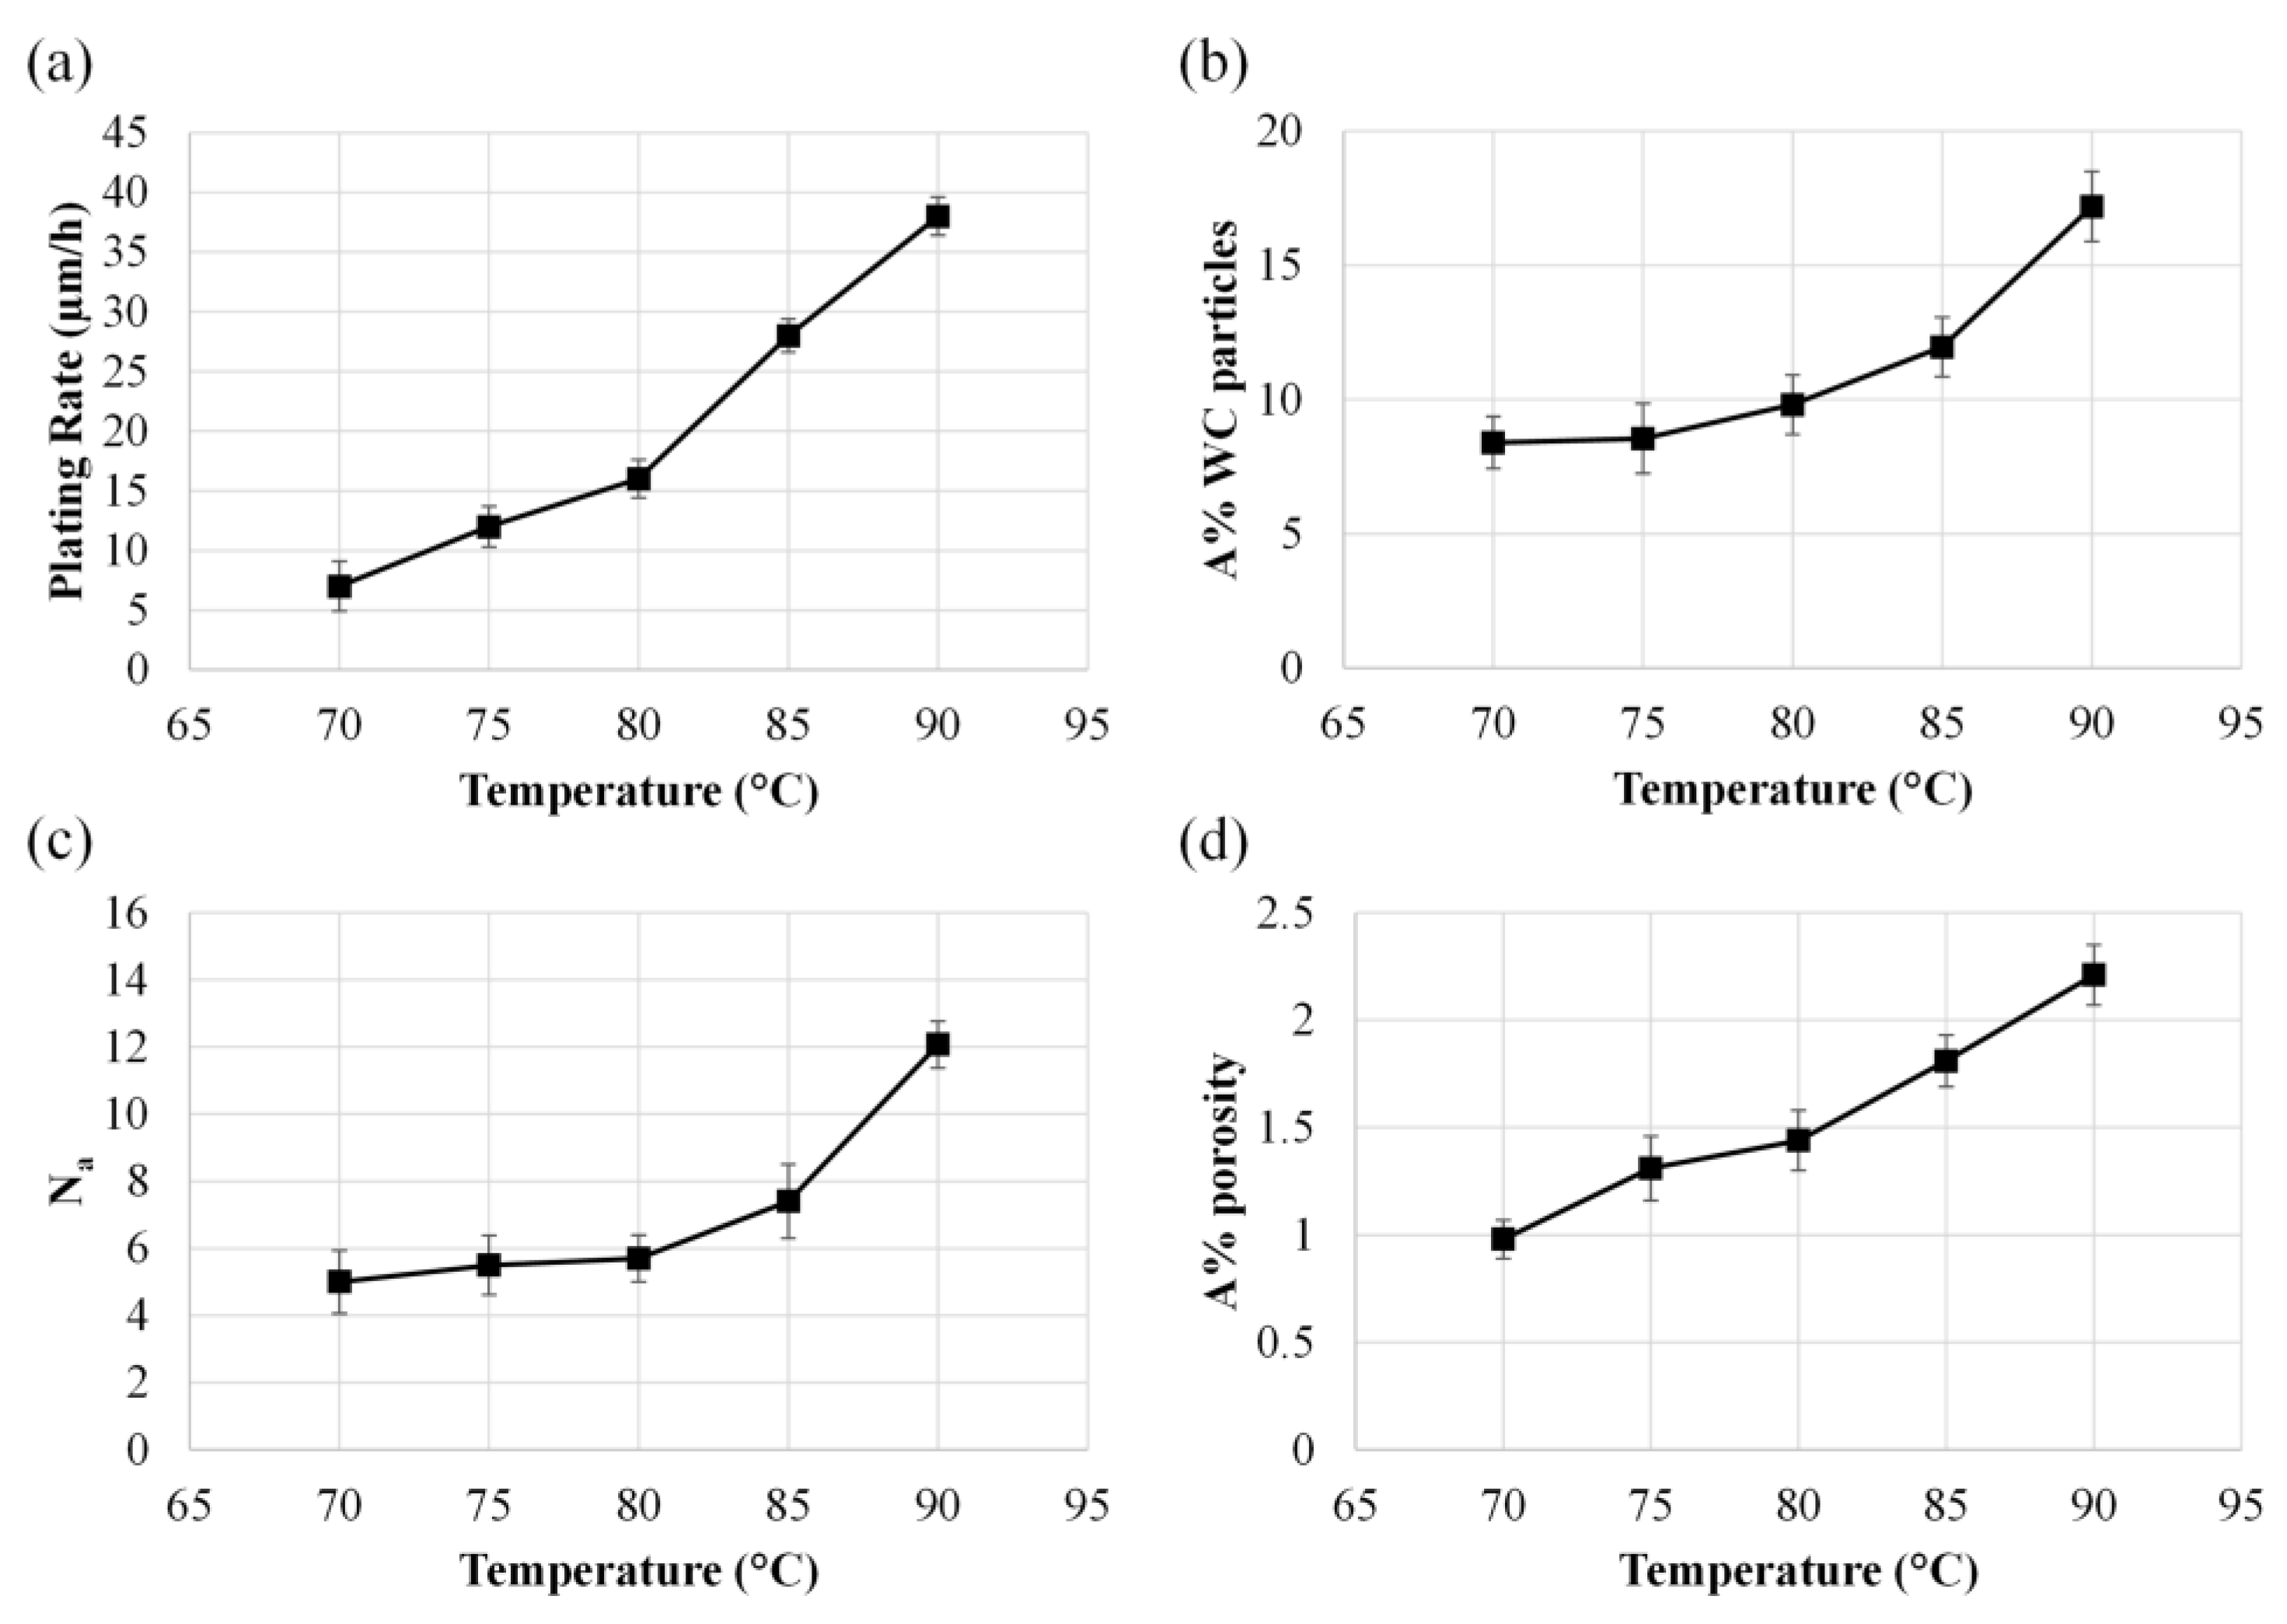
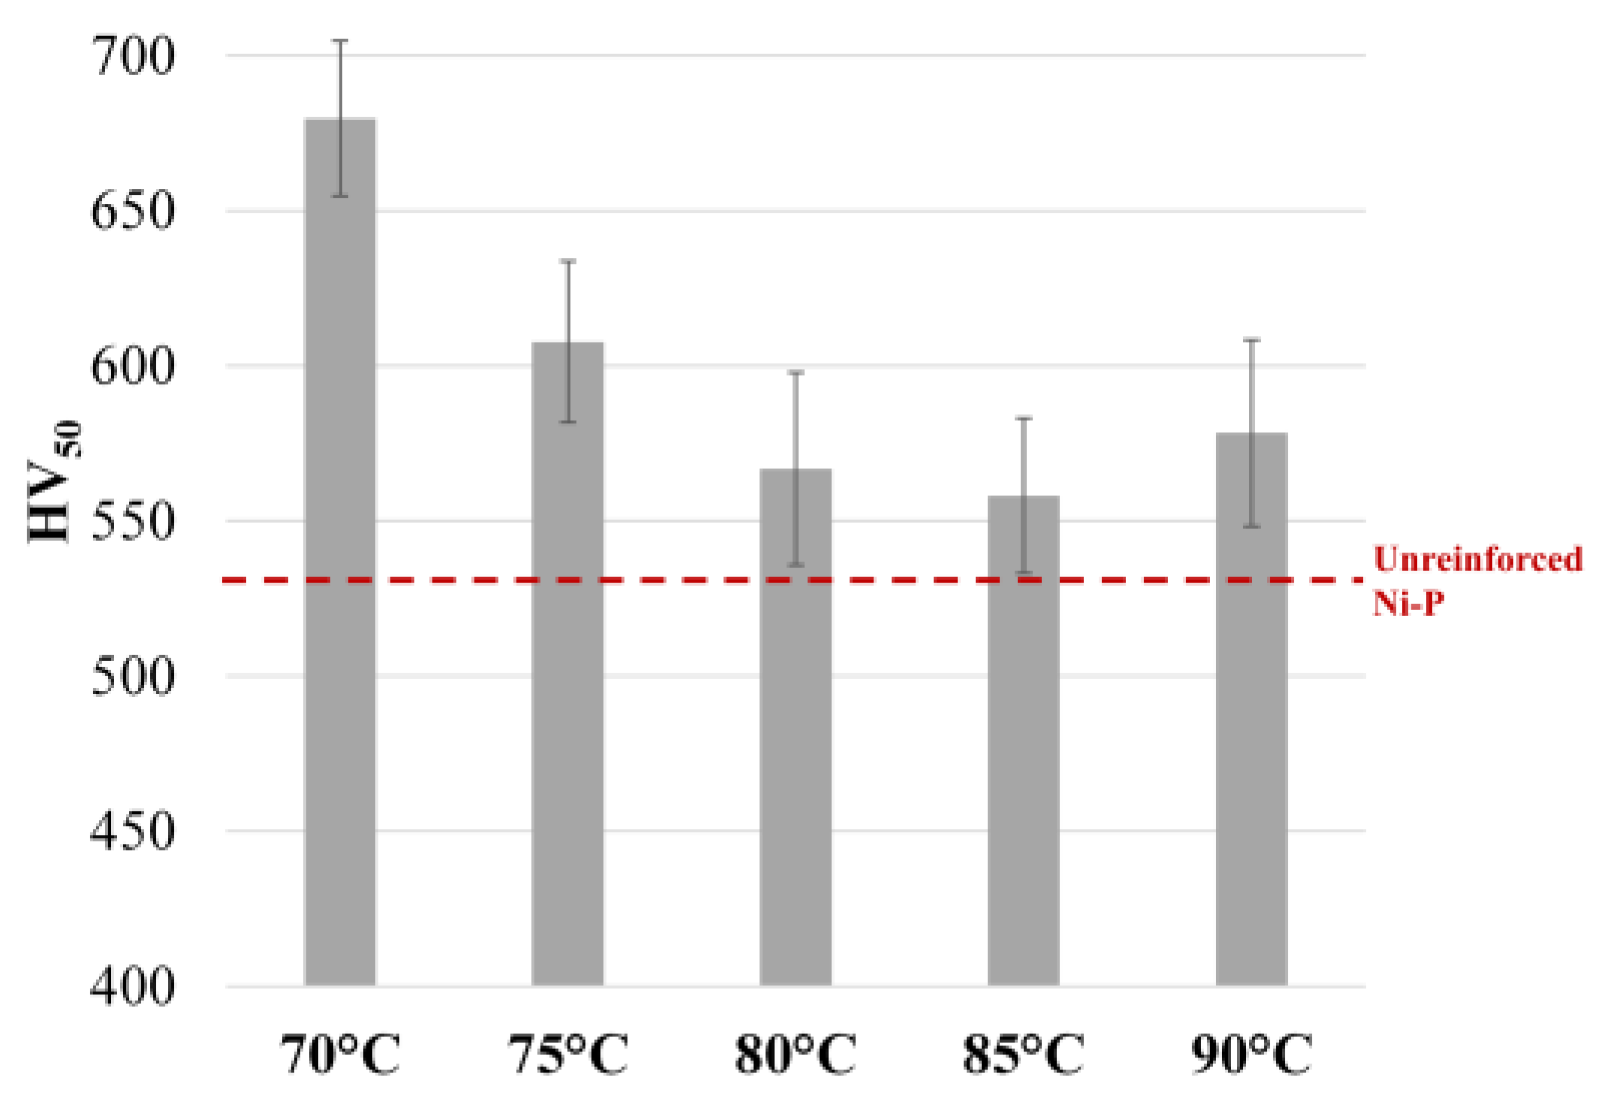
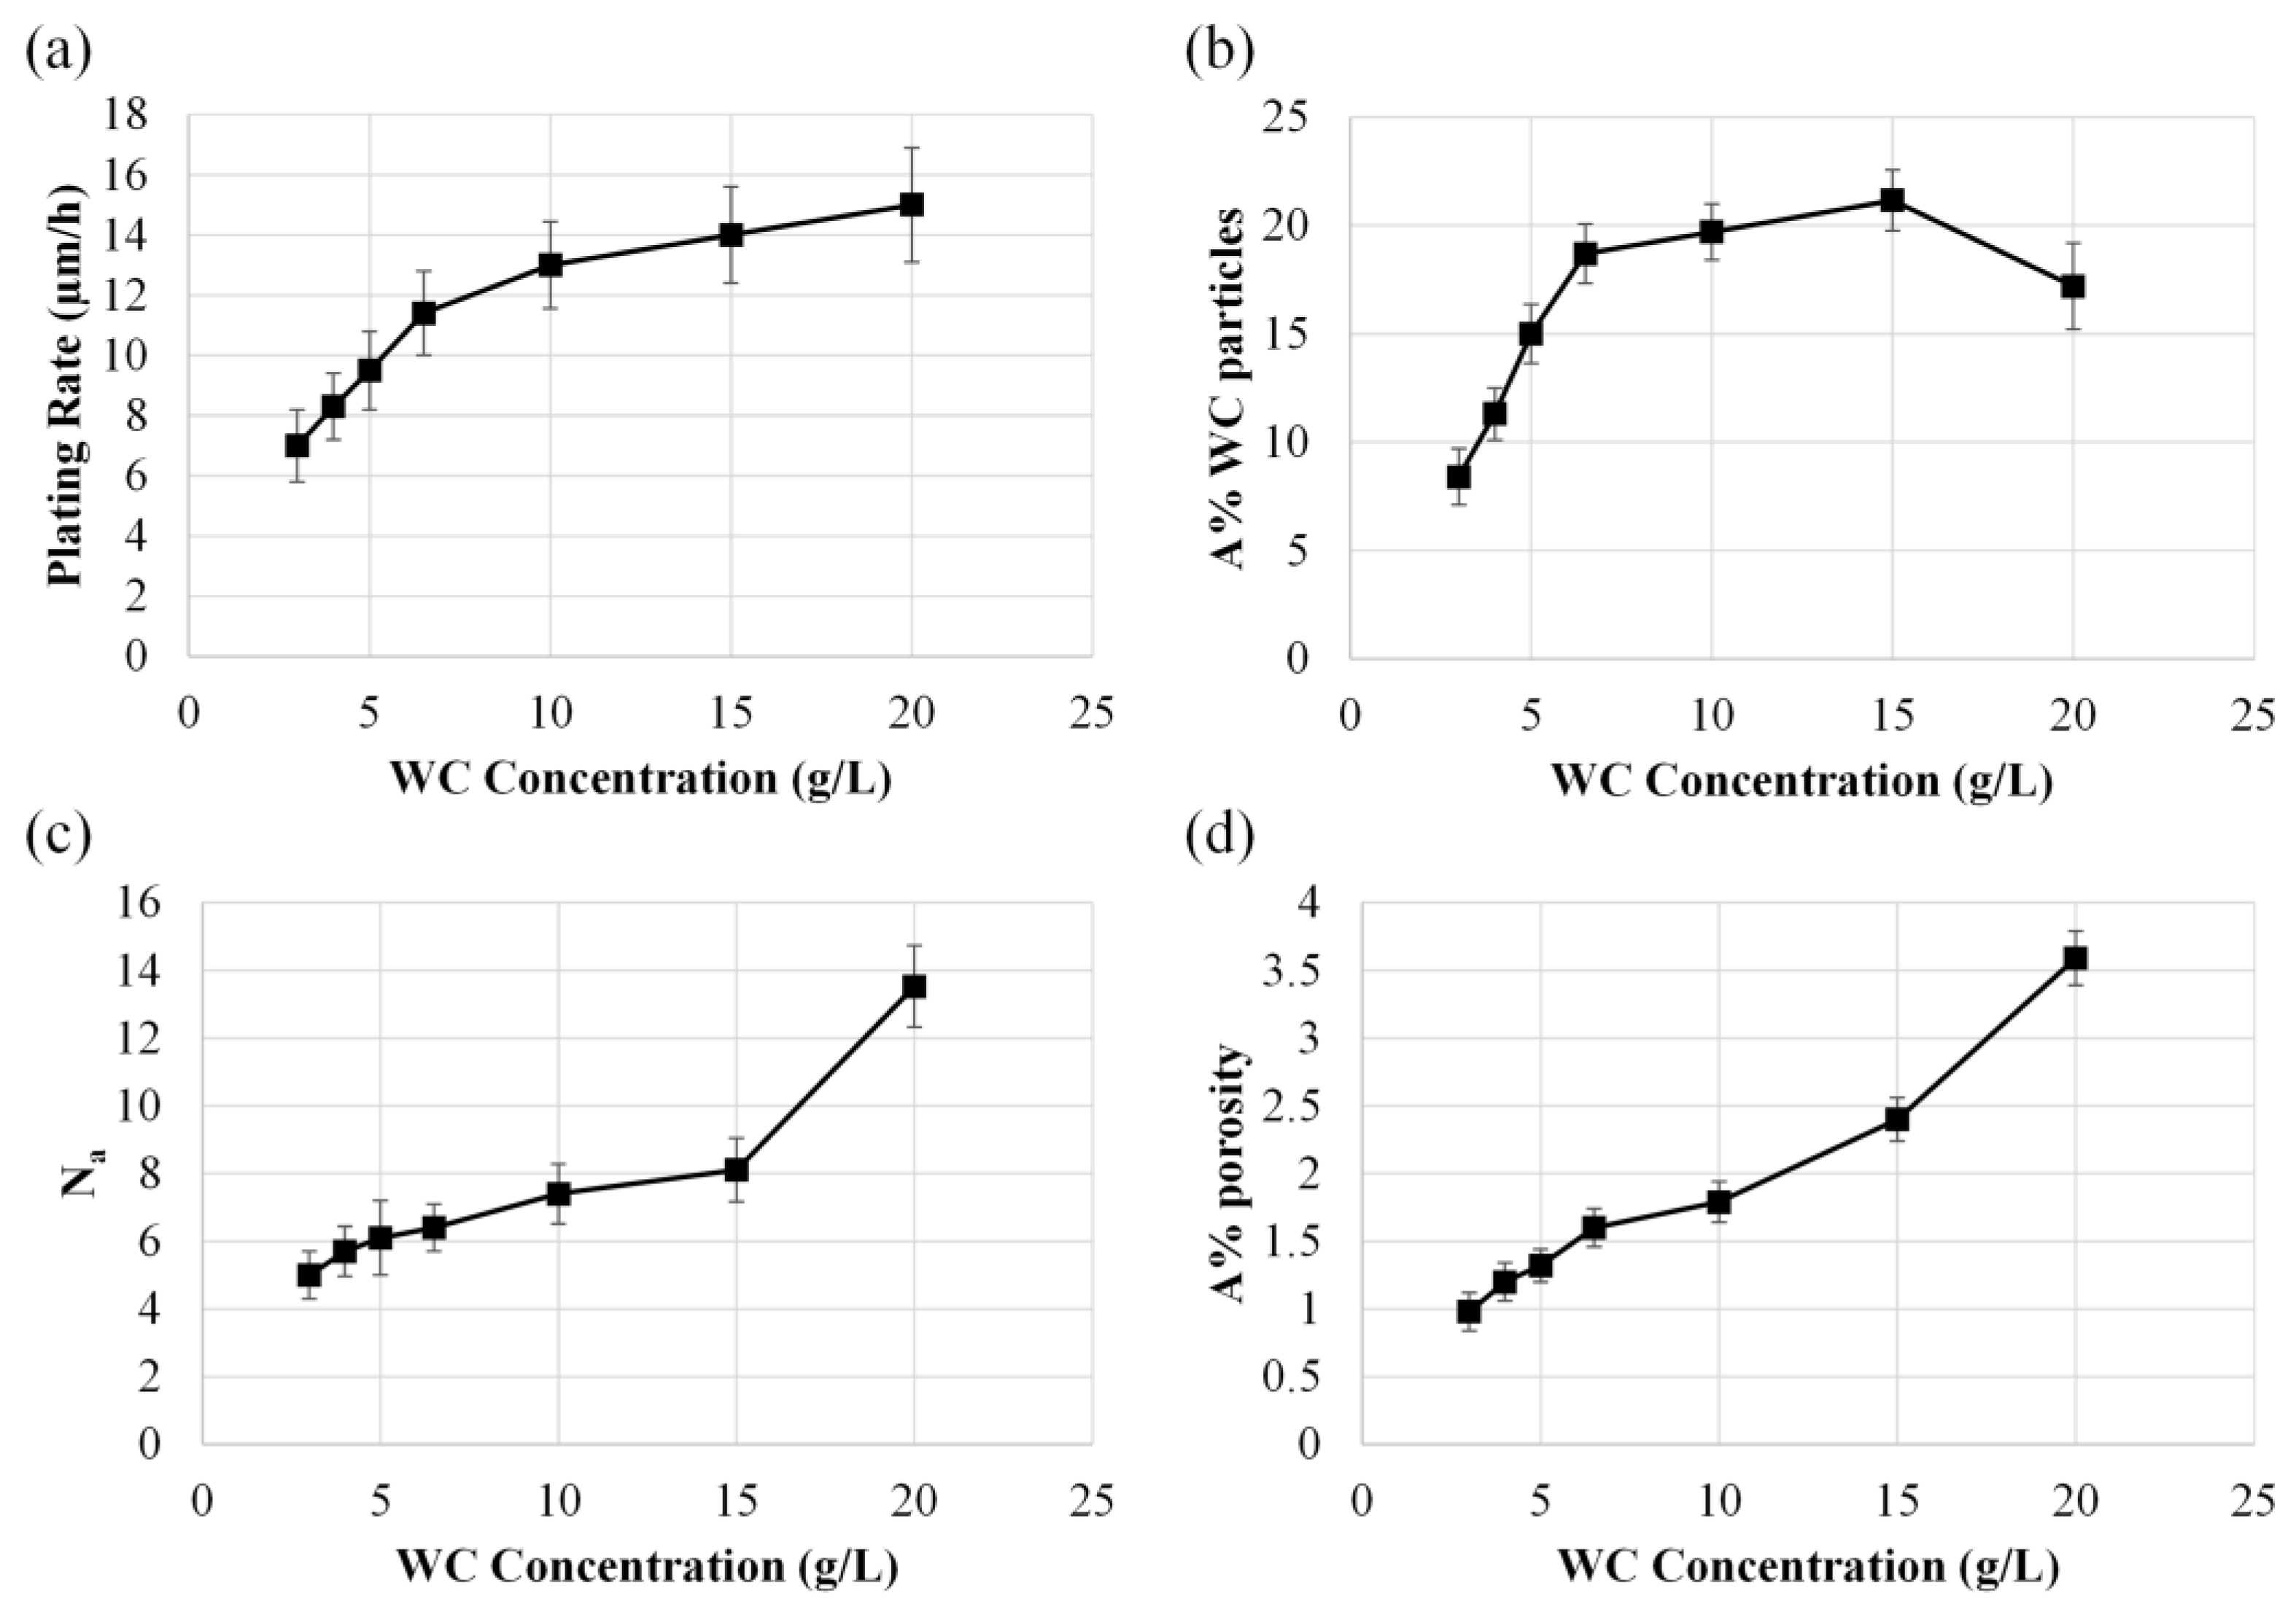
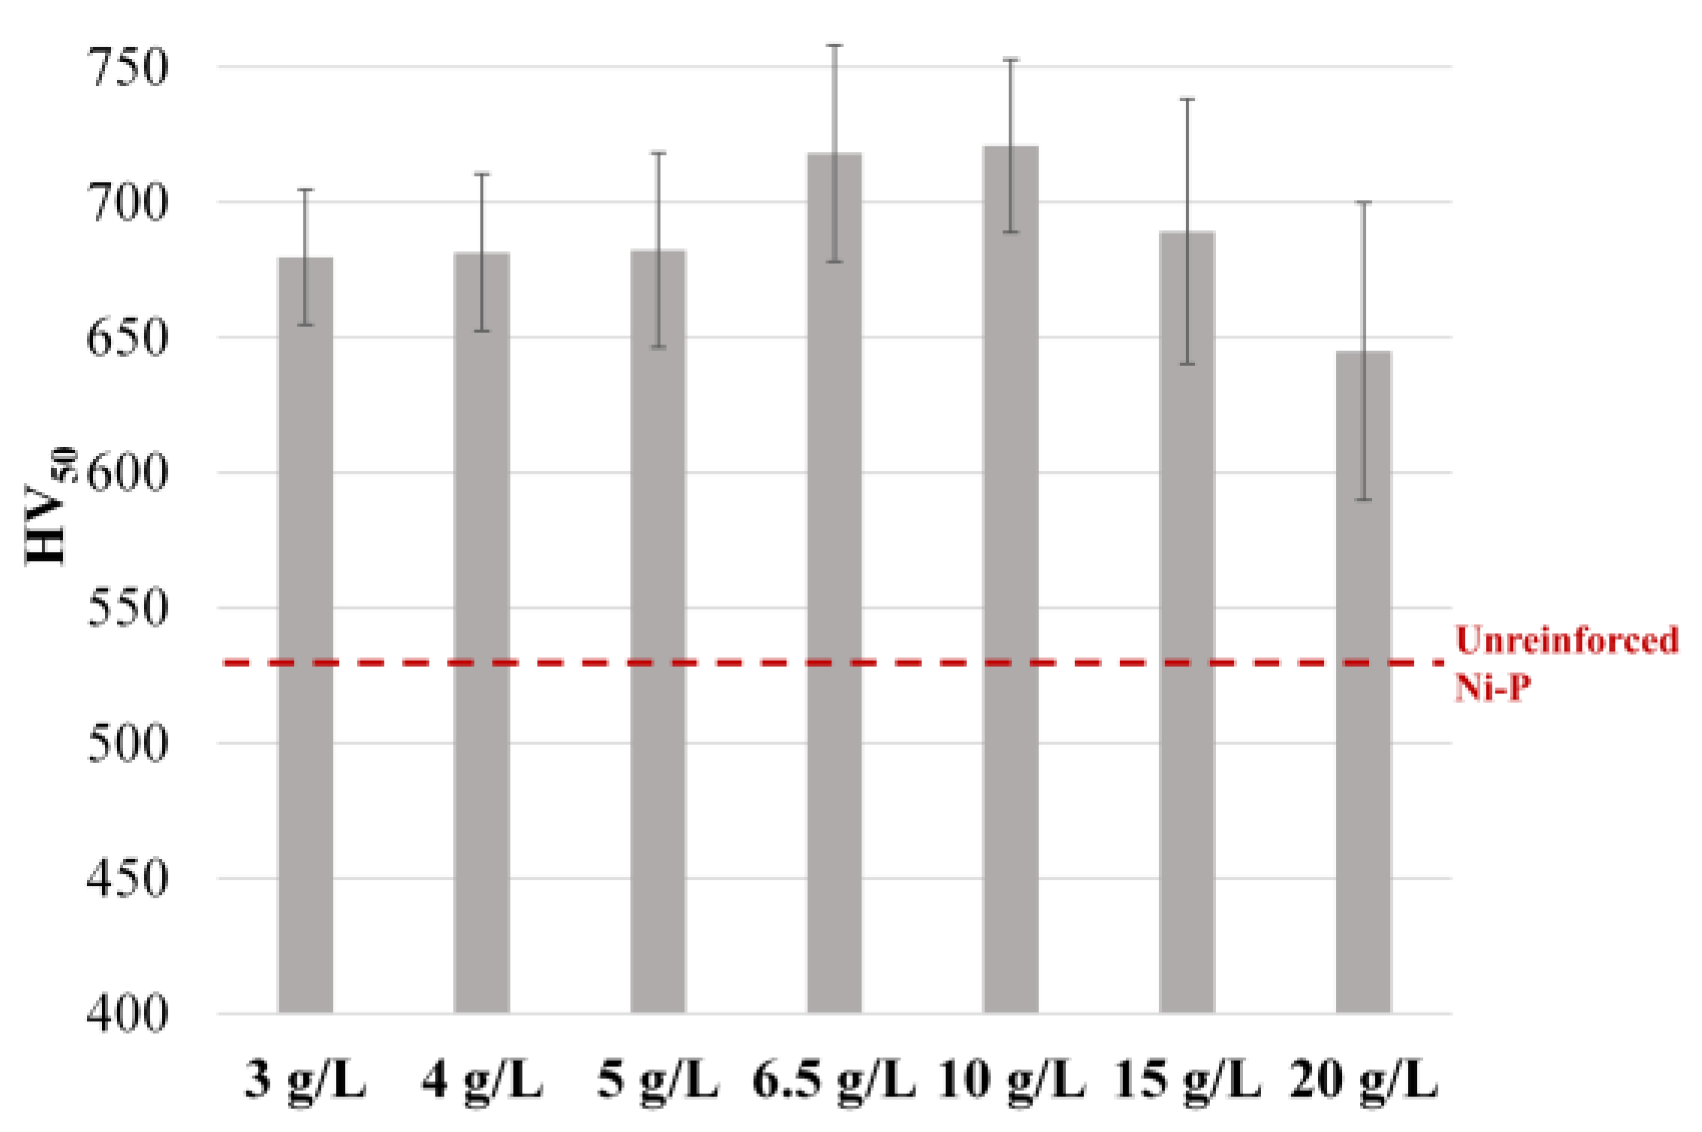
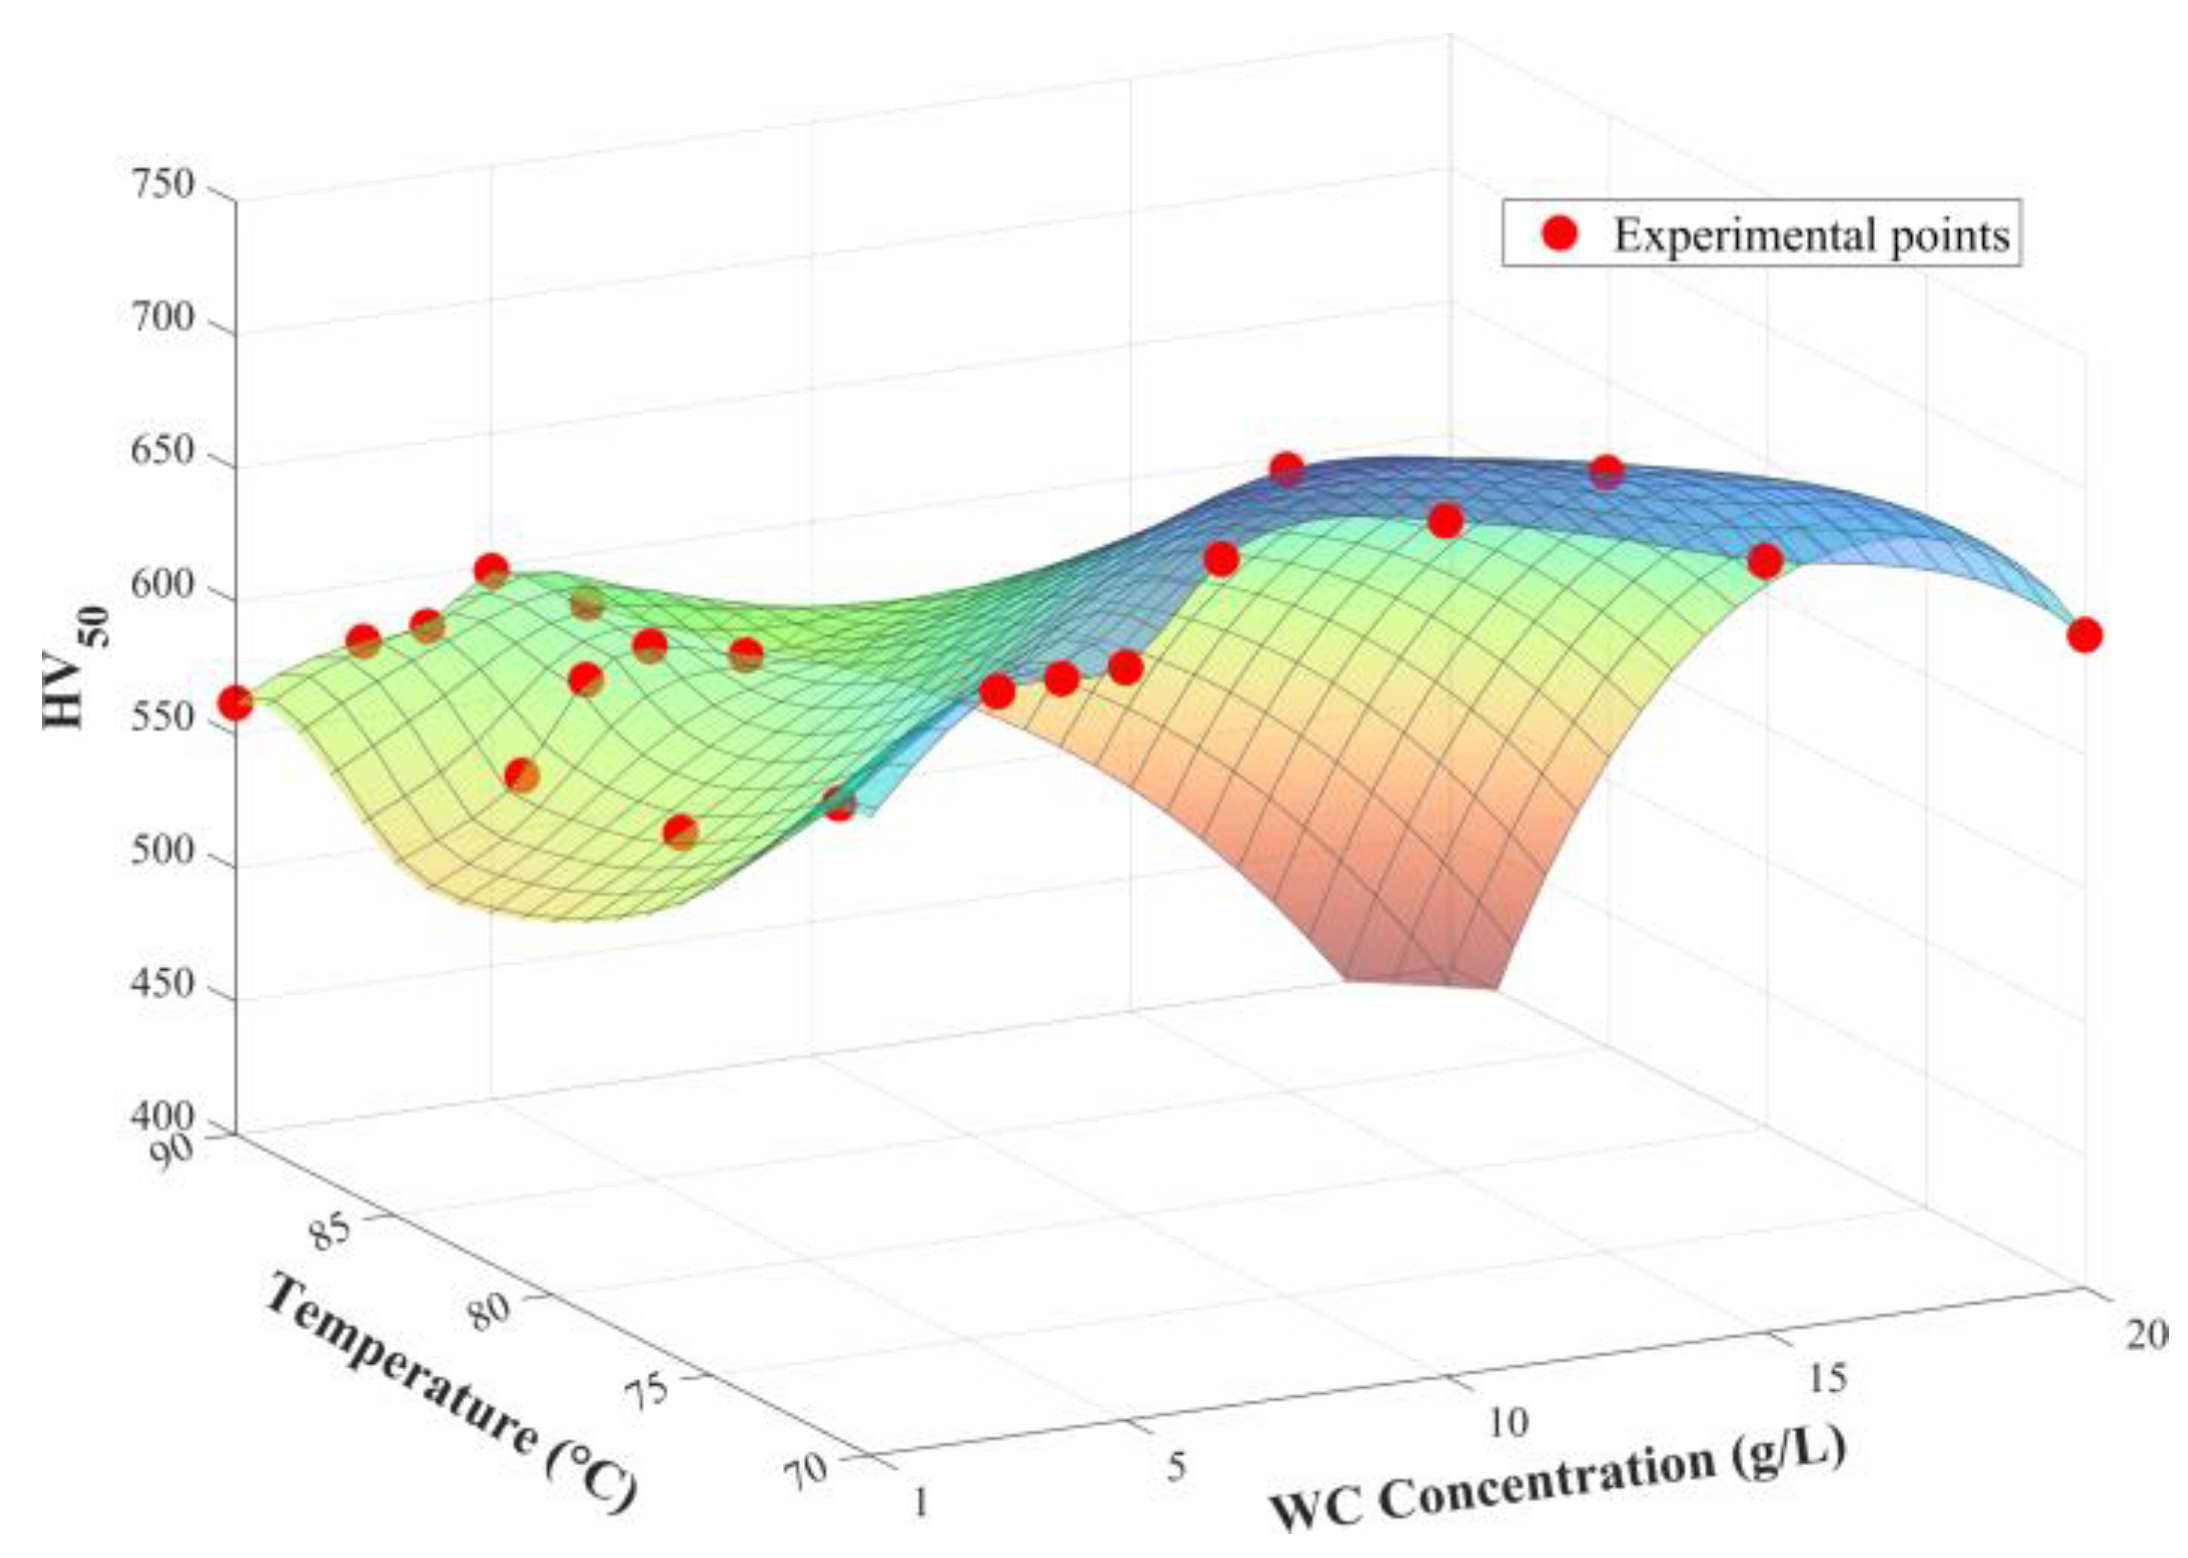
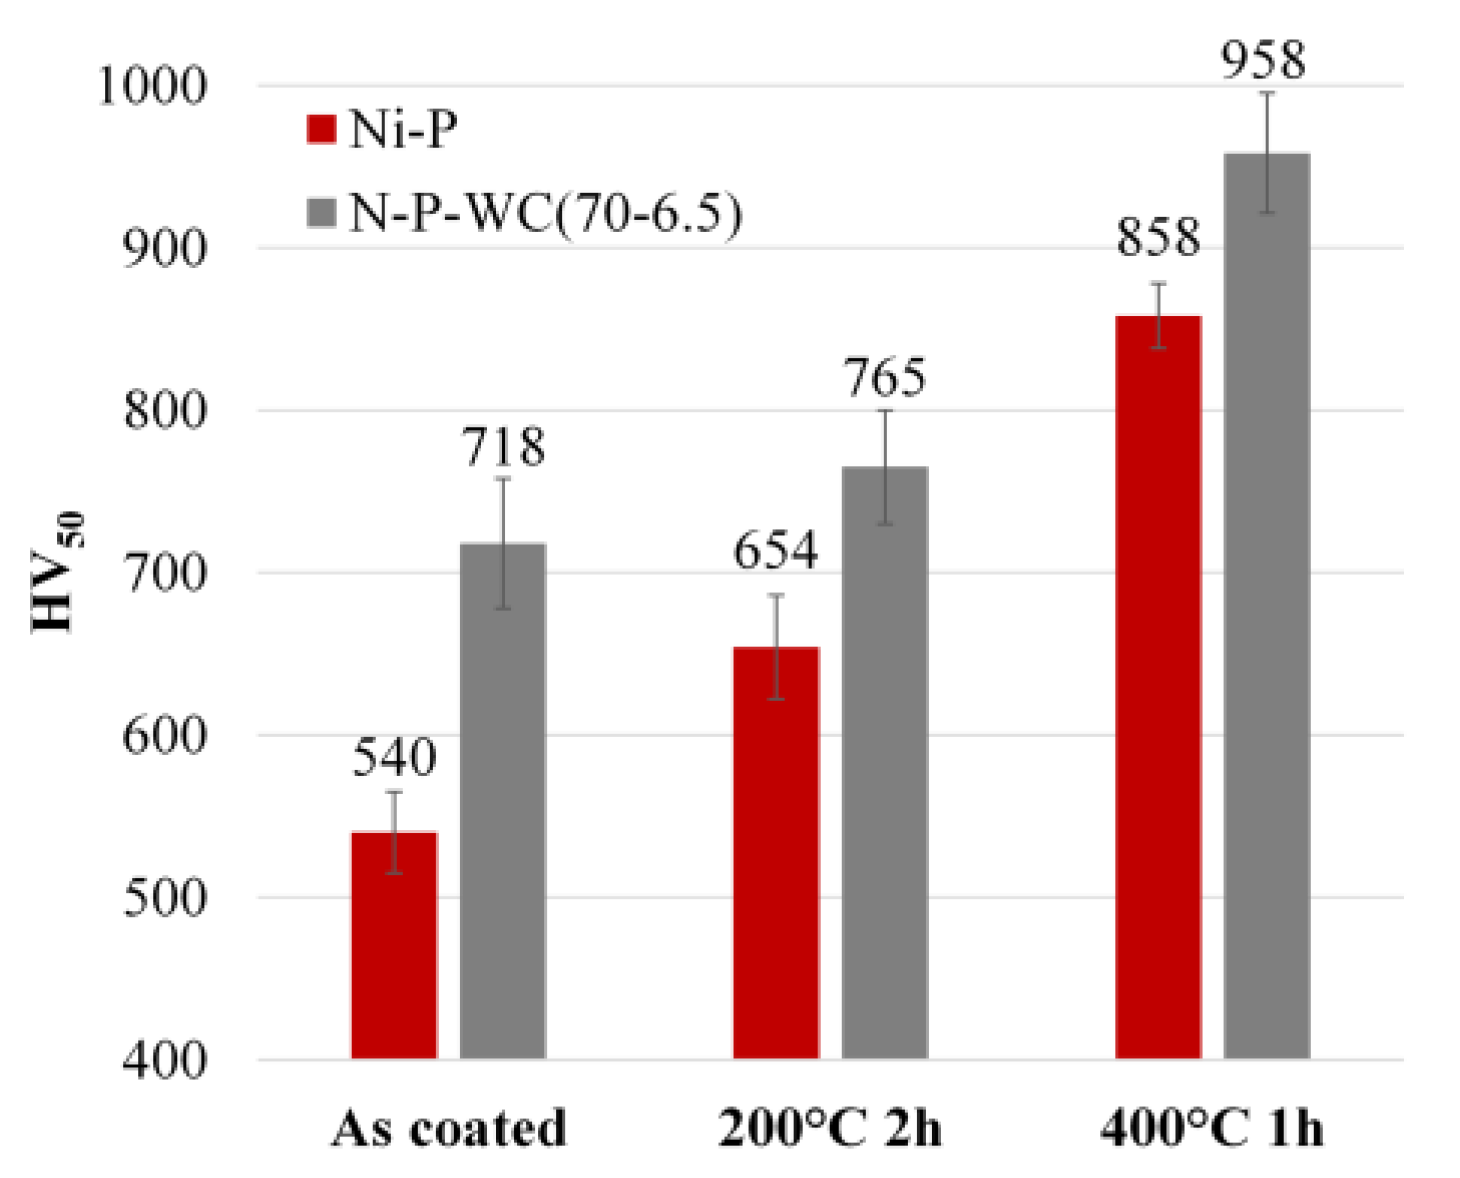
3.1. Effect of Temperature and WC Concentration on Microhardness

XRD analysis of F22 substrate, WC particles, and Ni-P-WC composite coatings are reported in Figure 4a, b, and c, respectively. XRD spectrum of the substrate (Figure 4a) only shows Fe peaks (JCPDS 87-0721), indicating no contamination of the pre-deposition surface. Similarly, XRD of WC powder (Figure 4b) only exhibits WC peaks (89-2727), further confirming purity of as-received particles. XRD spectrum of the nanocomposite (Figure 4c) demonstrates the successful embedding of WC in the Ni-P matrix, which, in turn, exhibits the typical amorphous microstructure of coatings with high phosphorus content. More detailed discussion of XRD spectra of Ni-P coatings will be given in Section 3.2.
The influence of WC nanoparticle concentration and deposition temperature on the manufacturing of nanocomposites was investigated, to uncover their effect on microstructural features (porosity, nanoparticle incorporation, and agglomeration, which are strongly dependent on the deposition parameters) and, consequently, microhardness.
Figure 5 shows the effects of nanoparticle concentration in the plating solution when deposition is performed at 90 °C. Figure 5a shows that plating rate increases with increasing the amount of WC in the bath. The increase in plating rate can be explained considering that conductive WC nanoparticles, with a small dimension and high surface to volume ratio, can act as an additional catalytic surface for deposition. Since nanoparticles can be easily adsorbed onto the substrate, they represent preferential nucleation sites that can reduce the activation energy for coating formation, thus accelerating deposition and leading to faster nanocomposite growth (i.e., higher coating thickness when depositing for the same time) [43,71]. Area fraction of embedded particles also increases with increasing WC concentration in the plating solution (Figure 5b). Such an increase, largely reported in literature in either the case of conductive or inert nanoparticles [43,72,73,74,75,76], can be explained by the impingement and settling mechanisms of particles incorporation [77,78]. This multi-step process involves the loose (and reversible) adsorption of nanoparticles onto the substrate and, given sufficient residence time, their permanent embedding in the growing Ni-P matrix. A higher concentration of WC in the plating solutions corresponds to a larger availability of nanoparticles near the substrate, with consequent higher probability of incorporation. Plating rate is also known to play a role in the yield of particle incorporation, since a fast-growing Ni-P matrix can reduce the minimum residence time onto the substrate required for embedding. However, the area fraction of incorporated particles does not linearly increase with WC concentration because of agglomeration phenomena taking place in the plating bath [79]. When the plating rate is sufficiently high, the superior enveloping capability can lead to the incorporation of big clusters of nanoparticles within the coating, as shown in Figure 5c, and to the higher formation of micro-voids (Figure 5d). It should be pointed out that the increase in coating porosity at a higher WC concentration cannot be ascribed to the incorporation of agglomerated nanoparticles only. Ni-P deposition reactions occur along with hydrogen evolution [80], and a too fast deposition rate may not allow the efficient removal of hydrogen bubbles, which remain trapped in the up-forming coating, thus increasing its porosity.
SEM-BSE cross-sectional micrographs of coatings deposited at 90 °C and reinforced with different concentration of WC are reported in Figure 6. All coatings were deposited for 90 min and the different thickness confirms the higher plating rate registered for increasing concentration of particles in solution. Indeed, the trend of nanoparticle incorporation quantitatively reported in Figure 5b is also well-represented by SEM micrographs, showing a clear increase in the amount of embedded nanoparticles for the concentrations of 1 g/L (Figure 6b) and 3 g/L of WC (Figure 6c). The increase in WC incorporation is less evident at higher concentrations, for which, conversely, agglomeration and porosity become more noticeable (Figure 6d–f, red arrows pointing at some of the bigger agglomerates). This behavior also suggests that 3 g/L concentration could be close to the steady state equilibrium, for which the number of particles approaching the substrate per unit time is comparable to the number of particles co-deposited in the coating [39,81].
Despite the high amount of area fraction of WC particles in the coating, the increased thickness of nanocomposites cannot be ascribed to the mere additional volume occupied by particles. Indeed, the increase in plating rate after WC introduction (>30% also for 1 g/L WC concentration compared with particle-free coatings) is considerably higher than the fraction of embedded particles (that reaches 19.7 A% when maximum of WC is added and plating rate increase is higher than 75%). It can be concluded that the increase in coating thickness with increasing concentration in the plating solution is the result of two mechanisms: (i) the progressively higher area fraction of nanoparticles present in the coating, which increase coating total volume (and, therefore, thickness) for equal volume of Ni-P matrix; (ii) the progressive increase in plating rate due to the catalytic activity of WC nanoparticles, which are active sites for deposition and, after being adsorbed on the substrate, can increase the amount of Ni-P matrix deposited for unit time (thus increasing overall coating thickness when deposition is performed for a fixed time, as in the case of this study).
To further verify the catalytic activity of WC, at the end of depositions containing 3 g/L of particles, the plating solution was filtered to isolate nanoparticles: the filtered nanoparticles were investigated by SEM and EDS analysis, as reported in Figure 7. Particles with two different gray shades can be identified by BSE compositional contrast, but EDS detects the presence of Ni and P on both. This also suggests that the not-embedded WC particles are partially coated by a Ni-P film, thus confirming that the carbide nanoparticles can effectively promote the nucleation of the metallic phase and accelerate coating growth. The differences in relative intensity between peaks suggest that darker particles have thicker Ni-P deposit and coverage does not proceed indistinctly on all particles.
The microhardness of coatings deposited at 90 °C with different concentrations of WC is reported in Figure 8. Despite the increase in embedded WC particles with increasing WC concentration in solution, maximum hardness value is registered after reinforcement with 5 g/L. The overall strengthening of particle-reinforced nanocomposite coatings depends on the synergistic effect of two contributions: (i) load bearing, that is expected to increase with increasing A% of the reinforcing phase [82,83]; and (ii) Orowan strengthening, whose contribution increases for decreasing size of well-dispersed reinforcing particles [84]. The presence of a big cluster of nanoparticles within the coating (i.e., high Na) detrimentally decreases efficiency of the Orowan strengthening mechanism, resulting in lower hardness despite the higher level of incorporation. Moreover, samples deposited at the higher WC concentrations exhibit an increase in the coating porosity, which compromises their structural integrity and causes local collapse upon indentation [37,85]. This effect might also be responsible for the high standard deviation highlighted in coatings reinforced with 5 g/L and 6 g/L of WC, which are characterized by the higher porosity.
Given the critical aspects that arise from the increased and uncontrolled deposition reactivity after WC nanoparticles addition, decreasing the deposition temperature was considered a promising strategy to increase control over deposition and to enhance the coatings quality. Using a fixed concentration of WC nanoparticles in the plating solution (equal to 3g/L), temperature was varied between 70 °C, 75 °C, 80 °C, 85 °C, and 90 °C. A concentration of 3 g/L was selected to continue the investigation since it combines a good microhardness increase and the best reproducibility of hardness measurements (i.e., lower standard deviation), probably because of the lower porosity and agglomeration issues in the coatings. Deposition at 65 °C was also investigated, but this temperature was not sufficient to overcome the activation energy for reactions to occur, and deposition could not be accomplished. Deposition at a temperature higher than 90 °C was also excluded from analysis since it would lead to poor bath stability, with too fast and uncontrolled reactions [50], and it would not be favorable for the scope of this work.
Results on plating rate and nanocomposite features as a function of deposition temperature are reported in Figure 9. Both plating rate and incorporation level increase with temperature (Figure 9a,b), as similarly observed in other studies [39,43,86,87]. Indeed, molecules require a certain amount of energy to react and, according to the collision theory, reaction rate increases with temperature. The maximum plating rate and WC A% is obtained at 90 °C, at which deposition mechanisms are presumably controlled by diffusion and particle transfer [88,89]. At lower temperatures, the rate controlling parameter is the activation of metal deposition, resulting in both slower deposition and decreased particle co-deposition. Nevertheless, particle agglomeration and porosity are notably reduced by deposition at a lower temperature (Figure 9c,d), with minimum values reached at 70 °C.
Differences in microstructural features according to the deposition temperature can be observed from high magnification SEM-BSE micrographs in Figure 10. Despite the fact that all coatings were manufactured with the same concentration of WC nanoparticles in the plating solution, nanocomposite characteristics appear clearly different: at 70 °C (Figure 10a), nanoparticles appear well-dispersed and distributed, with moderate porosity limited to the sub-micron size; conversely, agglomeration phenomena within the coating and overall porosity become more severe with increasing deposition temperature (Figure 10b–e). As previously discussed, their simultaneous increment can be mainly attributed to the faster plating rate, which enables the entrapment of bigger clusters but can generate a “shadowing” effect that creates voids around the shadowed areas in the proximity of agglomerates [90].
Reduced agglomeration and porosity in the nanocomposites have a direct beneficial effect on microhardness, as visible in Figure 11.
It can be concluded that 70 °C is the best deposition temperature to gain control over deposition and minimize the formation of defects that dramatically reduce strengthening effectiveness. Nevertheless, the area fraction of nanoparticles is relatively low at his temperature. Incorporation plays a key role in hardening and its increment, while keeping low agglomeration is crucial for the enhancement of properties [57,91,92]. To this aim, the effect of the increase in WC concentration up to 20 g/L (with deposition temperature 70 °C) was explored and results are reported in Figure 12. Plating rate increases with WC nanoparticles in solution (Figure 12a), but the slope of increment drastically decreases when concentration exceeds 10 g/L. This suggests that at 70 °C the supplied energy is not sufficiently high and, despite the high catalytic surface in solution, reaction rate is controlled by the activation of metal reduction, so that a further increase in WC nanoparticles does not remarkably influence plating rate. Figure 12b shows that the maximum of particle embedding is reached for 15 g/L concentration, after which agglomeration issues become severe and the incorporation yield drops. Similar results were largely reported in literature, either when dealing with WC [39] or other reinforcing particles [70,86,93,94,95]. Nanoparticles naturally tend to agglomerate to reduce their large surface energy, especially when they are present in high concentrations and interparticle distance is reduced [96,97]. Complete dispersion of WC is difficult to achieve by magnetic stirring only and agglomeration of particles in the plating solution invariably occurs and results in lower yield of incorporation. Yet, the slower plating rate obtained at 70 °C reduces entrapment capability and big clusters do not become embedded in the growing Ni-P matrix, with overall better dispersion of particles compared with deposition at higher temperatures (Figure 12c). A dramatic increase in porosity is observed when concentration is raised up to 15 g/L or higher (Figure 12d). This effect can be attributed to the extremely high quantity of particles in the vicinity of the substrate, which continuously undergo adsorption and desorption but cannot be irreversibly entrapped. Both shadowing and non-filling effects take place, since coating growth does not occur sufficiently fast to compete the filling of micro-voids that form around unburied WC particles [90]. According to the presented results, nanocomposites deposited with a particle concentration of 6.5 g/L and 10 g/L seem to exhibit the best compromise of incorporation, particle dispersion, and porosity.
Cross-sectional micrographs of composite coatings produced at 70 °C with different concentrations of WC nanoparticle are reported in Figure 13. A progressive increase in porosity and agglomeration can be observed for increasing WC concentration, giving an accurate visual representation of the features quantitatively evaluated in Figure 12. Results are further confirmed by microhardness measurements in Figure 14, where 6.5 g/L and 10 g/L samples are characterized by the higher hardness with comparable values. For coatings with higher nanoparticle concentration, the high levels of agglomeration and porosity lead to a less effective strengthening.
From the presented results, it is evident that both WC concentration and temperature have a major influence on the mechanisms of co-deposition and, consequently, on nanocomposite microstructural features (A% of particles, Na, and porosity) affecting the microhardness. Therefore, the combined effect of these two parameters on coating hardness was investigated by fitting the experimental data from temperature–concentration pairs in Table 2 with a surface having the form H V 50 = f ( T ,   W C c o n c e n t r a t i o n ) . The interpolation method used for computation is the biharmonic spline (MATLAB® 4), which corresponds to a linear combination of Green’s functions centered at each data point and is typically employed when data points are irregularly spaced. The interpolating surface reported in Figure 15 shows that optimized hardness can be obtained for deposition at 70 °C and WC concentration 7.7 g/L and it is expected to be equal to 728 HV50. This value is very similar to the one obtained using 6.5 g/L (718 HV50), especially when considering the standard deviation of measures. Therefore, further characterization of coating properties was conducted on coatings manufactured at 70 °C with 6.5 g/L of WC nanoparticles in plating solution, which can be considered the optimized deposition conditions. These coatings will be referred to as Ni-P-WC(70-6.5).

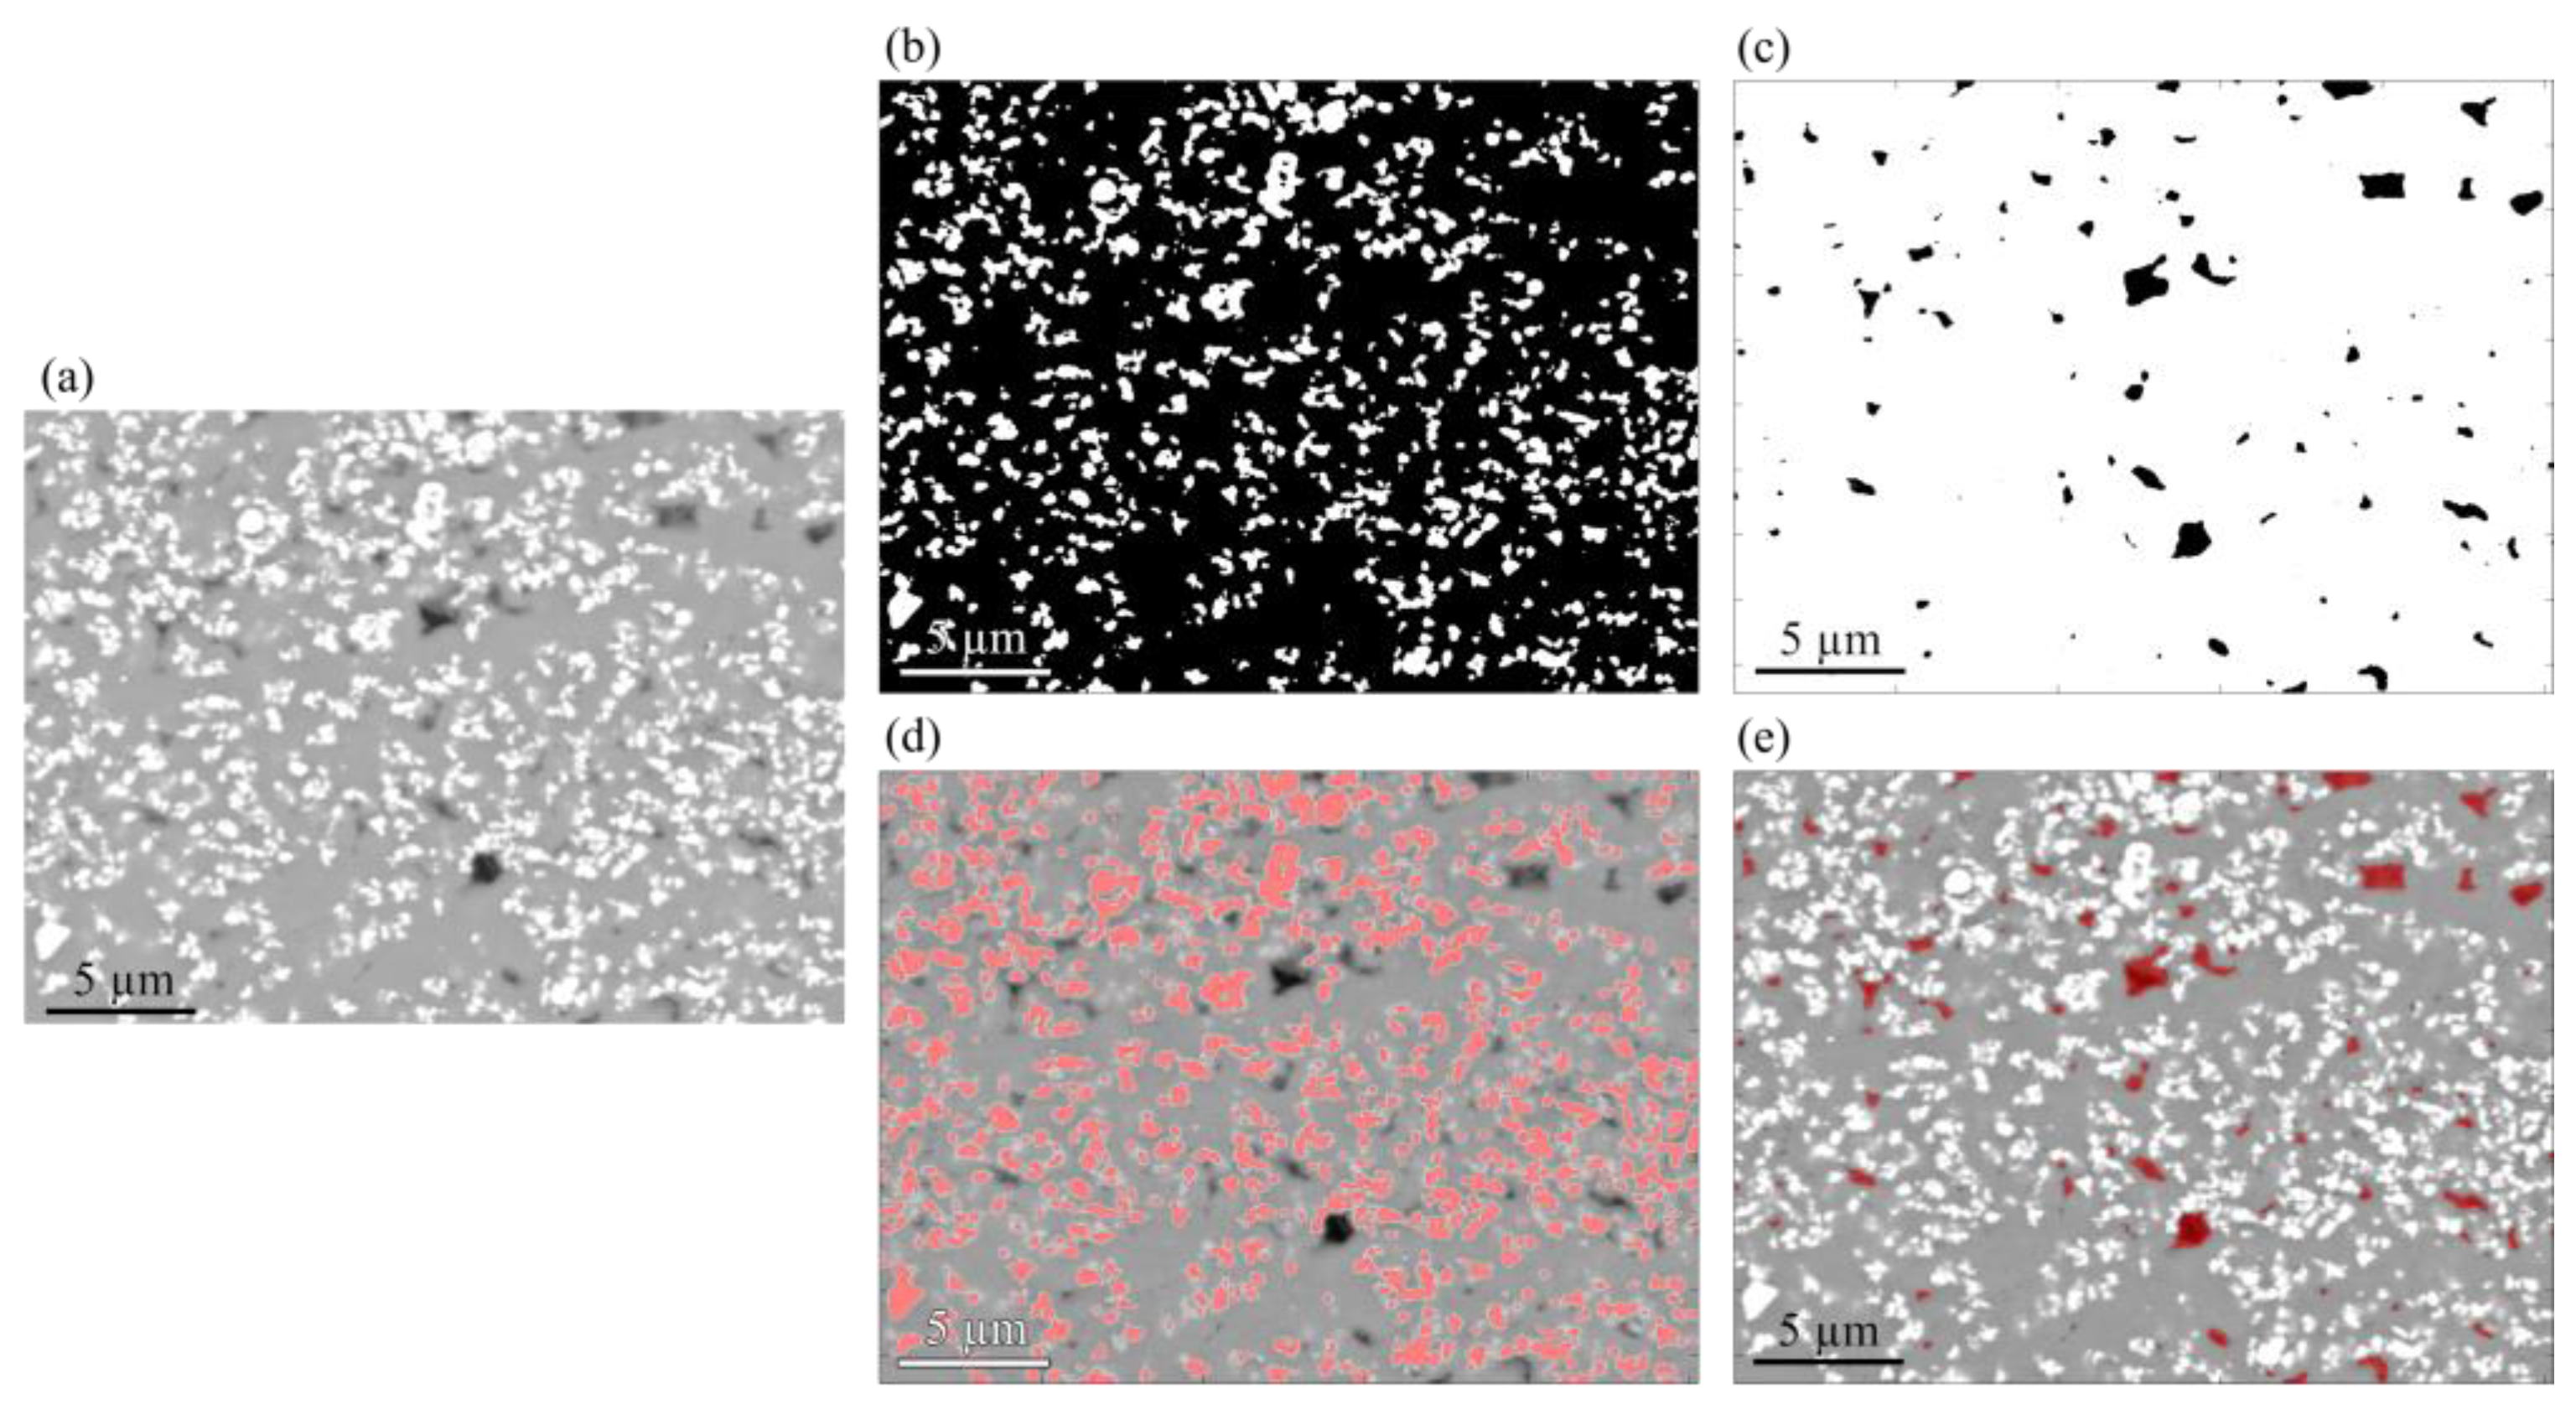
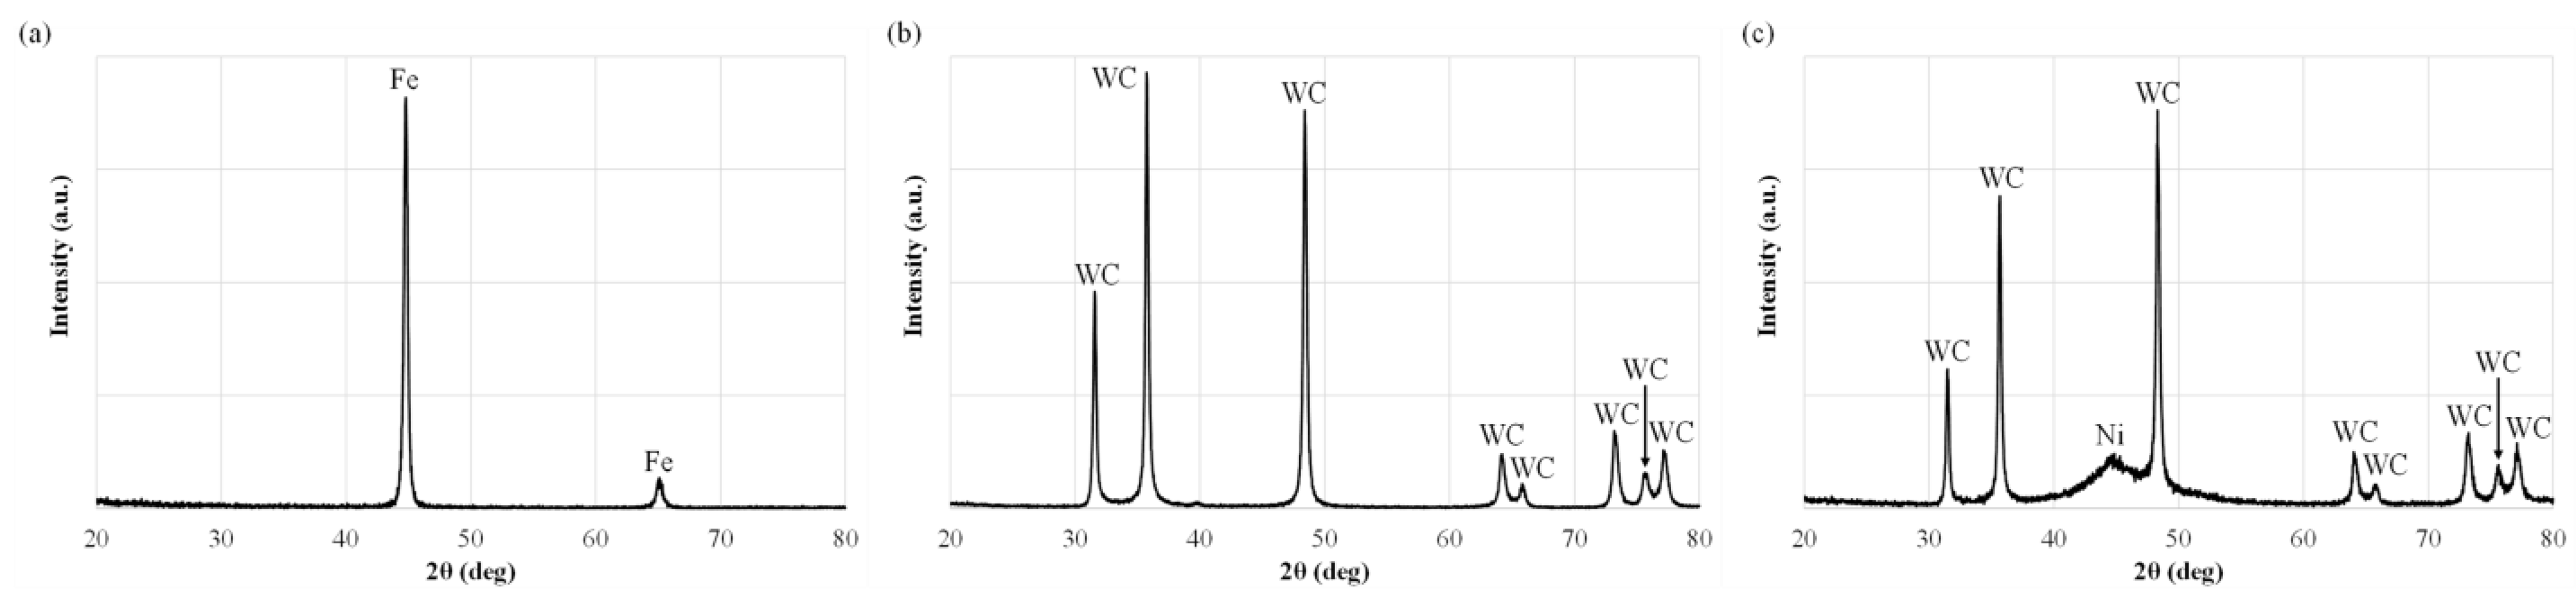
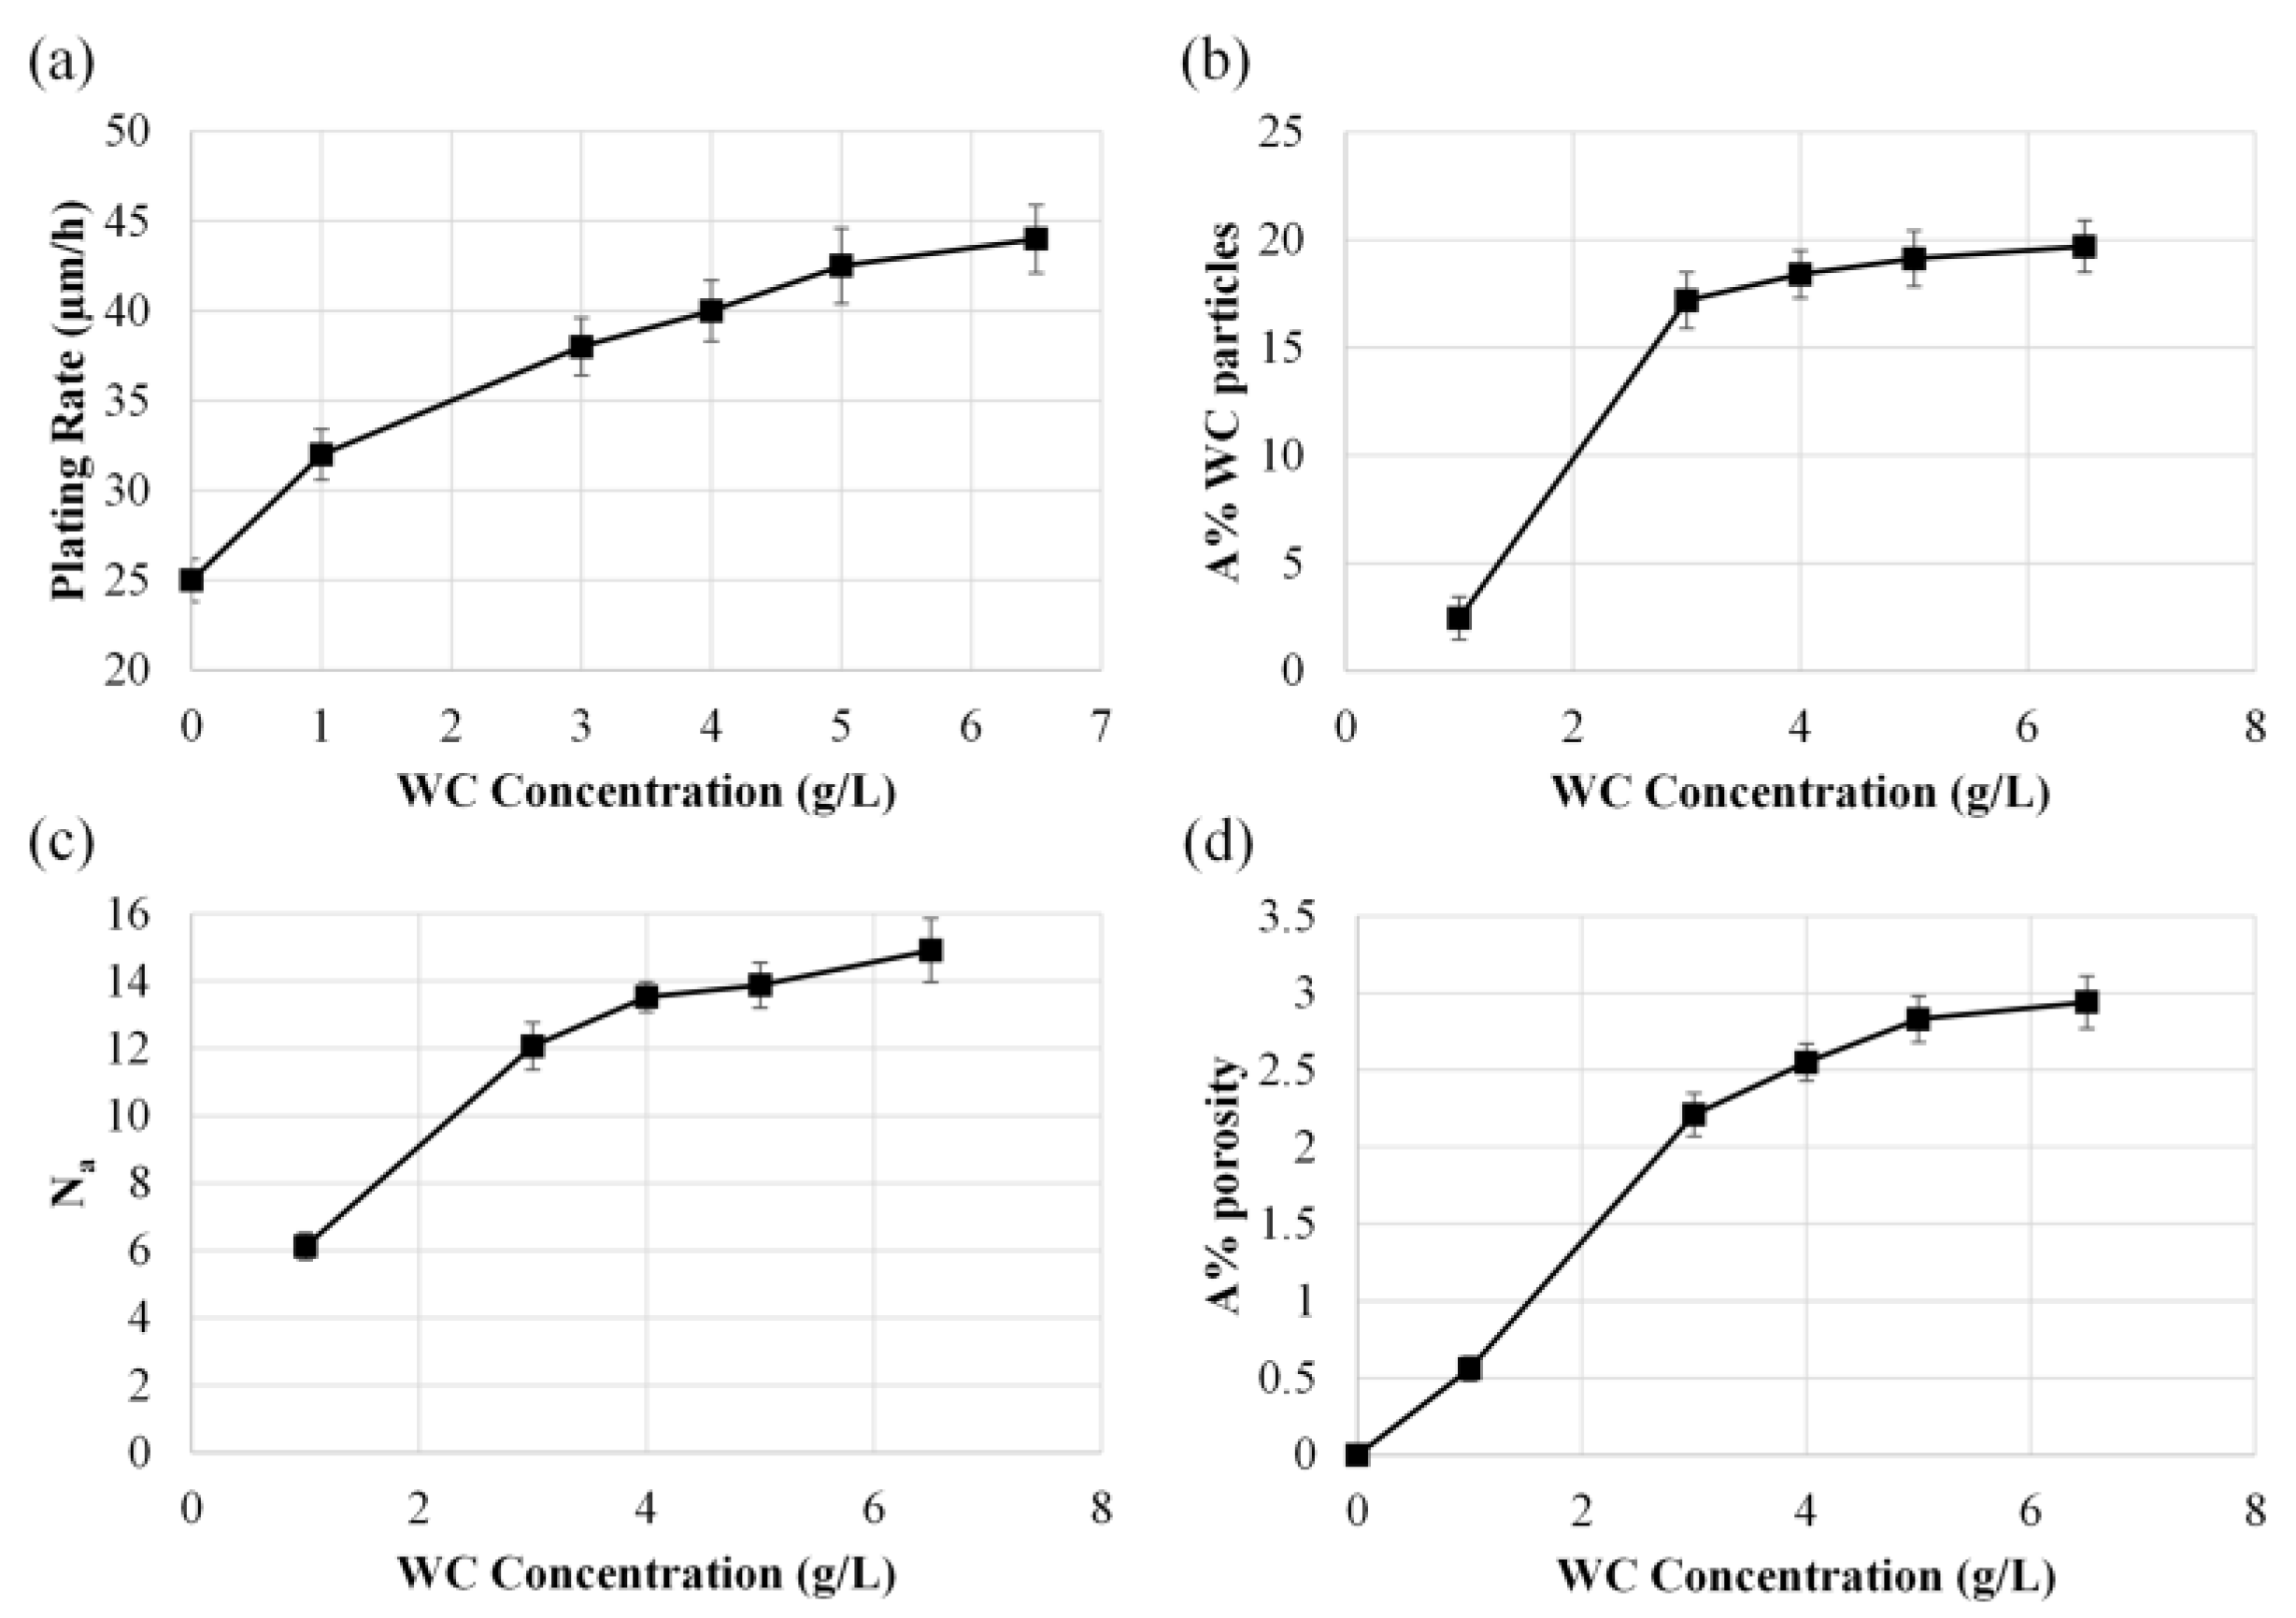
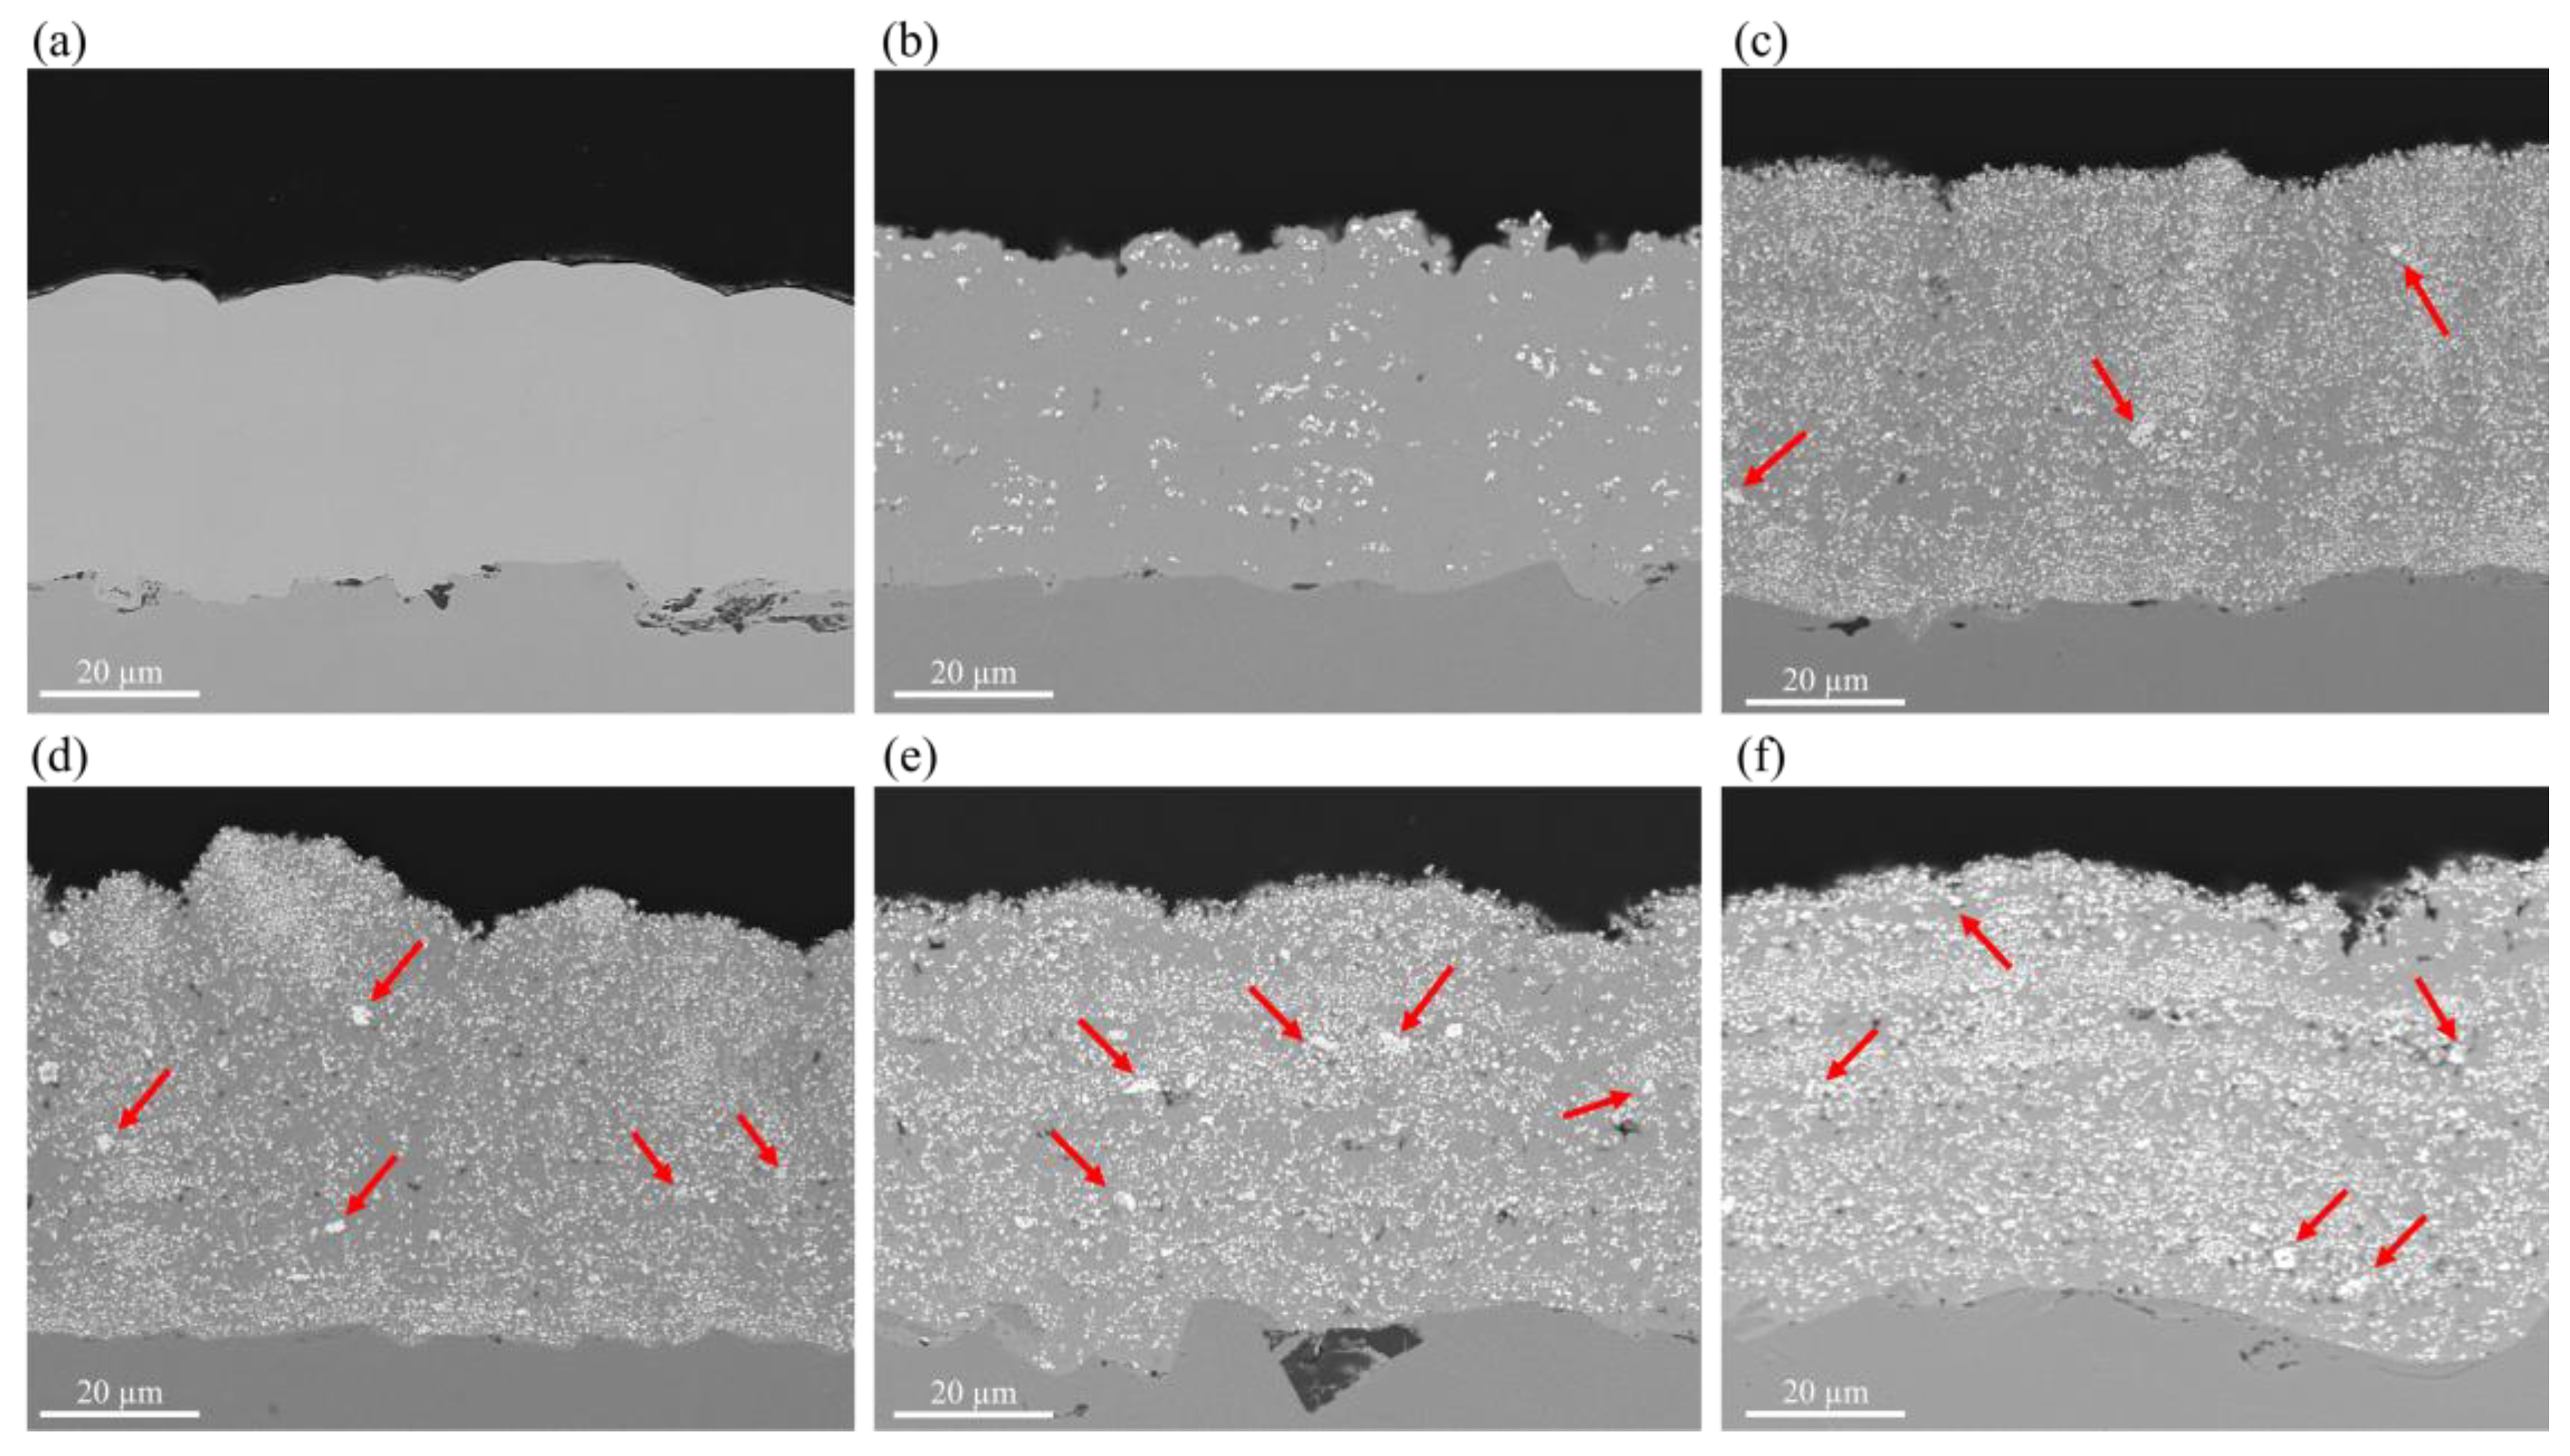
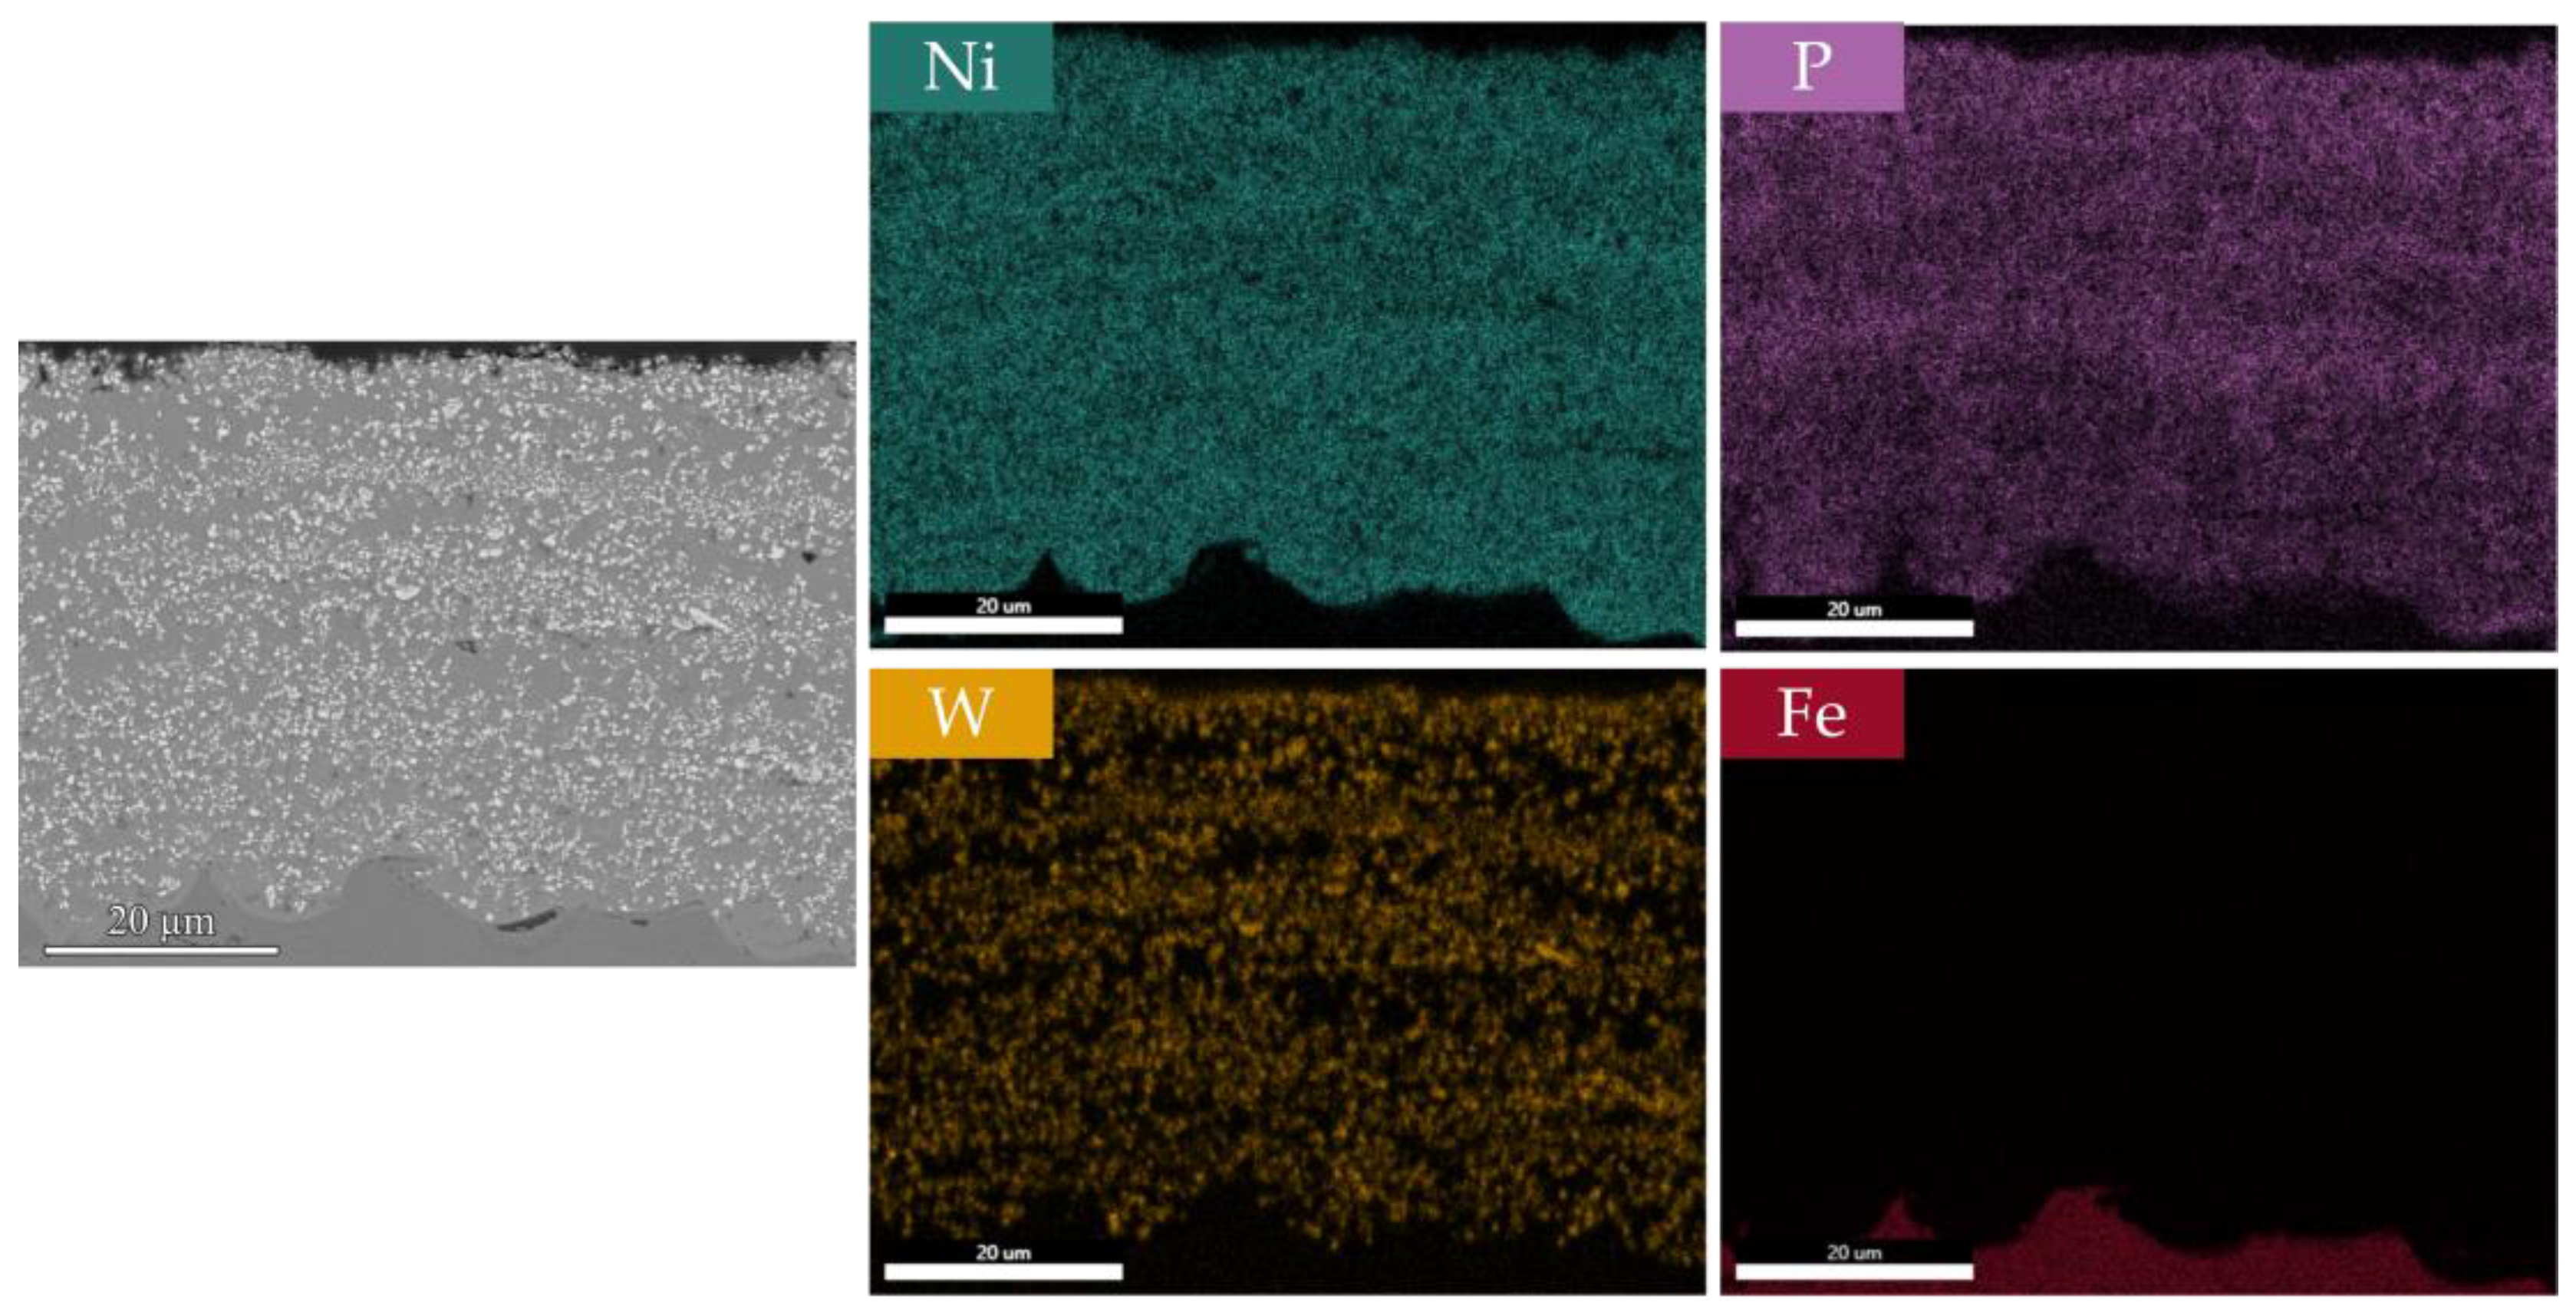
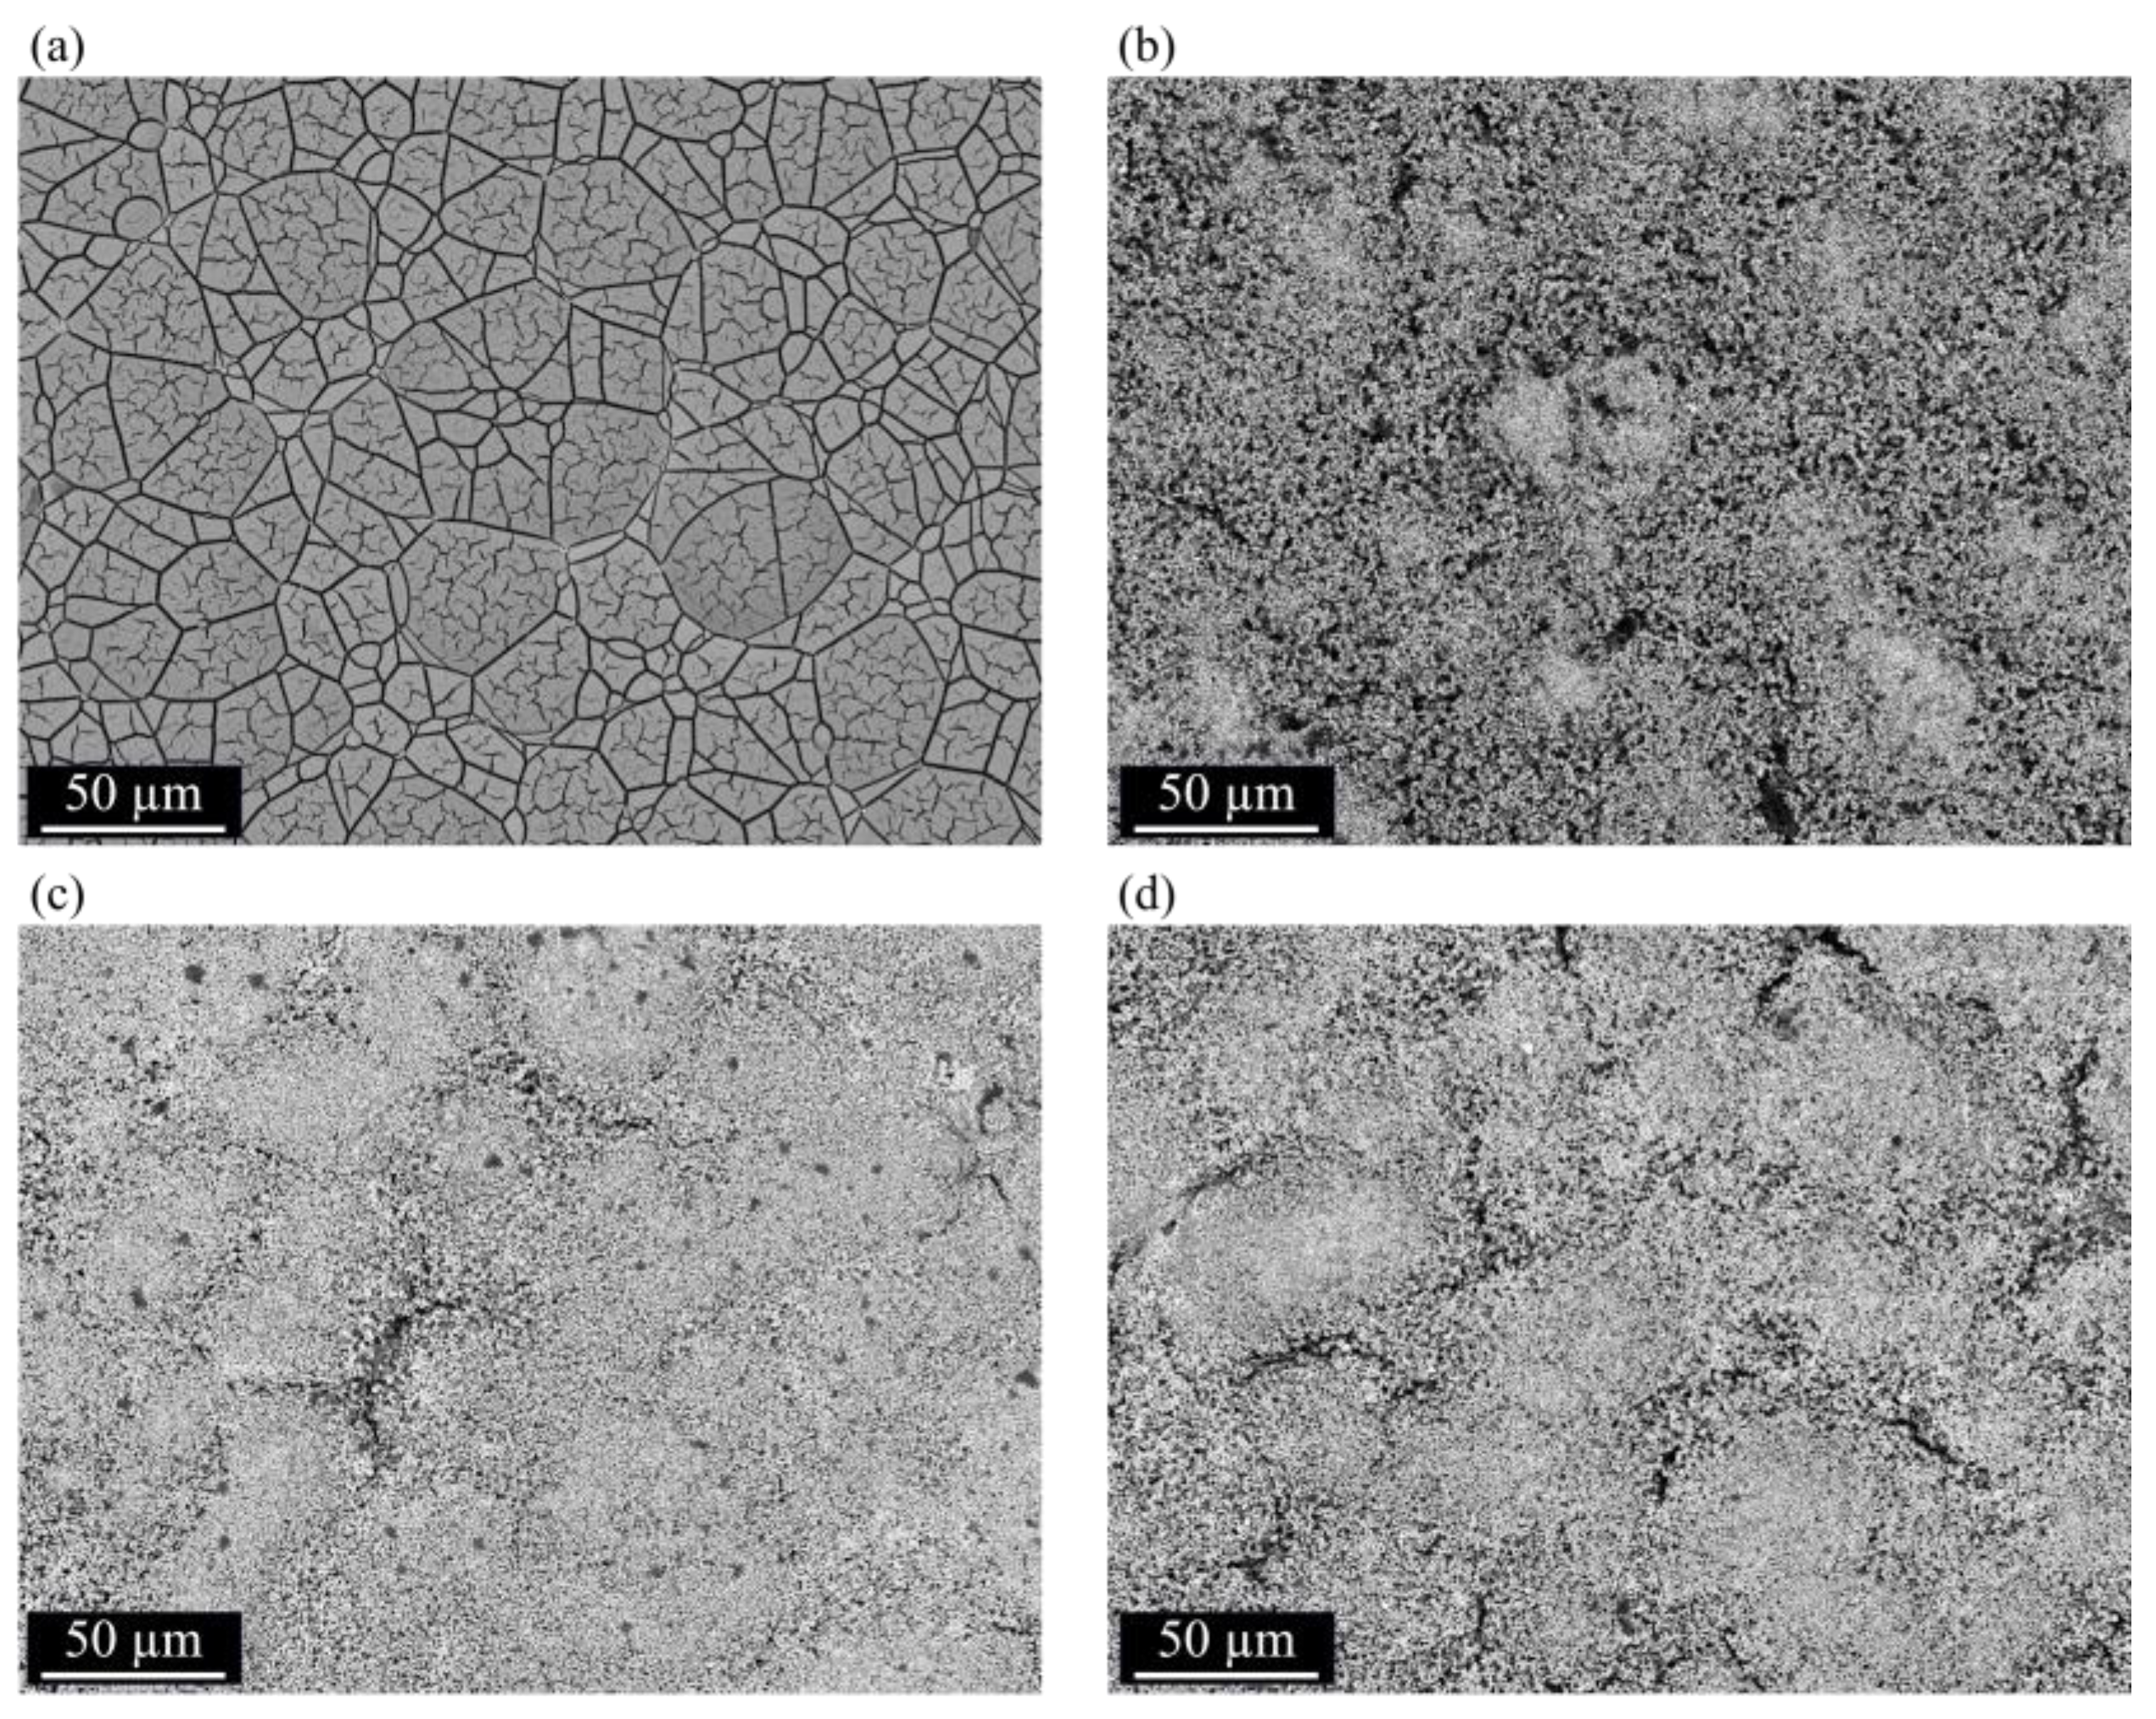
3.2. Surface Morphology, EDS Analysis, and Crystalline Structure

Figure 16 shows the surface morphology of sandblasted F22 steel substrate before deposition (Figure 16a), standard Ni-P coatings (Figure 16b), nanocomposites reinforced with 1 g/L of WC (Figure 16c) deposited at 90 °C, and nanocomposites reinforced with 6.5 g/L of WC (Figure 16d) deposited at 70 °C. All coatings exhibit the nodular microstructure typical of electroless Ni-P coatings, which is primarily attributed to the growth mechanism of this category of coatings. Deposition preferentially starts at catalytic sites with high surface energy and, after nucleation has begun, autocatalytic reduction of metal ions leads to the growth and coalescence process that gives rise to the nodular morphology [98]. Clusters of agglomerated WC particles can be observed on the surface of nanocomposite coatings, which also exhibit a more refined morphology compared with standard Ni-P. The considerably smaller size of nodules on WC-reinforced coatings can be ascribed to two mechanisms: (i) nanoparticle incorporation during coating growth can limit lateral growth of single nodules, restraining their dimension [99,100]; (ii) conductive WC nanoparticles can act as additional catalytic sites for deposition [32,45,101], thus increasing nucleation phenomena that lead to the formation of a higher number of nodules with smaller dimension. When concentration of WC particles in the plating solution is increased, the amount of WC clusters adsorbed on the surface is higher, and nanoparticles appear uniformly distributed. Nodular refinement also becomes more evident for increasing WC concentration, since nuclei with progressively smaller size can be observed under the layer of adsorbed particles (Figure 16c,d). This agrees with literature results, where it is often reported that incorporation of both inert or conductive nanoparticles in the Ni-P matrix modifies surface finish in terms of visual appearance and surface roughness, to an extent that depends on nanoparticle incorporation, size, and shape [32,73,102]. Figure 17 shows the surface morphology of Ni-P coating and Ni-P-WC coating (6.5 g/L at 70 °C) obtained by profilometry in a scan area of 1 mm × 1 mm. The nodular morphology of Ni-P coatings can be observed in Figure 17a, with nodules of different dimensions randomly distributed across the surface and an average roughness Ra = 5.074 µm. Severe roughness reduction (Ra = 1.648 µm) is observed after incorporation of WC nanoparticles, as shown is Figure 17b. The surface of the nanocomposite coating is covered with WC particles and morphological features are reduced in size, resulting in an overall flattening effect of the surface.
Composition of Ni-P-WC(70-6.5) nanocomposites along coating depth was investigated by EDS. The EDS map reported in Figure 18 shows a uniform P content across coating thickness. According to EDS quantitative analysis, the Ni/P weight ratio is equal to 7.40, compatible with coatings with a high P content. The calculated W amount is equal to 34.86 wt.%: however, this quantity can only be considered indicative due to the relatively high interaction volume of EDS scanning. EDS resolution is commonly limited to 1 micrometer laterally and 1–2 μm in depth for Ni-P specimen at an accelerating voltage of 15–20 kV [103,104]. Therefore, WC nanoparticles cannot be precisely identified, and the recorded W signal also comes from particles that lay under the actual plane of cross-sectional analysis.
The effect of WC introduction on the microstructure of Ni-P high phosphorus coatings was investigated by XRD. Analysis was performed on standard Ni-P coatings, and optimized Ni-P-WC(70-6.5) nanocomposites and XRD spectra are reported in Figure 19: both coatings are characterized by an amorphous matrix, with a single broad peak attributed to Ni (111) located at 2θ = 35°–55°. This is coherent with the expected amorphous microstructure of Ni coatings containing ≈11 wt.% of P [105,106], where Ni lattice is strongly distorted by the high P content located in interstitial positions. Well-defined peaks corresponding to the WC phase (JCPDS 73-0471) are present in the nanocomposite spectrum, confirming particle embedding in the Ni-P matrix. A decrease in relative intensity of the Ni peak can be observed after the nanoparticles’ introduction, suggesting that the WC effect of promoting nucleation phenomena also hinders the growth of Ni clusters, resulting in a finer grain size. Similar results have been observed in literature as a result of the catalytic activity of nanoparticles, which promote nucleation of new grains at the expense of their growth [6,100,107].

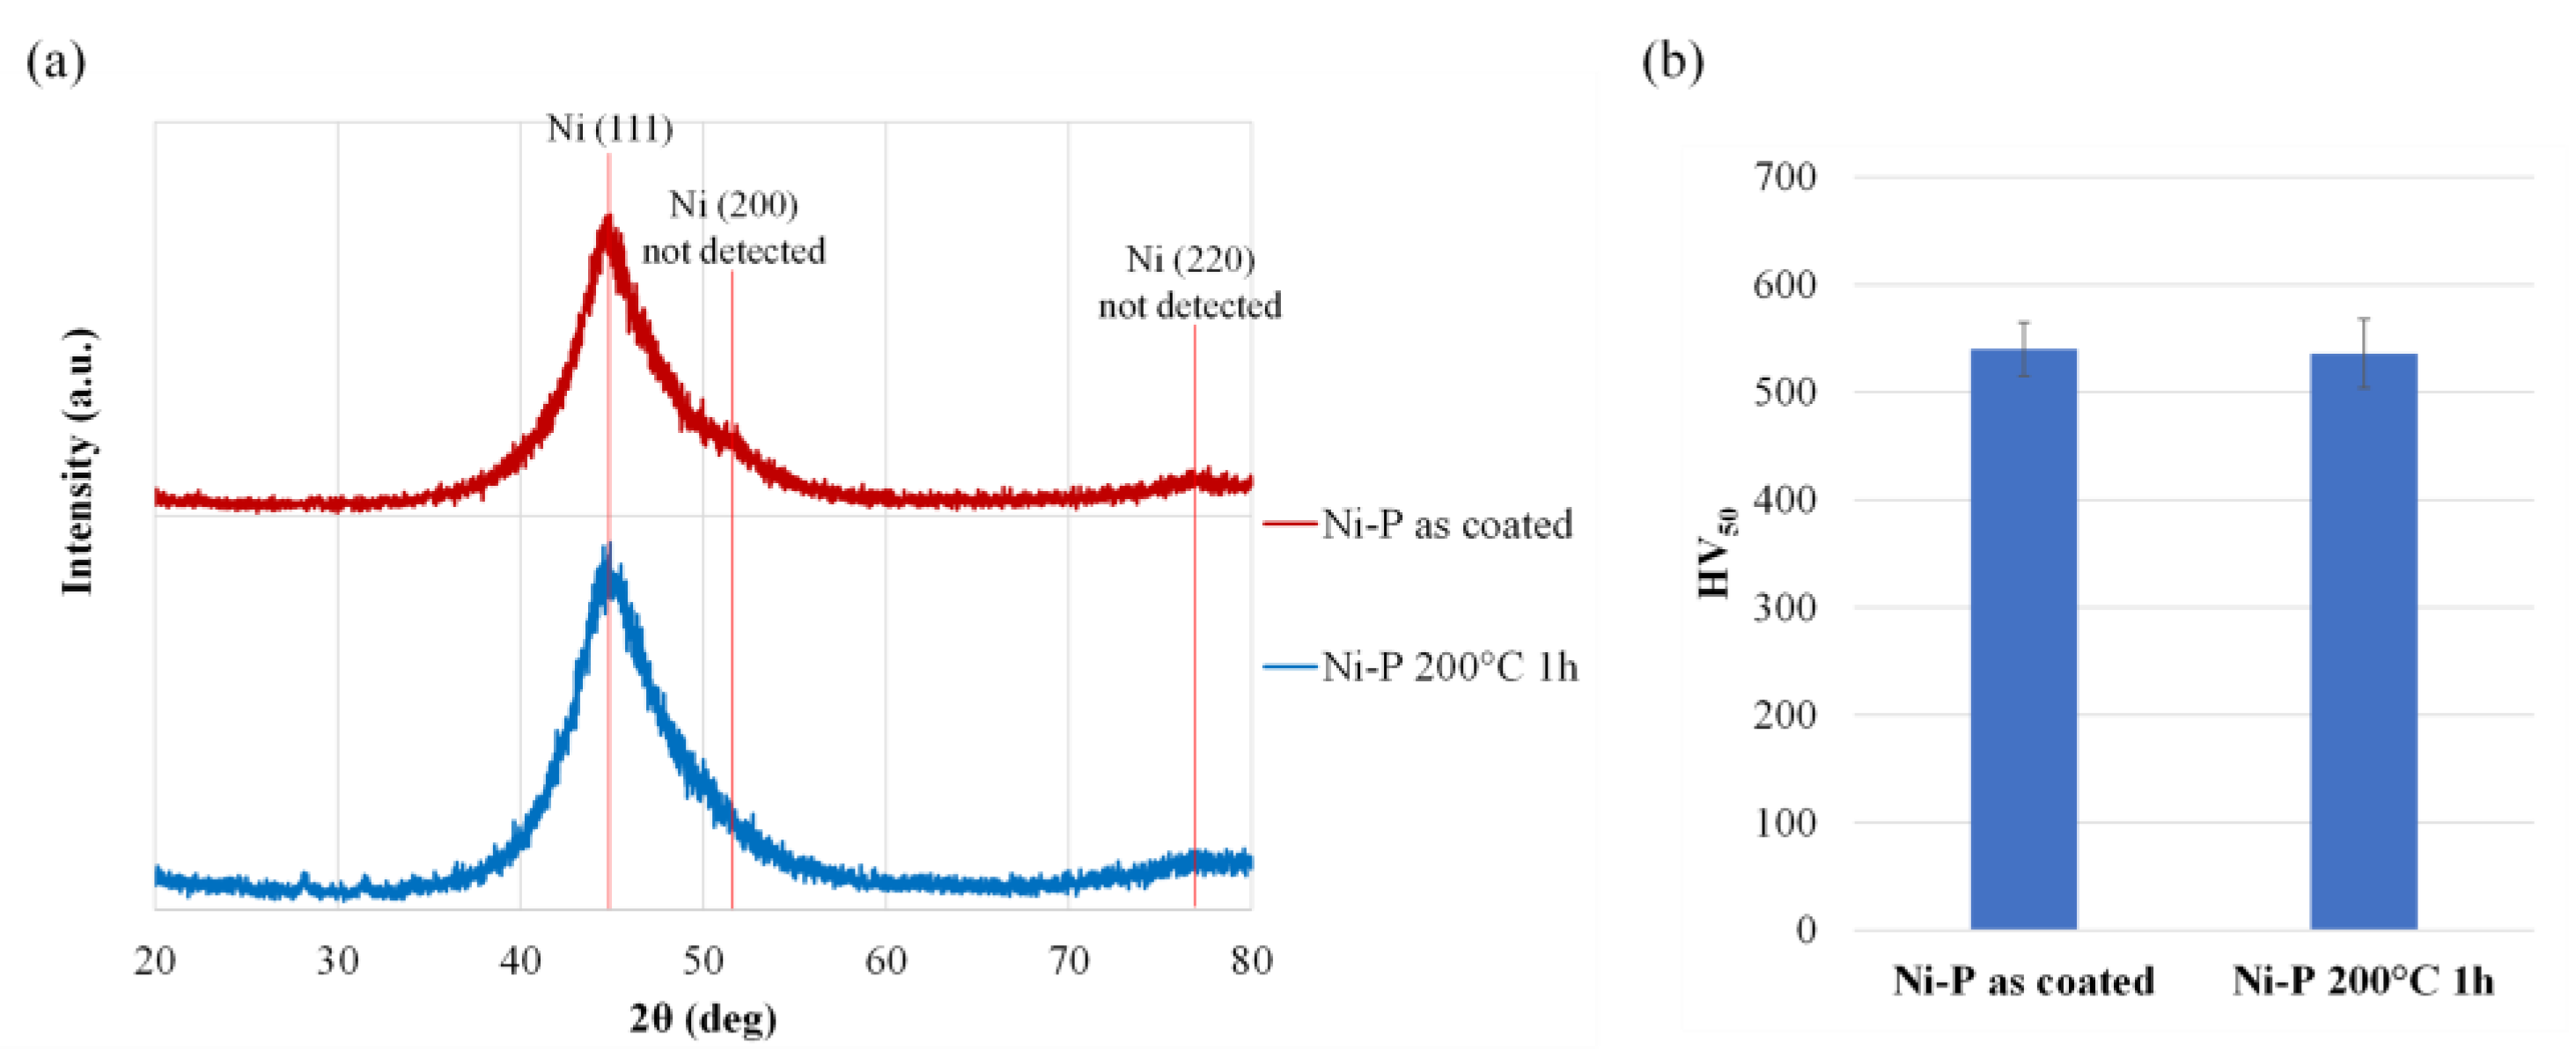
3.3. Thermal Treatments

Properties of Ni-P coatings can be further enhanced by post-deposition heat treatments, which induce changes in crystalline structure and phase composition. Nonetheless, the introduction of a second-phase reinforcement can influence the crystallization behavior of coatings. To investigate the effect of WC nanoparticles on the crystallographic modifications induced by annealing, thermal treatments at 200 °C for 2 h and 400 °C for 1 h were performed on optimized Ni-P-WC(70-6.5) nanocomposites and on standard Ni-P coatings. The comparison between XRD spectra after each heat treatment schedule is reported in Figure 20a and Figure 20b, respectively. Deposition of electroless Ni-P occurs along with H2 production, as a byproduct of H2PO2- oxidation [62]. Some H2 invariably remains trapped within the coating during its growth and considerably embrittle the material, thus reducing its wear resistance [61]. The heat treatment at 200 °C for 2 h was performed to dehydrogenate the samples, reduce hydrogen embrittlement phenomena [23,60], and release coating growth stresses. In this case, no substantial changes can be observed from XRD spectra compared to the as-coated condition and no phosphide phases can be detected, thus indicating the persistence of the super saturated solid solution of phosphorus in nickel. Nevertheless, an increase in Ni(111) peak intensity compared with the as-coated condition can be observed for unreinforced coatings, together with the initial appearance of Ni(200) at angular position 2θ = 51°–54°. These changes, which indicate initial grain growth and crystallization of the matrix, cannot be obviously observed in the case of Ni-P-WC(70-6.5), whose spectrum is unaltered from the as-coated. After annealing at 400 °C for 1 h, crystallization of Ni (JPCDS 03-1051) and precipitation of Ni3P phases (JPCDS 65-2778) occur in both standard and nanocomposite coatings. The mean crystallite size of Ni and Ni3P after treatment at 400 °C, calculated using the Scherrer equation (Equation (1)) are reported in Table 3: in this case, Ni grains of standard and nanocomposite coatings exhibit comparable dimensions, whereas finer Ni3P precipitates are present in nanocomposites. The superimposition of spectra reported in Figure 20c (2θ range 40°–55°) also reveals peak shifting, indicating a variation in lattice parameters of the unit cell. After finding similar results upon introduction of Si3N4 nanoparticles, Dhakal et al. [108] proposed that the different crystallization behavior between standard Ni-P and nanocomposites could be ascribed to nanoparticles, which induce strain and variations in lattice parameters and, in turn, constrain grain growth. In particle-free coatings, growth of Ni and Ni3P phases occurs by the diffusion and free re-arrangement of Ni and P atoms; conversely, when nanoparticles are incorporated, they can act as a barrier to grain coarsening and exert stresses that act against initial Ni and Ni3P growth.
All coatings, both in as-coated and heat-treated conditions, were successfully tested negative to the Ferroxyl reagent test. This confirms the absence of through the thickness defects, which could result from both nanoparticle introduction and stresses induced by microstructural changes.
The microhardness of coatings subjected to heat treatments is reported in Figure 21. Maximum hardness is registered after annealing at 400 °C for 1 h due to the combined effect of grain coarsening, which grows above the critical size of the Hall–Patch equation, and Ni3P precipitation strengthening [28]. After annealing at 200 °C for 2 h, unreinforced coatings exhibit a higher microhardness increase (+21% versus as-coated) compared with nanocomposite (+6.5% versus as-coated). This agrees with results of XRD analysis, in which initial crystallization could be observed for standard Ni-P but not for nanocomposite. Indeed, up to treatment at 200 °C for 2 h, coatings are characterized by grain size below 5 nm and deformation processes are governed by grain boundary sliding and rotation [109]. In these conditions, grain growth induced by heat treatments leads to hardness increase according to the reverse Hall–Patch behavior [26,110] and its hampering by the incorporation of nanoparticles reduces the hardness increment. Nonetheless, in all cases nanocomposites exhibit enhanced microhardness compared with standard Ni-P coatings, confirming the effective dispersion hardening effect of nanoparticles. The simultaneous mechanisms of load bearing and Orowan strengthening [41,83,84] by nanoparticles can act in synergy with microstructural evolution induced by heat treatment, so that WC-reinforced nanocomposites exhibit a maximum microhardness increase of +75%, whereas only +55% can be obtained for standard particle-free Ni-P coatings.

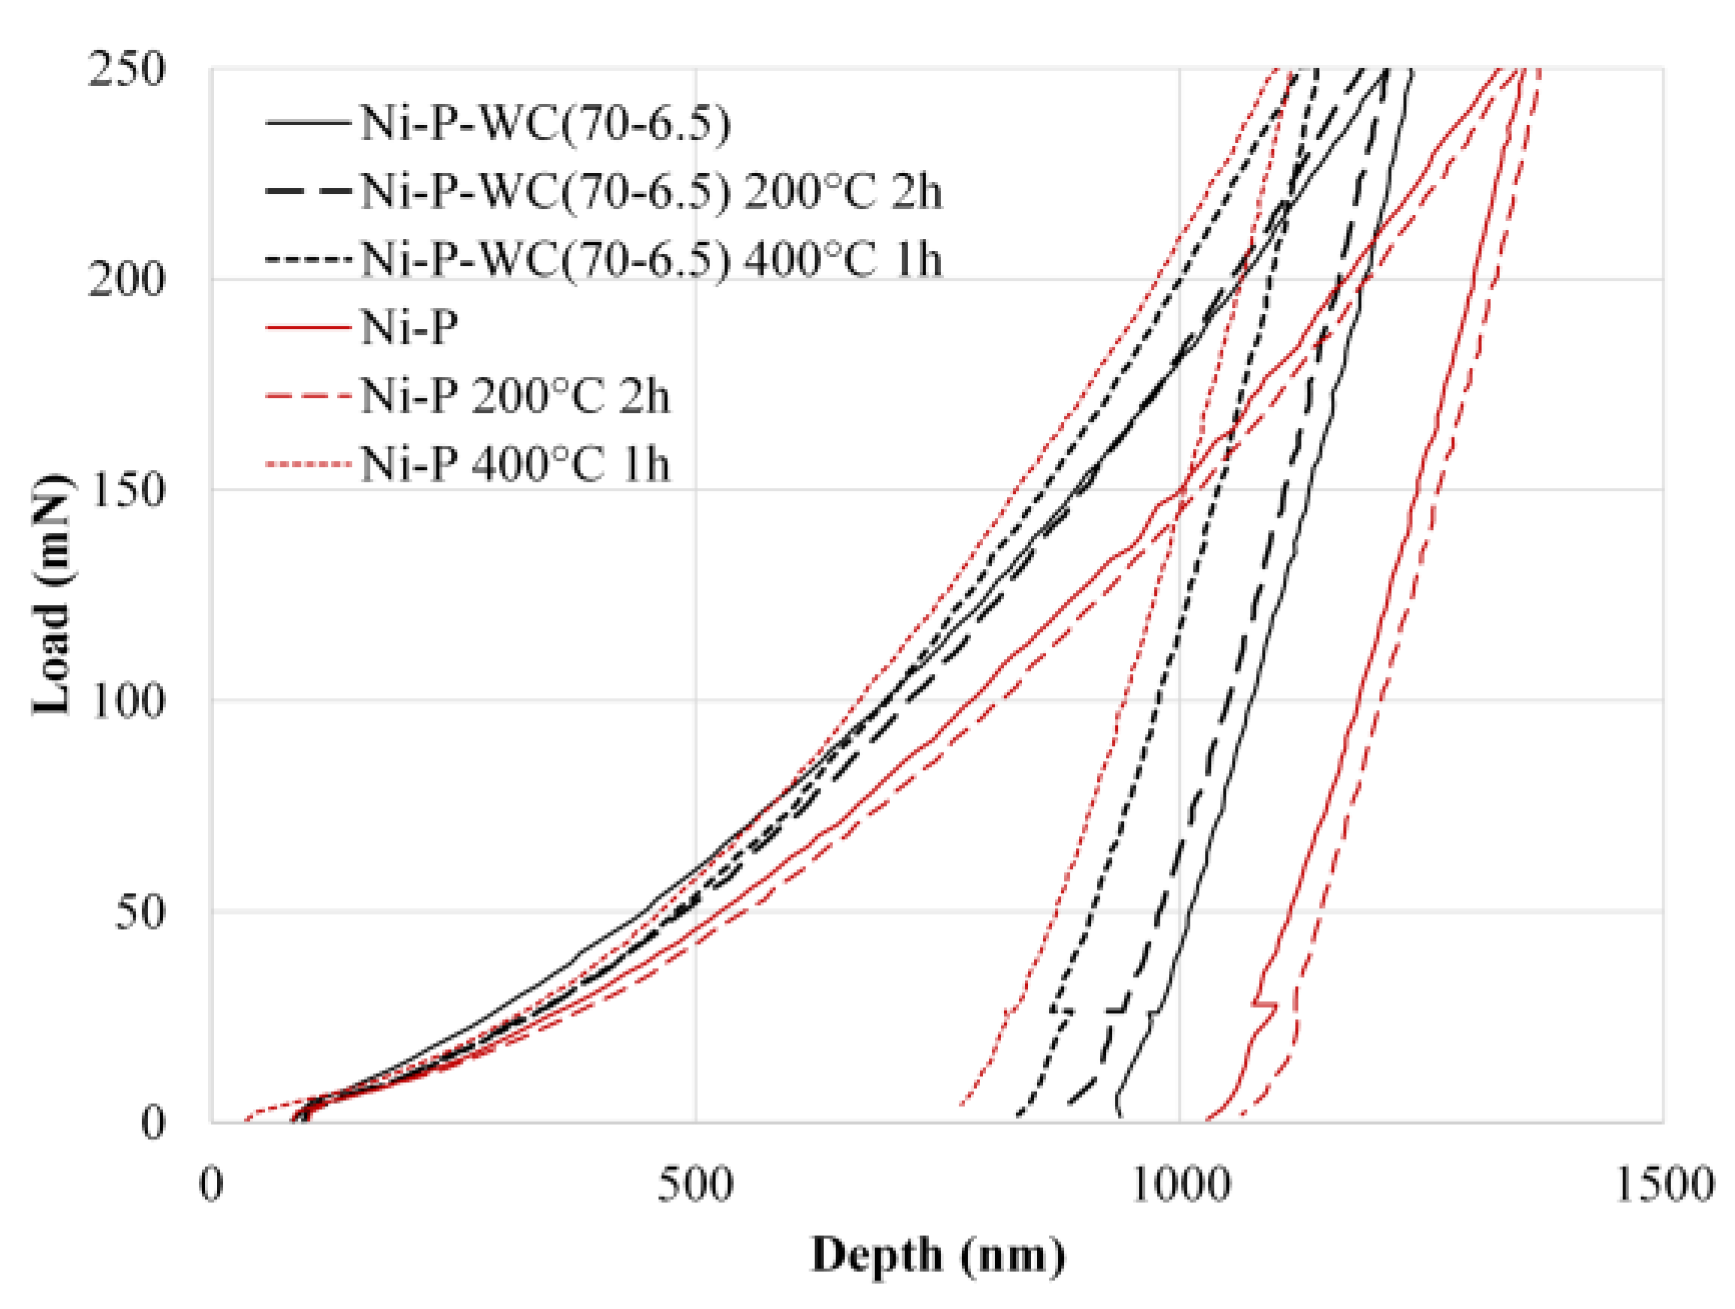
3.4. Instrumented Indentation

Mechanical properties (hardness (H) and Young’s modulus (E)) of coatings were assessed by instrumented indentation. Hardness calculated by instrumented indentation using the Berkovich tip can complement Vickers microhardness, since the lower load employed in the test allows for the assessment of coating properties with a lower influence of defects and accounts for the elastic deflection of material during indentation. Moreover, indexes describing the mechanical behavior of coatings can be extrapolated by the ratio between H and E [111], as will be further discussed in the text.
The load–displacement curves of both standard Ni-P coating and Ni-P-WC(70-6.5) nanocomposites in the as-coated condition and after heat treatments are reported in Figure 22. Hardness and Young’s modulus calculated at 250 mN are listed in Table 4. Results clearly show that the introduction of WC particles leads to both higher hardness (in accordance with the Vickers microhardness test described in Section 3.2) and an increase in the elastic modulus of coatings. A stiffening effect can also be observed after heat treatment, in accordance with existing literature results [112]. Indeed, the increment in Young’s modulus can occur as a consequence of both microstrain induced by nanoparticle dispersion, which can cause variations in lattice parameters of Ni and Ni3P crystals, and microstructural changes by heat treatments [108,112]. Despite that, similar stiffness values are obtained for particle-free and nanocomposite coatings after heat treatment at 400 °C for 1 h, suggesting that a stiffness increase induced by microstructural changes prevails after annealing above the crystallization temperature and the effect of nanoparticle introduction becomes negligible.
According to the work by Leyland and Matthews [113], the H/E ratio is a significant parameter to preliminarily assess wear resistance of coatings, which increases for higher H/E values. From Table 4, it can be observed that the H/E ratio of coatings increases with an increasing temperature of heat treatment, and nanoparticle incorporation further enhances this effect. It should be noted that the H/E ratio of as-coated nanocomposites is higher than that of standard coatings after annealing at 200 °C for 2 h, despite the higher crystallinity of the latter. This can indicate that the manufacturing of WC-reinforced Ni-P coatings can be a good strategy to improve wear resistance.

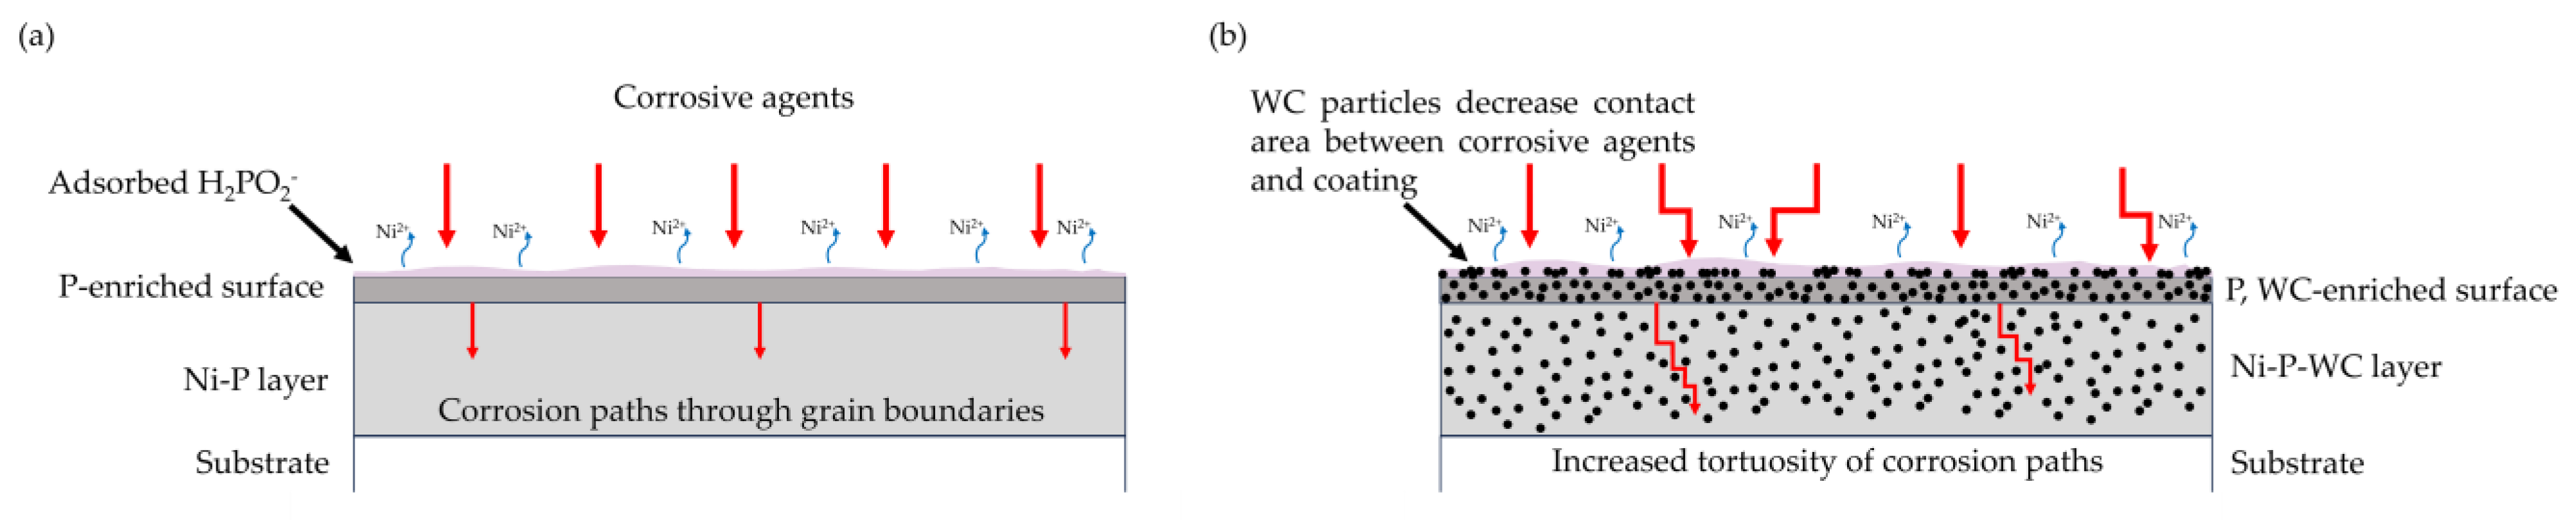
3.5. Potentiodynamic Polarization Test

The effect of WC incorporation and heat treatment on the corrosion resistance of Ni-P coatings was investigated by the potentiodynamic polarization test in 3.5 wt.% NaCl solution. Curves of standard Ni-P and Ni-P-WC(70-6.5) nanocomposites in the as-coated conditions, heat treated at 200 °C for 2 h and at 400 °C for 1 h, are reported in Figure 23. Corrosion parameters were calculated in the linear branch of curves (where active dissolution of nickel occurs) by the Tafel extrapolation method and are listed in Table 5. Corrosion resistance of Ni-P coatings depends on the initial preferential dissolution of Ni in the corrosive medium, leading to a P enrichment of coating surface; this phenomenon promotes the formation of a layer of elemental P at the external interface (≈1 nm thickness [92]), which hinders further dissolution nickel, and the local formation of NixPy phases in the coating bulk, which are able to slow down the diffusion of corrosive agents toward inner layers [114]. In addition, the P-enriched surface preferentially reacts with water to form a layer of adsorbed hypophosphite ions (H2PO2) that block water penetration and prevent nickel dissolution by chemical passivity [41,92]. The introduction of WC nanoparticles lead to a positive shift in the corrosion potential and to lower corrosion current density, indicating better protective behavior. This can be explained by the presence of WC nanoparticles on the coating surface, which are inert and act as a physical barrier to the penetration of corrosive agents, minimizing the contact area between the solution and the alloy [41,42]. Moreover, particles can also act as obstacles to the formation of corrosion paths, increasing their tortuosity and, consequently, the energy required for their propagation, thus improving corrosion resistance. A schematic representation of enhanced corrosion resistance mechanisms provided by the introduction of WC nanoparticles is reported in Figure 24.
Heat-treated samples exhibit even better corrosion-resistance properties, with higher (i.e., more positive) Ecorr and reduced Icorr for increasing temperature of heat treatment. After annealing at 200 °C for 2 h, improved corrosion resistance can be due to the slight densification of coatings that reduces porosity [115]. Even better corrosion resistance, which manifested after treatment at 400 °C for 1 h, can be ascribed to both densification and even precipitation of Ni3P phases, which enhances pseudo-passive behavior and favors the formation of the P-rich surface layer [42,96,116,117]. The presence of Ni3P might produce Ni/Ni3P active–passive corrosion cells where nickel acts as the anode and is preferentially dissolved at OCP, leading to accelerated P enrichment and to a positive shift in the corrosion potential. Moreover, grain growth registered at this temperature reduces grain boundaries and increases corrosion resistance [118]. The improved behavior of WC-reinforced nanocomposites also confirms the absence of defects extending to the substrate and the suitability of these coatings for harsh environment applications.
To better understand the different coatings’ behavior in corrosion tests, Figure 25 reports SEM-BSE micrographs collected after potentiodynamic tests. The polarization curve of standard Ni-P coatings exhibits a more rapid increase in corrosion current density when approaching more positive potentials. This indicates the onset of localized corrosion [119], which takes place through the formation of intergranular paths, as shown in Figure 25a. Differently, the curve of the nanocomposite coating exhibits a pseudo-passive behavior after the active region. Figure 25b shows that co-deposited particles effectively act as a barrier to the growth of corrosion paths and no sign of localized corrosion can be observed. Similar behavior can be noted for nanocomposites heat treated at 200 °C for 2 h (Figure 25c), which exhibit a compact morphology, although early signs of preferential corrosion at intergranular positions can be spotted. This difference can be imputed to the initial grain growth and crystallization that occurs after annealing. Conversely, the morphology of samples thermally treated at 400 °C shows evident effects of crystallization and intergranular paths of localized corrosion become visible (Figure 25d). This agrees with the initial change in slope that can be detected from the potentiodynamic polarization curve at potential higher that +0.2 V vs. SCE. Eventually, all samples resulted negative to the Ferroxyl reagent test, excluding the onset of substrate corrosion, and no corrosion products were detected by EDS analysis.

4. Conclusions

The optimal combination of WC concentration and deposition temperature was determined by quantitatively assessing nanocomposite characteristics and their impact on coating properties. It was demonstrated that WC nanoparticles act as nucleation sites for Ni-P deposition and higher WC concentration in the plating solution leads to increased plating rates and higher area fractions of embedded particles. Nonetheless, excessive concentrations cause agglomeration issues and a porosity increase, with detrimental effects on coating properties. Better control over deposition can be gained by lowering the deposition temperature to 70 °C, resulting in reduced agglomeration and porosity with maximized particle incorporation. Eventually, optimal results are obtained with deposition at 70 °C with 6.5 g/L of WC in the plating solution, which lead to a hardness increase of 33% compared with standard Ni-P coatings.
The introduction of WC nanoparticles was also found to affect the crystallization behavior of the coatings, hindering Ni grain growth after heat treatment at 200 °C for 2 h and resulting in finer Ni3P precipitates after annealing at 400 °C for 1 h. The highest hardness improvement of 75% was obtained for nanocomposites after annealing at 400 °C. This, compared with a 55% increase obtained for standard annealed Ni-P coatings, confirms the synergistic effect of dispersion hardening by WC nanoparticles and precipitation strengthening by Ni3P. WC-reinforced coatings are characterized by higher stiffness, but also exhibit higher H/E ratios, which suggests improved wear resistance. Eventually, the potentiodynamic polarization test demonstrated that WC introduction enhances corrosion resistance by reducing the penetration of corrosive agents and further improvements can be obtained after thermal treatments.
The presented findings suggest that control over deposition parameters, in terms of temperature and WC concentration, allows the manufacturing of WC-reinforced nanocomposite coatings with improved protective properties, which are suitable for demanding requirements of engineering applications in the Oil and Gas industry.

Author Contributions

Conceptualization, G.P. (Giulia Pedrizzetti), V.G. and G.P. (Giovanni Pulci); Data curation, G.P. (Giulia Pedrizzetti); Formal analysis, F.M.; Funding acquisition, M.B. and G.P. (Giovanni Pulci); Investigation, G.P. (Giulia Pedrizzetti), V.G. and A.B.; Methodology, G.P. (Giulia Pedrizzetti), V.G. and F.M.; Project administration, E.S. and G.P. (Giovanni Pulci); Resources, F.M.; Software, G.P. (Giulia Pedrizzetti); Supervision, E.S., F.M. and G.P. (Giovanni Pulci); Validation, M.B., F.M. and G.P. (Giovanni Pulci); Writing—original draft, G.P. (Giulia Pedrizzetti); Writing—review and editing, M.B. and G.P. (Giovanni Pulci). All authors have read and agreed to the published version of the manuscript.

Funding

This research received no external funding.

Institutional Review Board Statement

Not applicable.

Informed Consent Statement

Not applicable.

Data Availability Statement

Data will be made available upon request to interested researchers.

Conflicts of Interest

Authors Michelangelo Bellacci and Erica Scrinzi were employed by the company Nuovo Pignone Tecnologie Srl. The remaining authors declare that the research was conducted in the absence of any commercial or financial relationships that could be construed as a potential conflict of interest.

References

  1. Fuentes, G.G. Surface Engineering and Micro-Manufacturing. In Micromanufacturing Engineering and Technology, 2nd ed.; Elsevier Inc.: Amsterdam, The Netherlands, 2015; pp. 459–486. ISBN 9780323312677. [Google Scholar]
  2. Johansen, R.; Footitt, A.; Le Vedrine, M.; Wakefield, L. Legislative Mapping Chromium (VI); European Environment Agency (EEA): Copenhagen, Denmark, 2020. [Google Scholar]
  3. European Chemical Agency ECHA to Prepare Restriction Proposal on Chromium (VI) Substances. Available online: https://echa.europa.eu/it/-/echa-to-prepare-restriction-proposal-on-chromium-vi-substances (accessed on 7 June 2024).
  4. Sharma, P.; Singh, S.P.; Parakh, S.K.; Tong, Y.W. Health Hazards of Hexavalent Chromium (Cr (VI)) and Its Microbial Reduction. Bioengineered 2022, 13, 4923–4938. [Google Scholar] [CrossRef]
  5. Loto, C.A. Electroless Nickel Plating—A Review. Silicon 2016, 8, 177–186. [Google Scholar] [CrossRef]
  6. Lelevic, A.; Walsh, F.C. Electrodeposition of Ni-P Alloy Coatings: A Review. Surf. Coat. Technol. 2019, 369, 198–220. [Google Scholar] [CrossRef]
  7. Sahoo, P.; Das, S.K. Tribology of Electroless Nickel Coatings—A Review. Mater. Des. 2011, 32, 1760–1775. [Google Scholar] [CrossRef]
  8. Sharma, A.; Singh, A.K. Electroless Ni-P and Ni-P-Al2O3 Nanocomposite Coatings and Their Corrosion and Wear Resistance. J. Mater. Eng. Perform. 2013, 22, 176–183. [Google Scholar] [CrossRef]
  9. Fayyad, E.M.; Abdullah, A.M.; Hassan, M.K.; Mohamed, A.M.; Jarjoura, G.; Farhat, Z. Recent Advances in Electroless-Plated Ni-P and Its Composites for Erosion and Corrosion Applications: A Review. Emergent Mater. 2018, 1, 3–24. [Google Scholar] [CrossRef]
  10. Narayanan, T.S.N.S.; Seshadri, S.K.; Park, I.S.; Lee, M.H. Electroless Nanocomposite Coatings: Synthesis, Characteristics, and Applications. In Handbook of Nanoelectrochemistry; Springer International Publishing: Berlin/Heidelberg, Germany, 2016; pp. 389–416. [Google Scholar]
  11. Mallory, G.O.; Hajdu, J.B. Electroless Plating: Fundamentals and Applications; American Electroplaters and Surface Finishers Society: Orlando, FL, USA, 1990. [Google Scholar]
  12. Muraliraja, R.; Anthoni Sagaya Selvan, R.; Selvakumar, A.; Franco, M.; Tamilarasan, T.R.; Sanjith, U.; Sha, W.; Sudagar, J. A Review of Electroless Coatings on Non-Metals: Bath Conditions, Properties and Applications. J. Alloys Compd. 2023, 960, 170723. [Google Scholar] [CrossRef]
  13. Güler, O.; Kocaman, M.; Akçay, S.B.; Çuvalcı, H.; Varol, T. Structure and Tribological Properties of Composites Based on a Novolac Matrix with Ni–P Electrolytic Coating. Surf. Coat. Technol. 2022, 451, 129025. [Google Scholar] [CrossRef]
  14. Güler, O.; Çelebi, M.; Karabacak, A.H.; Çanakçı, A. The Effect of Advanced Electrodeposited Ni-P-Cu Coatings Obtained with Scrap Cu Plates on the Tribological Performance of Al Powder Metallurgy Products. Surf. Coat. Technol. 2023, 468, 129750. [Google Scholar] [CrossRef]
  15. Nickel Institute. Nickel Plating Handbook; Nickel Institute: Toronto, ON, Canada, 2022. [Google Scholar]
  16. Balaraju, J.N.; Sankara Narayanan, T.S.N.; Seshadri, S.K. Structure and Phase Transformation Behaviour of Electroless Ni-P Composite Coatings. Mater. Res. Bull. 2006, 41, 847–860. [Google Scholar] [CrossRef]
  17. Gould, A.J.; Boden, P.J.; Harris, S.J. Phosphorus Distribution in Electroless Nickel Deposits. Surf. Technol. 1981, 12, 93–102. [Google Scholar] [CrossRef]
  18. Wang, X.C.; Cai, W.B.; Wang, W.J.; Liu, H.T.; Yu, Z.Z. Effects of Ligands on Electroless Ni-P Alloy Plating from Alkaline Citrate-Ammonia Solution. Surf. Coat. Technol. 2003, 168, 300–306. [Google Scholar] [CrossRef]
  19. Keong, K.G.; Sha, W.; Malinov, S. Crystallisation Kinetics and Phase Transformation Behaviour of Electroless Nickel-Phosphorus Deposits with High Phosphorus Content. J. Alloys Compd. 2002, 334, 192–199. [Google Scholar] [CrossRef]
  20. Graham, A.H.; Lindsay, R.W.; Read, H.J. Structure of Electroless Nickel. J. Electrochem. Soc. 1962, 109, 1200. [Google Scholar] [CrossRef]
  21. Johnson, C.E.; Ogburn, F. Hardness of Heat Treated Electroless Nickel. Surf. Technol. 1976, 4, 161. [Google Scholar] [CrossRef]
  22. Hadipour, A.; Bahrololoom, M.E.; Monirvaghefi, S.M.; Bahramkia, A.R. Evaluation of Wear Properties for Ni–P Electroless Coatings. Trans. Indian Inst. Met. 2016, 69, 1733–1743. [Google Scholar] [CrossRef]
  23. Staia, M.H.; Castillo, E.J.; Puchi, E.S.; Lewis, B.; Hintermann, H.E. Wear Performance and Mechanism of Electroless Ni-P Coating. Surf. Coat. Technol. 1996, 86, 598–602. [Google Scholar] [CrossRef]
  24. Duncan, R.N. The Effect of Solution Age on Corrosion Resistance of Electroless Nickel Deposits. Plat. Surf. Finish. 1996, 83, 64–68. [Google Scholar]
  25. Park, S.H.; Lee, D.N. A Study on the Microstructure and Phase Transformation of Electroless Nickel Deposits. J. Mater. Sci. 1988, 23, 1643–1654. [Google Scholar] [CrossRef]
  26. Apachitei, I.; Duszczyk, J. Autocatalytic Nickel Coatings on Aluminium with Improved Abrasive Wear Resistance. Surf. Coat. Technol. 2000, 132, 89–98. [Google Scholar] [CrossRef]
  27. Bozzini, B.; Martini, C.; Cavallotti, P.L.; Lanzoni, E. Relationships among Crystallographic Structure, Mechanical properties and Tribological Behaviour of Electroless Ni–P (9%)/B4C Films. Wear 1999, 225–229, 806–813. [Google Scholar] [CrossRef]
  28. Pedrizzetti, G.; Paglia, L.; Genova, V.; Conti, M.; Baiamonte, L.; Marra, F. The Effect of Composition and Heat Treatment on Microhardness of Ni-P and Ni-P-NanoZrO2 Coatings. Chem. Eng. Trans. 2023, 100, 433–438. [Google Scholar] [CrossRef]
  29. Shu, X.; Wang, Y.; Liu, C.; Aljaafari, A.; Gao, W. Double-Layered Ni-P/Ni-P-ZrO2 Electroless Coatings on AZ31 Magnesium Alloy with Improved Corrosion Resistance. Surf. Coat. Technol. 2015, 261, 161–166. [Google Scholar] [CrossRef]
  30. Sade, W.; Proença, R.T.; Moura, T.D.D.O.; Branco, J.R.T. Electroless Ni-P Coatings: Preparation and Evaluation of Fracture Toughness and Scratch Hardness. ISRN Mater. Sci. 2011, 2011, 1–6. [Google Scholar] [CrossRef]
  31. Shen, Y.F.; Xue, W.Y.; Liu, Z.Y.; Zuo, L. Nanoscratching Deformation and Fracture Toughness of Electroless Ni-P Coatings. Surf. Coat. Technol. 2010, 205, 632–640. [Google Scholar] [CrossRef]
  32. Khodaei, M.; Gholizadeh, A.M. SiC Nanoparticles Incorporation in Electroless NiP-Graphene Oxide Nanocomposite Coatings. Ceram. Int. 2021, 47, 25287–25295. [Google Scholar] [CrossRef]
  33. Chinchu, K.S.; Riyas, A.H.; Ameen Sha, M.; Geethanjali, C.V.; Saji, V.S.; Shibli, S.M.A. ZrO2–CeO2 Assimilated Electroless Ni–P Anti-Corrosion Coatings. Surfaces and Interfaces 2020, 21, 100704. [Google Scholar] [CrossRef]
  34. Amjad-Iranagh, S.; Zarif, M. TiO2 Nano-Particle Effect on the Chemical and Physical Properties of Ni-P-TiO2 Nanocomposite Electroless Coatings. J. Nanostructures 2020, 10, 415–423. [Google Scholar] [CrossRef]
  35. Chen, B.; Yan, F.; Guo, J.; Yan, M.F.; Zhang, Y. Attractive Effects of Re on Electroless Ni-P-TiN Nanocomposite Coating. Appl. Surf. Sci. 2021, 565, 150472. [Google Scholar] [CrossRef]
  36. Shahbazi, H.; Mahdavi, M.; Alirezaei, S.; Tabatabaei, F. Corrosion Behavior of Ni-P-Ag and Ni-P-Al2O3 Composite Coatings Ni-P-Ag and Ni-P-Al2O3 Composite. Mater. Res. Express 2019, 6, 085076. [Google Scholar] [CrossRef]
  37. Farhan, M.; Fayyaz, O.; Qamar, M.G.; Shakoor, R.A.; Bhadra, J.; Al-Thani, N.J. Mechanical and Corrosion Characteristics of TiC Reinforced Ni-P Based Nanocomposite Coatings. Mater. Today Commun. 2023, 36, 106901. [Google Scholar] [CrossRef]
  38. Zoikis-Karathanasis, A.; Pavlatou, E.A.; Spyrellis, N. The Effect of Heat Treatment on the Structure and Hardness of Pulse Electrodeposited NiP-WC Composite Coatings. Electrochim. Acta 2009, 54, 2563–2570. [Google Scholar] [CrossRef]
  39. Hamid, Z.A.; El Badry, S.A.; Aal, A.A. Electroless Deposition and Characterization of Ni-P-WC Composite Alloys. Surf. Coat. Technol. 2007, 201, 5948–5953. [Google Scholar] [CrossRef]
  40. Liu, Y.Y.; Yu, J.; Huang, H.; Xu, B.H.; Liu, X.L.; Gao, Y.; Dong, X.L. Synthesis and Tribological Behavior of Electroless Ni-P-WC Nanocomposite Coatings. Surf. Coat. Technol. 2007, 201, 7246–7251. [Google Scholar] [CrossRef]
  41. Luo, H.; Leitch, M.; Behnamian, Y.; Ma, Y.; Zeng, H.; Luo, J.L. Development of Electroless Ni-P/Nano-WC Composite Coatings and Investigation on Its Properties. Surf. Coat. Technol. 2015, 277, 99–106. [Google Scholar] [CrossRef]
  42. Zhang, X.S.; Wang, Q.Y.; Tang, Y.R.; Guo, H.C.; Xi, Y.C.; Dong, L.J.; Zheng, H. Preparation of NiP-WC Composite Coatings by Ultrasonically Assisted Electroless Plating and Their Characterization. Int. J. Electrochem. Sci. 2020, 15, 11821–11832. [Google Scholar] [CrossRef] [PubMed]
  43. Zhao, C.; Yao, Y. Preparation and Mechanical Properties of Electroless Nickel-Phosphorus-Tungsten Carbide Nanocomposite Coatings. J. Mater. Eng. Perform. 2014, 23, 193–197. [Google Scholar] [CrossRef]
  44. Testa, V.; Morelli, S.; Bolelli, G.; Benedetti, B.; Puddu, P.; Sassatelli, P.; Lusvarghi, L. Alternative Metallic Matrices for WC-Based HVOF Coatings. Surf. Coat. Technol. 2020, 402, 126308. [Google Scholar] [CrossRef]
  45. Conti, M.; Paglia, L.; Genova, V.; Pedrizzetti, G.; Baiamonte, L.; Marra, F. The Effects of Deposition Parameters on the Properties of NiCr Coatings Obtained by Electroless Plating. Chem. Eng. Trans. 2023, 100, 427–432. [Google Scholar] [CrossRef]
  46. A182/A182M–12a; Standard Specification for Forged or Rolled Alloy and Stainless Steel Pipe Flanges, Forged Fittings, and Valves and Parts for High-Temperature Service. American Society for Testing and Materials Designation: West Conshohocken, PA, USA, 2012.
  47. B183−79; Standard Practice for Preparation of Low-Carbon Steel for Electroplating (Reapproved 2014). American Society for Testing and Materials Designation: West Conshohocken, PA, USA, 2014.
  48. B322−99; Standard Guide for Cleaning Metals Prior to Electroplating (Reapproved 2014). American Society for Testing and Materials Designation: West Conshohocken, PA, USA, 2014.
  49. B 733–97; Specification for Autocatalytic (Electroless) Nickel-Phosphorus Coatings on Metal. American Society for Testing and Materials Designation: West Conshohocken, PA, USA, 2017.
  50. Genova, V.; Paglia, L.; Pulci, G.; Pedrizzetti, G.; Pranzetti, A.; Romanelli, M.; Marra, F. Medium and High Phosphorous Ni-P Coatings Obtained via an Electroless Approach: Optimization of Solution Formulation and Characterization of Coatings. Coatings 2023, 13, 1490. [Google Scholar] [CrossRef]
  51. Wang, J.; Bai, X.; Shen, X.; Liu, X.; Wang, B. Effect of Micro-Texture on Substrate Surface on Adhesion Performance of Electroless Ni–P Coating. J. Manuf. Process. 2022, 74, 296–307. [Google Scholar] [CrossRef]
  52. Baskaran, I.; Sankara Narayanan, T.S.N.; Stephen, A. Effect of Accelerators and Stabilizers on the Formation and Characteristics of Electroless Ni-P Deposits. Mater. Chem. Phys. 2006, 99, 117–126. [Google Scholar] [CrossRef]
  53. Wu, W.; Liu, J.; Miao, N.; Jiang, J.; Zhang, Y.; Zhang, L.; Yuan, N.; Wang, Q.; Tang, L. Influence of Thiourea on Electroless Ni–P Films Deposited on Silicon Substrates. J. Mater. Sci. Mater. Electron. 2019, 30, 7717–7724. [Google Scholar] [CrossRef]
  54. Park, I.C.; Kim, S.J. Effect of Lead Nitrate Concentration on Electroless Nickel Plating Characteristics of Gray Cast Iron. Surf. Coat. Technol. 2019, 376, 2–7. [Google Scholar] [CrossRef]
  55. ISO 21920-2; Geometrical Product Specifications (GPS)-Surface Texture: Profile-Part 2:Terms, Definitions and Surface Texture. ISO: Geneva, Switzerland, 2021.
  56. Apachitei, I.; Tichelaar, F.D.; Duszczyk, J.; Katgerman, L. The Effect of Heat Treatment on the Structure and Abrasive Wear Resistance of Autocatalytic NiP and NiP-SiC Coatings. Surf. Coat. Technol. 2002, 149, 263–278. [Google Scholar] [CrossRef]
  57. Pedrizzetti, G.; Paglia, L.; Genova, V.; Cinotti, S.; Bellacci, M.; Marra, F.; Pulci, G. Microstructural, Mechanical and Corrosion Characterization of Electroless Ni-P Composite Coatings Modified with ZrO2 Reinforcing Nanoparticles. Surf. Coat. Technol. 2023, 473, 129981. [Google Scholar] [CrossRef]
  58. Sahagian, D.L.; Proussevitch, A.A. 3D Particle Size Distributions from 2D Observations: Stereology for Natural Applications. J. Volcanol. Geotherm. Res. 1998, 84, 173–196. [Google Scholar] [CrossRef]
  59. B689−97; Standard Specification for Electroplated Engineering Nickel Coatings (Reapproved 2023). American Society for Testing and Materials Designation: West Conshohocken, PA, USA, 2023.
  60. Zhou, Q.J.; Qiao, L.J.; Qi, H.B.; Li, J.X.; He, J.Y.; Chu, W.Y. Hydrogen Blistering and Hydrogen-Induced Cracking in Amorphous Nickel Phosphorus Coating. J. Non-Cryst. Solids 2007, 353, 4011–4014. [Google Scholar] [CrossRef]
  61. Wang, L.L.; Chen, H.J.; Chen, Z.L. Study on Post-Treatments for Electroless Ni-P Coating. Surf. Eng. 2011, 27, 57–60. [Google Scholar] [CrossRef]
  62. Krishnan, K.H.; John, S.; Srinivasan, K.N.; Praveen, J.; Ganesan, M.; Kavimani, P.M. An Overall Aspect of Electroless Ni-P Depositions—A Review Article. Metall. Mater. Trans. A 2006, 37, 1917–1926. [Google Scholar] [CrossRef]
  63. E384–11; Test Method for Knoop and Vickers Hardness of Materials. American Society for Testing and Materials Designation: West Conshohocken, PA, USA, 2012.
  64. ISO STANDARD 14577-4:2016; Metallic Materials—Instrumented Test for Hardness and materials Parameters—Part 4: Test Method for Metallic and Nonmetallic Coatings. ISO: Geneva, Switzerland, 2016.
  65. Oliver, W.C.; Pharr, G.M. Measurement of Hardness and Elastic Modulus by Instrumented Indentation: Advances in Understanding and Refinements to Methodology. J. Mat. Res. 2004, 19, 3–20. [Google Scholar] [CrossRef]
  66. Genova, V.; Paglia, L.; Marra, F.; Bartuli, C.; Pulci, G. Pure Thick Nickel Coating Obtained by Electroless Plating: Surface Characterization and Wetting Properties. Surf. Coat. Technol. 2019, 357, 595–603. [Google Scholar] [CrossRef]
  67. Hamada, A.S.; Sahu, P.; Porter, D.A. Indentation Property and Corrosion Resistance of Electroless Nickel-Phosphorus Coatings Deposited on Austenitic High-Mn TWIP Steel. Appl. Surf. Sci. 2015, 356, 1–8. [Google Scholar] [CrossRef]
  68. ASTM G59–97; Standard Test Method for Conducting Potentiodynamic Polarization Resistance Measurements. American Society for Testing and Materials Designation: West Conshohocken, PA, USA, 2014.
  69. Alhamad, R.K.; Hussein, A.K.; Abbas, L.K. Improved Acrylonitrile-Butadiene-Styrene Surface Properties via Electroless (NiP-SiC) Nanocomposite Coating. Chem. Phys. Impact 2023, 7, 100375. [Google Scholar] [CrossRef]
  70. Ghavidel, N.; Allahkaram, S.R.; Naderi, R.; Barzegar, M.; Bakhshandeh, H. Corrosion and Wear Behavior of an Electroless Ni-P/Nano-SiC Coating on AZ31 Mg Alloy Obtained through Environmentally-Friendly Conversion Coating. Surf. Coat. Technol. 2020, 382, 125156. [Google Scholar] [CrossRef]
  71. Sheng, M.; Wang, Y.; Zhong, Q.; Wu, H.; Zhou, Q.; Lin, H. The Effects of Nano-SiO2 Additive on the Zinc Phosphating of Carbon Steel. Surf. Coat. Technol. 2011, 205, 3455–3460. [Google Scholar] [CrossRef]
  72. Czapczyk, K.; Zawadzki, P.; Wierzbicka, N.; Talar, R. Microstructure and Properties of Electroless Ni-p/Si3n4 Nanocomposite Coatings Deposited on the Aw-7075 Aluminum Alloy. Materials 2021, 14, 4487. [Google Scholar] [CrossRef]
  73. Sarret, M.; Müller, C.; Amell, A. Electroless NiP Micro- and Nano-Composite Coatings. Surf. Coat. Technol. 2006, 201, 389–395. [Google Scholar] [CrossRef]
  74. Abdel Gawad, S.; Baraka, A.; Morsi, M.; Ali Eltoum, M. Development of Electroless Ni-P-Al2O3 and Ni-P-TiO2 Composite Coatings from Alkaline Hypophosphite Gluconate Baths and Their Properties. Int. J. Electrochem. Sci. 2013, 8, 1722–1734. [Google Scholar] [CrossRef]
  75. He, Y.; Zhang, S.; He, Y.; Song, R.; Zhang, Z.; Liu, B.; Li, H.; Shangguan, J. Effects of Yttrium-Stabilized Zirconia (Different Yttrium Content) Doping on the Structure, Corrosion Resistance and Wear Resistance of Ni-P Electroless Coating. Colloids Surf. A Physicochem. Eng. Asp. 2022, 654, 130059. [Google Scholar] [CrossRef]
  76. Fayyad, E.M.; Hassan, M.K.; Rasool, K.; Mahmoud, K.A.; Mohamed, A.M.A.; Jarjoura, G.; Farhat, Z.; Abdullah, A.M. Novel Electroless Deposited Corrosion—Resistant and Anti-Bacterial NiP–TiNi Nanocomposite Coatings. Surf. Coat. Technol. 2019, 369, 323–333. [Google Scholar] [CrossRef]
  77. Grosjean, A.; Rezrazi, M.; Bercot, P.; Tachez, M. Adaptation of a Mathematical Model to the Incorporation of Silicon Carbide Particles in an Electroless Nickel Deposit. Met. Finish. 1998, 96, 14–17. [Google Scholar] [CrossRef]
  78. Ger, M.-D.; Hwang, B.J. Effect of Surfactants on Codeposition of PTFE Particles with Electroless Ni-P Coating. Mater. Chem. Phys. 2002, 76, 38–45. [Google Scholar] [CrossRef]
  79. Chen, W.-W.; Gao, W. Microstructures and Properties of Sol-Enhanced Nanostructured Metal-Oxide Composite Coatings. Progress Nat. Sci. Mater. Int. 2011, 21, 355–362. [Google Scholar] [CrossRef]
  80. Cheong, W.J.; Luan, B.L.; Shoesmith, D.W. The Effects of Stabilizers on the Bath Stability of Electroless Ni Deposition and the Deposit. Appl. Surf. Sci. 2004, 229, 282–300. [Google Scholar] [CrossRef]
  81. Medeliene, V. The Influence of B4C and SiC Additions on the Morphological, Physical, Chemical and Corrosion Properties of Ni Coatings. Surf. Coat. Technol. 2002, 154, 104–111. [Google Scholar] [CrossRef]
  82. Pinate, S.; Ghassemali, E.; Zanella, C. Strengthening Mechanisms and Wear Behavior of Electrodeposited Ni–SiC Nanocomposite Coatings. J. Mater. Sci. 2022, 57, 16632–16648. [Google Scholar] [CrossRef]
  83. Zhang, Z.; Chen, D.L. Consideration of Orowan Strengthening Effect in Particulate-Reinforced Metal Matrix Nanocomposites: A Model for Predicting Their Yield Strength. Scr. Mater. 2006, 54, 1321–1326. [Google Scholar] [CrossRef]
  84. Zhang, Z.; Chen, D.L. Contribution of Orowan Strengthening Effect in Particulate-Reinforced Metal Matrix Nanocomposites. Mater. Sci. Eng. A 2008, 483–484, 148–152. [Google Scholar] [CrossRef]
  85. Kumaraguru, S.; Kumar, G.G.; Raghu, S.; Gnanamuthu, R.M. Fabrication of Ternary Ni-TiO2-TiC Composite Coatings and Their Enhanced Microhardness for Metal Finishing Application. Appl. Surf. Sci. 2018, 447, 463–470. [Google Scholar] [CrossRef]
  86. Gay, P.A.; Limat, J.M.; Steinmann, P.A.; Pagetti, J. Characterisation and Mechanical Properties of Electroless NiP-ZrO2 Coatings. Surf. Coat. Technol. 2007, 202, 1167–1171. [Google Scholar] [CrossRef]
  87. Malfatti, C.F.; Veit, H.M.; Menezes, T.L.; Zoppas Ferreira, J.; Rodriguês, J.S.; Bonino, J.P. The Surfactant Addition Effect in the Elaboration of Electrodepositated NiP-SiC Composite Coatings. Surf. Coat. Technol. 2007, 201, 6318–6324. [Google Scholar] [CrossRef]
  88. Nwoko, V.O.; Shreir, L.L. Electron Micrographic Examination of Electrodeposited Dispersion-Hardened Nickel. J. Appl. Electrochem. 1973, 3, 137–141. [Google Scholar] [CrossRef]
  89. Balaraju, J.N.; Sankara Narayanan, T.S.N.; Seshadri, S.K. Electroless Ni-P Composite Coatings. J. Appl. Electrochem. 2003, 33, 807–816. [Google Scholar] [CrossRef]
  90. Bakhit, B.; Akbari, A. Effect of Particle Size and Co-Deposition Technique on Hardness and Corrosion Properties of Ni-Co/SiC Composite Coatings. Surf. Coat. Technol. 2012, 206, 4964–4975. [Google Scholar] [CrossRef]
  91. Niihara, K.; Nakihara, A. Strengthening and Toughening Mechanisms in Nanocomposite Ceramics. Ann. Chim. Fr. 1991, 16, 479–486. [Google Scholar]
  92. Elsener, B.; Crobu, M.; Scorciapino, M.A.; Rossi, A. Electroless Deposited Ni-P Alloys: Corrosion Resistance Mechanism. J. Appl. Electrochem. 2008, 38, 1053–1060. [Google Scholar] [CrossRef]
  93. Chintada, V.B.; Gurugubelli, T.R.; Koutavarapu, R. The Impact of Surfactants on the Properties of Electroless Ni–P–SiC Coatings. Mater. Chem. Phys. 2022, 291, 126682. [Google Scholar] [CrossRef]
  94. Sadreddini, S.; Salehi, Z.; Rassaie, H. Characterization of Ni-P-SiO2 Nano-Composite Coating on Magnesium. Appl. Surf. Sci. 2015, 324, 393–398. [Google Scholar] [CrossRef]
  95. Alirezaei, S.; Monirvaghefi, S.M.; Salehi, M.; Saatchi, A. Effect of Alumina Content on Surface Morphology and Hardness of Ni-P-Al2O3(α) Electroless Composite Coatings. Surf. Coat. Technol. 2004, 184, 170–175. [Google Scholar] [CrossRef]
  96. Ma, C.; Wu, F.; Ning, Y.; Xia, F.; Liu, Y. Effect of Heat Treatment on Structures and Corrosion Characteristics of Electroless Ni-P-SiC Nanocomposite Coatings. Ceram. Int. 2014, 40, 9279–9284. [Google Scholar] [CrossRef]
  97. Franco, M.; Sha, W.; Malinov, S.; Rajendran, R. Phase Composition, Microstructure and Microhardness of Electroless Nickel Composite Coating Co-Deposited with SiC on Cast Aluminium LM24 Alloy Substrate. Surf. Coat. Technol. 2013, 235, 755–763. [Google Scholar] [CrossRef]
  98. Sudagar, J.; Lian, J.; Sha, W. Electroless Nickel, Alloy, Composite and Nano Coatings—A Critical Review. J. Alloys Compd. 2013, 571, 183–204. [Google Scholar] [CrossRef]
  99. Islam, M.; Azhar, M.R.; Fredj, N.; Burleigh, T.D.; Oloyede, O.R.; Almajid, A.A.; Ismat Shah, S. Influence of SiO2 Nanoparticles on Hardness and Corrosion Resistance of Electroless Ni-P Coatings. Surf. Coat. Technol. 2015, 261, 141–148. [Google Scholar] [CrossRef]
  100. Shibli, S.M.A.; Chinchu, K.S.; Sha, M.A. Development of Nano-Tetragonal Zirconia-Incorporated Ni–P Coatings for High Corrosion Resistance. Acta Metall. Sin. Engl. Lett. 2019, 32, 481–494. [Google Scholar] [CrossRef]
  101. Djokić, S.S.; Djokić, N.S. Electroless Deposition of Metallic Powders. J. Electrochem. Soc. 2011, 158, D204. [Google Scholar] [CrossRef]
  102. Sliem, M.H.; Shahzad, K.; Sivaprasad, V.N.; Shakoor, R.A.; Abdullah, A.M.; Fayyaz, O.; Kahraman, R.; Umer, M.A. Enhanced Mechanical and Corrosion Protection Properties of Pulse Electrodeposited NiP-ZrO2 Nanocomposite Coatings. Surf. Coat. Technol. 2020, 403, 126340. [Google Scholar] [CrossRef]
  103. Liu, Z.W.; Sun, C.; Gauvin, R.; Wu, W.; Zeng, Y.; Demers, H. High Spatial Resolution EDS Mapping of Nanoparticles at Low Accelerating Voltage. J. Test. Eval. 2016, 44, 2285–2292. [Google Scholar] [CrossRef]
  104. Williams, D.B.; Michael, R.; Goldstem, I.; Romlg, A.D. Definition of the Spatial Resolution of X-Ray Microanalysis in Thin Foils. Ultramicroscopy 1992, 47, 121–132. [Google Scholar] [CrossRef]
  105. Agarwala, R.C.; Agarwala, V. Electroless Alloy/Composite Coatings: A Review. Sadhana 2003, 28, 475–493. [Google Scholar] [CrossRef]
  106. Samanta, S.; Vishwanath, K.; Mondal, K.; Dutta, M.; Singh, S.B. Electroless Amorphous NiP Coatings Over API X70 Steel: Resistance to Wear and Hydrogen Embrittlement. Met. Mater. Int. 2022, 28, 397–411. [Google Scholar] [CrossRef]
  107. He, Y.; Sun, W.T.; Wang, S.C.; Reed, P.A.S.; Walsh, F.C. An Electrodeposited Ni-P-WS2 Coating with Combined Super-Hydrophobicity and Self-Lubricating Properties. Electrochim. Acta 2017, 245, 872–882. [Google Scholar] [CrossRef]
  108. Dhakal, D.R.; Kshetri, Y.K.; Gyawali, G.; Kim, T.H.; Choi, J.H.; Lee, S.W. Understanding the Effect of Si3N4 Nanoparticles on Wear Resistance Behavior of Electroless Nickel-Phosphorus Coating through Structural Investigation. Appl. Surf. Sci. 2021, 541, 148403. [Google Scholar] [CrossRef]
  109. Van Swygenhoven, H.; Caro, A. Plastic Behavior of Nanophase Ni: A Molecular Dynamics Computer Simulation. Appl. Phys. Lett. 1997, 71, 1652–1654. [Google Scholar] [CrossRef]
  110. Schiotz, J.; Vegge, T.; Di Tolla, F.D.; Jacobsen, K.W. Atomic-Scale Simulations of the Mechanical Deformation of Nanocrystalline Metals. Phisical Rev. B 1999, 60, 11971–11983. [Google Scholar] [CrossRef]
  111. Nemane, V.; Chatterjee, S. Nanomechanical, Tribological, and Scratch Properties of Electroless Ni-B-W Alloy and Ni-B-W-SiC Composite Coatings. J. Tribol. 2022, 144, 051402. [Google Scholar] [CrossRef]
  112. Ahmadkhaniha, D.; Eriksson, F.; Zanella, C. Optimizing Heat Treatment for Electroplated Nip and NiP/SiC Coatings. Coatings 2020, 10, 1179. [Google Scholar] [CrossRef]
  113. Leyland, A.; Matthews, A. On the Significance of the H/E Ratio in Wear Control: A Nanocomposite Coating Approach to Optimised Tribological Behaviour. Wear 2000, 246, 1–11. [Google Scholar] [CrossRef]
  114. Bai, A.; Chuang, P.Y.; Hu, C.C. The Corrosion Behavior of Ni-P Deposits with High Phosphorous Contents in Brine Media. Mater. Chem. Phys. 2003, 82, 93–100. [Google Scholar] [CrossRef]
  115. Vitry, V.; Sens, A.; Kanta, A.F.; Delaunois, F. Wear and Corrosion Resistance of Heat Treated and As-Plated Duplex NiP/NiB Coatings on 2024 Aluminum Alloys. Surf. Coat. Technol. 2012, 206, 3421–3427. [Google Scholar] [CrossRef]
  116. Khodaei, M.; Gholizadeh, A.M. Surfactant-Free Commercial Electroless Bath with Low Concentration of SiC Nanoparticles to Prepare the NiP-SiC Nanocomposite Coatings. Mater. Res. Express 2021, 8, 055009. [Google Scholar] [CrossRef]
  117. Bigdeli, F.; Allahkaram, S.R. An Investigation on Corrosion Resistance of As-Applied and Heat Treated Ni-P/NanoSiC Coatings. Mater. Des. 2009, 30, 4450–4453. [Google Scholar] [CrossRef]
  118. Rabizadeh, T.; Allahkaram, S.R.; Zarebidaki, A. An Investigation on Effects of Heat Treatment on Corrosion Properties of Ni-P Electroless Nano-Coatings. Mater. Des. 2010, 31, 3174–3179. [Google Scholar] [CrossRef]
  119. Balaraju, J.N.; Selvi, V.E.; Grips, V.K.W.; Rajam, K.S. Electrochemical Studies on Electroless Ternary and Quaternary Ni-P Based Alloys. Electrochim. Acta 2006, 52, 1064–1074. [Google Scholar] [CrossRef]
Figure 1. SEM micrographs (a,c), EDS spectrum (b), and particle size distribution (d) of as-purchased WC nanoparticles.
Coatings 14 00826 g001
Figure 2. Representation of the quantitative image analysis procedure for identification of particles and porosities: (a) original SEM-BSE micrograph; binarizing process for WC particles (b) and porosities (c) identification; routine output with particles (d) and porosity (e) reported in red and superimposed on the original micrograph, to demonstrate the good matching.
Coatings 14 00826 g002
Figure 3. Comparison of XRD spectra (a) and microhardness (b) of standard Ni-P coatings in the as-coated condition and after annealing at 200 °C for 1 h.
Coatings 14 00826 g003
Figure 4. XRD spectra of F22 substrate prior to deposition (a), WC particles (b), and Ni-P-WC composite coatings (c).
Coatings 14 00826 g004
Figure 5. Effect of WC concentration in the plating solution on plating rate (a), nanoparticle incorporation (b), mean number of particles per agglomerate (c), and porosity (d). Deposition at 90 °C.
Coatings 14 00826 g005
Figure 6. Cross-sectional SEM-BSE micrographs of nanocomposite coatings deposited at 90 °C and reinforced with different concentrations of WC in the plating solution: (a) unreinforced Ni-P; (b) 1 g/L of WC nanoparticles; (c) 3 g/L of WC nanoparticles; (d) 4 g/L of WC nanoparticles; (e) 5 g/L of WC nanoparticles; and (f) 6.5 g/L of WC nanoparticles. Red arrows point at some of the bigger agglomerates present in the coatings.
Coatings 14 00826 g006
Figure 7. SEM-BSE micrograph and EDS analysis of WC nanoparticles after deposition.
Coatings 14 00826 g007
Figure 8. Microhardness of standard Ni-P coatings and nanocomposites deposited at 90 °C as a function of WC nanoparticle concentration in the plating solution.
Coatings 14 00826 g008
Figure 9. Effect of deposition temperature on plating rate (a), nanoparticle incorporation (b), mean number of particles per agglomerate (c), and porosity (d). Deposition with 3 g/L of WC nanoparticles in the plating solution.
Coatings 14 00826 g009
Figure 10. High magnification cross-sectional SEM-BSE micrographs of nanocomposite coatings reinforced with 3/l of WC nanoparticles obtained after deposition at (a) 70 °C, (b) 75 °C, (c) 80 °C, (d) 85 °C, and (e) 90 °C.
Coatings 14 00826 g010
Figure 11. Microhardness of Ni-P composite coatings reinforced with 3 g/L of WC nanoparticles as a function of deposition temperature.
Coatings 14 00826 g011
Figure 12. Effect of WC concentration in the plating solution on plating rate (a), nanoparticle incorporation (b), mean number of particles per agglomerate (c), and porosity (d). Deposition at 70 °C.
Coatings 14 00826 g012
Figure 13. Cross-sectional SEM-BSE micrographs of nanocomposite coatings deposited at 70 °C and reinforced with different concentrations of WC in the plating solution: (a) 3 g/L of WC nanoparticles; (b) 5 g/L of WC nanoparticles; (c) 6.5 g/L of WC nanoparticles; (d) 10 g/L of WC nanoparticles; (e) 15 g/L of WC nanoparticles; and (f) 20 g/L of WC nanoparticles.
Coatings 14 00826 g013
Figure 14. Microhardness of Ni-P composite coatings reinforced deposited at 70 °C as a function of WC nanoparticles concentration in the plating solution.
Coatings 14 00826 g014
Figure 15. Response surface of microhardness as a function of deposition temperature and WC concentration in the plating solution. Red dots are experimental data used for interpolation.
Coatings 14 00826 g015
Figure 16. Surface morphology of sandblasted F22 substrate before deposition (a), standard Ni-P coating (b), nanocomposite reinforced with 1 g/L of WC deposited at 90 °C (c), and nanocomposite reinforced with 6.5 g/L of WC deposited at 70 °C (d).
Coatings 14 00826 g016
Figure 17. Surface morphology of standard Ni-P coating (a) and nanocomposite reinforced with 6.5 g/L of WC deposited at 70 °C (b).
Coatings 14 00826 g017
Figure 18. EDS map of Ni-P-WC(6.5-70) nanocomposite coating.
Coatings 14 00826 g018
Figure 19. XRD spectra of unreinforced Ni-P coatings (red line) and WC-reinforced Ni-P nanocomposite (black line) in the as-coated condition.
Coatings 14 00826 g019
Figure 20. XRD spectra of unreinforced Ni-P coatings (red line) and WC-reinforced Ni-P nanocomposite (black line) after heat treatment at 200 °C for 2 h (a) and 400 °C for 1 h (b). Figure (c) shows the insight of (b) highlighting peak shifting.
Coatings 14 00826 g020
Figure 21. Vickers microhardness of standard Ni-P and WC-reinforced nanocomposites as a function of heat treatment.
Coatings 14 00826 g021
Figure 22. Load–displacement curved measured by instrumented indentation for standard Ni-P and Ni-P-WC(70-6.5) nanocomposites in the as-coated condition and after heat treatment.
Coatings 14 00826 g022
Figure 23. Potentiodynamic polarization curves in 3.5 wt.% NaCl solution of unreinforced Ni-P coating, Ni-P+WC nanocomposite, Ni-P+WC nanocomposite heat treated at 200 °C for 2 h, and Ni-P+WC nanocomposite heat treated at 400 °C for 1 h.
Coatings 14 00826 g023
Figure 24. Schematic representation of corrosion resistance mechanisms of standard Ni-P coating (a) and Ni-P-WC nanocomposite (b).
Coatings 14 00826 g024
Figure 25. Surface BSE-SEM micrographs of coatings after the potentiodynamic polarization test: (a) standard Ni-P; (b) Ni-P+WC nanocomposite; (c) Ni-P+WC nanocomposite heat treated at 200 °C for 2 h; and (d) Ni-P+WC nanocomposite heat treated at 400 °C for 1 h.
Coatings 14 00826 g025
Table 1. Formulation of the electroless Ni-P plating solution.
CompoundConcentration (g/L)
Sodium hypophosphite monohydrate110
Sodium acetate20
Citric acid9
Nickel sulphate hexahydrate25
Thiourea8.5 ppm a
a Added from 1M water solution.
Table 2. Experimental matrix of the different temperature–WC concentration pairs investigated.
Temperature (°C)WC Concentration (g/L)
90013456.5
85 3456.5
80 3
75 3 1015
70 3456.5101520
Table 3. Mean Ni and Ni3P crystallite size, calculated by the Scherrer equation, for standard and nanocomposite coatings after heat treatment at 400 °C for 1 h.
Ni Crystallite Size (nm)Ni3P Crystallite Size (nm)
Ni-P 400 °C 1 h41.564.6
Ni-P-WC(70-6.5) 400 °C 1 h41.456.5
Table 4. Hardness (H), Young’s modulus (E), and H/E ratio of electroless Ni-P coatings and WC-reinforced nanocomposites in the as-coated condition and after heat treatment, determined by instrumented indentation.
Hardness (GPa)Young’s Modulus (GPa)H/E Ratio
Ni-P6.20 ± 0.27136.9 ± 5.360.0453 ± 0.027
Ni-P 200 °C 2 h6.93 ± 0.24148.8 ± 7.20.0466 ± 0.0028
Ni-P 400 °C 1 h9.35 ± 0.54180.4 ± 10.30.0518 ± 0.0042
Ni-P-WC(70-6.5)7.56 ± 0.44153.7 ± 4.570.0492 ± 0.0032
Ni-P-WC(70-6.5) 200 °C 2 h8.22 ± 0.35162.2 ± 6.40.0507 ± 0.0029
Ni-P-WC(70-6.5) 400 °C 1 h9.77 ± 0.35181.2 ± 7.10.0539 ± 0.0029
Table 5. Corrosion parameters of standard Ni-P coatings and Ni-P-WC nanocomposites in the as-coated conditions, heat treated at 200 °C for 2 h and at 400 °C for 1 h.
Ecorr (mV vs. SCE)Icorr (µA/cm2)βa (mV/Decade)βc (mV/Decade)Rp (kΩ ⋅ cm2)
Ni-P−436.457.061200.05−200.086.151
Ni-P+WC−332.956.50992.90−196.124.205
Ni-P-WC 200 °C 2 h−235.161.942171.363−208.6321.037
Ni-P-WC 400 °C 1 h−195.990.976171.436−175.10438.523
Disclaimer/Publisher’s Note: The statements, opinions and data contained in all publications are solely those of the individual author(s) and contributor(s) and not of MDPI and/or the editor(s). MDPI and/or the editor(s) disclaim responsibility for any injury to people or property resulting from any ideas, methods, instructions or products referred to in the content.

