Article

Effects of Wind Speed and Heat Flux on De-Icing Characteristics of Wind Turbine Blade Airfoil Surface

by
Ting Zhang
1,
Yangyang Lian
1,
Zhi Xu
1,2,* and
Yan Li
1,*
1
College of Engineering, Northeast Agricultural University, Harbin 150030, China
2
Key Laboratory of Icing and Anti/De-Icing, China Aerodynamics Research and Development Center, Mianyang 621000, China
*
Authors to whom correspondence should be addressed.
Coatings 2024, 14(7), 852; https://doi.org/10.3390/coatings14070852 (registering DOI)
Submission received: 31 May 2024 / Revised: 25 June 2024 / Accepted: 5 July 2024 / Published: 7 July 2024

Abstract

:
The icing on wind turbines reduces their aerodynamic performance and can cause other safety issues. Accordingly, in this paper, the de-icing characteristics of a wind turbine blade airfoil under different conditions are investigated using numerical simulation. The findings indicate that when the de-icing time is 10 s, the peak ice thickness on the leading edge of the airfoil surface decreases from 0.28 mm to 0.068 mm and from 0.77 mm to 0.45 mm at low (5 m/s) and high (15 m/s) wind speeds, respectively. This is due to the fact that the ice melting rate is much greater than the icing rate at low wind speeds, while the icing rate increases at high wind speeds. When the de-icing time is 20 s, ice accretion on the leading edge of the airfoil is completely melted. At a low heat flux (8000 W/m2) and high heat flux (12,000 W/m2), the peak ice thickness decreases by 31.2% and 64.9%, respectively. With an increase in de-icing time and heat flux, the peak thickness of runback ice increases. This is due to an increase in runback ice as a result of more ice melting on the leading edge of the airfoil. The surface temperature in the ice-free area is significantly higher than that in the ice-melting area, due to high thermal resistance in the ice-free area. This study will provide guidance for the thermal distribution and coating layout of a wind turbine blade airfoil to make the anti-/de-icing technology more efficient and energy-saving.

1. Introduction

With the increasing severity of the global energy crisis and environmental problems, wind energy utilization has become one of the most important forms of renewable energy in today’s world [1,2]. However, about a quarter of the world’s wind turbines are in cold regions [3,4], and these wind turbines face severe icing problems [5,6]. The icing of a wind turbine’s blades reduces its aerodynamic performance, which leads to a decrease in the wind turbine’s power output. Icing increases wind turbine loads, thus affecting its structural strength and fatigue life. In addition, icing causes safety problems such as ice shedding [7]. Therefore, it is crucial to study the de-icing technology for wind turbine blades.
At present, wind turbine anti-/de-icing methods are mainly divided into passive and active methods. Passive methods mainly include the coating method, which usually coats superhydrophobic materials on the surface of wind turbine blades, reducing the icing distribution area due to adhesion strength reduction between ice accretion and the blade surface [8,9,10,11]. The coating method is less polluting and energy efficient, but it does not adequately prevent and remove ice accretion on the blade surface. Therefore, combining passive and active methods can be an efficient anti-/de-icing method for wind turbine blade surfaces. Active methods include hot air, electric heating, electromagnetic pulse, ultrasonic vibration, etc. [12]. Among them, electric heating is considered to be the most effective and economical anti-/de-icing technology, as shown in Figure 1. The electric heating de-icing characteristics on the wind turbine blade surfaces are carried out to obtain the relationship between thermal layout and ice accumulation evolution, providing a reference basis for the coupling of the surface coating method and the electrothermal method for wind turbine anti-/de-icing technology.
In recent years, more research has been conducted on electrically heated de-icing systems. Reid et al. [13] used the electric de-icing calculation module to solve the control equations of water film, ice layer, and external flow field and reconstructed the melted ice type by Fensap-ice software. Xiao et al. [14] investigated the effects of parameters on the phase change heat transfer of ice, including heating mode, cooling time, heating power, and heating unit spacing. DeWitt et al. [15] carried out one-dimensional and two-dimensional rectangular calculations for a transient simulation of the de-icing process. Xiao et al. [16] modeled the ice-melting process using the porous media method.
Research on electric heating de-icing systems has focused on three aspects: the heat transfer characteristics of multi-layer structures, de-icing problems, and the improvement of electric de-icing systems. Chang et al. [17] established a rectangular differential model of a two-dimensional electric de-icing system based on the enthalpy method and analyzed the influence of heating sequence and power density on the two-dimensional de-icing process. Shen et al. [18] and Mu et al. [19] investigated the unsteady state heat and mass transfer model for runback water on the surface. Zhu et al. [20] established a multilayer structural heat transfer model of the electrothermal de-icing system and analyzed the influence of heating control parameters on the performance of the electrothermal de-icing system. Fu et al. [21] analyzed the effects of heating time and heat flux on the surface temperature of the helicopter rotor during the de-icing process. Pourbagian et al. [22] proposed an optimization framework for electrothermal de-icing systems, which considered energy consumption, thickness, volume, and the shape and location of surface accumulated ice as key parameters affecting energy usage and aerodynamic performance. Xiao et al. [23] pointed out that under electrothermal de-icing conditions, the thermodynamic coupling properties led to a significant increase in stresses in the ice. Lei et al. [24] investigated the transient heat transfer and ice-melting process of multilayered ice based on the melting model of the enthalpy-porous medium method. Henry et al. [25] developed a model to simulate two-dimensional heat transfer during de-icing and anti-icing processes.
There are fewer studies on electrically heated de-icing systems for wind turbine blades. Shu et al. [26] proposed a numerical method for the dynamic de-icing process of wind turbine blades through experiments and numerical simulations. Valerie [27] developed a one-dimensional transient model to simulate the electrothermal de-icing process of wind turbine blades. Shu et al. [28] established a numerical calculation model for the critical de-icing power of a wind turbine blade by analyzing the airflow, water droplet collision, and surface dynamic heat balance process.
According to the existing research results, ice conditions and heat fluxes are important factors in determining the de-icing performance of wind turbine blade surfaces. However, there are some limitations in the above studies, which include the following:
(1)
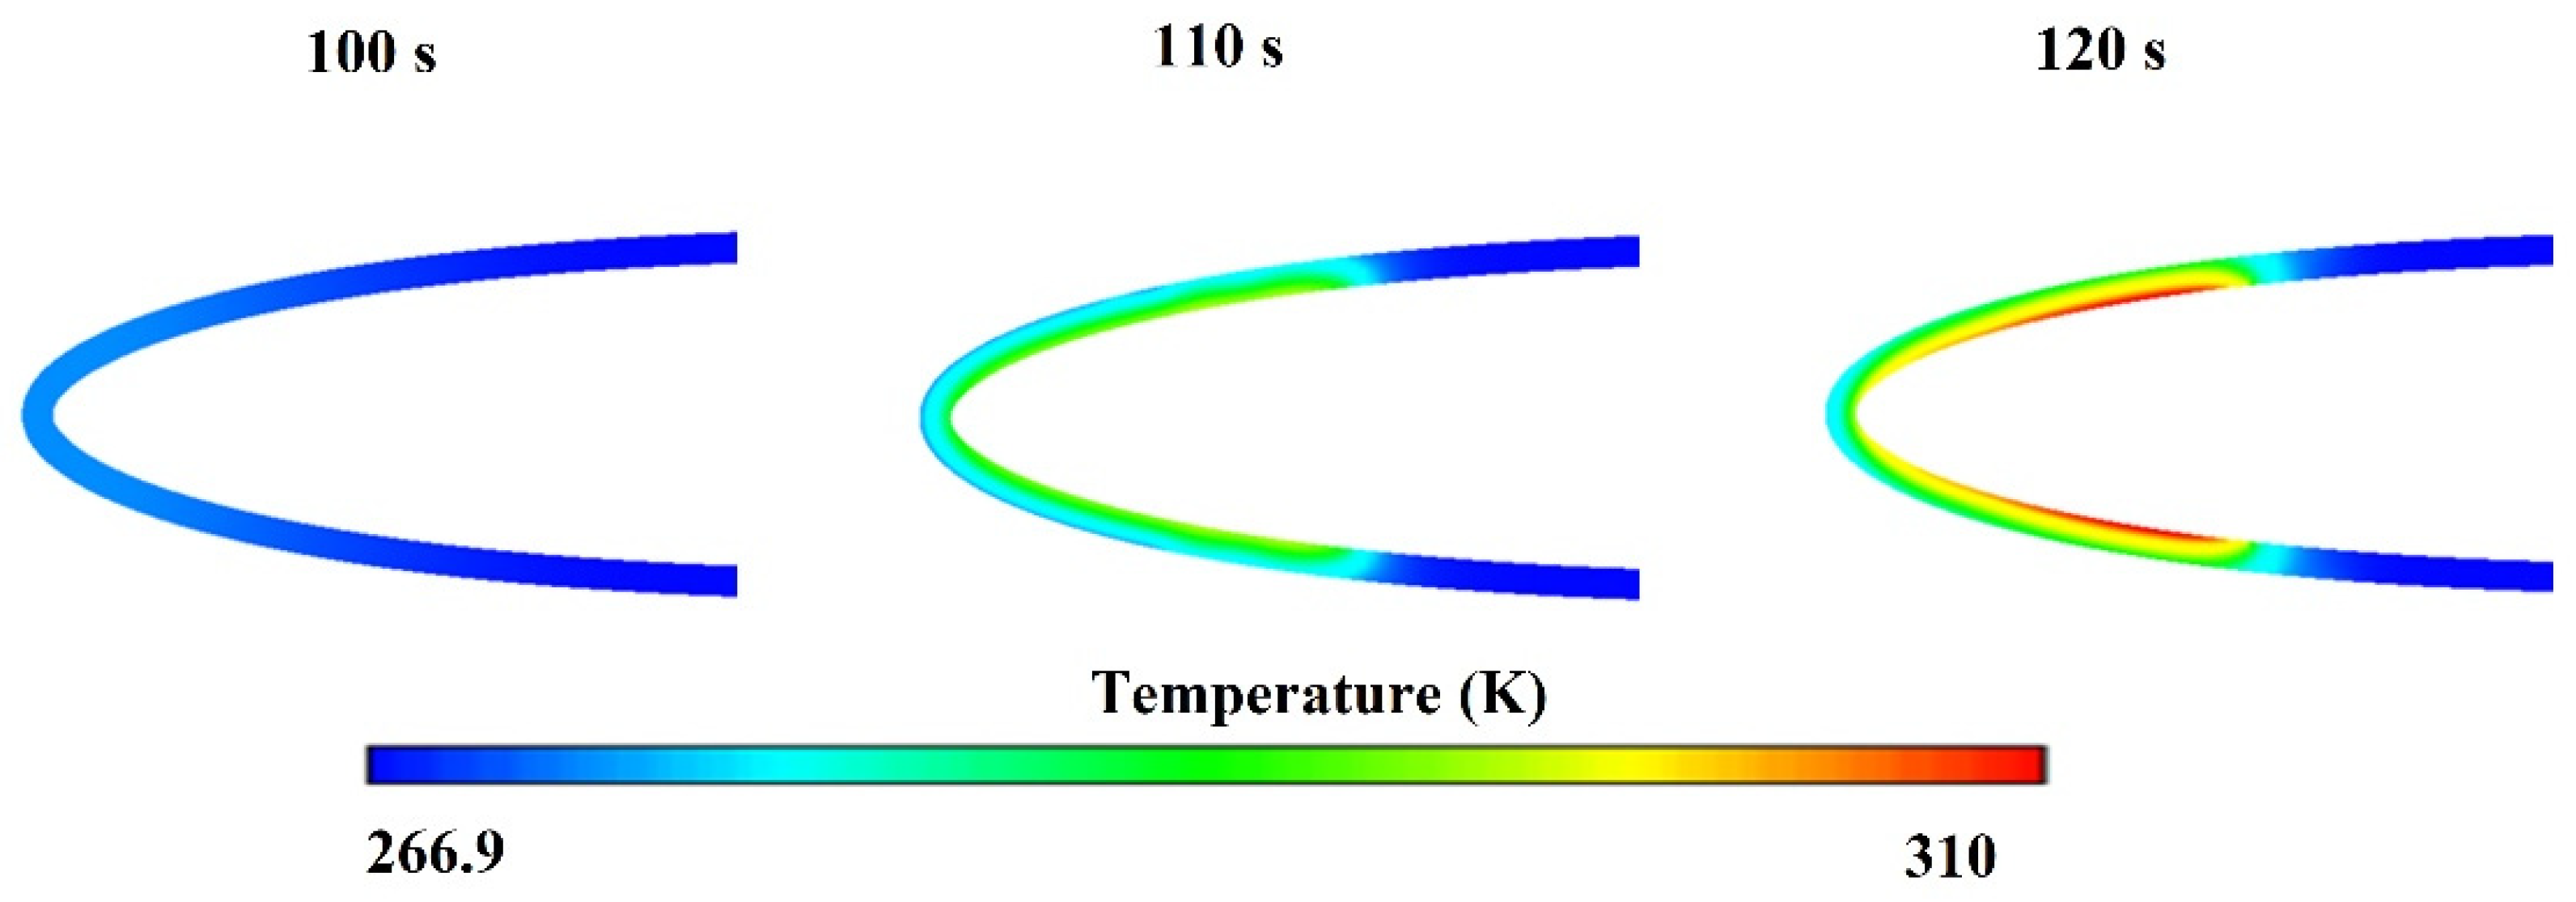
There is a lack of detailed thermal effect during the de-icing process;
(2)
The de-icing mechanism of wind turbine blade surfaces under different wind speeds and heat fluxes has not been reported.
Therefore, the main objectives of this study are as follows: (1) The thermal effect of the wind turbine blade surfaces during the de-icing process is analyzed in detail. (2) The de-icing mechanism of wind turbine blade surfaces under different wind speeds and heat fluxes is explored. (3) The distribution characteristics of runback water and runback ice after melting ice on the surface of the wind turbine blade airfoil are investigated.

2. Model

2.1. Mathematical Model

2.1.1. Airflow Model

The external flow of a wind turbine blade is calculated on the basis of the conservation of mass, momentum, and energy. The model is depicted as follows [29,30]:
The continuity equation is presented in Equation (1):
ρ 1 t + ( ρ 1 V 1 ) = 0
The momentum equation is obtained by Equations (2) and (3):
( ρ 1 V 1 ) t + ( ρ 1 V 1 V 1 ) = σ i j + ρ 1 g
σ i j = σ i j p 1 + τ i j
The energy equation is given by Equation (4):
( ρ 1 E 1 ) t + ( ρ 1 V 1 H 1 ) = [ k 1 ( T 1 ) + V i τ i j ] + ρ 1 V 1 g

2.1.2. Droplet Flow Model

The droplet flow model is based on Euler’s formula to solve the flow field of droplet distribution on wind turbine blades [31]. The model is represented by Equations (5) and (6):
α t + ( α V 2 ) = 0
( α V 2 ) t + ( α V 2 V 2 ) = C D Re 2 24 K α ( V 1 V 2 ) + α ( 1 ρ 1 ρ 2 ) 1 Fr 2
where
Re 2 = ρ 1 d V 1 , V 1 V 2 μ 1 ,   K = ρ 2 d 2 V 1 , 18 L μ 1 ,   Fr = V 1 , L g
The drag coefficient of the water droplet is based on an empirical correlation for flow around spherical droplets [32], which is given by Equations (7) and (8):
C D = ( 24 Re 2 ) ( 1 + 0.15 Re 2 0.687 ) , Re 2 1300
C D = 0.4 , Re 2 1300

2.1.3. Water Film and Ice Accretion Model

The velocity of the water film is a function of the coordinates on the surface and y (normal) to the surface. The problem is simplified by introducing a linear profile for the film velocity normal to the wall, with zero velocity imposed at the wall, which is expressed by Equations (9)–(11) [33,34,35,36]:
V f = y μ f τ 1 , wall
τ 1 , wall = 1 2 C f ρ 1 V 2
C f = [ 3.476 0.707 ln ( k s / S ) ] 2.46
The mass conservation equation is presented by Equation (12):
ρ f [ h f t + ( V f h f ) ] = V β L W C m ˙ evap m ˙ ice
The energy conservation equation includes heat transfer, phase transition, ice deposition, convective heat flow, and radiant heat flow caused by water droplet impact, which is calculated by Equation (13):
ρ f [ h f c f T ˜ t + ( V f h f c f T ˜ ) ] = ( c f T ˜ 2 , + 1 2 V 2 2 ) V β L W C 0.5 m ˙ evap ( L evap L sub 1 ) + m ˙ ice ( L fus c ice T ˜ ) + σ ε ( T 4 T f 4 ) + Q ˙ h

2.1.4. Unsteady Conjugate Heat Transfer

Heat transfer is an unsteady process in which heaters are turned on and off and heat flows through different solid materials. The unsteady heat conduction through a single layer of material M is expressed as (14) [37]:
H M ( T ) t = 2 ( k M ( T ) T ) j x j 2 + S M ( T )
where HM(T) and kM(T) denote the temperature-dependent enthalpy and conductivity of material M, respectively. T represents the temperature. In order to simulate the heating pad, the concept of heat source parameter SM(T) is proposed.

2.2. Geometry and Computational Mesh

The geometric model and flow field of the NACA0012 airfoil commonly used for wind turbine blades are shown in Figure 2. The airfoil has a chord length (C) and span length of 0.1 m and 0.02 m, respectively. The structural element mesh is used in the computational domain, and the normal distance of the first layer of the airfoil mesh is 0.01 mm, as shown in Figure 3. The y+ of the grid is controlled to be around or below 1. The total number of grids in the flow field is 94,000, which ensures high computational accuracy and improves computational efficiency.
The solid structure consists of fiberglass material, which is 1 mm thick. The solid structure model is shown in Figure 4, and the material properties are shown in Table 1. A heater with a length of 29 mm is set inside the solid layer, and the structure of the heater is shown in Figure 5. The solid structure is meshed by structured elements, and the y+ of the mesh is controlled to be around or below 1.
Battisti [38] reported in the book that under the operating conditions of the wind turbine, the ambient temperature range was 233–323 K and the wind speed range was 3–25 m/s in regions such as ridges, grasslands, and islands. In icing events, in-cloud measurements showed that the liquid water content (LWC) varied from 0 to 1 g/m3 (in stratiform clouds) and from 1 to 5 g/m3 (in cumuliform clouds). The median volume diameter (MVD) ranged from 10 μm (in freezing fog) to 5000 μm (in freezing rain). In this study, the de-icing conditions consist of wind speeds of 5–15 m/s, ambient temperatures of 268 K, an LWC of 0.6 g/m3 with an MVD of 50 μm, and an angle of attack of 0°. The de-icing conditions are shown in Table 2.

2.3. Boundary Condition and Solution Method

The external flow field and solid surface of the wind turbine blade airfoil are numerically simulated with far-field boundary conditions and wall boundary conditions, respectively. The specific parameters are presented in Table 2. The detailed solution method is described by reference [29].

2.4. Model Validation

In order to validate the numerical method, the icing experiments reported on the NASA Lewis icing research tunnel with a chord length of 0.914 m in the NACA 0012 airfoil reported by al-Khalil et al. [39] were selected for validation. The environmental conditions are an air velocity of 44.7 m/s, an LWC of 0.78 g/m3, an MVD of 20 μm, an environmental temperature of 266.48 K, and an angle of attack of 0°. The multilayer structure of the leading-edge protection area consists of four layers: an erosion shield, an elastomer layer, a fiberglass layer, and a silicone foam layer. Seven heaters are installed in the elastomer layer.
It is illustrated in Figure 6 for the simulated temperature of heater 3. The simulation result is basically similar to the experimental temperature variation curve. The experimental temperature is slightly lower than the simulation results at the beginning stage when the solid structure starts to heat up. The temperature of the experiment is about 270 K, which is about 3 K lower than the simulation temperature. The maximum error between the simulation result and the experimental data is 1.2%. The simulation result is basically consistent with the experimental data. The temperature difference between the experiment and simulation may be attributed to the following factors: (1) the exact location of the temperature measurement points is not mentioned in the experiment, while the simulation results are averaged over the heated area, and (2) the runback water may form beads or rivulet flow and does not completely wet the surface, leading to lower surface temperature.

3. Results and Discussion

In this section, de-icing simulations are performed to analyze the de-icing performance at different wind speeds and heat fluxes under conditions, as shown in Table 3.
The heating sequence is shown in Table 4, with a de-icing cycle of 120 s. The heater is inactive within the first 100 s and starts within 100~120 s. The heating sequence was chosen with reference to the icing experiments reported by al-Khalil et al. [39], as shown in Table 4. The cyclic heating method was chosen for electrothermal de-icing, with a single cycle of 120 s, an unheated time/heating time of 100/20 s, and a heat flux of 8000/10,000/12,000 W/m2. After the heating pad is turned off, the remaining heat can still be used for de-icing. Moreover, keeping the ratio of heating and non-heating time constant reduces the presence of runback water on the surface, reducing the runback ice. Therefore, the heating sequence and heat flux selected in this paper are more effective for the de-icing process.
The water droplet collection coefficient is displayed in Figure 7. The droplet collection coefficient reaches a maximum at the stagnation point and decreases as the boundary layer develops while moving backward. This trend is similar to reference [29]. The droplet collection coefficient grows with increasing wind speed, and there is no droplet impingement in the wake of the airfoil.
The effect of wind speed on the de-icing characteristics of a wind turbine blade airfoil surface is investigated. Figure 8, Figure 9, Figure 10, Figure 11, Figure 12, Figure 13, Figure 14, Figure 15 and Figure 16 depict the ice shape, ice thickness distribution, surface temperature distribution, and surface temperature contour on the airfoil surface at different wind speeds for a heat flux of 10,000 W/m2. When the de-icing time is 10 s, the majority of the ice is melted, as shown in Figure 8, Figure 11 and Figure 14. At a wind speed of 5 m/s, the peak ice thickness decreased from 0.28 mm to 0.068 mm (a 75% reduction), and the ice distribution reduced by 75%. At a wind speed of 10 m/s, the maximum ice thickness dropped from 0.53 mm to 0.18 mm (a 66% reduction), and the ice distribution decreased by 39.9%. At a wind speed of 15 m/s, the maximum ice thickness diminished from 0.77 mm to 0.45 mm (a 41.6% reduction), and the ice distribution decreased by 25%. In similar phenomena as in the literature [40], the melting generally occurs first at the end of the ice sheet, which leads to an increase in the surface temperature of the airfoil in the ice-free position. This is due to the large thermal resistance of the air, which has weak convective heat transfer with the airfoil surface, resulting in less heat dissipation and a higher airfoil surface temperature, as shown in Figure 9, Figure 12 and Figure 15. The temperature of the adjacent regions in the heated area increases due to thermal conduction, and the heated area is limited due to the low thermal conductivity of the structural material, as shown in Figure 10, Figure 13 and Figure 16. Water remains liquid in the heated region and forms ice in the downstream. Therefore, runback ice begins to appear downstream of the heated area at wind speeds of 10 m/s and 15 m/s. When the de-icing time is 20 s, the ice on the leading edge of the airfoil is completely melted, and the surface temperature exceeds 273.15 K. At wind speeds of 10 m/s and 15 m/s, the peak thickness of runback ice increases with an increase in de-icing time. This is due to the fact that the water melted by ice accumulation at the leading edge moves backward under the action of inertial force, forming thicker ice on the surface where the temperature is below 273.15 K. At the same time, the coverage range of runback ice decreases, due to runback ice melting caused by an increase in airfoil surface temperature.
The impact of heat flux on the de-icing characteristics of a wind turbine airfoil surface is investigated. Figure 14, Figure 15, Figure 16, Figure 17, Figure 18, Figure 19, Figure 20, Figure 21 and Figure 22 illustrate the ice shape, ice thickness distribution, surface temperature distribution, and surface temperature contour on the airfoil surface for different heat fluxes at a wind speed of 15 m/s. When the de-icing time is 10 s, the ice begins to melt, as shown in Figure 14, Figure 17 and Figure 20. At a heat flux of 8000 W/m2, the peak ice thickness decreased from 0.77 mm to 0.53 mm (a 31.2% reduction), and the ice distribution decreased by 16.1%. At a heat flux of 10,000 W/m2, the peak ice thickness dropped from 0.77 mm to 0.45 mm (a 41.6% reduction), and the ice distribution declined by 25%. At a heat flux of 12,000 W/m2, the peak ice thickness diminished from 0.77 mm to 0.27 mm (a 64.9% reduction), and the ice distribution decreased by 25%. The secondary freezing occurs on the surfaces of the airfoil after ice melting, as shown in Figure 17 and Figure 20; this phenomenon is similar to the literature in [14]. The runback water moves backward, which freezes again on the surface where the temperature is below 273.15 K, resulting in discontinuous ice accumulation. When the de-icing time is 20 s, the ice on the leading edge of the airfoil is completely melted, and the surface temperature exceeds 273.15 K. As heat flux grows, the peak thickness of runback ice increases. This is due to the fact that a larger heat flux causes more volume of de-icing per unit time, forming more runback water to freeze into thicker runback ice on the surface where temperatures are below 273.15 K. The surface temperature rises with increasing heat flux, leading to a decrease in the coverage of the runback ice.
The effects of wind speed and heat flux on the peak runback ice thickness at different de-icing times are investigated. Figure 23a illustrates the peak ice thickness of the runback ice at a de-icing time of 10 s. It is observed that the wind speed has a much greater effect on the runback ice than heat flux. At a wind speed of 5 m/s, no runback ice is generated at different heat fluxes, and the peak ice thickness is 0. At a wind speed of 10 m/s, the maximum ice thicknesses at 8000 W/m2, 10,000 W/m2, and 12,000 W/m2 are 0.003 mm, 0.0036 mm, and 0.0041 mm, respectively. The peak ice thickness at a heat flux of 12,000 W/m2 is 36.7% larger than that at 8000 W/m2. At a wind speed of 15 m/s, the peak ice thicknesses of 8000 W/m2, 10,000 W/m2, and 12,000 W/m2 are 0.037 mm, 0.0425 mm, and 0.047 mm, respectively.
Figure 23b illustrates the peak ice thickness of the runback ice at a de-icing time of 20 s. It is noticed that the variation of the peak ice thickness is similar to that at a de-icing time of 10 s. At a wind speed of 5 m/s, no runback ice is generated. At a wind speed of 10 m/s, the maximum ice thicknesses at a heat flux of 8000 W/m2, 10,000 W/m2, and 12,000 W/m2 are 0.037 mm, 0.044 mm, and 0.051 mm, respectively. The peak ice thickness at a heat flux of 12,000 W/m2 is 37.8% larger than that at 8000 W/m2. At a wind speed of 15 m/s, the peak ice thicknesses at 8000 W/m2, 10,000 W/m2, and 12,000 W/m2 are 0.053 mm, 0.071 mm, and 0.081 mm, respectively. The peak ice thickness at a heat flux of 12,000 W/m2 is 52.8% larger than that at 8000 W/m2. The effect of heat flux on runback ice is smaller than the effect of wind speed on runback ice. This is due to the low thermal conductivity of the airfoil material, which makes the heat transfer weak, resulting in a smaller effect of heat flux on runback ice.

4. Conclusions

In this study, a numerical simulation is used to investigate the effects of wind speed and heat flux on the electrothermal de-icing characteristics. The following conclusions were reached:
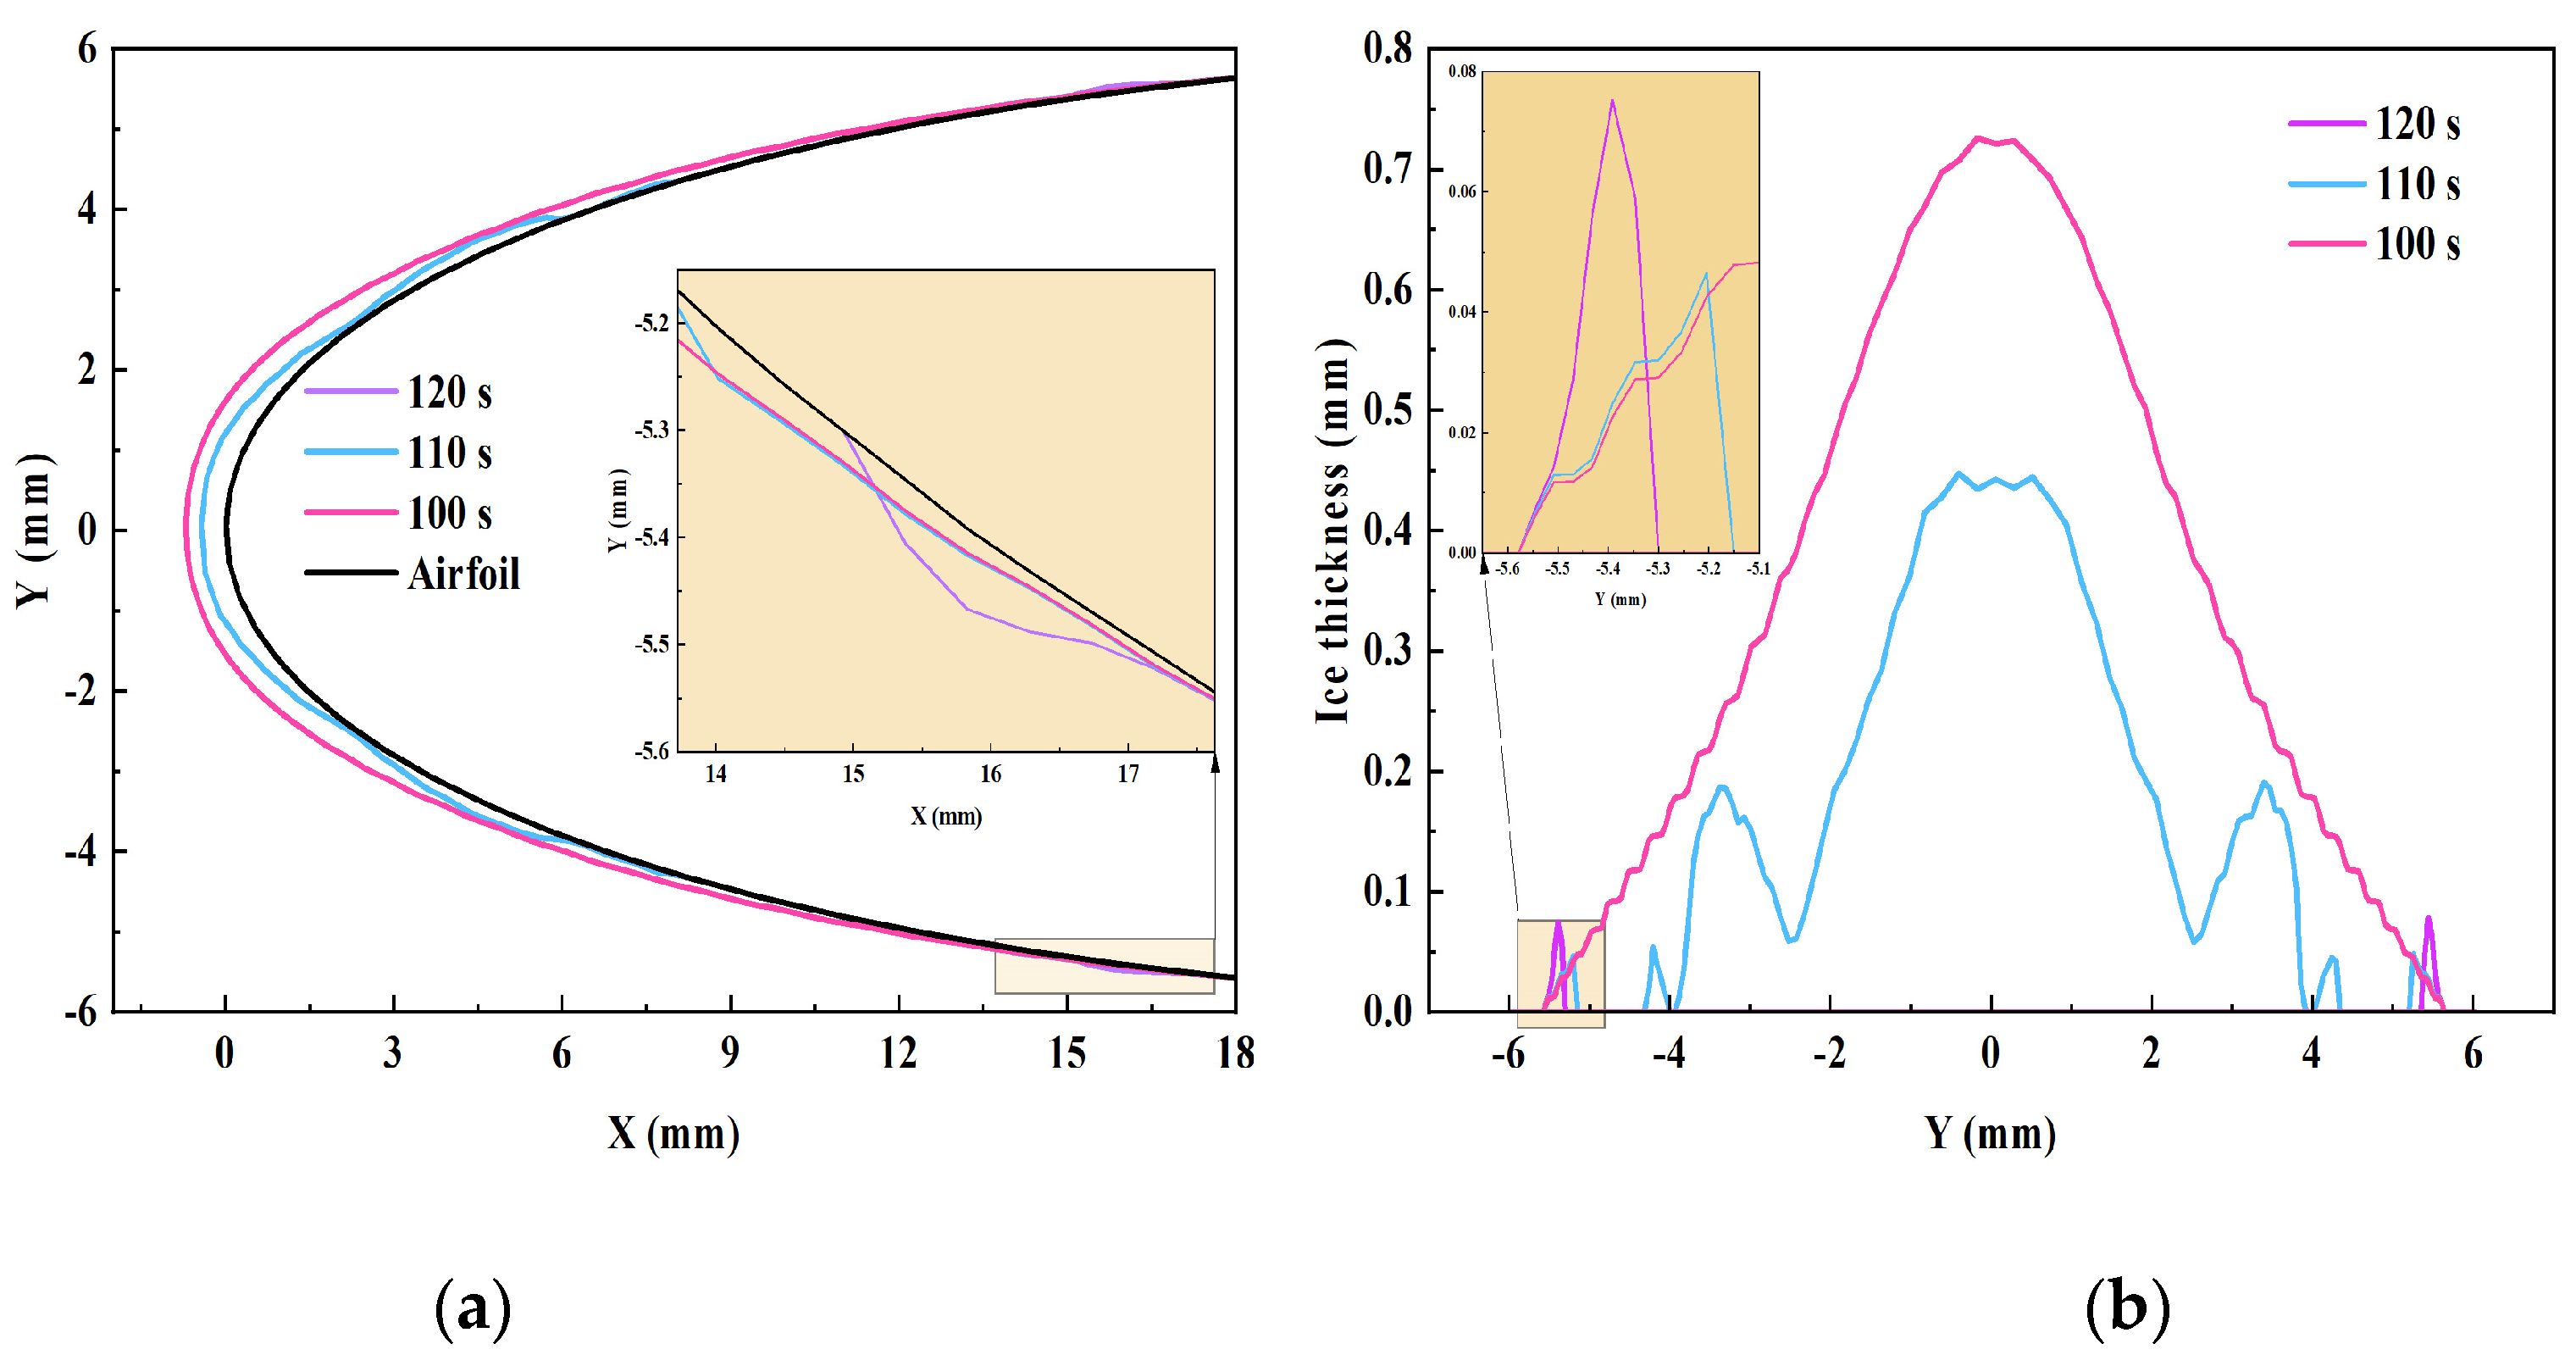
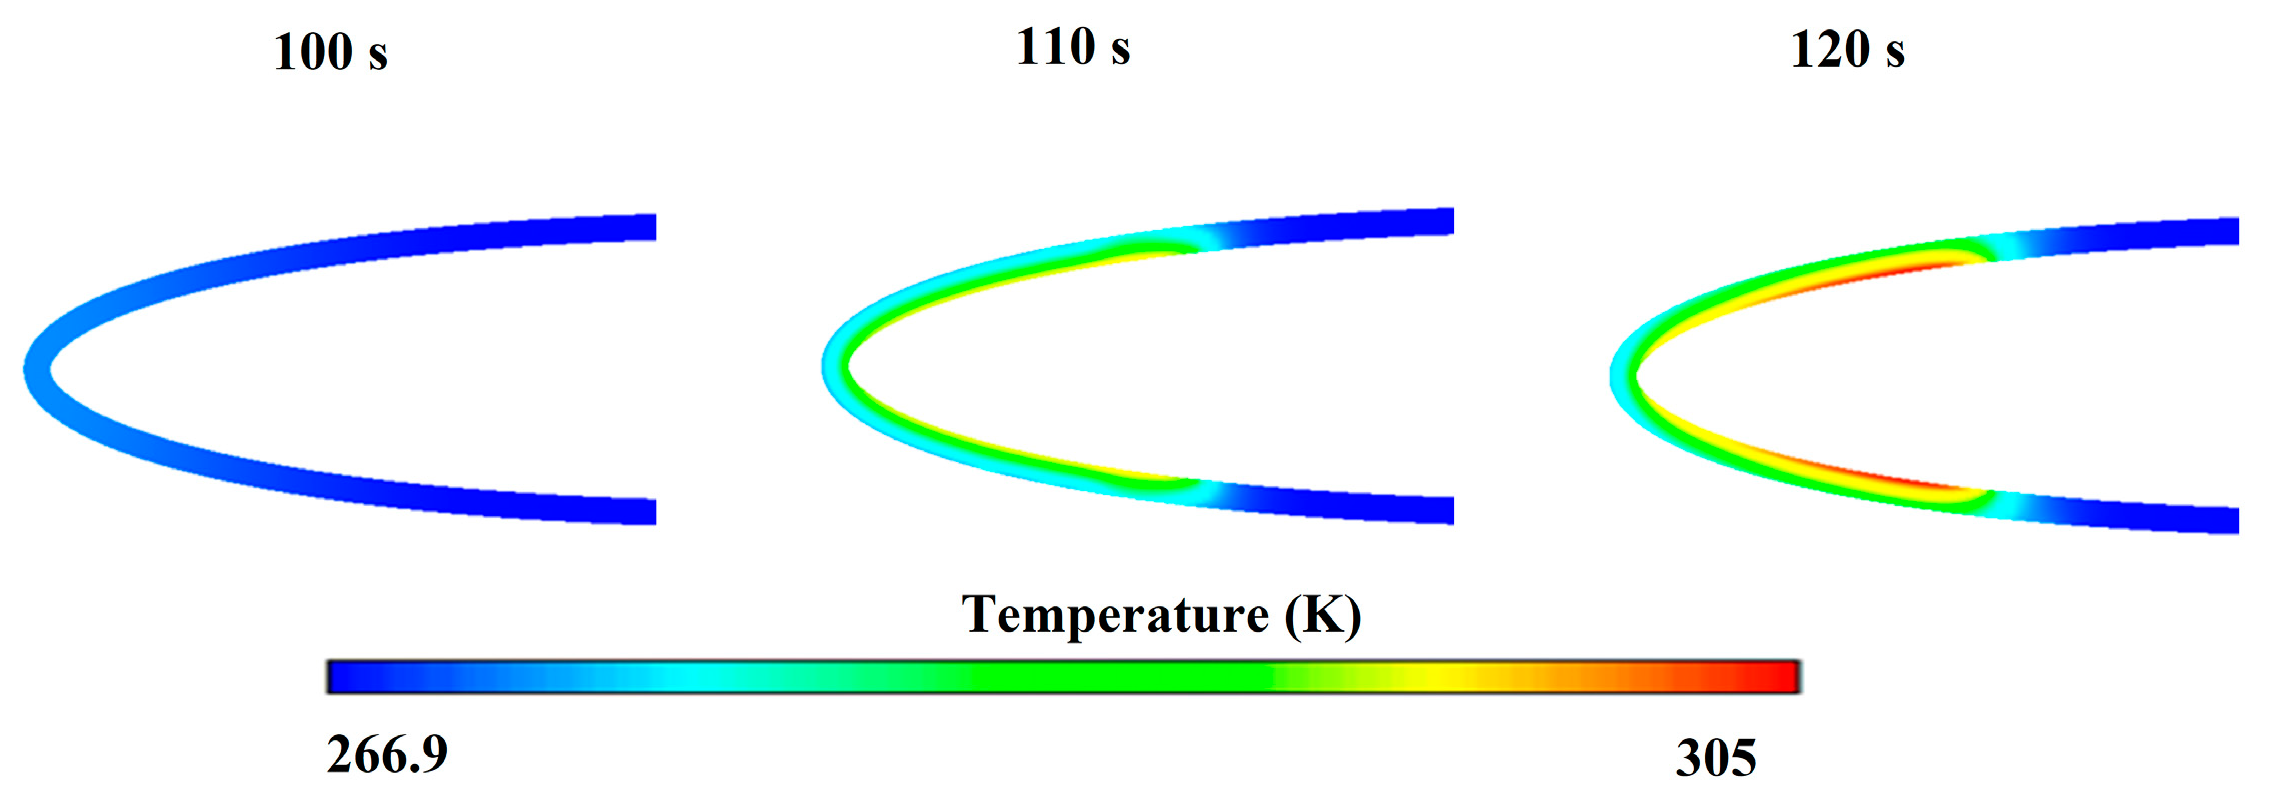
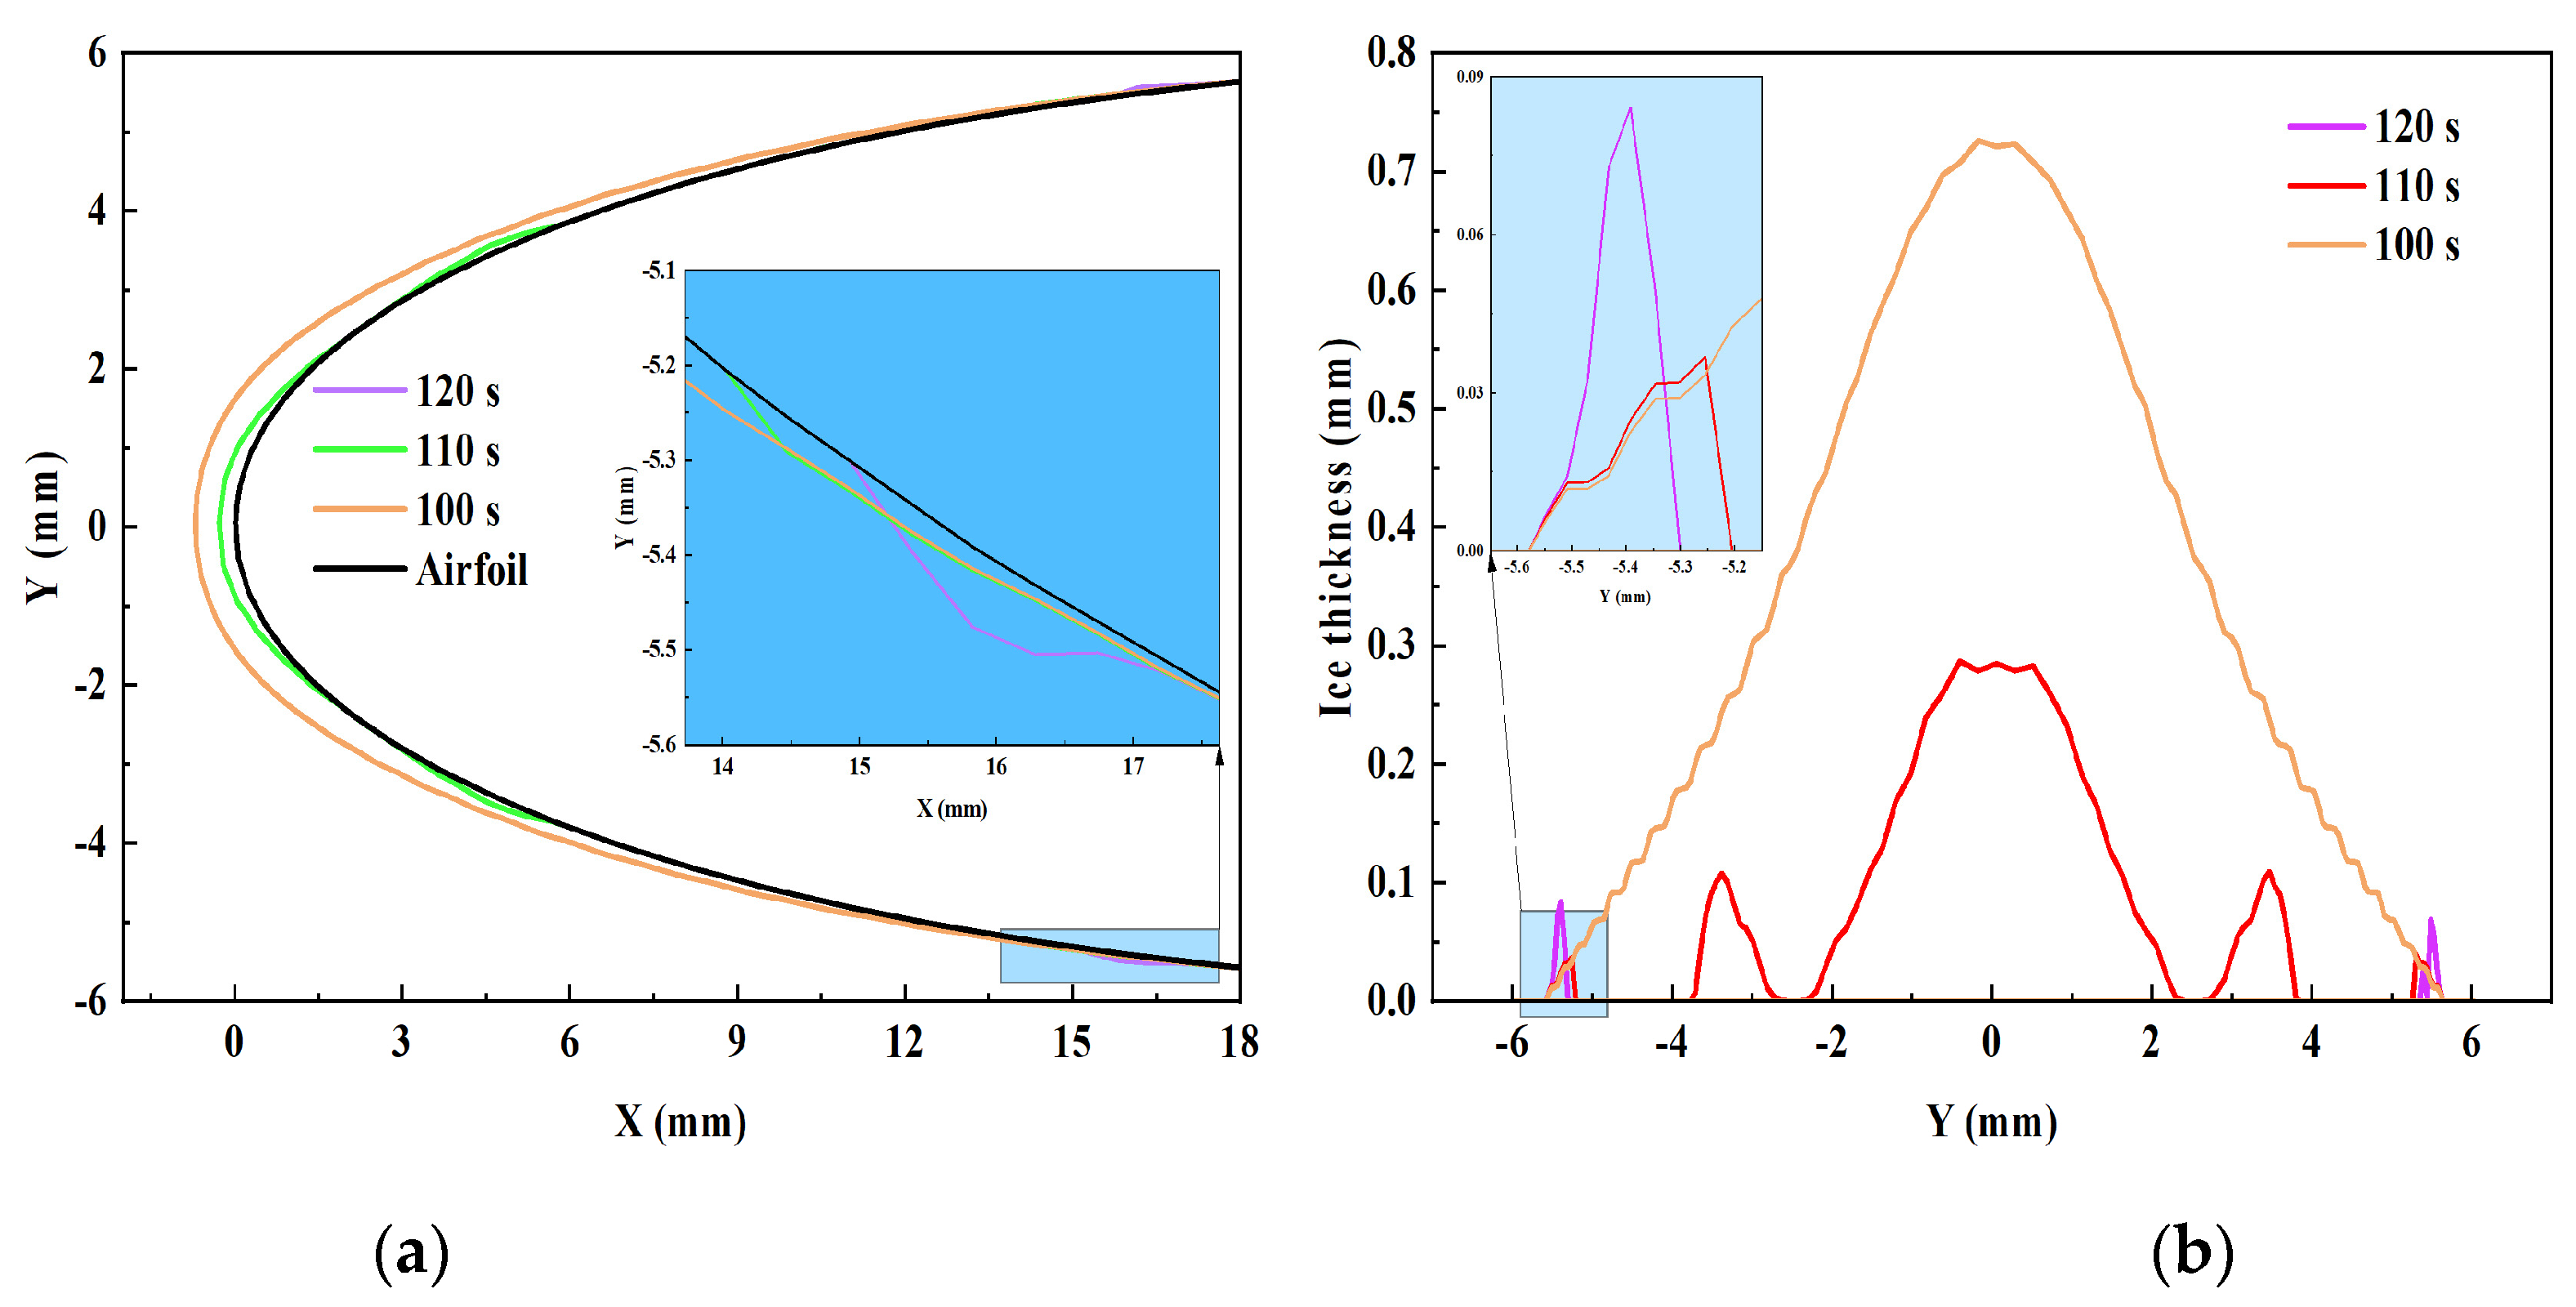
  • When the de-icing time is 10 s with a heat flux of 10,000 W/m2, the peak ice thickness on the leading edge of the airfoil surface decreases from 0.28 mm to 0.068 mm, from 0.53 mm to 0.18 mm, and from 0.77 mm to 0.45 mm at wind speeds of 5 m/s, 10 m/s, and 15 m/s, respectively. The ice distribution range was reduced by 75%, 39.9%, and 25%, respectively.
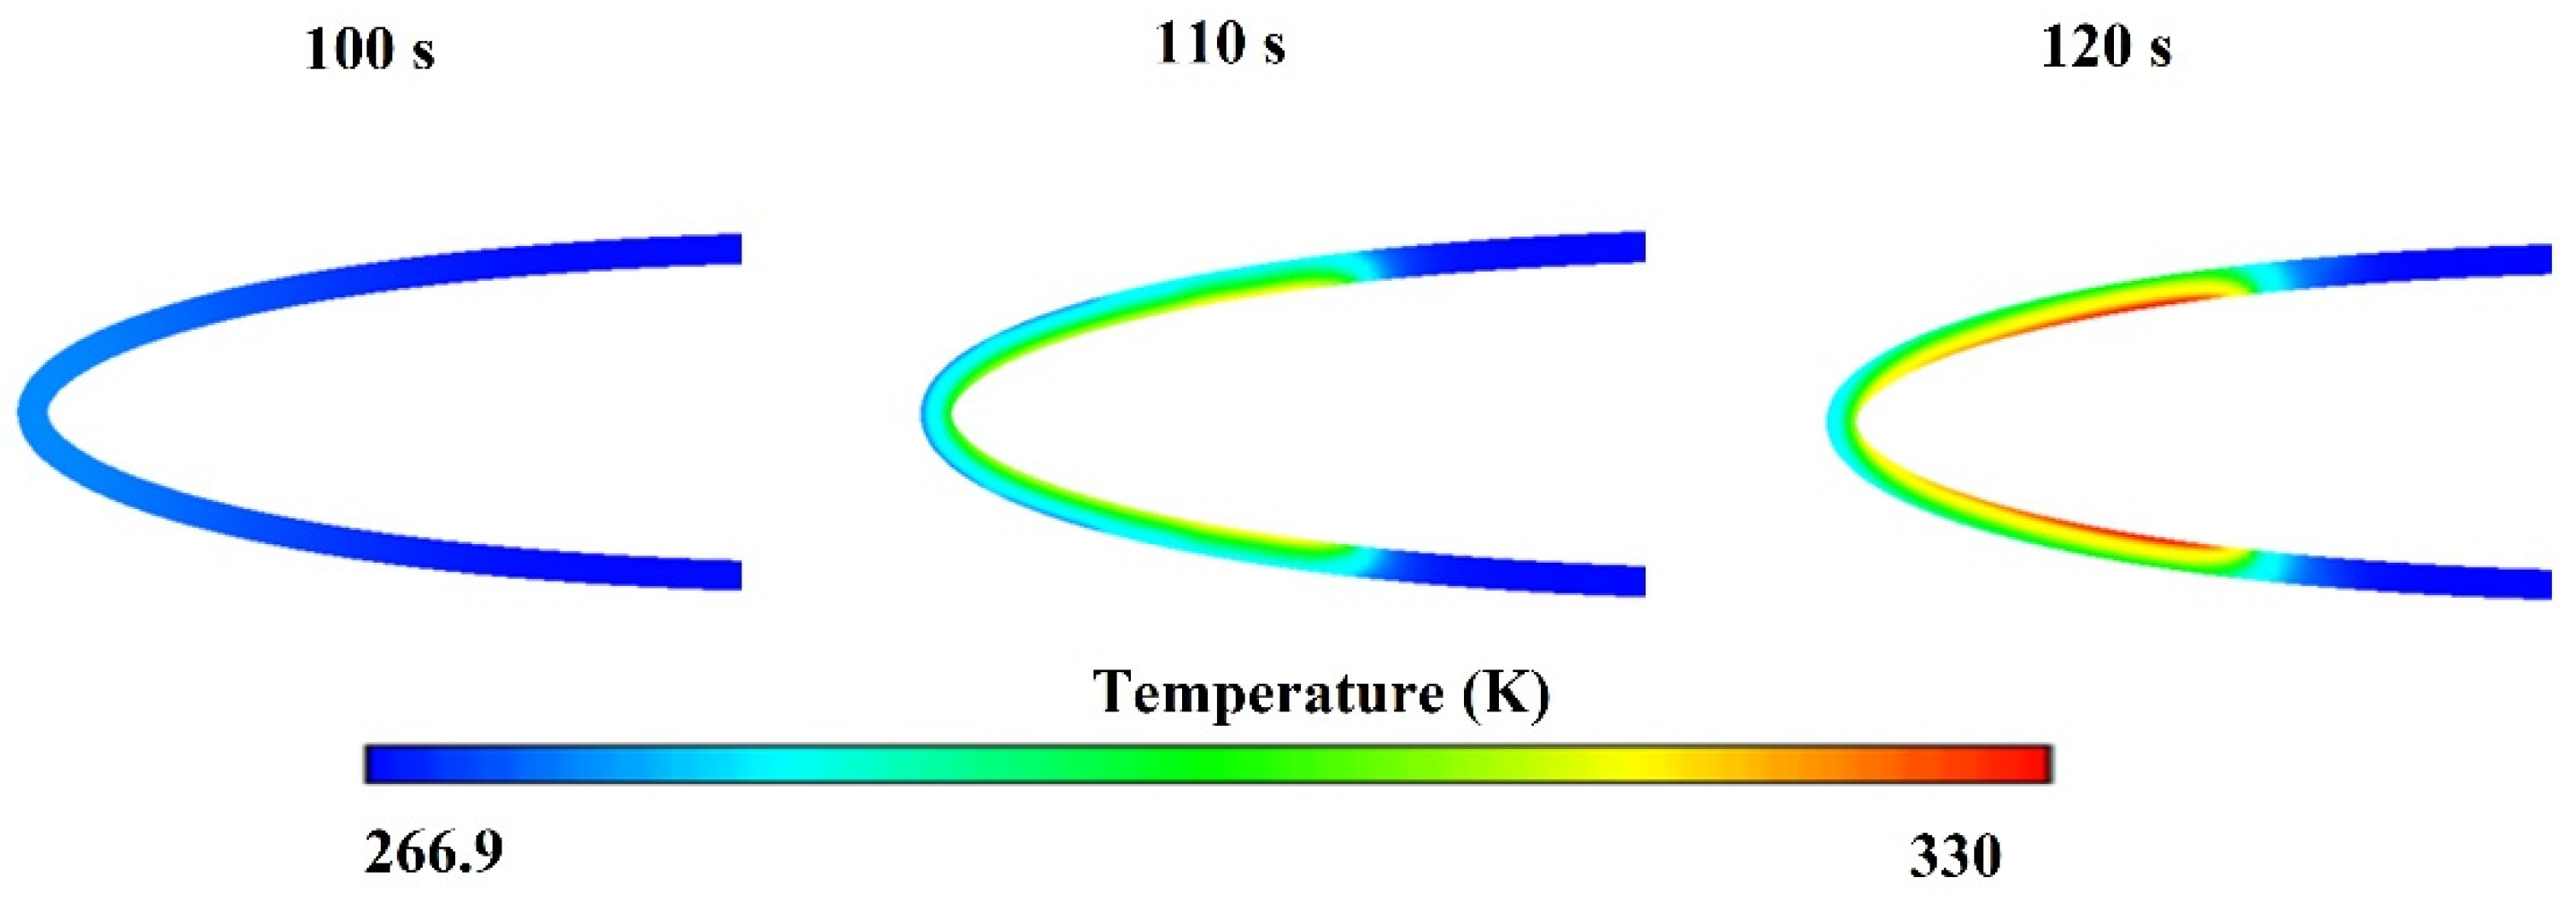
  • When the de-icing time is 10 s with a wind speed of 15 m/s, the peak ice thickness on the leading edge of the airfoil surface decreases by 31.2%, 41.6%, and 64.9% at a heat flux of 8000, 10,000, and 12,000 W/m2, respectively. Owing to an increase in surface temperature, the ice distribution range reduces by 16.1%, 25%, and 33.3%, respectively.
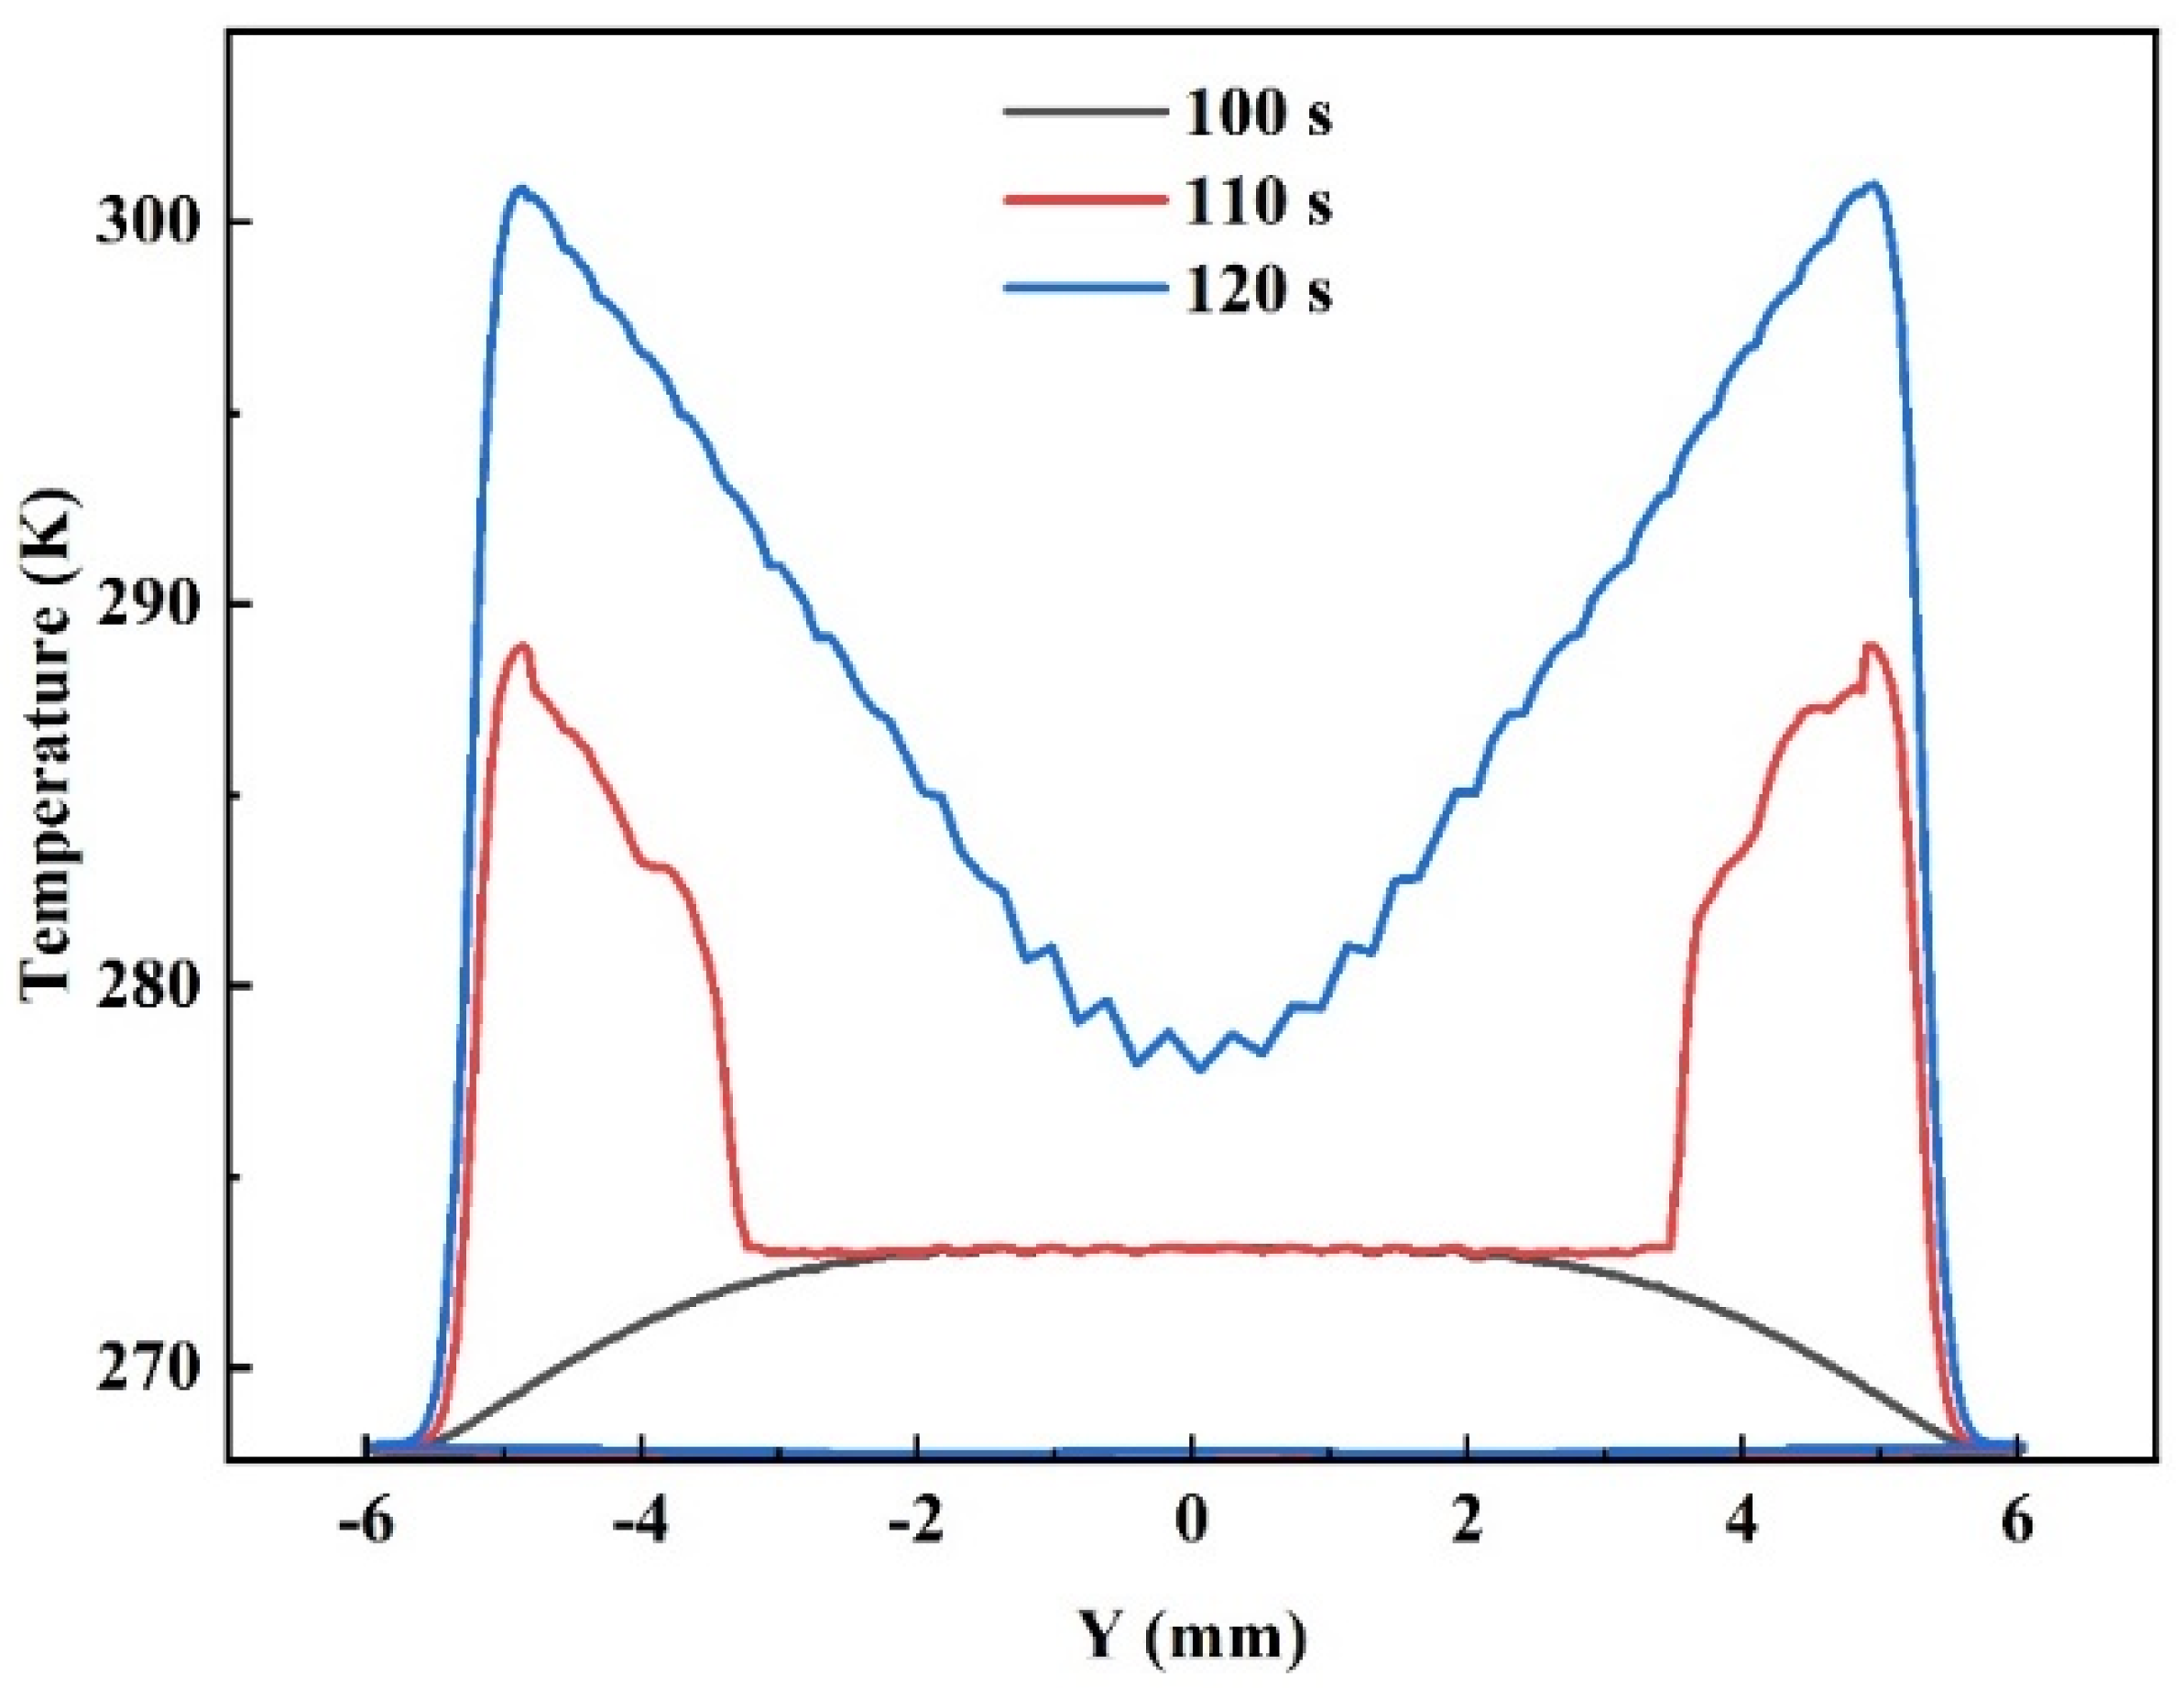
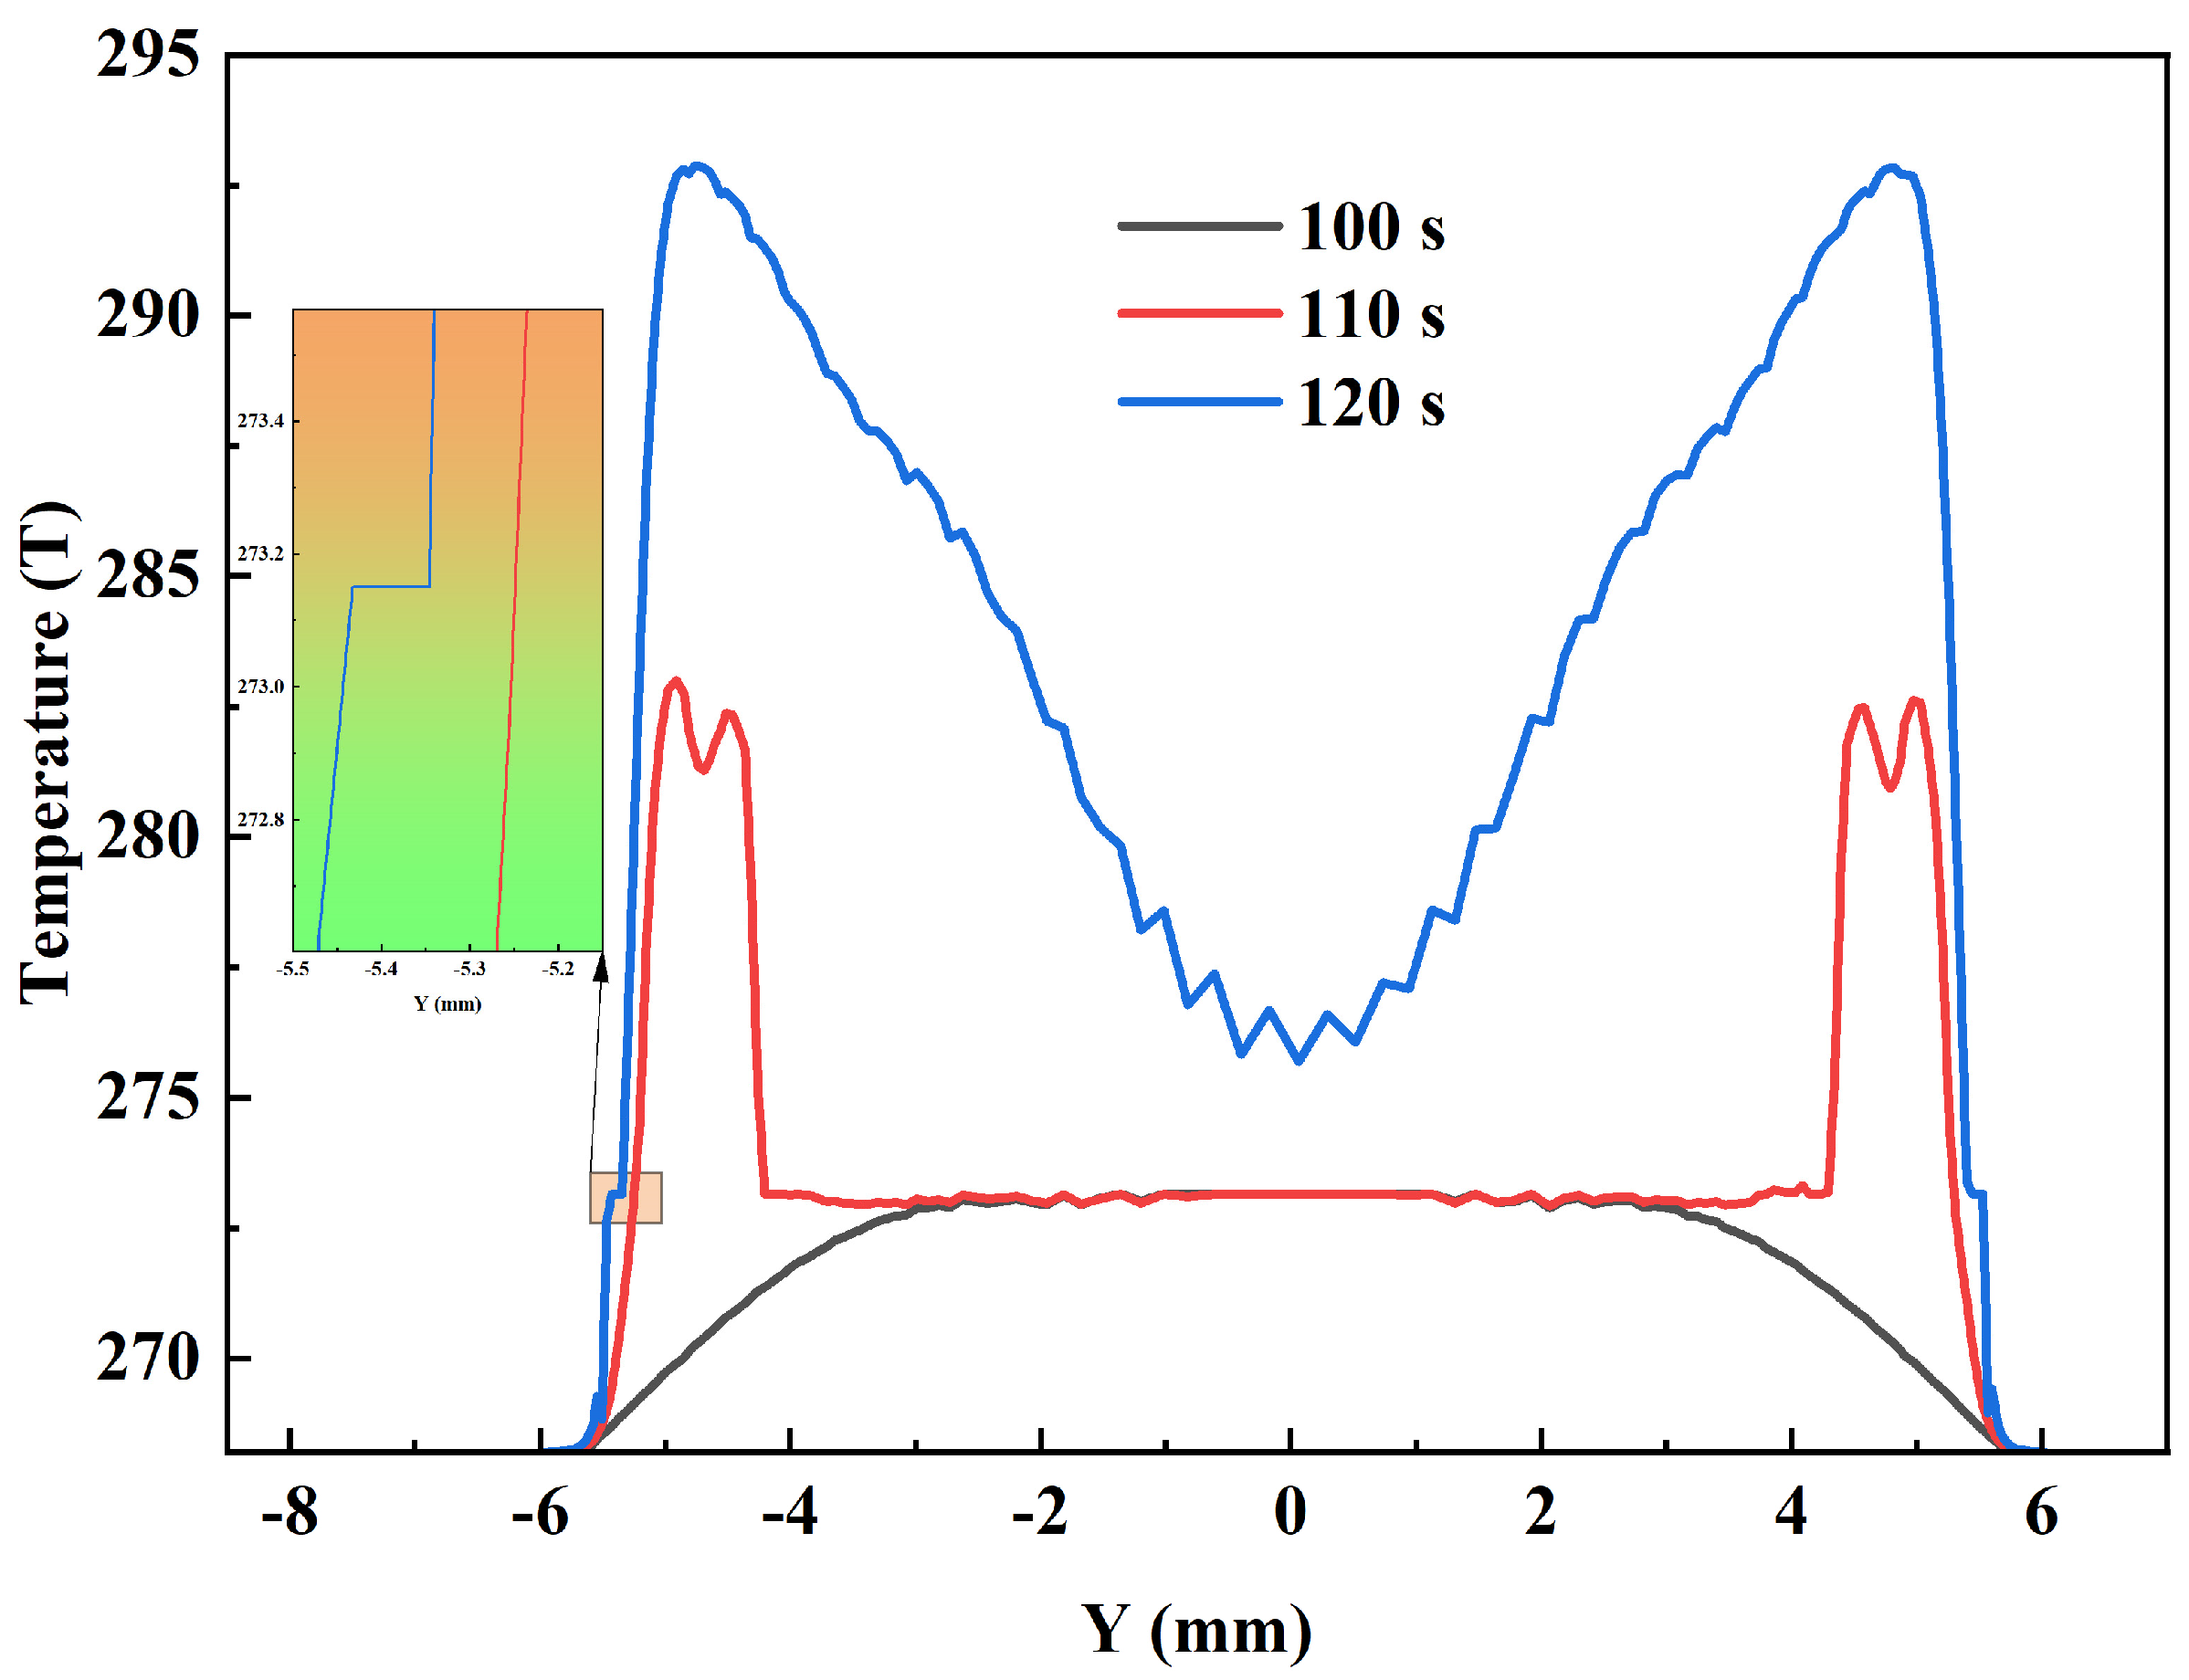
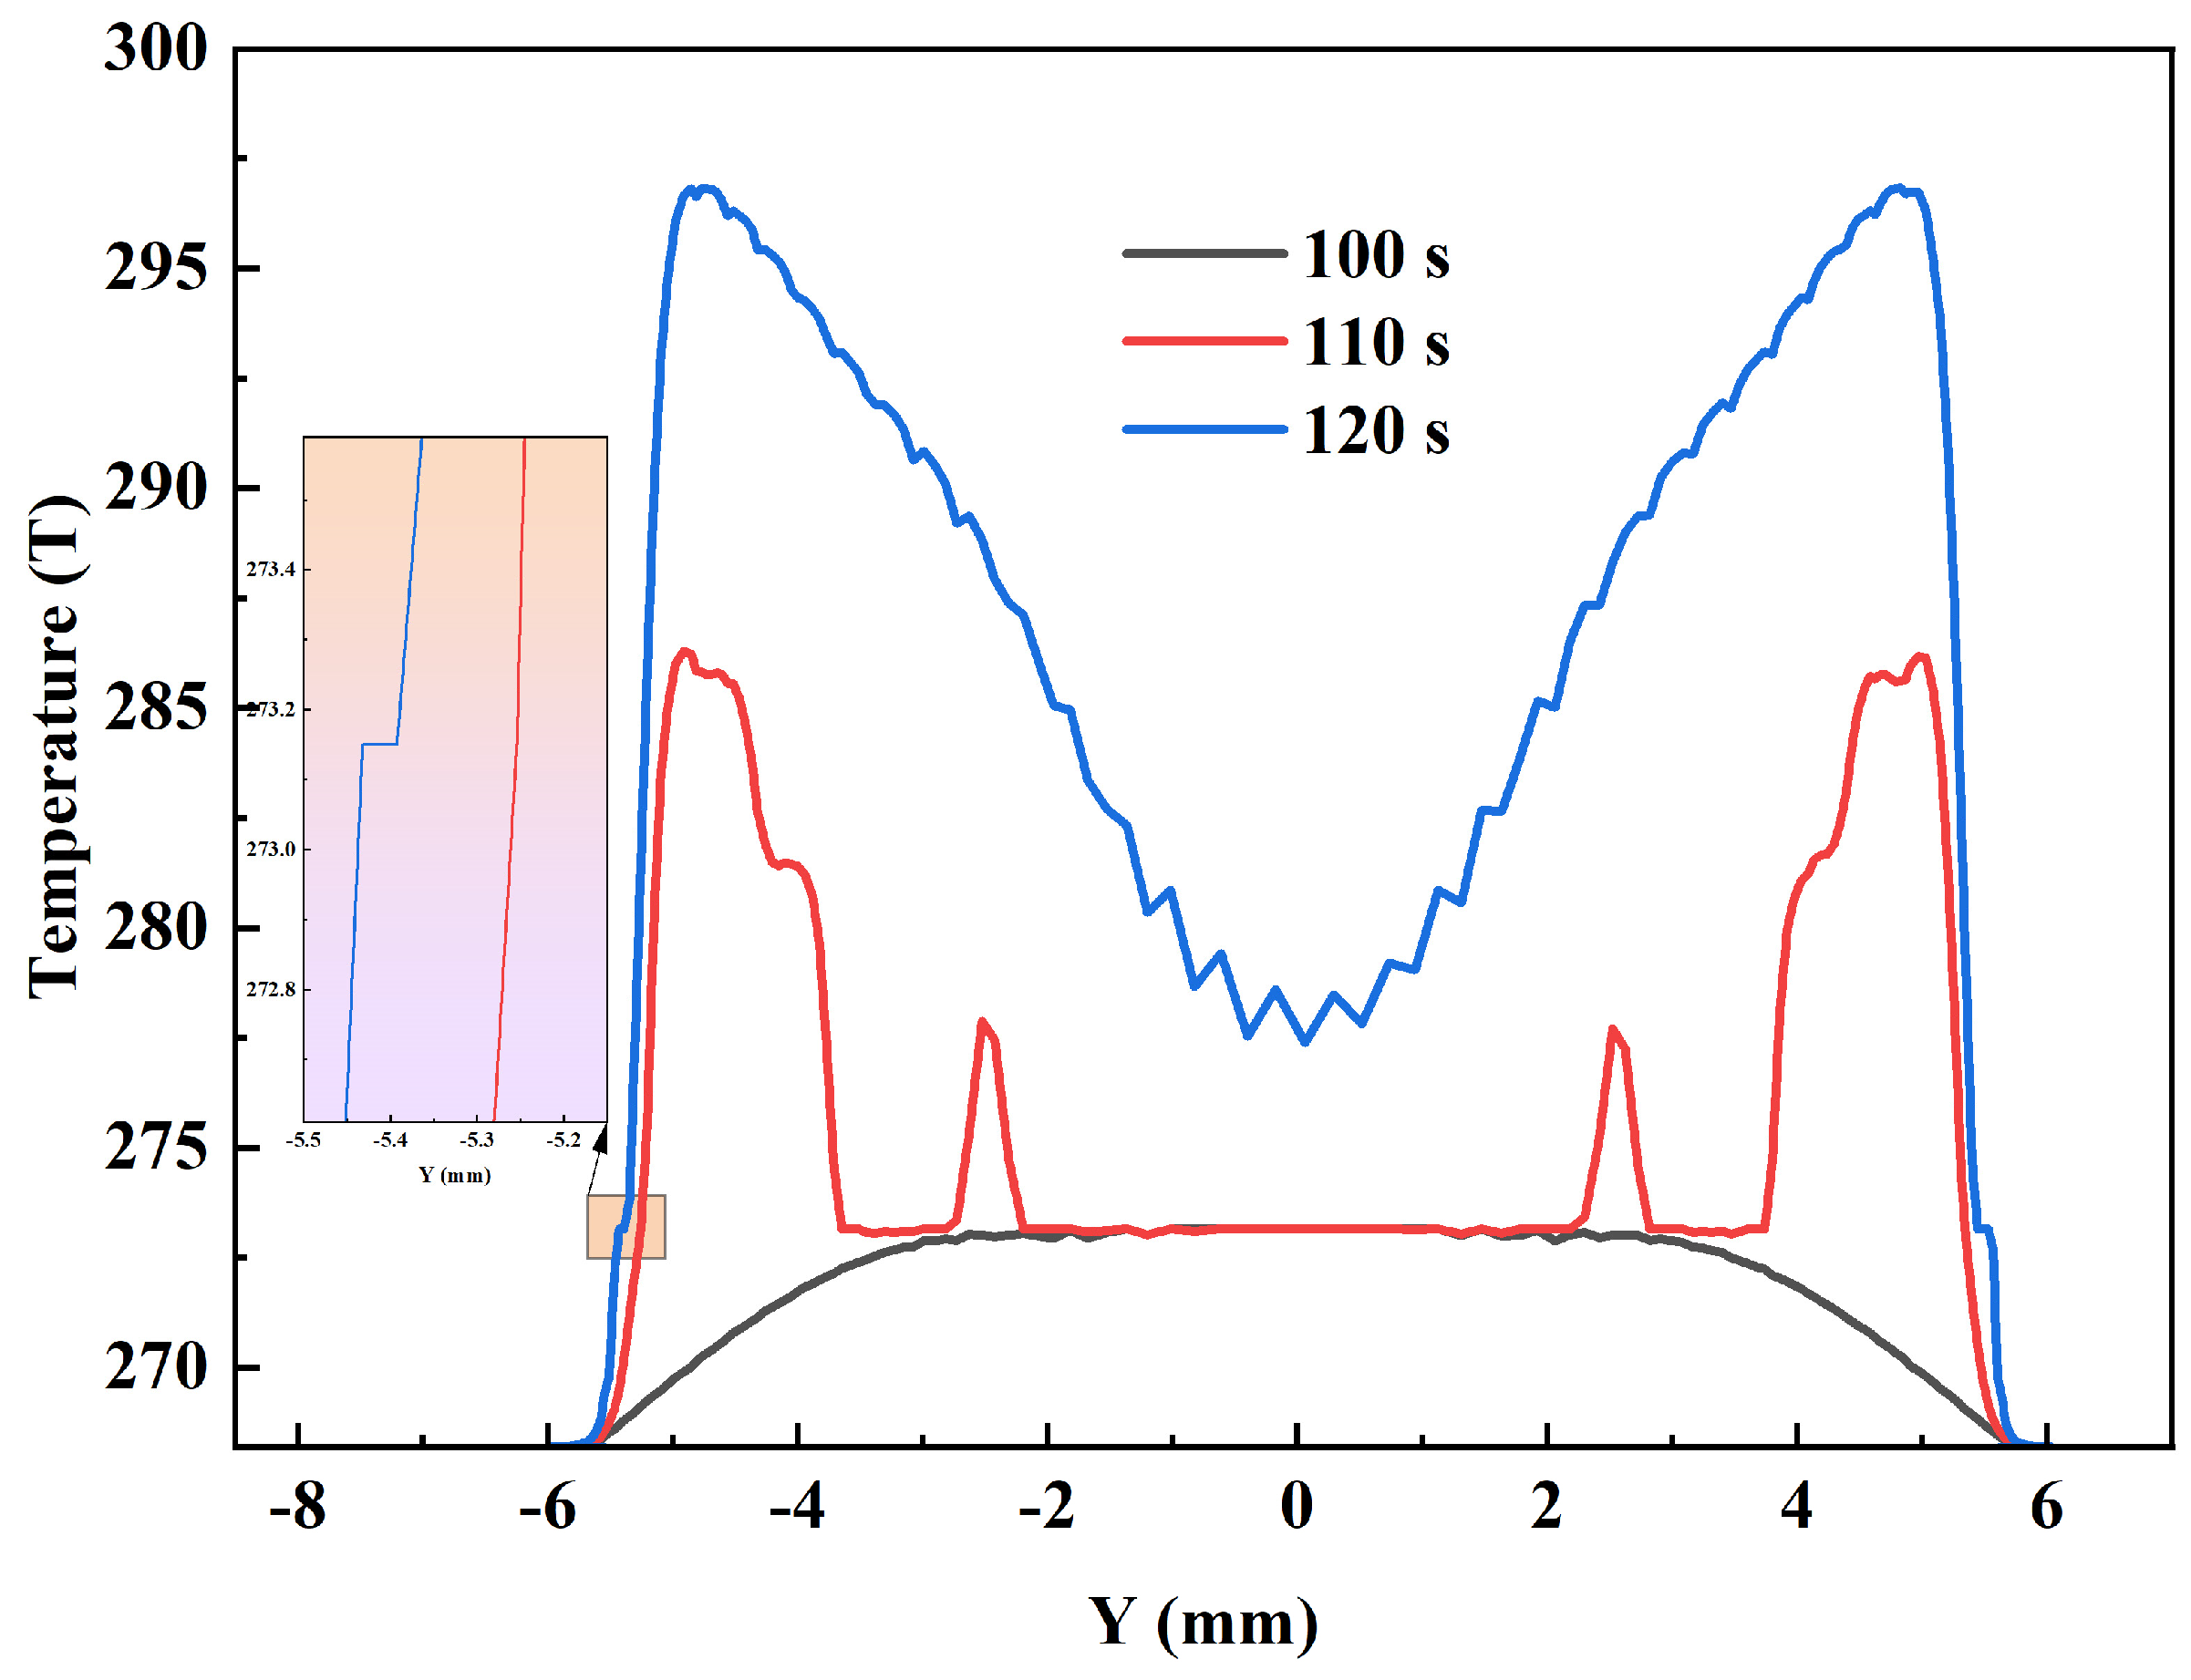
  • With an increase in de-icing time, the peak thickness of runback ice increases. This is due to the fact that the water melted by ice accumulation at the leading edge moves backward under the action of inertial force, forming thicker ice on the surface where the surface temperature is below 273.15 K.
  • The coverage range of runback ice decreases with an increase in heat flux due to the increase in surface temperature. The surface temperature in the ice-free area is significantly higher than that in the ice-melting area, due to high thermal resistance in the ice-free area.
In the follow-up study, the effects of ambient temperature and heating sequence on the de-icing characteristics of wind turbine blades will be explored, optimizing thermal distribution on the surfaces of wind turbine blades, which will provide an effective reference for the anti-icing coating layout of wind turbine blades.

Author Contributions

Conceptualization, Z.X. and Y.L. (Yan Li); methodology, T.Z. and Z.X.; software, T.Z.; validation, T.Z.; formal analysis, Y.L. (Yangyang Lian); investigation, T.Z.; data curation, T.Z. and Y.L. (Yangyang Lian); writing—original draft preparation, T.Z.; writing—review and editing, Z.X.; supervision, Z.X. and Y.L. (Yan Li); funding acquisition, Z.X. All authors have read and agreed to the published version of the manuscript.

Funding

This study was supported by the National Natural Science Foundation of China (Grant No. 52106228) and the Key Laboratory of Icing and Anti/De-icing of CARDC (Grant No. IADL 20230114).

Informed Consent Statement

Not applicable.

Data Availability Statement

Data are contained within the article.

Conflicts of Interest

The authors declare no conflicts of interest.

Nomenclature

c chord length (m) T temperature (K)
c f the specific heat capacity of the water film (J/kg K) T ˜ the interface equilibrium temperature (°C)
c ice the specific heat capacity of the ice (J/kg K) V velocity (m/s)
C D drag coefficient y the distance normal to the wall (m)
C f friction coefficient
d characteristic length (m) α droplet volume fraction
k thermal conduction coefficient (W/m K) β droplet collection efficiency
k s surface roughness (m) ε emissivity
K inertia parameter μ dynamic viscosity (Pa s)
L latent heat (J/kg) τ shear stress (kg/m s2)
E internal energy (J/kg)
Fr Froude number 1 air
h f water film thickness (m) 2 droplet
H internal enthalpy (J/kg) evap evaporation
L W C liquid water content (g/m3) fus fusion
Re Reynolds number f water film
m ˙ mass rate per unit area (kg/m2·s) ice ice
Q ˙ h heat flux (W/m2) subl sublimation
g gravity vector (m/s2) free stream
t time (s)

References

  1. Tong, G.; Li, Y.; Tagawa, K.; Feng, F. Effects of blade airfoil chord length and rotor diameter on aerodynamic performance of straight-bladed vertical axis wind turbines by numerical simulation. Energy 2023, 265, 126325. [Google Scholar] [CrossRef]
  2. Xu, Z.; Zhang, T.; Lian, Y.; Feng, F. A parametric study on the effect of liquid water content and droplet median volume diameter on the ice distribution and anti-icing heat estimation of a wind turbine airfoil. Results Eng. 2024, 22, 102121. [Google Scholar] [CrossRef]
  3. Li, Y.; Sun, C.; Jiang, Y.; Yi, X.; Xu, Z.; Guo, W. Temperature effect on icing distribution near blade tip of large-scale horizontal-axis wind turbine by numerical simulation. Adv. Mech. Eng. 2018, 10, 1687814018812247. [Google Scholar] [CrossRef]
  4. Wang, C.; Lin, W.; Lin, X.; Wu, T.; Meng, Z.; Cai, A.; Xu, Z.; Li, Y.; Feng, F. The influence of angle of attack on the icing distribution characteristics of DU97 blade airfoil surface for wind turbines. Coatings 2024, 14, 160. [Google Scholar] [CrossRef]
  5. Stoyanov, D.B.; Nixon, J.D.; Sarlak, H. Analysis of derating and anti-icing strategies for wind turbines in cold climates. Appl. Energy 2021, 288, 116610. [Google Scholar] [CrossRef]
  6. Pryor, S.C.; Barthelmie, R.J. Climate change impacts on wind energy: A review. Renew. Sustain. Energy Rev. 2010, 14, 430–437. [Google Scholar] [CrossRef]
  7. Lamraoui, F.; Fortin, G.; Benoit, R.; Perron, J.; Masson, C. Atmospheric icing impact on wind turbine production. Cold Reg. Sci. Technol. 2014, 100, 36–49. [Google Scholar] [CrossRef]
  8. Zhang, L.; Gao, C.; Zhong, L.; Zhu, L.; Chen, H.; Hou, Y.; Zheng, Y. Robust photothermal superhydrophobic coatings with dual-size micro/nano structure enhance anti-/de-icing and chemical resistance properties. Chem. Eng. J. 2022, 446, 137461. [Google Scholar] [CrossRef]
  9. Liu, Z.; Feng, F.; Li, Y.; Sun, Y.; Tagawa, K. A corncob biochar-based superhydrophobic photothermal coating with micro-nano-porous rough-structure for ice-phobic properties. Surf. Coating. Technol. 2023, 457, 129299. [Google Scholar] [CrossRef]
  10. Zhang, L.-B.; Zhang, H.-X.; Liu, Z.-J.; Jiang, X.-Y.; Agathopoulos, S.; Deng, Z.; Gao, H.-Y.; Lu, H.-P.; Deng, L.-J.; Yin, L.-J. Nano-silica anti-icing coatings for protecting wind-power turbine fan blades. J. Colloid Interface Sci. 2023, 630, 1–10. [Google Scholar] [CrossRef]
  11. Wu, B.; Cui, X.; Jiang, H.; Wu, N.; Peng, C.; Hu, Z.; Liang, X.; Yan, Y.; Huang, J.; Li, D. A superhydrophobic coating harvesting mechanical robustness, passive anti-icing and active de-icing performances. J. Colloid Interface Sci. 2021, 590, 301–310. [Google Scholar] [CrossRef] [PubMed]
  12. Fan, B.; Jiang, L.; Zhou, Q.; Li, B. Research status and prospect of air-heating deicing technology for wind turbine blades. J. Eng. Therm. Energy Power 2023, 38, 1–9. [Google Scholar]
  13. Reid, T.; Baruzzi, G.S.; Habashi, W.G. FENSAP-ICE: Unsteady conjugate heat transfer simulation of electrothermal de-Icing. J. Aircr. 2012, 49, 1101–1109. [Google Scholar] [CrossRef]
  14. Xiao, C.; Yu, K.; Gui, Y.; Tang, Q. Analysis of parametric influence on phase change heat transfer characteristics of 1-D and 2-D electrothermal deicing. J. Aerosp. Power 2018, 33, 882–893. [Google Scholar]
  15. De Witt, K.J.; Keith, T.G.; Chao, D.F.; Masiulaniec, K. Numerical Simulation of Electrothermal Deicing Systems. In Proceedings of the AIAA 21st Aerospace Sciences Meeting, Reno, NV, USA, 10–13 January 1983. [Google Scholar]
  16. Xiao, C.; Lin, G.; Gui, Y.; Xiao, J. Study on effect of ice shedding on heat transfer characteristics of electrothermal aircraft deicing. Acta Aerodyn. Sin. 2012, 30, 551–556. [Google Scholar]
  17. Chang, S.; Ai, S.; Huo, X.; Yuan, X. Improved simulation of electrothermal de-icing system. J. Aerosp. Power 2008, 23, 1753–1758. [Google Scholar]
  18. Shen, X.; Wang, H.; Lin, G.; Bu, X.; Wen, D. Unsteady simulation of aircraft electro-thermal deicing process with temperature-based method. Proc. Inst. Mech. Eng. Part G J. Aerosp. Eng. 2020, 234, 388–400. [Google Scholar] [CrossRef]
  19. Mu, Z.; Lin, G.; Shen, X.; Bu, X.; Zhou, Y. Numerical simulation of unsteady conjugate heat transfer of electrothermal deicing process. Int. J. Aerosp. Eng. 2018, 2018, 1–16. [Google Scholar] [CrossRef]
  20. Zhu, C.-X.; Wang, Y.; Zhao, N.; Zhu, C.-L.; Liu, C.-Y. Numerical simulation and experimental verification of the airfoil electrothermal deicing system performance. J. Chin. Inst. Eng. 2021, 44, 608–617. [Google Scholar] [CrossRef]
  21. Fu, J.; Zhuang, W.; Yang, B.; Chang, S. Simulation of heating control law of electro-thermal deicing of helicopter rotor blade. J. Beijing Univ. Aeronaut. Astronaut. 2014, 40, 1200–1207. [Google Scholar]
  22. Pourbagian, M.; Habashi, W.G. Aero-thermal optimization of in-flight electro-thermal ice protection systems in transient de-icing mode. Int. J. Heat Fluid Flow 2015, 54, 167–182. [Google Scholar] [CrossRef]
  23. Xiao, C.-H.; Lin, G.-P.; Gui, Y.-W.; Xiao, J.-P. Study on coupled thermo-mechanical characteristic and its effects during the process of electrothermal deicing. J. Exp. Fluid Mech. 2012, 26, 23–28. [Google Scholar]
  24. Lei, G.; Dong, W.; Zhu, J.; Zheng, M. A new melting model in electrothermal de-icing simulation. In Proceedings of the ASME Turbo Expo 2015: Turbine Technical Conference and Exposition, Montreal, QC, Canada, 15–19 June 2015. [Google Scholar]
  25. Henry, R. Development of an Electrothermal Deicing/Anticing mode. In Proceedings of the 30th Aerospace Sciences Meeting & Exhibit, Reno, NV, USA, 15–18 January 1992. [Google Scholar]
  26. Shu, L.; Qiu, G.; Hu, Q.; Jiang, X.; McClure, G.; Yang, H. Numerical and field experimental investigation of wind turbine dynamic de-icing process. J. Wind. Eng. Ind. Aerodyn. 2018, 175, 90–99. [Google Scholar] [CrossRef]
  27. Valerie, P. Numerical Modeling of an Electrothermal System for Deicing Horizontal Axis Wind Turbine Blades; Ecole Polytechnique: Montreal, QC, Canada, 1998. [Google Scholar]
  28. Shu, L.; Qiu, G.; Hu, Q.; Jiang, X.; McClure, G.; Liu, Y. Numerical Model and Field Experimental Investigation of Threshold Heat Flux of Wind Turbine De-icing. Proc. Chin. Soc. Electr. Eng. 2018, 38, 3997–4003. [Google Scholar]
  29. Xu, Z.; Zhang, T.; Li, X.; Li, Y. Effects of ambient temperature and wind speed on icing characteristics and anti-icing energy demand of a blade airfoil for wind turbine. Renew. Energy 2023, 217, 119135. [Google Scholar] [CrossRef]
  30. Hannat, R.; Morency, F. Numerical validation of conjugate heat transfer method for anti-/de-icing piccolo system. J. Aircraft 2014, 51, 104–116. [Google Scholar] [CrossRef]
  31. Ahn, G.B.; Jung, K.Y.; Myong, R.S.; Shin, H.B.; Habashi, W.G. Numerical and experimental investigation of ice accretion on rotorcraft engine air intake. J. Aircr. 2015, 52, 903–909. [Google Scholar] [CrossRef]
  32. Clift, R.; Grace, J.R.; Weber, M.E. Bubbles, Drops, and Particles; Academic Press: New York, NY, USA, 1978. [Google Scholar]
  33. Beaugendre, H.; Morency, F.; Habashi, W.G. Development of a second generation in-flight icing simulation code. J. Fluids Eng. 2006, 128, 378–387. [Google Scholar] [CrossRef]
  34. Fouladi, H.; Habashi, W.G.; Ozcer, I.A. Quasi-steady modeling of ice accretion on a helicopter fuselage in forward flight. J. Aircr. 2013, 50, 1169–1178. [Google Scholar] [CrossRef]
  35. Tompson, B.E.; Marrochello, M.R. Rivulet formation in surface-water flow on an airfoil in rain. AIAA J. 1999, 37, 45–49. [Google Scholar] [CrossRef]
  36. Beaugendre, H.; Morency, F.; Habashi, W.G.; Benquet, P. Roughness implementation in FENSAP-ICE: Model calibration and influence on ice shapes. J. Aircr. 2003, 40, 1212–1215. [Google Scholar] [CrossRef]
  37. Reid, T.; Baruzzi, G.; Aliaga, C.; Aubé, M. FENSAP-ICE: Application of Unsteady CHT to De-icing Simulations on a Wing with Inter-Cycle Ice Formation. AIAA 2010, 2010, 7835. [Google Scholar]
  38. Battisti, L. Wind Turbines in Cold Climates; Springer: Berlin/Heidelberg, Germany, 2015. [Google Scholar]
  39. Al-Khalil, K.; Horvath, C.; Miller, D.; Aubé, M.; Habashi, W. Validation of NASA thermal ice protection computer codes: Part 3: The validation of ANTICE. In Proceedings of the 35th Aerospace Sciences Meeting and Exhibit, Reno, NV, USA, 6–10 January 1997; American Institute of Aeronautics and Astronautics: Reston, VA, USA, 1997. [Google Scholar]
  40. Zhong, G. Simulation of Airfoil Electro-Thermal Anti-Ice/De-Ice System. Aeronaut. Manuf. Technol. 2011, 4, 75–79. [Google Scholar]
Figure 1. A schematic diagram of the electrothermal de-icing method.
Coatings 14 00852 g001
Figure 2. The computational domain and detailed boundary conditions.
Coatings 14 00852 g002
Figure 3. The computational mesh of the NACA0012 blade airfoil.
Coatings 14 00852 g003
Figure 4. Material and structure of blade airfoil.
Coatings 14 00852 g004
Figure 5. The geometry of the heater.
Coatings 14 00852 g005
Figure 6. Comparison of temperature of heater 3.
Coatings 14 00852 g006
Figure 7. Droplet collection efficiency at different wind speeds.
Coatings 14 00852 g007
Figure 8. The ice shapes (a) and the ice thickness distribution (b) of case 1.
Coatings 14 00852 g008
Figure 9. Airfoil surface temperature distribution of case 1.
Coatings 14 00852 g009
Figure 10. The temperature contour at the cross section of case 1.
Coatings 14 00852 g010
Figure 11. The ice shapes (a) and the ice thickness distribution (b) of case 2.
Coatings 14 00852 g011
Figure 12. Airfoil surface temperature distribution of case 2.
Coatings 14 00852 g012
Figure 13. The temperature contour at the cross section of case 2.
Coatings 14 00852 g013
Figure 14. The ice shapes (a) and the ice thickness distribution (b) of case 3.
Coatings 14 00852 g014
Figure 15. Airfoil surface temperature distribution of case 3.
Coatings 14 00852 g015
Figure 16. The temperature contour at the cross section of case 3.
Coatings 14 00852 g016
Figure 17. The ice shapes (a) and the ice thickness distribution (b) of case 4.
Coatings 14 00852 g017
Figure 18. Airfoil surface temperature distribution of case 4.
Coatings 14 00852 g018
Figure 19. The temperature contour at the cross section of case 4.
Coatings 14 00852 g019
Figure 20. The ice shapes (a) and the ice thickness distribution (b) of case 5.
Coatings 14 00852 g020
Figure 21. Airfoil surface temperature distribution of case 5.
Coatings 14 00852 g021
Figure 22. The temperature contour at the cross section of case 5.
Coatings 14 00852 g022
Figure 23. The peak ice thickness of runback ice at different de-icing times.
Coatings 14 00852 g023
Table 1. Material properties.
MaterialDensity
(kg m−3)
Thermal Conductivity
(W m−1 K−1)
Heat Capacity
(J kg−1 K−1)
Fiberglass17940.2941570.1
Table 2. Boundary conditions.
TypesValues
Far fieldPressure: 101,325 Pa
Temperature: 268 K
LWC: 0.6 g/m3
MVD: 50 μm
Speed: 5~15 m/s
WallNo slip
Table 3. De-icing simulation conditions.
CaseWind Speed
(m/s)
Heat Flux
(W/m2)
Other Conditions
1510,000Temperature: 268 K
Liquid water content: 0.6 g/m3
Medium volume diameter: 50 μm
Angle of attack: 0°
Total de-icing time: 120 s
21010,000
31510,000
4158000
51512,000
Table 4. Heating sequence of simulation.
Time0~100 s100~120 s
Heat flux0 W/m28000/10,000/12,000 W/m2
Disclaimer/Publisher’s Note: The statements, opinions and data contained in all publications are solely those of the individual author(s) and contributor(s) and not of MDPI and/or the editor(s). MDPI and/or the editor(s) disclaim responsibility for any injury to people or property resulting from any ideas, methods, instructions or products referred to in the content.

