Article

Evaluation of Slurry-Eroded Rubber Surface Using Gloss Measurement

by
Wichain Chailad
1 and
Liu Yang
2,*
1
Department of Materials and Metallurgical Engineering, Faculty of Engineering, Rajamangala University of Technology Thanyaburi, Pathum Thani 12110, Thailand
2
Department of Mechanical and Aerospace Engineering, University of Strathclyde, Glasgow G1 1XQ, UK
*
Author to whom correspondence should be addressed.
Coatings 2024, 14(7), 915; https://doi.org/10.3390/coatings14070915 (registering DOI)
Submission received: 29 May 2024 / Revised: 12 July 2024 / Accepted: 21 July 2024 / Published: 22 July 2024

Abstract

:
Slurry erosion testing is essential for evaluating the durability of materials under erosive conditions. This study examines the slurry erosion behaviours of chloroprene rubber (CR) under varying impact conditions to assess its durability. Traditional mass loss methods and qualitative techniques, including microscopy, SEM, and AFM, were employed to analyse eroded CR samples. Results indicate that cumulative material loss in CR increases linearly with sand impingement after approximately 60 kg of sand and correlates with an impact energy of about 30 kJ. The highest erosion rate was found at an impact angle of 15°. Erosion mechanisms vary with impact angle, affecting surface topography from cutting and ploughing at lower angles to deformation and crater formation at higher angles. Despite their efficacy, these methods are time-intensive and costly. This paper presents a novel approach utilising gloss measurement for continuous, non-destructive monitoring of eroded rubber surfaces. Gloss measurements are 24 times faster than traditional mass loss methods. Correlating gloss values with cumulative material loss, steady-state erosion, and impact energy offers significant time savings and an enhanced understanding of the erosion process. Experimental results demonstrate the effectiveness of gloss measurement as a reliable tool in slurry erosion testing of rubbers. The quantitative output from gloss measurements could support proactive maintenance strategies to extend service life and optimise operational efficiency in industrial applications, particularly in the mining industry.

1. Introduction

Slurry erosion testing is essential in material science for assessing the durability of materials, including rubber liners used in mining and manufacturing. These rubber liners are critical for transporting ores, sand, and tailings through pumps and pipelines, acting as sacrificial materials to prevent damage to the components in slurry equipment. Erosive particles in the slurry can cause significant surface degradation, impacting the reliability and longevity of the equipment. The erosive forces generated by erosive particles suspended in fluids can lead to substantial surface degradation over time, ultimately impacting the reliability and longevity of the equipment [1,2,3,4,5,6,7]. Therefore, slurry erosion testing serves as a crucial tool for simulating these harsh operating conditions and assessing the suitability of materials for withstanding such demanding environments [4,8,9].
In industrial applications, particularly within sectors like mining, rubber components are frequently exposed to erosive environments that can lead to significant wear and tear. Accurate and efficient assessment of slurry erosion is crucial to ensure the durability and performance of equipment. Traditional methods of assessing slurry erosion, which often rely on mass loss measurements, are time-consuming and may lack precision, especially when dealing with the small material losses typically observed in rubber components [8,10]. Developing new, non-destructive testing methods, such as using a gloss meter for real-time monitoring, represents a significant advancement in the field. These methods can provide faster, more accurate erosion assessments, allowing for better maintenance planning and resource allocation [11].
Despite the significance of slurry erosion testing, traditional methods for monitoring erosion during testing pose notable challenges, particularly with rubber materials. One critical challenge involves ensuring the proper drying of rubber samples within a specific timeframe to prevent discrepancies in weight changes post-slurry erosion, especially concerning the fluid materials used in the test. Rubber exhibits high slurry erosion resistance, resulting in minimal mass loss [12,13,14,15,16]. Therefore, if the drying process is not carried out correctly, it can lead to inaccurate mass loss measurements and erroneous evaluations of slurry erosion rates.
Traditional methods for assessing slurry erosion, such as mass loss measurements, pose several limitations regarding accuracy, efficiency, and practicality. These methods often require prolonged drying times, which can exceed 16 h, and are prone to inaccuracies when dealing with the minimal material loss typical of rubber components impacted by erosive particles. In the study by Chailad et al. [10], a slurry erosion test of the rubber was conducted for at least six days until the steady state of material loss was achieved and the erosion rate could be investigated. In contrast, gloss meter technology offers a promising alternative for real-time, non-destructive evaluation of slurry erosion. By measuring surface gloss changes, gloss meters can provide immediate feedback on the erosion status without damaging the samples. This allows for continuous monitoring and more frequent assessments, leading to better-informed maintenance decisions and the early identification of erosion onset [11,17,18].
In response to these challenges, there is a need for fast and non-destructive methods that facilitate the prompt monitoring of eroded rubber surfaces following slurry erosion testing. Gloss measurement emerges as a promising approach for easy, fast, and real-time monitoring of surface erosion. Gloss measurement, widely utilised across various industries for surface quality assessment, provides a rapid and non-destructive means of quantifying the reflective properties of surfaces. By measuring the gloss value of a surface, which reflects its specular reflection characteristics, it becomes feasible to assess surface smoothness and integrity changes over time [11,17,18,19]. Utilising gloss measurement in slurry erosion testing enables continuous monitoring of surface morphology changes without the need for prolonged waiting periods or destructive sampling, thus overcoming the limitations of traditional monitoring techniques in investigating the slurry erosion of rubber samples.
Gloss is an optical property characterising how effectively a surface reflects light in a specular or mirror-like direction. It is one of the most significant indicators used to describe the visual appearance of an object. Various factors influence gloss, including the angle of incident light and surface topography. Gloss encompasses a range of surface phenomena that collectively define the light-reflecting properties of a surface [18,19,20]. In industrial settings, specular gloss finds extensive application in describing the reflectance properties of product surfaces. Specular gloss is defined as a measure of the specular reflectance of a surface relative to the specular intensity reflected by a standard template at a given angle of incidence, denoted as θ:
Gloss = I I 0 × 100 %
where I is the intensity of specular reflection from the sample, I0 represents the specular reflectance from the standard template, and θ could be 20°, 60°, or 85° [17,21,22], as shown in Figure 1. This formula quantifies the degree of specular reflectance the surface exhibits, providing information on its visual appearance and surface quality. Gloss is quantified using gloss units (GU), which ranges from a scale of 0 GU, representing a fully matte surface, to 100 GU, indicative of a perfectly mirrored surface [21].
The intensity of specular reflection hinges on the surface from which the beam is reflected. When the surface is uniform and smooth, a significant proportion of the incident beam is reflected as specular reflectance, exhibiting minimal scattering and low diffuse reflectance. This phenomenon is illustrated in Figure 2.
The chosen angles for the gloss measurement significantly influence the obtained gloss value. To obtain a clear differentiation over the entire measurement range from high gloss to matte, three different geometries, i.e., three different ranges, were defined using a 60° gloss meter, as seen in Table 1. If the surface appears matte, an angle of 85° is employed. For surfaces exhibiting mid-level gloss, 60° is selected, while for highly glossy surfaces, an angle of 20° is utilised. Varied angles broaden the feasible range of gloss measurements, as evidenced by the linear segments depicted in Figure 3. Operating within this linear region offers distinct advantages for gloss measurement across a spectrum of timeframes or conditions that may induce variations in gloss values. This linear region offers the broadest gloss units corresponding to apparent surface glossiness. Furthermore, measurements within the linear region provide greater accuracy due to the broader operational range of gloss units (Y-axis in Figure 3) compared to measurements conducted within curved sections. Hence, selecting an appropriate angle is crucial when conducting gloss measurements, ensuring accurate and reliable assessments of surface glossiness.
This paper introduces a novel approach that utilises gloss measurement to rapidly monitor eroded rubber surfaces immediately after slurry erosion testing. By leveraging the principles of gloss measurement and its established applicability in material characterisation, we propose a method that enables continuous assessment of surface erosion mechanisms. This study reviews existing techniques for assessing erosion in rubber materials and explores the principles and applications of gloss measurement to highlight the potential of this innovative approach in advancing slurry erosion testing methodologies. Additionally, we incorporate images obtained from a microscope, scanning electron microscope (SEM, Energy Beam Sciences, East Granby, CT 06026, USA), and atomic force microscope (AFM) to correlate with the gloss values of eroded rubber surfaces. By integrating these multiple imaging techniques, our research aims to comprehensively understand surface morphology changes in conjunction with gloss measurements.
By addressing the current challenges in monitoring the slurry erosion status of rubber samples, the method proposed in this study enhances the efficiency and effectiveness of material durability assessment, particularly for elastomeric materials used in mining and other erosive industrial applications. Furthermore, the quantitative erosion measurements obtained can be applied to numerical modelling tools, facilitating the prediction of rubber liner lifetimes and aiding in optimising material designs for prolonged service life in erosive environments.

2. Materials and Methods

2.1. Materials

The rubber utilised in this study is a commercially available polychloroprene rubber (CR) commonly utilised as a lining material in slurry transport equipment due to its resilience and durability. The CR formulation contains 50 parts per hundred rubber (phr) of carbon black, enhancing its mechanical properties and resistance to abrasion. The properties obtained from the manufacturer and evaluated through standard testing procedures are summarised in Table 2.

2.2. Slurry Erosion Testing

The accelerated slurry erosion testing of CR samples was carried out using a slurry-jet erosion test (SJET) rig. The testing method was described in full detail in the research conducted by Chailad et al. [10]. This test rig differs from others [8,23,24] in that it incorporates a large slurry tank to handle significant amounts of impinging sand and mitigate rapid increases in slurry temperature. Figure 4 shows a schematic view of the SJET rig used in this study. The SJET rig has 500 L of slurry to avoid the rapid increase of slurry temperature, which could change the properties of rubbers. This method involves forcing erodent particles through a 4 mm internal diameter nozzle via a water flow, resulting in a forceful impact on the test specimen. The specimen was fixed at a designated impact angle and distance from the nozzle throughout the test. The SJET rig provides thorough control over important variables. The sample used was a square slab measuring 40 mm in length and width and 12 mm in thickness. Silica sand obtained from Minerals Marketing (Cheshire, UK) was utilised as erodent particles for the experiments. This sand consists of sub-rounded particles, possessing a bulk density of 1.56 g/cm3, and is characterised by a Mohs hardness rating of 7.
Table 3 summarises the parameters employed to test the rubber materials in this study. Due to the design of the SJET rig, 80% of its maximum slurry capacity was used. Thus, for the test condition in this study, 20 kg of sand was used per test cycle. After the SJET, all rubber samples were conditioned for at least 16 h before weighing. Following weighting, the rubber samples underwent slurry erosion testing until a steady state of erosion was achieved. The SJET was repeated three times.
Once the amount of sand impacts is determined using the amount of sand used to impact the CR sampler per one cycle, namely 20 kg of each cycle, it becomes possible to calculate the total impact energy inflicted by the sand particles on the specimen. This process entails computing the kinetic energy associated with each impact, which is accomplished by multiplying the mass of the sand by the square of its impact velocity and subsequently scaling up to account for the total number of sand impacts. The kinetic energy is calculated using Equation (2). It was assumed that the impact energy imparted by the sand onto the rubber surfaces would remain consistent across various impact angles based solely on sand mass and velocity parameters. The velocity of the sand would be similar to that of the slurry.
E k = 1 2 m v 2
where Ek is kinetic energy, m is the amount of the impacting sand (kg), and v is the impact velocity (m/s).

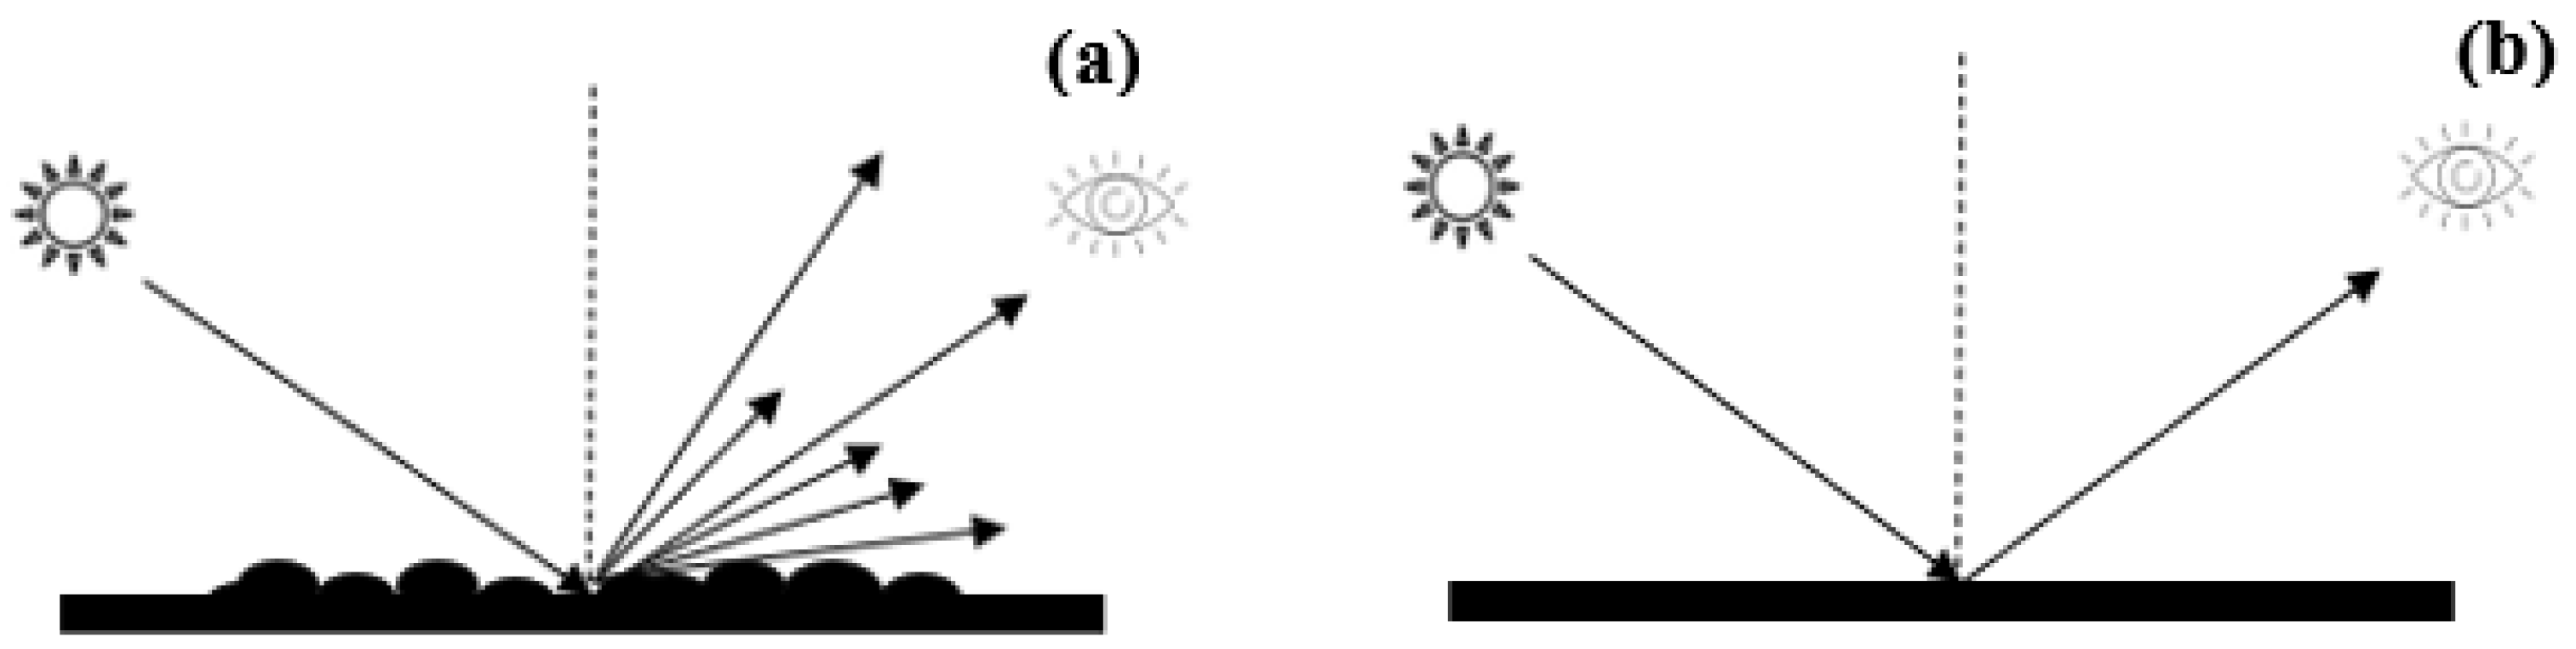
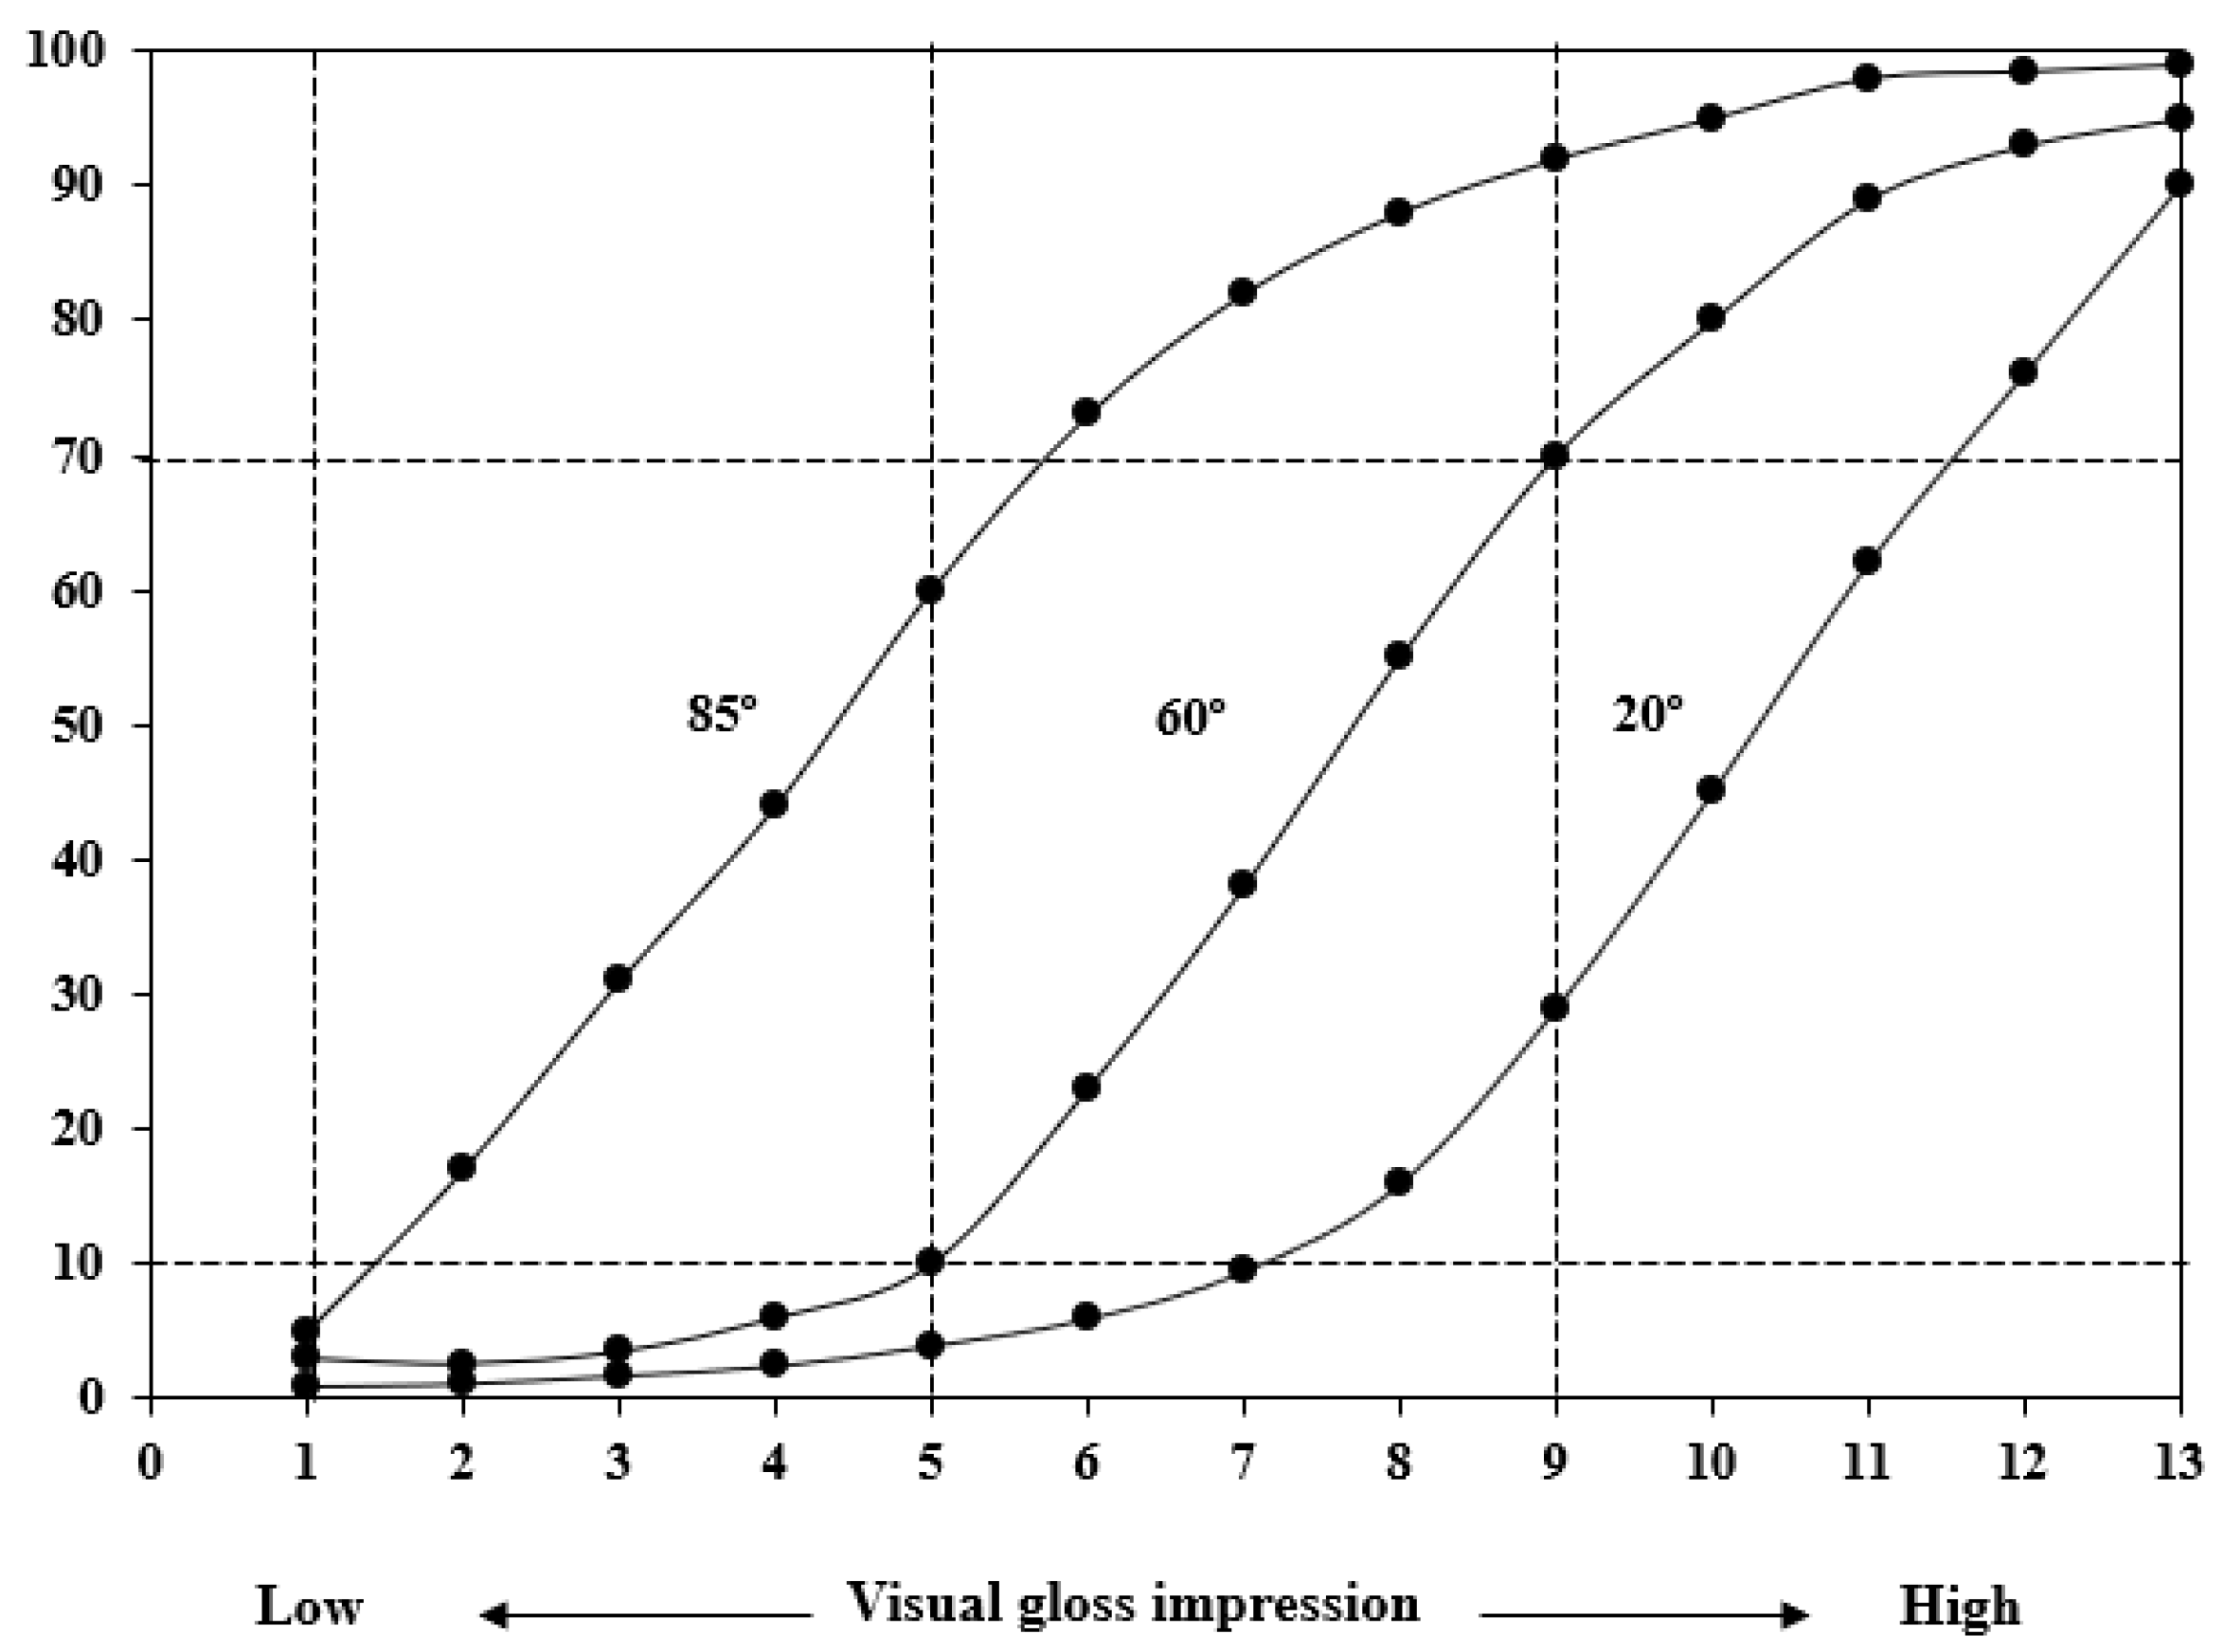
2.3. Surface Glossiness Measurement

A Rhopoint Instruments IQ Goniophotometer (St. Leonards, UK) equipped with measurement angles of 20°, 60°, and 85° was used to assess the gloss of eroded rubber surfaces. The active area for each measurement is approximately two mm2. This device was chosen due to its ability to measure multiple angles simultaneously within one measurement session and measure haze and reflected image quality. Before measuring eroded rubber surfaces, the gloss meter was calibrated against the calibration tile specific to the device. This calibration step was crucial to ensure the precise functionality and accuracy of the gloss meter throughout the measurement process [11,17,18].
Initially, the gloss of uneroded CR samples was assessed using the Rhopoint IQ at 60° to determine the appropriate angle for measuring rubber surface gloss, as indicated in Table 1. The gloss measured at 60° for CR surfaces was found to be less than 10 gloss units (GU), suggesting a matte finish upon visual inspection. Consequently, the measurement angle was adjusted to 85° to enhance accuracy. These initial measurements established a baseline for the glossiness of the CR samples. After each slurry erosion test, gloss measurement of the eroded rubber surface, again at 85°, was conducted immediately without prior conditioning. The measurement zone for specimens subjected to accelerated SJET was concentrated on the central region where the slurry impacted the specimens. The step-by-step gloss measurement and interpretation are presented in Figure 5. This focused approach ensured that the measurements accurately captured the effects of erosion in the area most directly affected by the slurry impact. The area of the eroded surfaces varied depending on the impact angles. Ensuring that the same eroded areas are measured for gloss for different slurry erosion testing statuses is necessary. The rubber samples were marked at four points to ensure consistent positioning of the gloss meter during gloss measurement of the same samples under different slurry erosion testing stages. The average of these five measurements was calculated to determine the mean glossiness of the rubber sample surfaces, ensuring a representative measurement of glossiness for the same eroded areas of the sample.

2.4. Measurements of Eroded Surface Morphology

The eroded CR surfaces after each testing cycle were examined using the Yenway SZMN stereo microscope to monitor changes across various wear regions during different stages of slurry erosion. Following the final stage of SJET, eroded CR surfaces were characterised using Bruker Innova atomic force microscopy (AFM, Bruker, Billerica, MA, USA). Tapping mode AF was conducted using a monolithic silicon tip with an average resonance frequency of 300 kHz and a force constant of 40 N/m following the study of Yerina N and Magonov S [25] The tip dimensions are 125 μm in length, 30 μm in width, and 4 μm in thickness. AFM images were captured at a resolution of 128 × 128 pixels and a scan rate of 0.75 Hz. The rubber sample was affixed to a metal plate using carbon tape. Selected areas were scanned within a 10 × 10 μm region. The topography and average roughness were analysed using NanoScope Analysis software (versions 1.7), with average roughness (Ra) reported in nanometers. Finally, micro-examination images were conducted using a scanning electron microscope (SEM) from the HITACHI S-3700 Tungsten Filament SEM (Energy Beam Sciences, East Granby, CT 06026, USA) and the FEI Inspect F High vacuum FEG source SEM operating at 5–10 kV [10]. Before being examined, the specimens were coated with gold to render them conductive before being tested in the SEM.

3. Results

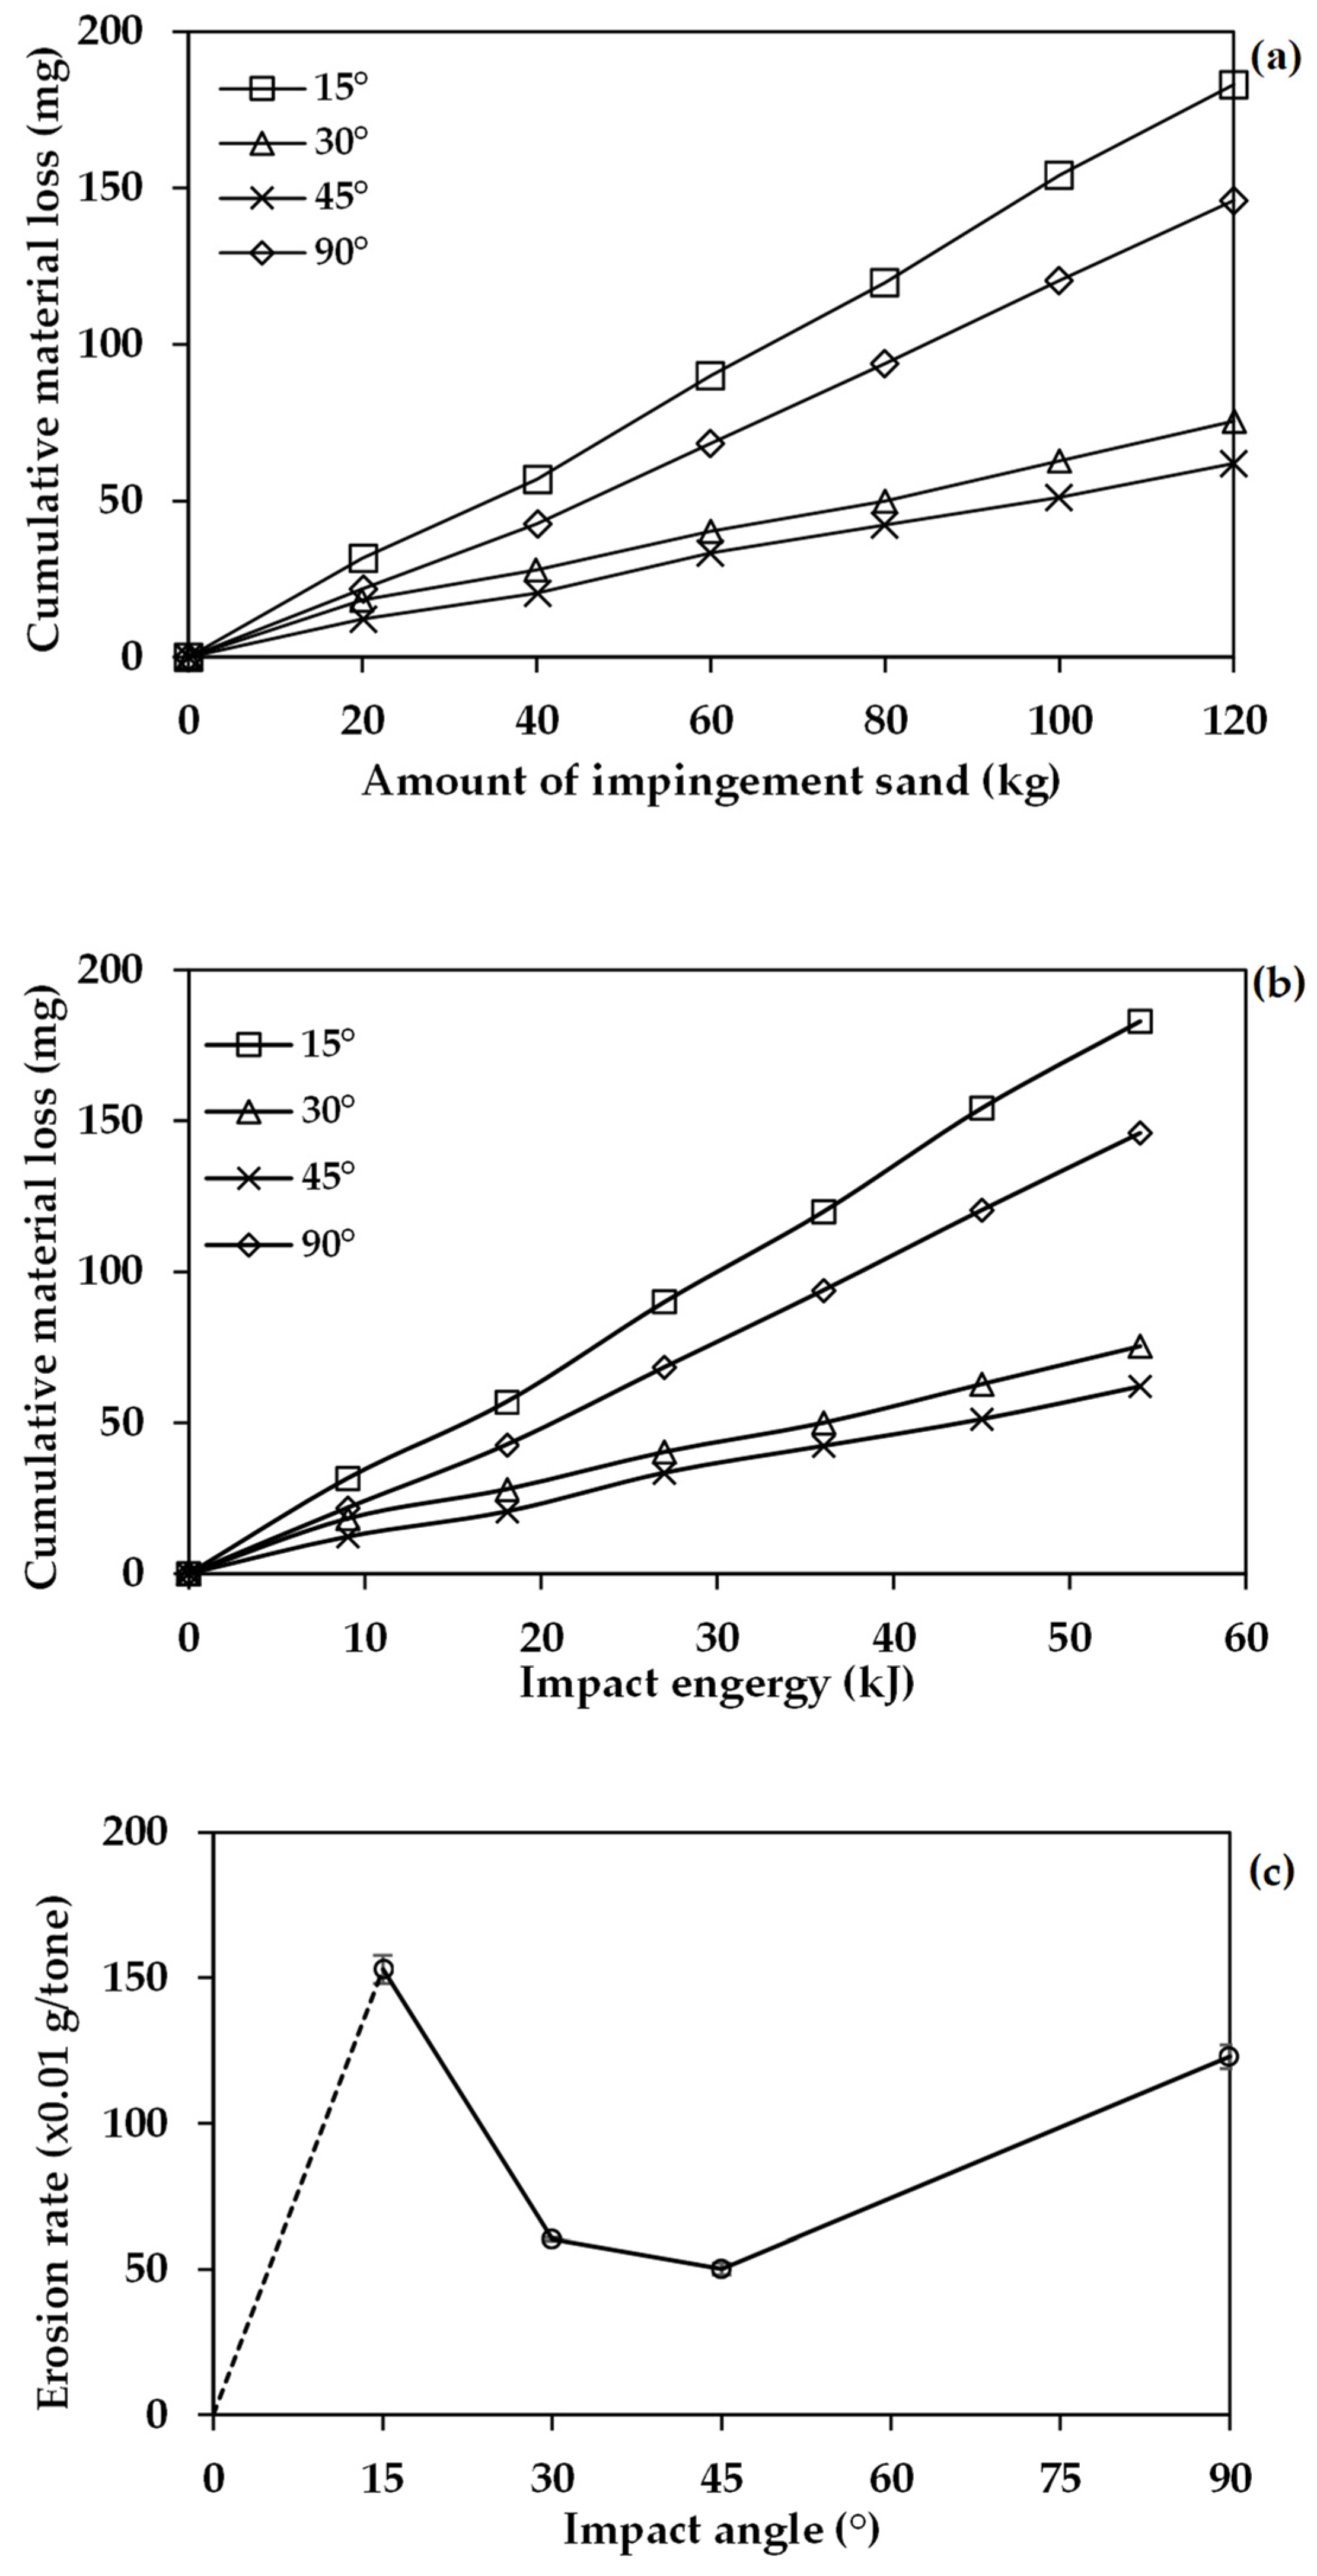
3.1. Slurry Erosion and Erosion Rates

Figure 6a,b displays the cumulative material loss in CR with the changes in the mass of impinging sand, impact energy, and impact angles. Figure 6c shows the slurry erosion rate of CR samples with variation in impact angles. The erosion rates were calculated from the graph in Figure 6a, where the material loss of CR is linearly proportional to the amount of impingement sand.

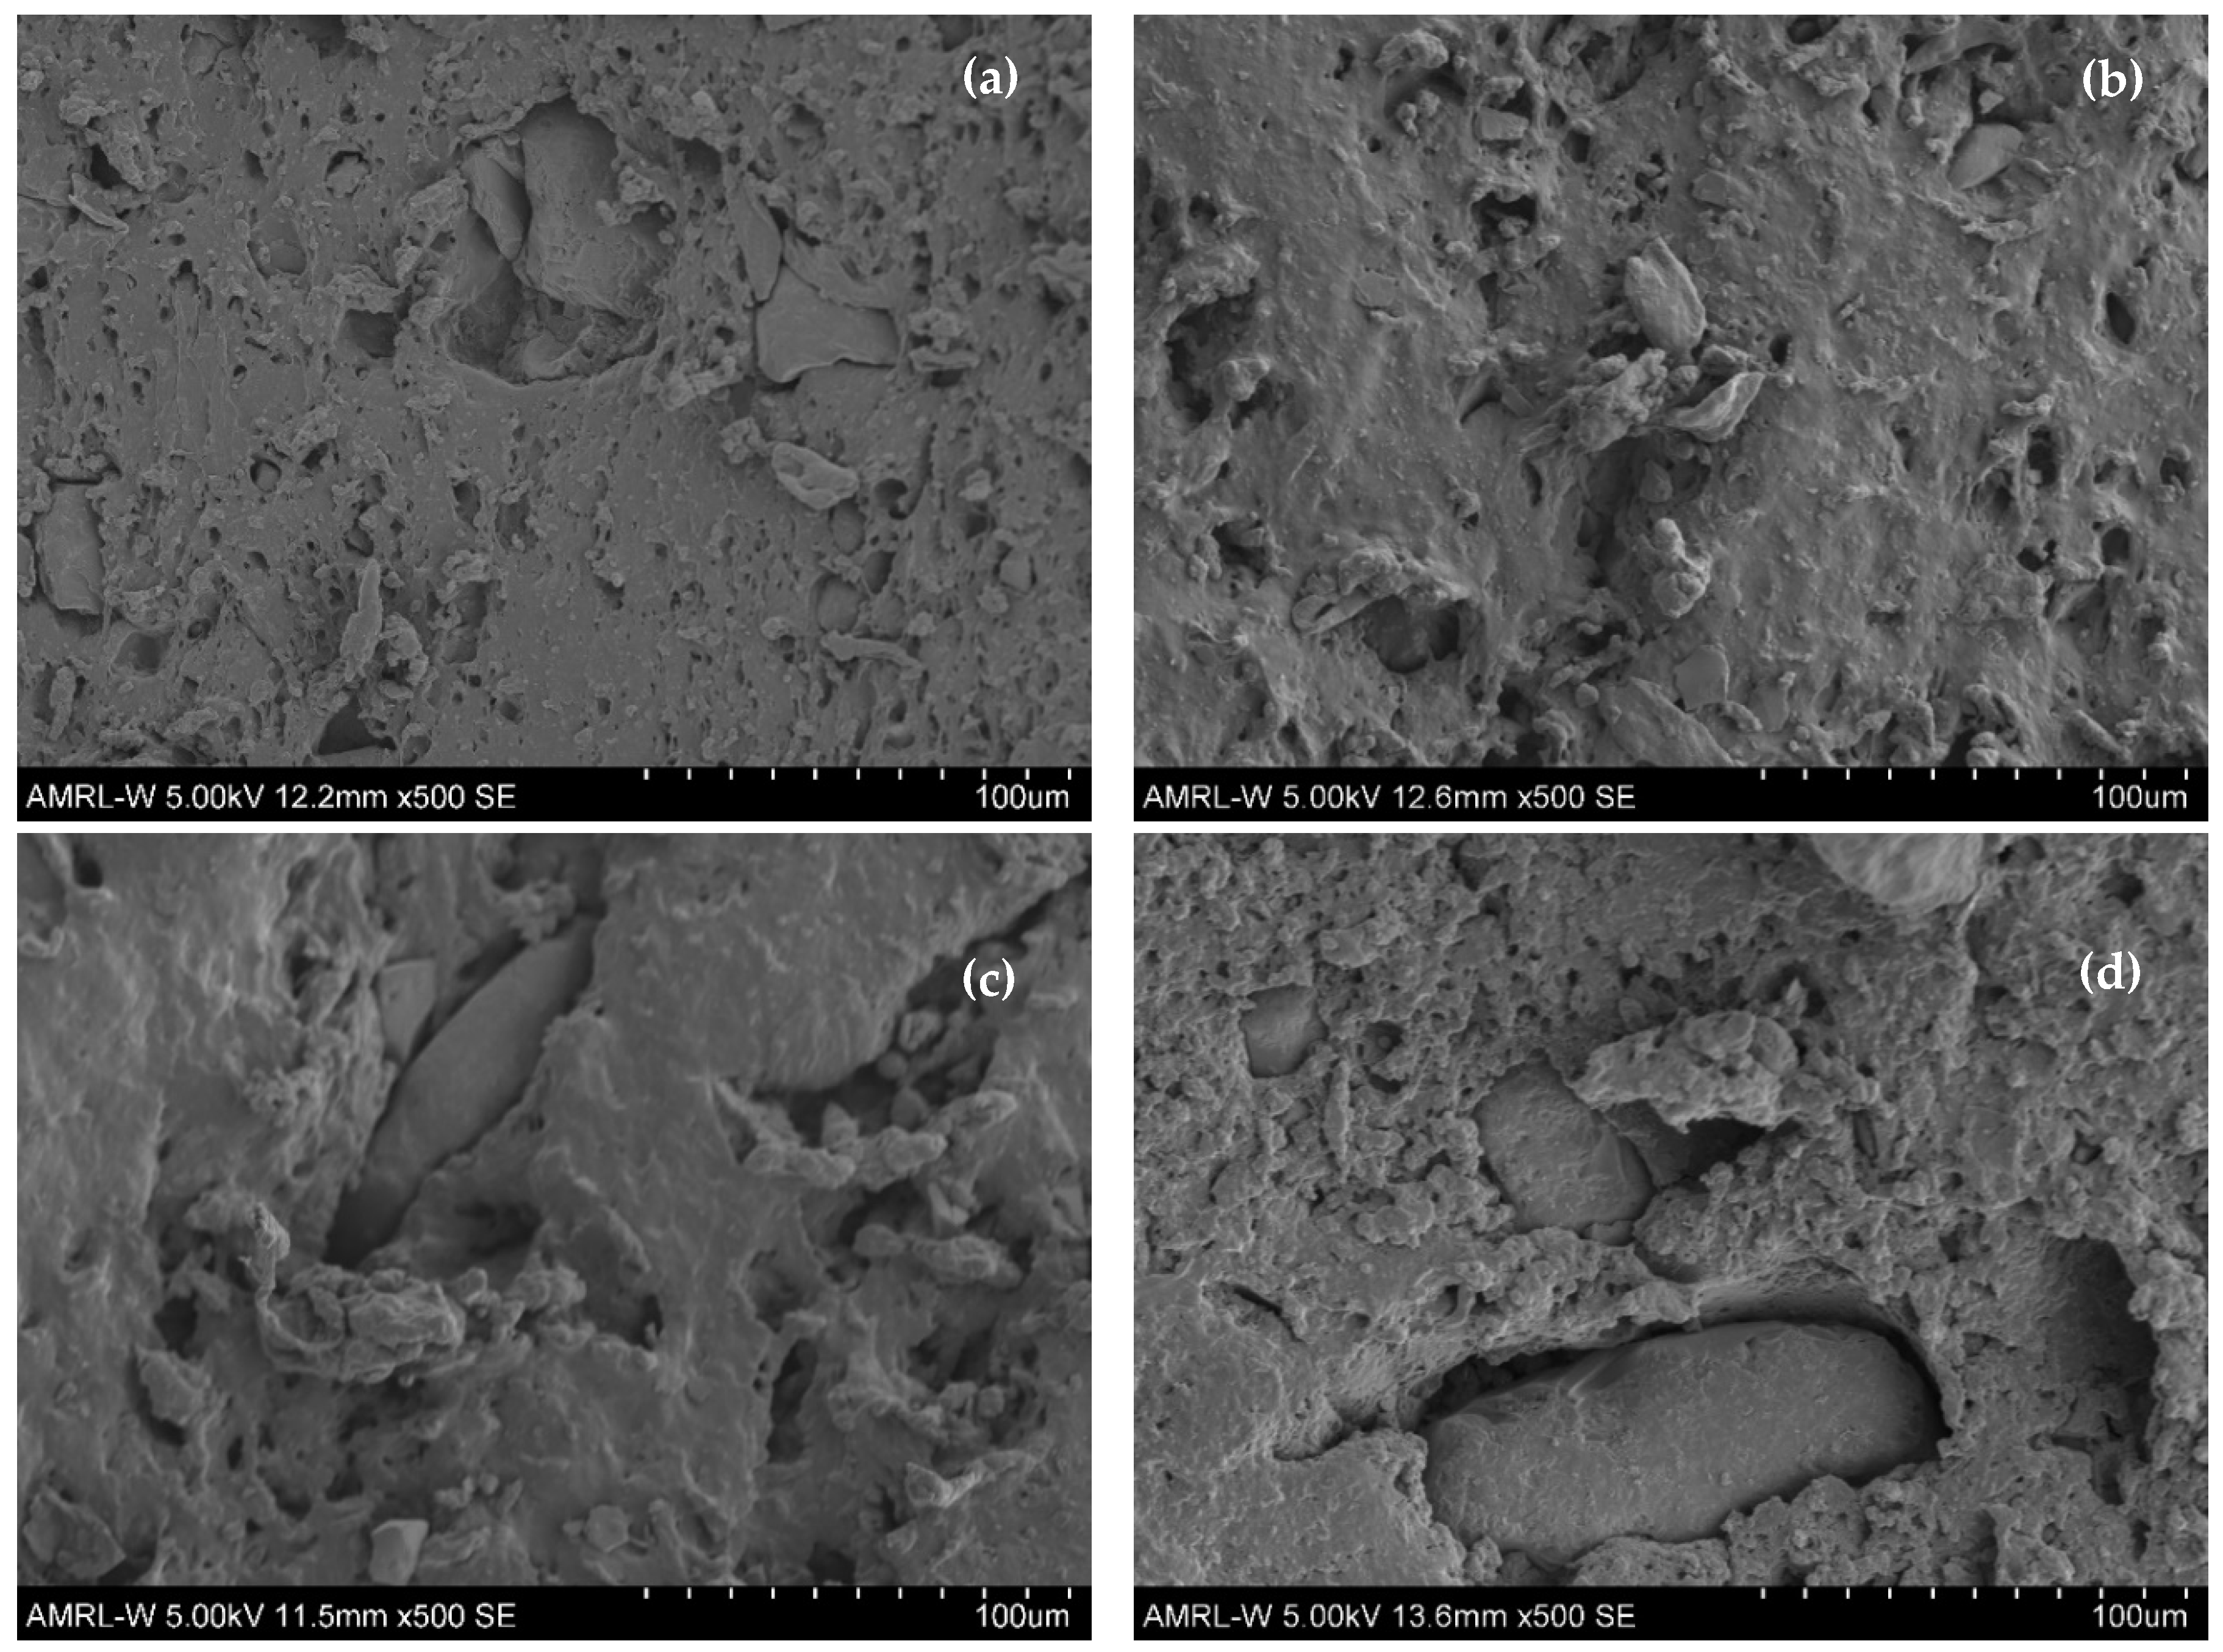
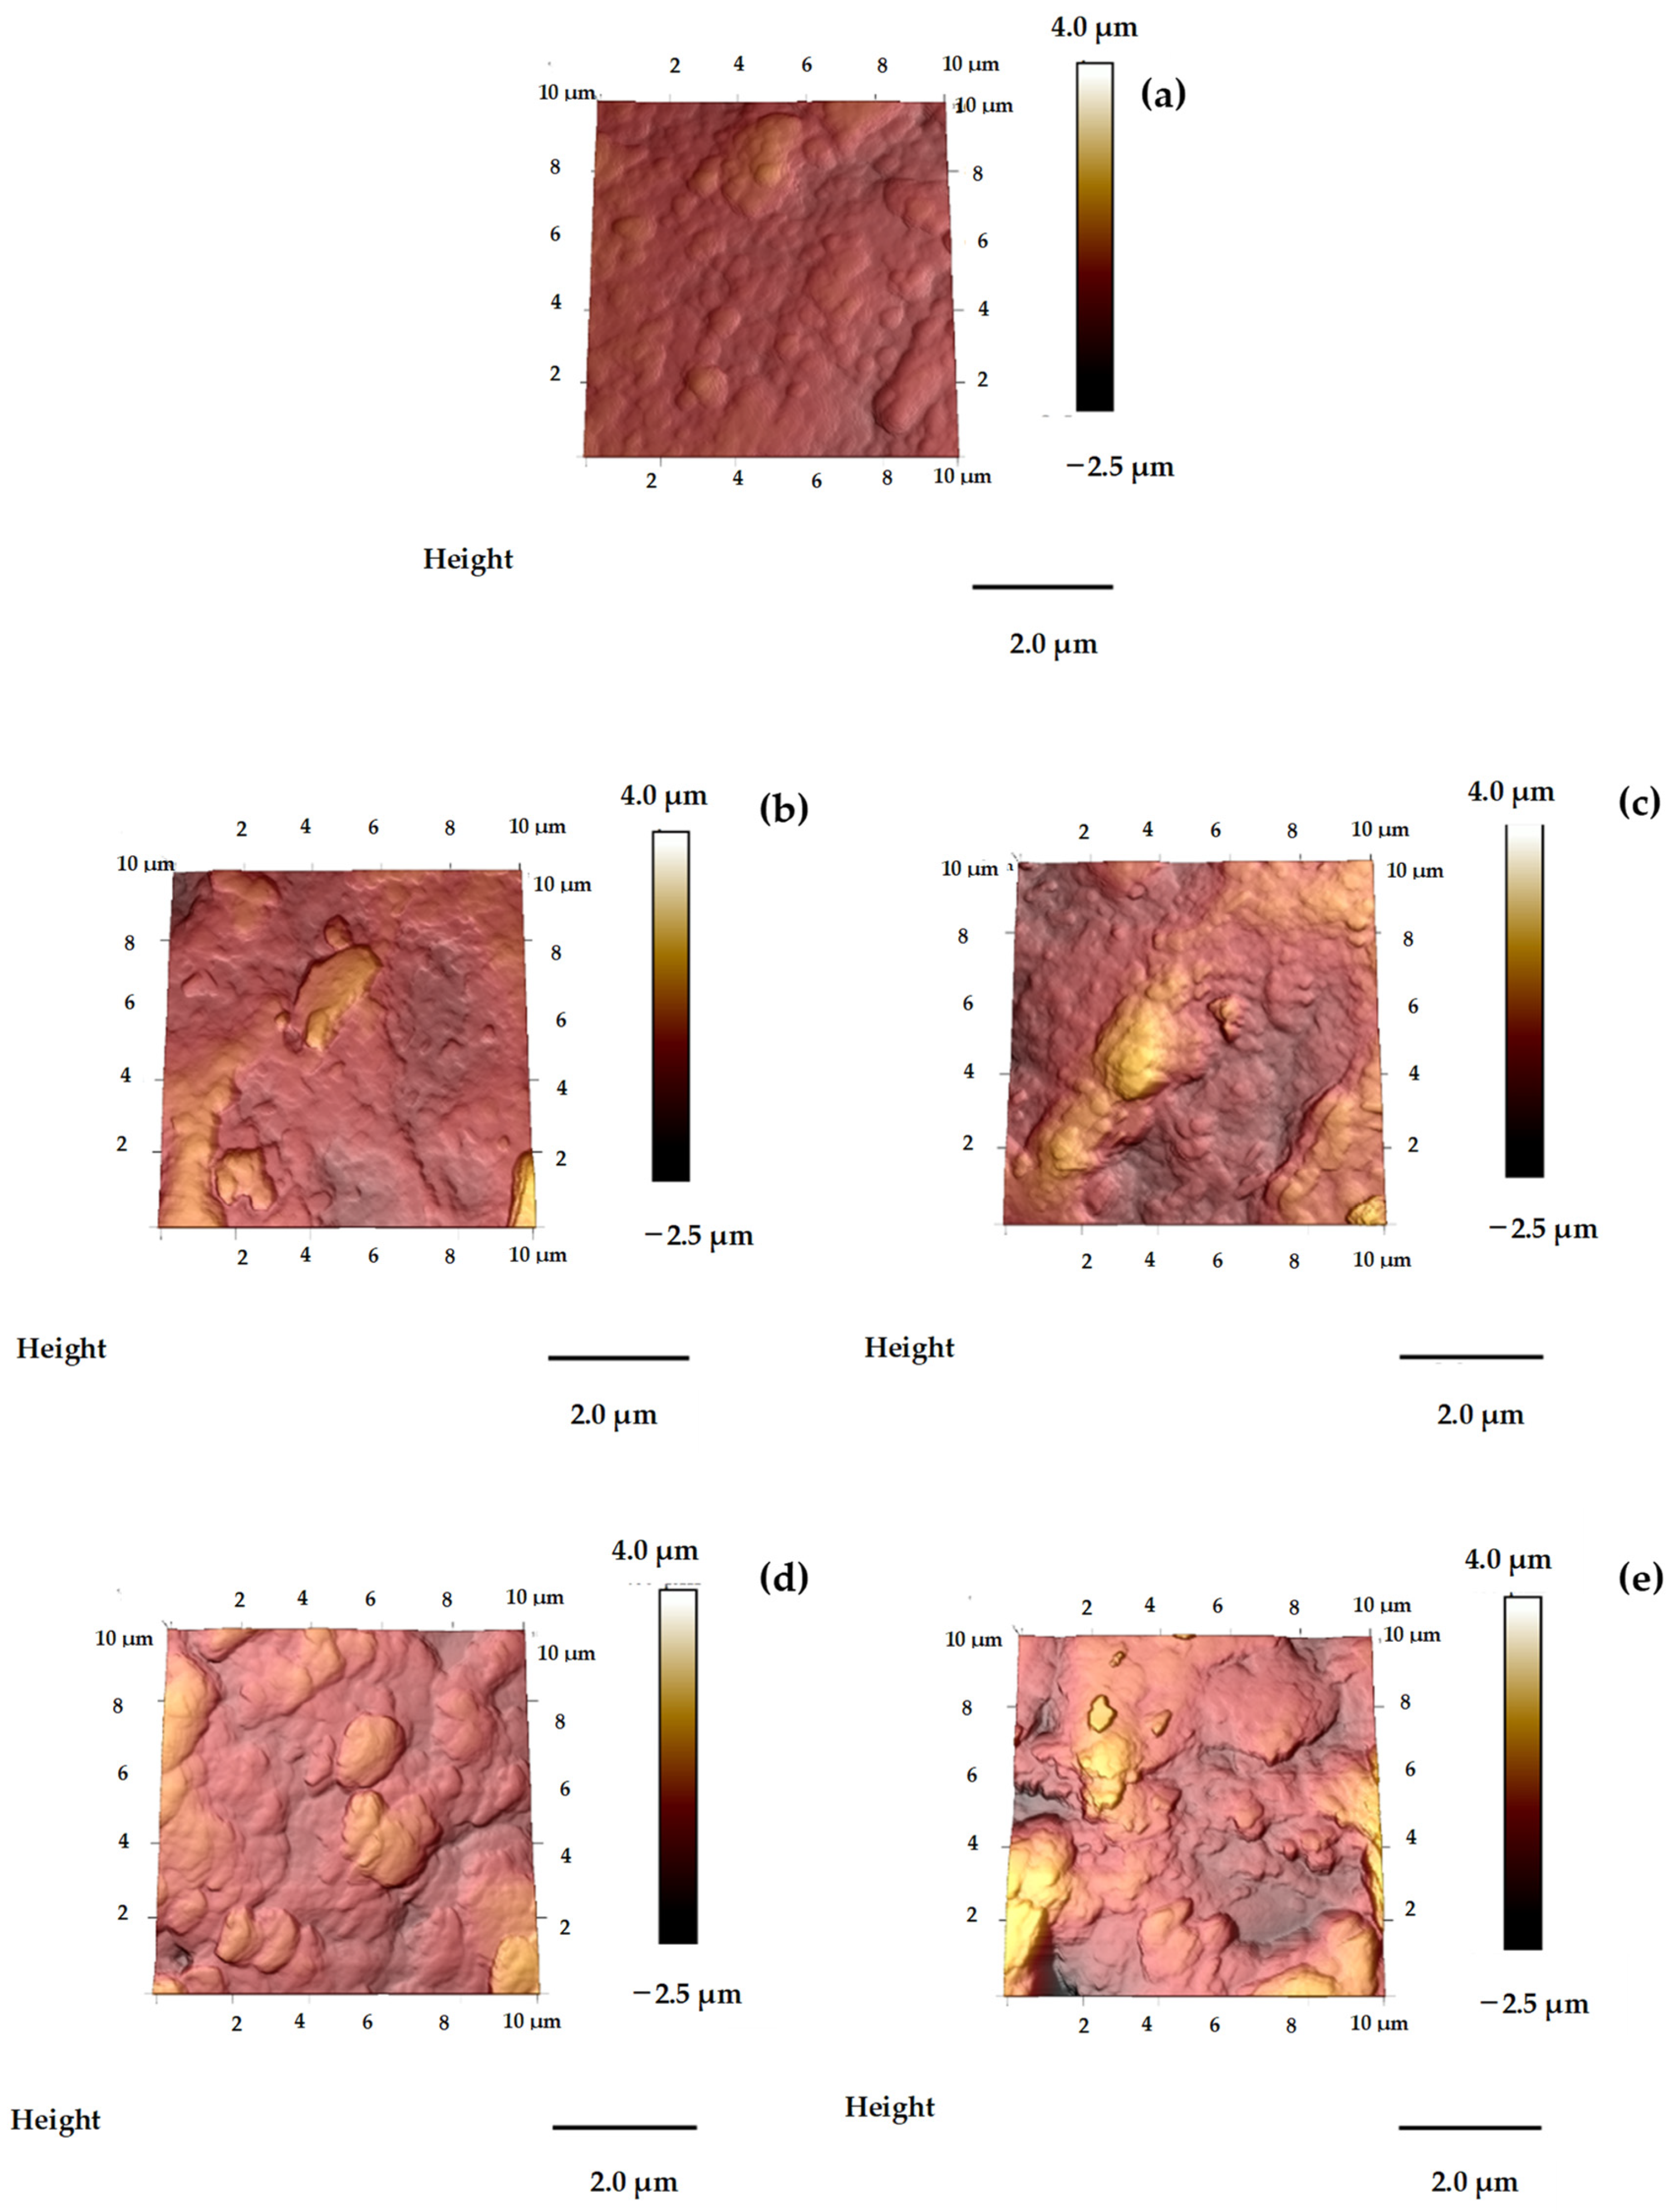
3.2. Surface Topography

Figure 7 presents the optical micrographs of the eroded surface of CR impacted by 120 kg of sand at different impact angles.
Figure 8 shows the SEM images, and Figure 9 illustrates AFM images of eroded CR surfaces subjected to impacts by 120 kg of sand at different impact angles.

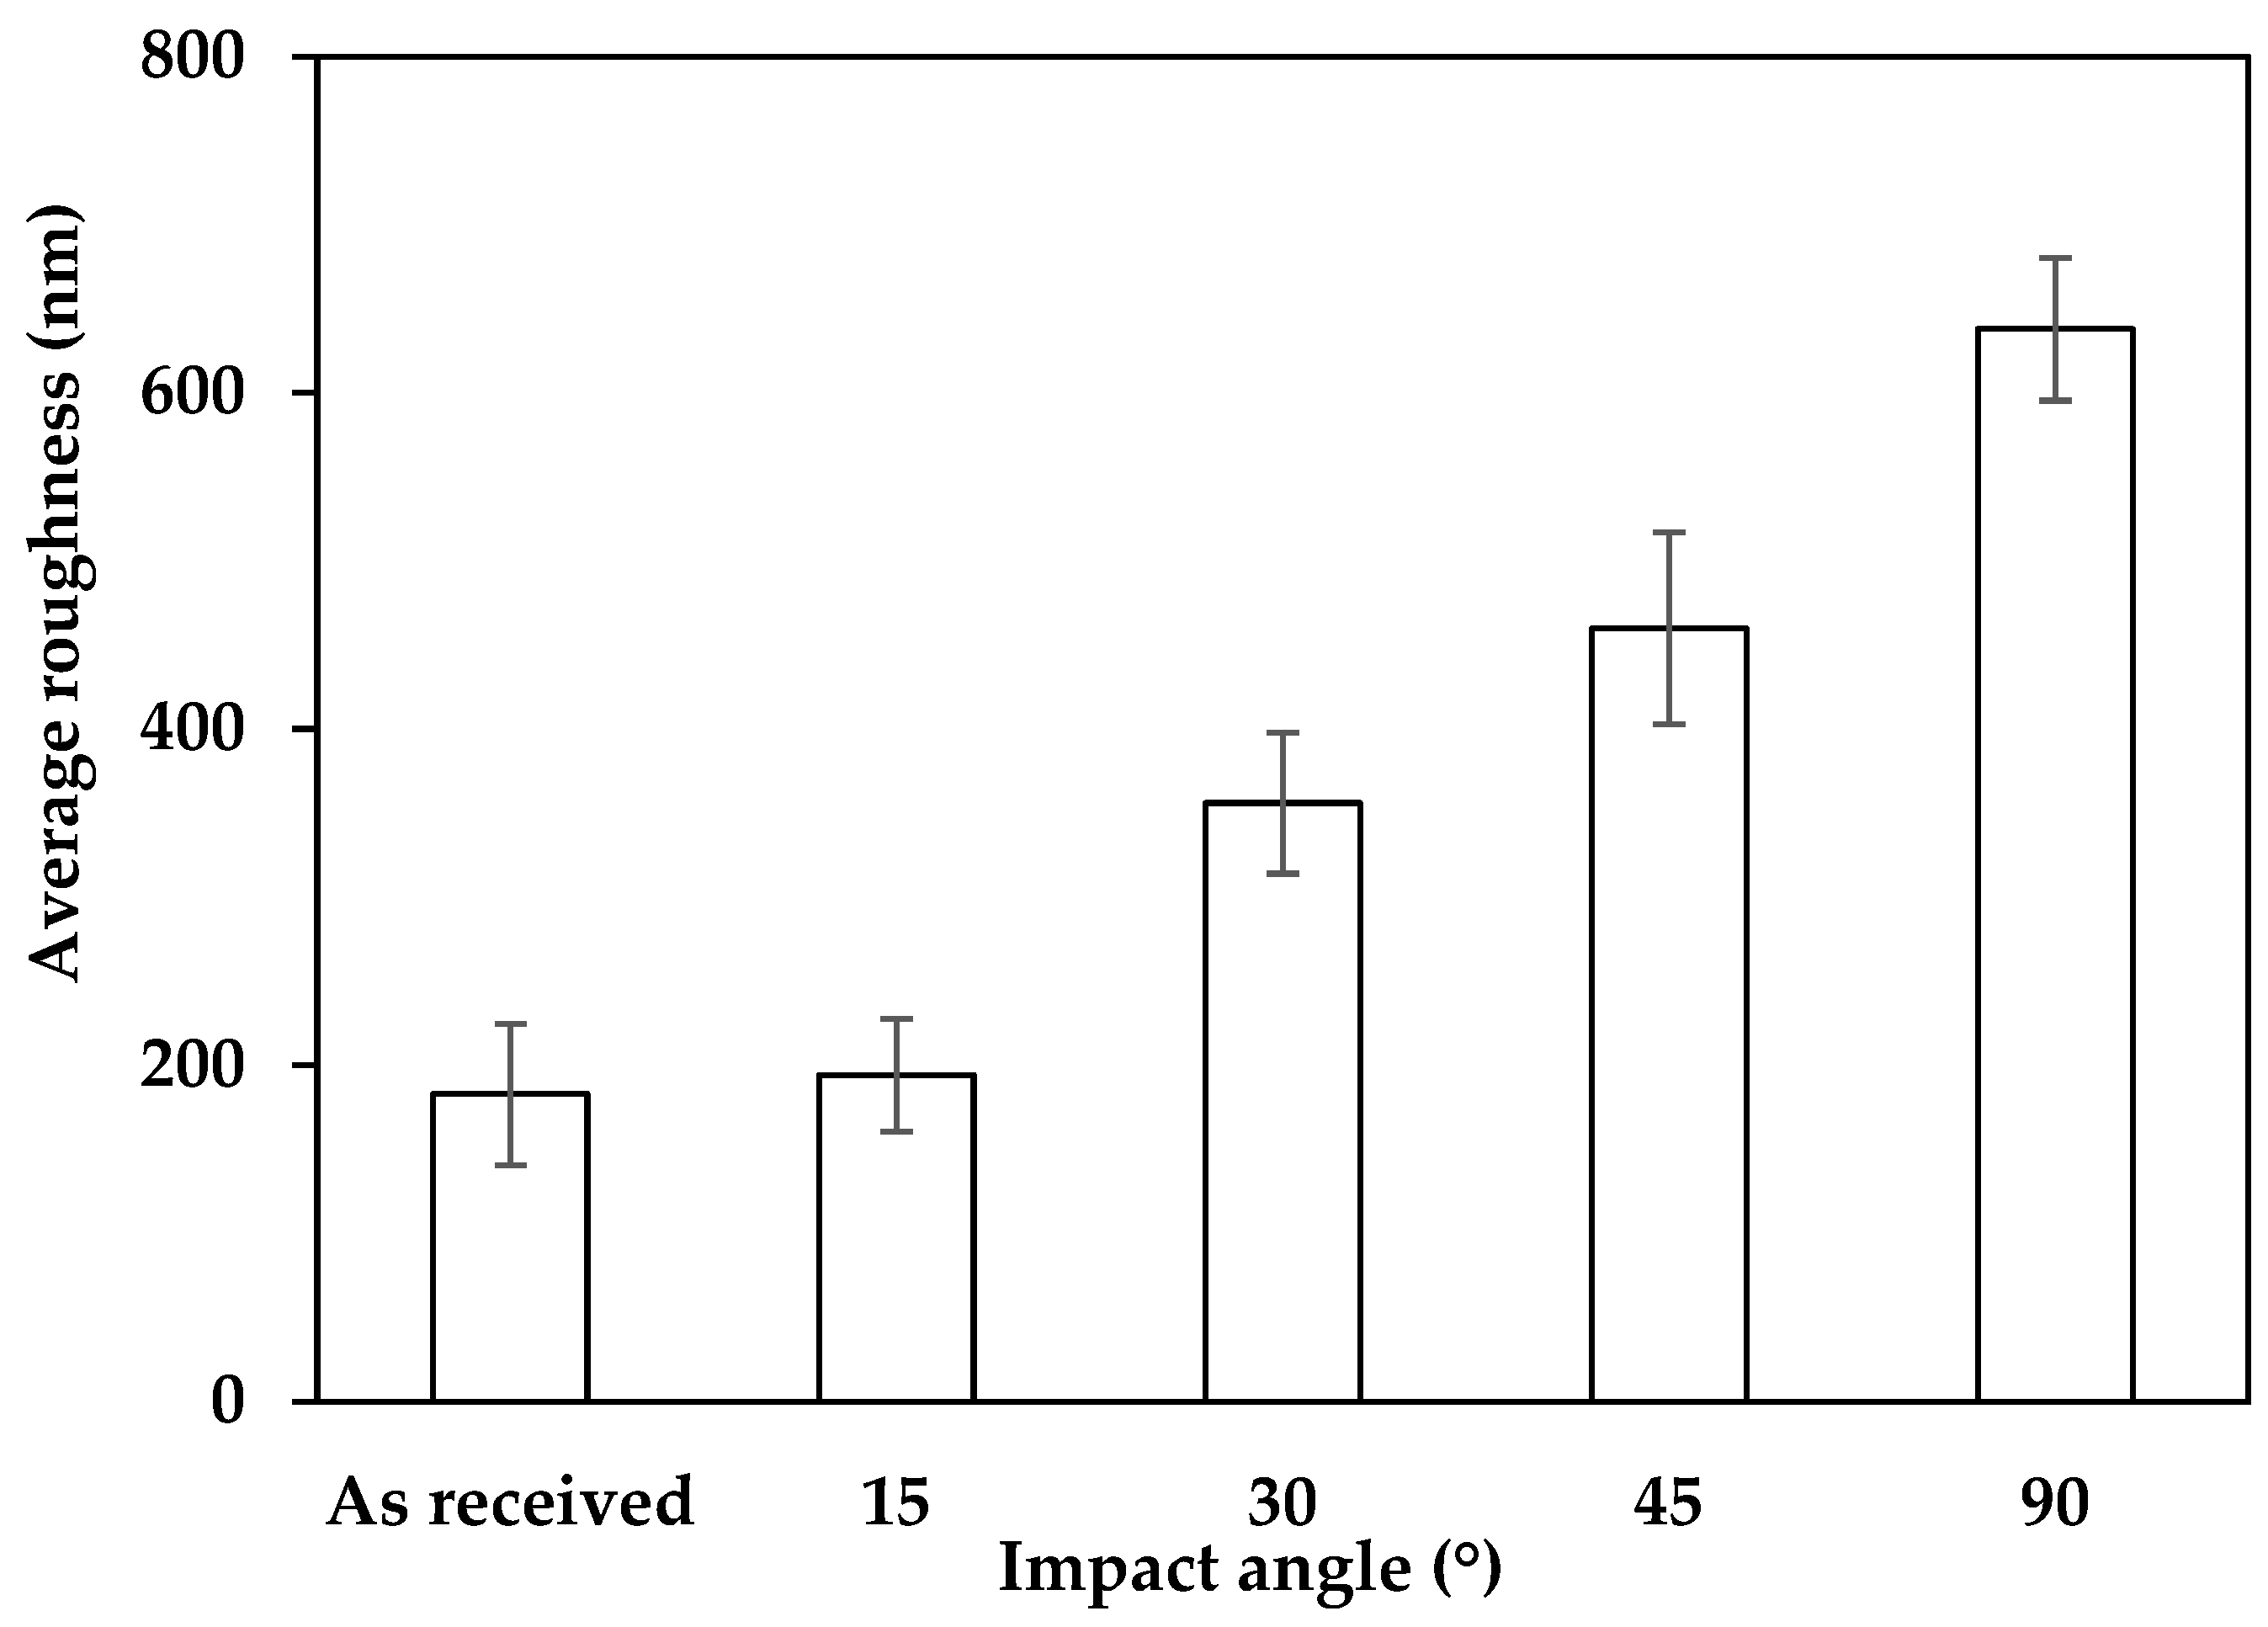
3.3. Surface Roughness

Figure 10 shows the average roughness analysis using AFM images of eroded CR surfaces subjected to varying impact angles. The error bars depict a 95% confidence interval for the results. Table 4 shows the average roughness of eroded CR samples and the change in the roughness compared to uneroded CR samples.

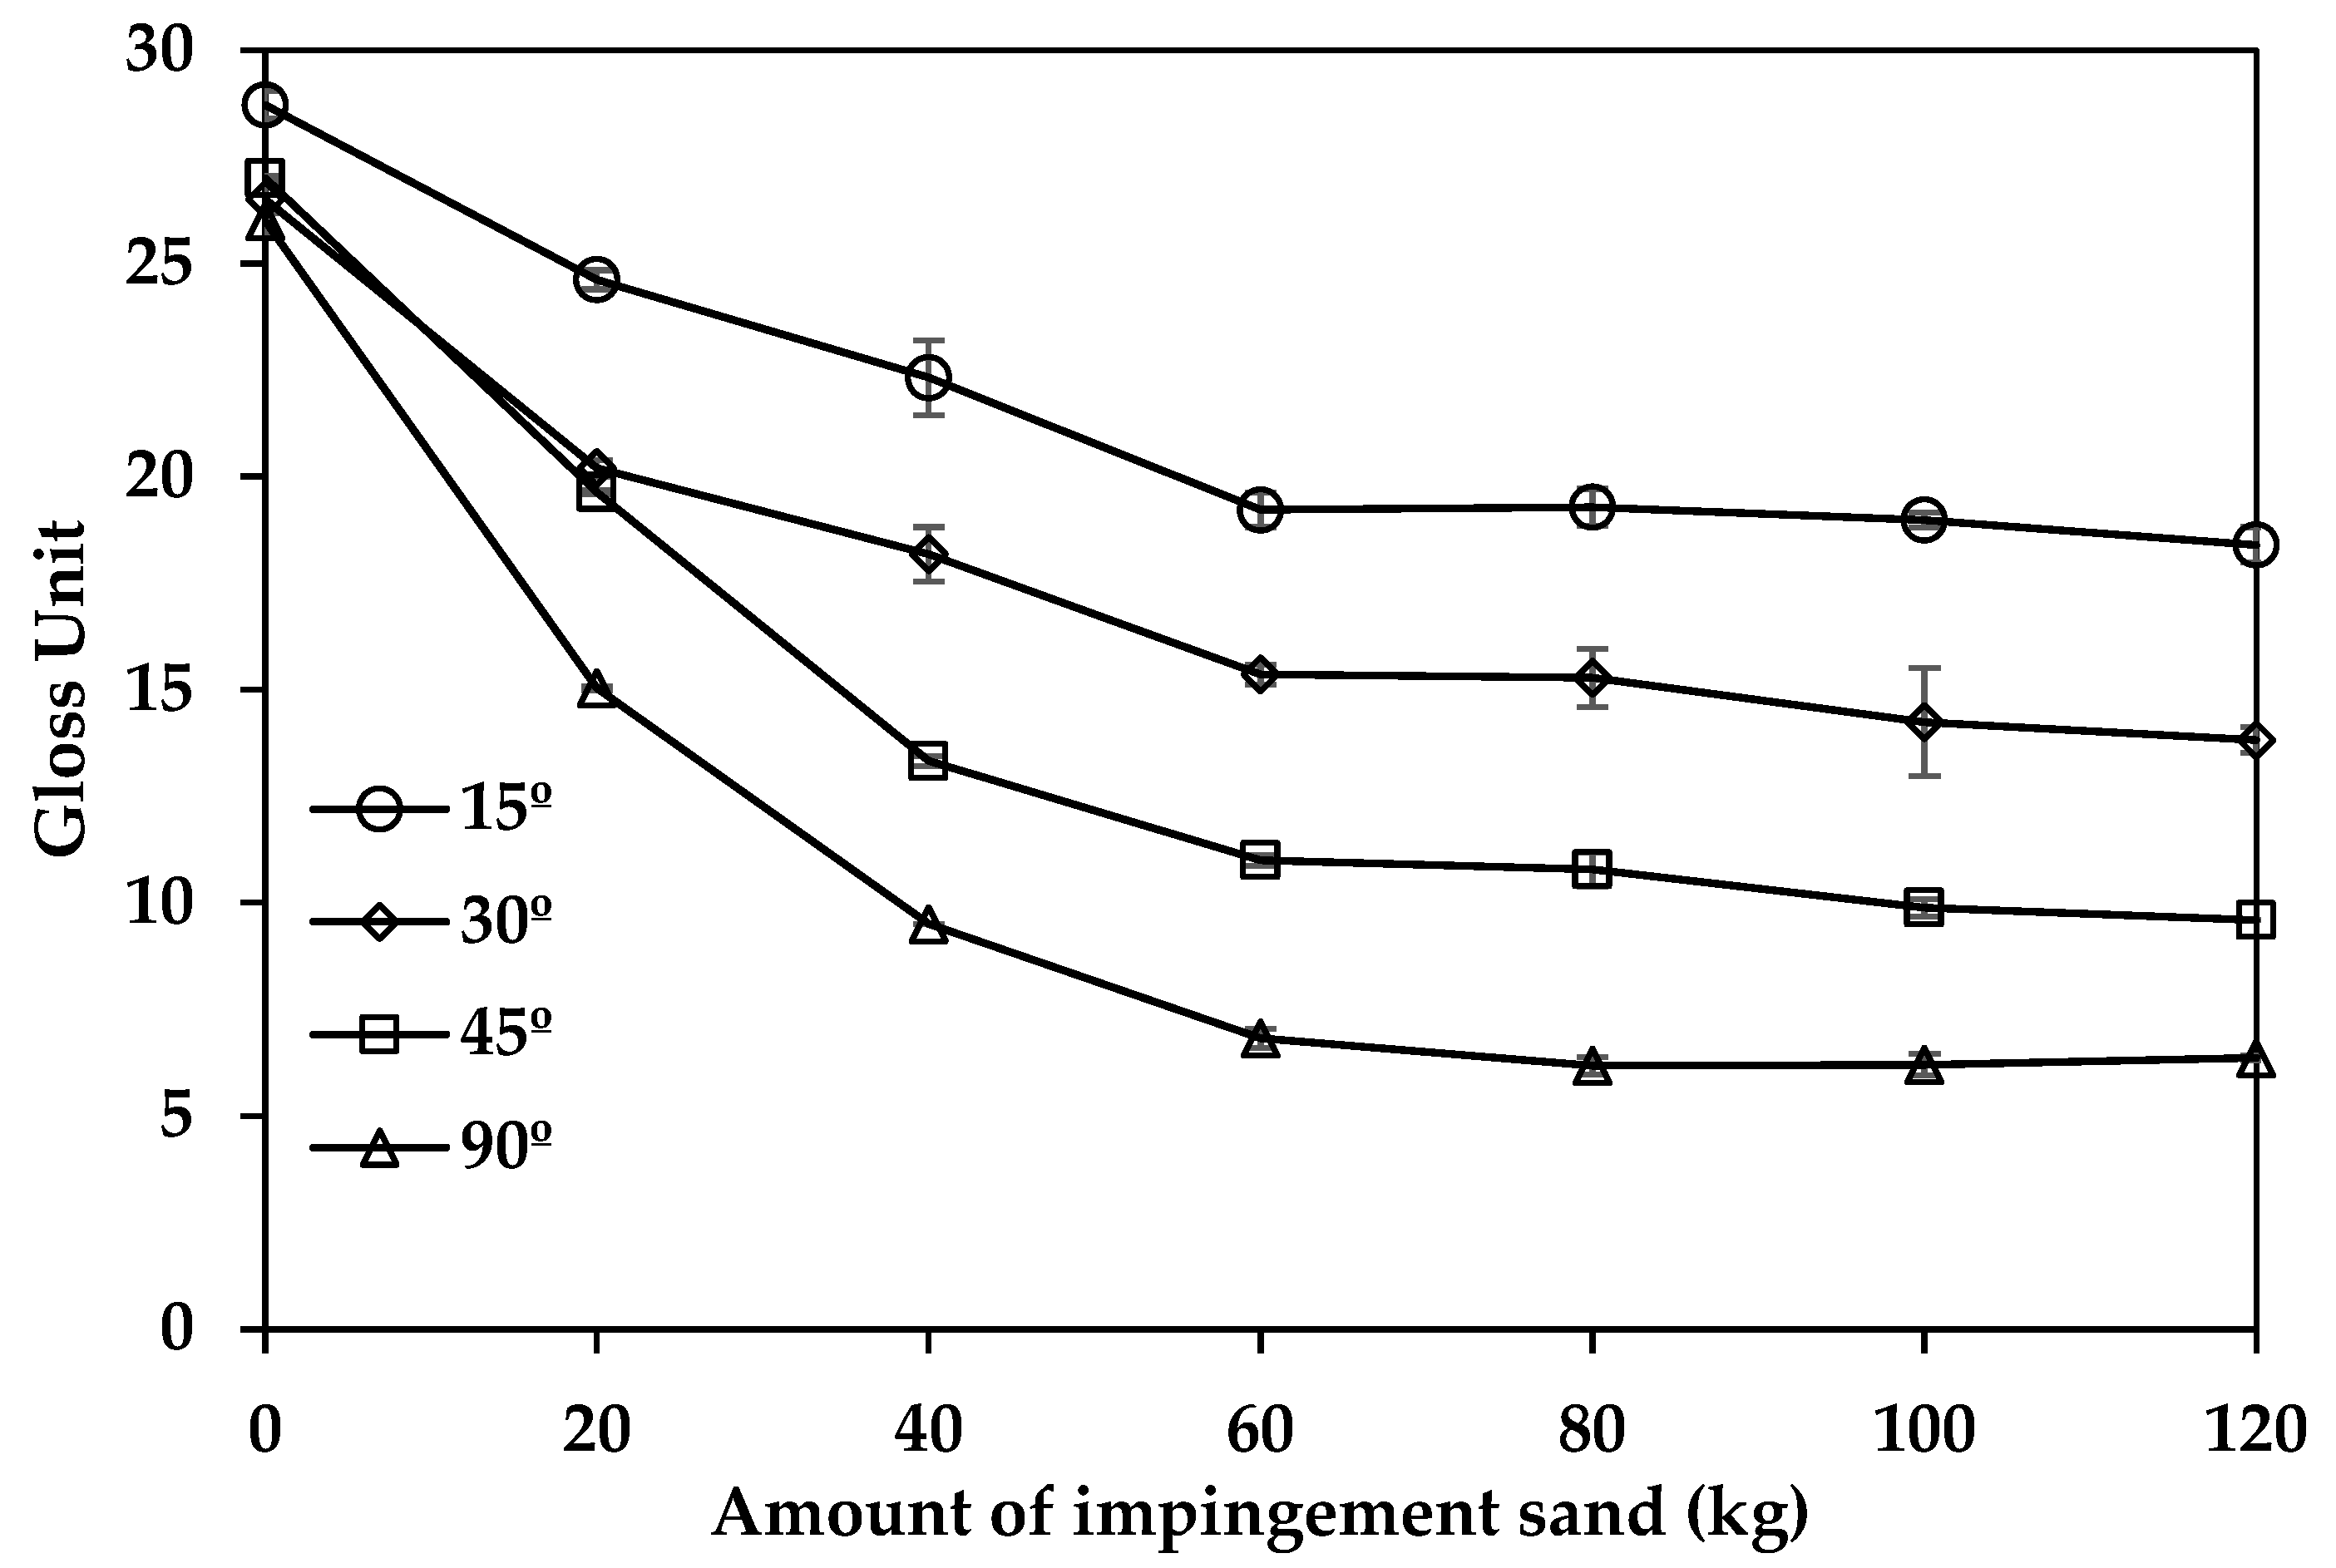
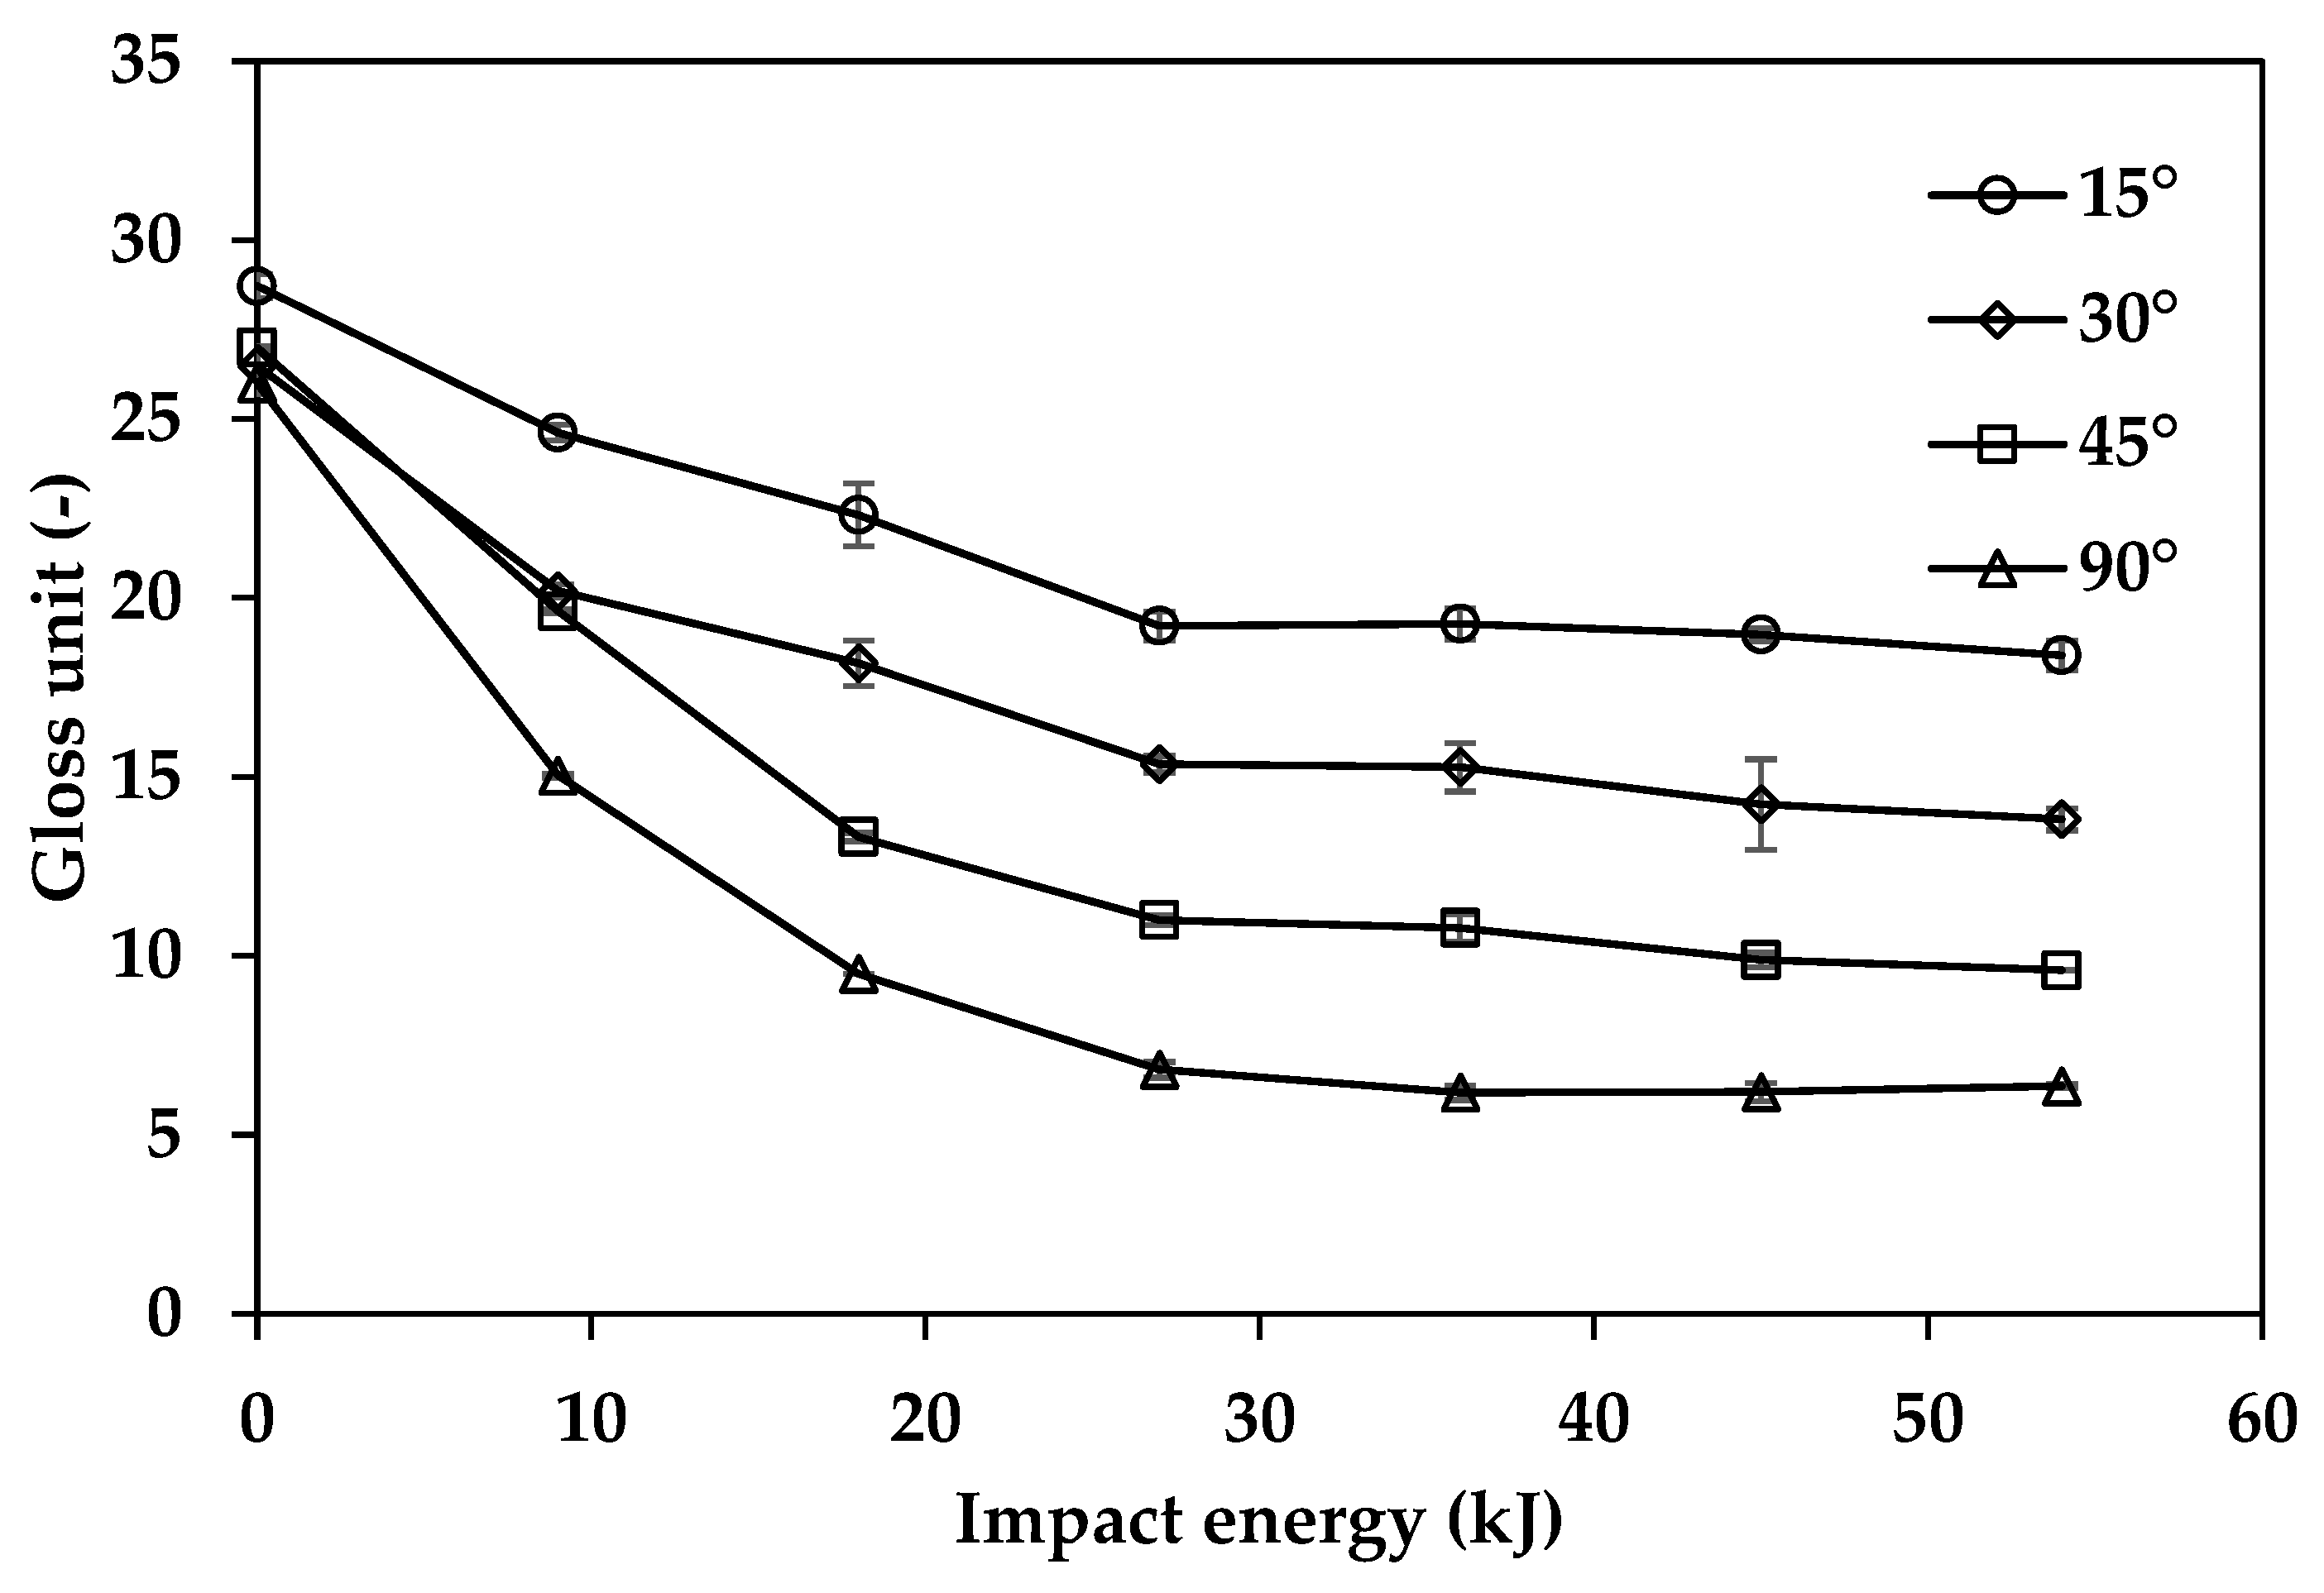
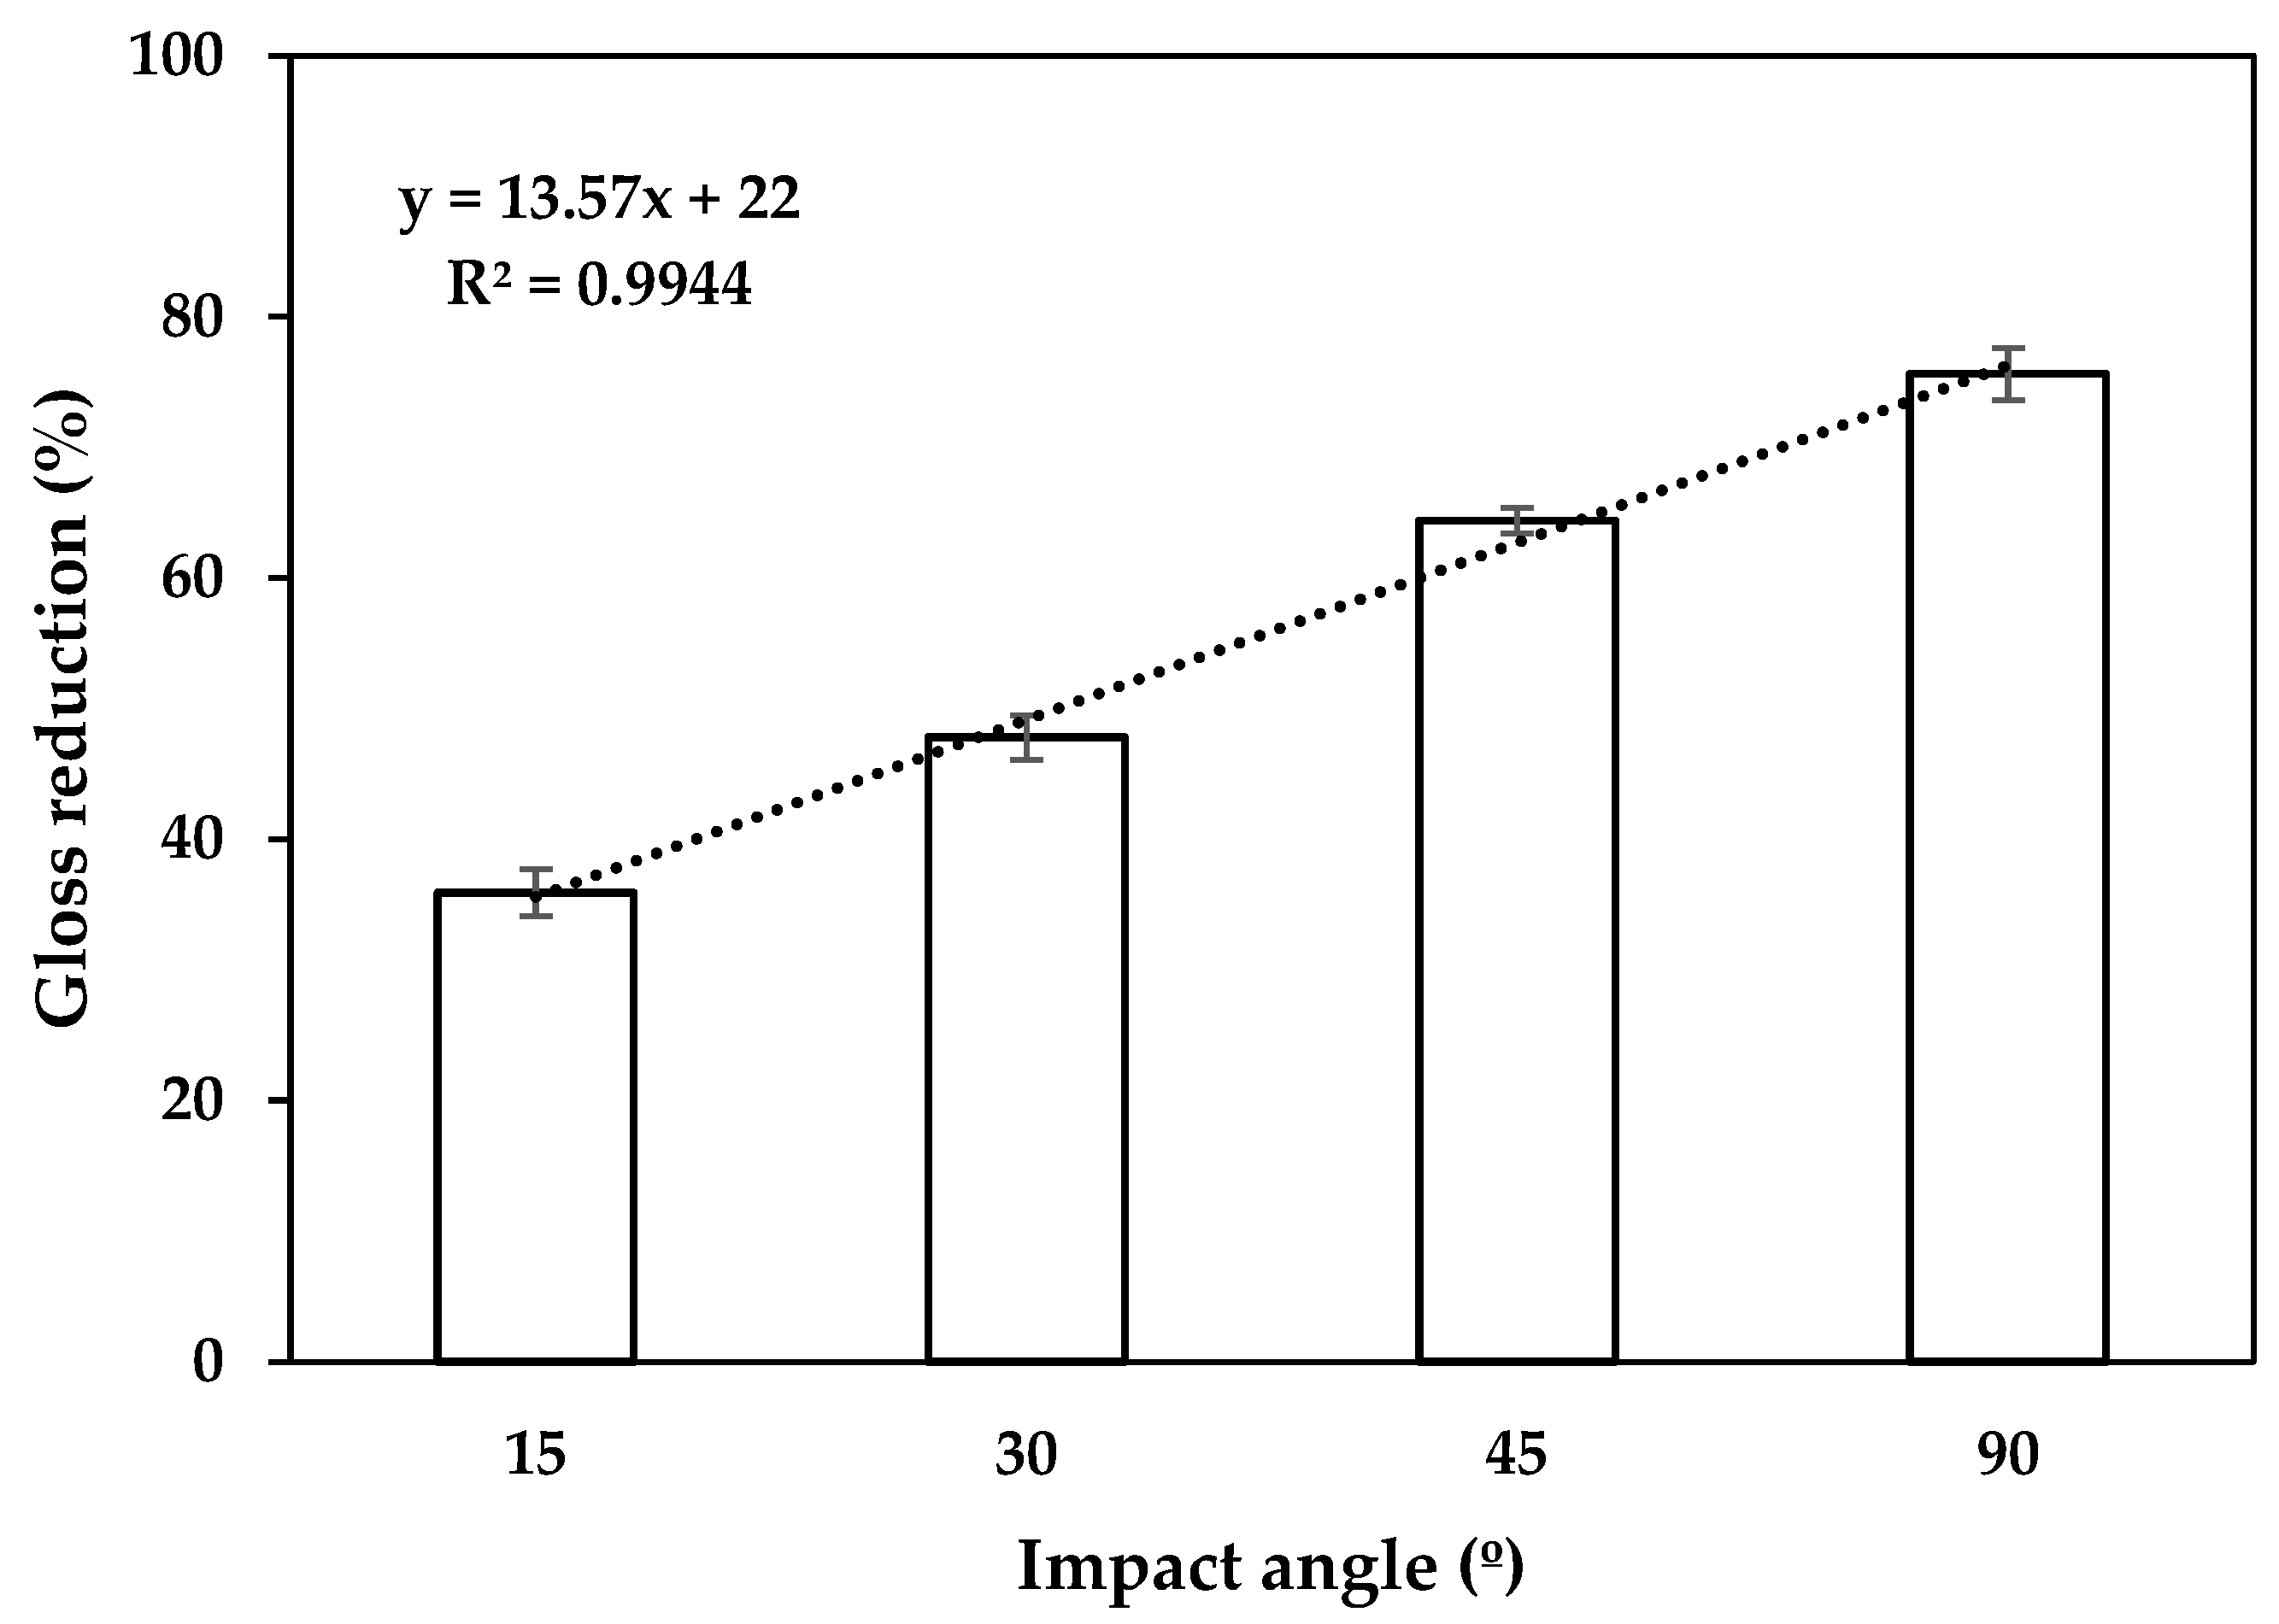
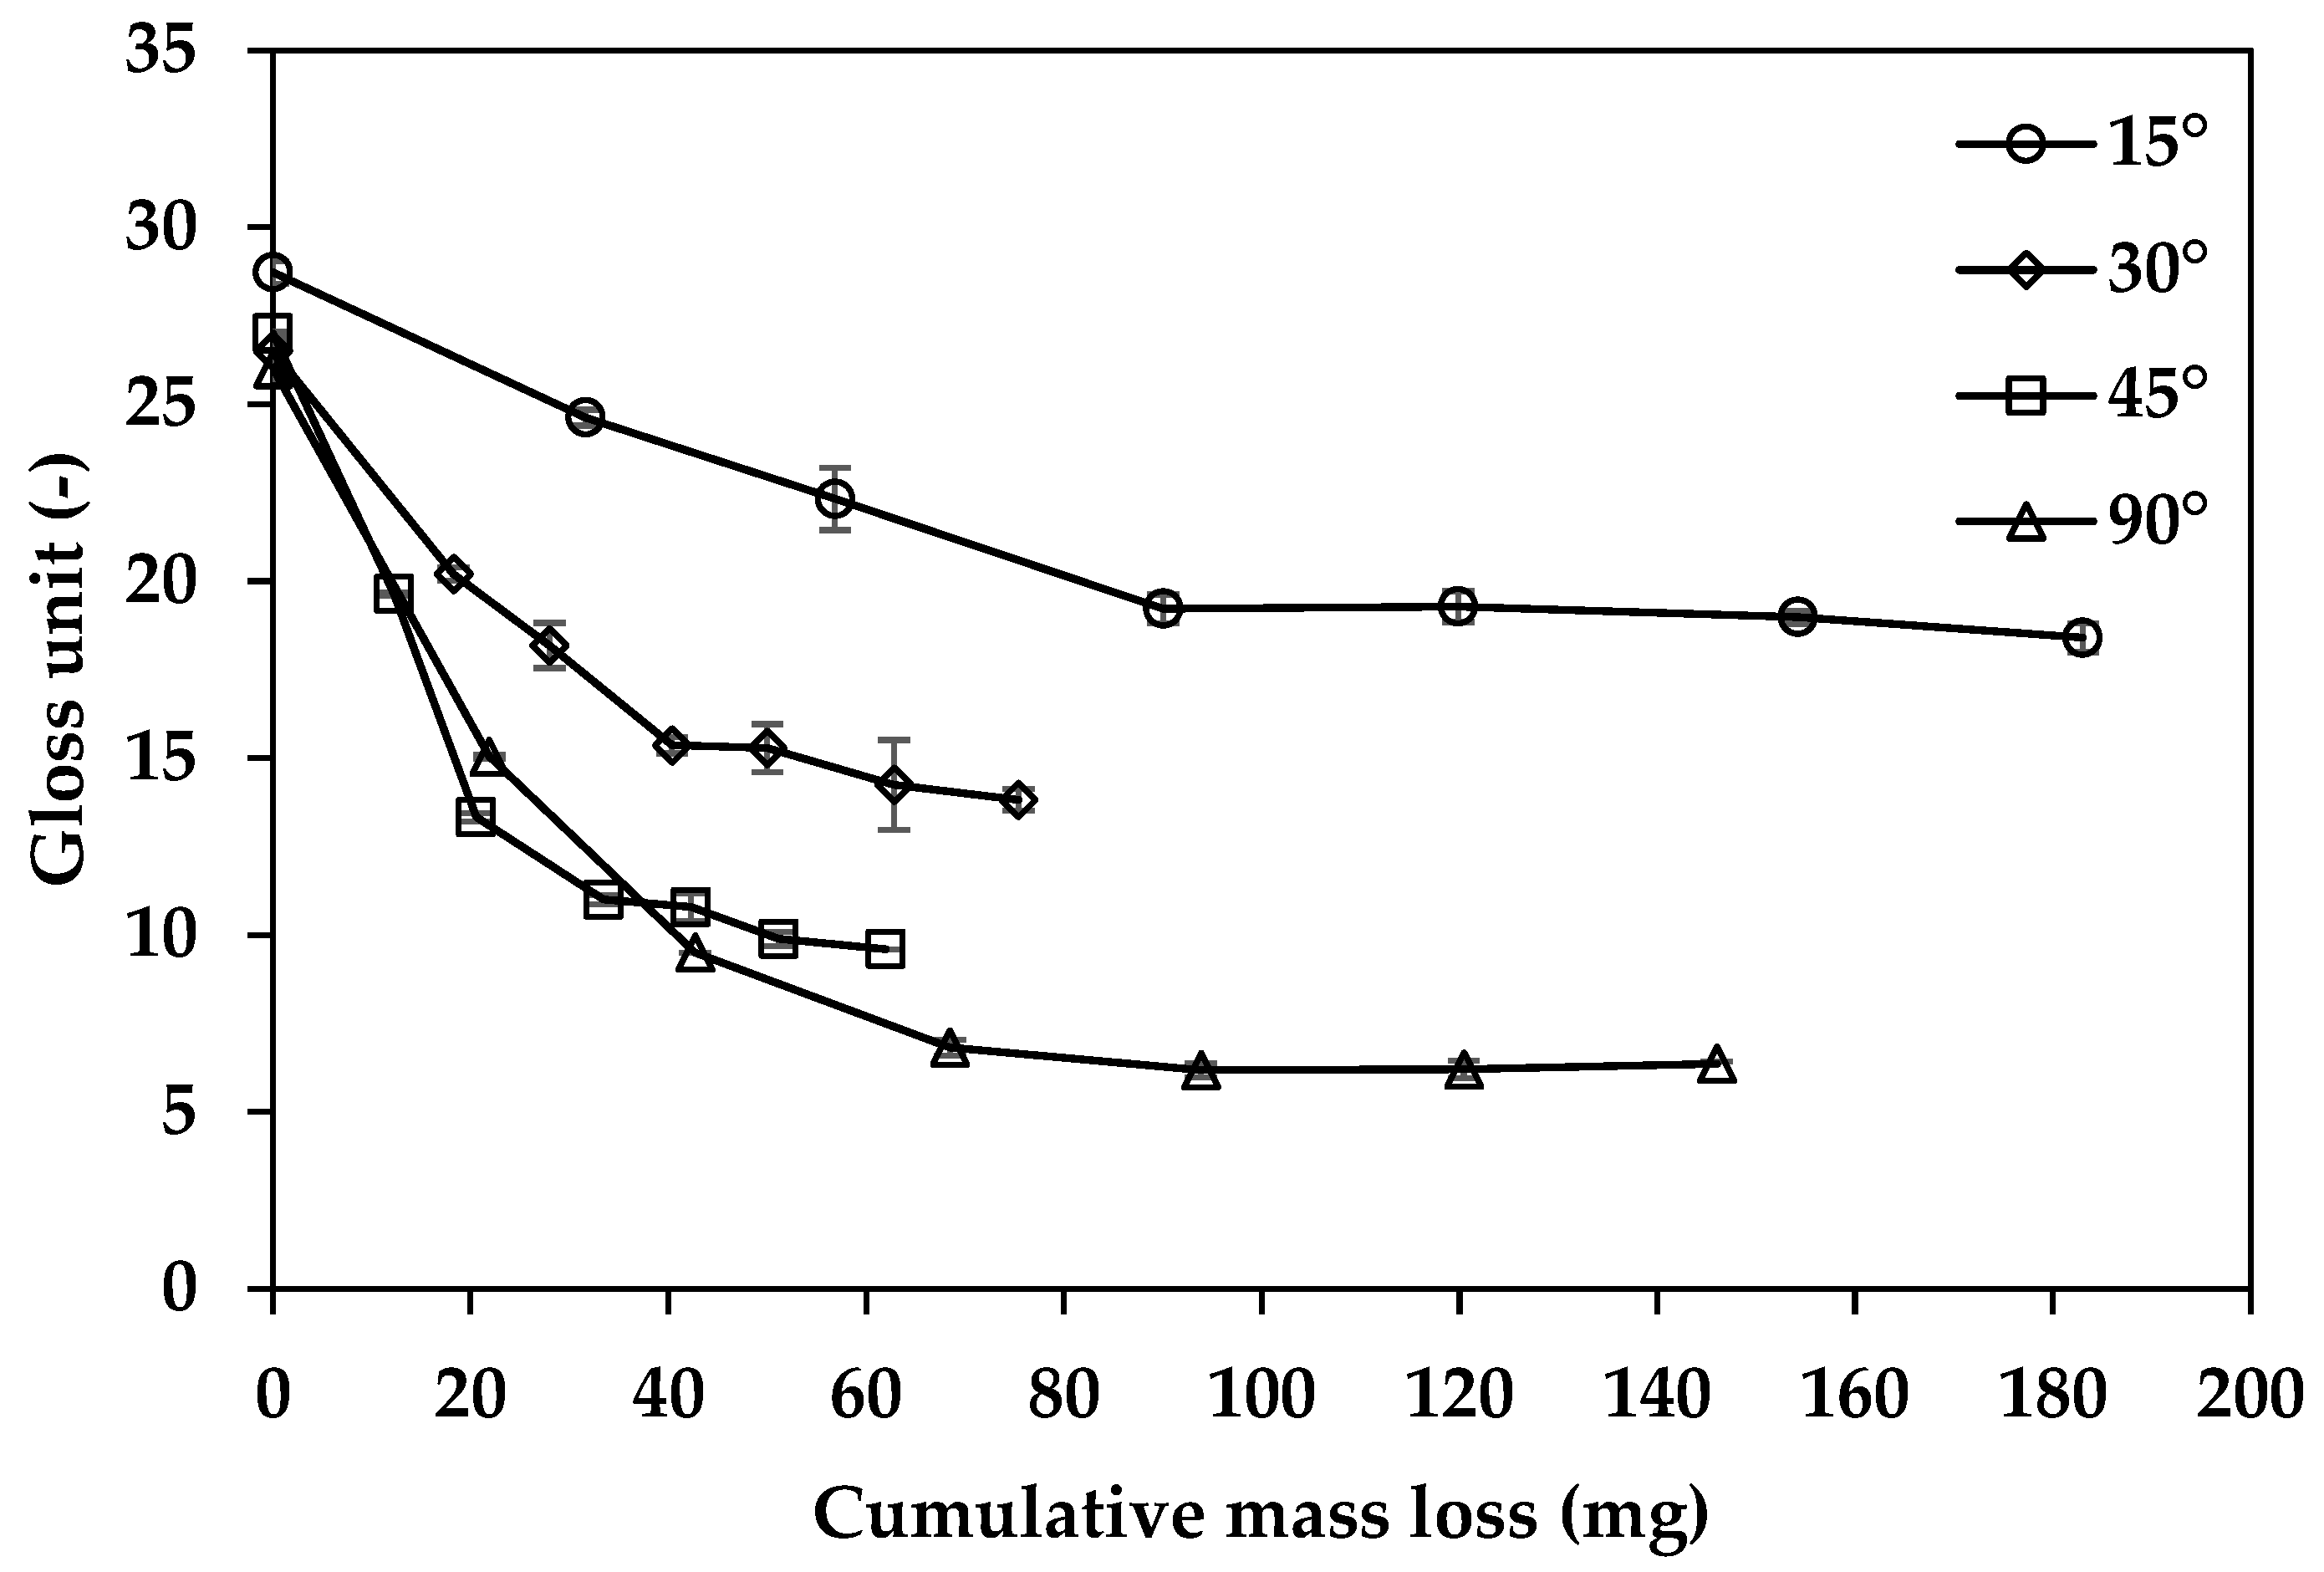
3.4. Slurry Erosion and Surface Gloss

The results in Figure 11 and Figure 12 show the changes in gloss units of eroded CR with varying amounts of impinging sand and impact energy for different impact angles.
Figure 13 shows the gloss reduction of the eroded CR surfaces subjected to different impact angles. Error bars indicate a 95% confidence interval for the results.
Figure 13 displays the gloss data recorded at each slurry erosion testing cycle plotted against cumulative material loss. Error bars represent a 95% confidence interval for the results.

4. Discussion

4.1. Slurry Erosion and Erosion Rate

From consideration of Figure 6a illustrating the cumulative material loss in CR in relation to changes in the mass of impinging sand and impact angles, it is clear that the material loss of CR increased proportionally with the amount of impinging sand, reaching a steady state of slurry erosion after approximately 60 kg of sand impingement. Figure 6b indicates that the steady state of material loss occurs around an impact energy of 30 kJ applied to the CR samples at all impact angles. Furthermore, Figure 6c reveals variations in material loss due to slurry erosion at different impact angles, highlighting distinct erosion rates. Specifically, the highest material loss typically occurs at an impact angle of 15°. The erosion rates decreased with an increase in impact angles but increased again at 90°. This variability suggests that erosion mechanisms differ significantly across various impact angles, particularly between glancing and normal angles, consistent with previous studies [10,12,13,14,15,16]. Employing appropriate testing techniques is crucial to substantiate these observations.
Quantitative measurement methods offer valuable insights into rubber resistance to slurry erosion under various impact conditions, aiding in assessing erosion stages and rates. However, obtaining precise quantitative data, such as rubber mass loss, can be time-intensive. In this study, for example, it took 16 h to sufficiently dry rubber samples for accurate mass loss measurements, excluding the effects of water uptake during slurry erosion testing. Using traditional methods, such as mass loss measurements employed here, involves the lengthy process of drying samples and measuring mass loss after each test cycle, as depicted in Figure 6a. Under the conditions of this study, it required at least three days to determine the amount of sand needed for the slurry erosion of CR to stabilise and reach a steady state. This extended timeframe ensures dependable and precise measurements of material loss due to slurry erosion in CR samples. Therefore, alternative qualitative methods are needed for initial assessments of rubber slurry erosion to reduce analysis time. Visual inspection, which can provide quantitative results, could be one of the valuable methods for this purpose.

4.2. Surface Topography

Optical images in Figure 7 reveal a transition in the shape of the eroded area from elongated to circular with increasing impact angle, indicating changes in the impingement area. This suggests a shift from shallow to deep wear scars as slurry impact angles move from oblique to normal. At lower impact angles, the parallel component of sand velocity exceeds the normal, leading the sand to roll and slide across the rubber surface, consequently restricting penetration. Subsequently, material removal occurs mainly through cutting, ploughing, or shearing mechanisms [10,15,26,27]. Conversely, at a 90° impact angle, the surface of the rubber absorbs the normal kinetic energy component, leading to deformation wear with repeated impacts [10,28]. Impingement at different angles results in differences in material loss and variations in eroded surface topography. The results align with previous studies [10,15,26,27,28,29,30].
The SEM images in Figure 8 and AFM images in Figure 9 reveal the distinct topographies of eroded rubber surfaces subjected to the impact of 120 kg of sand at various angles. At smaller impact angles, the surfaces appear smoother than those at normal incidence, showing evident signs of cutting, shearing, and ploughing. Conversely, the granular structure at higher angles indicates severe deformation. The observed impact craters and cracks at higher angles reflect the intense mechanical stress exerted on the material, leading to significant surface disruption. Sand embedments further illustrate the depth and severity of the impact as particles become lodged within the rubber matrix. These findings underscore the varied slurry erosion mechanisms that occur at different impact angles, corroborating previous studies [10,15,26,27]. This detailed analysis highlights the importance of understanding how impact angles influence erosion. By examining the surface morphology through SEM and AFM images, it becomes evident that the erosion mechanisms are not uniform but rather dependent on the impact angles.

4.3. Surface Roughness

The average roughness analysis derived from AFM images of eroded CR surfaces subjected to different impact angles is presented in Figure 10. When impacted by sand, the rubber surfaces displayed a matte appearance. The average roughness of CR impacted at 15° showed a slight increase, while those impacted at 30°, 45°, and 90° exhibited a substantial increase. As indicated in Table 4, the average roughness of CR impacted at 30°, 45°, and 90° increased by 95, 151, and 250%, respectively. This increase in average roughness correlates directly with the impact angles: the higher the impact angle, the rougher the eroded CR surfaces become. It is noted that the increase in roughness of the CR eroded sample at 90° was 40 times higher than that of the CR eroded sample at 15°. These quantitative findings confirm the variations in slurry erosion resistance and mechanisms of CR at different impact angles, as demonstrated by the previous results of mass loss, microscope, AFM, and SEM images.
While images from microscopic, SEM, and AFM techniques provide detailed topographical information on slurry erosion mechanisms and quantitative data like average roughness measured by AFM, obtaining these results demands considerable time, especially for SEM and AFM imaging. These methods are also time-consuming and expensive. Additionally, preparing rubber samples for AFM and SEM involves cutting and coating, making these techniques destructive and unsuitable for subsequent analyses. The electron bombardment from SEM can significantly damage the rubber surface by causing extensive cross-link formation, leading to a heavily cross-linked surface layer that may exhibit different erosion behaviour [31]. Consequently, using the same rubber samples for slurry erosion testing to obtain erosion rates is impractical, as erosion rates are typically derived from the slope between impingement sand quantity and cumulative material loss from the same CR samples. Furthermore, obtaining prompt, real-time results to track slurry erosion status is impossible with these methods.

4.4. Slurry Erosion and Surface Gloss

The evolution of CR surfaces can be effectively monitored through gloss tracking, providing valuable insights into surface alterations over time. Figure 11 and Figure 12 provide a visual representation of gloss data recorded at each cycle of slurry erosion testing, offering a comprehensive view of how gloss values evolve throughout the testing process with different amounts of impingement sand and impact energy. The results show that the gloss values of CR samples decreased after being impacted by impingement sand with impact energy at all angles. The gloss value decreased significantly at the onset of erosion testing but appeared to stabilise as the CR samples were subjected to impacts from more than 60 kg of sand. The extent of gloss change depended on the impact angles. Specifically, after the first round of testing (20 kg), the gloss of CR decreased by approximately 15% at 15°, 23% at 30°, 27% at 45°, and 43% at 90°. The reduction in gloss after the samples were impacted by particles or rain is consistent with the findings of Leishman G. et al. [11]. Additionally, Figure 13 presents a comparative analysis of the changes in gloss data for CR samples impacted at varying angles, elucidating any angle-dependent trends or patterns in surface gloss alterations. The error bars depicted in the figures represent a 95% confidence interval for the results.
Moreover, the quantitative data obtained from gloss measurements in Figure 12 could be utilised as input for a numerical modelling approach aimed at predicting the lifespan of rubber lining and determining the required frequency and scope of repair interventions. By integrating the gloss data into such predictive models, it becomes possible to assess the degradation rate of the rubber lining over time and anticipate potential failure points or deterioration patterns. This proactive approach to maintenance planning can help optimise resource allocation and minimise downtime by scheduling timely repairs or replacements based on predictive insights derived from the gloss measurements.
Figure 13 indicates that after the final stage of slurry erosion testing, the gloss of CR was reduced by approximately 35% at 15° impact angles, while the reduction exceeded 50% at 30°, 45°, and 90° impact angles. These findings are consistent with the average roughness data obtained from AFM measurements, confirming the different erosion mechanisms at various impact angles. Visual inspection corroborates these observations, showing that CR samples become rougher when impacted at higher angles. The extent of gloss reduction in relation to the impact angles observed in this study can be estimated using Equation (3), as follows:
Gloss reduction (%) = 13.57x + 22
where x is the impact angle (°).
These results demonstrate a clear correlation between impact angle and the degree of gloss reduction, reflecting the varying erosion resistance of CR at different angles. The linear relationship described by Equation (3) provides a quantitative measure to predict the gloss reduction based on the impact angle, highlighting the impact of angle-dependent erosion mechanisms on the surface properties of CR samples.
Figure 14 displays the gloss data recorded at each slurry erosion testing cycle plotted against cumulative material loss. As depicted in Figure 14, the gloss values of CR samples experienced a significant reduction with the initial material loss but then stabilised at specific values. Notably, the glossiness of CR samples remained constant once their material loss reached certain levels. This indicates that the gloss value remains consistent beyond a certain point regardless of further material loss. These observations are consistent with the changes observed in mass loss and gloss with varying amounts of impingement sand and impact energy.
These findings suggest that initial erosion significantly impacts surface gloss, but as erosion progresses and material loss accumulates, the gloss stabilises. This stabilisation points to a steady state of material loss in the slurry erosion process, where further material removal does not significantly alter surface gloss. This relationship between gloss stability and material loss can be crucial for predicting the lifespan and maintenance needs of rubber components in abrasive environments.
Examining the cumulative material loss in Figure 6 and the gloss units in Figure 10 with respect to the amount of impingement sand, it becomes clear that after 60 kg of sand impingement, the cumulative material loss entered a linear phase relative to the impingement sand amount, indicating the attainment of a steady state of erosion. Concurrently, the gloss units remained stable across all impact angles. These findings suggest that once the steady state of rubber material loss is reached, the gloss values of eroded surfaces tend to stabilise, showing little to no change over time. This indicates that the erosion process is relatively constant, resulting in consistent surface gloss properties. In this study, gloss tracking during slurry erosion testing revealed that it takes less than 3 h to determine the sand amount required to reach a steady state of erosion, starkly contrasting to traditional mass loss methods that typically require at least three days. Using gloss measurements to monitor the steady state of CR slurry erosion is 24 times faster than the traditional mass loss method. This implies that the slurry erosion status can be effectively tracked in real-time using gloss measurements, eliminating the need for mass measurement. The gloss measurement provides a more accurate assessment and does not require an extensive drying time of over 16 h before measurement, as seen in traditional methods. If the gloss values at each erosion stage for a given set of rubber samples are known, as illustrated in Figure 11 and Figure 12, these data could serve as an assessment tool for characterising slurry erosion in real-world rubber linings commonly used in the mining industry.
By correlating changes in gloss values with specific erosion stages, it becomes possible to establish quantitative benchmarks for evaluating the extent and severity of erosion damage experienced by rubber linings over time. This information can inform maintenance strategies, allowing for proactive interventions to mitigate wear and prolong the operational lifespan of rubber linings in mining applications. This approach depends on knowing the type of rubber used for lining mining equipment and establishing the gloss value progression with erosion. The quantity of impinging sand required for rubber samples to reach their steady state of slurry erosion can be determined using gloss measurements. By identifying the point at which gloss values stabilise, continuous slurry erosion testing can proceed during the initial stage without needing to dry and weigh the eroded rubber samples until the predetermined amount of sand is reached. Subsequently, the erosion rates of rubber samples can be computed from the slope of the graph, illustrating the relationship between the amount of sand and cumulative material loss after the designated sand exposure period. This approach significantly reduces the time needed for slurry erosion testing.
Gathering sufficient gloss measurement data on the rubber lining allows for a more precise assessment of slurry erosion. This method reveals the current erosion state and predicts when the lining will enter the active erosion phase, known as the steady state. Identifying this phase enables operators to proactively address escalating erosion rates, implementing timely maintenance to extend the service life of rubber linings. This proactive approach boosts operational efficiency, reduces downtime, and lowers overall lifecycle costs in mining applications. The gloss meter method presents numerous advantages compared to current methods for assessing slurry erosion on rubber linings. It can provide quantitative results, is portable, allows quick quantitative measurements, and is cost-effective, requiring minimal expertise. However, there are some drawbacks to consider. Gloss measurements are limited to a small area compared to the entire lining, necessitating multiple measurements, and they can be affected by surface contaminants.

5. Conclusions

In conclusion, this study examined the slurry erosion behaviour of chloroprene rubber (CR) under varying impact conditions, such as the amounts of sand, impact angles, and energy, employing a combination of quantitative and qualitative measurement techniques. The research illustrates that cumulative material loss in CR increases directly to the amount of impinging sand, stabilising notably after approximately 60 kg of sand impingement. This stabilisation is consistent across impact angles and closely correlates with an impact energy of around 30 kJ, highlighting the pivotal role of impact conditions in shaping erosion rates.
While traditional mass loss methods proved effective, they were notably time-intensive due to extended drying requirements for accurate mass loss measurements of high erosion-resistant material such as rubbers. Qualitative methods such as visual inspection and optical imaging offered rapid initial assessments, revealing distinct changes in eroded area shapes with varying impact angles—from cutting and ploughing at lower angles to deformation and crater formation at higher angles. Subsequent SEM and AFM analyses confirmed these observations, demonstrating surface topography changes and increased roughness at higher impact angles. However, these methods also have significant time and cost implications, with sample preparation for AFM and SEM being particularly disruptive and unsuitable for subsequent analyses.
Gloss measurements emerged as a practical alternative for real-time erosion monitoring. The differences in the gloss of eroded CR surfaces impacted at different angles highlight varying slurry erosion mechanisms, as confirmed by SEM and AFM results. Gloss measurements showed stabilised gloss values upon reaching critical material loss thresholds, indicating a state of steady erosion. Further material removal minimally affects surface gloss in this state, establishing a linear relationship between the amount of impinging sand and material loss. Once a specific amount of sand and impact energy is reached, the gloss values of eroded CR surfaces stabilise, signifying a steady state of material loss in the slurry erosion process. This relationship between gloss stability and material loss is crucial for predicting the lifespan and maintenance needs of rubber components in erosive environments. Gloss measurements offer a faster and more accurate assessment method than traditional mass loss measurements. They can determine the sand amount needed to reach a steady state of erosion in less than 3 h, compared to the three days required by traditional methods. This approach allows for real-time monitoring, eliminating the need for extensive drying times.
Overall, integrating these measurement techniques significantly enhances our understanding of slurry erosion mechanisms in rubber materials and facilitates proactive maintenance approaches to mitigate wear and extend service life in industrial applications. By leveraging these insights, operators can streamline maintenance schedules, optimise resource allocation, and reduce downtime, supporting operational efficiency and reducing lifecycle costs associated with rubber components exposed to slurry erosion. These findings underscore the critical importance of tailored measurement strategies in advancing the durability and performance of rubber linings in demanding operational environments, particularly in the mining industry. Future research could refine gloss measurement techniques across diverse environmental conditions and explore integrating gloss data with predictive models for more precise forecasts of rubber liner lifetimes and erosion rates.

Author Contributions

Conceptualisation, W.C. and L.Y.; methodology, W.C. and L.Y.; validation, W.C.; formal analysis, W.C.; investigation, W.C.; data curation, W.C. and L.Y.; writing—original draft, W.C.; writing—review and editing, W.C. and L.Y.; supervision, L.Y.; funding acquisition, W.C. and L.Y.; project administration, L.Y.; and visualisation, L.Y. All authors have read and agreed to the published version of the manuscript.

Funding

This research received no external funding.

Institutional Review Board Statement

Not Applicable.

Informed Consent Statement

Not Applicable.

Data Availability Statement

Data are contained within the article.

Acknowledgments

The authors would like to thank the Advanced Composites Group (ACG) at the University of Strathclyde, UK and Department of Materials and Metallurgical Engineering, Faculty of Engineering, Rajamangala University of Technology Thanyaburi, Thailand, for using its facilities. We also would like to express our sincere gratitude to the reviewers for their thorough evaluation and insightful comments.

Conflicts of Interest

The authors declare no conflicts of interest.

References

  1. Xie, Y.; Jiang, J.; Tufa, K.Y.; Yick, S. Wear Resistance of Materials Used for Slurry Transport. Wear 2015, 332–333, 1104–1110. [Google Scholar] [CrossRef]
  2. Llewellyn, R.J.; Yick, S.K.; Dolman, K.F. Scouring Erosion Resistance of Metallic Materials Used in Slurry Pump Service. Wear 2004, 256, 592–599. [Google Scholar] [CrossRef]
  3. Shitole, P.P.; Gawande, S.H.; Desale, G.R.; Nandre, B.D. Effect of Impacting Particle Kinetic Energy on Slurry Erosion Wear. J. Bio-Tribo-Corros. 2015, 1, 29. [Google Scholar] [CrossRef]
  4. Sinha, S.L.; Dewangan, S.K.; Sharma, A. A Review on Particulate Slurry Erosive Wear of Industrial Materials: In Context with Pipeline Transportation of Mineral−Slurry. Part. Sci. Technol. 2017, 35, 103–118. [Google Scholar] [CrossRef]
  5. Grewal, H.S.; Agrawal, A.; Singh, H. Slurry Erosion Performance of Ni–Al2O3 Based Composite Coatings. Tribol. Int. 2013, 66, 296–306. [Google Scholar] [CrossRef]
  6. Javaheri, V.; Porter, D.; Kuokkala, V.T. Slurry Erosion of Steel—Review of Tests, Mechanisms and Materials. Wear 2018, 408, 248–273. [Google Scholar] [CrossRef]
  7. Zum Gahr, K.-H. Wear by Hard Particles. Tribol. Int. 1998, 31, 587–596. [Google Scholar] [CrossRef]
  8. Iwai, Y.; Nambu, K. Slurry Wear Properties of Pump Lining Materials. Wear 1997, 210, 211–219. [Google Scholar] [CrossRef]
  9. Han, J.; Zhang, Y.; Wu, C.; Xie, L.; Ma, Y. Wet Sliding Abrasion of Natural Rubber Composites Filled with Carbon Black at Different Applied Loads. J. Macromol. Sci. Part B Phys. 2015, 54, 401–410. [Google Scholar] [CrossRef]
  10. Chailad, W.; Yang, L.; Coveney, V.; Bowen, C.; Bickley, A. Development of Slurry-Jet Erosion Test for Elastomeric Materials. Wear 2022, 488, 214025. [Google Scholar] [CrossRef]
  11. Leishman, G.; Nahs, D.; Yang, L.; Dyer, K. A Novel Approach for Wind Turbine Blade Erosion Characterization An Investigation Using Surface Gloss Measurement. Coatings 2022, 12, 928. [Google Scholar] [CrossRef]
  12. Jones, L.C. Low Angle Scouring Erosion Behaviour of Elastomeric Materials. Wear 2011, 271, 1411–1417. [Google Scholar] [CrossRef]
  13. Sare, I.R.; Mardel, J.I.; Hill, A.J. Wear-Resistant Metallic and Elastomeric Materials in the Mining and Mineral Processing Industries—An Overview. Wear 2001, 250, 1–10. [Google Scholar] [CrossRef]
  14. Xie, Y.; Jiang, J.; Islam, M.A. Elastomers and Plastics for Resisting Erosion Attack of Abrasive/Erosive Slurries. Wear 2019, 426, 612–619. [Google Scholar] [CrossRef]
  15. Arnold, J.C.; Hutchings, I.M. The Mechanisms of Erosion of Unfilled Elastomers by Solid Particle Impact. Wear 1990, 138, 33–46. [Google Scholar] [CrossRef]
  16. Arnold, J.C.; Hutchings, I.M. Flux Rate Effects in the Erosive Wear of Elastomers. J. Mater. Sci. 1989, 24, 833–839. [Google Scholar] [CrossRef]
  17. Yong, Q.; Chang, J.; Liu, Q.; Jiang, F.; Wei, D.; Li, H. Correlation of Surface Roughness on Measurement Length and Gloss. Polymers 2020, 12, 326. [Google Scholar] [CrossRef] [PubMed]
  18. Nadal, M.; Thompson, E. New Primary Standard for Specular Gloss Measurements. J. Coat. Technol. 2000, 72, 61–99. [Google Scholar] [CrossRef]
  19. Vessot, K.; Messier, P.; Hyde, J.M.; Brown, C.A. Correlation between Gloss Reflectance and Surface Texture in Photographic Paper. Scanning 2015, 37, 204–217. [Google Scholar] [CrossRef]
  20. Järnström, J.; Väisänen, M.; Lehto, R.; Jäsberg, A.; Timonen, J.; Peltonen, J. Effect of Latex on Surface Structure and Wetting of Pigment Coatings. Colloids Surfaces A Physicochem. Eng. Asp. 2010, 353, 104–116. [Google Scholar] [CrossRef]
  21. BS EN ISO 2813:2014; Paints and Varnishes—Determination of Gloss Value at 20 Degrees, 60 Degrees and 85 Degrees. BSI Standards Publication: London, UK, 2014.
  22. Trezza, T.A.; Krochta, J.M. Specular Reflection, Gloss, Roughness and Surface Heterogeneity of Biopolymer Coatings. J. Appl. Polym. Sci. 2001, 79, 2221–2229. [Google Scholar] [CrossRef]
  23. Romo, S.A.; Santa, J.F.; Giraldo, J.E.; Toro, A. Cavitation and High-Velocity Slurry Erosion Resistance of Welded Stellite 6 Alloy. Tribol. Int. 2012, 47, 16–24. [Google Scholar] [CrossRef]
  24. Wang, Q.; Tang, Z.; Cha, L. Cavitation and Sand Slurry Erosion Resistances of WC-10Co-4Cr Coatings. J. Mater. Eng. Perform. 2015, 24, 2435–2443. [Google Scholar] [CrossRef]
  25. Yerina, N.; Magonov, S. Atomic Force Microscopy in Analysis of Rubber Materials. Rubber Chem. Technol. 2003, 76, 846–859. [Google Scholar] [CrossRef]
  26. Hutchings, I.M. Mechanisms of the Erosion of Metals by Solid Particles; American Society for Testing and Materials: West Conshohocken, PA, USA, 1979; pp. 59–76. [Google Scholar]
  27. Arnold, J.C.; Hutchings, I.M. The Erosive Wear of Elastomers. J. Rubber Res. 1991, 6, 241–256. [Google Scholar]
  28. Arnold, J.C.; Hutchings, I.M. Erosive Wear of Rubber by Solid Particles at Normal Incidence. Wear 1993, 161, 213–221. [Google Scholar] [CrossRef]
  29. Oka, Y.I.; Ohnogi, H.; Hosokawa, T.; Matsumura, M. The Impact Angle Dependence of Erosion Damage Caused by Solid Particle Impact. Wear 1997, 203, 573–579. [Google Scholar] [CrossRef]
  30. Clark, H.M.I.; Wong, K.K. Impact Angle, Particle Energy and Mass Loss in Erosion by Dilute Slurries. Wear 1995, 186, 454–464. [Google Scholar] [CrossRef]
  31. Arnold, J.C.; Hutchings, I.M. Electron Beam Damage in Scanning Electron Microscopy of Worn Elastomer Surfaces. Wear 1988, 128, 339–342. [Google Scholar] [CrossRef]
Figure 1. Spectral reflection.
Coatings 14 00915 g001
Figure 2. (a) High diffuse reflection; (b) low diffuse reflection.
Coatings 14 00915 g002
Figure 3. Incident angle for gloss measurement [21].
Coatings 14 00915 g003
Figure 4. A schematic view of the SJET rig (not to scale) [10]. 1. Nozzle; A test piece with backing strip (adjustable angle 10° to 90°); 2. CR Sample; 3. Slurry collecting reservoir; 4. Main slurry pipe; 5. Main pump with inverter; 6. 500 L testing reservoir; 7. Sand slurry; 8. Overhead mixer; 9. Transfer pump; 10. Slurry storage reservoir; 11. Water inlet; 12. Splash cover; 13. Draining pipe points.
Coatings 14 00915 g004
Figure 5. Step-by-step gloss measurements and interpretation of gloss results.
Coatings 14 00915 g005
Figure 6. (a) Cumulative mass loss of CR with the amount of impingement sand; (b) impact energy in SJET at impact angles of 15°, 30°, 45°, and 90°; (c) slurry erosion rates obtained from the slope in Figure 6a.
Coatings 14 00915 g006
Figure 7. Optical micrographs of the eroded surface of CR impacted by 120 kg of sand at angles of (a) 15°; (b) 30°; (c) 45°; (d) 90°.
Coatings 14 00915 g007
Figure 8. SEM images of the eroded surface of CR impacted by 120 kg of sand at angles of (a) 15°; (b) 30°; (c) 45°; (d) 90°.
Coatings 14 00915 g008
Figure 9. AFM topography images of the (a) uneroded and eroded surfaces of CR after 120 kg of sand impingement at impact angles of (b) 15°; (c) 30°; (d) 45°, (e) 90°.
Coatings 14 00915 g009
Figure 10. Average roughness of CR surfaces before and after 120 kg of sand at impact angles of 15° 30°, 45°, and 90°.
Coatings 14 00915 g010
Figure 11. Changes in gloss units of eroded CR with the amount of impingement sand in SJET at impact angles of 15°, 30°, 45°, and 90°.
Coatings 14 00915 g011
Figure 12. Changes in gloss units of eroded CR with the impact energy in SJET at impact angles of 15°, 30°, 45°, and 90°.
Coatings 14 00915 g012
Figure 13. Gloss units changes in CR samples at impact angles of 15°, 30°, 45°, and 90°.
Coatings 14 00915 g013
Figure 14. Gloss units for CR as a function of cumulative mass loss at impact angles of 15°, 30°, 45°, and 90°.
Coatings 14 00915 g014
Table 1. Gloss values measured at 60° according to the surface gloss [21].
60° Gloss ValuesGloss AreaTo Be Measured with
10 to 70 GUMedium-gloss60°
>70 GUHigh gloss20°
<10 GUMatte Gloss85°
Table 2. Properties of filled CR samples.
PropertiesValues
Tensile strength (MPa)5.0 ± 1.5
Stress at 300% strain (MPa)5.9 ± 0.1
Elongation at break (%)300 ± 23
Hardness (IRHD)60.0 ± 1.7
Hysteresis loss (kJ/m)985.7 ± 0.3
Tear strength (N/mm)20.0 ± 1.2
Specific gravity (-)1.4 ± 0.002
Rebound resilience (%)27.3 ± 1.5
Abrasion loss (mm3)506.9 ± 9.5
Compression set (%)35.0 ± 0.7
Wet abrasion resistance index (%)623.2 ± 5.6
Water absorption (×100%)101.3 ± 1
Average roughness (nm)183 ± 42
Table 3. Parameters used in this study for slurry-jet erosion characterisation.
ParametersDetails
Fluid mediumFresh tap water
Slurry temperature (°C)20 ± 2
Slurry velocity (m/s)30
Sand content (wt%)5
Sand amount/cycle (kg)20
Impact angle (°)Varying among 15, 30, 45, and 90
Particle typeSand
Sand size (µm)392 ± 20
Stand-off distance (mm)30
Mass of sand used (kg)Varying on the steady-state material loss of the CR samples
Table 4. Average roughness of uneroded and eroded CR.
Average
Roughness (nm)
As receivedEroded CR at an Impact Angle (°)
15304590
183 ± 42194 ± 33356 ± 42460 ± 57637 ± 42
Change (%)-695151250
Disclaimer/Publisher’s Note: The statements, opinions and data contained in all publications are solely those of the individual author(s) and contributor(s) and not of MDPI and/or the editor(s). MDPI and/or the editor(s) disclaim responsibility for any injury to people or property resulting from any ideas, methods, instructions or products referred to in the content.

