Abstract
This study on oriented strand board (OSB) wood doors with veneer as the door leaf aimed to investigate consumers’ preference for visual–tactile elements of OSB. First, we utilized the questionnaire and interview methods to extract specific elements as experimental variables for this study. Then, through subjective evaluation experiments and eye-movement experiments, as well as correlation analyses of the experimental results, we explored the relationship between the slice size, gloss, and color of oriented strand boards and consumers’ visual preferences and summarized the eye-movement indexes that can represent consumers’ aesthetic evaluation of the visual elements of oriented strand boards. Unidirectional haptic experiments analyzed the relationships between the slice size, gloss, and roughness of the oriented strand boards and consumers’ haptic preferences. The results showed that, visually, chip size and surface gloss had little effect on people’s subjective aesthetic evaluations of oriented strand-board wood doors. At the same time, the quantitative mean pupil diameter could represent consumers’ aesthetic evaluations of oriented strand boards. Regarding haptics, the size of the wood chips on the surface of the oriented strand-board specimens did not significantly correlate with participants’ haptic preferences. All participants’ tactile preferences for the unpainted specimens were positively correlated with the fineness of sanding. The visual and tactile effects presented on the surface of an object are essential factors that influence the perception of a material. Oriented strand board (OSB) has excellent advantages in providing a healthy and environmentally friendly living environment, so exploring the visual and tactile perception of OSB from the consumer’s point of view plays a vital role in promoting the use of OSB. The visual–tactile experimental results and the conclusions drawn from the analysis in this study can enable OSB to provide more opinions and potential information from consumers for the design of OSB wooden doors under the premise of conforming to the actual production and meeting the quality standards so that the designed and produced OSB wooden doors can satisfy the users’ preferences based on safety and stability.
1. Introduction
1.1. Outline of the Design Model
Particleboard is widely used in wooden doors because of its moderate density, strong nail-holding force, stable size, flexibility, ease of changing the overall panel processing size, ease of carving and milling, and other good mechanical-processing performances. As an upgraded derivative of particleboard, the use of MDI technology can effectively avoid the release of formaldehyde, reduce the pollution of the environment during the production and use of oriented particleboard (OPP), and satisfy consumers’ demand for a healthy and environmentally friendly indoor living environment. The chemical name of MDI is diphenylmethane diisocyanate, and there are many classifications of MDI, among which polymerizable isocyanate (PMDI) is the adhesive used in the production of artificial boards. Among them, polymerizable isocyanate (PMDI) is the adhesive used in producing wood-based panels, directly referred to as MDI glue by insiders. MDI glue does not contain any formaldehyde elements. It has low volatility, and the panels produced with MDI glue are cured at high temperatures to form a stable chemical substance that will not release other organic chemical substances [1].
China’s interior wood-door industry provides a clear definition of a wooden door, which consists of two parts: one part is the door leaf, and the other part is the door frame [2]. According to the material composition, wooden doors can be divided into solid wood, composite, and molded doors [3]. Solid wood doors are made of high-quality natural wood, precisely spliced together through careful processing to form a complete door. Solid wood composite doors are made from solid wood strips, artificial boards, and bee paper, which combine to give the door a more robust overall structure [4]. They are finished with high-quality and decorative veneers. Beautifully molded wooden doors can be created by using two high-density-fiber molded door panels with a beautiful appearance and realistic wood grain [5]. Wooden doors vary in internal structure and production processes, so their surface finishes vary. The surface decoration of wooden doors can be mainly divided into coating, veneer decoration, and instrument processing. The finish decoration will mainly be a variety of paint substances covering the surface of the wooden door to play a change in the surface color or surface gloss and protect the role of the wooden door surface. Veneer decoration refers to the veneer material on the surface of the wooden door to change the color of the wooden door itself and the texture of the decorative method. Instrumentation is mainly divided into manual and machine processing, through the surface of the wooden door milling groove, drilling, carving, inlay, and other ways to change the surface shape of the wooden door, presenting a variety of patterns to enhance the overall beauty of the wooden door. Oriented strand board (OSB), due to the unique nature of its process, is formed by staggered hot pressing of 5-to-9 layers of planes, with thicknesses of 9 mm, 12 mm, 18 mm, etc. Therefore, if OSPB is used as the door’s appearance, it cannot be made by the process of solid wood composite door and molded door. This study focuses on exploring the influence of the surface properties of OSB doors on people’s aesthetic evaluation of them. It needs to exclude the influence of surface veneer, processing, and decorative accessories, so the definition of OSB doors is selected as sliding OSB doors with veneer as the door leaf, and the processing of the door leaf surface is defined as finishing.
1.2. Visual and Tactile Perception of Oriented Strand Board Surfaces
The sensory characteristics of a product are critical for consumers to accept the product and participate in its selection [6]. Brandt and Shook (2005) conducted a comprehensive review of forest product attribute research, and they concluded that product attributes influence consumer preferences for wood products, and these attributes include physical (tactile and visual) attributes and intangible attributes, such as service and environmental impact [7]. We can easily distinguish whether a sidewalk is smooth or rough; a table is made of wood; food is not fresh; or a spoon is made of plastic, rubber, or stainless steel. This ability of human perception of visual, tactile, and even gustatory and olfactory senses to recognize and discriminate materials is called material perception [8]. Board roughness is also perceived by sight and touch, and changes in veneer surface roughness can affect the application and performance of planed veneer [9]. In material perception, texture is an essential factor that affects perception, referring to the visual feeling and tactile effect presented on the surface of an object.
Wood grain, wood color, and other wood-specific appearance characteristics can affect the viewer’s psychological and physiological responses [10]. Although the raw material used to make OSB is not always wood, OSB, as a type of wood panel, still has unique appearance characteristics, such as grain and color, which can also have psychological and physiological effects on the viewer [11]. Many previous studies have focused on visual preferences for the appearance of humans for wood surfaces [12,13,14]. The results indicate that color, grain, and gloss significantly impact the visual aesthetic evaluation of wood surfaces. The visual appearance of wood surfaces may vary considerably depending on the type of wood and the surface treatment. The application of surface treatments to wood products is so widespread that when we discuss the appearance of wood products, we usually refer to the visual characteristics of the surface after it has been painted. Therefore, evaluating the appearance of wood surfaces with different treatments is particularly interesting to the wood-product industry. In the field of visual perception of wood research, some studies have utilized a biased subjective approach. For example, German scholars have studied consumers’ perceptions and preferences of wood surfaces by analyzing participants’ subjective evaluations of participants’ wood surfaces compared to spruce floor samples [12]. Later, with the need for objective information extraction from wood surfaces, eye movement, and EEG methods have been increasingly used [15,16]. Eye tracking can detect users’ perception of real-time reactions to products in order to predict what products they want. Eye-tracking indicators can provide a basis for in-depth research on the internal mechanisms of visual perception and provide technical support for product designers, attracting more consumers to experience and even purchase products [17]. Therefore, it is essential to explore the influence of wood and wood-based materials as living and decorative materials on the visual characteristics and psychological effects of the occupants and to use the objective indexes of the eye-movement experiment and the subjective evaluation scale to reflect the participants’ preference for the wood construction pattern, which is essential for the study of the wood aesthetics and the characteristics of the wood environmental science.
Scholars have defined tactile perception as every sensation related to touch, including skin sensation (pressure, vibration, and temperature), limb movement sensation (limb movement), and proprioceptive sensation (body position) [18]. Wouter M. Bergmann Tiest et al. discussed the physical properties associated with perception by examining the roughness, suppleness, coldness, and friction of materials of psychophysical functions and how the sensation of these material properties is artificially induced to show up in the sense of touch. Finally, they explored the interaction between perceiving different material properties [19]. Tactile properties refer to the type of sensation that occurs when a person touches the surface of a material [20]. Surface texture has a significant impact on tactile friction [21]. Standard indoor wooden door thickness is between 32 mm and 44.5 mm. China’s implementation of the standard of ordinary oriented strand board and the current international standards of technical content are the same; different climatic conditions on the board indexes have different requirements for the door thickness range of oriented strand board regarding the internal bonding strength of the required 0.06 MPa. The tactile properties of oriented strand boards are critical physical parameters, and the tactile properties of oriented strand boards are related to their structural characteristics, especially the surface texture. Therefore, oriented strand boards with different surface treatments have different tactile properties. When oriented strand board is used for wooden doors, humans can feel the difference when touching the surface of oriented strand board wooden doors with different characteristics [22]. The advantage of the mono-tactile technique is that it avoids other sensory interference [23]. Inconsistencies between users’ ex ante expectations and ex post reality of product perceptions may affect their perceived quality and lead to consumer surprise, satisfaction, delight, or disappointment [24]. In market research, the effect of expectations on customer satisfaction has been investigated [25]. Thus, studying the relationship between users’ haptic preferences for oriented strand boards and the visual and tactile properties of oriented strand boards can increase the consistency between prior expectations and perceived quality, while meeting users’ needs and enhancing customer satisfaction with the product.
OSB has excellent physical properties and a unique texture on its surface that is full of natural flavor, so it is also often used to make household products [26]. Although some enterprises began to try to use oriented strand board to manufacture wooden doors, their imitation of the surface technology processing of Europe and the United States did not fully take into account the preferences of the local people in China. You can learn from Europe and the United States and other regions regarding the application technique and combine that knowledge with the local people’s sense of visual and tactile preferences in order to further promote and apply orientated strand-board wooden doors in the region. It is possible to learn from the application experience in Europe and America and combine it with the local people’s visual and tactile preferences to make the oriented strand-board wood door more popular and applicable in the local area. This study is based on the demand of Q enterprise for the promotion of oriented strand board doors to research the visual and tactile characteristics of oriented strand board doors.
1.3. The Present Study
In this study, we aimed to refine the visual and tactile elements in the surface physical quantities of particleboards and analyze their influence on Chinese consumers’ subjective aesthetic evaluations and preferences. Firstly, the visual and tactile elements in the surface physical quantities of oriented particleboards were obtained through interviews, which were used as the experimental variables in this study, and the experimental samples of visual and tactile elements were made. Secondly, the relationship between visual elements and the visual preference of local people was analyzed through eye movement-assessment experiments combined with subjective-assessment experiments. Finally, the relationship between the tactile elements in the surface physical quantities of OSB wooden doors and the tactile preference was analyzed through tactile experiments, and the optimal expression of the visual and tactile aspects of the OSB wooden doors was explored when they were applied in different scenes.
This study is divided into two parts, each addressing a different research question:
a. What is the relationship between different visual elements and consumer preferences?
b. What is the relationship between different tactile elements and consumer preferences?
2. Materials and Methods
The two main factors of preference for oriented strand-board wood doors are surface features and visual perception. We can determine the relationship between each eye-tracking factor and aesthetic evaluation by applying eye-tracking instruments to visual experiments. Currently, in-home product sales, a combination of material sample blocks, and brochures are often used to display home products without physical objects. Therefore, the samples used in this study are material sample blocks of oriented strand board.
2.1. Experiments on Visual Factors
2.1.1. Specimen Preparation
We obtained the visual and tactile factors of oriented particleboard wooden doors through interviews to produce a sample for experimental research. After analyzing the content of the interviews, specific elements were selected as experimental variables in this study. The interviews comprehensively covered the three stages of product development: front-end development, terminal sales, and consumer use. Two respondents at each stage were invited to participate in the study, i.e., six respondents. The interview study began on 1 January 2023, and ended on 26 January 2023. Respondents were verbally informed of the content and purpose of the experiment before being interviewed, and those who agreed to participate indicated that they confirmed their acceptance to be interviewed and were audio-recorded. This study used a two-person focus group to conduct the semi-structured interviews, and the interview time was limited to 90 min. The semi-structured interview method means that there is only a rough essential requirement for the conditions of the interviewee, the questions to be asked, etc., and the interviewer can flexibly make the necessary adjustments according to the actual situation at the time of the interview and, thus, obtain more helpful information. The researcher transcribed the interview recordings into textual information, distilled and summarized the meaningful content of the textual information, stated the essential information points by level, and, finally, reviewed the results with the interviewers to ensure the accuracy of the interviews. The process culminated in a basic framework of visual and tactile factors for OSB wood doors, including 5 primary, 14 secondary, and 20 tertiary catalogs. We extracted the tertiary categories related to the visual–tactile factors of OSB wood doors, which were color matching between the product and the interior environment, color matching between the products themselves, the choice of transparent and colored finishes, the glossiness of the OSB wood doors, and the chip size of the OSB wood doors. Three factors relevant to this study were obtained from our summary: color matching, surface flatness, and surface texture. We extracted chip size, color, and surface gloss for the experimental study of visual factors of oriented strand-board wood doors according to the content needs of visual tendency.
The chip species used in this study was Australian pine, provided by Q Enterprise in Hangzhou; it is used to produce pine chips. The chips were divided into three specification groups by the research team: Group A chip sizes of 0.6 mm × (30~40) mm × (100~150) mm, Group B chip sizes of 0.6 mm × (20~30) × (50~100), and Group C chip sizes of 0.6 mm × (40~60) mm × (150~250 mm). The sizes of flake specifications are categorized by the size of flakes used in standard oriented strand-board specifications in the market. We used a Canon camera with a TAMRON HAO36 lens, at a distance of 40 cm from the desktop, with the focal length set to 35 mm, to photograph each planer in each planer group individually, with the blue cardboard as the background, with a stable light source in the photographing scene, in a closed scene, and without the influence of natural light. Then, we set the canvas size to 220 cm × 110 cm in Photoshop, corresponding to the size of the actual door, and set the random concentration to 1, the minimum scaling factor to 0.5, and the maximum scaling factor to 1 through the random filling function in the application software to simulate the size of the planer sheets in the actual situation. The color randomness was set at 0.05, and the brightness randomness was set at 0.1 to eliminate the effect of differences in the color of each tree. The research team laid three groups of flakes according to the flake-laying method of oriented strand-board surface layers. Finally, it generated an electronic picture of the oriented strand board composed of three groups of flakes. According to the results of the preliminary research on the market and wood-door manufacturers on the color tendency of wood doors, 15 colors for the study of oriented strand-board wood doors were discussed by the expert group and analyzed by clustering. We changed the color of the oriented strand board in Photoshop. We rendered it in three dimensions in a unified rendering scene (Figure 1), keeping the wall and back surfaces to enhance the three-dimensional visual feeling. The expert group selected six colors among the existing 15 color renderings for the high-gloss color rendering of oriented strand-board wood doors to compare the effect of visual surface gloss on subjective aesthetic evaluation (Figure 2). Finally, we used numbers and letters to number the samples, taking A1Y as an example; it stands for the image of an oriented strand board composed of a group of flakes that one means that the selected color is No. 1 (No. 1 is the contrasting color without color change), and Y means that the surface process of the image sample is chosen as matte. H means that the surface process is high gloss. There were 21 groups of oriented strand board (OSB) doors in the final experimental sample, with 3 OSB doors in each group, for a total of 63 OSB doors.
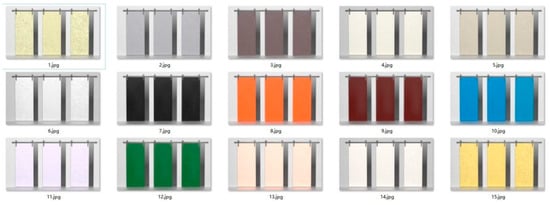
Figure 1.
Fifteen colors of a door made of oriented strand board.
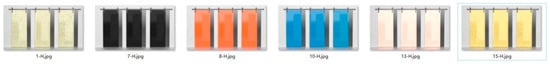
Figure 2.
Six high-gloss colors for oriented particleboard wood doors.
2.1.2. Participant
The development of online e-commerce has led to a year-on-year increase in the proportion of online sales of wooden doors, and the age of consumers tends to be in the Z generation. As a non-conventional panel used in interior decoration, oriented strand board needs to be more widely accepted by the public when it enhances its ornamental properties. Therefore, the age of the participants in this experimental study on the visual and tactile sensation of oriented strand board wooden doors ranged from 22 to 35 years old and had a bachelor’s degree or higher. The subjects consisted of 30 doctoral and postgraduate students from Nanjing Forestry University, of which 15 were male, and 15 were female, with no history of ophthalmological diseases, normal vision or corrected vision, right-handedness, color blindness or color weakness, and no neurological or skin diseases. The experiment began on 5 March 2023, and ended on 30 March 2023. Subjects were required to read a written research informed-consent form before the experiment, and only consenting respondents were allowed to continue participating.
2.1.3. Experimental Environment and Equipment
Subjective evaluation experiment: Aesthetic scoring of 63 OSB wooden doors in questionnaires according to the scoring model of 1~9 points. In this study, the questionnaires were distributed and collected through the Internet. The valid questionnaires were screened according to the basic information filled out by the questionnaire participants. Only the respondents in the age group of 25~35 years old and with a bachelor’s degree or above were entitled to complete the questionnaires. Finally, 230 valid questionnaires were collected, 18 invalid questionnaires were deleted, and the total number of valid questionnaires was 212, among which 91 were for male respondents and 121 were for female respondents. The questionnaire started on 20 April 2023 and ended on 5 May 2023. Respondents were required to read the written research informed-consent form before completing the questionnaire, and only those who agreed were allowed to complete the questionnaire. Data processing of the collected valid questionnaires yielded a Cronbach’s ɑ = 0.93 (>0.8) for the questionnaires. The obtained data had good reliability, and the aesthetic evaluation scores of each sample were averaged.
Objective evaluation experiment: The eye-tracking device (Tobii1750, Sweden) and ErgoLab 3.17.2 software system were used to program the presentation of stimulus pictures to complete the objective evaluation experiment on the influence of visual elements of oriented particleboard wooden doors on the preference of potential consumers. The main evaluation indexes were the number of gaze times, the proportion of gaze time, the average gaze time, the average pupil diameter, the minimum pupil diameter, the maximum pupil diameter, the average distance of eye jumps, the frequency of eye jumps, and the total time of eye jumps.
At the same time, to ensure the comfort of the subjects during the experimental process, the experiments were completed in a laboratory with an ambient temperature of 23 ± 1.2 °C and a relative humidity of 55 ± 4%, with light-blocking curtains and sound-proofing, and with lighting illuminance and luminance conforming to the standard for illumination. The light was diffused (to avoid reflecting the light on the computer screen).
2.1.4. Procedure
Subjects entered the laboratory, familiarized themselves with the environment, and sat down about 60 cm from the monitor. Before the start of the experiment, we inspected the experimental environment to avoid the appearance of unfamiliar visual targets that would attract the subjects’ attention. At the beginning of the experiment, we set up the test-procedure instructions so that they were displayed on the screen and limited the presentation time of both the instructions and the thank-you message to 5000 ms. We set the presentation time of each OSB door to 8000 ms and played 21 sets of OSB door renderings in sequence. At the same time, we inserted a black picture to relax the participants’ eyeballs between every two OSB door renderings so that the participants’ initial gaze on each picture was not always at the center of the image. The presentation time of the black pictures was 3000 ms–3000 ms (Figure 3).
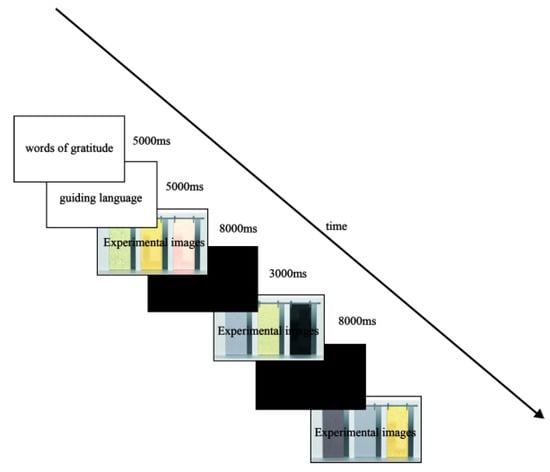
Figure 3.
Eye movement-experiment flowchart.
2.2. Experiments on Tactile Factors
2.2.1. Specimen Preparation
The research team selected 18 pieces of untreated pine OSB as specimens and cut all the specimens into 300 mm × 180 mm × 12 mm sized pieces. All the OSBs of the same size chip type were cut from the same OSB board. The researchers placed all the specimen materials in the same environment for the surface treatment so that the moisture content of each OSB was consistent. The samples were sanded by hand, according to the experimental requirements. We sanded the surface of the specimens along the length of the specimen, timed the blocks with a stopwatch, and sanded them uniformly to ensure that the speeds and pressures were similar, and then cleaned the surface of the specimens with a brush after sanding. For the blocks that required surface treatment, the researchers sprayed the blocks by hand at the same time and with the same intensity in a dust-free environment, at a frequency of every ten minutes, which ensured that the amount of paint applied was consistent from time to time. After spraying, all samples were placed in the same lightproof and ventilated area for 15 days. The specimen numbers and treatments are shown in Table 1.

Table 1.
Specimen nos.
2.2.2. Experimental Environment and Equipment
The experiment was carried out in the Perceptual Engineering Laboratory of Nanjing Forestry University using a 3nh HG268 gloss meter produced by 3nh Technology Co., Ltd., in Shenzhen, China, which can simultaneously measure gloss at 20°, 60°, and 85° angles of incidence of the light source. The surface-roughness meter (Haidian, Beijing, China, Stylus Roughness Meter) we used has a sampling length of 0.25 mm; a measuring range of 0.8 mm; a display range of 0.005~0.016 for Ra and Rq; and filtering modes of RC, PC-RC, GAUSS, and D-P, with a display resolution of 0.001 mm. The ambient temperature of the laboratory is 23 ± 1.2 °C, and the relative humidity is 55 ± 4%; the indoor use of blackout curtains and sound insulation, and the illumination and brightness of the light complied with the lighting standards, and the light was diffused (to avoid the reflection of light on the computer screen).
2.2.3. Procedure
The researchers randomly placed the specimens on a specialized test trial table. Before the experiment, we had participants view pictures of oriented strand-board wood doors to guide them in associating the specimens with oriented strand-board wood doors. The haptic test was conducted with the subjects in a situation where the state of the specimen could not be observed. At the beginning of the experiment, subjects used their usual fingers to touch the surface of the samples in the lengthwise direction, and the touching time of each specimen was controlled to 10 s. After the touching was completed, the subjects were required to place their hands on the test platform to maintain the same state as before touching the specimen and to rate the touch sensation of the specimen in terms of preference. The temperature of the measurement environment was 20 °C, and the relative humidity of the air was 40%. Before the gloss-measurement experiments, the researchers cleaned the surface of the dust specimens. We measured 10 points of each specimen, removed the highest and lowest two values, and calculated the average of the measurement results as the final determination of the specimen’s gloss parameter to ensure the measurement results’ accuracy.
3. Results
3.1. Correlation between Visual Factors and Subjective Evaluations
According to the results and analysis of the interview research in Section 2.1, there are three visual factors related to the physical quantities on the surface of particleboard wooden doors: chip size, door color, and surface gloss. We tabulated the 212 raw Q&A data and imported them into IBM SPSS Statistics 26.0 analysis software for processing, thus obtaining the correlation between the three factors and the subjective evaluation of aesthetics.
The researchers conducted Pearson correlation coefficient analyses of the original color group and the dye group, with the flake size as the univariate variable, and the results are shown in Table 2. It was found that, for the original color group, starting from the smallest chip group, there was a non-significant positive relationship between upgrading the chip size and the aesthetic evaluation score of the original chip; upgrading from medium-sized to large-sized chips had a personal preference for individuals; and individuals’ aesthetic evaluation of the oriented chipboard doors made from large-sized chips might become lower or higher with the shift from medium-sized to large-sized chips, instead of having the same tendency. For the stained group, there was an isotropic aesthetic relationship between the three particleboard door groups with different chip sizes: a higher aesthetic evaluation score for any of the three oriented particleboard doors resulted in higher aesthetic evaluations for the remaining two models.
Table 2.
Pearson’s correlation analysis.
The researchers correlated the aesthetic ratings of the OSB doors according to chip size, which included one unstained OSB door and 14 stained OSB doors. Pearson’s correlation coefficient can be defined as 0.8–1.0 for robust correlation, 0.6–0.8 for strong correlation, 0.4–0.6 for moderate correlation, 0.2–0.4 for weak correlation, and 0–0.2 for no correlation. Next, we conducted a regression analysis on the strongly correlated oriented strand-board wood doors with seven groups, namely A8Y–B8Y, A10Y–B10Y, B10Y–C10Y, A10Y–C10Y, B11Y–C11Y, A12Y–C12Y, and B12Y–C12Y. By looking at the samples from the strongly correlated groups, we found that group No. 8 is a highly saturated orange, group No. 10 is a highly saturated blue, and group No. 12 is a highly saturated dark green. From this analysis, we conclude that some specific colors can strengthen the perception of chip size on the surface of OSB wood doors. In contrast, most OSB wood doors with different sizes of oriented chip sizes within the color groups do not have a solid aesthetic correlation. At the same time, the undyed OSB wood doors also verify this point: most of the cases of the aesthetic scores of OSB wood doors relate little to the chip size of their surface-oriented chipboards. Only some specific stained OSB doors make it necessary to consider the size of the surface shavings.
The advantage of the PCCS color system used in this study is that the combination of brightness and saturation in the three attributes of color becomes the hue. The primary color system is formed by hue and hue together, which can extend a small amount of color to the corresponding hue and infer the overall aesthetic trend of the color of oriented particleboard wood doors in the form of hue. The color of oriented strand boards is not uniform because of the finishing process and the uneven surface. Since the color of OSB is not uniform due to the finishing process and the surface’s unevenness, we used the blur tool in Photoshop to blur the color of the OSB door into a single-color block for the study. We converted the RGB values of the subject colors to the PCCS color system using the Easy RGB color converter. Then, we analyzed the hue, lightness, and saturation values after the conversion. In addition, we analyzed the values in the PCCS color system converted from HSB values. The researchers placed the renderings of the oriented strand-board wood doors from A1Y-A15Y within the PCCS tint map according to the region they were located in within the conversion table (Figure 4). We labeled their aesthetic scores (Figure 5). We knew by comparing the original tone charts that the areas where the subjects’ aesthetic evaluation of the oriented strand board doors is higher tends to be more toward the light grey tones, ltg; light tones, P; white tones, W; light grey, ltGy; and light soft tones, sf. The aesthetic evaluation of the oriented strand board doors with no color panels shows a tendency that the aesthetic evaluation decreases with the decrease in brightness, and in the trend line of the bright tones, the white > bright tones > pure colors, and the aesthetic evaluation decreases with the increase in color degrees. The color degree becomes higher, and the subjects’ aesthetic assessment of the oriented strand-board wood doors becomes lower.
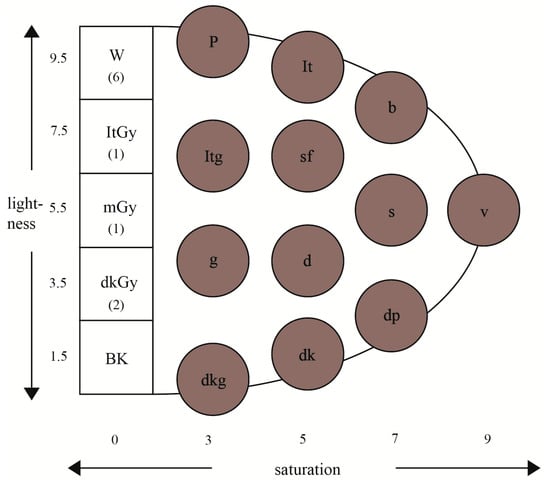
Figure 4.
PCCS color-distribution map.
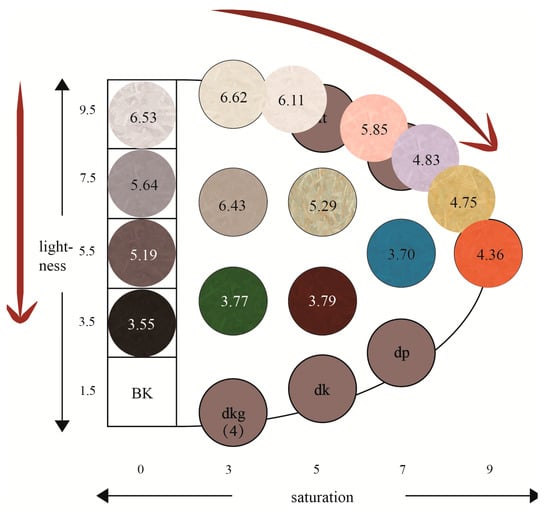
Figure 5.
PCCS experimental color score distribution.
We calculated the correlation between each value of HSL and the aesthetic evaluation of 63 oriented strand-board wood doors, as shown in Table 3. The data show no significant relationship between hue (H) and saturation (S) and the aesthetic evaluation of OSB doors. At the same time, the converted luminance (L) has a positive correlation, indicating that the higher the luminance, the better the review, both for the OSB doors with different sizes of surface slices and differences in surface gloss. To cater to the user’s aesthetic needs, the surface color of oriented strand-board wood doors should be biased toward brighter shades.
Table 3.
Pearson’s correlation analysis.
The researchers compared the surface gloss-evaluation scores of oriented strand-board wood doors. Based on the original questionnaire data, we created a bubble-like evaluation comparison chart of the gloss aesthetics of Group A oriented strand-board wood doors. We found no obvious trend line in five of the six color bubble charts. The table diagonal as the axis can show that most of the bubbles are around the axis, and a small number of bubbles are higher or lower than the axis, which indicates that most of the stained oriented strand-board wood doors changing their surface gloss will not have a significant impact on people’s aesthetic evaluation of them. The fact that only one OSB door in color #13 had a substantial majority of bubbles above the axis suggests that using appropriate high-gloss surfaces in specific colors may enhance the aesthetic evaluation.
3.2. Results and Analysis of Eye-Movement Experiments
3.2.1. Eye-Movement Experiments with Different Planing-Sheet Sizes
Each set of stimuli within this experiment has three regions of interest, each representing eye-movement experimental data for sliding doors of different planer sizes. The primary data consisted of four items: first-gaze duration, mean gaze duration, weight of gaze duration, and weight of number of gazes. We plotted stacked bar graphs of first annotation duration (Figure 6), stacked bar graphs of mean gaze duration (Figure 7), and stacked bar graphs of gaze duration weighting versus gaze count weighting (Figure 8 and Figure 9) after a cumulative analysis of samples that had the same planer-sheet size.
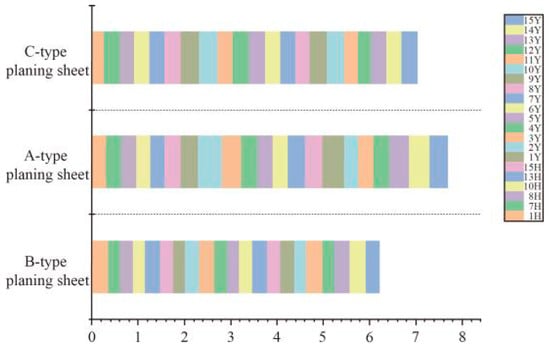
Figure 6.
Stacking of first-gaze durations.
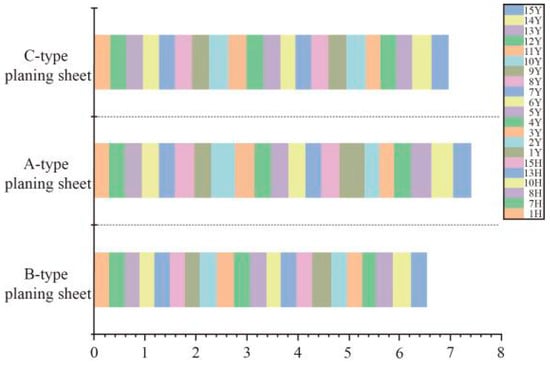
Figure 7.
Stacking of average gaze durations.
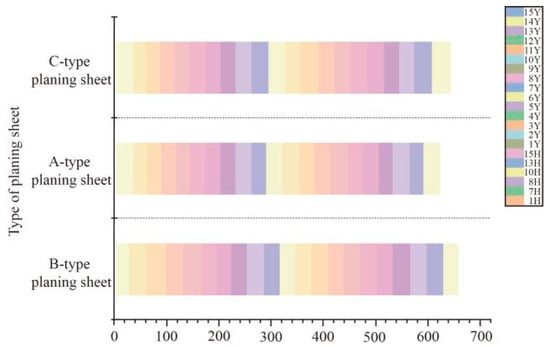
Figure 8.
Stacking of the weighting on gazing time.
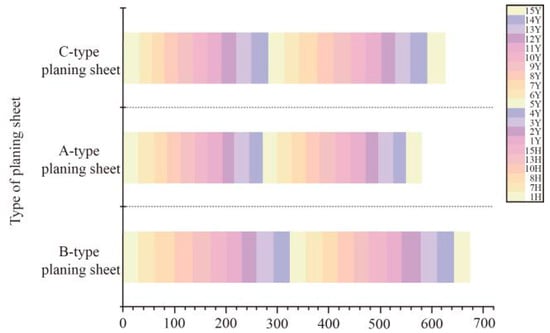
Figure 9.
Stacking of the weighting on attention counts.
The mean first-gaze durations of the 21 samples stacked for Type C planes totaled 7.03 s; for Type A planes, 7.68 s; and for Type B planes, 6.21 s. The subjects’ mean gaze durations for Type C planes totaled 6.96 s, with the highest mean gaze durations for Type A planes at 7.40 s and the lowest mean gaze durations for Type B planes at 6.52 s. In the stacking diagram of gaze duration, the total weight of gaze for the Type C planing sheet is 640%, which is in the middle of the three types of the planing sheet; the lowest proportion is 630% for the Type A planing sheet, and the highest proportion of gaze duration is 658% for the Type B planing sheet. The ranking of the three types is opposite to the first-gaze duration and average gaze duration. The ordering of the number of gaze shares is the same as the ordering of the weight of gaze time. The highest was 673% for Type B planers, followed by 625% for Type C planers, and the lowest weighting of gaze times was 578% for Type A planers.
In addition, we analyzed the hotspot maps using A1Y, B1Y, C1Y, A7H, B7H, and C7H as examples. After summarizing the hotspot maps of all participants based on the actual gaze times, we found that, although there were numerical differences in the gaze times, the differences in the hotspot maps were minimal, and it was not possible to visually observe from the hotspot maps alone which size of planing sheet of OSB doors participants preferred to view.
To understand the effect of different surface planer sizes on the oculomotor indices, we carried out a variance chi-square test and analysis of variance (ANOVA) on the data, and the results are shown in Table 4 and Table 5. From Table 4, we know that the significance of the total gaze time percentage, the gaze number percentage, is more significant than 0.05, and the importance of the first-gaze time, the average gaze time, is less than 0.05, which means that they do not belong to the same sample data. As seen in Table 5, the Sig. values of the four eye movement-index factors are all less than 0.05, indicating that different planing-sheet sizes significantly affect the eye-movement indexes. The above analysis shows a significant difference in the percentage of total gaze time and the percentage of the number of gaze times in the eye-movement indexes for different planer sizes.
Table 4.
ANOVA chi-square test for three types of planing-sheet sizes.
Table 5.
ANOVA test of eye-movement data for three types of planing-sheet sizes.
We carried out a Pearson correlation analysis on subjective evaluation with the proportion of total gaze time and the proportion of gaze times, and the results are shown in Table 6. The Sig. values of the linear correlation between the percentage of total gaze time and the percentage of gaze times and the subjective evaluation were 0.896 and 0.902, respectively, which were much more extensive than 0.05. Therefore, there was no significant linear relationship between the two, which indicated no correlation between the changes in the percentage of total gaze time and the percentage of gaze times caused by changes in the size of the planer sheet and the subjective evaluation.
Table 6.
Pearson’s correlation coefficient table.
3.2.2. Eye-Movement Experiments with Different Colors
We recorded and compiled eye-movement data for 45 matte oriented strand-board wood doors and conducted a chi-square test and analysis of variance (ANOVA) on the results of the eye-movement experiments for males and females for the different colors, respectively. The results for male subjects are shown in Table 7 and Table 8.
Table 7.
Variance alignment tests for 15 colors.
Table 8.
ANOVA test for 15 colors.
From the data of the male participants in Table 7, we found that the significance of the seven oculomotor index factors was more significant than 0.05, except for the mean gaze duration and the mean distance of the eye beats. Then, we conducted an ANOVA on the 15 colors and found that only the mean pupil diameter and the mean distance of the eye beats had a Sig. value of less than 0.05, which showed that only the mean pupil diameter had a significant difference for the different colors in the nine data items. The Pearson correlation analysis of subjects’ preferences based on male mean pupil diameter showed a correlation coefficient of −0.602 and a Sig. of 0.017. This indicates that, at the 0.05 level, the aesthetic evaluations of oriented strand-board wood doors of different colors show a negative correlation with mean pupil diameter and that larger mean pupil diameters result in a lower subjective aesthetic assessment.
In the same way, we carried out the ANOVA chi-square test and the ANOVA test on the eye-movement data of female participants. We found that, in the ANOVA test of the eye-movement data of female participants, only the Sig. value of the mean pupil diameter was less than 0.05. The rest of the values were all greater than 0.05, which indicated that, except for the mean pupil diameter, the rest of the data did not significantly change color. In the ANOVA chi-square test, the mean pupil diameter was 0.615, which was more significant than 0.05, so the female participants were the same as the males, and only the mean pupil diameter was significantly different for the different colors. The Pearson correlation coefficient for females was −0.523, and the correlation was similar to that of males: the smaller the mean pupil diameter, the higher the subjective evaluation of the oriented strand-board wood doors.
The change in mean pupil diameter reflects the participants’ enjoyment of the experimental images, and a more relaxed state results in a larger pupil diameter. From the recorded eye movement-data results, we observed that the maximum average pupil diameter of male participants was Y9, and the minimum average pupil diameter was Y11. The minimum average pupil diameter of female participants was Y15, which indicated that Y15 could not bring a more comfortable viewing experience for female participants. The maximum average pupil diameter was Y7, which stated that the eyes were more relaxed when viewing Y7, but this may also be related to the brightness of Y7 itself, which would cause the pupil to dilate due to the reduction in light input.
3.2.3. Eye-Movement Experiments with Different Gloss Levels
Changes in the surface gloss of oriented strand-board wood doors can cause changes in the results of eye-movement experiments. In this experiment, we set up six control groups for visual glossiness, namely 1H–1Y, 7H–7Y, 8H–8Y, 10H–10Y, 13H–13Y, and 15H–15Y, and each control group contained six different oriented strand-board wooden doors. We analyzed the data in terms of the number of gaze, the proportion of gaze time, the average gaze time, the average pupil diameter, the minimum pupil diameter, the maximum pupil diameter, the average distance of the eye jumps, and the frequency of the eye jumps, and the result obtained by subtracting the eye-movement data of the matte group from the eye-movement data of the high-gloss group in each of the six glossy control groups was used as a change quantity. After visualizing the data, we found that only the most minor pupil diameters were positively varied in the nine categories of variation in the male data. In contrast, only 13H of the mean pupil diameters were smaller, and most of the mean pupil diameters were positively elevated. In the female data, both the most minor and average pupil diameters were positive. Pupil diameter generally symbolizes emotional tension, suggesting that changing the oriented particleboard wood doors from matte to high gloss for the participants could relieve emotional stress or reduce the stimulation of the images, resulting in greater relaxation. To investigate the effect of visual changes in gloss on eye-movement indicators, the researchers conducted two chi-square tests and an analysis of variance (ANOVA) to categorize them by gender. The results are shown in Table 9 and Table 10, with the values outside of the parentheses being the results of calculating the eye-movement data for males and those inside of the parentheses being the results of calculating the eye-movement data for females.
Table 9.
ANOVA chi-square test for glossiness.
Table 10.
ANOVA test for glossiness.
The ANOVA test for males showed that only the Sig. value for minimum pupil diameter was less than 0.05, and the ANOVA chi-square significance for minimum pupil diameter was 0.440, which was more significant than 0.05, suggesting that changes in glossiness can significantly affect changes in minimum pupil diameter. The ANOVA chi-square test for the nine oculomotor factors for the female participants had significant results greater than 0.05, indicating that the data were within the same sample group. Our ANOVA test for the eye movement-index factors for females showed a significant relationship between three factors and changes in glossiness: mean pupil diameter, minimum pupil diameter, and mean eye-hopping distance.
The correlation between the minimum pupil diameter and the subjective evaluation of the male participants is shown in Table 11. We found that the Sig. value of 0.634 is much larger than 0.05, so we know that the change in the minimum pupil diameter caused by the change in gloss level does not have any significant correlation with the male participants’ subjective evaluation of the wood doors with different gloss levels of oriented strand boards. In addition, we also analyzed the correlation between the mean pupil diameter, the minimum pupil diameter, the mean eye-hopping distance, and the subjective evaluation of the female participants, and the resulting Sig. values were all greater than 0.05 and the specific results are shown in Table 12. Therefore, we learned that there was no significant correlation between the changes in the mean pupil diameter, the minimum pupil diameter, and the mean eye-hopping distance caused by the changes in gloss and the changes in the subjective evaluation of the wood doors.
Table 11.
Pearson’s correlation coefficient for males.
Table 12.
Pearson’s correlation coefficient for females.
3.3. Results and Analysis of Tactile Experiments
Based on the analysis in Section 2.1 and the discussions within the research group, the elements of the physical quantities of the surface of the oriented strand-board wood doors that we extracted that are relevant to the sense of touch are chip size, surface gloss, and roughness. Surface gloss was varied by the finishing process in the form of 10 coats of wood wax oil, 10 coats of varnish, and 15 coats of varnish, and roughness was varied by sanding with 360#, 800#, 1200#, and 2000# sandpaper, respectively. In practice, the tactile elements work together to influence consumers, so we measured three surface physical quantities on 18 specimens and analyzed the effects of using different finish levels on the tactile elements and the impact of changes in one of the elements on the other two.
We used a gloss-measuring instrument and a surface-roughness instrument to measure the bare-surface physical information of the 18 specimens. We plotted the gloss line graphs against the number of grits (Figure 10 and Figure 11).
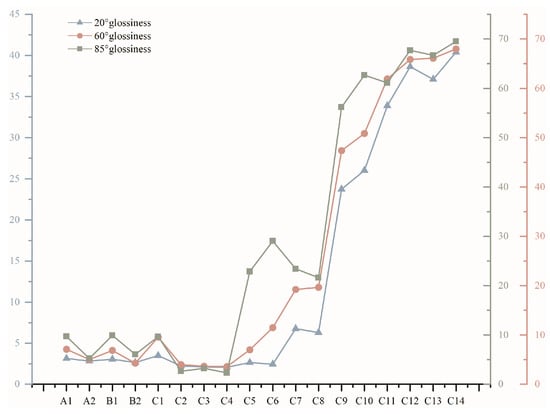
Figure 10.
Glossiness line graph.
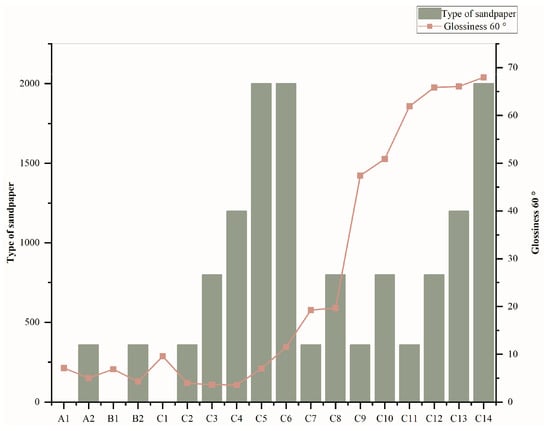
Figure 11.
Comparison graph of the size of abrasive grains.
Based on the gloss line graph, we analyzed the gloss variation, with chip size as a single variable, and finally concluded that there is no correlation between the surface gloss of OSB and its chip size. Then, we analyzed the gloss variation with different degrees of sanding as a single variable and found that sanding with lower-grit sandpaper, i.e., rough sanding of OSB, does not affect the surface gloss. The sanding process, up to a certain degree of fineness, can positively impact the gloss variation. In addition, we also analyzed the change in surface gloss with the variables of spraying varnish and the number of times of spraying. We learned that spraying varnish on the surface of oriented strand board can improve its surface gloss, and the greater the number of sprayings, the higher the gloss. The higher-grit-sandpaper process on the thicker lacquered surfaces was less able to affect the surface gloss. In contrast, low-grit sandpaper 360# made the gloss significantly lower than the high-grit sanded specimens due to the destruction of the lacquered surfaces. Roughness is an important perceptual factor representing the surface of an object; changes in surface roughness, Ra, are most pronounced when the surface is rubbed with low-grit sandpaper, and the degree of change in roughness decreases as the grit of sandpaper is gradually increased. Wood wax oil can slightly reduce the surface roughness value, Ra, but the varnish-spraying process can significantly reduce the surface roughness.
3.3.1. Correlation between Different Planing-Sheet Sizes and Subjective Ratings
To investigate the effect of different chip sizes on the subjective evaluation of tactile perception, we set up two control groups in this experiment, namely, the A1, B1, and C1 unfinished group and the A2, B2, and C2 roughly finished group treated with 360# sandpaper. Group B had the smallest chip size, followed by Group A, and Group C had the largest chip size. We counted and visualized the mean values of the preference scores of male and female subjects for the three sizes of flakes in the two control groups. The results showed that, although the overall mean preference of subjects for oriented strand boards increased with the size of the flakes, there was not the same trend of preference bias for men and women. The trend of the mean preference for men and women was not apparent, so it was impossible to determine the relationship between changes in the size of oriented strand boards and tactile preference. The researcher entered the data into SPSS 26.0 processing software to analyze the personal correlation between male and female participants separately, and the results are shown in Table 13.
Table 13.
Table of Pearson’s correlation coefficients for different planer sizes.
In Group A1, the control group, the Pearson’s coefficient of correlation was 0 for both men and women, indicating no linear relationship between the participants’ preference for OSB without surface treatment and the change in chip size. The Pearson’s coefficient of 0.071 for the male participants and 0.152 for the female participants in the data analysis of Group A2 falls into the category of no significant correlation. Therefore, we conclude from the data that the change in chip size of OSB is not related to the participant’s preference for the surface feel.
3.3.2. Correlation of Different Surface Gloss Levels with Subjective Evaluation
The difference between 20°, 60°, and 85° gloss levels is the difference in the angle of incidence of the light from the instrument, and 60° is a standard angle used in gloss measurements, so we used the 60° angle of incidence of the light to analyze the relationship between gloss changes and participants’ tactile preferences for the specimens and plotted a control chart (Figure 12). It can be seen from the graphs that male and female participants showed the same trend in preference for the frosted-only specimens, i.e., specimens before C6, while preference for the lacquered specimens diverged in mean scores, so we analyzed the specimens after C6 separately. Glossiness increased significantly from C6 onward, while participants’ mean preferences for the specimens did not increase significantly, so this analysis was conducted to categorize the specimens with and without varnish, with A1, A2, B1, B2, C1, C2, C3, C4, and C5 as Group 1; and C7, C8, C9, C10, C11, C12, C13, and C14 as Group 2. We conducted a Pearson correlation analysis using the amount of change in gloss and the amount of change in preference for each participant as variables, and the results are shown in Table 14.
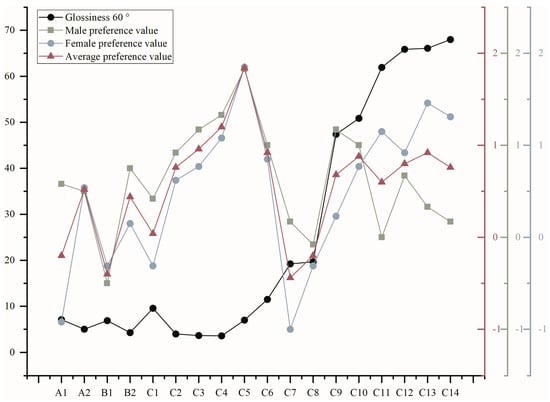
Figure 12.
Plot of 60° gloss against preference.
Table 14.
Table of Pearson’s correlation coefficients for different surface-gloss levels.
The correlation coefficient between glossiness and male preference within Group 1 was −0.164, indicating that there was no significant linear relationship between the two, and the correlation coefficient between glossiness and male preference within Group 2 was 0.071, indicating that there was no significant linear relationship between the two. The situation was different for the female participants, as the correlation coefficient between female preference and gloss in Group 1 was −0.225, indicating a weak linear relationship. Group 2 had a correlation coefficient of 0.518, indicating that as the gloss level increased in Group 2, and so did the preference of the female participants. C6 was analyzed separately as a special group that used polishing wax after sanding, while the rest of the specimens had sanding set as the final process step. C6 shows an increase in gloss compared to C5. At the same time, the participants’ preference for it decreased significantly, indicating that the tactile feel of the polishing wax did not increase the preference for it.
3.3.3. Correlation between Different Levels of Polishing and Subjective Evaluations
The sanding process affects the surface flatness, and all specimens except C6 were sanded as the final treatment. Therefore, after removing C6, we divided the 17 specimens into two groups: A1, A2, B1, B2, C1, C2, C3, C4, and C5 for the No. 1 group without lacquer film; and C7, C8, C9, C10, C11, C12, C13, and C14 for the No. 2 group with lacquer film. We made a control chart of the final grit of sanding and the average tactile preference of each specimen (Figure 13). We found that the tactile preference of the sanded A2, B2, and C2 was significantly improved compared to that of the unsanded A1, B1, and C1 and that, in the specimen group C, which was only sanded, the finer grit sandpaper provided a better tactile experience. The researchers explored the correlation between sandpaper type and tactile preference for both male and female subgroups and produced a table of Pearson’s correlation coefficients (Table 15). The Pearson’s correlation coefficients between the final grit size of the specimens in the No. 1 unlacquered group and the participants’ tactile preference were 0.403 for males and 0.487 for females, suggesting that using a finer grit of sandpaper could increase the participants’ tactile preference for the specimens in the No. 2 lacquered group. The situation was different in Group 2 with varnish, as there was no significant relationship between the men’s preference and the grit of the sandpaper, while the correlation coefficient for the women was 0.295, suggesting a weak positive correlation and demonstrating that women’s tactile perception of variations in varnish is more acute than men’s in the presence of varnish.
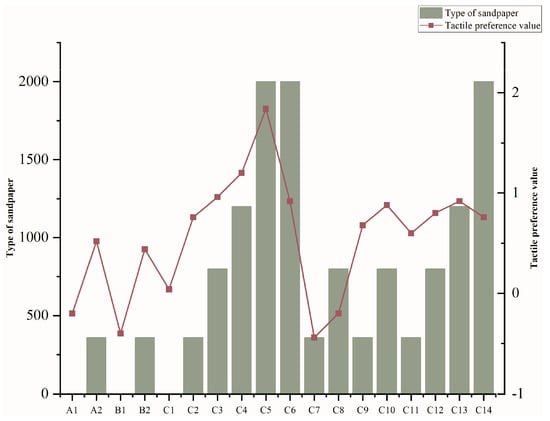
Figure 13.
Plot of sandpaper type against tactile preference.
Table 15.
Table of Pearson’s correlation coefficients for different levels of polishing.
4. Discussion
4.1. Visual Elements and Subjective Preferences
We performed a Pearson correlation coefficient analysis on the data obtained from the questionnaire in Section 3.1 to analyze the relationship between the visual elements of particleboard and consumer preferences based on subjective data. In Section 3.2, we visualized the eye-movement objective data obtained when the three visual factors of particleboard size, color, and surface gloss were used as one-way variables, respectively. We performed the variance chi-square test and ANOVA test to the Pearson correlation coefficient analysis on the data. In this section, we discuss and analyze the relationship between the visual elements of particleboard and consumer preference by combining the results of subjective and objective visual experimental-data processing.
Participants’ visual attention to the oriented strand-board wood doors did not vary with the size of the planer sheets in the same tendency. After accumulating samples with the same chip size, we found that the duration of the first annotation and the average duration of the subjects’ attention to the A-size chips were the longest. Thus, we concluded that oriented strand board doors made with A-size slices were the most appealing to the first eye and that B-size slices had the most significant advantage in terms of the time spent looking and the proportion of times looked at. Thus, we analyzed that the smallest size of B-size slices allowed the participants to look at the door for a more extended period; in other words, smaller slices were more likely to be more visually comfortable for the consumer. In the subjective vision experiment, we individually analyzed oriented strand-board wood doors with different planing-sheet sizes for each color. We found that some specific colors intensified the perception of strand sizes on the surface of oriented strand-board wood doors. In contrast, no solid aesthetic correlation existed between oriented strand-board wood doors with different planing-sheet sizes within most color groups. There was no correlation between the percentage of total gaze time and the percentage of gaze times that produced significant changes due to changes in chip size and participants’ subjective evaluations of the specimens, i.e., changing the surface chip size of the oriented strand board doors was not visually significant in influencing people’s subjective aesthetic assessment of them.
After applying oriented strand board (OSB) wood doors to the tone panel within the PCCS system, we found that people’s aesthetic evaluation of OSB wood doors decreases with decreasing brightness, and subjective aesthetic evaluation scores decrease as the tone trend of White Tone > Bright Tone > Pure Tone gets closer and closer to Pure Tone. Using the unstained OSB door A1Y as a benchmark to compare the scores of the stained OSB doors, we found that inappropriate colors, such as high chromaticity and low lightness, would significantly reduce the aesthetic evaluation of the doors. In contrast, lighter colors could improve the aesthetic assessment of the OSB doors. The above analysis results show that, in the practical application of interior decoration, people still want to orient particleboard wood doors to be simple rather than thick and colorful images. Changes in the surface color of OSB doors can significantly impact the participants’ average pupil diameter. There is a negative correlation between the average pupil diameter and the participants’ subjective evaluation. To a certain extent, the average pupil diameter reacts to the participants’ preference for OSB doors, and smaller pupil diameters can improve the participants’ evaluation of them. Therefore, in the visual design of oriented strand board doors, the quantitative average pupil diameter can represent consumers’ aesthetic evaluation of oriented strand boards. The results of the eye-movement experiment showed a significant correlation between changes in gloss and changes in the participants’ minimum pupil diameter, with a high-gloss surface elevating the participants’ minimum pupil diameter. Still, there was no correlation between the minimum pupil diameter and the subjective ratings. By changing the surface gloss of the oriented strand-board wood doors, the visual perception of the oriented strand-board wood doors in most of the colors did not enhance or reduce their aesthetic evaluation scores. In a few colors, the gloss level can affect the brightness of the particleboard color and, thus, weakly enhance its aesthetic evaluation score. Therefore, when designing the visual surface gloss of oriented strand boards, consideration should be given to the suitability of the selected surface color and chip size to the gloss level.
4.2. Tactile Elements and Subjective Preferences
In Section 3.3, we used a single-touch modal experiment to explore changes in consumers’ subjective evaluations of the tactile sensation of oriented particleboard and similarly visualized and analyzed the experimental data with the Pearson correlation analysis to investigate the relationship between the tactile factors of particleboard and consumer preferences.
The results of the Pearson correlation analysis showed that changes in chip size on the surface of the oriented strand board specimens affected participants’ tactile perception of them but were not significantly correlated with participants’ tactile preferences for them. In both control groups, the trend in the mean preference of the roughing group relative to the unfinished group was even less pronounced, so we analyzed how the use of rough sanding to treat the specimens weakened the differences in tactile sensation of the surfaces with different chip sizes.
The data showed no significant correlation between the male participants’ tactile preference for the specimens and the gloss level. In contrast, the females’ tactile preference for the surface of the specimens was correlated with the gloss level. This result can indicate, to a certain extent, that the female participants’ tactile perception of the gloss level of the surface of the oriented strand boards was more substantial than that of the male participants. Female participants showed a weak negative correlation between tactile perception and preference for specimens treated with sanding only and a positive correlation between tactile perception and glossiness for specimens with lacquer, meaning that, in the absence of surface lacquering of oriented strand-board wood doors, workers should reduce the glossiness of their surfaces to enhance tactile preference, and oriented strand-board wood doors with lacquered surfaces should be appropriately enhanced in terms of surface gloss level. After sandpaper sanding, followed by the polishing wax-rubbing coating process, the subjects’ tactile preference decreased. The tactile preference of the specimens in the category with varnish film was smaller than that of the group without varnish film under the same variable, indicating that the spraying process on the surface of oriented strand boards could not significantly enhance people’s tactile evaluation of them. The unsuitable surface treatment process would instead reduce people’s tactile preference for the oriented strand boards. Only the female participants’ tactile preference showed a weak positive correlation with the degree of sanding in the specimens with varnish. All participants’ tactile preference for the specimens without varnish showed a positive correlation with the degree of sanding fineness. This indicates that the participants preferred touching finer surfaces and that finer surfaces should be considered in the haptic design of the oriented strand-board wood doors.
4.3. Differences in Subjective Preferences for Optic–Tactile Elements
Although touch and sight are the main factors influencing consumer preference for wood products, appropriate treatment of oriented strand boards based on the impact of these two elements on the target population in different settings can lead to broader application and promotion. OSB doors for residential use have always existed in the user’s life scene. Users can not only see it from time to time, and because it is closely related to life, it will often touch it, so this kind of oriented strand board material needs to be used in the family scene through the independent choice of consumers should try to conform to the consumer’s visual and tactile preference. When oriented strand board is used in residential wood doors and wall coverings with a somewhat similar sensory effect to wood doors, consumers prefer the brighter white tones in their colors. Consumers do not have a visual or tactile preference for planing-sheet size. However, considering that wood door-type panels occupy a significant visual weight in the home when customizing this type of panel, you should consider, whenever possible, B-type particleboards that are visually comfortable for the user, that is, oriented strand boards with smaller chip sizes. Suppose that consumers want to increase the interior’s visual center of gravity so that the overall effect feels more balanced and has a sense of design. In that case, you can adequately choose a wooden door made of A-type oriented strand board because the chip size is moderate and can visually appeal to the first line of sight. Only a correlation between women’s tactile preference and the gloss of particleboard existed. Domestic wooden doors and wall decorative panels are coated with a lacquer film for protection or decoration. There is a positive correlation between women’s tactile perception of the lacquered specimens and gloss and fineness. Women touch the surface of these products when cleaning, so oriented particleboard doors or wall decorations with lacquered films should have a finer and more delicate surface finish. OSB wood doors or wall coverings that appear in public places do not come into direct contact with people and thus should focus on the impact of their visual elements on the public. Oriented strand boards in public places should be as visually pleasing and comfortable as possible. Although the experimental results show that there is no correlation between the chip size and gloss level of the oriented strand boards and the participants’ preferences, high-gloss particleboards with moderate chip sizes can be more visually relaxing and comfortable to the participants than matte or high-gloss particleboards with larger and smaller chip sizes. Therefore, the oriented strand boards used in public places should consider high-gloss particleboards with a moderate chip size.
5. Conclusions
This study investigated the relationship between visual and tactile factors and subjective consumer evaluation of oriented strand board wooden doors. Through market research, we analyzed related products and made electronic specimens. We extracted the visual and tactile factors of oriented strand-board wood doors using questionnaires and interviews, explored the relationship between the size, gloss, and color of strand boards and consumers’ visual preferences through subjective evaluation and eye-movement experiments, and then we derived the eye-movement indexes representing consumers’ aesthetic evaluation. We analyzed the relationships between planer size, gloss, degree of grinding, and customer tactile preferences through one-factor haptic experiments. The extracted opto-tactile elements are universal and provide a theoretical basis and data support for designing oriented strand-board wood doors.
In the color design stage, we summarized 15 colors applied to oriented strand-board wood doors and incorporated them into the PCCS color system, but the number of data is limited, and the hue preference theory needs more support. Due to the different arrangement of slices in each oriented strand board, the rendering may have deviations. This study explored only the effects of the visual and tactile elements of oriented strand-board wood doors on consumer evaluations. It did not explore the relationship between visual and tactile characteristics. Future research could explore the relationship between visuo-tactile perceptions from the perspective of expectation effects to meet user needs better. The oriented strand board application system can be improved for use in various decorative spaces through the joint efforts of scholars, designers, and the market.
Author Contributions
Methodology, Y.M. and T.M.; Software, T.M.; Formal analysis, Y.M. and X.G.; Investigation, X.G. and T.M.; Data curation, T.M.; Writing—original draft, Y.M. and X.G.; Writing—review & editing, Y.M.; Supervision, Y.M. and W.X. All authors have read and agreed to the published version of the manuscript.
Funding
National Art Fund Traditional Woodcarving and Modern Creative Talent Training Project: 2019-A-04-(149)-0691.
Informed Consent Statement
Informed consent was obtained from all subjects involved in the study.
Data Availability Statement
Data are contained within the article.
Conflicts of Interest
The authors declare no conflict of interest.
References
- Wang, W.H.; Zang, X.Q.; Lu, R.S. Low Formaldehyde Emission Particleboard Bonded by Uf-Mdi Mixture Adhesive. For. Prod. J. 2004, 54, 36–39. [Google Scholar]
- Bin, L.U.; Yue-Jin, F.U.; Zhang, Y.-P. Status and Development Trends of Wooden Door Industry in China. China Wood Ind. 2008, 5, 17–20. [Google Scholar]
- Wang, J.; Deng, N.; Li, J.; Sun, J. Life Cycle Analysis of a Novel Treatment Method for Recycling Wood Processing Residues into the Core Material of Wooden Doors. J. Clean. Prod. 2023, 415, 137798.1–137798.12. [Google Scholar] [CrossRef]
- Chen, Y.; Sun, B.-L. China Wood Industry. Analyses on Quality Evaluation Indexes for Solid Wood Composite Door. China Wood Ind. 2013, 27, 38–41. [Google Scholar]
- Zhou, X.; Shen, T.; Sun, Y.; Dun, M.; Shan, W.; Wang, W. Improve the Bonding between Wood Veneer and Wood Fiber/High-Density Polyethylene Composite Board for Decoration. Polym. Compos. 2022, 43, 2163–2174. [Google Scholar] [CrossRef]
- Buehlmann, U.; Bumgardner, M.; Schuler, A.; Barford, M. Assessing the Impacts of Global Competition on the Appalachian Hardwood Industry. For. Prod. J. 2007, 57. [Google Scholar]
- Brandt, J.P.; Shook, S. Attribute Elicitation: Implications in the Research Context. Wood Fiber Sci. 2005, 37, 127–146. [Google Scholar]
- Sharan, L. The Perception of Material Qualities in Real-World Images. Ph.D. Thesis, Massachusetts Institute of Technology, Cambridge, MA, USA, 2010. [Google Scholar]
- Kamperidou, V.; Barboutis, I.; Aidinidis, E. Surface Roughness of Sliced Veneers in Terms of Defects and Wood Structure Variability—Impact of Mild Hydrothermal Treatment. Drv. Ind. 2022, 73, 177–191. [Google Scholar] [CrossRef]
- Hwang, S.-W.; Lee, T.; Kim, H.; Chung, H.; Choi, J.G.; Yeo, H. Classification of wood knots using artificial neural networks with texture and local feature-based image descriptors. Holzforschung 2021, 76, 1–13. [Google Scholar] [CrossRef]
- Strobel, K.; Nyrud, A.Q.; Bysheim, K. Interior Wood Use: Linking User Perceptions to Physical Properties. Scand. J. For. Res. 2017, 32, 798–806. [Google Scholar] [CrossRef]
- Manuel, A.; Leonhart, R.; Broman, O.; Becker, G. Consumers’ Perceptions and Preference Profiles for Wood Surfaces Tested with Pairwise Comparison in Germany. Ann. For. Sci. 2015, 72, 741–751. [Google Scholar] [CrossRef]
- Nakamura, M.; Masuda, M.; Shinohara, K. Multiresolutional Image Analysis of Wood and Other Materials. J. Wood Sci. 1999, 45, 10–18. [Google Scholar] [CrossRef]
- Ramananantoandro, T.; Ramanakoto, M.F.; Rajemison, A.H.; Eyma, F. Rajemison, and Florent Eyma. Relationship between Density and Aesthetic Attributes of Wood and Preference of Malagasy Consumers. Ann. For. Sci. 2013, 70, 649–658. [Google Scholar] [CrossRef][Green Version]
- Ohira, H.; Hirao, N. Analysis of skin conductance response during evaluation of preferences for cosmetic products. Front. Psychol. 2015, 6, 103. [Google Scholar] [CrossRef] [PubMed]
- Khushaba, R.N.; Wise, C.; Kodagoda, S.; Louviere, J.; Kahn, B.E.; Townsend, C. Consumer Neuroscience: Assessing the Brain Response to Marketing Stimuli Using Electroencephalogram (Eeg) and Eye Tracking. Expert Syst. Appl. 2013, 40, 3803–3812. [Google Scholar] [CrossRef]
- Guo, F.; Ding, Y.; Liu, W.; Liu, C.; Zhang, X. Can Eye-Tracking Data Be Measured to Assess Product Design? Visual Attention Mechanism Should Be Considered. Int. J. Ind. Ergon. 2016, 53, 229–235. [Google Scholar] [CrossRef]
- Sperling, G.; Dosher, B. Handbook of Perception and Performance; International Society for Optics and Photonics: Bellingham, WA, USA, 1986; Volume 1, pp. 1–65. [Google Scholar]
- Tiest, W.M.B. Tactual Perception of Material Properties. Vis. Res. 2010, 50, 2775–2782. [Google Scholar] [CrossRef]
- Kryklywy, J.H.; Vyas, P.; Maclean, K.E.; Todd, R.M. Characterizing Affiliative Touch in Humans and Its Role in Advancing Haptic Design. Ann. N. Y. Acad. Sci. 2023, 1528, 29–41. [Google Scholar] [CrossRef] [PubMed]
- Zhang, L.; Urribarrí, A.C.R.; Wang, H.; Zhang, S.; Zhang, Y.; Zeng, X.; van der Heide, E. Textured Polymer Surfaces Mimicking the Tactile Friction between Wood and Skin. JOM 2021, 73, 515–523. [Google Scholar] [CrossRef]
- DeLucia, P.R.; Greenlee, E.T. Effects of Task Demands on Tactile Vigilance. Exp. Brain Res. 2023, 241, 441–449. [Google Scholar] [CrossRef]
- Chu, S.; Tu, H. Understanding the Effects of Tactile Grating Patterns on Perceived Roughness over Ultrasonic Friction Modulation Surfaces. Hum. Factors 2022, 65, 1718–1739. [Google Scholar] [CrossRef] [PubMed]
- Ludden, G.D.S.; Schifferstein, H.N.J.; Hekkert, P. Visual-Tactual Incongruities in Products as Sources of Surprise. Empir. Stud. Arts 2009, 27, 61–87. [Google Scholar] [CrossRef]
- Wang, X.; Zhou, R. Impacts of User Expectation and Disconfirmation on Satisfaction and Behavior Intention: The Moderating Effect of Expectation Levels. Int. J. Hum. Comput. Interact. 2023, 39, 3127–3140. [Google Scholar] [CrossRef]
- Kensuke, K.; Ueda, K.; Yugo, Y. A Study on the Possibility of Achieving Life Cycle Carbon Minus in Apartment Houses. J. Environ. Eng. 2022, 87, 169–179. [Google Scholar]
Disclaimer/Publisher’s Note: The statements, opinions and data contained in all publications are solely those of the individual author(s) and contributor(s) and not of MDPI and/or the editor(s). MDPI and/or the editor(s) disclaim responsibility for any injury to people or property resulting from any ideas, methods, instructions or products referred to in the content. |
© 2024 by the authors. Licensee MDPI, Basel, Switzerland. This article is an open access article distributed under the terms and conditions of the Creative Commons Attribution (CC BY) license (https://creativecommons.org/licenses/by/4.0/).