Article

Effects of ALD Deposition Cycles of Al2O3 on the Morphology and Performance of FTO-Based Dye-Sensitized Solar Cells

by
Elizabeth Adzo Addae
1,*,
Wojciech Sitek
1,
Marek Szindler
1,
Mateusz Fijalkowski
2 and
Krzysztof Matus
3
1
Scientific and Didactic Laboratory of Nanotechnology and Material Technologies, Faculty of Mechanical Engineering, Silesian University of Technology, Towarowa 7 Str., 44-100 Gliwice, Poland
2
Institute for Nanomaterials, Advanced Technologies and Innovation, Technical University of Liberec, Studentská 1402/2, 461 17 Liberec, Czech Republic
3
Materials Research Laboratory, Silesian University of Technology, Konarskiego 18a Str., 44-100 Gliwice, Poland
*
Author to whom correspondence should be addressed.
Coatings 2024, 14(8), 1019; https://doi.org/10.3390/coatings14081019 (registering DOI)
Submission received: 20 July 2024 / Revised: 6 August 2024 / Accepted: 8 August 2024 / Published: 11 August 2024
(This article belongs to the Special Issue Advances in Nanomaterials and Coatings for Solar Cells)

Abstract

:
In dye-sensitized solar cells (DSSCs), materials classified as Transparent Conducting Oxides (TCOs) have the capacity to conduct electricity and transmit light at the same time. Their exceptional blend of optical transparency and electrical conductivity makes them popular choices for transparent electrodes in DSSCs. Fluorine Tin Oxide (FTO) was utilized in this experiment. The optical and electrical characteristics of TCOs may be negatively impacted by their frequent exposure to hostile environments and potential for deterioration. TCOs are coated with passivating layers to increase their performance, stability, and defense against environmental elements including oxygen, moisture, and chemical pollutants. Because of its superior dielectric qualities, strong chemical stability, and suitability with TCO materials, aluminum oxide (Al2O3) was utilized as a passivating layer for the FTO. In this research work, Al2O3 was deposited via atomic layer deposition (ALD) to form thin mesoporous layers as a passivator in the photoanode (working electrode). The work focuses on finding an appropriate thickness of Al2O3 for optimum performance of the dye-sensitized solar cells. The solar simulation and sheet resistance analysis clearly showed 200 cycles of Al2O3 to exhibit an efficiency of 4.31%, which was the most efficient performance. The surface morphology and topography of all samples were discussed and analyzed.

1. Introduction

The push for renewable energies has gained traction over the last decade as the world’s energy consumption has grown. Different types of renewable energy, such as solar energy, biomass, hydropower, geothermal energy, marine energy, and wind, are regarded as viable alternatives to traditional sources. Amongst these sources of renewable power, solar energy is a significant technology derived from sunlight that includes the use of sun energy in various ways. Sunlight is an affordable, non-polluting, plentiful, and irreplaceable natural source of renewable energy [1]. Photovoltaic electronics operate on the principle of the separation of charges at the interface of two different materials with distinct conduction mechanisms [2]. As of now, this sector has been monopolized by solid-state junction devices, which are typically constructed of silicon and benefit from semiconductor industry knowledge and material availability [3]. A 1991 paper in Nature brought attention to the non-conventional solar electric technology known as the dye-sensitized solar cell (DSSC), which is now being used by the photovoltaic community [4]. Although the dye-sensitized solar cell (DSSC) functions substantially differently from traditional solar cells, scientists have already shown that it can achieve efficiencies of over 10%. Instead of solid-state physics, which is the field that underpins today’s traditional solar cells, photochemistry is its basis. An evaluation of the dye-sensitized solar cell’s effectiveness with traditional solar electric technologies is necessary due to the advancement of the cell and the ensuing interest expressed by solar cell researchers and developers worldwide [5].
Although there is still work to be conducted before dye-sensitized solar cells (DSSCs) can be considered a viable option for large-scale deployments, in “low-density” applications like rooftop solar collectors, DSSCs are an appealing alternative to current technologies due to their efficiency and low cost of materials required to fabricate them. Though the cost of using additional DSSCs would be justified by the efficiency of the cell, even a little gain in conversion efficiency for these new-generation solar cells might qualify them for large-scale applications [6]. Another benefit of DSSCs over regular solar cells is that the direct injection of a photon into the nanocrystalline metal oxide layer eliminates the chance of an electron recombining with a hole. This solves the problem of no current being created when recombination happens [7]. In typical cells, when an electron is excited across the bandgap, a hole is formed; however, when an electron is injected into a DSSC, no hole forms [8]. Instead, just one more electron is added. While it is theoretically and energetically conceivable for an electron to recombine with a hole in the dye, the rate at which this occurs is minimal when compared to the rate at which electrons are provided by the electrode [9]. Because of their mechanical resilience, DSSCs also have the benefit of having better efficiency at higher temperatures than conventional solar cells do [10]. Instead of using a more insulating glass box like silicon solar cells, DSSCs are typically built with a thin layer of conductive glass on the front layer, which allows them to radiate heat away much more efficiently and operate at lower internal temperatures [11,12].
Transparent Conducting Oxides (TCOs) are materials that conduct electricity and transmit light in DSSCs; in this experiment, Fluorine Tin Oxide (FTO) was utilized. Because of their exceptional optical transparency and electrical conductivity, they are frequently utilized as transparent electrodes in DSSC devices. TCOs can suffer deterioration due to exposure to severe conditions, which can negatively impact their optical and electrical characteristics. To shield TCOs from environmental elements like moisture and oxygen, as well as to increase their performance and stability, passivating layers are added to their surface [13]. Due to its superior dielectric qualities, strong chemical stability, and compatibility with TCO materials, aluminum oxide is frequently utilized as a passivating layer for TCOs. Al2O3 is a protective barrier that was applied to the surface of the FTO film. Its role is to shield the FTO layer from undesirable reactions and degradation processes, such as those caused by moisture, oxygen, and chemical pollutants. Despite testing a variety of semiconducting oxides in DSSCs, the titanium dioxide (TiO₂) nanoparticle-based electron transport layer turned out to be the most effective photoelectrode in the system due to its many advantages. Modified versions of conventional (TiO₂) titanium dioxide-based photoelectrode designs have been put out in recent years as intriguing trends and tactics to achieve champion photovoltaic performances using sophisticated molecular light harvesters (dyes) and redox shuttles [14]. With a band gap of 3.2 eV, titanium dioxide is a semiconductor material that is widely utilized. Titanium dioxide is an inexpensive, safe, and widely available material. TiO₂ nanoparticles typically have a particle size of 15–30 nm and a thickness of 10–15 μm [15,16]. When Nazeeruddin et al. replaced three tetrabutylammonium ions (TBA+) with four hydrogen (H+) counter ions of N3 dye and one H+ counter ion, N719 dye was shown for the first time; 10.0% and 11.2% efficiency, respectively, are displayed by the DSSCs for N3 and N719. N719 had a greater conversion efficiency than N3, although having a structurally comparable structure. This was ascribed to a shift in the counter ions, which altered the rate of adsorption onto the porous TiO₂ electrode [17]. The first successful DSSC was based on Ru (II)-polypyridyl dyes, and in the years that followed, Ru (II)-polypyridyl dyes were the basis for DSSCs since Gratzel and O’Regan (1991) confirmed 7% based on nanocrystalline TiO₂ [18]. With the black Ruthenium dye and Ru bipyridyl compounds (N3 and N719), DSSCs have demonstrated up to 11.2% and 10.4% power conversion efficiency as photosensitizers [19].
This study was conducted to investigate how the number of deposition cycles of Al2O3 via atomic layer deposition (ALD) on an FTO glass substrate affects the performance and conversion efficiency of the typical dye-sensitized solar cells. Different ALD cycles of Al2O3 deposited on FTO glass substrates with the same fabrication techniques are observed by performing Atomic Force Microscopy, UV-Vis analysis, Scanning Electron Microscopy, solar simulation, and sheet resistance test.

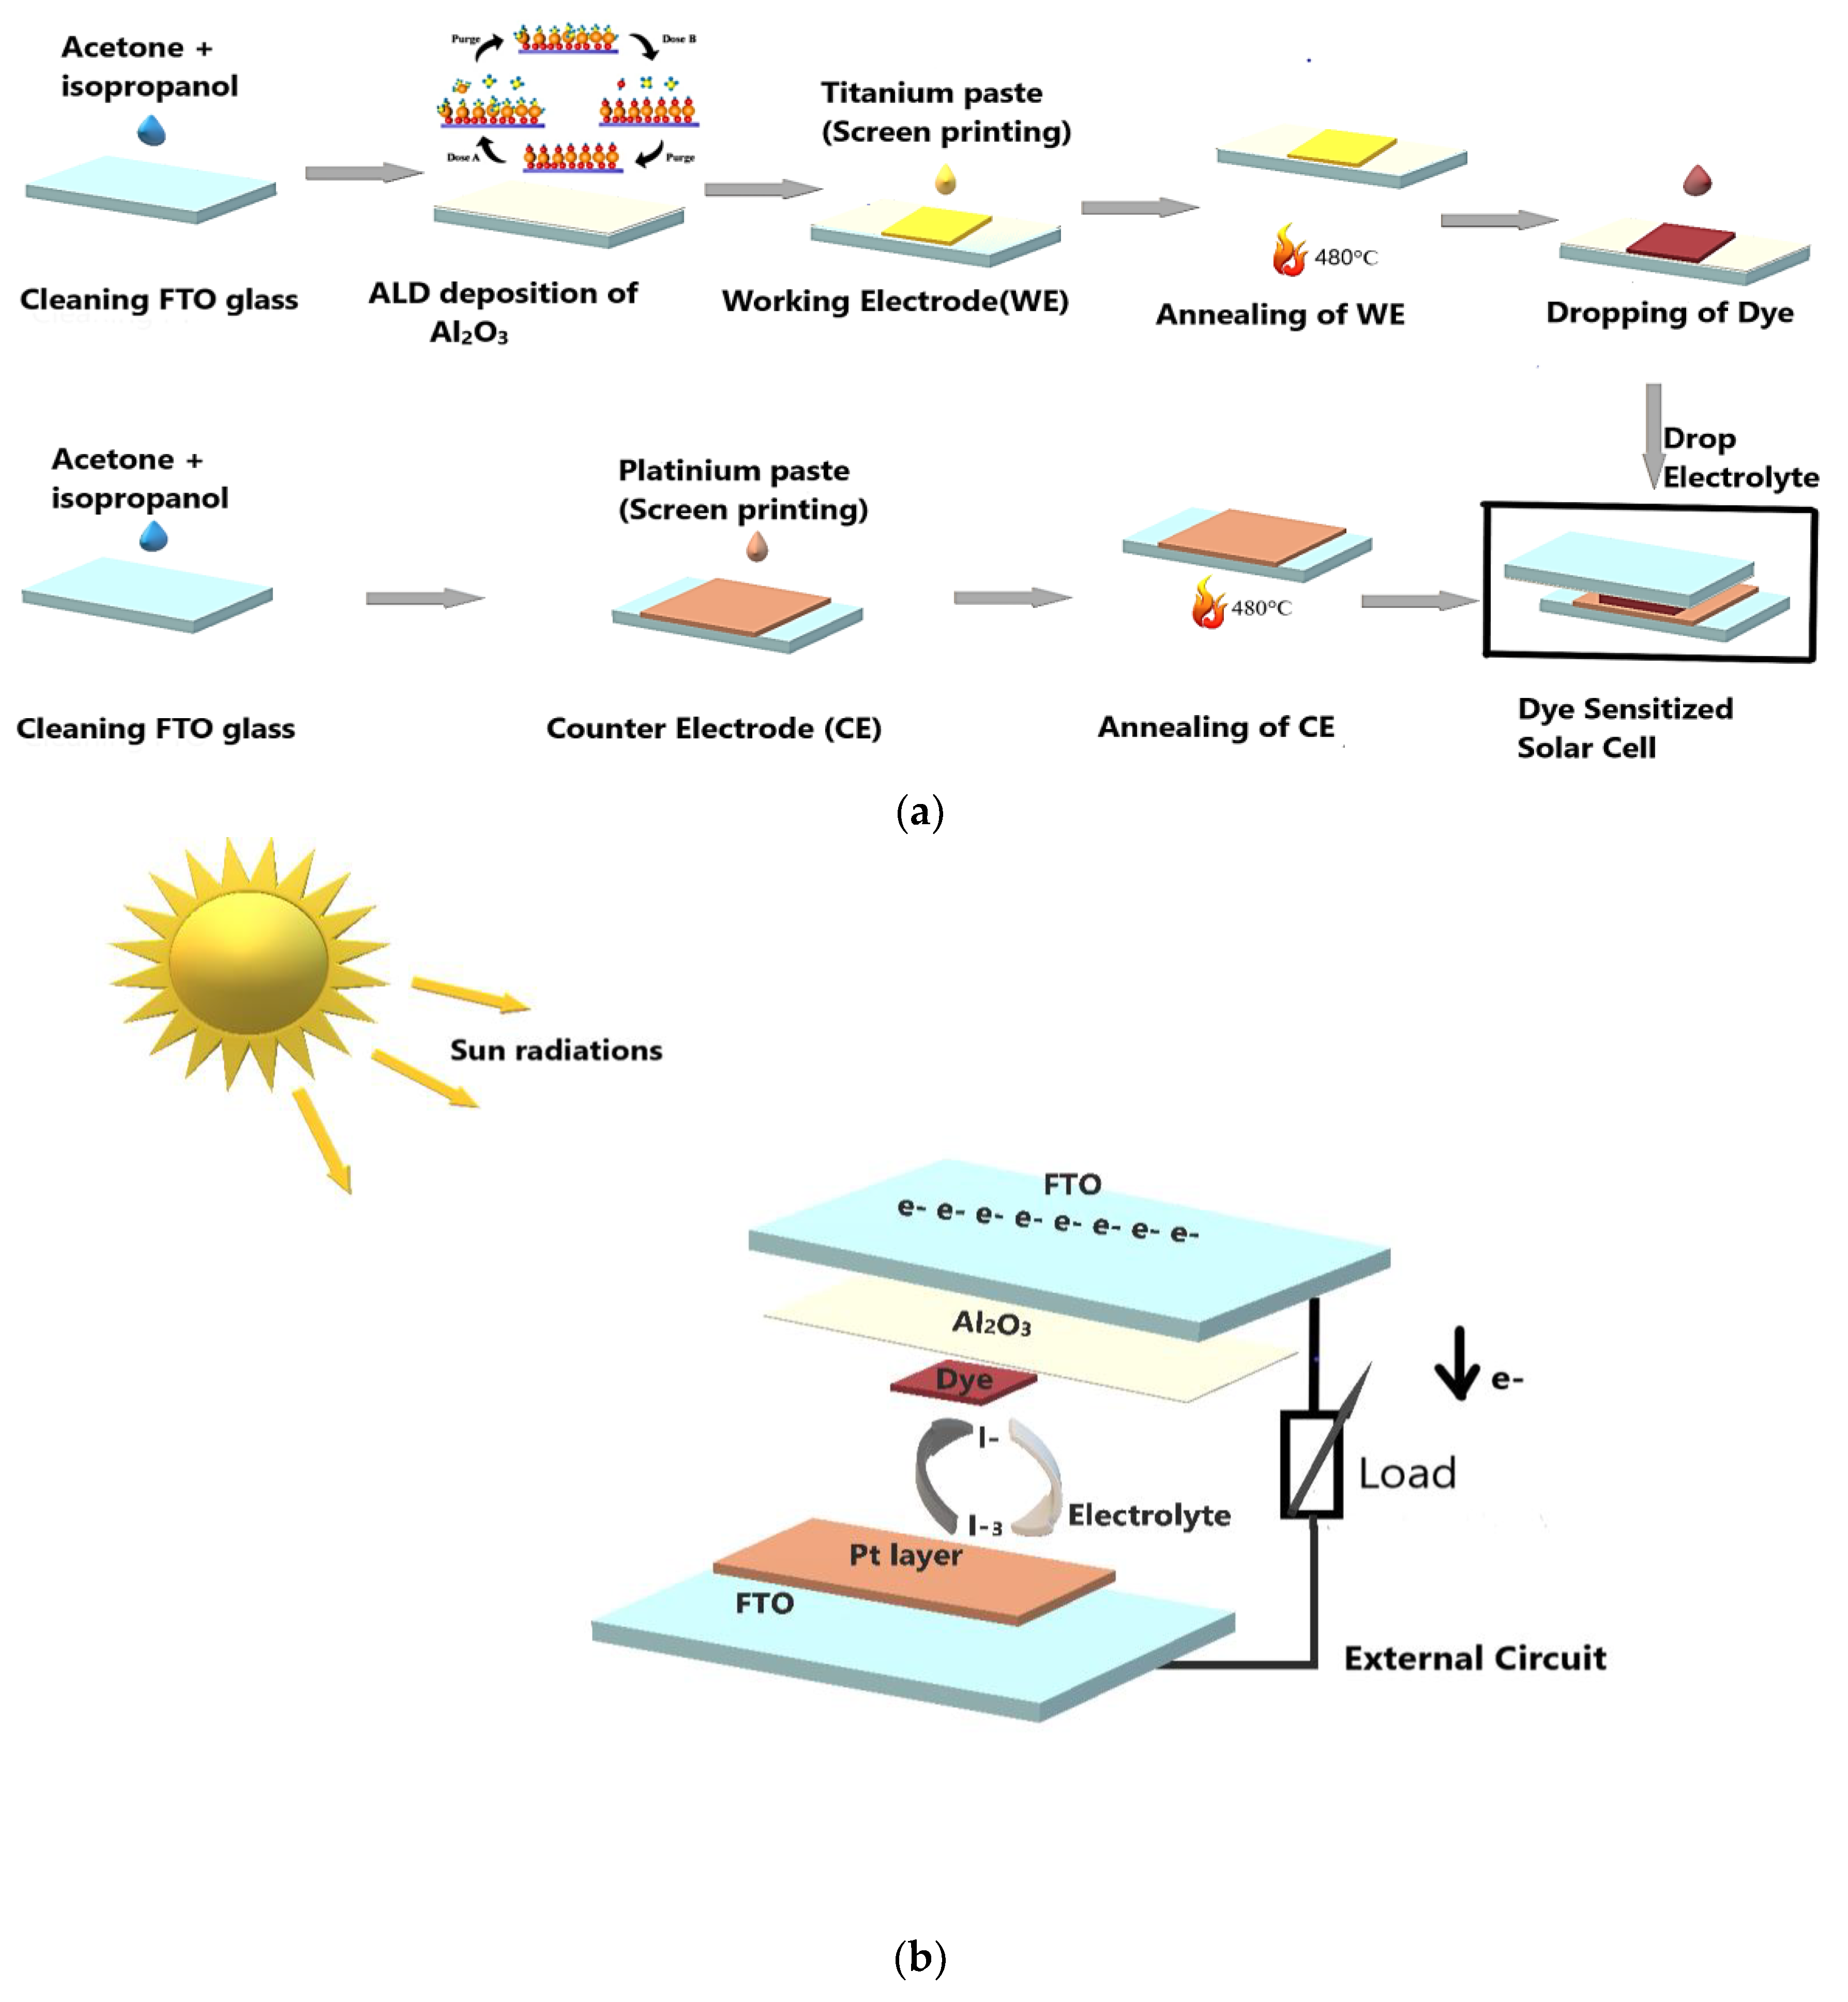
2. Materials and Methods

A 50 mm × 50 mm × 3 mm Fluorine Tin Oxide glass (GreatCell Solar Materials, Queanbeyan, Australia) was used as a transparent conducting oxide, PTI platinum paste (Sigma Aldrich, Darmstadt, Germany) was deposited onto the FTO glass substrate to act as a counter electrode, 18NR-AO Active Opaque Titania Paste (GreatCell Solar Materials, Queanbeyan, Australia) was also deposited as a semiconducting material to form the working electrode, EL-HSE High Stability Electrolyte (Sigma Aldrich, Darmstadt, Germany) was used to sensitize the active working electrode, N719 Industry Standard Dye (GreatCell Solar Materials, Queanbeyan, Australia) was used as a dye for the semiconductor material, and isopropanol and ethanol (Sigma Aldrich, Darmstadt, Germany) were used as cleaning agents. All these materials were purchased at industrialized quality and did not need to be further processed.
The 50 mm × 50 mm × 3 mm Fluorine Tin Oxide (FTO) glass substrates were carefully removed from its packaging and cut into 2.5 mm × 2.5 mm square samples. The substrates were handled by their sides, being careful not to make contact with the FTO-covered area. The substrates were placed into clean glass beakers filled with deionized water and a little detergent solution. This helped to physically remove dirt from the substrates, the substrates were then rinsed off with generous amounts of deionized water, precisely 200 mL. The beaker was then placed into an ultrasonic bath filled with boiling deionized water and sonicated for 15 min each. The ultrasonic bath causes rapid vibration to occur around the substrates, aiding the removal of particulates.
The substrates were then rinsed and sonicated in acetone and isopropyl alcohol (IPA) subsequently. Each process was sonicated further for 15 min. The substrates were allowed to dry before the deposition of the aluminum oxide.
Al2O3 thin films were deposited using the ALD Picosun R200 (Picosun Corporation, Espoo, Finland) system. Trimethylaluminum (TMA) and H2O were used as precursors. Typical thermal ALD parameters were used with a deposition temperature of 200 °C with pulse lengths of 0.1 and 4s forming precursor and water, respectively. A N2 purge of 4s was introduced between pulses to remove excess precursors and reaction by-products. Various numbers of cycles were used: 100, 200, and 300 cycles.
A screen with the appropriate mesh size for the application was selected. The prepared screen was placed onto the Al2O3-FTO glass substrate, and the titanium dioxide paste (18NR-AO Active Opaque Titania Paste) was applied onto the screen. The automated squeegee was used to spread the paste evenly across the screen, forcing it through the mesh onto the Al2O3-FTO glass substrate in the desired pattern. After printing, the titanium dioxide paste was dried to remove the solvent and bind the titanium dioxide particles to the Al2O3-FTO glass substrate. This was performed by using a drying oven at a controlled temperature (100 °C) for 10 min. To ensure proper removal of residual, adhesion, and performance, and create a porous structure, the titanium dioxide particles on Al2O3-FTO glass substrates are further heat treated at 480 °C for 30 min in a heating oven. The samples were then allowed to cool off slowly till room temperature. This forms the photoanode. The exact procedure above was performed with platinum paste (PTI Platinum) on separate FTO glass substrates. This forms the counter electrode.
The cleaned TiO₂-coated Al2O3-FTO glass substrates (working electrode) were immersed into the N719 dye solution. This was performed by placing the glass substrates in a container filled with the dye solution and allowing it to soak for 24 h. During immersion, the dye molecules were adsorbed onto the surface of the TiO₂ film through coordination bonds between the dye’s anchoring groups and the TiO₂ surface. After the desired immersion time, the glass substrates were removed from the dye solution and rinsed with isopropanol to remove any unbound dye molecules.
Using a syringe, drops of the EL-HSE High Stability Electrolyte were deposited on the active surface of the dye-sensitized solar cells. The above procedure for producing dye-sensitized solar cells is shown schematically in Figure 1a.

3. Results and Discussion

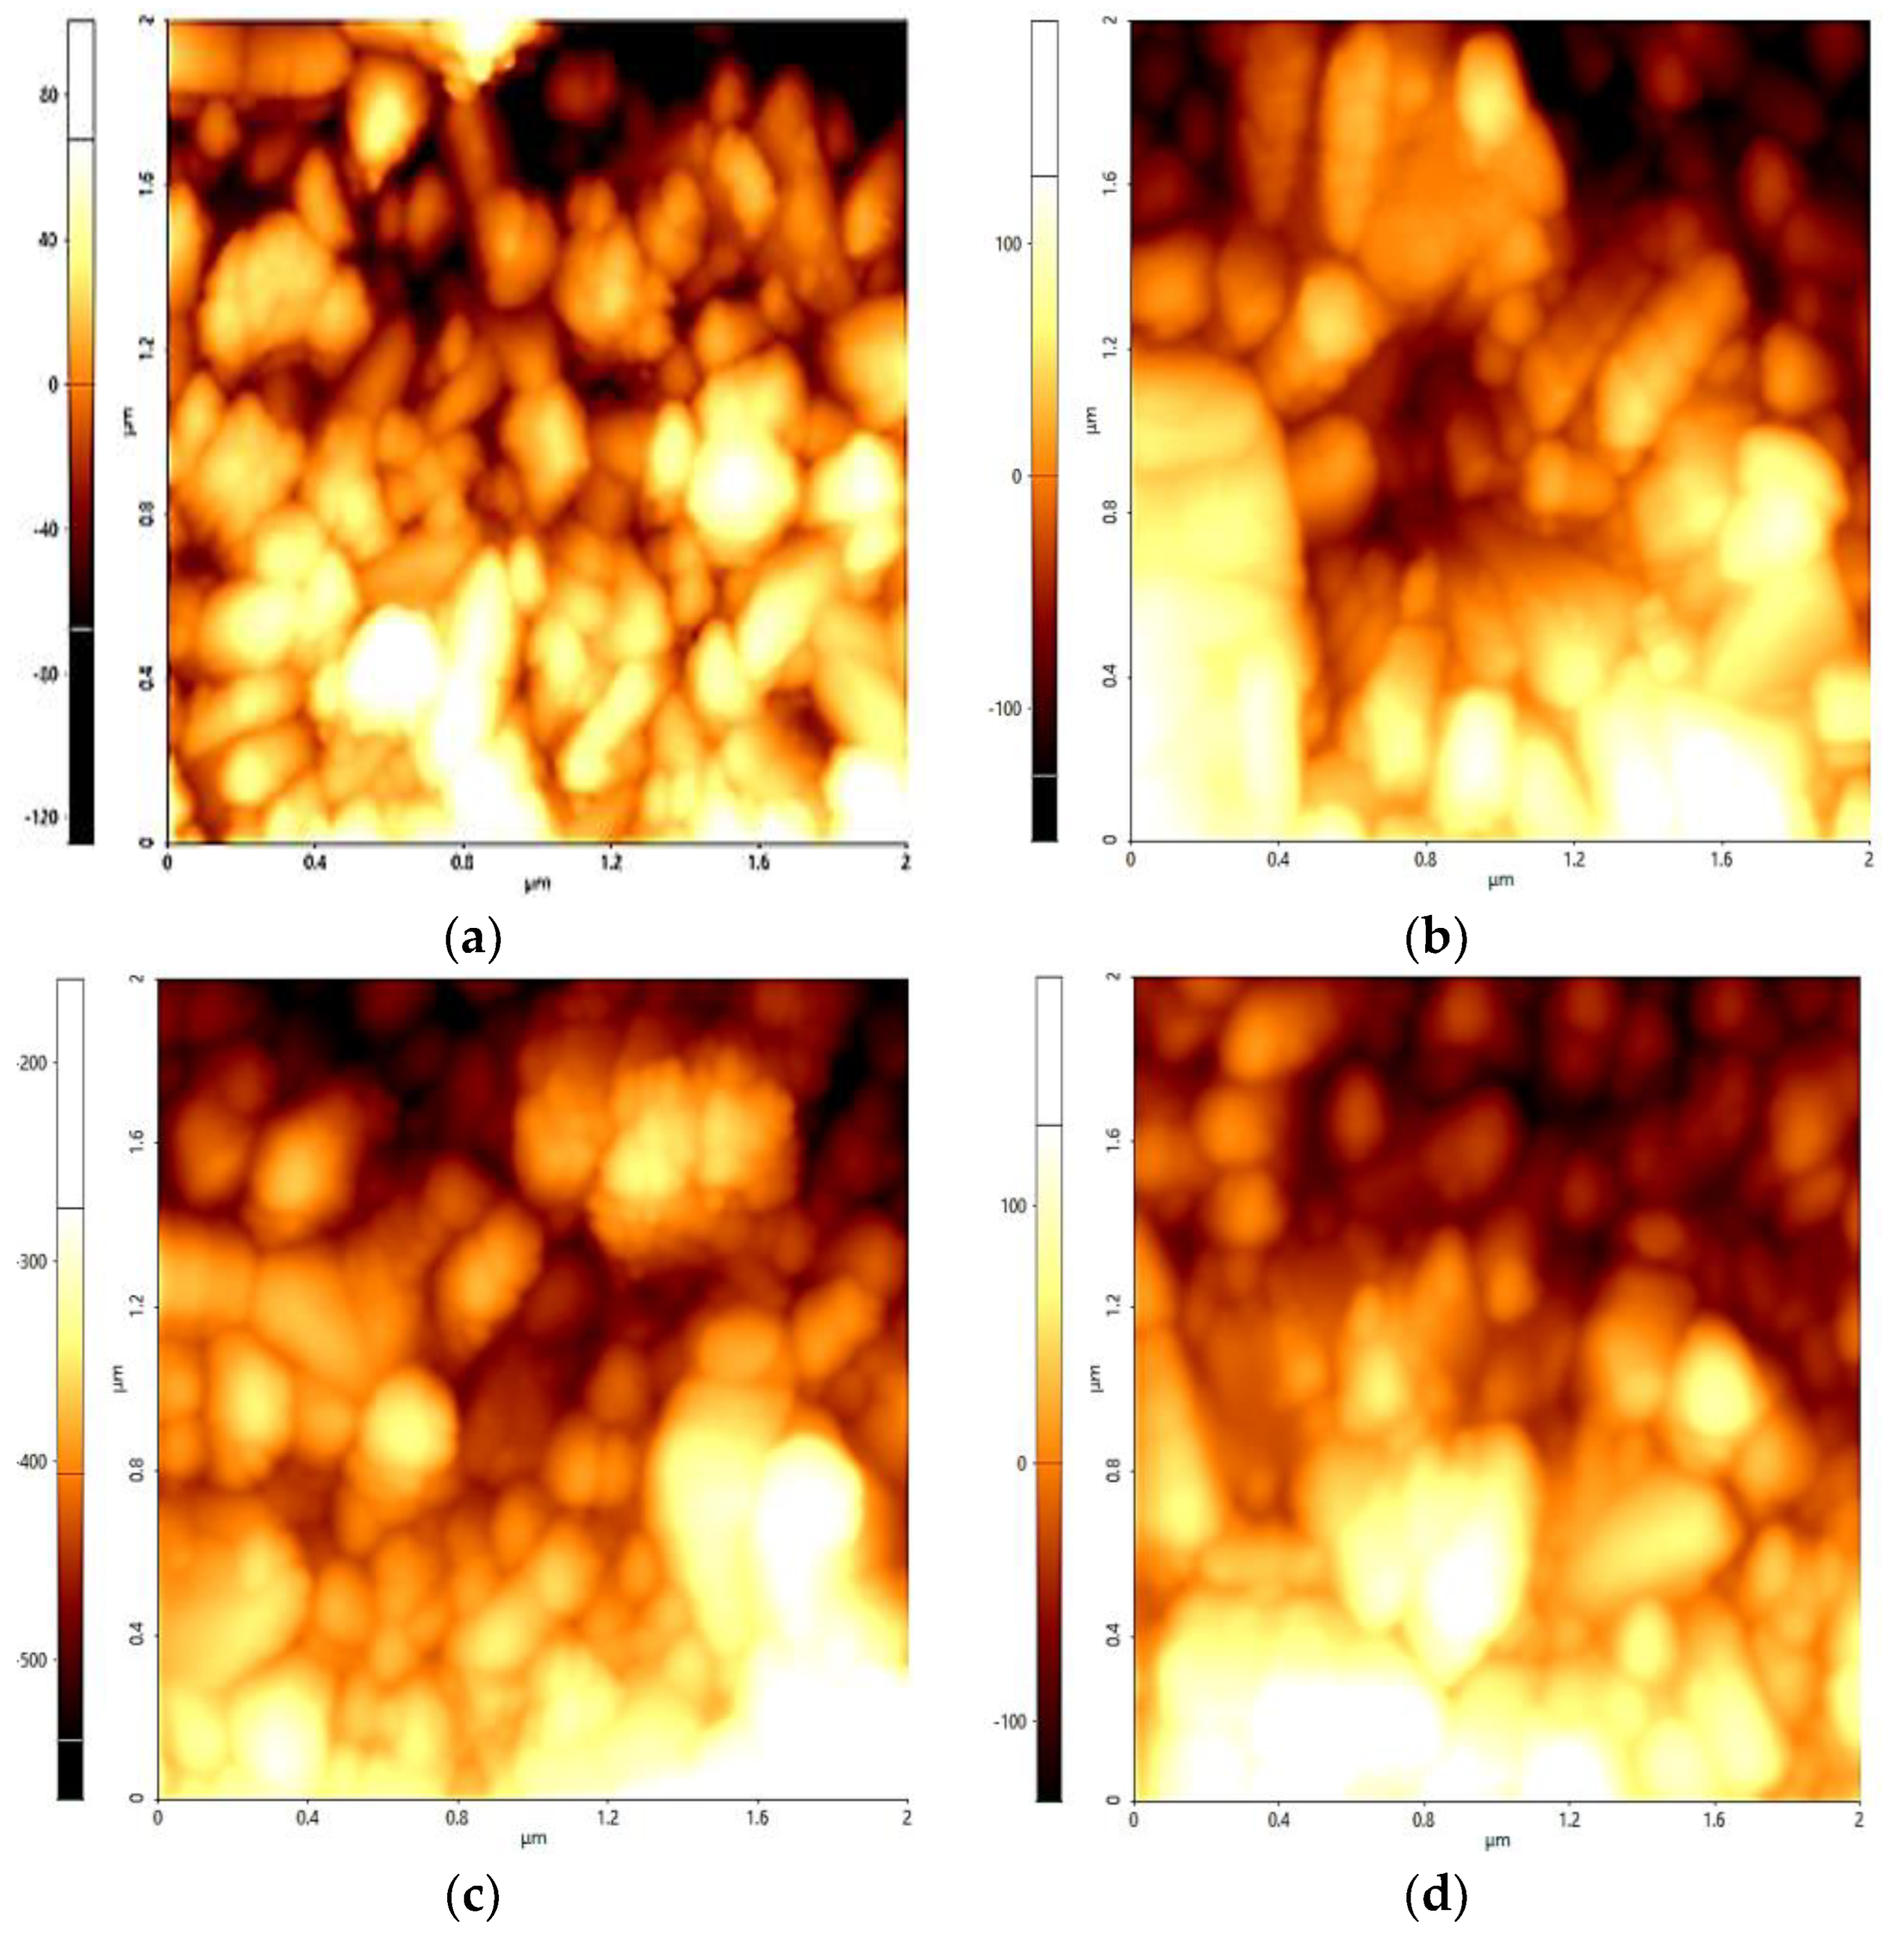
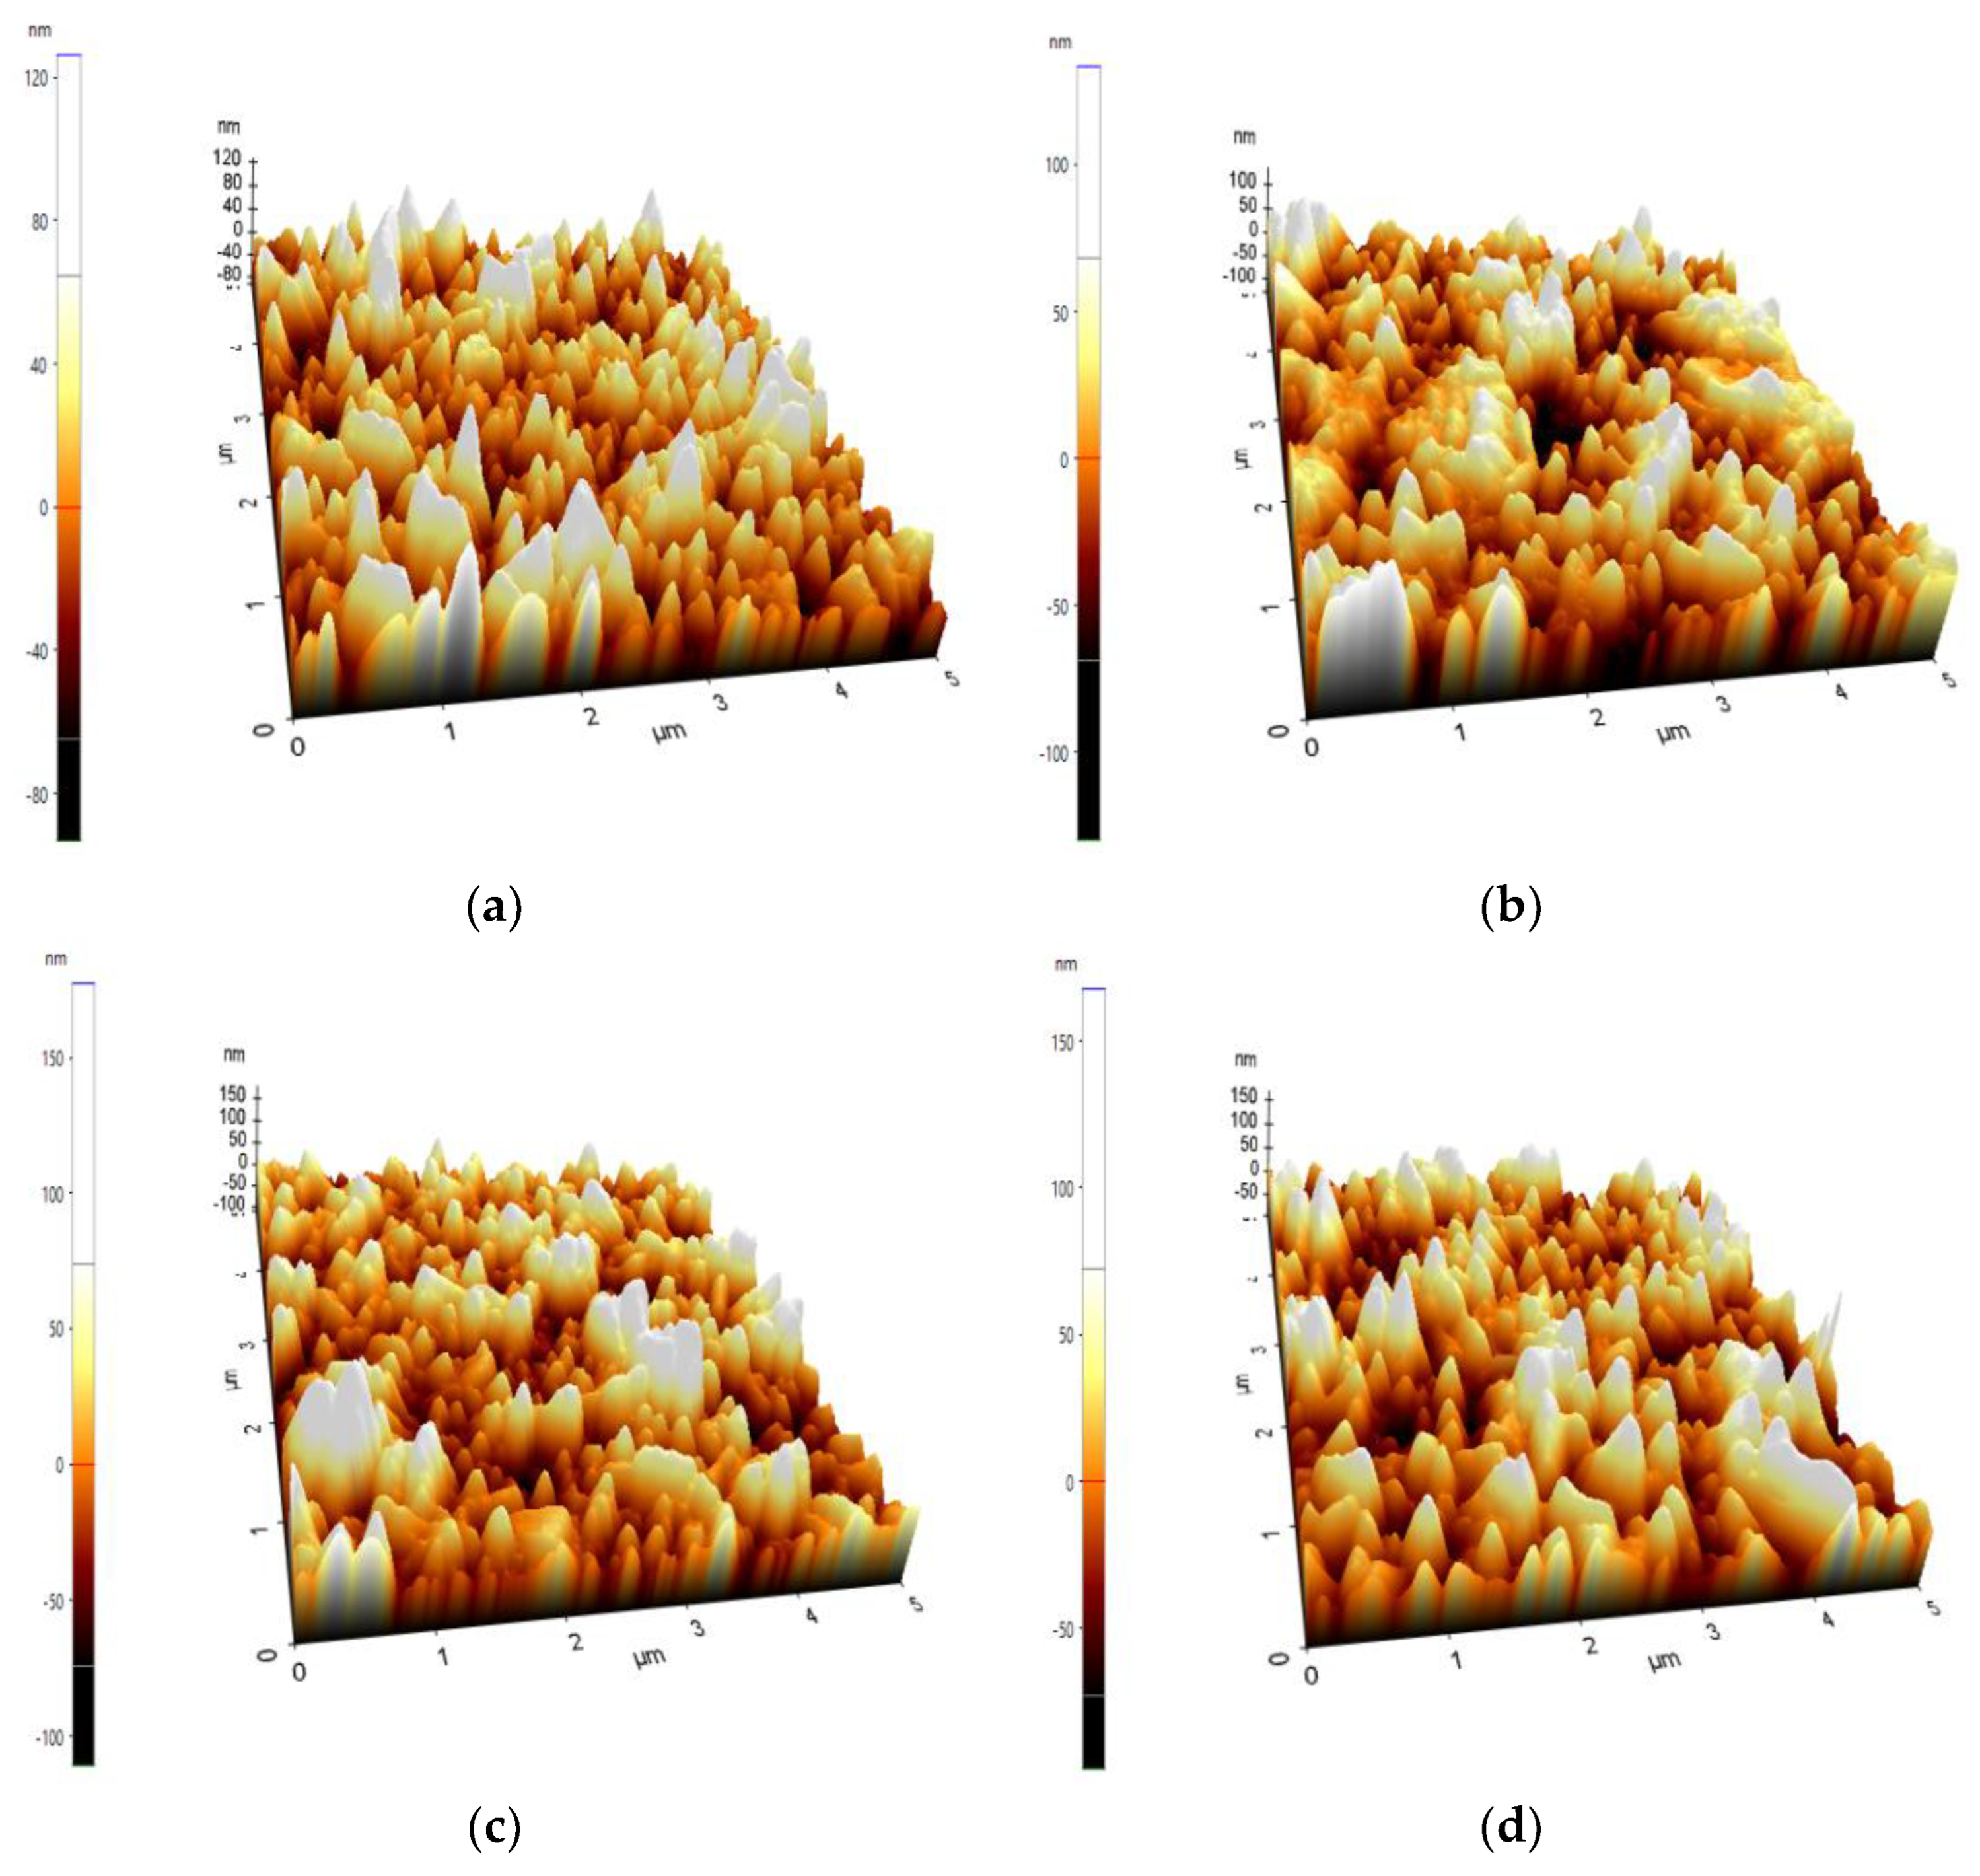
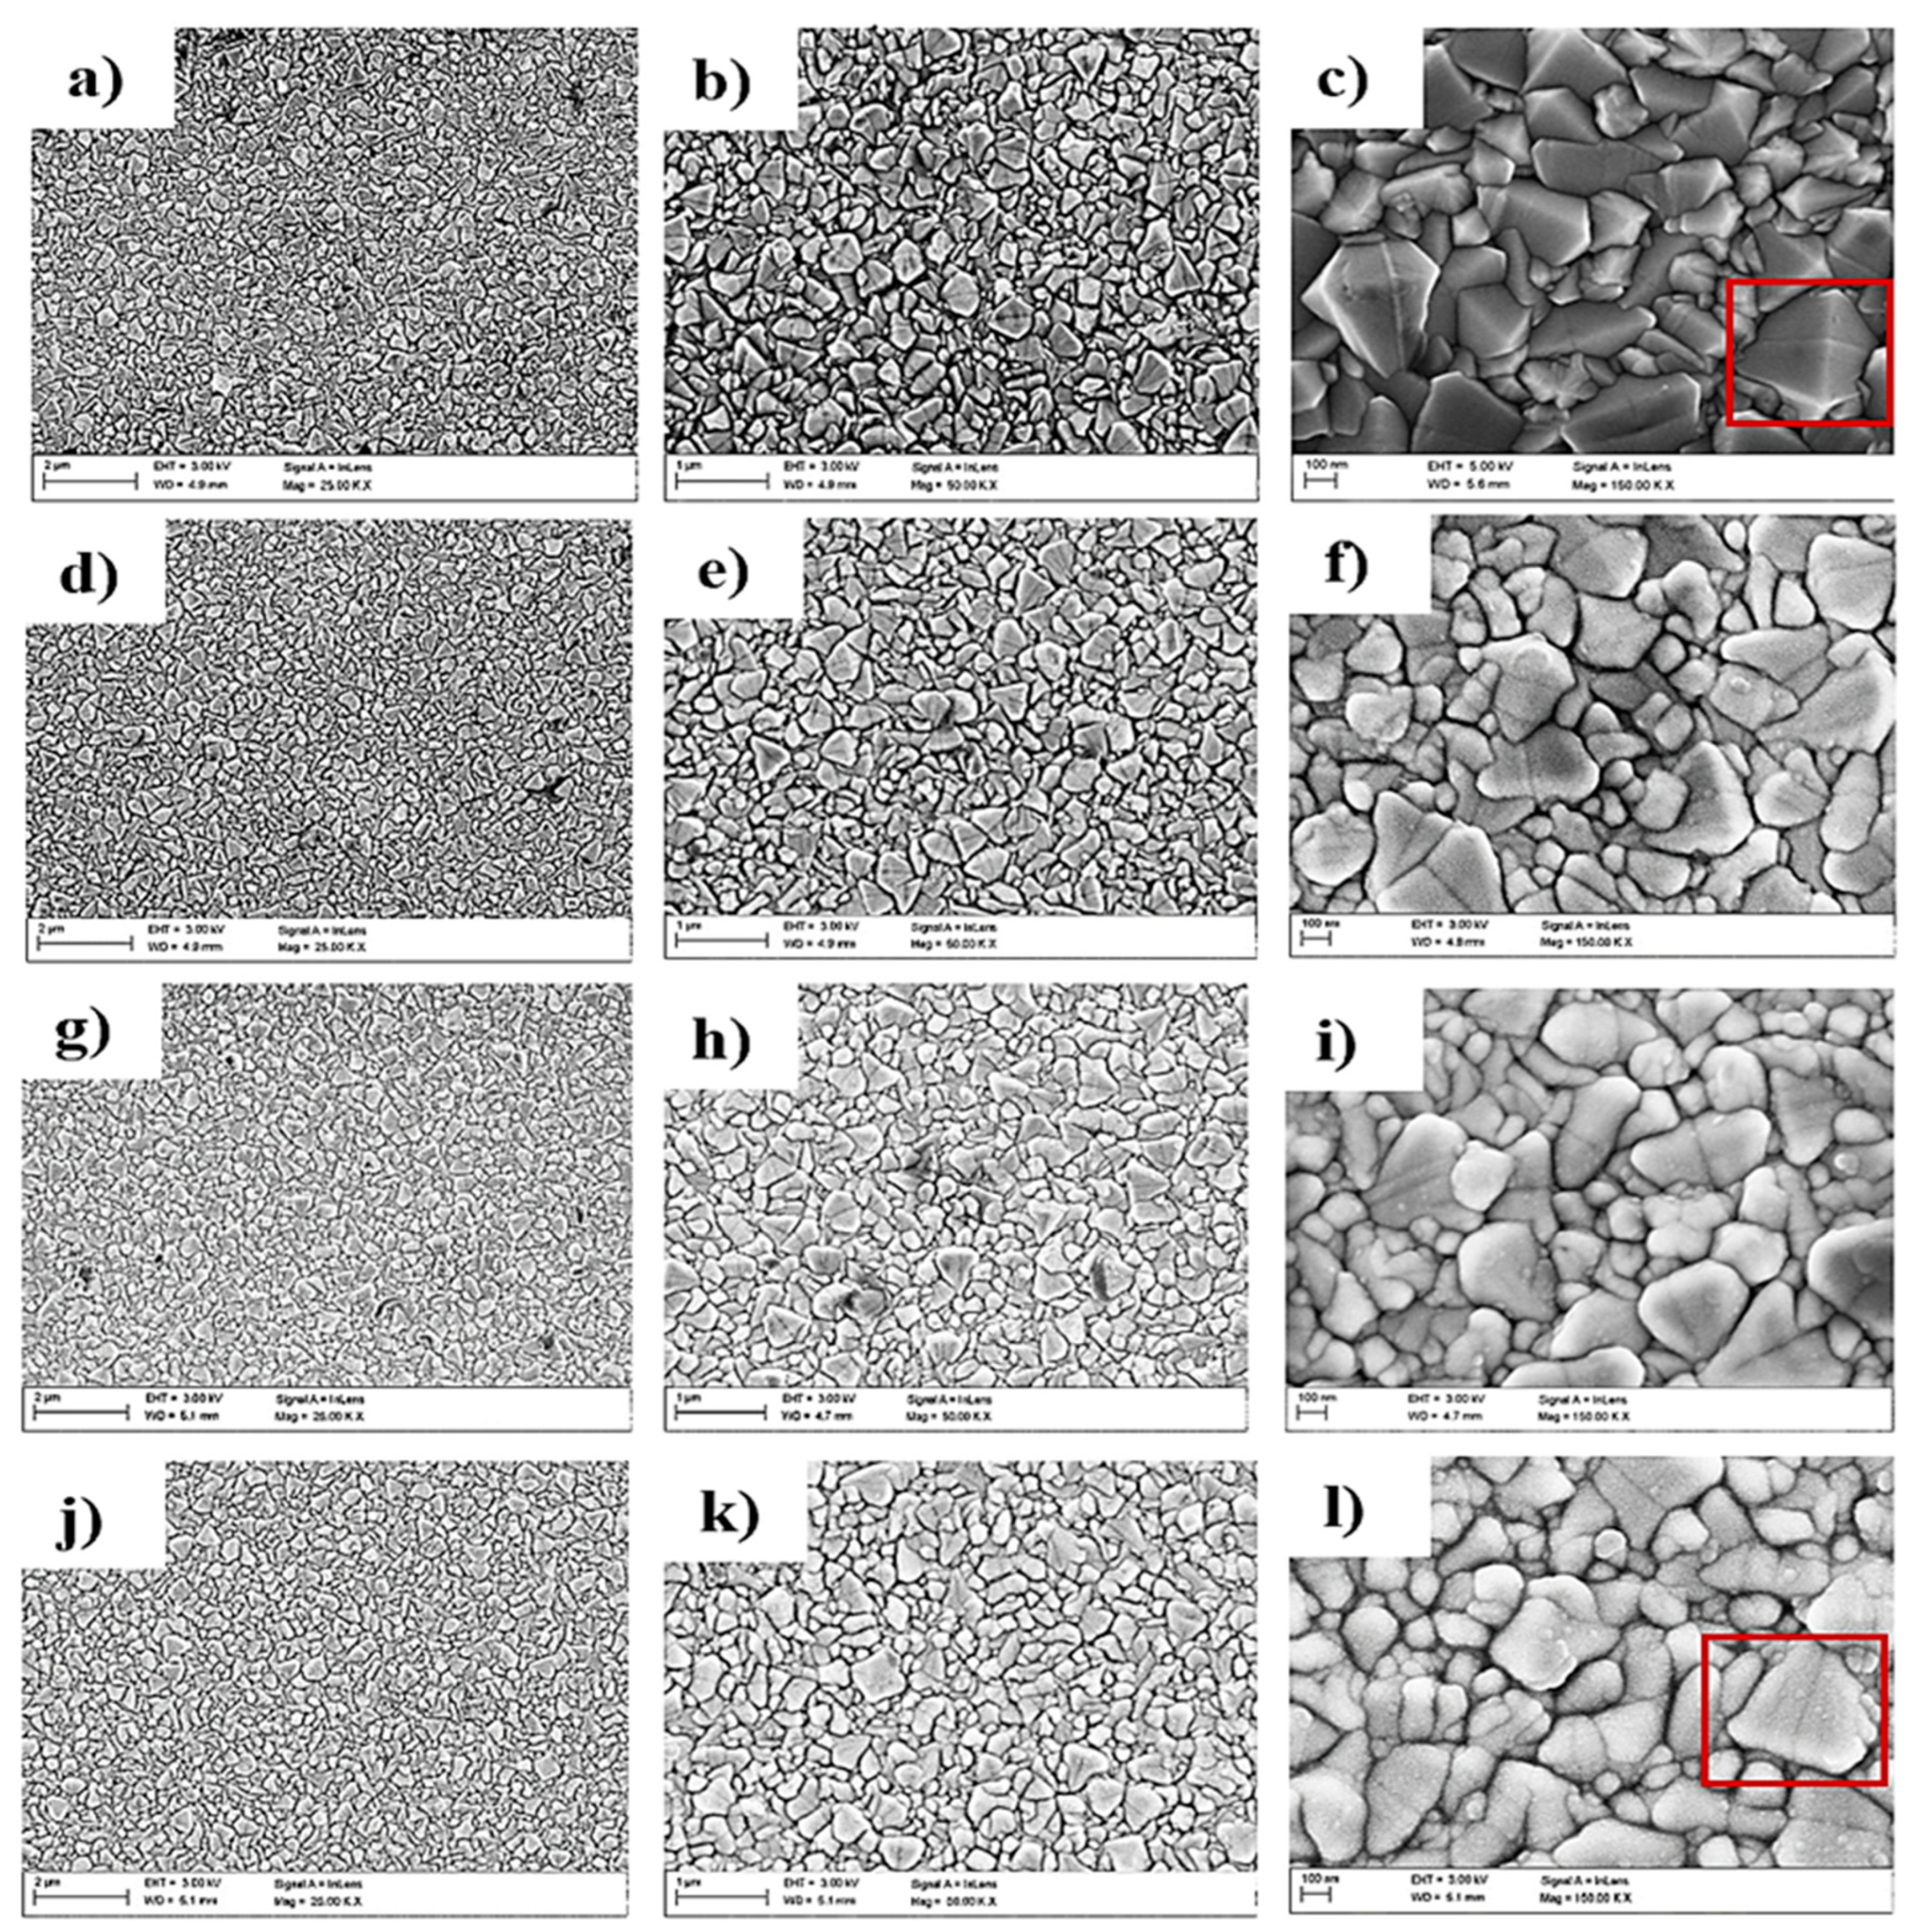
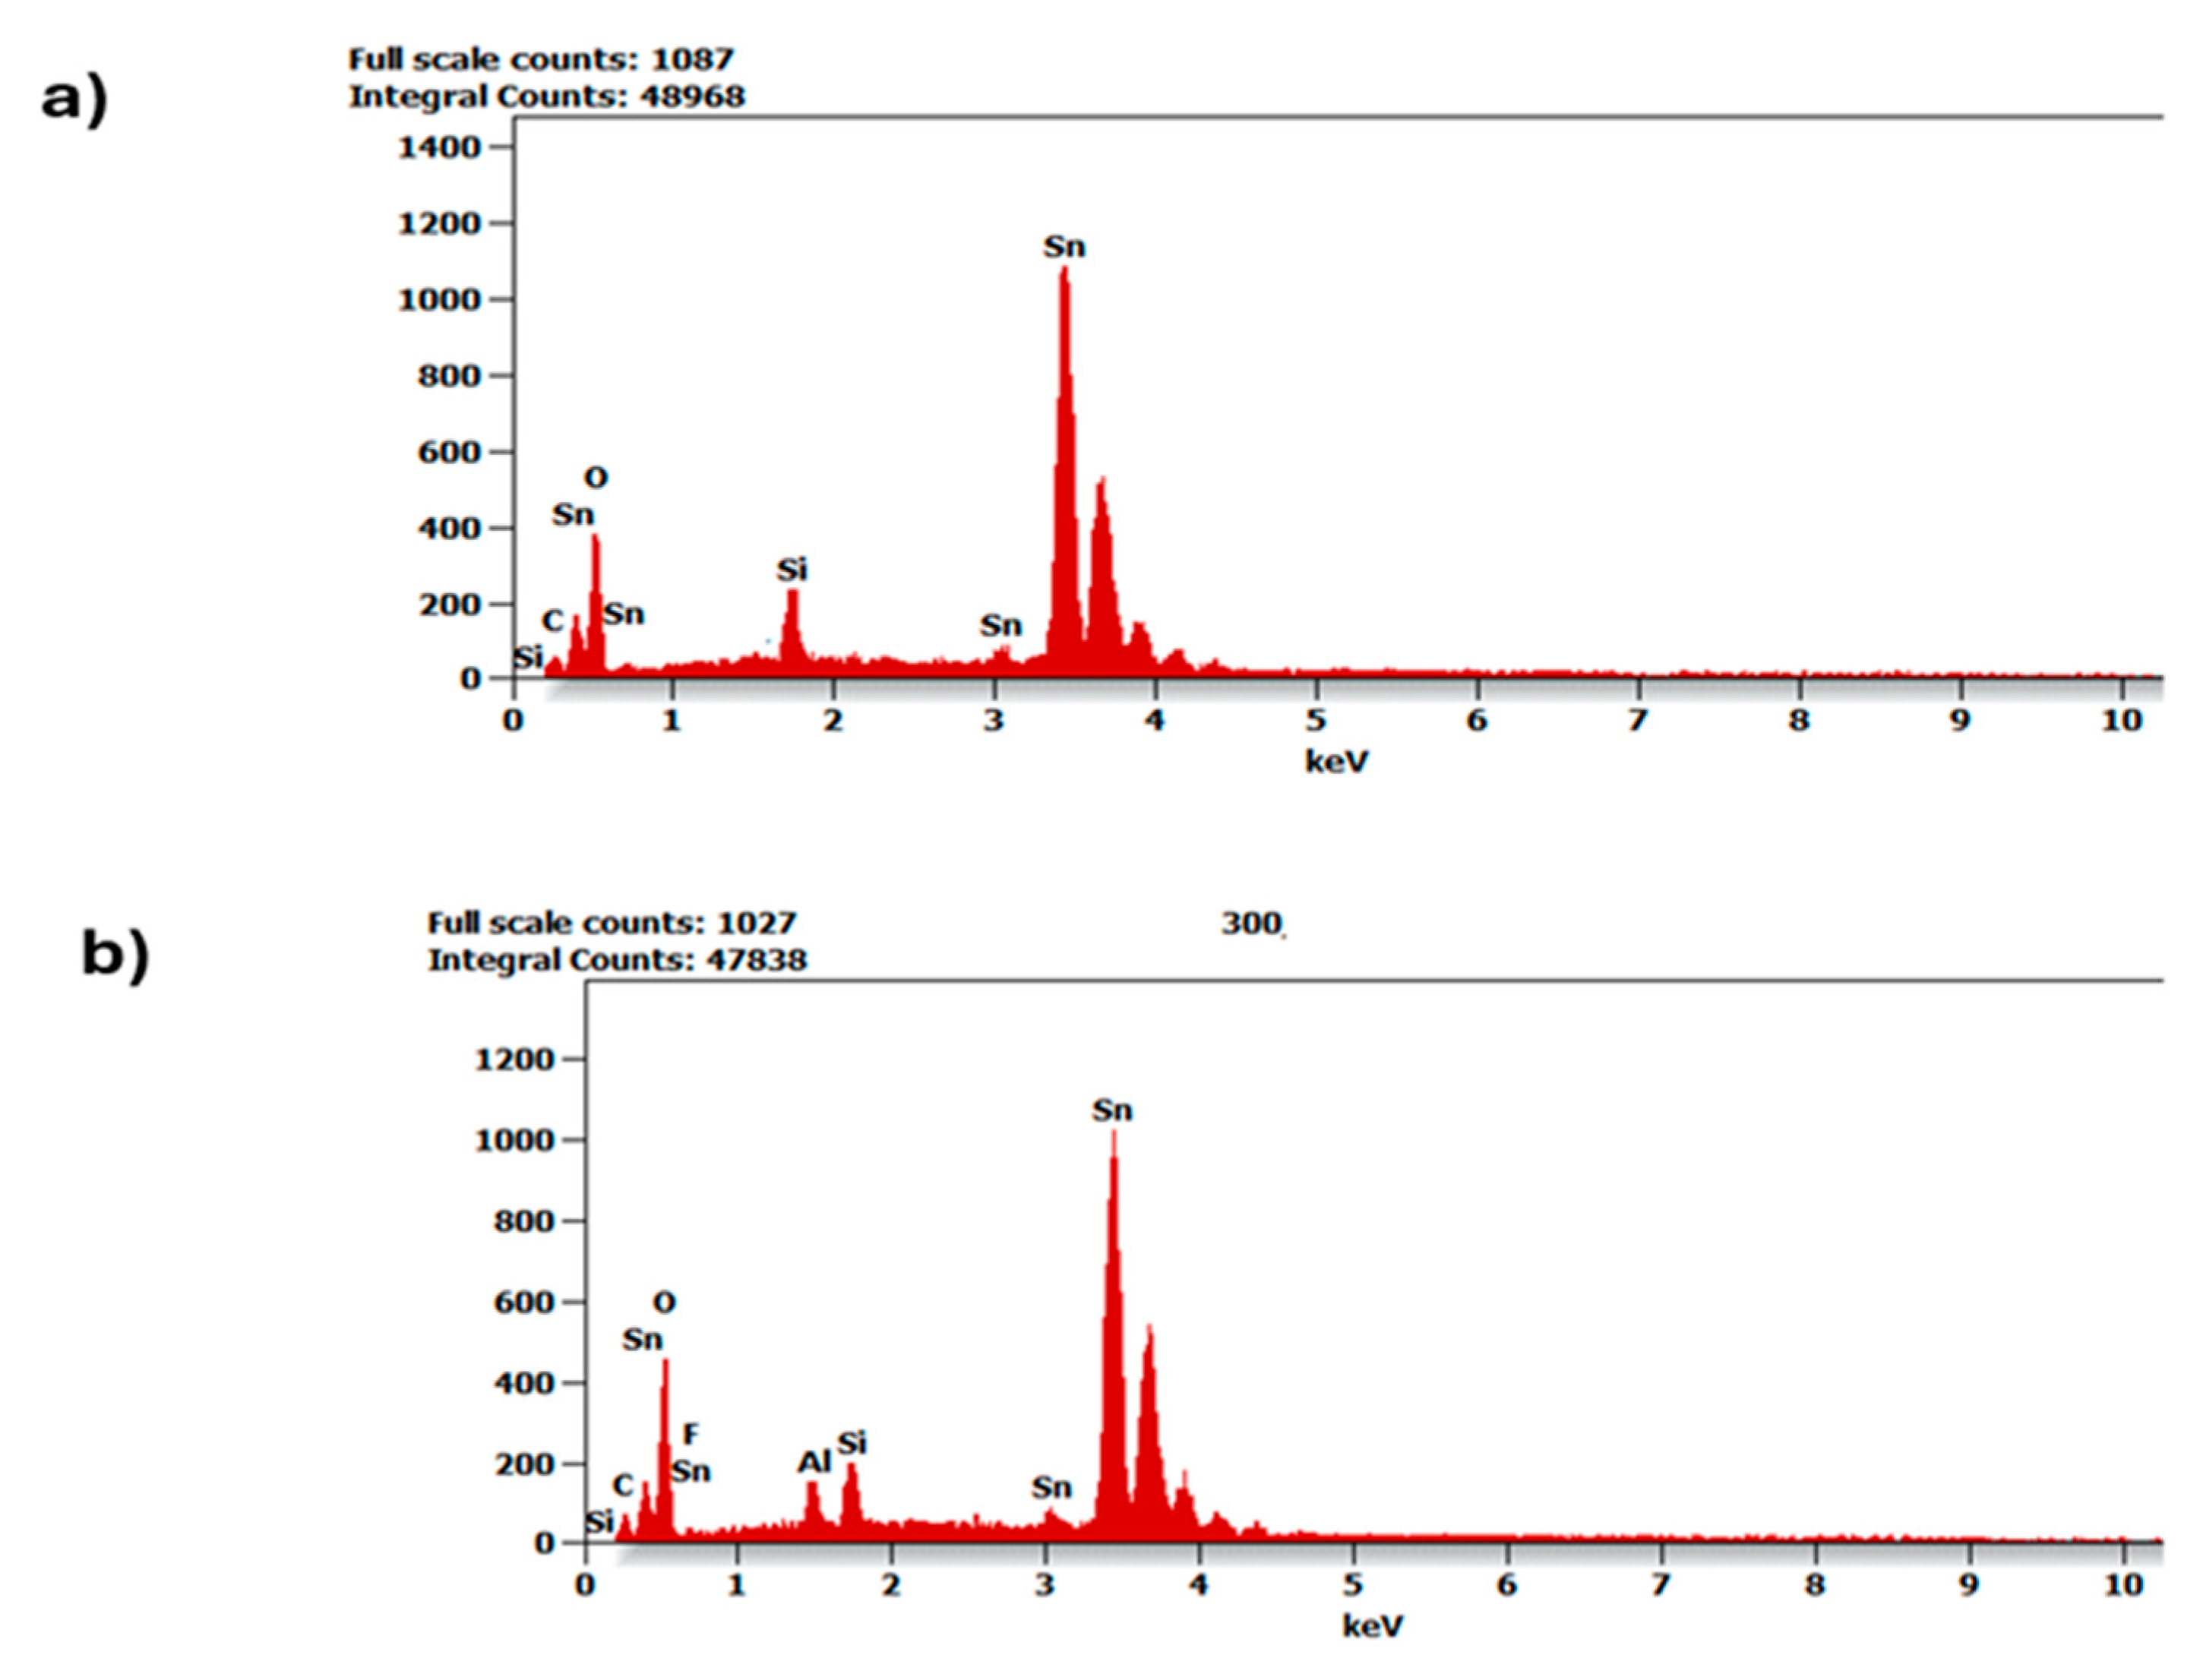
3.1. Surface Morphology

Since dye-sensitized solar cells’ (DSSCs) surface morphology directly impacts the solar cell’s efficiency performance to absorb light, transport electrons, and function as a whole, it is essential to the device’s operation. The surface morphology of the prepared samples was evaluated by the Atomic Force Microscope (XE-100 Park Systems) manufactured by Park Systems Corporations, Suwon, Korea. The study was conducted in a non-contact mode, in the areas of 2 × 2 µm. The cantilever vibration frequency was 1 Hz, and the recorded test results were developed in the Park Systems XEI 4.3.0 program (Park Systems Inc., California, United States of America). 2D and 3D images were recorded, and basic roughness parameters such as root mean square (RMS) and arithmetical mean height (Ra) were calculated.
In Figure 2a, it is observed that there are multiple notable defined granular structures, indicating the presence of crystalline structures on the surface of the pure FTO sample. In Figure 2b, the FTO-Al2O3 100 cycles show almost no difference, and there are still granular crystalline structures present; however, the micrograph is a little blurred due to the introduction of Al2O3 layers. In Figure 2c, the FTO-Al2O3 200 cycles show very agglomerated and less defined granular structures on the surface, and in Figure 2d, FTO-Al2O3 300 cycles exhibit almost indistinctive crystalline structures, forming huge chunks. The pure FTO samples in Figure 2 show a much rougher and non-uniform surface morphology as compared to the FTO-Al2O3; this can be attributed to the fact the Al2O3 helps to passivate the semiconductor layer and also the heat treatment that was performed after deposition. When compared with the images obtained from the SEM, it can be observed that with the help of annealing after the deposition of Al2O3, the roughness of the surface is improved. By moving surface atoms around or causing surface diffusion, annealing can change a material’s surface morphology. The distribution and quantity of dye molecules that may be adsorbed are influenced by surface shape, and this in turn impacts the solar cell’s capacity to absorb light. Changes in surface roughness, crystallinity, and defect density may result from this, and these changes may have an effect on the availability of adsorption sites as well as the molecules of adsorbate they are accessible to [20].
In Figure 3a, it is observed that there are multiple notable defined sharp crystalline structures on the surface of the pure FTO sample. In Figure 3b FTO-Al2O3, 100 cycles show less prominent spikes which begin to merge into clumps due to the introduction of Al2O3 deposition. In Figure 3c, FTO-Al2O3 200 cycles show granular spikes that are less defined on the surface, and in Figure 3d, FTO-Al2O3 300 cycles exhibit less sharp crystalline structures. The semiconductor material used in these DSSCs was a nanostructured layer of titanium dioxide (TiO2), and this layer usually forms nanoparticles and nanorods, as can be seen in the 3D topography analysis in Figure 3 and Table 1. The crystalline nature of the FTO samples used in this research was confirmed due to their maximum and minimum roughness value of 17.42 ± 3.06 nm, aligning with the study performed by Leila et al. Mohsen (2024) that showed the maximum and minimum roughness value of FTO to be 15.21 ± 0.78 nm [21]. The surface roughness and root-mean-square roughness (Rq) show that Al2O3 nanoparticles were successfully deposited onto the surface via ALD and helped to improve the absorption of light rays encountered by the surface of these DSSCs [22]. All the micrographs obtained are similar because FTO is a very crystalline material and still very much visible in all samples and the Al2O3 layers are very thin. However, with further increase in Al2O3 layers (from 300 cycles), the roughness begins to reduce, which indicates over-passivation of the surface, which is not very desired since some level of roughness is required for the absorption of sunlight rays [23,24].
Analyzing dye-sensitized solar cells (DSSCs) using Scanning Electron Microscopy (SEM) is a useful technique for studying their surface morphology and microstructure. SEM is capable of producing fine-grained pictures of the electrodes used in DSSCs, including the counter electrode and photoanode. In doing so, researchers are better able to comprehend the electrode surface’s porosity, surface roughness, and nanoparticle or sensitizing dye dispersion. These elements greatly affect the solar cell’s capacity to absorb light, move charges, and function as a whole. Sensitizing dye dispersion within the porous photoanode may be examined by researchers using SEM. For DSSCs to capture light as efficiently as possible, this information is essential [25]. The surface morphology of the analyzed specimens was evaluated by the scanning electron microscope (SEM). The images were taken with a Zeiss Supra 35. The accelerating voltage was 3–5 kV. To register images of the surface topography, the secondary electron detector (by the in-lens detector) was used. The qualitative research of chemical elements was also performed using energy-dispersive spectrometry (EDS).
Figure 4a–c show that pure FTO samples have a crystalline microstructure appearance with a clear crystalline structure highlighted with a red rectangle in Figure 4c, Figure 4d–f show that FTO-Al2O3 100 cycles display a less crystalline microstructure with agglomerated particles as compared to pure FTO samples, Figure 4g–i show that FTO-Al2O3 200 cycles show a microstructure with defined particles with irregular shapes and sizes, and Figure 4j–l show that FTO-Al2O3 300 cycles show cloudy microstructures with a decrease in the irregularities in the particle sizes and very drastic agglomeration of the particles. These changes in microstructure with each Al2O3 deposition cycle are due to the amorphous structure of Al2O3 thin film layers.
Figure 5a is an EDS analysis from a sample of the pure FTO glass substrate and Figure 5b is the elemental counts of FTO-Al2O3 300 cycles. Figure 4 and Figure 5 go hand in hand, where the EDS analysis can help us understand what is possibly happening before and after the ALD deposition of Al2O3. In Figure 4c, the red rectangle-highlighted area shows a distinctive crystalline structure due to the crystalline structure of FTO; however, this crystalline structure gradually diminished with the deposition of Al2O3, as can be seen in Figure 4l, where the microstructure highlighted in the red rectangle displays a very ‘cloudy’ microstructure due to the presence of thin Al2O3 amorphous layers. Figure 4b proves that Al2O3 was successfully deposited. In Figure 5a, tin (Sn) was the most prominent element present due to the FTO, but aluminum (Al) was not detected; however, in Figure 5b, the elemental count of aluminum (Al) was detected due to the deposition of Al2O3. At high magnification, the surface of FTO crystals can be seen to be covered with a uniform cloud-like layer, which is typical for amorphous materials (Al2O3).
The directional deviations of a surface’s normal vector from its ideal state serve as a measure of surface roughness. The surface is smooth if these variances are tiny, and rough if they are considerable [26]. From Figure 4, the images obtained clearly reveal that the porosity of the surface is improved drastically with the number of Al2O3 ALD cycles performed. This is due to the fact that atomic layer deposition (ALD) allows for uniform coverage, and regulated surface morphology is achieved by this deposition technique, which enables exact control over the nucleation and development of Al2O3 nanoparticles or thin films on the semiconductor substrate’s surface.

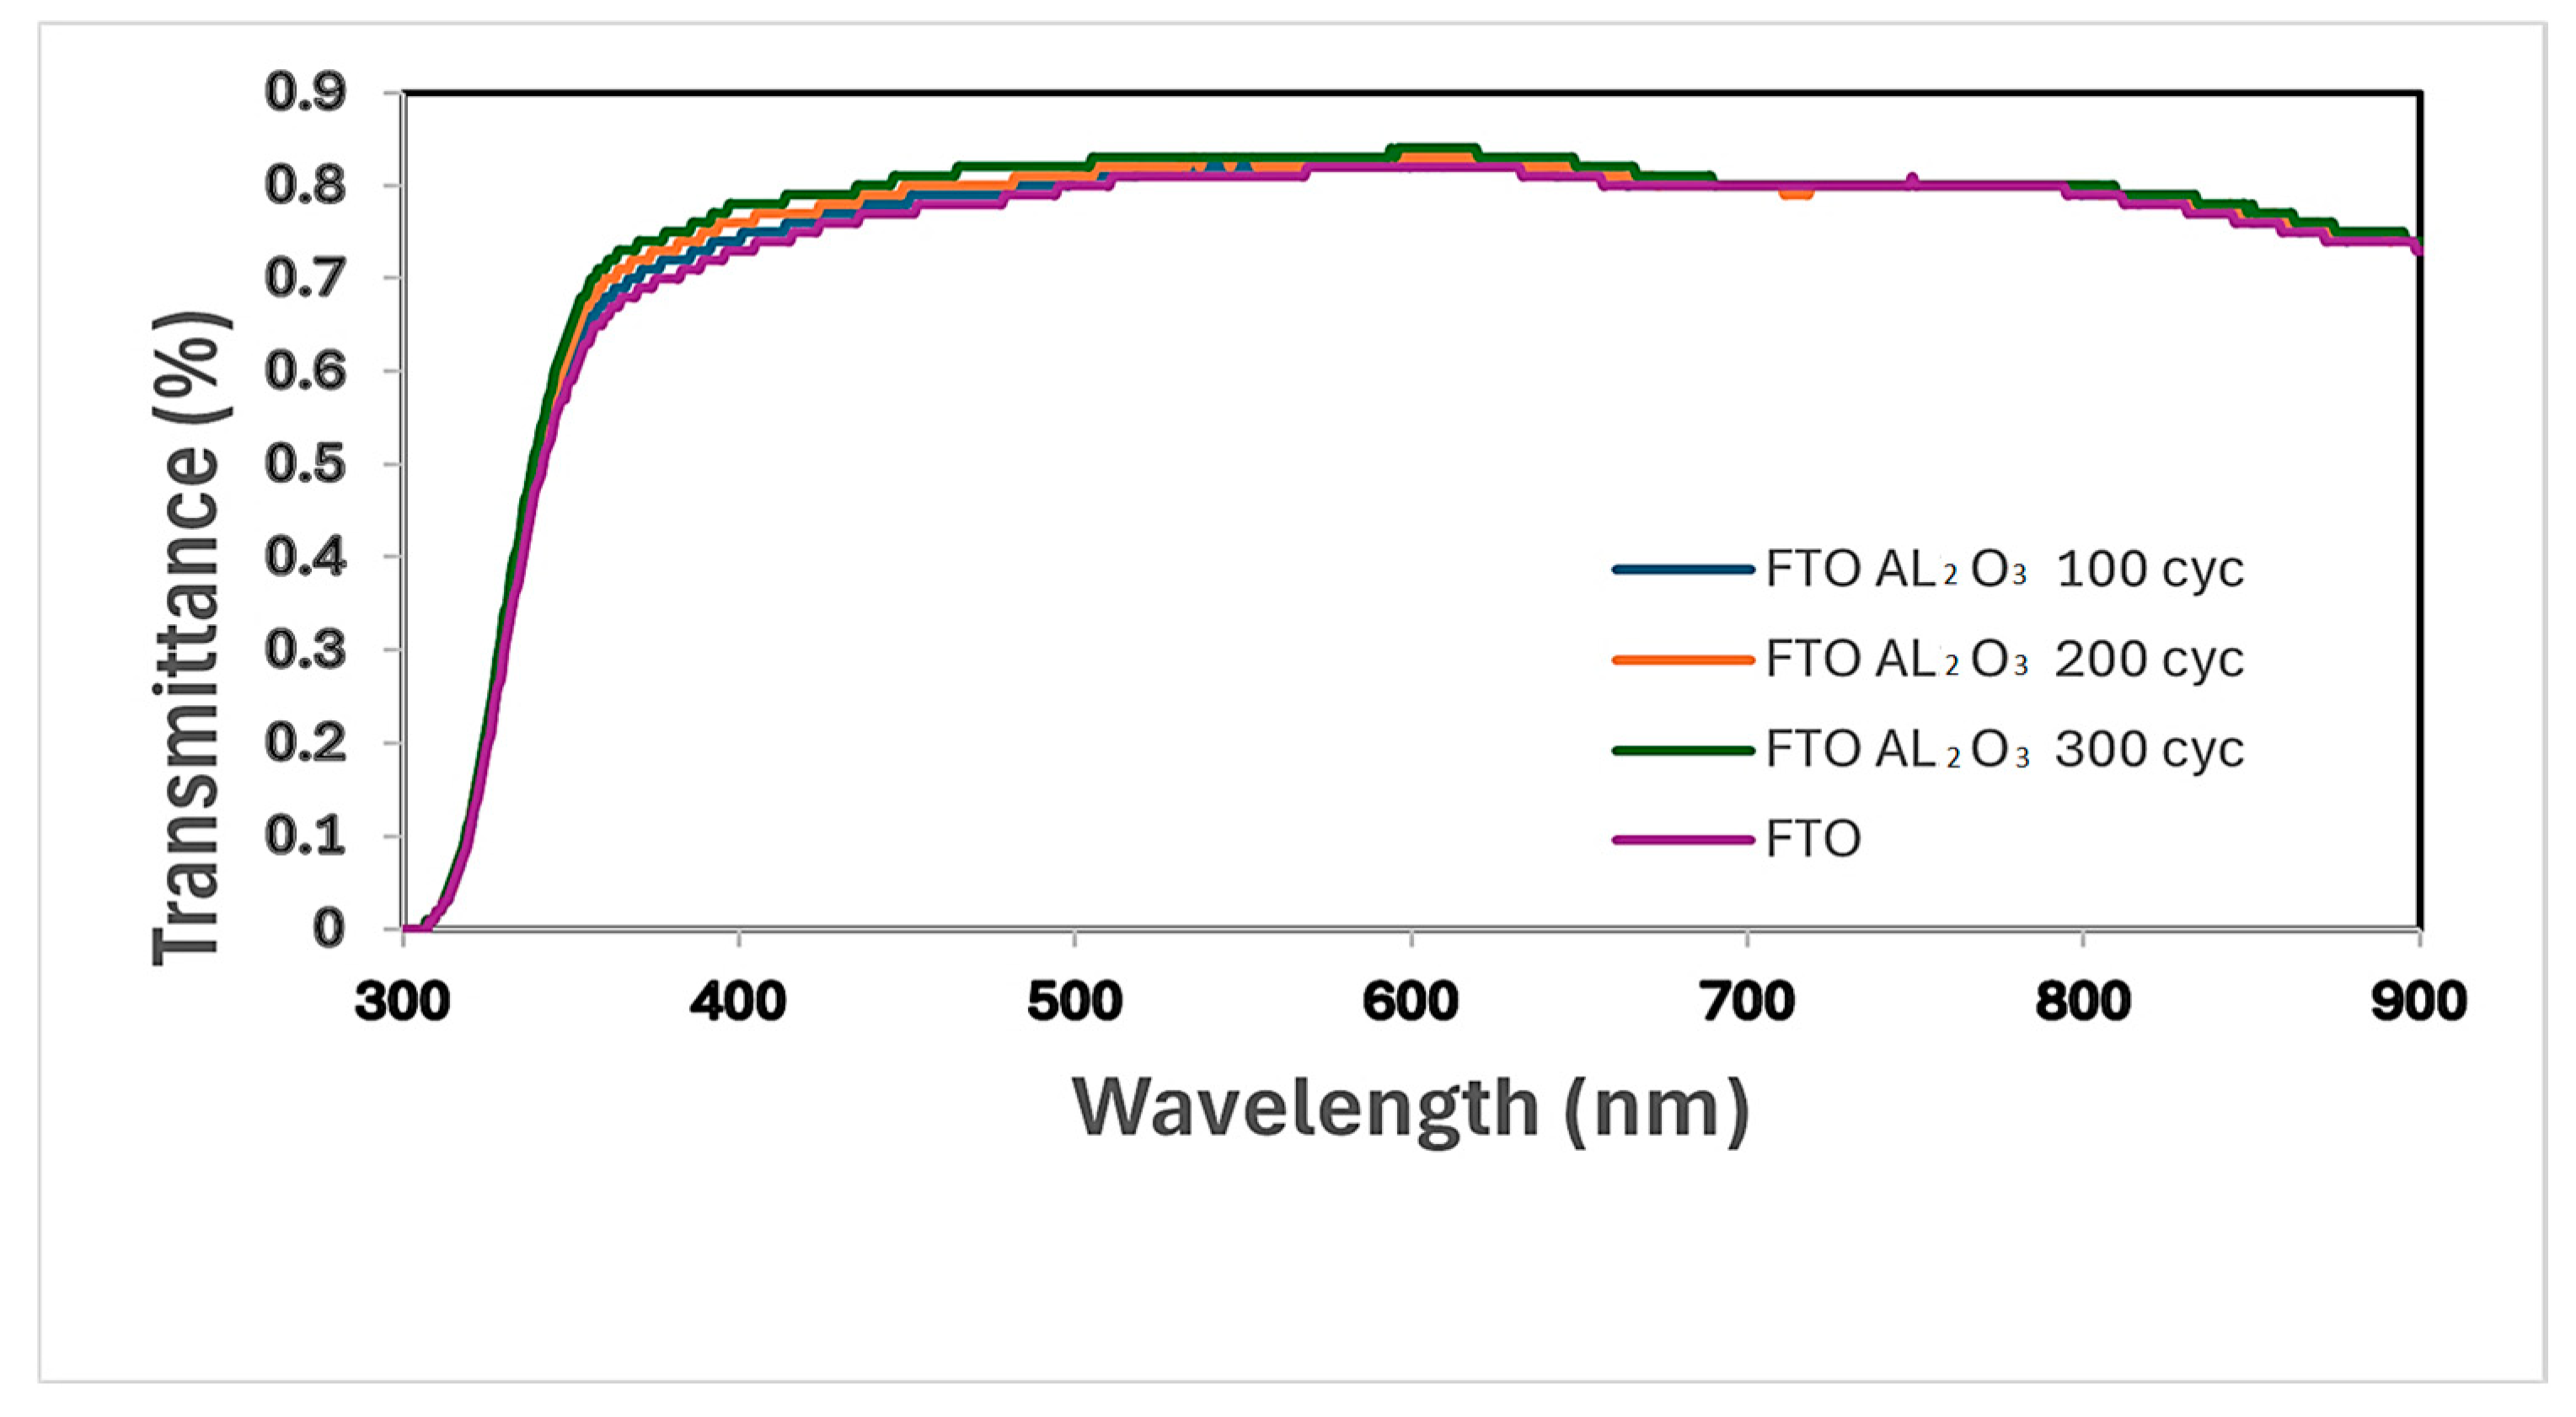
3.2. Light Transmittance Analysis

The transmittance spectra of the sensitizing dye molecules employed in DSSCs are measured using UV-Vis spectroscopy. Typically, organic dyes or metal complexes with substantial absorption in the visible portion of the electromagnetic spectrum are employed as dyes in dye-sensitive solar cells (DSSCs). Researchers can successfully convert photons into electrons by determining the wavelengths of light that the dye can absorb by evaluating the absorption spectra. Quantifying the quantity of dye adsorbed onto the semiconductor photoanode of the dye-sensitized solar cell (DSSC) may be achieved using UV-Vis spectroscopy. In order to achieve this, a calibration curve that links the dye solution’s absorbance at a particular wavelength to its concentration is frequently used [27]. The quantity of dye deposited onto the surface may be determined by researchers by measuring the absorbance of the dye solution both before and after adsorption onto the photoanode. The long-term performance of the DSSC may be impacted by changes in the absorption spectra over time, which may point to dye degradation or photochemical processes. Modifications in the absorption spectrum may indicate adjustments made to the solar cell’s charge transfer mechanisms, electron injection efficiency, or recombination kinetics [28]. The optical properties of the thin films were determined using a UV/VIS spectrophotometer from Thermo Fisher Scientific Company (Waltham, MA, USA), model Evolution 220. The spectral range of the research was in the range of 300–900 nm.
Figure 6 displays the transmittance of pure FTO (purple), FTO-Al2O3 100 cycles (blue), FTO-Al2O3 200 cycles (orange) and FTO-Al2O3 300 cycles (green). Observing the patterns of each graph, they all look similar and take the same shape. However, the FTO-Al2O3 samples show different transmittance intensities as compared to the pure FTO sample. The pure FTO sample showed the highest intensity at approximately 550nm and 65% of transmittance, while FTO-Al2O3 samples exhibited the highest intensity around 750nm and 62% of transmittance. The absorption wavelength intensities are improved with the ALD deposition of Al2O3 while maintaining the transmittance range. These analyses show that FTO-Al2O3 DSSCs have a normal transmittance spectrum despite the number of cycles that were performed in this work. The normal absorption spectra for such DSSCs are usually 400-800nm [29]. The FTO-Al2O3 samples display an above average absorbance of light rays as compared to pure FTO samples because light can also be scattered inside the DSSC structure by the Al2O3 nanoparticles. Several interactions between light and the dye molecules or the semiconductor surface are encouraged by light scattering, which lengthens the incident photons’ optical path within the apparatus. As a result of this improved interaction, the solar cell’s total capacity to gather light is raised, as well as light absorption and photon-to-electron conversion efficiency.

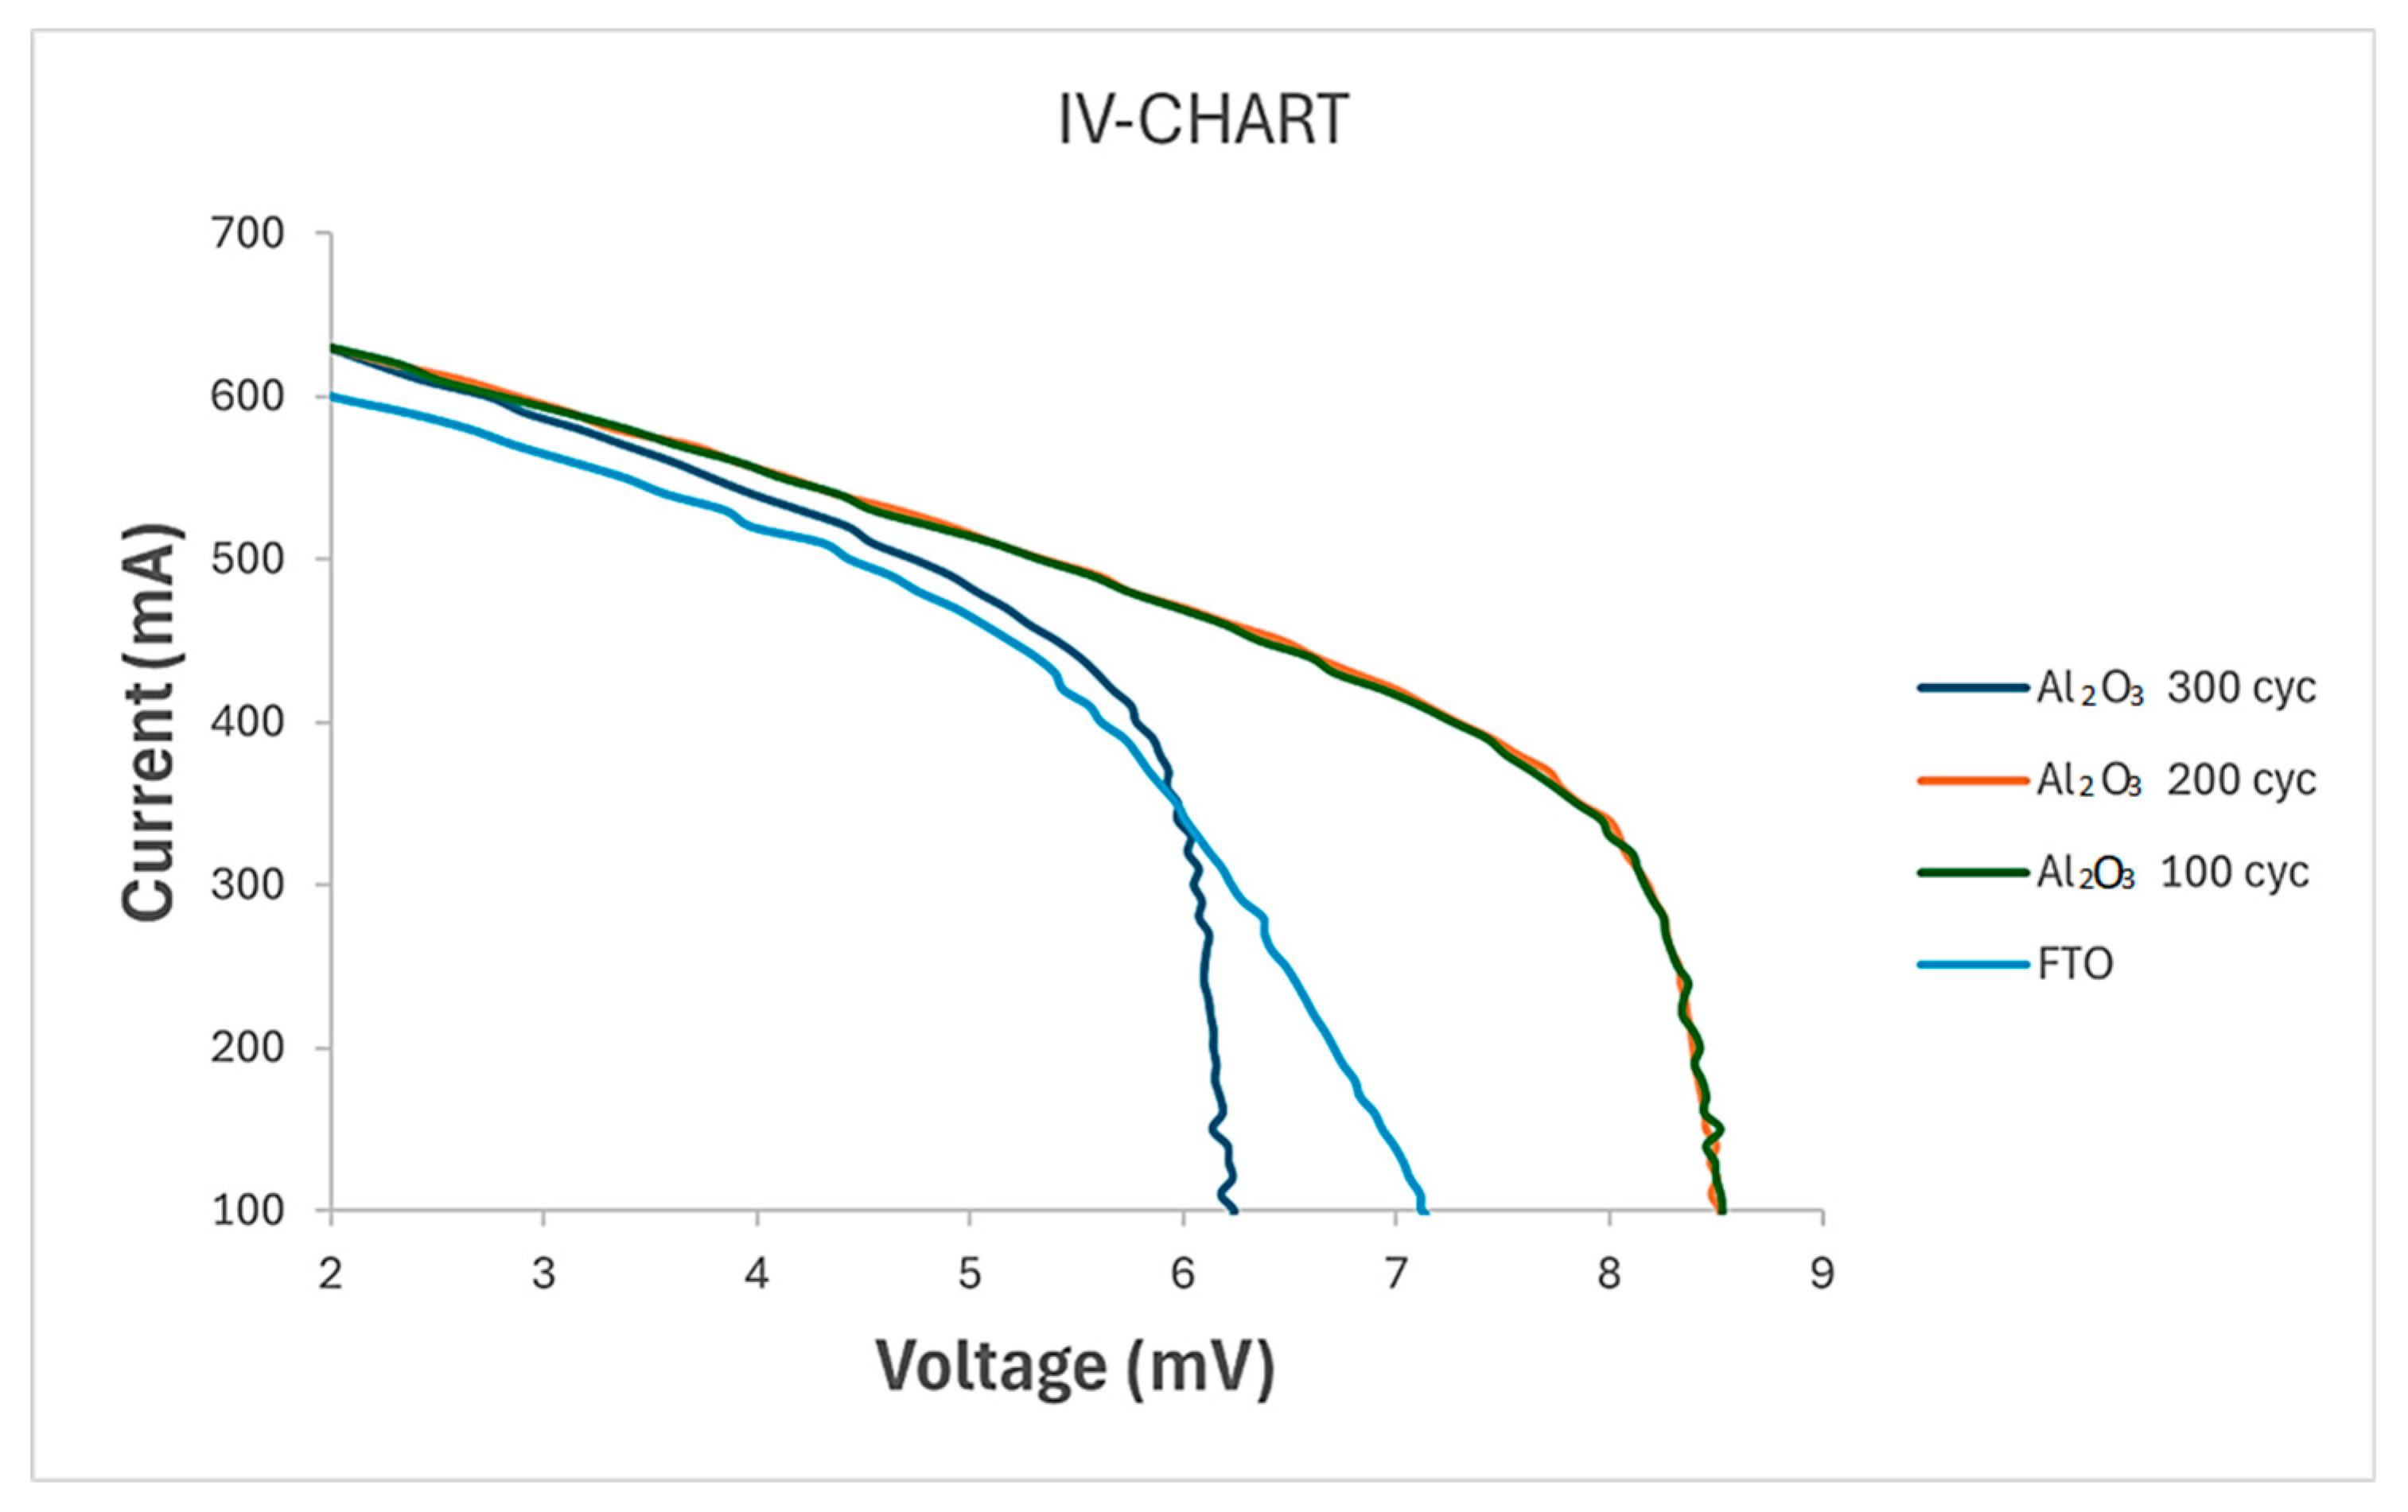
3.3. Solar Simulation Analysis and Electrical Performance

One of the most important tools for simulating sunshine in the lab is a solar simulator. Usually, it is made up of filters, optics, and a light source to create a spectrum distribution like that of sunshine. Researchers may repeatably test DSSCs under controlled settings by adjusting factors including intensity, spectrum, and irradiance uniformity using solar simulators. I–V measurements, which entail varying the external bias voltage across the device and measuring the resultant photocurrent, are carried out on DSSCs using solar simulators. This gives important details on the performance parameters of the device, such as the total power conversion efficiency (PCE), fill factor (FF), short-circuit current density (Isc), and open-circuit voltage (Voc). This allows researchers to obtain insight into the light-harvesting capabilities and spectral sensitization efficiency of the device. Under simulated sunlight exposure, the long-term stability and endurance of DSSCs may also be evaluated using solar simulation analysis [30]. The electrical parameters of the manufactured DSSCs were characterized by measurements of current–voltage (I–V) characteristics using a Solar Cell I–V Tracer System (PV Test Solutions Tadeusz Zdanowicz, Wrocław, Poland) and a Keithley 2400 source meter (Tektronix, Beaverton, OR, USA) under standard AM 1.5 radiation and a light intensity of 1000 W/m2, according to the European standard IEC 61853-1. The intensity of incident light was calibrated by the National Renewable Energy Laboratory NREL-certified silicon reference cell equipped with a KG3 filter.
Figure 7 shows the IV behavior of pure FTO (light blue), FTO-Al2O3 100 (green), FTO-Al2O3 200 (orange), and FTO-Al2O3 300 (deep blue). The obtained results and parameters seen in Figure 7 and Table 2 display the IV curves and efficiencies of each sample. From Figure 7, it can be observed that both green and orange graphs are almost similar, with FTO-Al2O3 200 cycles slightly greater. This can be further proven by Table 2, where 8.594 mA and 8.629 mA were recorded for FTO-Al2O3 100 cycles and FTO-Al2O3 200 cycles, respectively. These results can be because Al2O3 can help the DSSC move charges more efficiently. By serving as electron highways, they can minimize recombination losses by facilitating the rapid movement of produced electrons toward the electrode. In solar modeling, this enhanced charge movement may result in increased conversion efficiency [31]. Coatings with Al2O3 have the potential to inhibit charge recombination, a process in which produced electrons and holes join again before reaching their respective electrodes. Under solar simulation circumstances, Al2O3 coatings can enhance the overall efficiency of the DSSCs by mitigating recombination losses; as can be seen, FTO-Al2O3 200 cycles have the highest efficiency of 4.31%. However, FTO-Al2O3 300 cycles had a lower efficiency of 3.87%, with the voltage abruptly halting at 6.2 mV; this is due to the fact that surface recombination rates at the interface between the Al2O3 and the semiconductor (TiO2) can be increased by a thicker coating of Al2O3, which lowers the open-circuit voltage to the external circuit [32].
In order to describe the electrical characteristics of conductive substrates and thin films, such as those utilized in dye-sensitized solar cells (DSSCs), sheet resistance analysis is a method frequently employed. To determine if these substrates are suitable for fabricating DSSCs, sheet resistance analysis was utilized to test the electrical conductivity of these materials both before and after the active layers were deposited. A quantitative assessment of the electrical resistance of the TCO layer placed on the substrate is possible by sheet resistance analysis. Better electrical conductivity is shown by a reduced sheet resistance, and this is necessary for effective charge transfer inside the DSSC. Sheet resistance variations across the electrode surface might be a sign of coating thickness variations or other flaws that could affect the operation of the device. The electrical characteristics of the conductive layers in DSSCs may be improved with the use of sheet resistance analysis by methodically adjusting deposition parameters such as film thickness, deposition method, and post-treatment procedures. The goal of this optimization is to improve the overall performance of the device by minimizing resistance losses and maximizing charge-collecting efficiency. Indicators of device deterioration or failure mechanisms in DSSCs can be seen in changes in sheet resistance over time. Delamination of layers, electrode corrosion, or degradation of the conductive coatings as a result of operating for an extended period of time are some of the causes of increased resistance [33]. The sheet resistance of the manufactured DSSCs was characterized by the Ossila Four Point Probe that operated between a sheet resistant range of 100 mΩ and 10 MΩ.
As discussed above, the semiconductor material surfaces are passivated by the Al2O3. By forming a thin insulating layer, passivation lowers the amount of charge carriers (electrons and holes) that recombine on the surface. Al2O3 reduces charge carrier losses and passivates the surface, which enhances the semiconductor layer’s conductivity. As seen in Table 3 this can explain why FTO-Al2O3 200 cycles exhibit the lowest sheet resistance and resistivity of 7.6176 Ω/sq and 761.176 nΩ.m, respectively. It also has the highest conductivity of 1.3127 MS/m because 200 cycles seem to form the perfectly thin insulating film that reduces the number of electrons and holes that recombine at the surface. Al2O3 300 cycles do not have a higher conductivity or performance because the film formed is too thick and resists the flow of electrons in the dye-sensitized solar cell.

4. Conclusions

The 3D AFM results proved that there was little to no difference in microstructure between samples with and without Al2O3 due to the very distinctive crystalline structure of FTO and how thin the ALD-deposited Al2O3 layers are. The SEM and EDS analysis showed the successful deposition of Al2O3 layers by showing the atomic percentage and weight percentage of Al increased by 2.1% and 1.6%, respectively, after the ALD deposition of Al2O3. FTO-Al2O3 samples exhibited the highest intensity around 750nm and 62% of transmittance, which was an improvement when compared to pure FTO displaying the highest intensity at approximately 550nm and 65% of transmittance. Particularly in the context of solar simulation, aluminum oxide (also known as Al2O3) has been seen to have a major impact on the performance of dye-sensitized solar cells (DSSCs), with Al2O3 coatings having overall efficiency by mitigating recombination losses, as FTO-Al2O3 200 cycles have the highest efficiency of 4.31%. FTO-Al2O3 200 cycles exhibited the lowest sheet resistance and resistivity of 7.6176 Ω/sq and 761.176 nΩ.m, respectively. Due to their improved ability to scatter and trap light inside the device, Al2O3 coatings can also improve light harvesting in DSSCs. In the process, the photosensitive dye may absorb more light, increasing the solar cell’s total efficiency in the simulation. Effective charge transfer inside the DSSC might be aided by Al2O3 coatings. They have the ability to function as electron highways, facilitating the rapid movement of produced electrons toward the electrode and thereby mitigating recombination losses.
Despite all these positive impacts of Al2O3, the number of cycles of deposition via ALD can be damaging. FTO-Al2O3 300 cycles resulted in a lower efficiency of 3.87%.
This is due to the fact that Al2O3 acts as both a passivator and insulator in photoanode; hence, an unfavorable thickness or number of cycles can reduce the improvements that have been seen in FTO-Al2O3 200 cycles even in the presence of the same temperature and environmental conditions. The appropriate cycles should be 200 in order to achieve efficient performance. Further work can be conducted between 100 and 200 cycles to determine if there is a more appropriate cycle within those initial studied cycles.

Author Contributions

Conceptualization, E.A.A. and M.S.; methodology, E.A.A., K.M. and M.F; validation, E.A.A., W.S., M.F. and K.M.; formal analysis, E.A.A.; investigation, E.A.A.; resources, M.S.; data curation, E.A.A.; writing—original draft preparation, E.A.A.; writing—review and editing, M.S.; supervision, W.S. All authors have read and agreed to the published version of the manuscript.

Funding

This research received no external funding.

Institutional Review Board Statement

Not applicable.

Informed Consent Statement

Not applicable.

Data Availability Statement

Data are contained within this article.

Conflicts of Interest

The authors declare no conflicts of interest.

Abbreviations

The following abbreviations are used in this manuscript:
Al2O3Aluminum oxide
ALDAtomic layer deposition
DSSCsDye-sensitized solar cells
FTOFluorine Tin Oxide
IPAIsopropyl alcohol
PtPlatinum
TBA+Tetrabutylammonium ions
TCOsTransparent Conducting Oxides
TiO2Titanium dioxide
TMATrimethylaluminum

References

  1. Kumavat, P.P.; Sonar, P.; Dalal, D.S. An Overview on Basics of Organic and Dye Sensitized Solar Cells, Their Mechanism and Recent Improvements. Renew. Sustain. Energy Rev. 2017, 78, 1262–1287. [Google Scholar] [CrossRef]
  2. Grätzel, M. Dye-Sensitized Solar Cells. J. Photochem. Photobiol. C Photochem. Rev. 2003, 4, 145–153. [Google Scholar] [CrossRef]
  3. O’Regan, B.; Grätzel, M. A Low-Cost, High-Efficiency Solar Cell Based on Dye-Sensitized Colloidal TiO2 Films. Nature 1991, 353, 737–740. [Google Scholar] [CrossRef]
  4. McConnell, R.D. Assessment of the Dye-Sensitized Solar Cell. Renew. Sustain. Energy Rev. 2002, 6, 271–293. [Google Scholar] [CrossRef]
  5. Mehmood, U.; Rahman, S.; Harrabi, K.; Hussein, I.; Reddy, B. Recent Advances in Dye Sensitized Solar Cells. Adv. Mater. Sci. Eng. 2014, 2014, 974782. [Google Scholar] [CrossRef]
  6. Sci, A.; Tsegaye, A.; Demiss, S. Review on Dye-Sensitized Solar Cells (DSSCs). Appl. Sci. 2018, 2, 130. [Google Scholar] [CrossRef]
  7. Grant, F.A. Properties of Rutile (Titanium Dioxide). Rev. Mod. Phys. 1959, 31, 646–674. [Google Scholar] [CrossRef]
  8. Kalyanasundaram, K.; Grätzel, M. Heterogeneous Photocatalysis with Semiconductor Particulate Systems. In Chemistry and Physics of Solid Surfaces V; Vanselow, R., Howe, R., Eds.; Springer: Berlin/Heidelberg, Germany, 1984; pp. 111–139. ISBN 978-3-642-82253-7. [Google Scholar]
  9. Oskam, G.; Bergeron, B.; Meyer, G.; Searson, P. Pseudohalogens for Dye-Sensitized TiO2 Photoelectrochemical Cells. J. Phys. Chem. B 2001, 105, 6867–6873. [Google Scholar] [CrossRef]
  10. Nusbaumer, H.; Moser, J.-E.; Zakeeruddin, S.; Nazeeruddin, M.; Graetzel, M. Co II (Dbbip)22+ Complex Rivals Triiodide/Iodide Redox Mediator in Dye-Sensitized Photovoltaic Cells. J. Phys. Chem. B 2001, 105, 10461–10464. [Google Scholar] [CrossRef]
  11. Gao, F.; Wang, Y.; Shi, D.; Zhang, J.; Wang, M.; Jing, X.; Humphry-Baker, R.; Wang, P.; Zakeeruddin, S.M.; Grätzel, M. Enhance the Optical Absorptivity of Nanocrystalline TiO2 Film with High Molar Extinction Coefficient Ruthenium Sensitizers for High Performance Dye-Sensitized Solar Cells. J. Am. Chem. Soc. 2008, 130, 10720–10728. [Google Scholar] [CrossRef]
  12. Wisz, G.; Sawicka-Chudy, P.; Sibiński, M.; Yavorskyi, R.; Łabuz, M.; Płoch, D.; Bester, M. Formation and Characterization of Stable TiO2/CuxO-Based Solar Cells. J. Mater. 2023, 16, 5683. [Google Scholar] [CrossRef] [PubMed]
  13. Chavan, G.T.; Kim, Y.; Khokhar, M.Q.; Hussain, S.Q.; Cho, E.-C.; Yi, J.; Ahmad, Z.; Rosaiah, P.; Jeon, C.-W. A Brief Review of Transparent Conducting Oxides (TCO): The Influence of Different Deposition Techniques on the Efficiency of Solar Cells. Nanomaterials 2023, 13, 1226. [Google Scholar] [CrossRef] [PubMed]
  14. Miettunen, K.; Asghar, I.; Mastroianni, S.; Halme, J.; Barnes, P.R.F.; Rikkinen, E.; O’Regan, B.C.; Lund, P. Effect of Molecular Filtering and Electrolyte Composition on the Spatial Variation in Performance of Dye Solar Cells. J. Electroanal. Chem. 2012, 664, 63–72. [Google Scholar] [CrossRef]
  15. Kasimakhunova, A.M.; Olimov, S.A.; Nurdinova, R.; Iqbal, T.; Mamadalieva, L.K. Highly Efficient Conversion of Solar Energy by the Photoelectric Converter and a Thermoelectric Converter. J. Appl. Math. Phys. 2018, 06, 520–529. [Google Scholar] [CrossRef]
  16. Graetzel, M.; Moser, J.-E. Solar Energy Conversion. In Electron Transfer in Chemistry; Wiley-VCH: Weiheim, Germany, 2008; pp. 588–644. ISBN 978-3-527-61824-8. [Google Scholar]
  17. Nazeeruddin, M.K.; Kay, A.; Rodicio, I.; Humphry-Baker, R.; Mueller, E.; Liska, P.; Vlachopoulos, N.; Graetzel, M. Conversion of Light to Electricity by Cis-X2bis(2,2′-Bipyridyl-4,4′-Dicarboxylate)Ruthenium(II) Charge-Transfer Sensitizers (X = Cl-, Br-, I-, CN-, and SCN-) on Nanocrystalline Titanium Dioxide Electrodes. J. Am. Chem. Soc. 1993, 115, 6382–6390. [Google Scholar] [CrossRef]
  18. Fung, A.K.M.; Chiu, B.K.W.; Lam, M.H.W. Surface Modification of TiO2 by a Ruthenium(II) Polypyridyl Complex via Silyl-Linkage for the Sensitized Photocatalytic Degradation of Carbon Tetrachloride by Visible Irradiation. Water Res. 2003, 37, 1939–1947. [Google Scholar] [CrossRef]
  19. Wang, P.; Zakeeruddin, S.M.; Moser, J.E.; Nazeeruddin, M.K.; Sekiguchi, T.; Grätzel, M. A Stable Quasi-Solid-State Dye-Sensitized Solar Cell with an Amphiphilic Ruthenium Sensitizer and Polymer Gel Electrolyte. Nat. Mater. 2003, 2, 402–407. [Google Scholar] [CrossRef] [PubMed]
  20. Senthil, T.S. Effect of Surface Morphology on the Performance of Natural Dye Sensitized TiO2 Thin Film Solar Cell. Adv. Mater. Res. 2013, 678, 326–330. [Google Scholar] [CrossRef]
  21. Eftekhari, L.; Ghasemi, M. Analysing the Surface Morphology of Annealed FTO/ZnS Bilayer Films: Stereometric, Fractal, and Wettability Approaches. Sci. Rep. 2024, 14, 14262. [Google Scholar] [CrossRef]
  22. Abedi, H.R.; Hoseinpour Gollo, M. An Experimental Study of the Effects of Surface Roughness and Coating of Cr2O3 Layer on the Laser-Forming Process. Opt. Laser Technol. 2019, 109, 336–347. [Google Scholar] [CrossRef]
  23. Kim, H.-J.; Kim, D.-E. Effect of Surface Roughness of Top Cover Layer on the Efficiency of Dye-Sensitized Solar Cell. Sol. Energy 2012, 86, 2049–2055. [Google Scholar] [CrossRef]
  24. Optical Scattering and Surface Roughness—Eckhardt Optics. Available online: https://www.eckop.com/resources/scatterometer-resources/optical-scattering-versus-surface-roughness/ (accessed on 28 May 2024).
  25. Lee, K.-M.; Suryanarayanan, V.; Ho, K.-C. The Influence of Surface Morphology of TiO2 Coating on the Performance of Dye-Sensitized Solar Cells. Sol. Energy Mater. Sol. Cells 2006, 90, 2398–2404. [Google Scholar] [CrossRef]
  26. Tseng, T.-L.; Konada, U.; Kwon, Y. A Novel Approach to Predict Surface Roughness in Machining Operations Using Fuzzy Set Theory. J. Comput. Des. Eng. 2016, 3, 1–13. [Google Scholar] [CrossRef]
  27. Xu, Q.; Liu, F.; Meng, W.; Huang, Y. Plasmonic Nanoparticles Enhanced Dye-Sensitized Solar Cells. In Proceedings of the SPIE Micro+Nano Materials, Devices, and Applications, Devices, VIC, Australia, 8–11 December 2013; SPIE—The International Society for Optical Engineering: Bellingham, WA, USA, 2013; Volume 8923. [Google Scholar] [CrossRef]
  28. Yang, R.-Y.; Chen, H.-Y.; Lai, F.-D. Performance Degradation of Dye-Sensitized Solar Cells Induced by Electrolytes. Adv. Mater. Sci. Eng. 2012, 902146. [Google Scholar] [CrossRef]
  29. Lee, J.S.; Kim, K.H.; Kim, C.S.; Choi, H.W. Achieving Enhanced Dye-Sensitized Solar Cell Performance by TiCl4/Al2O3 Doped TiO2 Nanotube Array Photoelectrodes. J. Nanomater. 2015, 2015, e545818. [Google Scholar] [CrossRef]
  30. Zhang, H.; Banfield, J. Understanding Polymorphic Phase Transformation Behavior During Growth of Nanocrystalline Aggregates: Insights from TiO2. J. Phys. Chem. B 2000, 104, 3481–3487. [Google Scholar] [CrossRef]
  31. Ren, F. Alumina Coatings on Fluorine-Doped Tin Oxide Titanium Dioxide as Photoanode for Dye-Sensitized Solar Cells. Electrochim. Acta 2015, 173, 534–539. [Google Scholar]
  32. Roelofs, K.; Brennan, T.; Dominguez, J.; Bailie, C.; Margulis, G.; Hoke, E.; Mcgehee, M.; Bent, S. Effect of Al2O3 Recombination Barrier Layers Deposited by Atomic Layer Deposition in Solid-State CdS Quantum Dot-Sensitized Solar Cells. J. Phys. Chem. C 2013, 117, 5584–5592. [Google Scholar] [CrossRef]
  33. Wu, M.-S.; Tsai, C.-H.; Jow, J.-J.; Wei, T. Enhanced Performance of Dye-Sensitized Solar Cell via Surface Modification of Mesoporous TiO2 Photoanode with Electrodeposited Thin TiO2 Layer. Electrochim. Acta 2011, 56, 8906–8911. [Google Scholar] [CrossRef]
Figure 1. (a) Illustration of the complete procedure for fabricating the dye-sensitized solar cells; (b) illustration of the components of the FTO-Al2O3 dye dye-sensitized solar cells.
Coatings 14 01019 g001
Figure 2. Surface morphology analysis: (a) pure FTO on glass 2 × 2; (b) FTO-Al2O3 on glass 100 cycles 2 × 2; (c) FTO-Al2O3 on glass 200 cycles 2 × 2; (d) FTO-Al2O3 on glass 300 cycles 2 × 2.
Coatings 14 01019 g002
Figure 3. (a) 3D topography of pure FTO; (b) 3D topography of FTO-Al2O3 (100 cycles); (c) 3D topography of FTO-Al2O3 (200 cycles); (d) 3D topography of FTO-Al2O3 (300 cycles).
Coatings 14 01019 g003
Figure 4. SEM images of (a) pure FTO (25× 1000×); (b) pure FTO (50× 1000×); (c) pure FTO (100× 1000×); (d) FTO-Al2O3 100 cycles (25× 1000×); (e) FTO-Al2O3 100 cycles (60× 1000×); (f) FTO-Al2O3 100 cycles (150× 1000×); (g) FTO-Al2O3 200 cycles (25× 1000×); (h) FTO-Al2O3 200 cycles (50× 1000×); (i) FTO-Al2O3 200 cycles (100× 1000×); (j) FTO-Al2O3 300 cycles (25× 1000×); (k) FTO-Al2O3 300 cycles (50× 1000×); (l) FTO-Al2O3 300 cycles (150× 1000×).
Coatings 14 01019 g004
Figure 5. (a) Element count in pure FTO; (b) element count in FTO-Al2O3 300 cycles.
Coatings 14 01019 g005
Figure 6. Transmittance graph of pure FTO, FTO-Al2O3 100 cycles, FTO-Al2O3 200 cycles and FTO-Al2O3 300 cycles.
Coatings 14 01019 g006
Figure 7. Solar simulation of pure FTO, FTO-Al2O3 100 cycles FTO-Al2O3 200 cycles, and FTO-Al2O3 300 cycles dye-sensitized solar cells.
Coatings 14 01019 g007
Table 1. Measured roughness parameters.
Region Whole (µm)Max (nm)Min (nm)Rq (nm)Ra (nm)
Pure FTO (2x2)17.42−3.061.650.97
FTO-Al2O3 100 cycles 2x2125.30−114.5141.1633.98
FTO-Al2O3 200 cycles 2x2122.55−114.2141.5434.26
FTO-Al2O3 300 cycles 2x2115.02−95.6730.5823.92
Table 2. Measured solar simulation parameters and efficiencies.
SampleIsc (mA)Voc
(mV)
Imax
(mA)
Vmax (mV)Pmax (mW)FF (-)Efficiency (%)
Pure FTO 7.604629.9995.203447.2782.3270.493.43
FTO-Al2O3 100 cycles8.594629.6226.988416.9572.9140.544.27
FTO-Al2O3 200 cycles8.629629.6187.017418.2492.9350.544.31
FTO-Al2O3 300 cycles6.382630.0255.317457.9632.4350.613.87
Table 3. Sheet resistance values.
SampleSheet Resistance (Ω/sq)Resistivity
(nΩ.m)
Conductivity
(MS/m)
Outer Probe Voltage (mV)Outer Probe Current (mA) Inner Probe Voltage (mV)
Pure FTO 8.0078800.781.2488−486.49−12.134−21.84
FTO-Al2O3 100 cycles8.0243802.431.2464−487.65−11.051−19.931
FTO-Al2O3 200 cycles7.6176761.1761.3127−284.73−13.61−23.302
FTO-Al2O3 300 cycles8.0300803.001.2453−386.64−11.971−21.606
Disclaimer/Publisher’s Note: The statements, opinions and data contained in all publications are solely those of the individual author(s) and contributor(s) and not of MDPI and/or the editor(s). MDPI and/or the editor(s) disclaim responsibility for any injury to people or property resulting from any ideas, methods, instructions or products referred to in the content.

