Article

Effect of Sulfuric Acid Immersion on Electrical Insulation and Surface Composition of Amorphous Carbon Films

1
Department of Electrical and Electronic Engineering, Faculty of Engineering, Tokyo Denki University, 5 Senju Asahi-cho, Adachi-ku, Tokyo 120-8551, Japan
2
Nanotec Corporation, Nanotechno-Plaza, 4-6, Kashiwa-Inter-Minami, Kashiwa City 277-0874, Chiba, Japan
*
Authors to whom correspondence should be addressed.
Coatings 2024, 14(8), 1023; https://doi.org/10.3390/coatings14081023
Submission received: 22 July 2024 / Revised: 8 August 2024 / Accepted: 10 August 2024 / Published: 12 August 2024
(This article belongs to the Special Issue Thin Films and Coatings for Energy Storage and Conversion)

Abstract

:
Sulfuric acid is a concern for contacts within electronic devices, and the application of amorphous carbon films as thin electrical insulating coatings for small coils requires full investigation of its effects. Five types of amorphous carbon films were fabricated on Si substrates under different deposition conditions using vacuum coating systems. Based on their optical constants (ISO 23216:2021(E)), the films were classified into three types: hydrogenated amorphous carbon (a-C:H), polymer-like carbon (PLC), and graphite-like carbon (GLC). The structure, surface composition, and electrical insulation properties of the films were evaluated before and after immersion in sulfuric acid. Although the PLC and a-C:H showed progression of surface oxidation due to sulfuric acid immersion, none showed obvious changes in their structure or DC dielectric breakdown field strength due to sulfuric acid immersion, proving their stability. Furthermore, the PLC and a-C:H, which had a relatively low extinction coefficient, exhibited excellent insulation properties. Our results suggest that amorphous carbon films can be useful as thin insulating films for small coils that may come in contact with sulfuric acid. Our study offers a valuable tool for general users in the industry to facilitate selection of electrical insulating amorphous carbon films based on optical constants, such as extinction coefficients.

1. Introduction

Amorphous carbon films containing diamond-like carbon have amorphous molecular structures with sp2 and sp3 hybridization of carbon and hydrogen bonds. These film structures can be controlled by adjusting the deposition method and conditions, affording various properties [1]. For example, properties such as film hardness, wear resistance, electrical insulation, and chemical stability comparable to those of diamonds can be obtained [1,2]. Although this is very attractive from a product design perspective, it is difficult for general users in the industry to select an amorphous carbon film suitable for a particular application. Therefore, the classification of amorphous carbon films based on their different characteristics has long been considered [1]. In this study, we focused on the optical classification method (ISO 23216:2021(E)) [3], a method for classifying amorphous carbon films, and investigated the various properties of the classified amorphous carbon films [3,4,5]. The optical classification method can differentiate six film types with different characteristics based on the optical constants (refractive index and extinction coefficient) of the amorphous carbon film measured using a spectroscopic ellipsometer.
To satisfy the demand for thinner and more highly integrated electronic devices, such as smartphones and wearable devices, it is essential to miniaturize their components [6]. Coils (inductors) are components that have long been used in the industry as enamel-coated circular conductors with a thickness of several micrometers to several tens of micrometers; however, thinning of the insulation film has become an issue in downsizing coils [6]. Nakajima et al. investigated amorphous carbon film coatings as a thin insulating film to replace enamel coating, and evaluated their electrical insulation, chemical resistance, and mechanical properties. They revealed that amorphous carbon films can be thin and effective insulating film for coils [6]. However, previous studies are limited to amorphous carbon films prepared via radio frequency plasma chemical vapor deposition (RF-PECVD) without fully examining the effects of the various film types (film structures), with the guidelines for using amorphous carbon films in relevant applications being unclear. In general, acidic solutions such as sulfuric acid oxidize material surfaces [7,8]. Under the operating environment of electronic equipment, it is possible that sulfuric acid may come in contact with the material surface, possibly causing surface oxidization of the thin amorphous carbon film, thus leading to changes in its electrical insulation properties. Even though no significant differences in film structure or film hardness have been reported with respect to sulfuric acid resistance of amorphous carbon films, no reports exist on the effects of sulfuric acid immersion on their electrical insulation and surface properties [6]. Song et al. reported that the corrosion state of amorphous film carbon differs depending on the film structure (presence or absence of defects such as micropores, cracks, and denseness) in salt-spray tests, and it is considered extremely important to investigate whether the desired chemical resistance can be obtained for each deposition method and film type [9].
In this study, five types of amorphous carbon films were fabricated on Si substrates under different deposition conditions using various vacuum coating systems. The amorphous carbon films were classified using optical constants, and the effects of sulfuric acid immersion on the structure, surface properties, and electrical insulation of the amorphous carbon films were investigated before and after immersion. Understanding the electrical insulation properties and sulfuric acid resistance of these different amorphous carbon film types is extremely important for the application of amorphous carbon film coatings as insulating coatings for small coils. In addition, clarification of the relationship between the optical constants (optical classification method) of amorphous carbon films and their electrical insulating properties is expected to enable amorphous carbon film coatings with electrical insulating properties without mismatches by general users in the industry.

2. Materials and Methods

2.1. Deposition Conditions for Amorphous Carbon Films

In this experiment, five different amorphous carbon films were deposited on Si {100} substrates (4 inches) using various dry coating processes, including physical vapor deposition (PVD) and chemical vapor deposition (CVD). Specifically, radio-frequency plasma CVD (RF-PCVD), pulsed direct current plasma CVD (Pulsed DC-PCVD), ionized evaporation, and high-power impulse magnetron sputtering (HiPIMS) were employed [1,2,5]. To control the structure of the amorphous carbon films, the substrate bias voltage and target voltage were arbitrarily adjusted in addition to the type of deposition method used. The amorphous carbon samples were cut into small pieces of various sizes and subjected to various analyses. The deposition conditions are listed in Table 1. Figure 1 shows photographs of the five amorphous carbon samples deposited on the Si substrate together with a photograph of the Si substrate (non-deposited).

2.2. Spectroscopic Ellipsometric Analysis

A spectroscopic ellipsometer (SE; Auto SE, HORIBA Ltd., Kyoto, Japan) was used to evaluate the thickness and optical constants (refractive index (n) and extinction coefficient (k)) of the amorphous carbon films and the thickness of the optical surface roughness layer. During SE analysis, the angle of incidence was fixed at 70°, and the reflection amplitude ratio angle (ψ) and phase difference (Δ) were measured for s- and p-polarized light at wavelengths from 450 to 900 nm (photon energy 1.4 to 2.8 eV), respectively. Regression analysis was performed on the obtained SE spectra to reduce the chi–square (χ2). The typical measurement resolution for SE is 0.001 for the optical constant and 1 Å for the film thickness. The hypothetical thin-film multilayer model consists of three layers: a surface roughness layer/amorphous carbon film layer/substrate with an amorphous carbon film layer as in the Tauc–Lorentz model and an optical surface roughness layer as the effective medium approximation of the amorphous carbon film layer (50%) and air layer (50%) [4]. The five amorphous carbon film types fabricated in this study were classified according to ISO 23216:2021(E) [3].

2.3. Sulfuric Acid Immersion Conditions

Sulfuric acid is commonly used as an electrolyte in batteries. In this experiment, sulfuric acid (H2SO4, FUJIFILM Wako Pure Chemical Corporation, Osaka, Japan) of 37.4% purity was used. Each sample was immersed in sulfuric acid for 24 h at 27 °C in a constant-temperature drying oven (ETTAS ONW-300S, AS ONE Corporation, Osaka, Japan). After immersion, each sample was rinsed with ion-exchanged water (TRUSCO NAKAYAMA CORPORATION, Tokyo, Japan) [6]. Ion-exchanged water is water in which anions and cations have been removed using ion-exchange resins (deionized water).

2.4. Surface Morphology Analysis

The surface morphology of amorphous carbon films before and after sulfuric acid immersion was observed using an atomic force microscope (AFM; SPM-5200, JEOL Ltd., Tokyo, Japan). In the AFM analysis, a root mean square (RMS) roughness of 1.5 × 1.5 μm2 was obtained by using the AC mode. The measurement points were changed three times, and the mean ± standard deviation was obtained.

2.5. Structural Analysis

The structures of the amorphous carbon films before and after immersion in sulfuric acid were confirmed using an inVia Raman microscope (Raman: inVia Qontor, Renishaw Plc., Wotton-under-Edge, UK) at a laser power of 3.75 mW, laser wavelength of 532 nm, exposure time of 1 s, and 10 cycles as the number of integrations. Amorphous carbon films have a characteristic Raman spectrum with a D peak (~1350 cm−1) owing to their disordered structure and a G peak (~1550 cm−1) owing to their graphite structure [1]. In this experiment, these two peaks were waveform and were separated using a Gaussian function to obtain their ID/IG intensity ratios and G peak positions [1].

2.6. Surface Composition Analysis

The surface compositions of the amorphous carbon films were analyzed before and after sulfuric acid immersion using X-ray photoelectron spectroscopy (XPS; ESCA3400, Shimadzu Ltd., Kyoto, Japan), employing a conical X-ray source (MgKα source, 10 mA, 10 kV) to analyze the carbon 1s (C1s) and oxygen 1s (O1s) spectra. The C1s spectrum was shift-corrected to exhibit its maximum peak at 284.6 eV and then normalized to have a maximum peak value set at 1. The O1s/C1s area ratio was obtained for these two peaks [4]. The C1s spectrum was waveform-separated into C–C sp2, C–C sp3, C–O, C=O, and O=C–O bonds, and the ratio of each bond area to the total area was calculated [4,10].

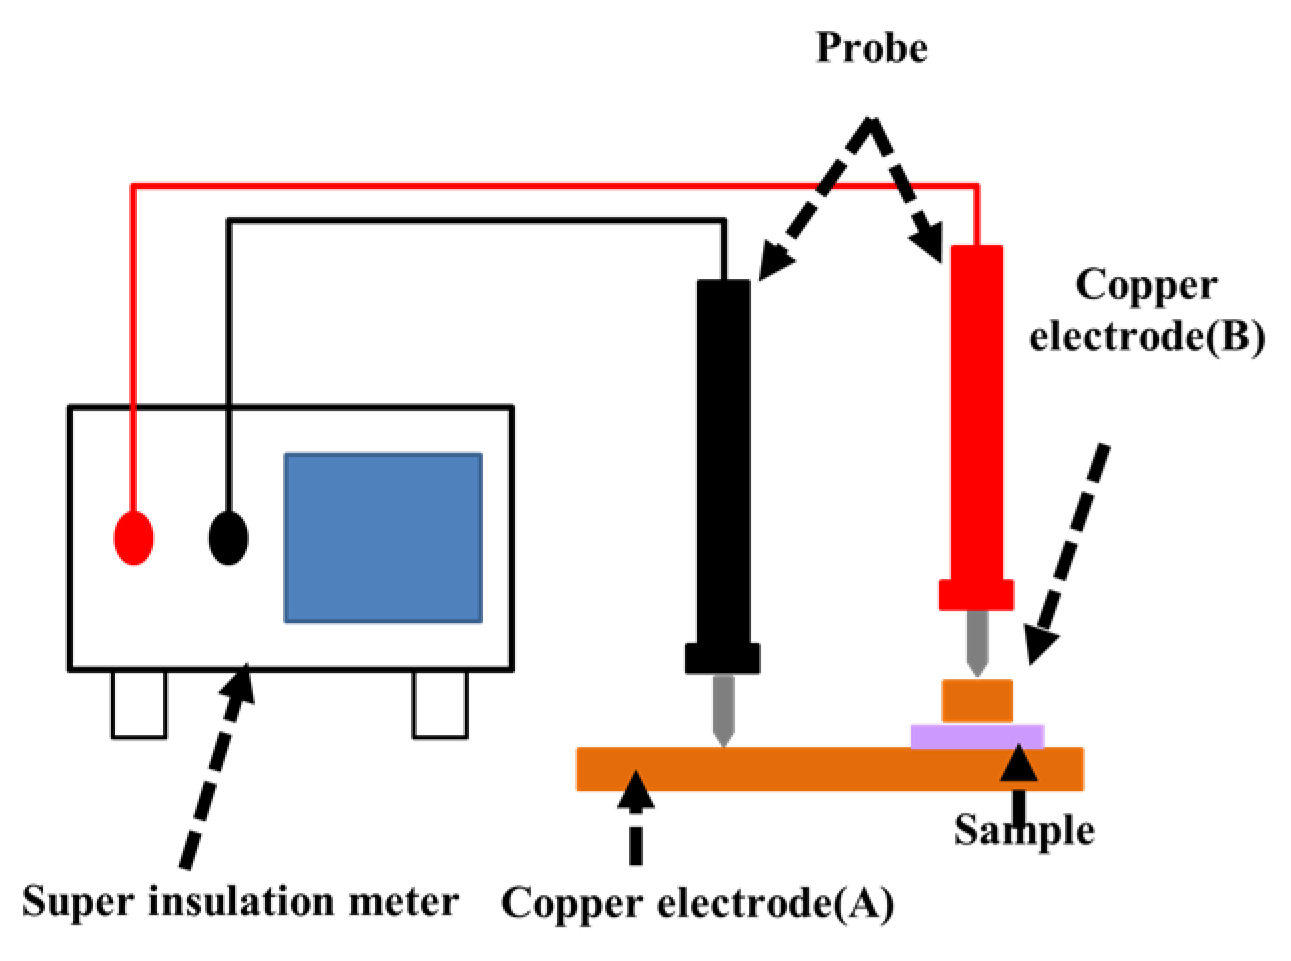
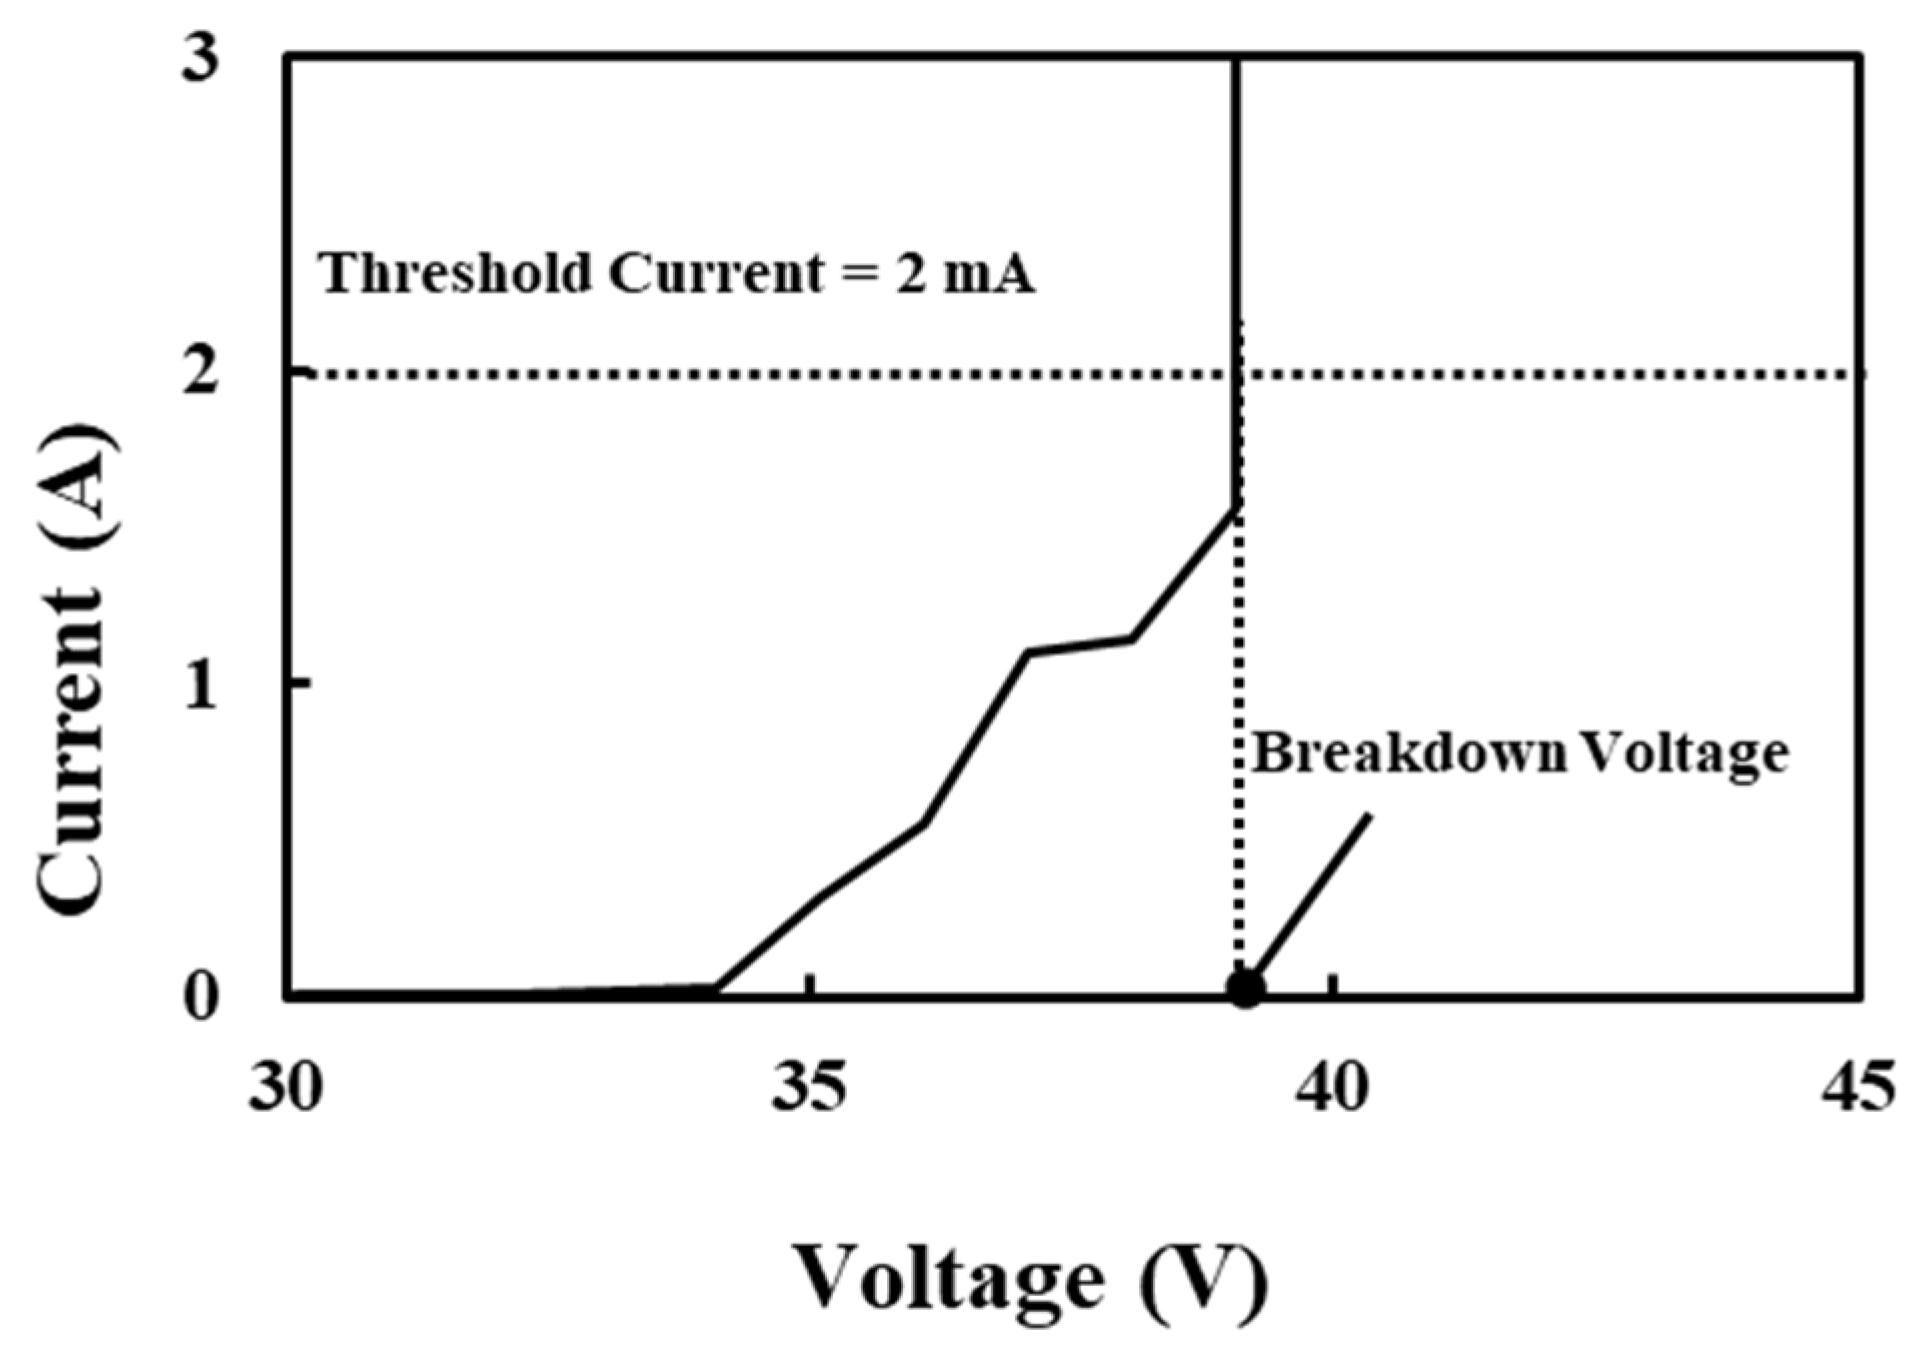
2.7. Electrical Insulation Evaluation

The electrical insulation properties of the amorphous carbon films were measured before and after sulfuric acid immersion using a super insulation meter (SM7100, HIOKI E.E. CORPORATION, Nagano, Japan) to determine their DC breakdown voltage (Figure 2) [6]. Each sample was placed on a 100 × 200 × 0.5 mm3 Cu electrode (A), and a DC voltage was applied between the sample and a 5 × 5 × 0.3 mm3 Cu electrode (B) surface was placed across it, with the voltage being increased at a constant rate (1 V/s). The voltage at which dielectric breakdown (overcurrent) occurred was recorded. In this experiment, the threshold current for the overcurrent was 2 mA. Figure 3 shows an example of the I–V characteristics during the electrical insulation evaluation. Furthermore, the DC breakdown field strength was obtained by dividing the obtained breakdown voltage by the film thickness. In general, the higher the DC breakdown voltage or DC breakdown field strength, the better the electrical insulation properties of the amorphous carbon film.

3. Results

3.1. Classification of Amorphous Carbon Films Based on Optical Constants

The film thickness, refractive index, extinction coefficient, and optical surface roughness of each amorphous carbon sample obtained via SE analysis are listed in Table 2. The optical constants were measured at 550 nm, as specified by ISO 23216:2021(E) [3]. Regression analysis of the SE spectra afforded a sufficiently small χ2 value, indicating accurate fitting [4].
The thickness of the five amorphous carbon samples ranged from 90 to 200 nm, indicating that the produced amorphous carbon films were sufficiently thin compared to current enamel films (several micrometers to several tens of micrometers). The thickness of the optical surface roughness layers was approximately 4–19 nm, exhibiting the same level of smoothness. The refractive indices and extinction coefficients of the optical constants of the amorphous carbon films ranged between 1.70–2.25 and 0.04–0.47, respectively, at a wavelength of 550 nm. The amorphous carbon samples were classified into three types according to ISO 23216:2021(E): hydrogenated amorphous carbon (a-C:H), polymer-like carbon (PLC), and graphite-like carbon (GLC) [3]. Three of the five amorphous carbon films were classified as GLC-type, denoted as GLC-A for sample 2, GLC-B for sample 4, and GLC-C for sample 5. Among these, GLC-B and GLC-C are hydrogen-free amorphous carbon films, meaning that they do not contain any hydrogen in the deposition material. In contrast, GLC-A contains hydrogen in the deposition material and is classified at the boundary between GLC and a-C:H. Therefore, although GLC-A is a GLC, it is considered to have a film structure similar to that of a-C:H. Among the amorphous carbon films, GLC is considered to have a film type with a relatively high sp2 content and low hydrogen content (<5 atm%), resulting in a relatively high extinction coefficient. In contrast, the PLC and a-C:H films have a relatively low sp2 content and high hydrogen content (50–70 atm% hydrogen content for PLC and 5–50 atm% hydrogen content for a-C:H) [2,11,12]. It is therefore suggested that the structures (especially the hydrogen content) of the three types of amorphous carbon films classified based on the optical constants are different from each other.

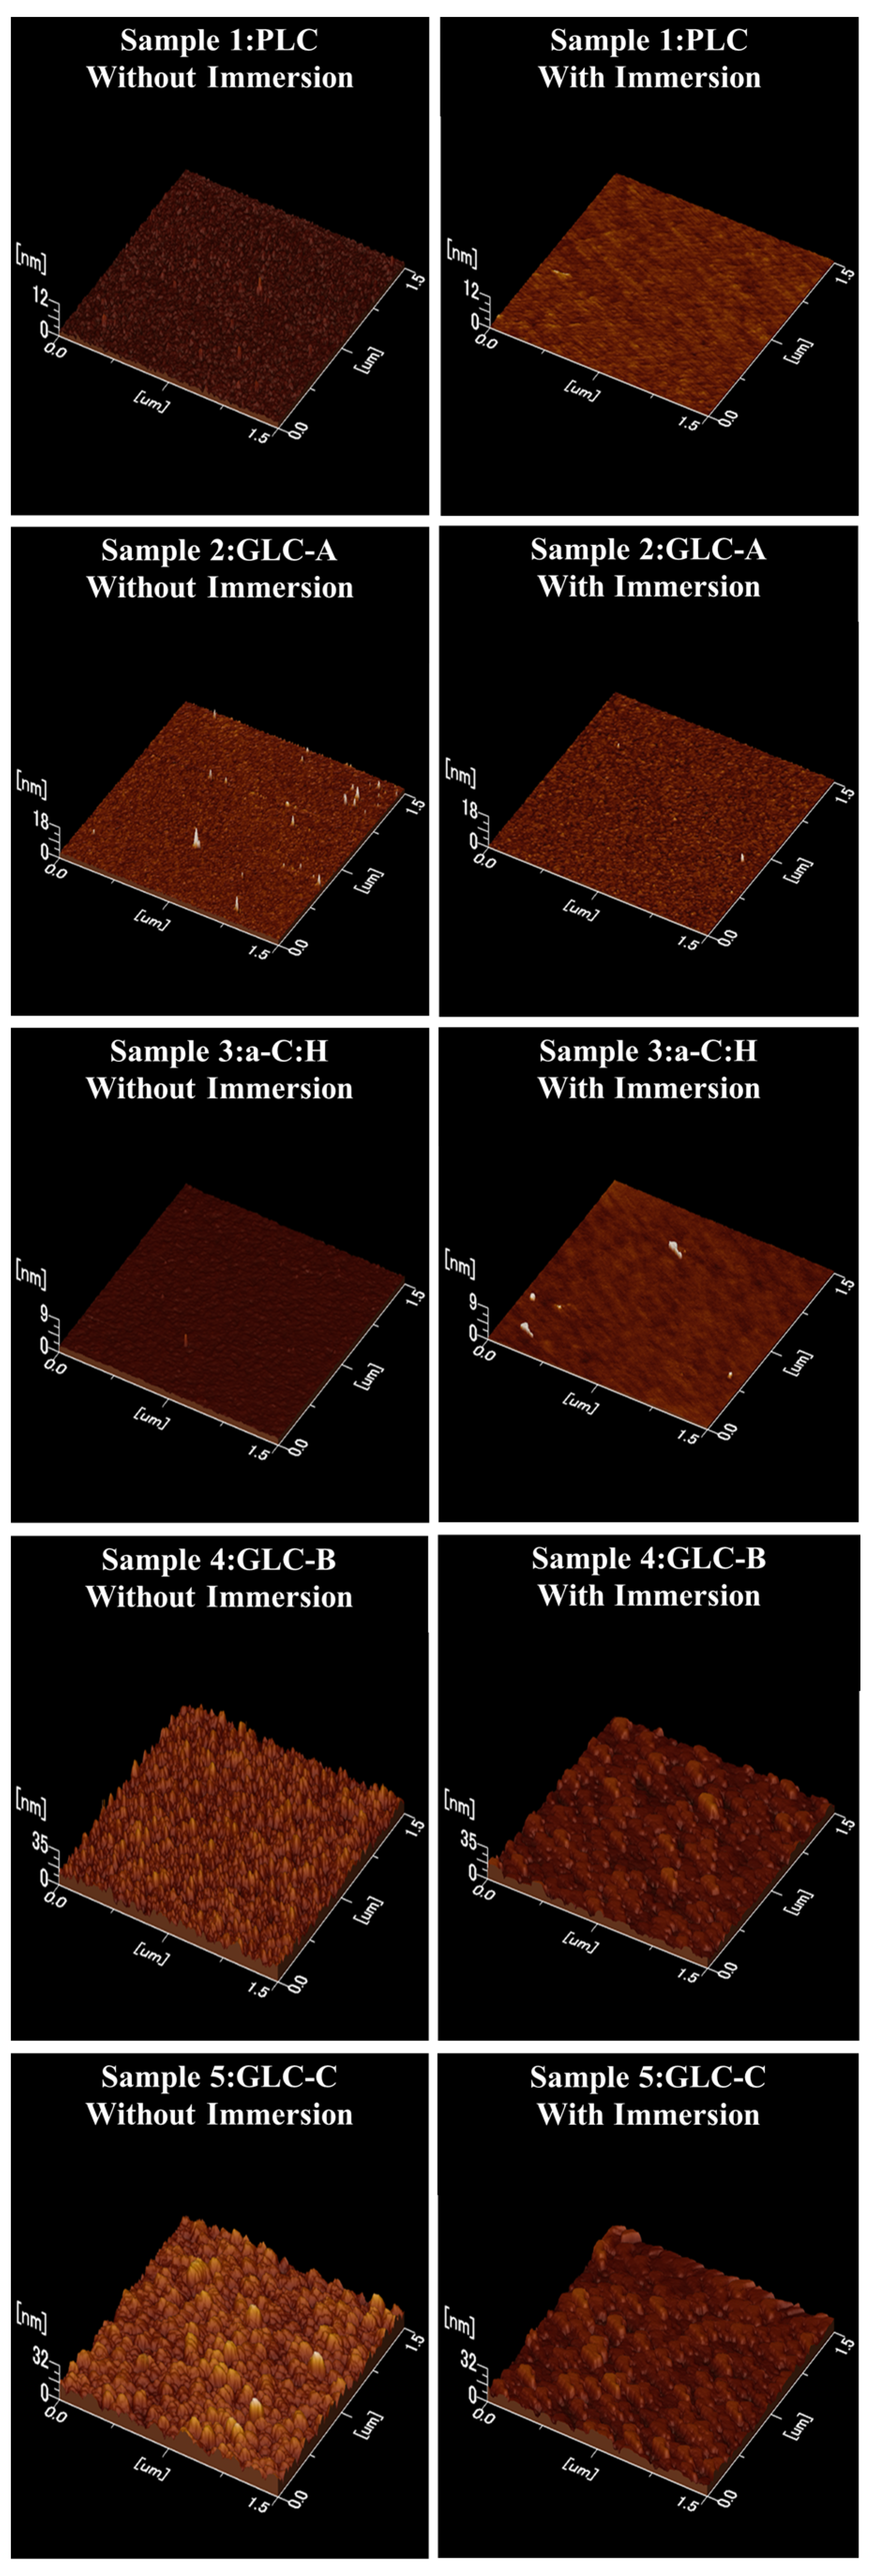
3.2. Surface Morphology of Amorphous Carbon before and after Sulfuric Acid Immersion

The amorphous carbon films after immersion in sulfuric acid were confirmed to be stable on the Si substrate with no film peeling. The surface morphology of each sample after immersion in sulfuric acid was confirmed by AFM analysis, and the AFM results are shown in Table 3 and Figure 4. The results show that the surface remained extremely smooth, although there was a slight smoothing tendency at the level of several nm before and after sulfuric acid immersion. In addition, no defects such as cracks or pinholes, were observed after sulfuric acid immersion, at least in the narrow measurement area of this experiment.

3.3. Effect of Sulfuric Acid Immersion on the Structure of Amorphous Carbon Films

The film structure of each amorphous carbon sample before and after sulfuric acid immersion was confirmed using Raman spectroscopy. The Gaussian fitting results of the Raman spectra are listed in Table 3, and the Raman spectra of each sample are shown in Figure 5, exhibiting the typical shape of amorphous carbon films with G and D peaks. In accordance with the previous results, GLC-B and GLC-C, which have relatively high extinction coefficients among the amorphous carbon film types, have large ID/IG intensity ratios and G peak positions on the relatively high-wavenumber side [4]. This trend is attributed to the increased sp2 cluster size and number in the amorphous carbon films, suggesting that GLC-B and GLC-C contain more sp2 bonds than the other samples [1]. The results of the Raman spectroscopic analysis confirm the classification of the three amorphous carbon types since their optical constants have different structures. Furthermore, the Raman spectra suggest that GLC-A has a similar film structure to that of a-C:H, as mentioned in the SE analysis.
A comparison of the Raman spectra of each sample before and after sulfuric acid immersion revealed no significant differences for any of the amorphous carbon film types. Therefore, sulfuric acid did not adversely affect the bulk structure of the amorphous carbon films, at least for the three types of amorphous carbon prepared in this experiment. This finding may serve as a reference for determining the type of amorphous carbon film required for specific applications in which sulfuric acid is in contact with the film.

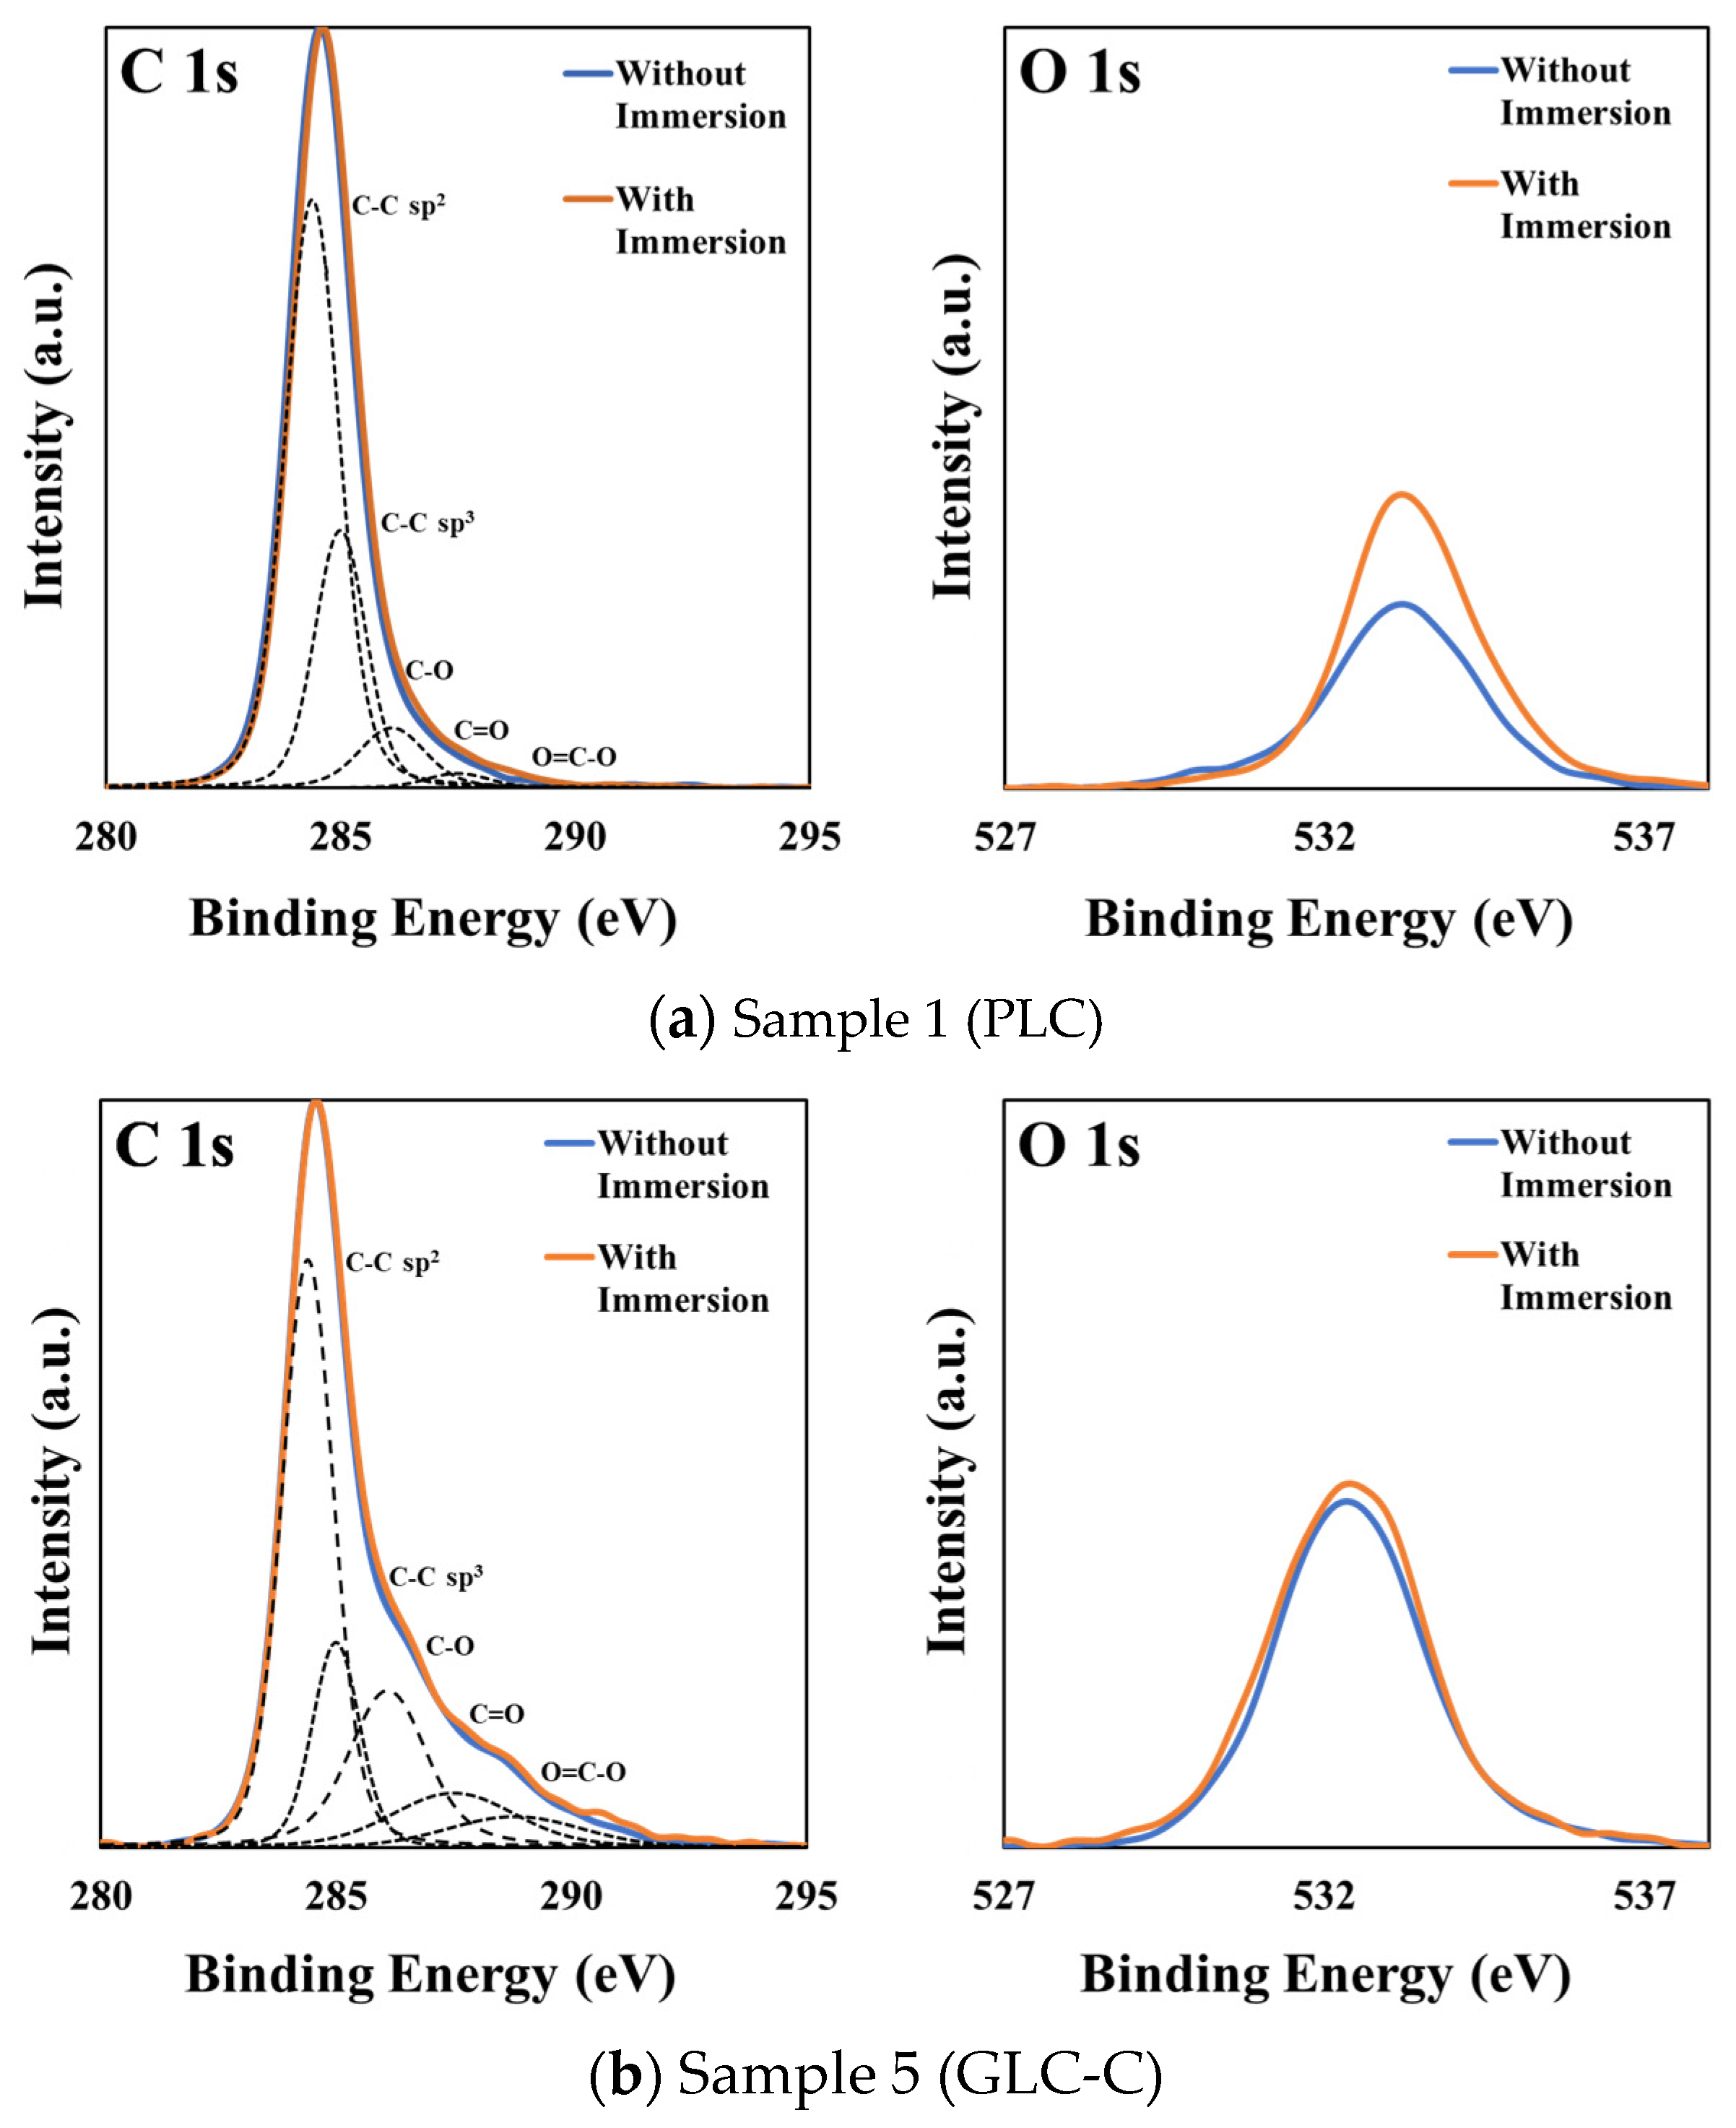
3.4. Effect of Sulfuric Acid Immersion on the Surface Composition of Amorphous Carbon Films

XPS analysis was used to evaluate the surface composition of each amorphous carbon film before and after sulfuric acid immersion. Table 4 lists the surface composition of each sample. As an example, the C1s and O1s spectra of samples 1 (PLC) and 5 (GLC-C) before and after sulfuric acid immersion are shown in Figure 6a,b. The area ratio of the XPS spectra (O1s/C1s ratio) was calculated, and the C1s peaks were waveform-separated to obtain the ratio of the C–C sp2, C–C sp3, C–O, C=O, and O=C–O bond areas to the total area.
Compared to those of PLC, GLC-A, and a-C:H with relatively low extinction coefficients, GLC-B and GLC-C, which have relatively high extinction coefficients, had higher O1s/C1s ratios and oxygen bond ratios in C1s. Such a finding may be attributed to the presence of more reactive sp2 bonds in the film [4].
Comparison of the surface composition of each sample before and after sulfuric acid immersion revealed that the O1s/C1s ratio of PLC, GLC-A, and a-C:H (especially PLC) that contains hydrogen as a deposition material tended to increase after sulfuric acid immersion, whereas no obvious difference was observed in their C1s spectra. This indicates that sulfuric acid affects the surface composition of certain amorphous carbon films. In a previous study, Nakamura et al. reported that when carbon fiber, which is the same carbon-based material as the amorphous carbon film, is immersed in sulfuric acid, the sulfur and oxygen-containing species that are components of the sulfuric acid are strongly adsorbed on the surface of the carbon fiber, initiating its surface oxidation. Interestingly, they also observed that the surface oxidation (O/C element ratio) changes with the immersion time of sulfuric acid, which is caused by the etching of the brittle layer (skin layer) on the surface of the material [7]. Therefore, the increasing trend of O1s/C1s ratio in the hydrogenated amorphous carbon film in this experiment is considered to be caused by the strong adsorption to sulfuric acid (surface free energy) and etching of the brittle layer, such as the low-density layer on the extreme surface layer of the hydrogenated amorphous carbon film [7,13]. These oxidation mechanisms must be clarified in future experiments through the effect of sulfuric acid immersion time and detailed analysis of sulfur peaks in XPS analysis. When applying thin amorphous carbon film coatings intended for small coils, it is important from a quality assurance perspective to clarify the effect of electrical insulation on the surface composition changes.

3.5. Effect of Sulfuric Acid Immersion on the Electrical Insulation Properties of Amorphous Carbon Films

The DC breakdown voltage of each amorphous carbon film was evaluated before and after immersion in sulfuric acid using a superinsulation meter. The DC breakdown field strength was calculated based on the DC breakdown voltage and film thickness. Table 5 and Figure 7 present the DC breakdown voltage and field strength results for each sample. The values are the mean ± standard deviation of n = 5.
Prior to sulfuric acid immersion, the DC breakdown voltages of the all the films were in the range of ~13–52 V. However, after immersion in sulfuric acid, the DC breakdown voltages of the PLC and a-C:H films became larger than that of the GLC film. The actual maximum voltage used in small electronic devices is in the range of 5–15 V; therefore, it is suggested that at least PLC, a-C:H, and GLC-A in this experiment satisfied the required performance [6]. The DC breakdown voltage generally depends on the film thickness; it is therefore possible that the electrical resistance required for small electronic devices can be obtained by fabricating even thicker films of GLC-B and GLC-C. Comparing the DC breakdown field strength of each sample, PLC and a-C:H showed relatively high values (approximately 400–500 kV/mm), similar to the DC breakdown voltage. According to previous studies, the breakdown field strength of a standard polyurethane wire used in coils is approximately 247 kV/mm, suggesting that the prepared amorphous carbon films have good electrical insulation properties [6]. As a matter of concern, in this experiment, a smooth Si substrate was used instead of Cu or Al, which are general-purpose wiring materials, in order to evaluate detailed film characteristics. This difference in substrate type may have affected the conductivity of the substrate and adhesion of the amorphous carbon film, which may have caused changes in breakdown voltage. Therefore, future comparative experiments using Cu and Al substrates should be carefully verified.
Figure 7 shows the relationship between the electrical insulating properties and ID/IG strength ratio for each sample before and after sulfuric acid immersion. This relationship indicates that the electrical insulating properties of the amorphous carbon film tend to decrease as the ID/IG strength ratio increases. As previously mentioned, as the ID/IG intensity ratio increases, the sp2 cluster size and number in the amorphous carbon film increase [1]. In general, the electrical conductivity of amorphous carbon films increases with graphitization [1]. Similarly, the sp2 state of an amorphous carbon film is believed to affect its electrical insulation properties.
The electrical insulation properties of each sample before and after sulfuric acid immersion remained stable, including those of PLC, a-C:H, and GLC-A, which exhibited progressive surface oxidation. Such a finding was attributed to the surface oxide layer being sufficiently thin compared to the bulk layer of the amorphous carbon film, and thus not affecting the electrical insulating properties [13]. Therefore, the effect of surface oxidation on the further thinning of amorphous carbon films requires further investigation in the future.

3.6. Optical Classification of Amorphous Carbon Films According to Their Electrical Insulation Properties

Figure 8 shows the optical classification of the amorphous carbon films with respect to their electrical insulation properties. The amorphous carbon films (PLC, GLC-A, and a-C:H) with relatively low extinction coefficients containing hydrogen atoms as the deposition material exhibited better electrical insulation properties than those of amorphous carbon films with relatively high extinction coefficients and without hydrogen atoms as the deposition material (GLC-B and GLC-C). The extinction coefficient of amorphous carbon films depends on the sp2 cluster size and hydrogen content, and the refractive index is proportional to the hardness, which is related to the film density [4]. Thus, it seems reasonable that the extinction coefficient, which reflects the structure of amorphous carbon films, has a certain relationship with the electrical insulation properties [14]. However, Tomidokoro et al. stated that the electrical properties of hydrogenated amorphous carbon films show complex trends that are affected by film structure, such as the hydrogen content, sp2/(sp2 + sp3) ratio, and dangling bonds [15]. Hence, the detailed electrical insulation differences between the hydrogenated amorphous carbon film types, such as PLC and a-C:H, require careful examination in the future after further data accumulation.
Based on the above research results, amorphous carbon films with electrical insulating properties can be easily obtained by general users in the industry based on their extinction coefficient. However, the current GLC types specified in ISO 23216:2021(E) include GLCs with very different characteristics, such as film structure and electrical insulation properties (GLC-A, GLC-B, C in this experiment). It is therefore necessary to review the optical classification methods for amorphous carbon films in the future and subdivide the various GLC types.

4. Conclusions

Three types of amorphous carbon films (hydrogenated amorphous carbon (a-C:H), polymer-like carbon (PLC), and graphite-like carbon (GLC)) were evaluated for their film structure, surface composition, and electrical insulation properties before and after immersion in sulfuric acid. The hydrogen-containing films, such as PLC and a-C:H, showed a tendency toward surface oxidation due to sulfuric acid immersion. However, no evident changes in the film structure or DC dielectric breakdown field strength were observed for any of the film types after immersion in sulfuric acid, indicating their stable nature. Furthermore, the amorphous carbon films with a relatively low extinction coefficient exhibited better electrical insulation properties than the amorphous carbon films with a relatively high extinction coefficient.
The developed amorphous carbon film coatings are very promising for future applications as thin insulating films for small coils in contact with sulfuric acid. Our study provides a useful tool to general users in the industry, aiding in the selection of electrically insulating amorphous carbon films based on the optical classification method without any mismatches.

Author Contributions

Conceptualization, K.K.; methodology, K.K. and E.I.; validation, M.H. and K.K.; formal analysis, K.K., E.I. and M.H.; investigation, K.K. and E.I.; writing—original draft preparation, K.K.; writing—review and editing, K.K., E.I., M.H. and K.H.; supervision, K.H.; project administration, K.H.; funding acquisition, K.H. All authors have read and agreed to the published version of the manuscript.

Funding

This research received no external funding.

Institutional Review Board Statement

Not applicable.

Informed Consent Statement

Not applicable.

Data Availability Statement

The data presented in this study are available on request from the corresponding author.

Acknowledgments

The authors would like to express our gratitude for the partial support provided by the Analysis Center of Tokyo Denki University.

Conflicts of Interest

Author Masanori Hiratsuka was employed by the company Nanotec Corporation. The remaining authors declare that the research was conducted in the absence of any commercial or financial relationships that could be construed as a potential conflict of interest.

References

  1. Robertson, J. Diamond-like amorphous carbon. Mater. Sci. Eng. R 2002, 37, 129–281. [Google Scholar] [CrossRef]
  2. Bewilogua, K.; Hofmann, D. History of diamond-like carbon films—From first experiments to worldwide applications. Surf. Coat. Technol. 2014, 242, 214–225. [Google Scholar] [CrossRef]
  3. ISO 23216:2021(E); Carbon Based Films—Determination of Optical Properties of Amorphous Carbon Films by Spectroscopic Ellipsometry. ISO: Geneva, Switzerland, 2021. Available online: https://www.iso.org/standard/74875.html (accessed on 22 August 2022).
  4. Kanasugi, K.; Arimura, K.; Alanazi, A.; Ohgoe, Y.; Manome, Y.; Hiratsuka, M.; Hirakuri, K. UV sterilization effects and osteoblast proliferation on amorphous carbon films classified based on optical constants. Bioeng 2022, 9, 505. [Google Scholar] [CrossRef] [PubMed]
  5. Reimi, M.; Akio, N.; Ryota, Y.; Junji, T.; Keiji, K.; Hidetoshi, S. Optical constants of diamond-like carbon films formed by gas cluster ion beam assisted deposition. Appl. Phys. Exp. 2022, 15, 035501. [Google Scholar] [CrossRef]
  6. Nakajima, D.; Kuwabara, H.; Annaka, S.; Fujii, S.; Tanaka, Y.; Hirakuri, K. Diamond-like carbon coating for effective electrical insulation of Cu and Al wires. Diam. Relat. Mater. 2020, 103, 107731. [Google Scholar] [CrossRef]
  7. Nakamura, K.; Sato, Y.; Takase, T. Surface oxidation and/or corrosion behavior of vapor-grown carbon fibers (VGCFs) in nitric acid, hydrogen peroxide, and sulfuric acid solutions. Diam. Relat. Mater. 2017, 76, 108–114. [Google Scholar] [CrossRef]
  8. Nakamura, K.; Morooka, H.; Tanabe, Y.; Yasuda, E.; Akatsu, T.; Shindo, H. Surface oxidation and/or corrosion behavior of glass-like carbon in sulfuric and nitric acids, and in aqueous hydrogen peroxide. Corros. Sci. 2011, 53, 4010–4013. [Google Scholar] [CrossRef]
  9. Song, J.; Tian, H.; Li, J.; Zhang, P.; Sun, A. Effect of methane and acetylene pre-gases on the corrosion resistance of DLC coatings. Vacuum 2024, 221, 112899. [Google Scholar] [CrossRef]
  10. Nitta, Y.; Okamoto, K.; Nakatani, T.; Hoshi, H.; Homma, A.; Tatsumi, E.; Taenaka, Y. Diamond-like carbon thin film with controlled zeta potential for medical material application. Diam. Relat. Mater. 2008, 17, 1972–1976. [Google Scholar] [CrossRef]
  11. Zhou, X.; Tunmee, S.; Suzuki, T.; Phothongkam, P.; Kanda, K.; Komatsu, K.; Kawahara, S.; Ito, H.; Saitoh, H. Quantitative NEXAFS and solid-state NMR studies of sp 3 /(sp 2 + sp 3) ratio in the hydrogenated DLC films. Diam. Relat. Mater. 2017, 73, 232–240. [Google Scholar] [CrossRef]
  12. Moriguchi, H.; Ohara, H.; Tsujioka, M. History and applications of diamond-like carbon manufacturing processes. Sei Technol. Rev. 2016, 82, 52–55. [Google Scholar]
  13. Harigai, T.; Yasuoka, Y.; Nitta, N.; Furuta, H.; Hatta, A. X-ray reflectivity analysis on initial stage of diamond-like carbon film deposition on Si substrate by RF plasma CVD and on removal of the sub-surface layer by oxygen plasma etching. Diam. Relat. Mater. 2013, 38, 36–40. [Google Scholar] [CrossRef]
  14. Ding, X.L.; Li, Q.S.; Kong, X.H. Optical and electrical properties evolution of diamond-like carbon thin films with deposition temperature. Chin. Phys. Lett. 2009, 26, 027802. [Google Scholar] [CrossRef]
  15. Tomidokoro, M.; Tunmee, S.; Rittihong, U.; Euaruksakul, C.; Supruangnet, R.; Nakajima, H.; Hirata, Y.; Ohtake, N.; Akasaka, H. Electrical Conduction Properties of Hydrogenated Amorphous Carbon Films with Different Structures. Materials 2021, 14, 2355. [Google Scholar] [CrossRef] [PubMed]
Figure 1. Amorphous carbon films deposited and non-deposited on a Si substrate.
Coatings 14 01023 g001
Figure 2. Overview of the DC dielectric breakdown test.
Coatings 14 01023 g002
Figure 3. Example of the I–V characteristics during the electrical insulation evaluation (sample 1).
Coatings 14 01023 g003
Figure 4. Atomic force microscope (AFM) images of each sample before and after sulfuric acid immersion.
Coatings 14 01023 g004
Figure 5. Raman spectra of each sample before and after sulfuric acid immersion (the waveform separation results for the sample before sulfuric acid immersion are shown in the Raman spectrum).
Coatings 14 01023 g005
Figure 6. Example of X-ray photoelectron spectroscopy (XPS) spectra (the waveform separation results of a sample before sulfuric acid immersion are shown in C1s).
Coatings 14 01023 g006
Figure 7. Relationship between the electrical insulation properties and ID/IG strength ratio of each sample before and after sulfuric acid immersion.
Coatings 14 01023 g007
Figure 8. Optical classification of amorphous carbon films with respect to their electrical insulating properties. The size of the spheres represents the electrical insulating properties associated with each amorphous carbon type. Color coding indicates the presence or absence of hydrogen relative to the precursor.
Coatings 14 01023 g008
Table 1. Deposition conditions for amorphous carbon films.
Sample No.Deposition MethodPrecursorSubstrate
Bias Voltage
[kV]
Target
Voltage [kV]
1CVDRF-PCVDhydrogenated gas (C6H6)1.5-
2Pulsed
DC-PCVD
hydrogenated gas (C6H6)1.5-
3PVDIonized
evaporation
hydrogenated gas (C6H6)1.0-
4HiPIMSgraphite solid target + Ar-0.75
5HiPIMSgraphite solid target + Ar−0.050.90
Table 2. Optical constants, thickness, and optical surface roughness of the amorphous carbon films obtained using SE analysis.
Sample No.χ2Film Thickness
(nm)
nkTypeOptical Surface Roughness
(nm)
λ = 550 nm
10.19901.940.04PLC11
20.161292.020.28GLC-A4
30.121072.250.33a-C:H19
40.061971.700.39GLC-B17
50.191701.910.47GLC-C7
Table 3. Surface roughness and film structure of amorphous carbon before and after sulfuric acid immersion.
Sample
No.
Sulfuric Acid
Immersion
Surface Roughness (nm)D-Peak
Position
[cm−1]
G-Peak
Position
[cm−1]
ID/IG
Intensity Ratio
1
(PLC)
Without0.39 ± 0.04 (n = 3)1311.6 ± 2.41523.8 ± 0.40.31
With0.12 ± 0.01 (n = 3)1309.1 ± 2.51523.1 ± 0.40.31
2
(GLC-A)
Without0.33 ± 0.04 (n = 3)1369.1 ± 2.91541.3 ± 0.20.52
With0.22 ± 0.01 (n = 3)1369.1 ± 3.01540.8 ± 0.20.52
3
(a-C:H)
Without0.16 ± 0.05 (n = 3)1387.8 ± 3.51554.3 ± 0.20.60
With0.12 ± 0.02 (n = 3)1387.4 ± 3.51555.0 ± 0.20.63
4
(GLC-B)
Without3.54 ± 0.01 (n = 3)1366.9 ± 0.81581.2 ± 0.31.00
With2.90 ± 0.02 (n = 3)1369.0 ± 0.81582.0 ± 0.31.00
5
(GLC-C)
Without3.21 ± 0.36 (n = 3)1367.2 ± 0.91581.9 ± 0.31.10
With2.66 ± 0.12 (n = 3)1374.6 ± 0.91582.8 ± 0.31.10
Table 4. Surface composition of amorphous carbon before and after sulfuric acid immersion.
Sample
No.
Sulfuric
Acid Immersion
O1s/C1s
Ratio
C1s Curve Fitting Area
C–C sp2C–C sp3C–OC=OO=C–O
1
(PLC)
Without0.140.640.260.080.020.00
With0.190.540.340.100.030.00
2
(GLC-A)
Without0.120.490.340.120.030.02
With0.150.480.340.130.030.02
3
(a-C:H)
Without0.110.40 0.39 0.15 0.05 0.02
With0.130.39 0.39 0.15 0.05 0.02
4
(GLC-B)
Without0.210.44 0.24 0.16 0.11 0.04
With0.210.430.25 0.170.11 0.04
5
(GLC-C)
Without0.210.470.150.210.100.06
With0.210.46 0.17 0.20 0.10 0.07
Table 5. Electrical insulating properties of amorphous carbon before and after sulfuric acid immersion.
Sample
No.
Sulfuric Acid
Immersion
Electrical Insulation (n = 5)
Insulation Voltage
(V)
Electrical Insulation
(kV/mm)
1
(PLC)
Without40 ± 1444 ± 11
With42 ± 3467 ± 33
2
(GLC-A)
Without39 ± 2302 ± 16
With36 ± 1279 ± 8
3
(a-C:H)
Without52 ± 3486 ± 28
With53 ± 2495 ± 19
4
(GLC-B)
Without13 ± 066 ± 0
With13 ± 066 ± 0
5
(GLC-C)
Without16 ± 494 ± 24
With14 ± 382 ± 29
Disclaimer/Publisher’s Note: The statements, opinions and data contained in all publications are solely those of the individual author(s) and contributor(s) and not of MDPI and/or the editor(s). MDPI and/or the editor(s) disclaim responsibility for any injury to people or property resulting from any ideas, methods, instructions or products referred to in the content.

