Abstract
Mud caking on shield cutterhead is a critical issue for tunnel safety, and temperature and duration are factors that can affect the characteristics of mud cake. Therefore, the aim of this study is to explore the characteristics of different temperatures and action times on the adhesion and hardness of red-bed geological mud cake. A self-designed experimental apparatus was used to simulate the adhesion of mud cake on the cutterhead. The adhesion and hardness of the mud cake were analyzed through mud cake shedding tests and hardness tests. In addition, water film theory is used to analyze the adhesion mechanism of the mud cake. The results indicate that temperature and duration are key factors affecting mud cake shedding. Within the range of 25~150 °C, mud cake shedding efficiency is positively correlated with temperature and duration. However, temperatures above 150 °C promote the sintering of the mud cake, reducing its shedding efficiency. The hardness of the mud cake increases with temperatures above 150 °C, where the mud cake hardens and sinters, increasing the difficulty of shield tunneling. The water content of mud cake is influenced by temperature and time, affecting the amount of mud cake shedding. As the water content increases, the shedding initially decreases and then increases, reaching its minimum at about 30%, where the adhesion is strongest. By controlling the temperature and time, the water content can be optimized, improving the handling of mud cake.
1. Introduction
Shield tunneling [1], with its safety, efficiency, and convenience, has become one of the primary construction methods for urban underground space development. However, in complex geological strata, particularly in clay and mudstone layers rich in clay mineral particles, the use of shield tunneling often encounters construction problems related to cutterhead mud cake [2].
The mud cake attached to the cutterhead, under the influence of geological pressure and temperature at the cutter face, tends to consolidate and gradually harden under high temperatures. This results in the formation of semi-solid or solid masses within the cutterhead or excavation chamber, leading to mud cake formation. Mud cake on the cutterhead can cause issues such as reduced penetration depth and blockage at the cutterhead opening, significantly affecting the efficiency of the tunnel boring machine [3].
The formation of shield mud cake essentially involves the interaction between soil and the cutterhead. Thewes et al. [4] have defined the mud cake issue as an interplay of four single-effect mechanisms, with a particular focus on the cohesion of clay particles and their adhesiveness on component surfaces. In the study of mud cake mechanisms, shear tests and pullout tests were used to analyze the impact of soil properties, consolidation pressure, shear rate, and metal surface roughness on cutterhead clogging. Ding et al. [5] concluded from several engineering cases that when the clay content in the layer exceeds 25% by weight, the probability of mud cake formation significantly increases. Basmenj et al. [6] used piston pullout tests and modified direct shear tests to study the factors affecting normal and tangential adhesion at the soil–metal interface. Subsequently, Basmenj et al. [7] used a piston pullout test apparatus to study the differences in interfacial adhesion between kaolin, bentonite, and metal, comparing the adhesion of bentonite and kaolin. Khabbazi et al. [8] conducted tests on the adhesion stress of clays with different sand contents using piston pullout tests and soil shear tests, finding a strong correlation between adhesion stress and both sand and water contents. They also considered piston pullout tests as a reliable method for evaluating soil adhesiveness.
To address cutterhead clogging and reduce mud cake formation, two preventive technologies are utilized. Firstly, we optimize the configuration of cutterhead tools, including removing overly dense fixed scrapers and continuous flushing during excavation [9,10,11]. Secondly, soil conditioning involves injecting additives such as foam, polymers, and high-density mud into the slurry to enhance its fluidity and reduce shear and adhesive strengths [12,13,14,15].
In engineering, the kinetic energy from the cutterhead’s cutting action is largely converted into thermal energy due to friction. This generates high temperatures on the cutterhead and excavation face, causing the mud cake formed on the cutterhead to dehydrate, consolidate, and further harden, making it difficult to remove. The hardening of the mud cake also increases wear on the tunnel boring machine’s tools [16,17], not only affecting the progress of tunnel excavation but also posing risks to project quality and safety [18].
Therefore, the issue of mud cake is not only a result of clogging but also of the solidification of debris due to frictional heat. Qiu et al. [19] analyzed soil contact tests on heated surfaces to study the effects of temperatures ranging from 30 °C to 70 °C on clay adhesion properties and discussed the differences among soils with varying water contents. Ying et al. [20] studied the effects of temperatures ranging from 13 °C to 70 °C on the consolidation and hardening of sandy clay mud cake, along with the impact of various soil parameters, excavation parameters, and foaming agents on the temperature at the soil–cutter interface. Fu et al. [21] analyzed data from cutterhead inspections in actual engineering projects; the study examines the impact of temperature on mud cake formation. During each excavation cycle, cutterhead temperatures fluctuate, typically maintaining a temperature of around 20 °C. When encountering harder geological layers or forming mud cake, there is an abnormal increase in cutterhead temperature, with peaks exceeding 70 °C, about 50 °C higher than usual. Yang et al. [22] established a transient temperature field model for a cutterhead during the slurry shield driving process, taking into account the frictional heat generated between the cutterhead face and the soil. They conducted a parametric study, exploring the variations in the cutterhead temperature field under different shield tunneling parameters and geological factors. Abuel-Naga et al. [23] studied the engineering properties of soft Bangkok clay when heated from room temperature (25 °C) to 90 °C. Bangkok soft clay exhibited temperature-induced volumetric changes, a reduction in the traditional elastic zone, hardening, increased permeability with rising temperature, and a pronounced over-consolidated state in normally consolidated samples after undergoing heating/cooling cycles.
Red beds consist of iron-rich sedimentary rock layers with clay minerals as the primary component [24,25,26,27,28]. Soil water content exceeds 30%, leading to high viscosity and moisture levels that facilitate mud cake formation on the cutterhead. This study is based on the Haizhu Bay Tunnel and aims to investigate the characteristics of mud cake in red-bed geology.
However, conventional studies have limited the range of temperatures studied for cutterhead, and there are almost no related reports on the characteristics of mud cake in red-bed geology.
Therefore, the aim of this study is to explore the characteristics of red-bed mud cake at higher temperature ranges. A simulated shield cutterhead mud cake adhesion apparatus was developed to simulate the actual formation of mud cake, extending the temperature range to 25 °C to 200 °C and the duration to 10–50 min to study mud cake properties under high temperatures. Shedding tests and hardness tests were carried out to obtain parameters related to the adhesiveness and hardening of mud cake. The water film theory was used to analyze the adhesion mechanism of mud cake. This study provides a reference for the mud cake issue in red-bed geology.
2. Engineering Background
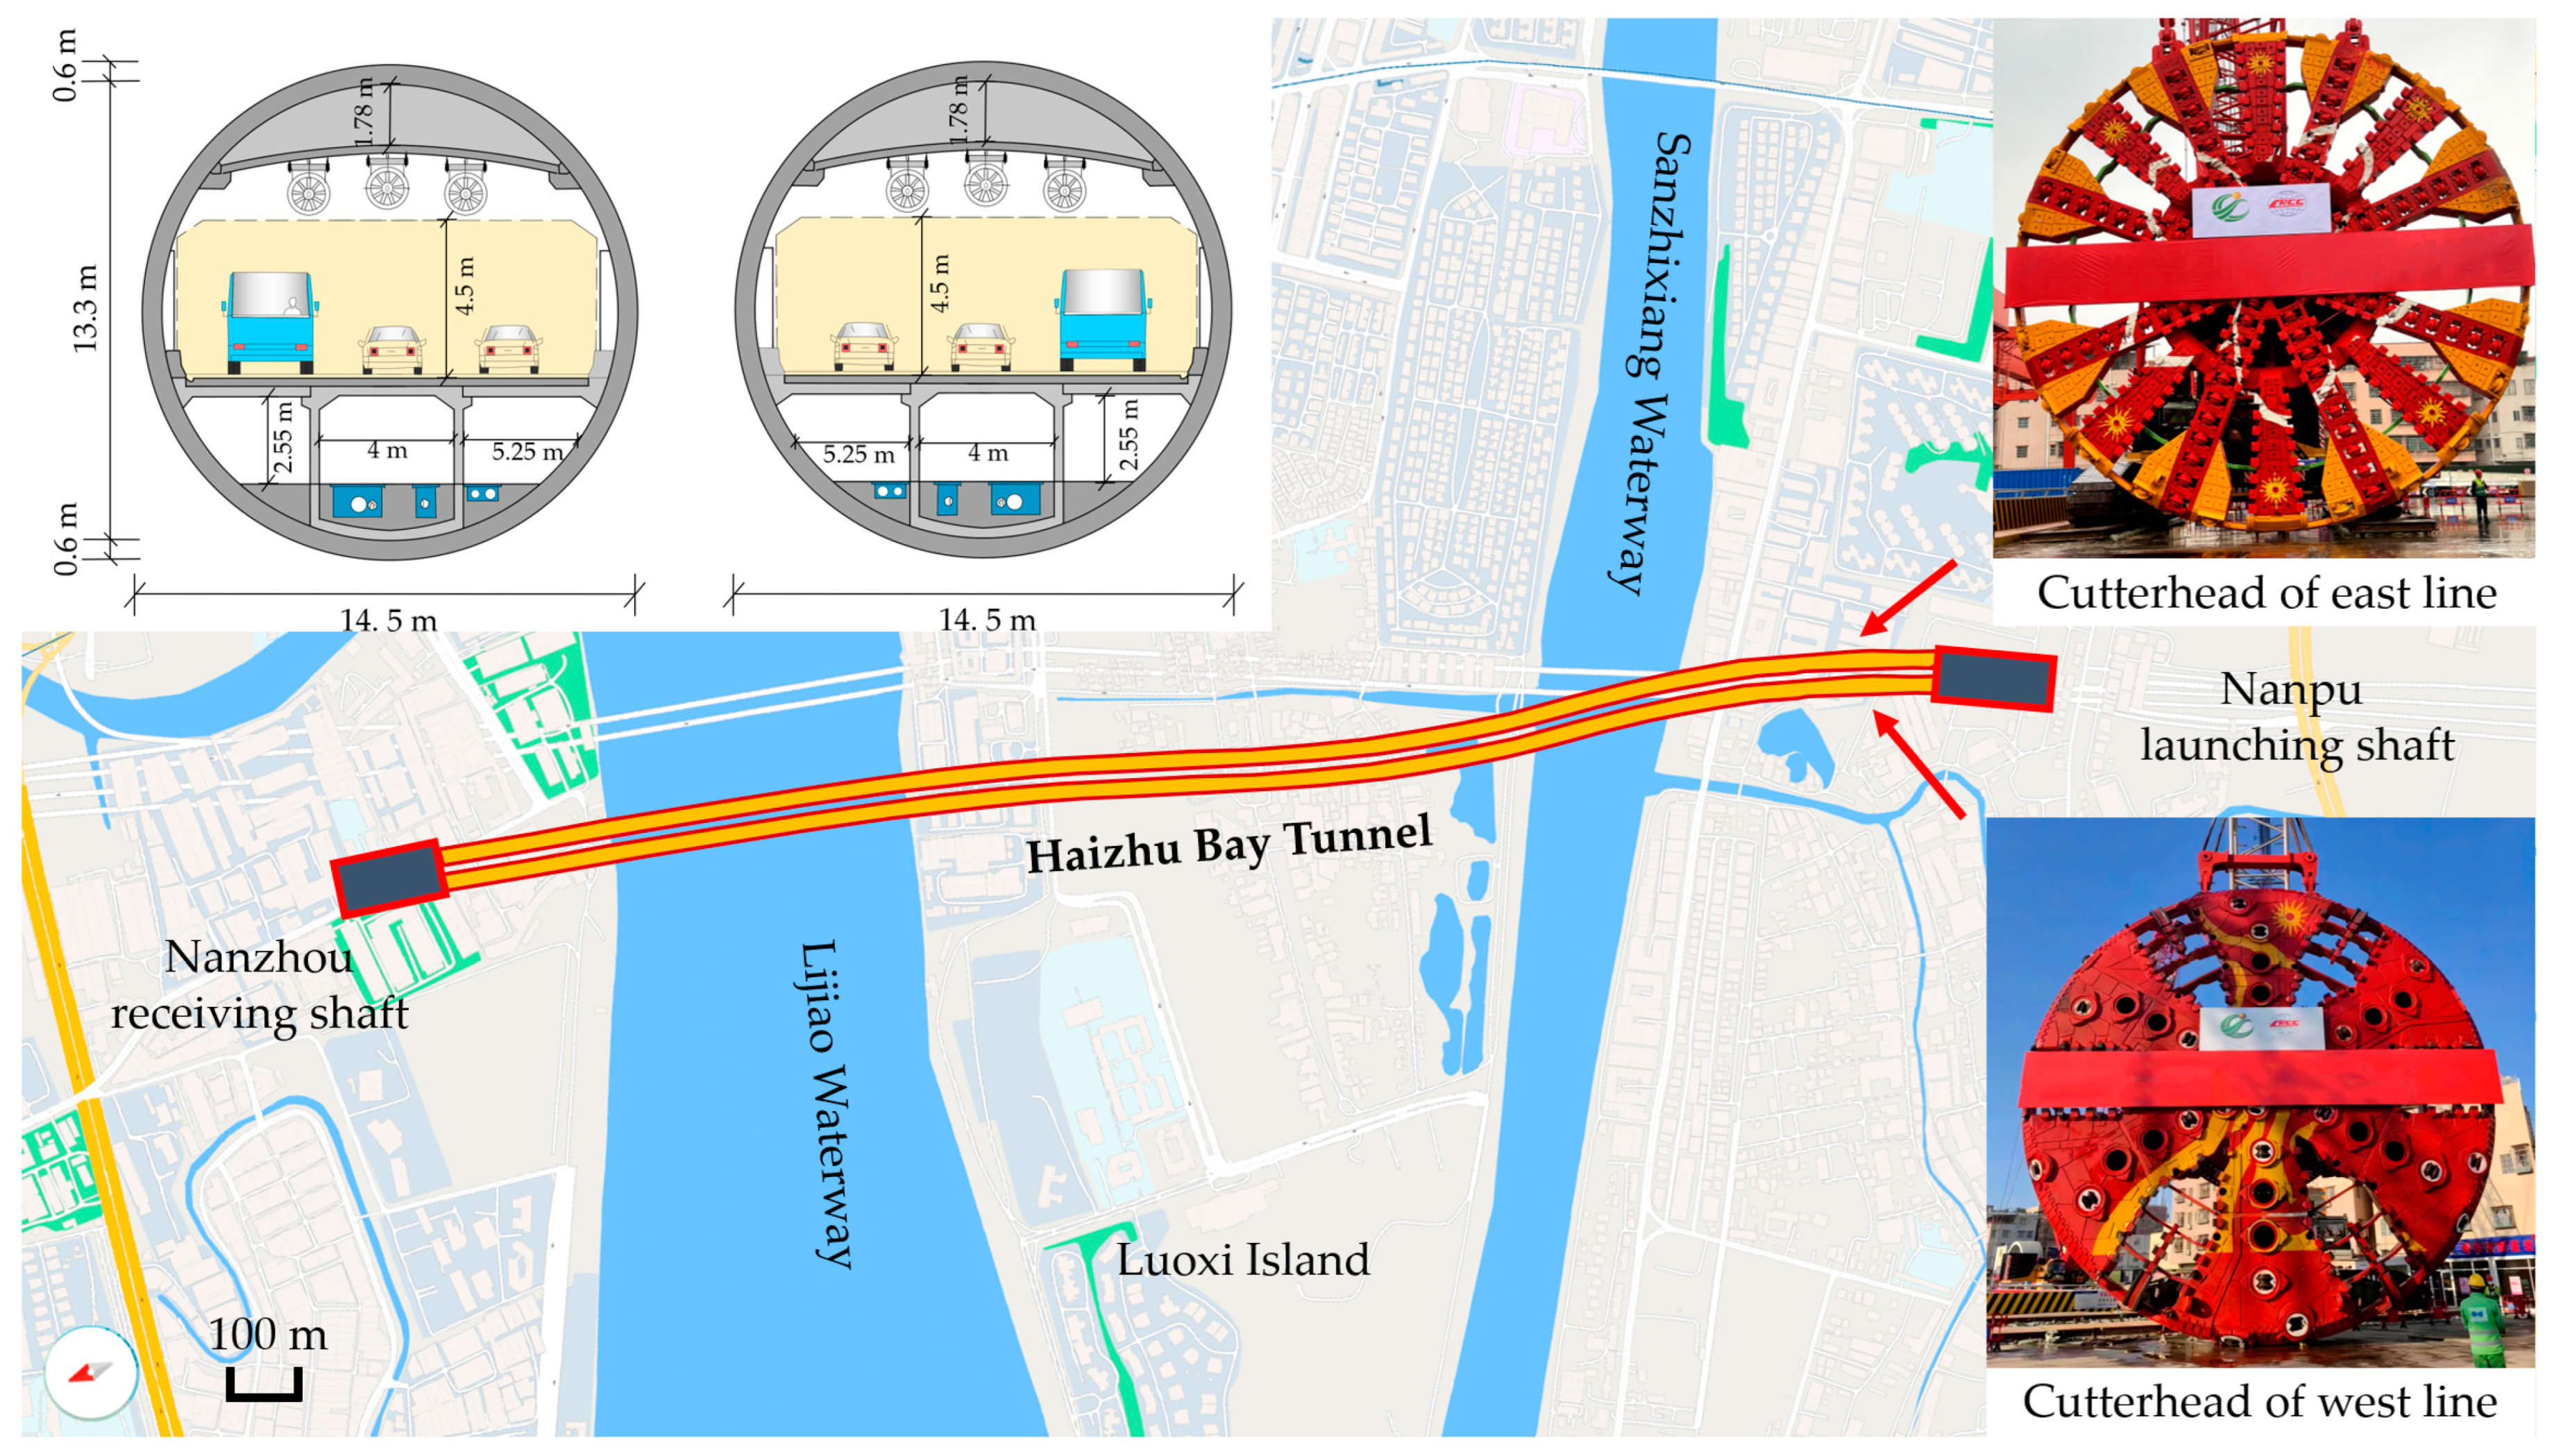
The tunnel spans across Haizhu and Panyu districts, starting north at Nanzhou Road, connecting to the existing Dongxiao South Elevated Road, and traveling south via a shield tunnel beneath the Pearl River Lijiao Waterway, Luoxi Island, and Sanzhi Xiang Waterway, reaching Nangpu Avenue and connecting to the southern section of the Guangzhou South Station link, as illustrated in Figure 1. The tunnel’s shield-driven section is 2077 m long and has a diameter of 14.5 m, making it the largest diameter shield tunnel in the Pearl River Delta region. The tunnel is divided into east and west lines, constructed using two large-diameter slurry balance shield machines with cutterhead diameters of 15.07 m. The west line’s shield machine has a pressurized cutterhead with an opening rate of 33%, while the east line’s machine has a normal pressure cutterhead with an opening rate of 30%. The relatively small opening rates of both hinder the flow of mud and sand, increasing the risk of mud cake formation.
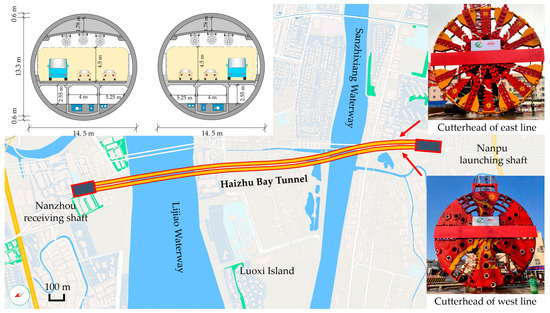
Figure 1.
Tunnel location map.
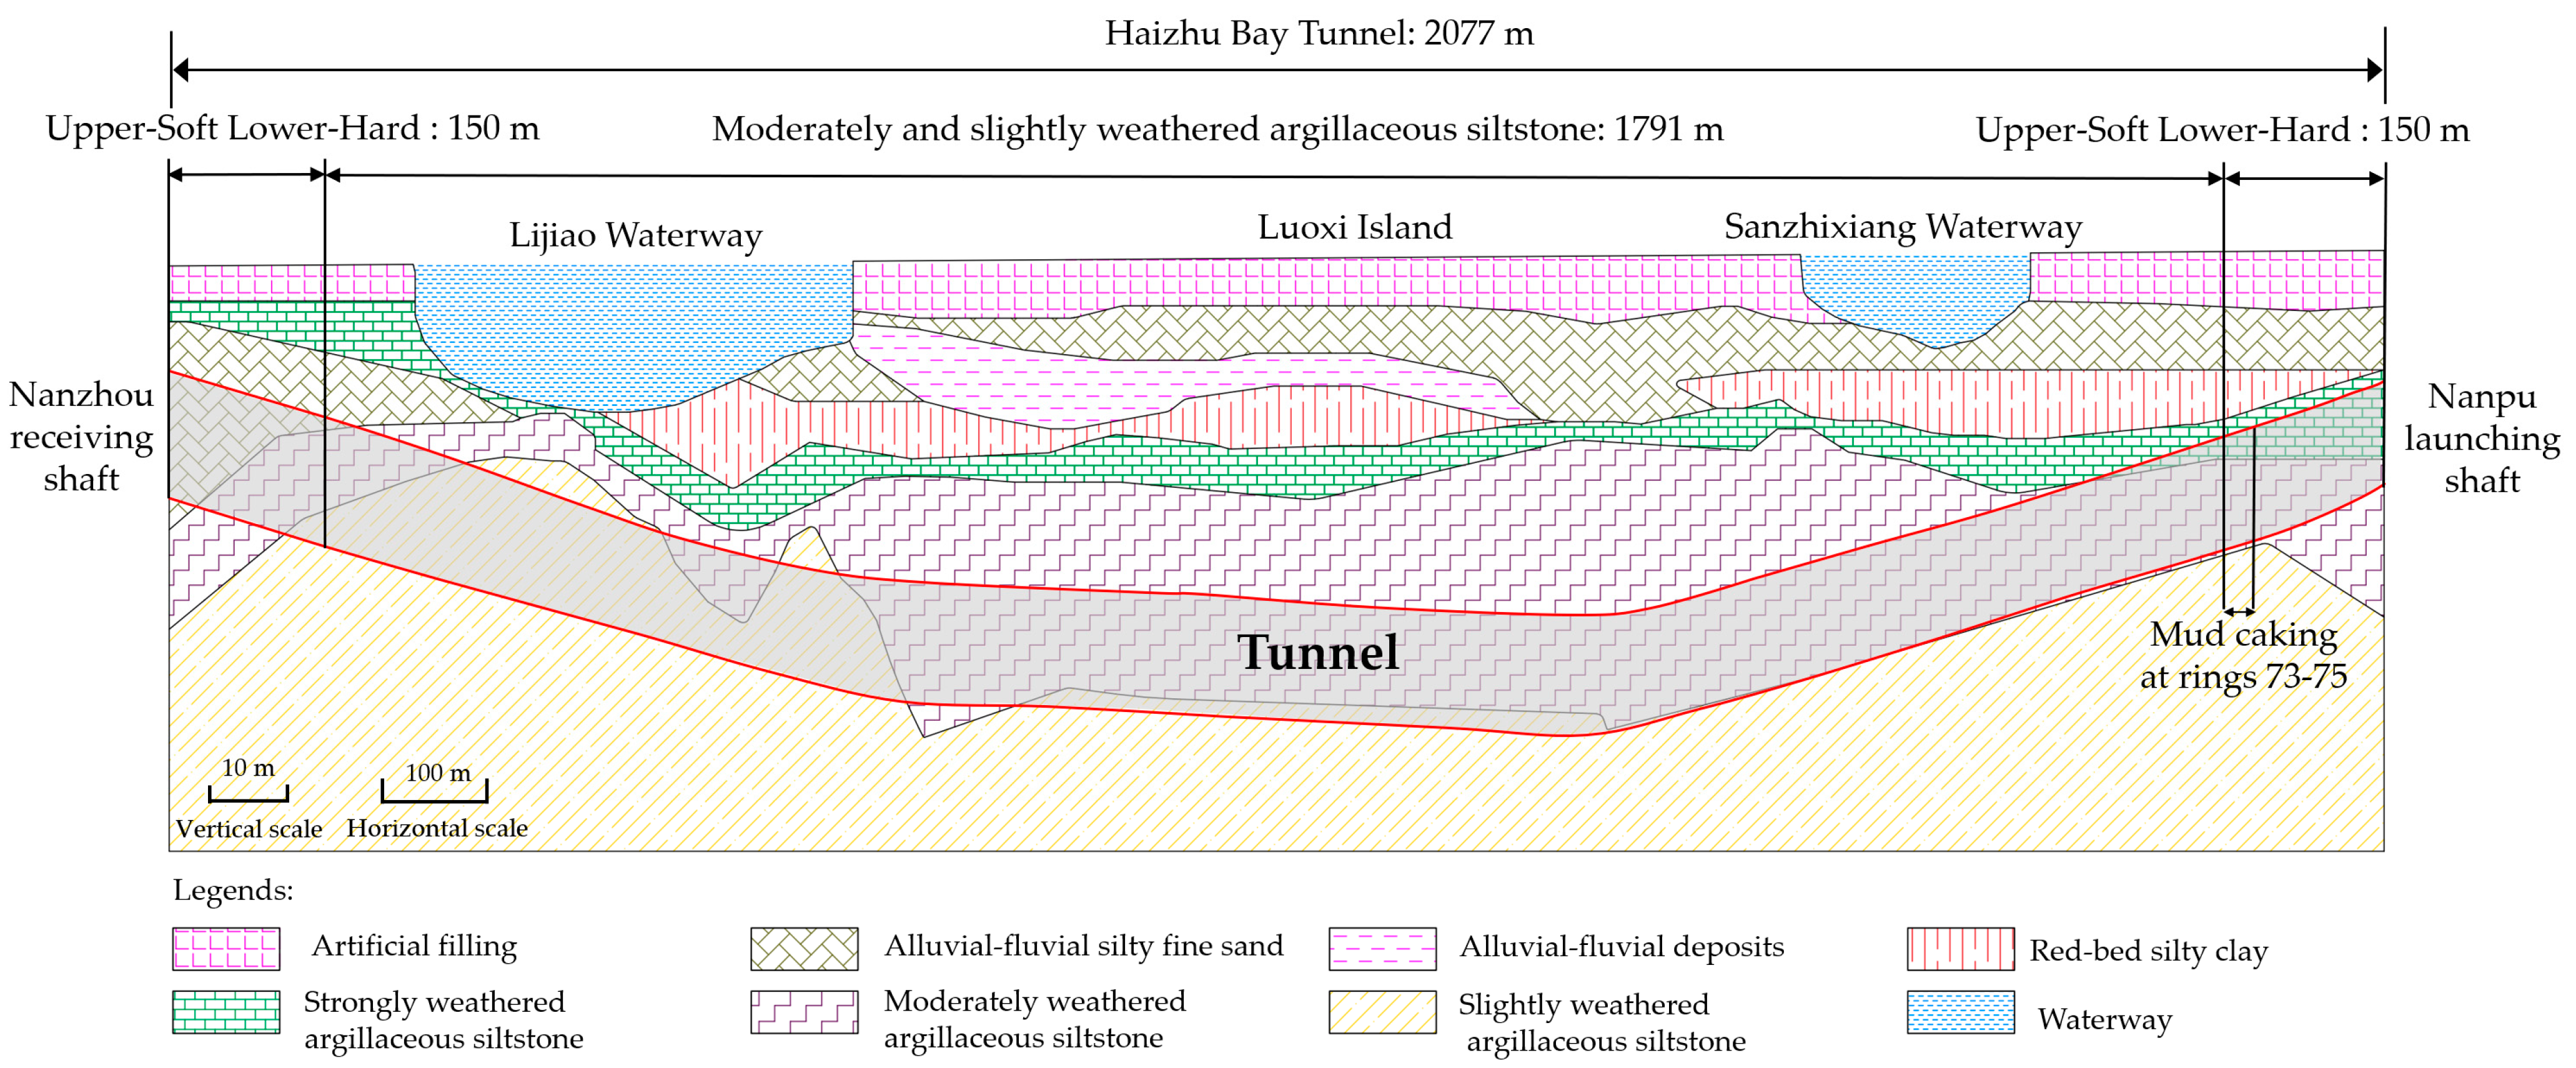
The shield tunnel segment primarily passes through layers of gravel, medium sand, silty clay, and fully to slightly weathered mudstone siltstone, as shown in Figure 2, with mudstone siltstone comprising a significant proportion. The primary components of mudstone siltstone are clay minerals with minor silt content. With silt content ranging from 25% to 50% and clay content from 75% to 50%, this composition facilitates the easy deposition of mud cake on the cutterhead.
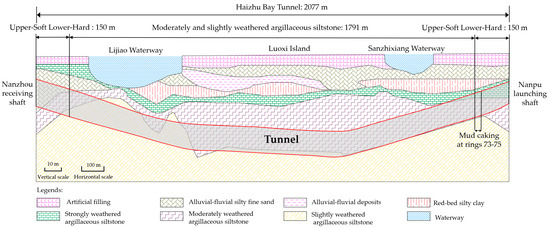
Figure 2.
Tunnel geological map.
3. Materials and Methods
3.1. Experimental Materias
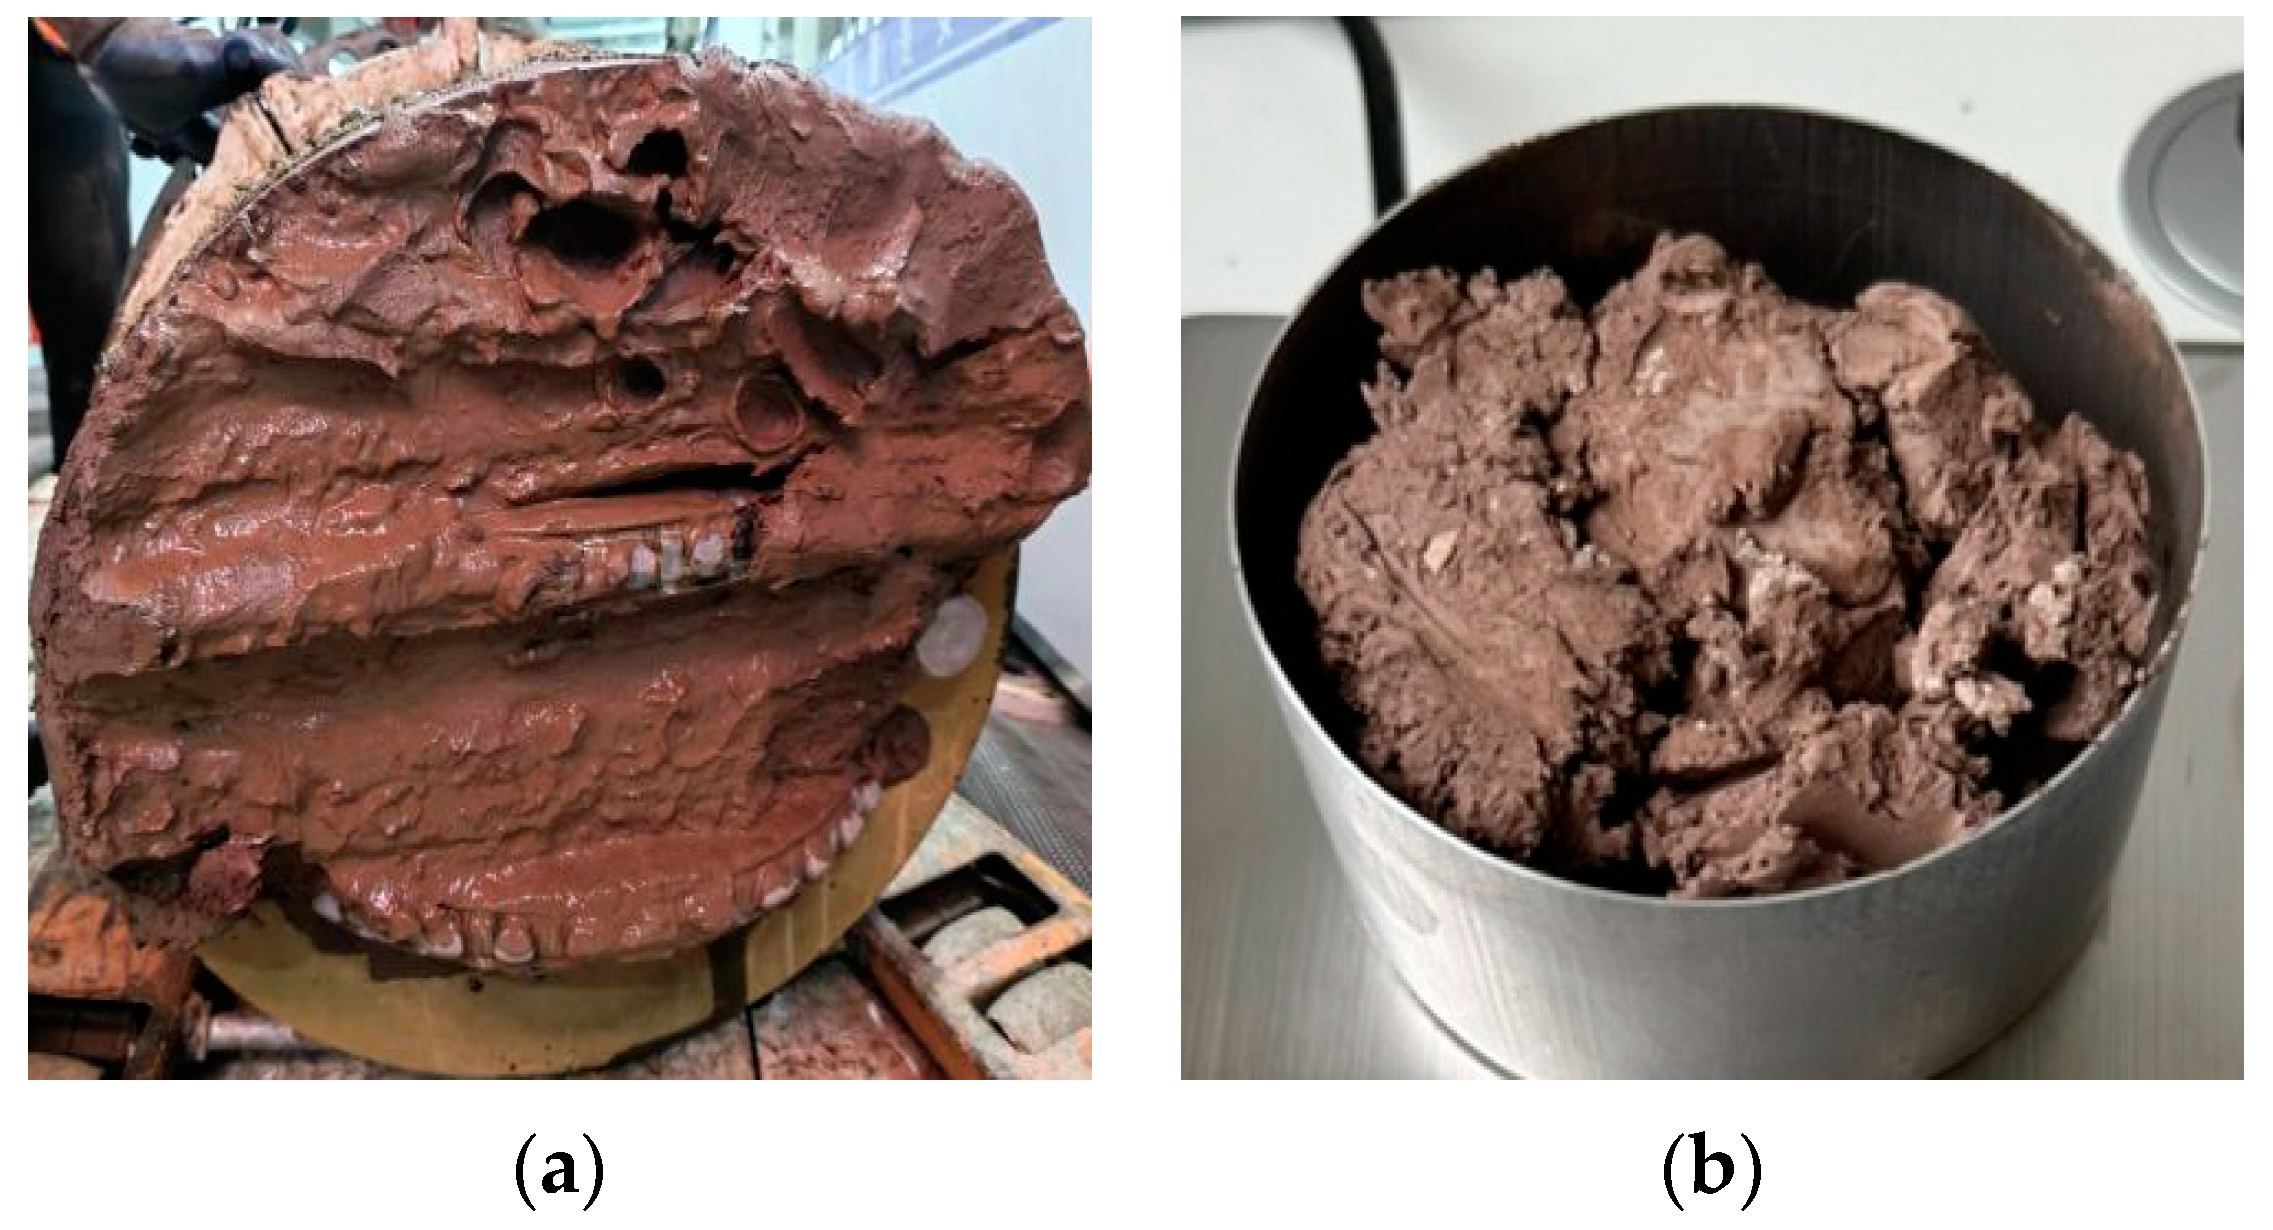
The shield machine on the western line encountered increased thrust, reduced torque, and decreased excavation speed while advancing through rings 73 to 75. An inspection during a shutdown revealed the formation of the mud cake; subsequently, operations to change cutters and remove the mud cake were initiated. Figure 3a illustrates the condition of the mud cake on the roller cutter of the western line. The mud cake was manually removed, and the cleared samples were wrapped in cling film and taken to the laboratory for testing (Figure 3b).

Figure 3.
Mud cake instances and sample. (a) The roller cutter with adhered mud cake; (b) the sample used for measurement.
The basic physical properties of the mud cake sample were measured, showing a water content of 15.13%, a liquid limit of 42%, and a plastic limit of 23%. Additionally, according to the geological survey report, the natural water content is 36.5%, as shown in Table 1.

Table 1.
Basic properties of the mud cake sample.
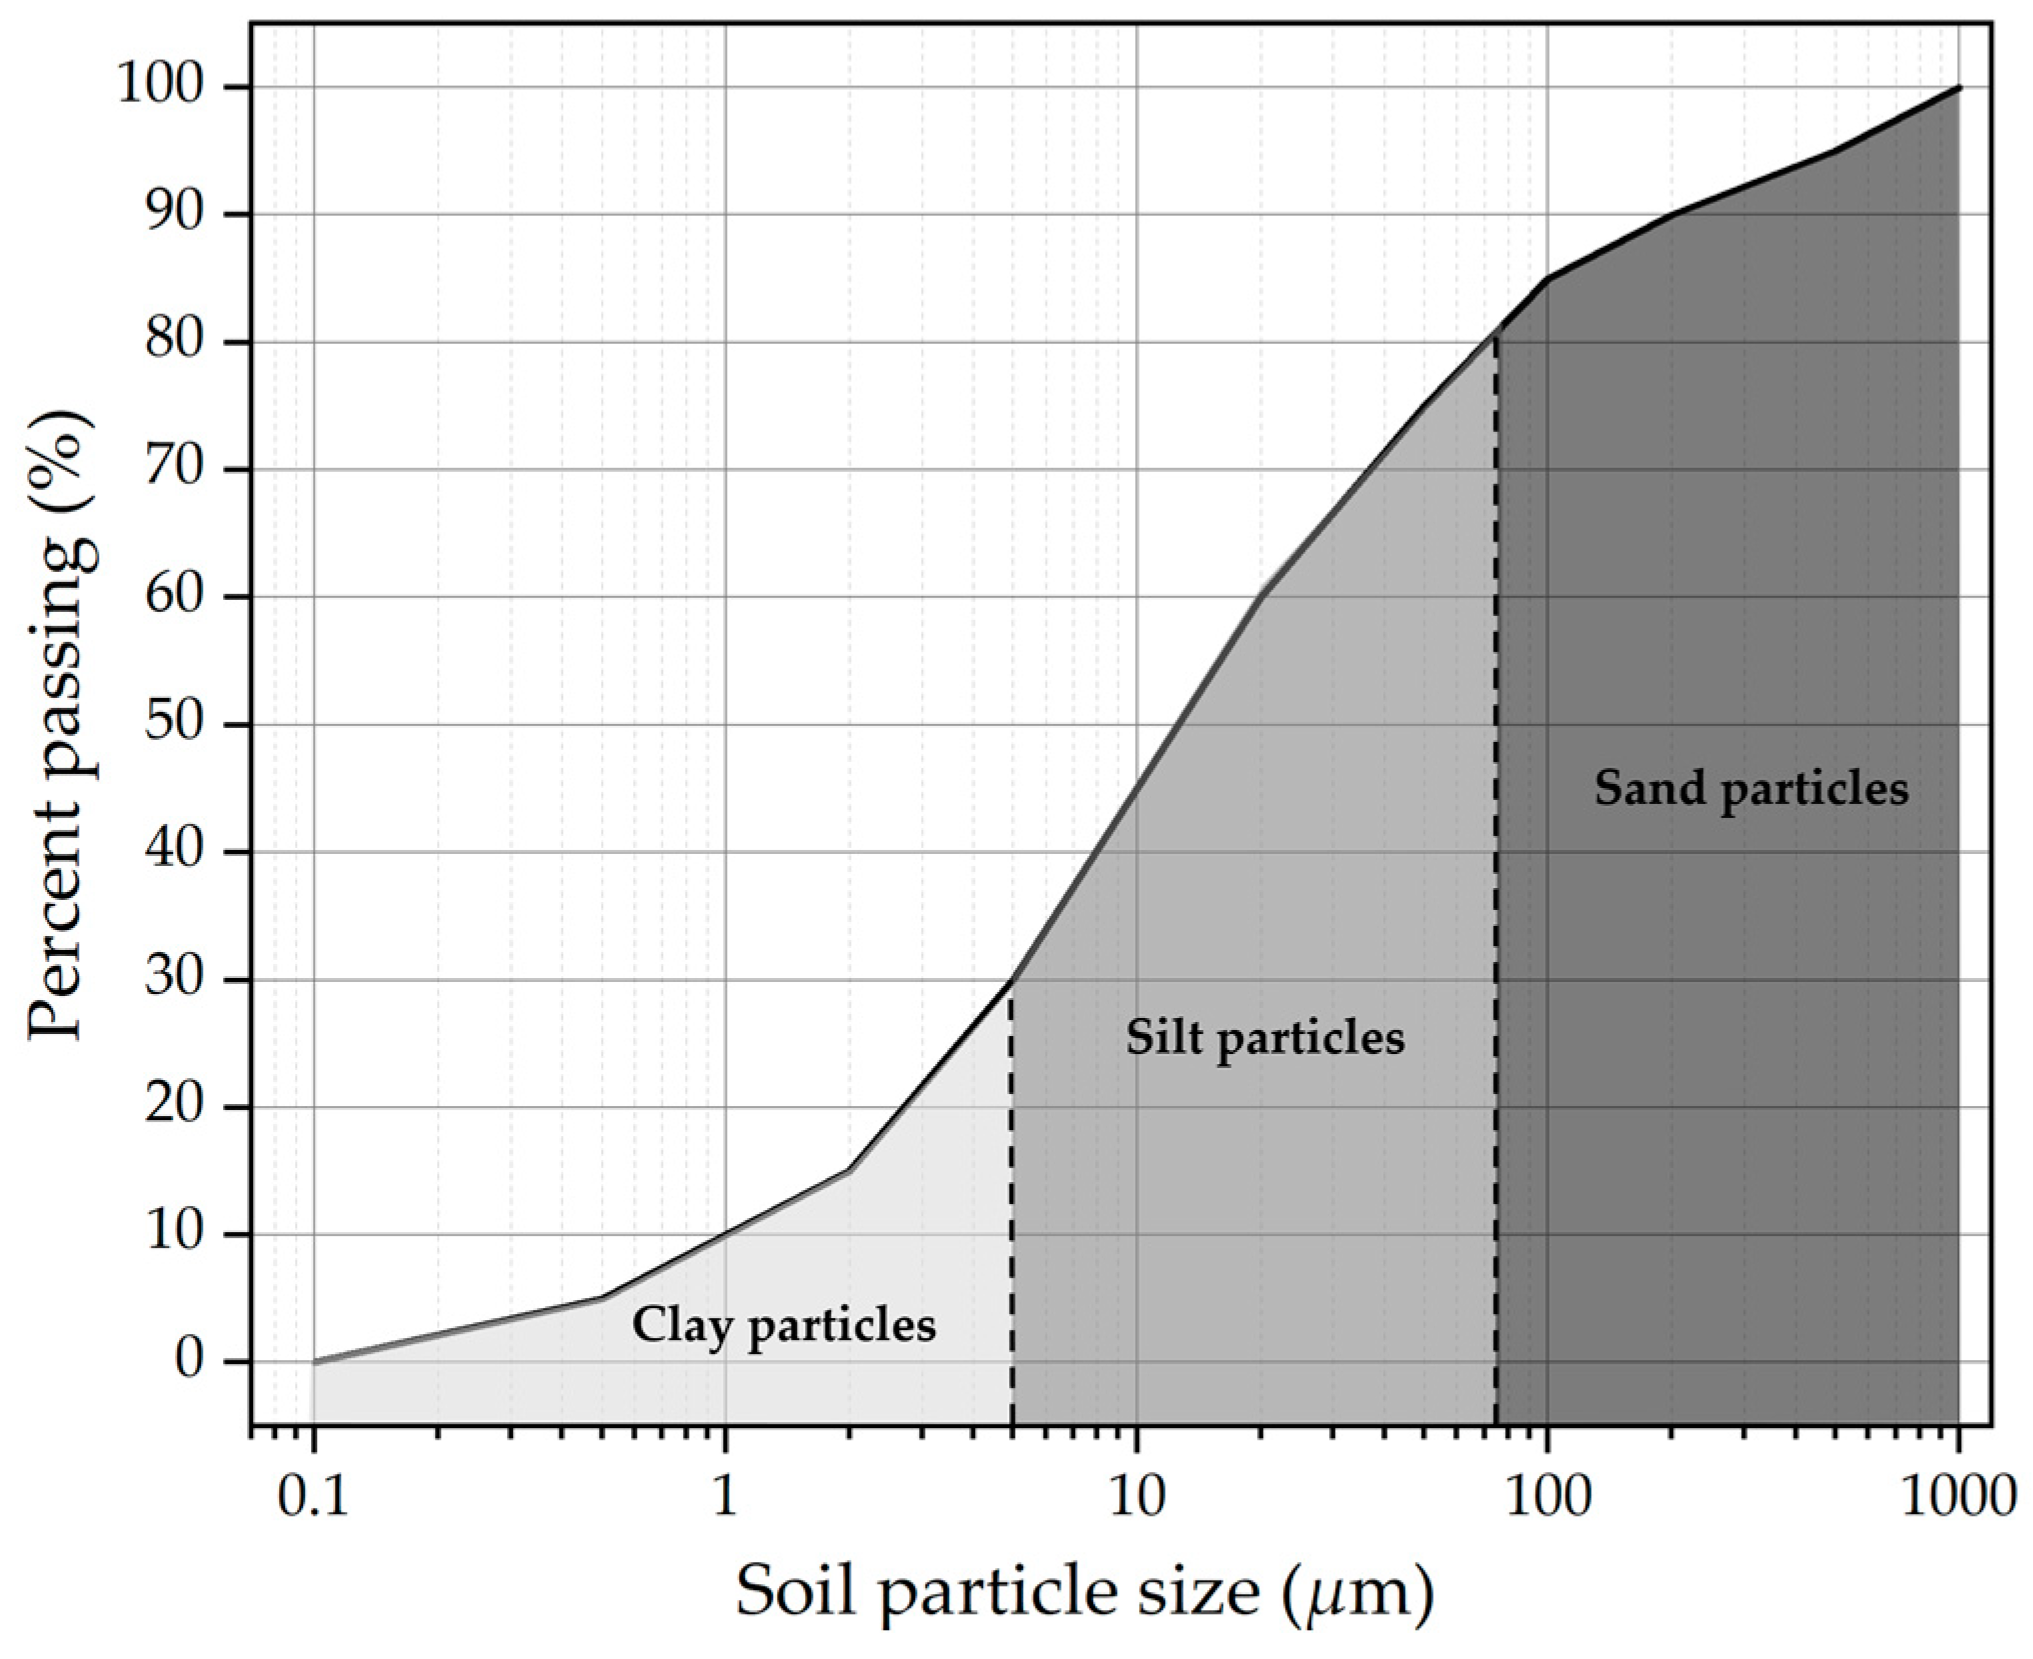
The particle size distribution of the mud cake samples was determined using a Malvern Mastersizer 3000 laser particle size analyzer, produced by Malvern Panalytical. The resulting distribution curve is presented in Figure 4. From Figure 4, it can be observed that the particle size range of the tested soil mainly falls between 5 μm and 200 μm. The mud cake primarily consists of silt particles (particle size between 5 μm and 75 μm) and clay particles (particle size less than 5 μm), comprising about 80.5% of the content.
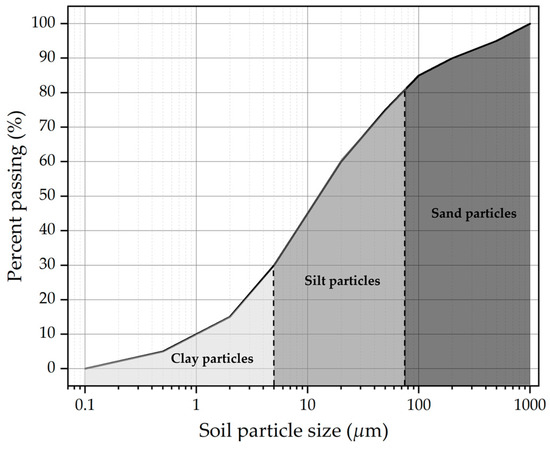
Figure 4.
Mud cake sample particle size distribution curve.
The high content of silt and clay particles in the sediment causes mud cake to rapidly form on the cutter tools and cutter head in the shield tunneling machine, and sintering occurs under high-temperature conditions.
3.2. Experimental Methods
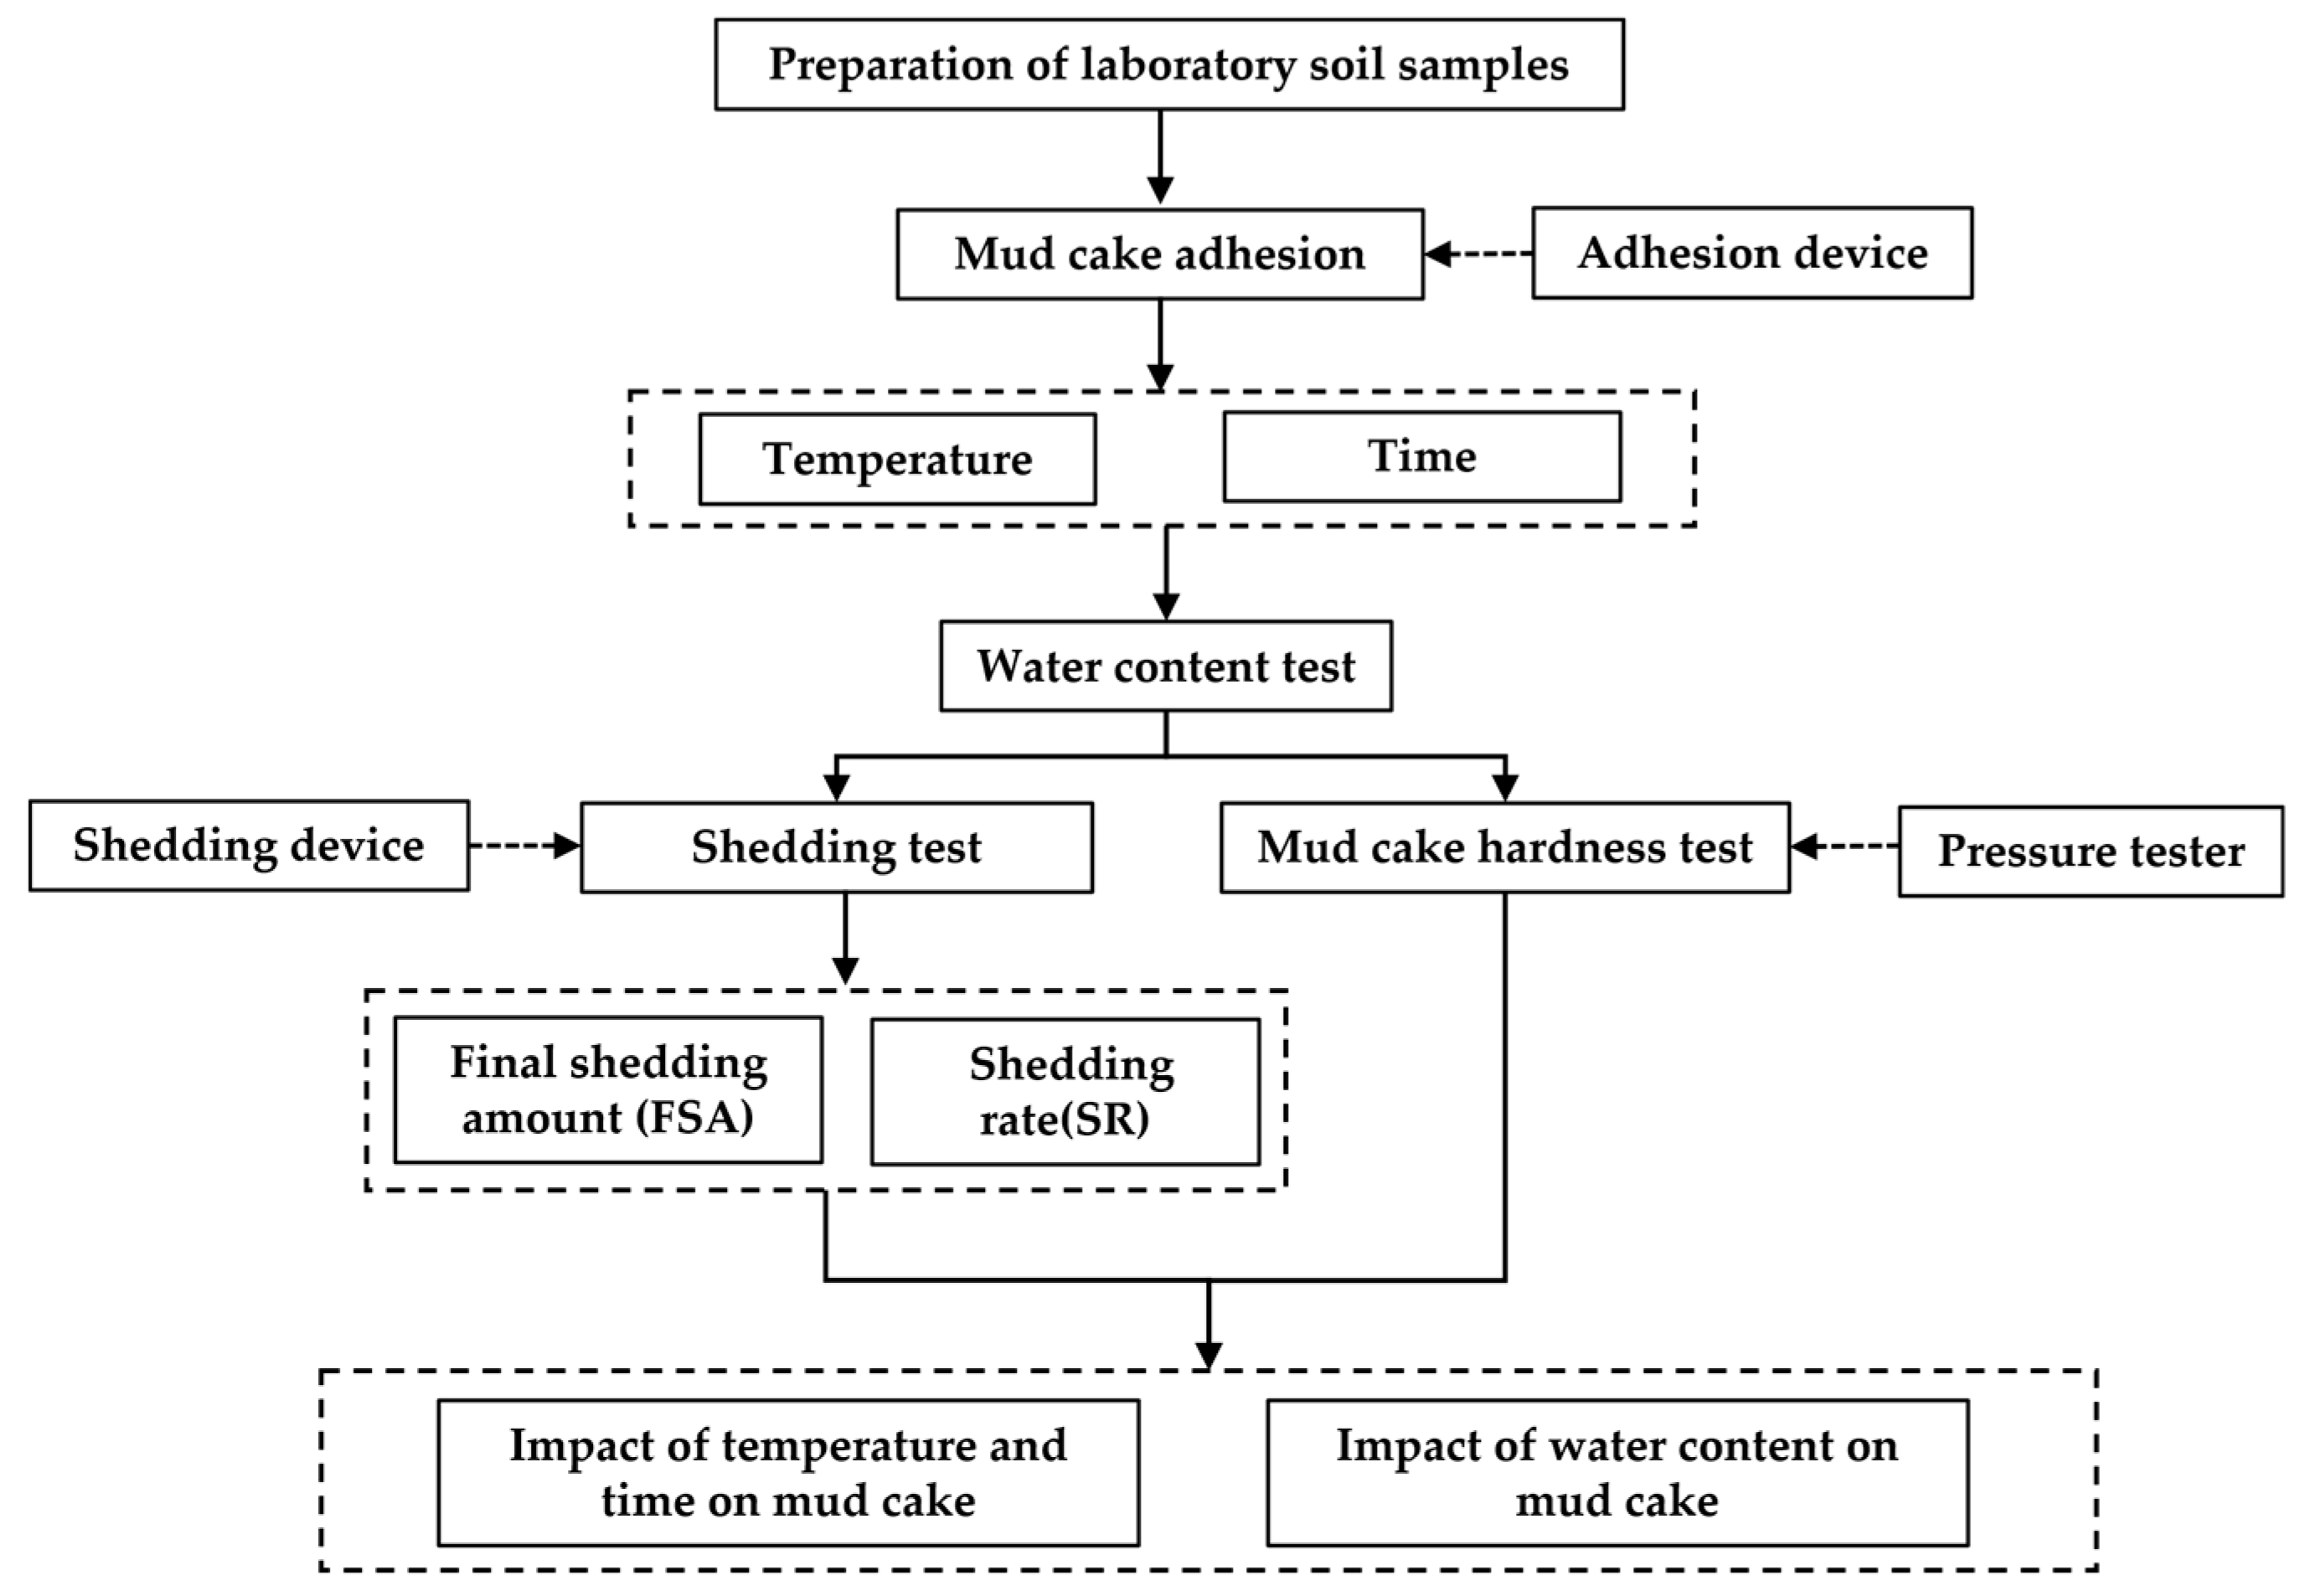
This study employs experimental methods to investigate the adhesion characteristics between the cutter head and the mud cake under different temperature conditions, and to test the hardness of the mud cake. The main procedures and content of the experiment include:
- Preparation of the soil samples for the experiment. After removing impurities from the mud cake, the dried soil samples are rehydrated to their natural water content to prepare the experimental soil samples.
- Development of the adhesion device and mud cake shedding experiments. First, a device is developed to prepare mud cake samples that simulate actual conditions. This device applies pressure to the mud cake, mimicking the pressure on the cutter head face, while also using motor rotation to simulate the turning of the cutter head, creating mud cakes that closely resemble real conditions. Subsequently, the cutter head with an adhered mud cake is placed in an oven to bake, simulating the adhesion characteristics of the cutter head and mud cake at different temperatures and durations.
- The mud cake hardness test involves using a pressure gauge with a conical head to perform a compressive penetration destruction test on the mud cake adhering to the cutter head. The compressive penetration load is used to characterize the hardness of the mud cake, obtaining hardness values under various temperatures and durations.
A flowchart of the experimental methods is shown in Figure 5.

Figure 5.
The flowchart of the experimental methods.
3.2.1. Preparation of Laboratory Soil Samples
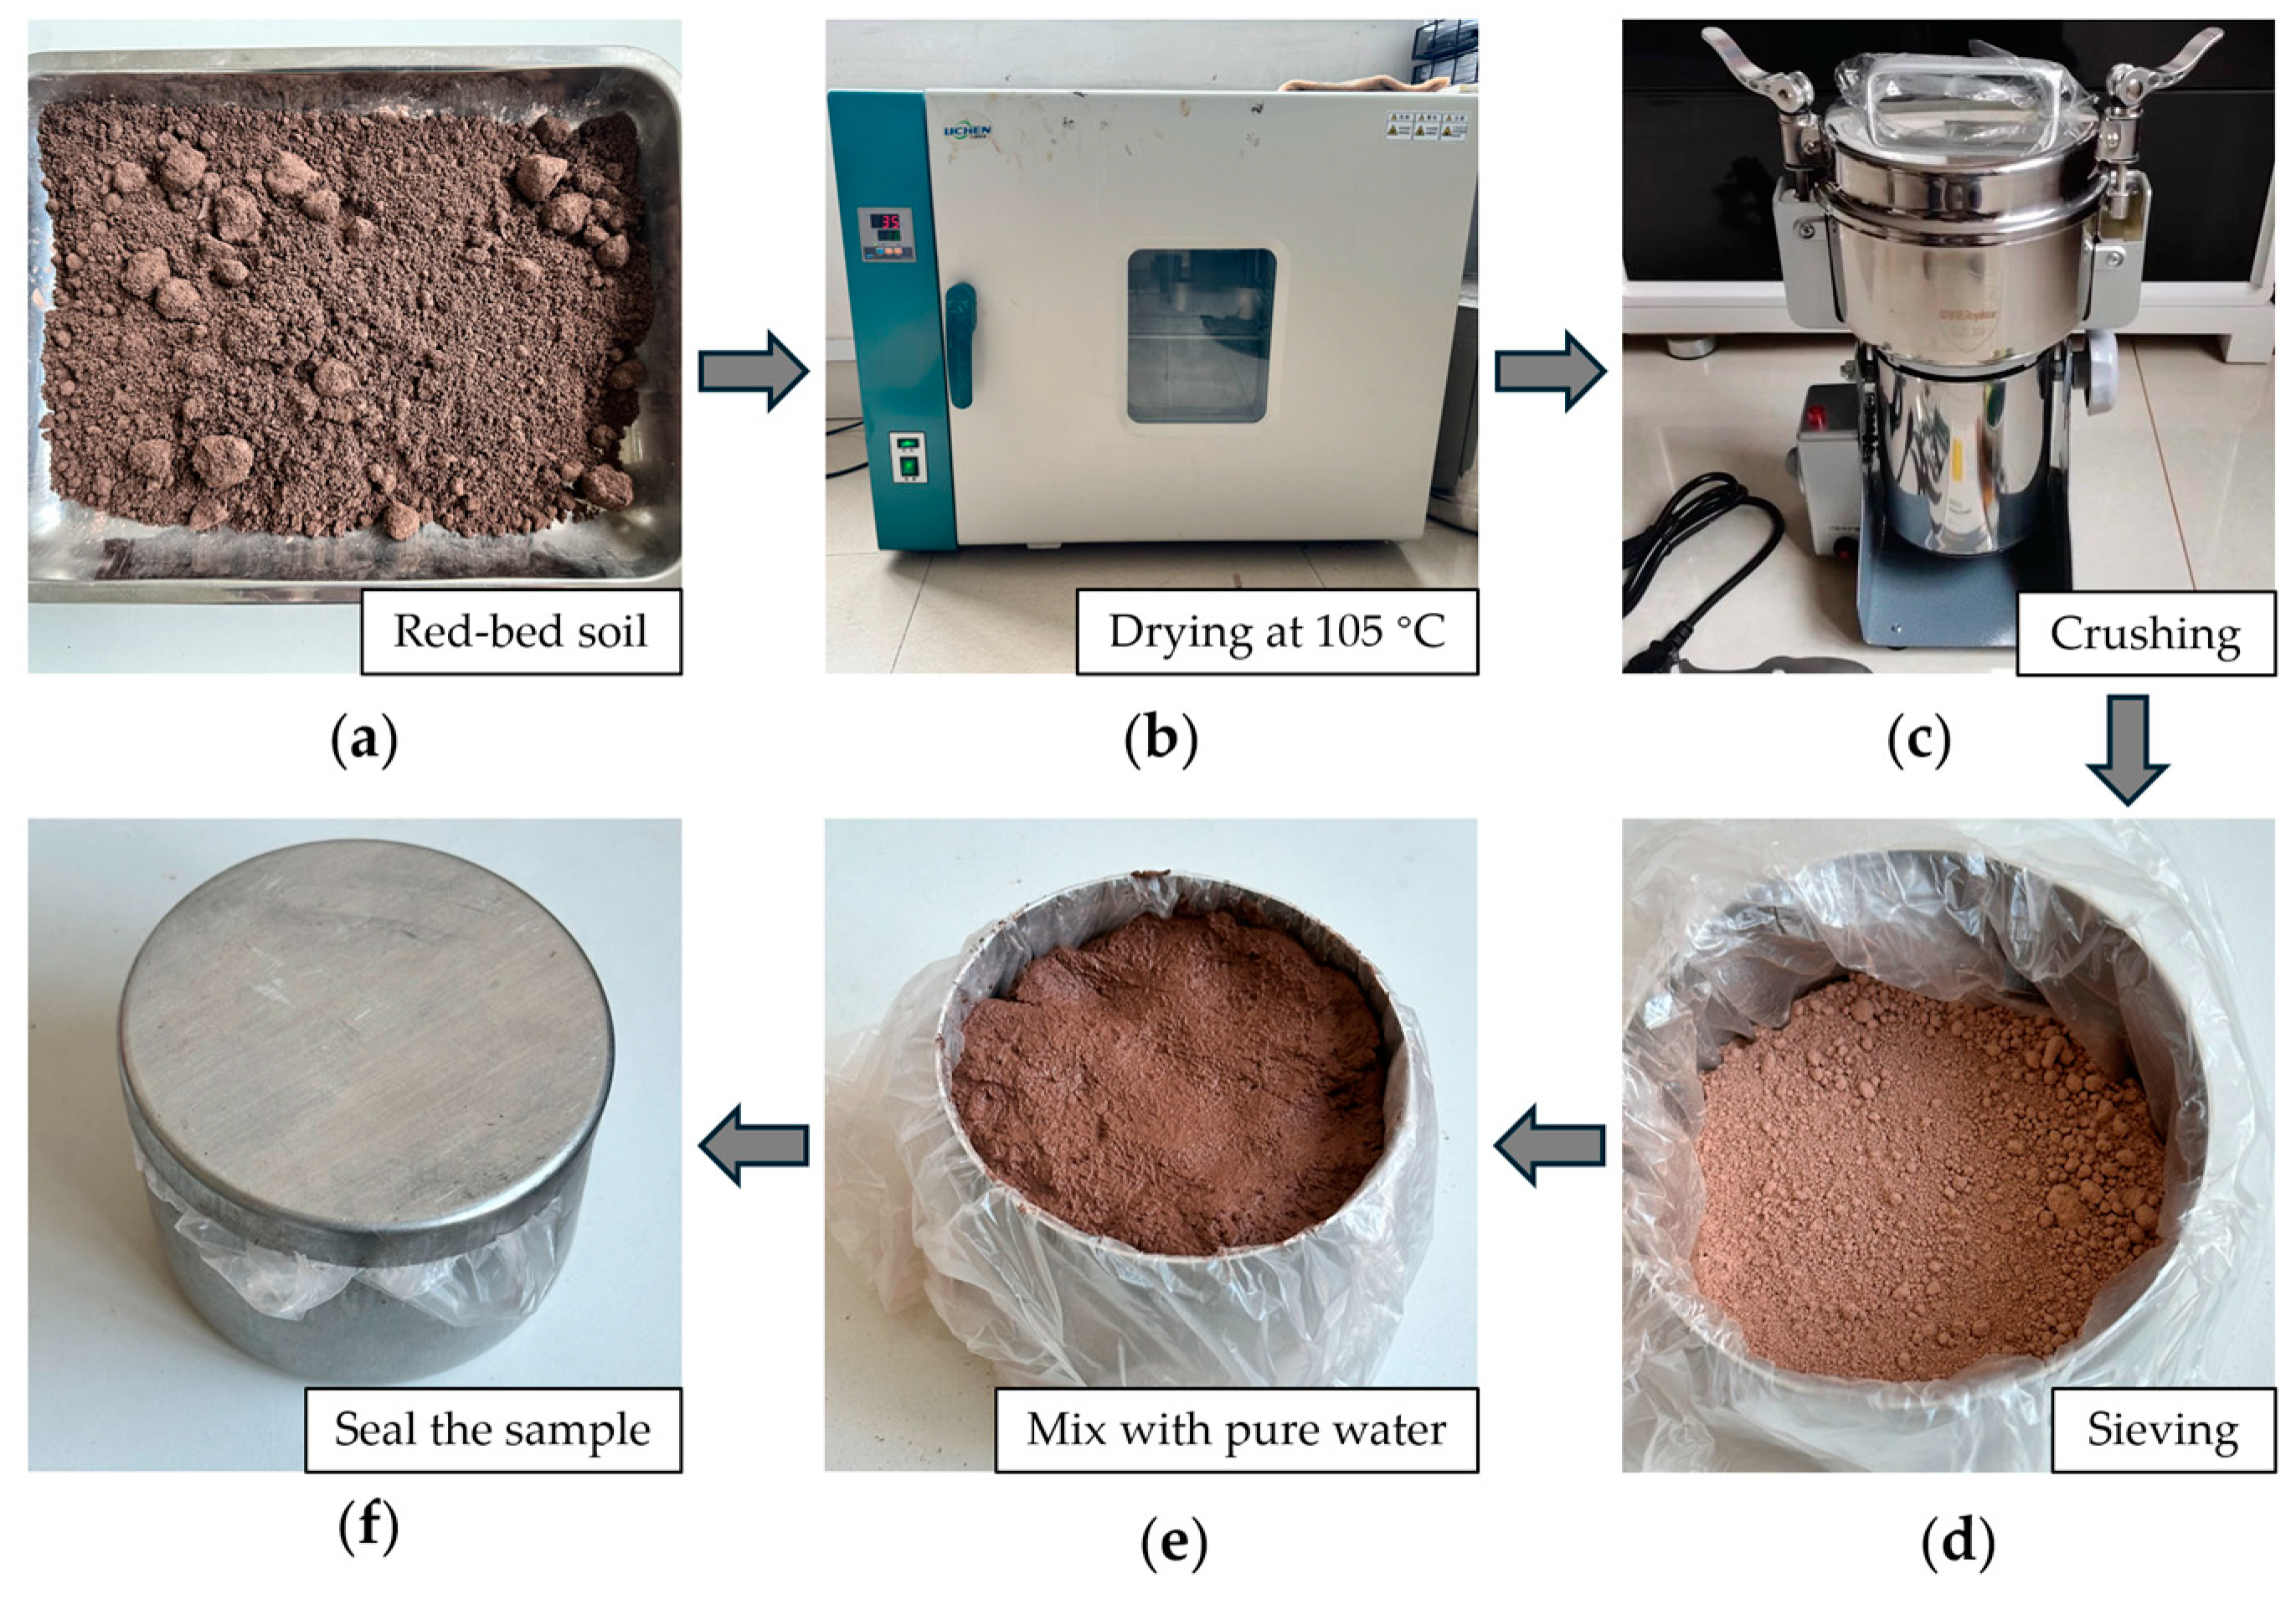
The soil samples on the cutterhead show certain differences from natural soil samples, necessitating the removal of rock impurities and adjustment of water content for laboratory preparation. The specific process is shown in Figure 6.

Figure 6.
The Process of laboratory soil sample preparation. (a) Red-bed soil; (b) drying the soil; (c) crushing the soil; (d) sieving the soil; (e) mixing with pure water; (f) sealing the soil sample.
First, the soil brought back from the site (Figure 6a) is heated in an oven at 105 °C for approximately 24 h to completely dry the moisture in the soil sample (Figure 6b). Then, the soil is crushed in a crusher (Figure 6c) and sifted through a 0.1 mm sieve to separate the rock particles (Figure 6d). Subsequently, the separated soil is uniformly mixed with pure water (Figure 6e) to achieve a natural water content of 36.5%. The mixed soil is then sealed in a container for over 24 h (Figure 6f) to prepare the soil samples.
Before the experiment, the water content of the soil samples was randomly measured, and the measured water content had an error of less than 0.5% compared to the designed water content, indicating that the soil samples prepared in the laboratory accurately replicate the physical characteristics of natural soil.
3.2.2. Mud Cake Adhesion Preparation Device
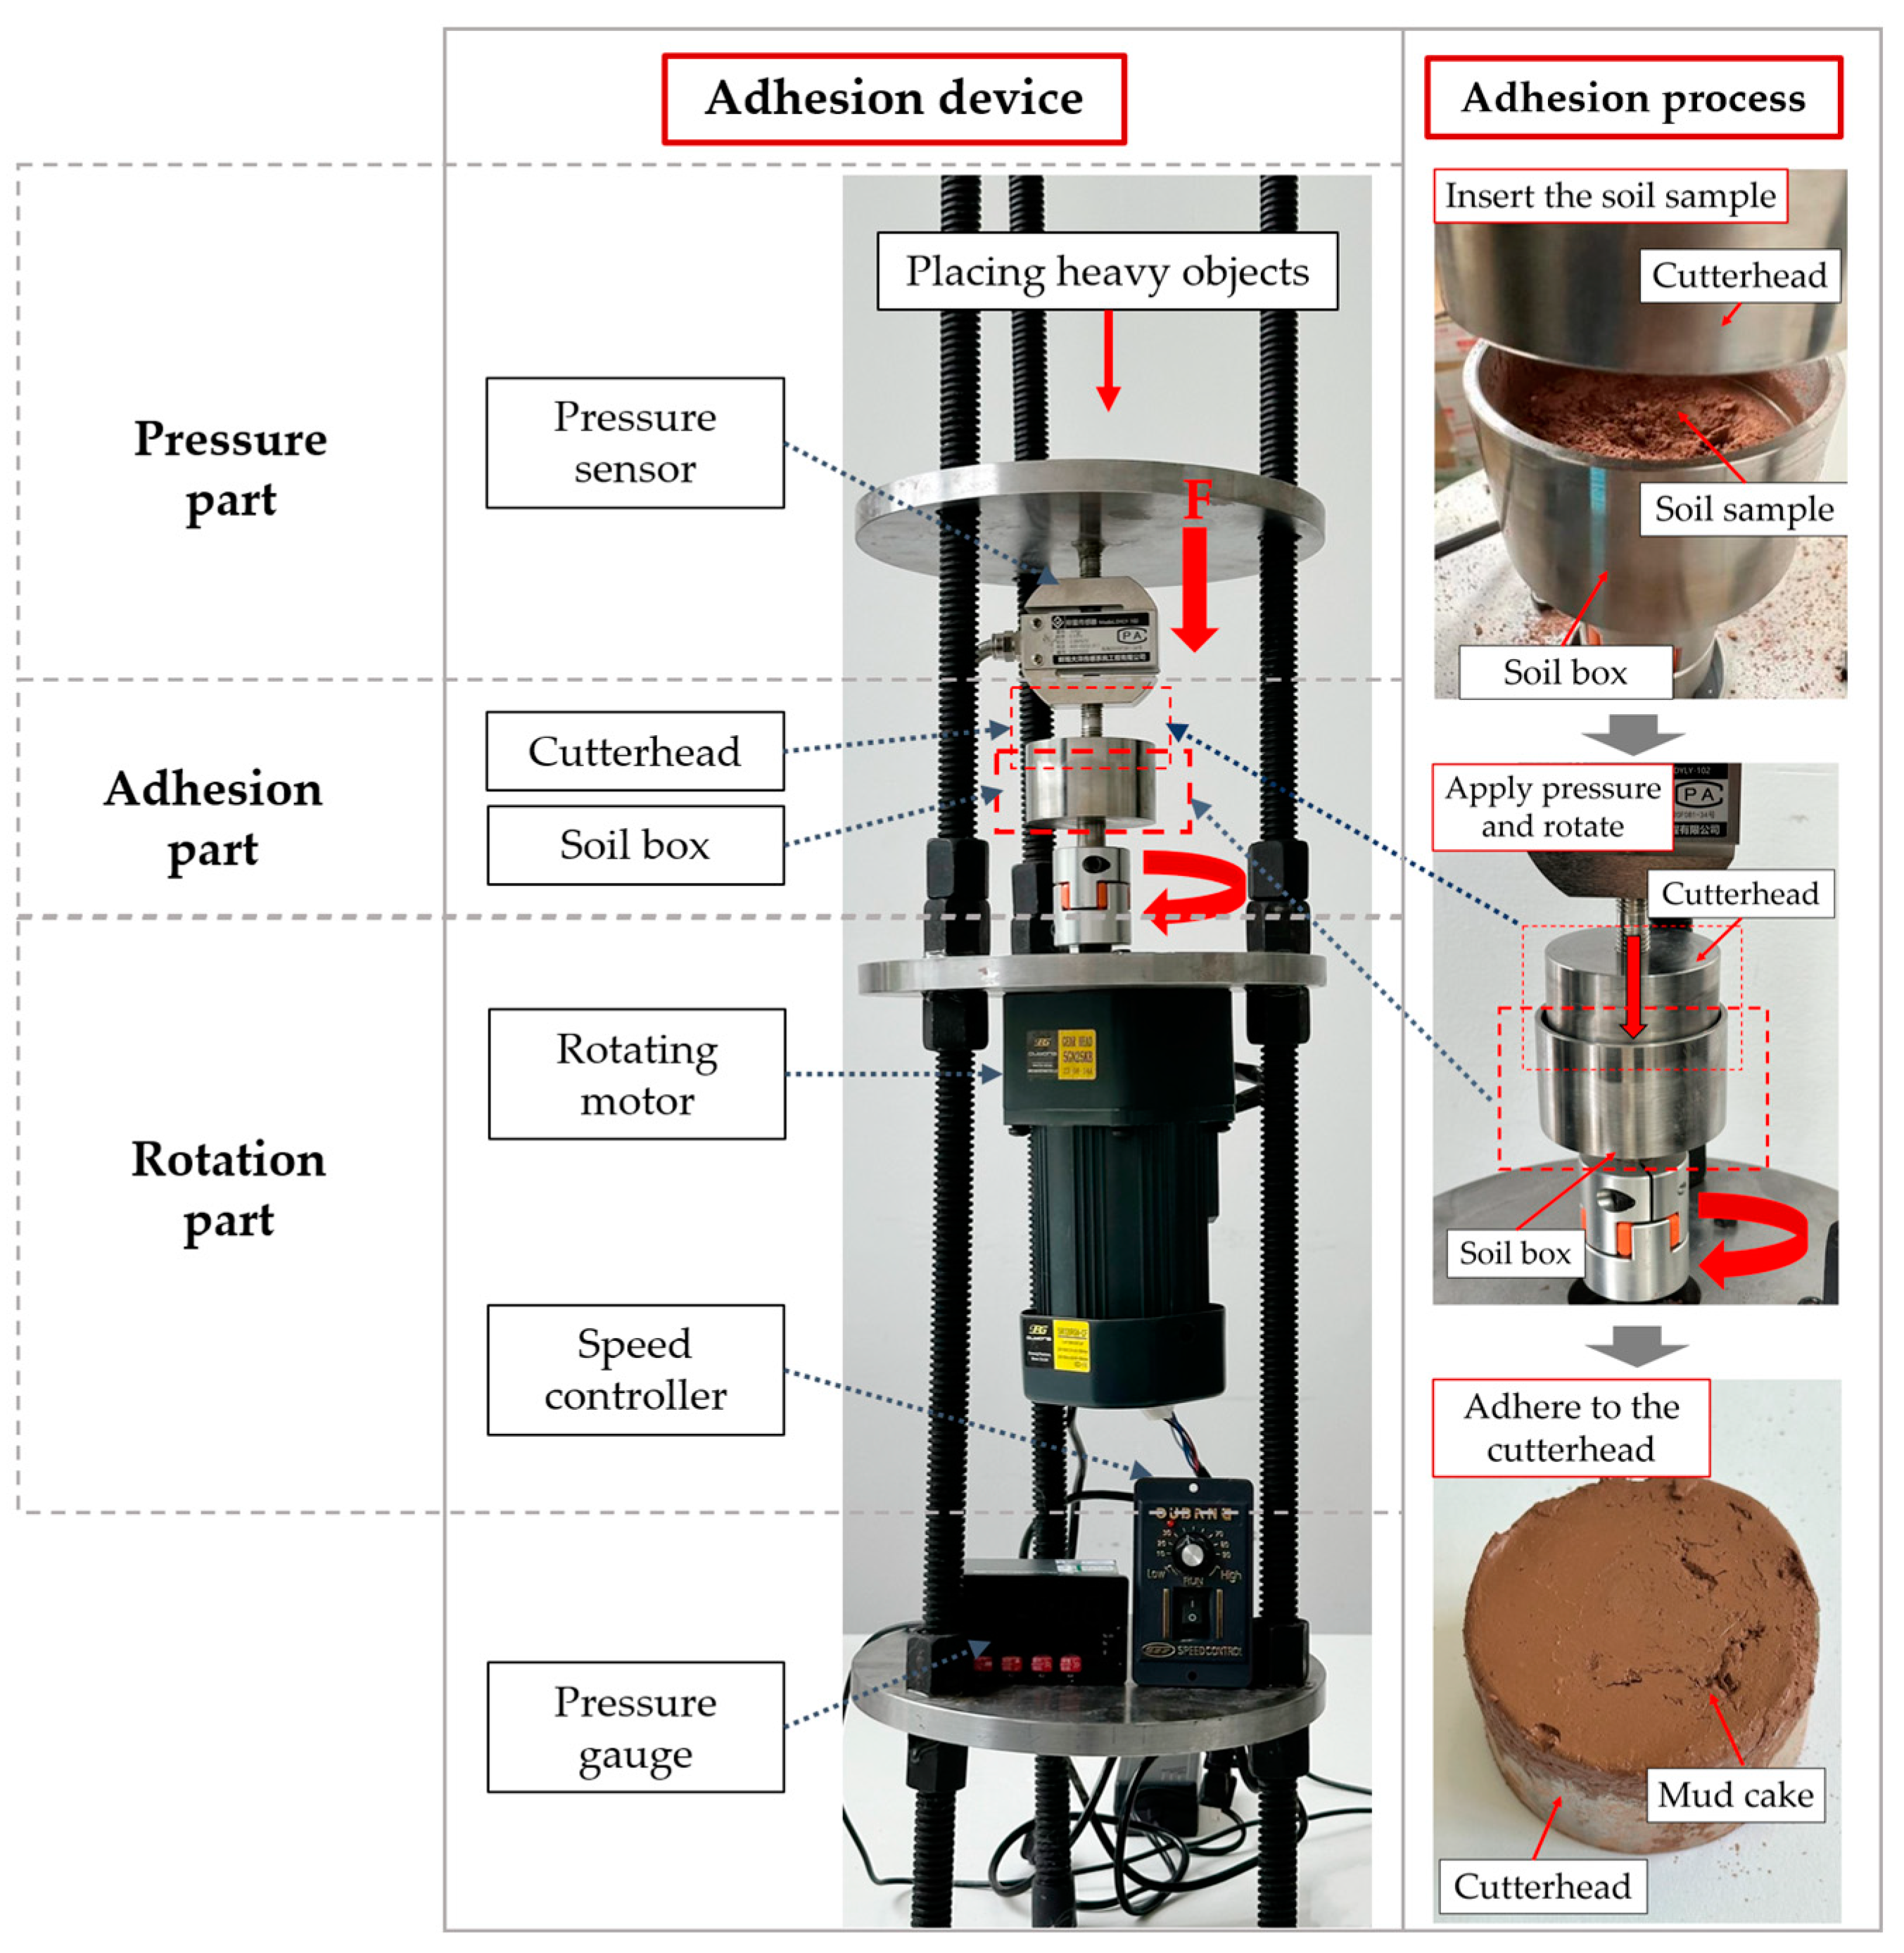
During the advancement of the shield machine, there is compression between the cutterhead and the soil, with the pressure on the face typically ranging from 50 kPa to 350 kPa. Additionally, while compressing, the cutterhead also rotates, with a speed range of 1–10 rpm.
Based on the operational characteristics of the cutterhead during shield machine advancement, the mud cake adhesion preparation device self-designed by the research team includes the Adhesion Part, the Pressure Part, and the Rotation Part, as shown in Figure 7.

Figure 7.
Mud cake adhesion preparation device.
The Adhesion Part primarily consists of a cutterhead and a soil box. After applying a demolding lubricant inside the soil box, 30 g of soil sample is added, followed by insertion into the cutterhead. The top of the cutterhead connects to the Pressure Part, and the bottom of the soil box connects to the Rotation Part. To simulate the compression between the cutterhead and the soil, the top of the cutterhead is loaded with weights and monitored by a pressure sensor in real-time.
During the experiment, the pressure inside the soil box is controlled at 100 kPa. The rotation of the cutterhead is facilitated by the Rotation Part, achieved by installing a rotating motor at the bottom of the soil box. The motor’s rotation drives the soil box, simulating the rotation of the cutterhead. The rotation speed is maintained at 5 r/min by a speed controller. After a continuous application of pressure and rotation for 10 min, the cutterhead is slowly lifted from the soil box to produce the mud cake sample adhered to the cutterhead.
3.2.3. Mud Cake Shedding Test
After weighing the cutterhead with the attached mud cake samples, they are placed in an oven and baked at eight different temperatures: 25 °C, 50 °C, 75 °C, 100 °C, 125 °C, 150 °C, 175 °C, and 200 °C, for durations of 10, 20, 30, 40, and 50 min, resulting in a total of 40 mud cake samples. Specific details are provided in Table 2. After baking is complete, the samples are weighed again, and the water content (weight of water divided by the weight of the dry soil) of each sample is calculated.
Table 2.
Test Samples.
As shown in Figure 8, the samples are placed in a transparent square box filled with pure water for soaking. The cutterhead with the prepared mud cake is positioned vertically on a mesh panel for easy observation of the experiment and to determine if the test is complete. The placement of the test samples also closely aligns with actual construction practices.
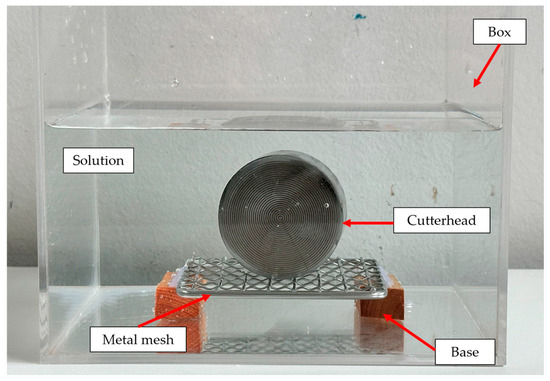
Figure 8.
Mud cake shedding test device.
The condition of the mud cake samples’ shedding is recorded every second. When the mud cake sample on the cutterhead has mostly detached or no longer changes over a long period, the cutterhead is taken out. The amount of mud cake shed is determined using the image processing software Image-Pro Plus 6.0 (Figure 9). The final shedding amount (FSA) is calculated using Equation (1):
where At represents the percentage of the sample shed at time t and S0 and St represent the areas of the mud cake adhered to the cutterhead surface at the start of the experiment and at time t, measured in cm2.

Figure 9.
Image processed using Image-Pro Plus software.
Combining the duration of the test, the change in mud cake shedding per unit of time can be determined, defined as the shedding rate (SR). The calculation is shown in Equation (2):
where Vt is the mud cake shedding rate, measured in s−1; At is the final shedding amount of mud cake; and T is the time required for complete shedding, measured in seconds.
3.2.4. Mud Cake Hardness Test
Hardness tests were conducted on samples baked for 50 min at temperatures of 25 °C, 50 °C, 75 °C, 100 °C, and 125 °C to study the variations in mud cake hardness at different temperatures. Specific details are provided in Table 2, marked with an “*” label.
After baking, the samples are positioned with the cutterhead at the bottom and the mud cake on top. A pressure gauge is used to perform pressure tests on the mud cake to measure its hardness, as shown in Figure 10.

Figure 10.
Pressure sensor.
The pressure sensor utilized in the experiment is the SH-III-200 manufactured by Suce Measurement Technology Co., Ltd. (Shanghai, China), with a range of 200 N and a graduation value of 0.01 N. It features a conical sensor head with a diameter of 10 mm and a height of 5 mm. This pressure sensor is connected to a computer that logs the pressure data.
For the test, the gauge is positioned vertically atop a mud cake sample, and pressure is progressively increased until the sensor head penetrates the mud cake. The first peak pressure recorded is considered the ultimate pressure for determining the hardness of the mud cake. It is crucial to apply pressure smoothly and uniformly throughout the test, while also ensuring the sensor head remains clean and intact.
3.2.5. Test Samples
Table 2 lists the test samples for this study, which are mainly divided into two categories: Samples marked with an “*” underwent both shedding and hardness tests, with two samples of each type. Samples without an “*” only underwent shedding tests.
In the experimental labels, “T” followed by a number indicates the temperature and its value in degrees Celsius; the number following a “-” represents the baking time in minutes. An asterisk “*” indicates that both shedding and hardness tests were conducted. For example, “T25-20” denotes that the sample was baked at 25 °C for 20 min and underwent only the shedding test. “T125-50*” indicates that the sample was baked at 125 °C for 50 min and underwent both shedding and hardness tests.
4. Results
The mud cakes that formed and adhered to the cutterhead changed their physical characteristics with varying adhesion times and increasing temperatures of the cutterhead; their adhesion properties also changed.
The experiment tested the water content of the samples, as well as their shedding amount and rate in pure water under various temperature and time conditions to explore the effects on water content and mud cake adhesion. The choice to use pure water was made to avoid potential variations that could be introduced by others and to ensure consistency in testing. Additionally, hardness tests were conducted to study the effects of different temperatures and durations on the hardening of the mud cake.
4.1. The Impact of Temperature and Time on Mud Cake Shedding
A total of 40 samples were tested in mud cake shedding experiments, with temperatures ranging from 25 °C to 200 °C and baking durations from 10 to 50 min.
The relationships between temperature and time with the final shedding amount of the mud cake (FSA) and the shedding rate (SR) are displayed in Figure 11 using 3D bar graphs, respectively.

Figure 11.
Final shedding amount (FSA) and shedding rate (SR). (a) Temperature and time—FSA; (b) temperature and time—SR.
4.1.1. The Impact of Temperature on Mud Cake Shedding Amount and Rate
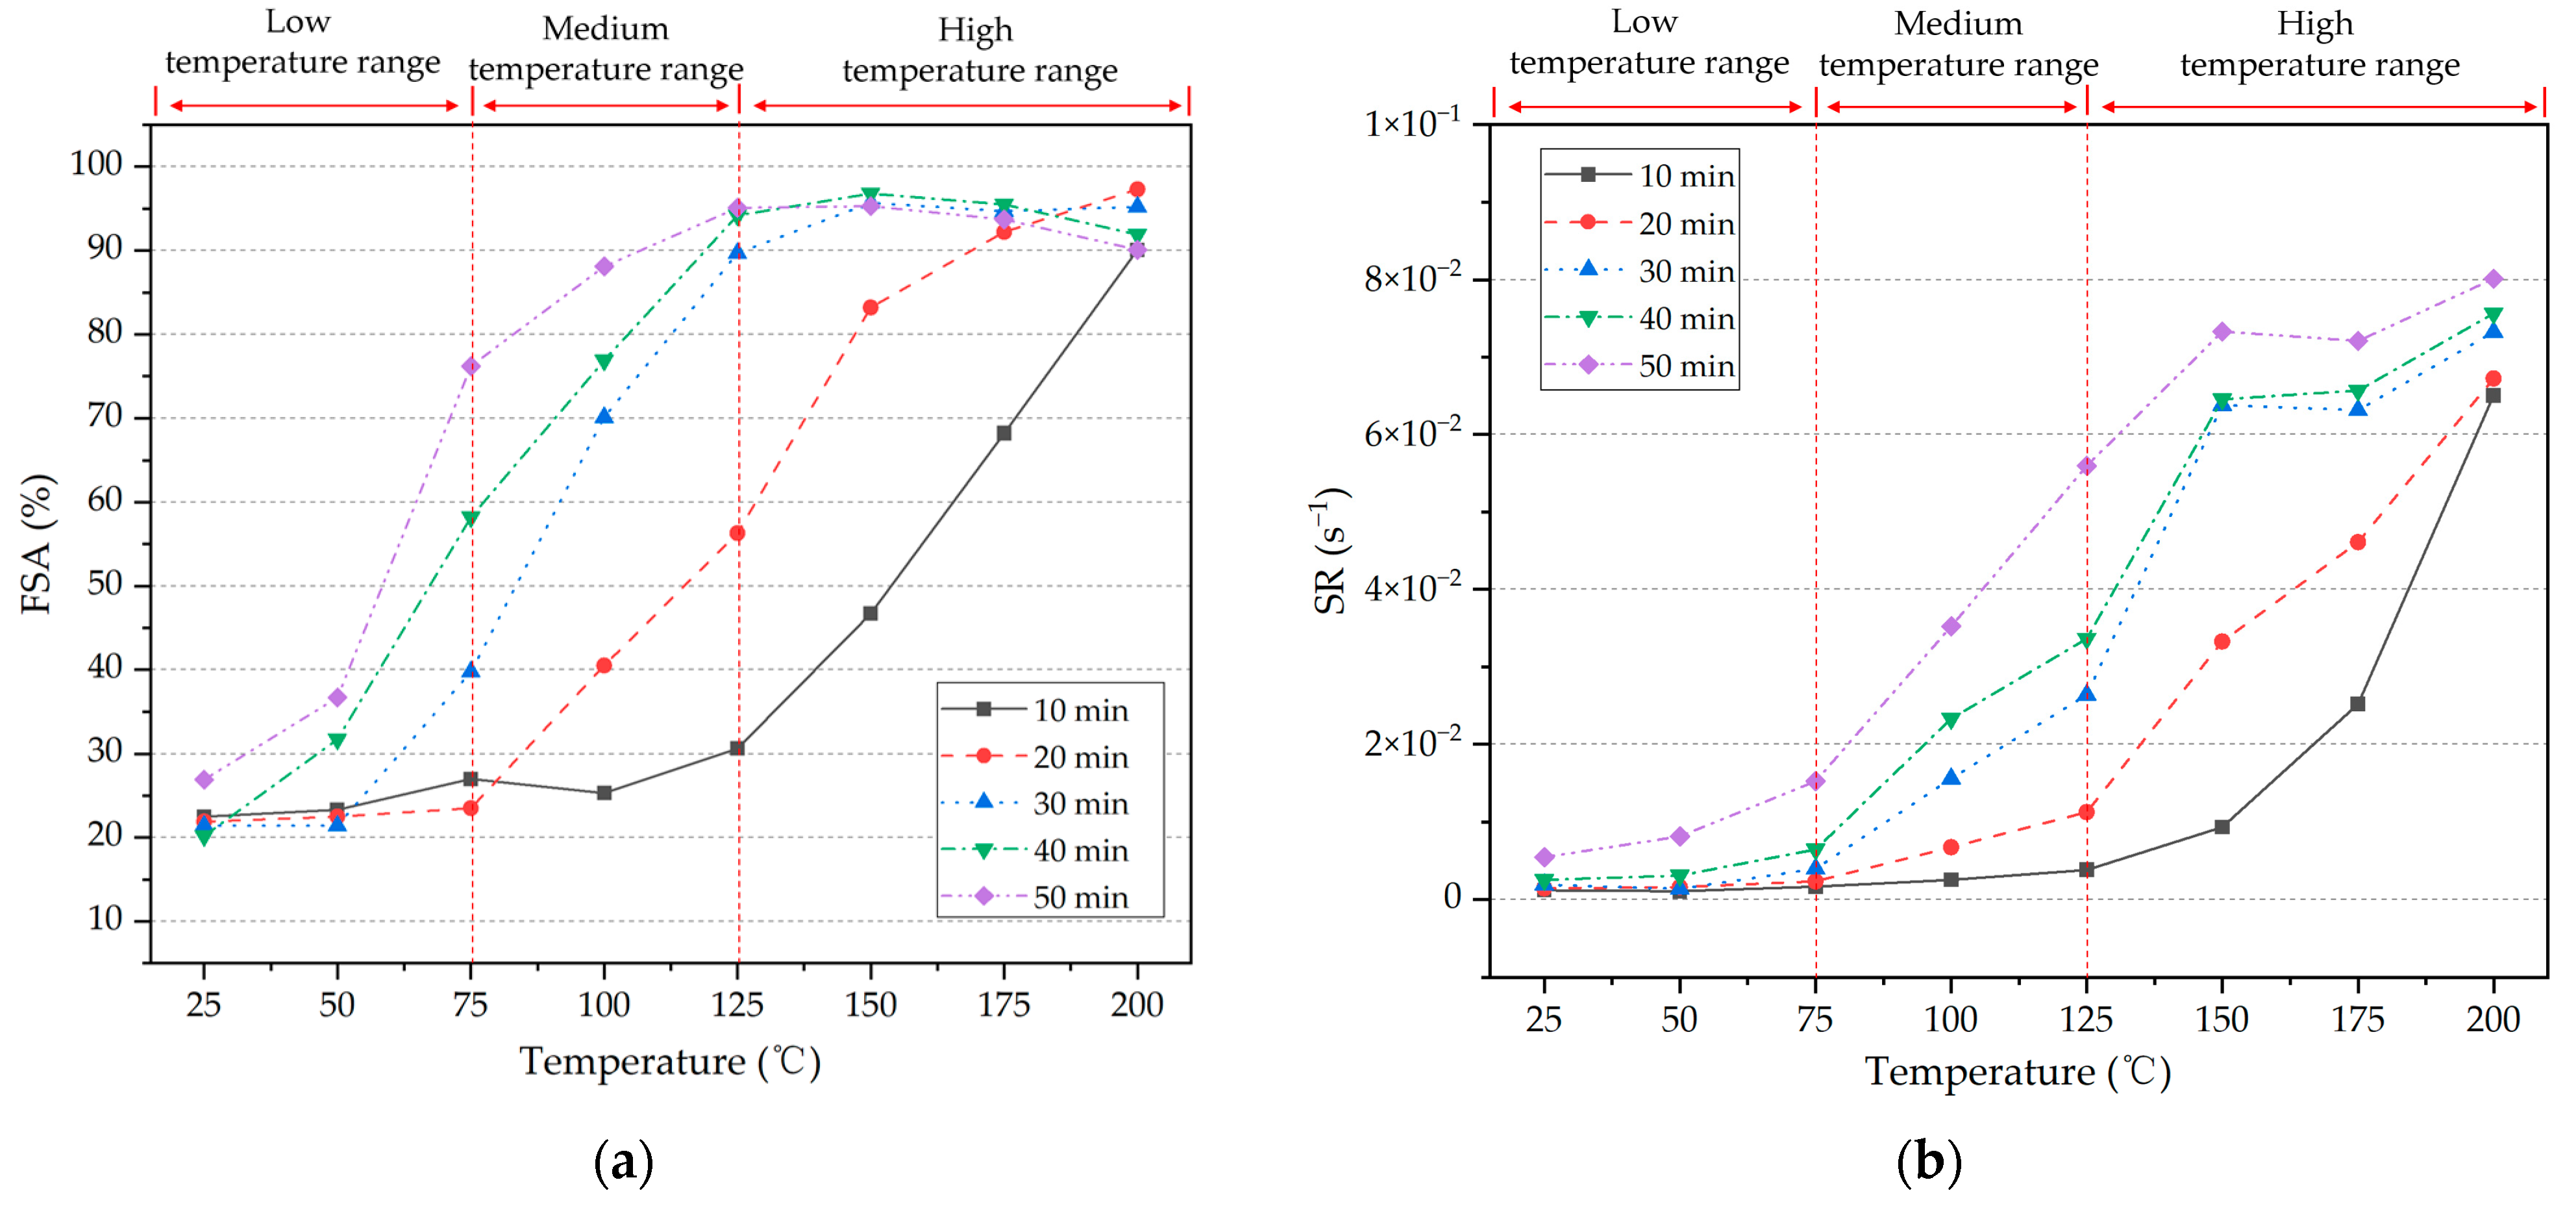
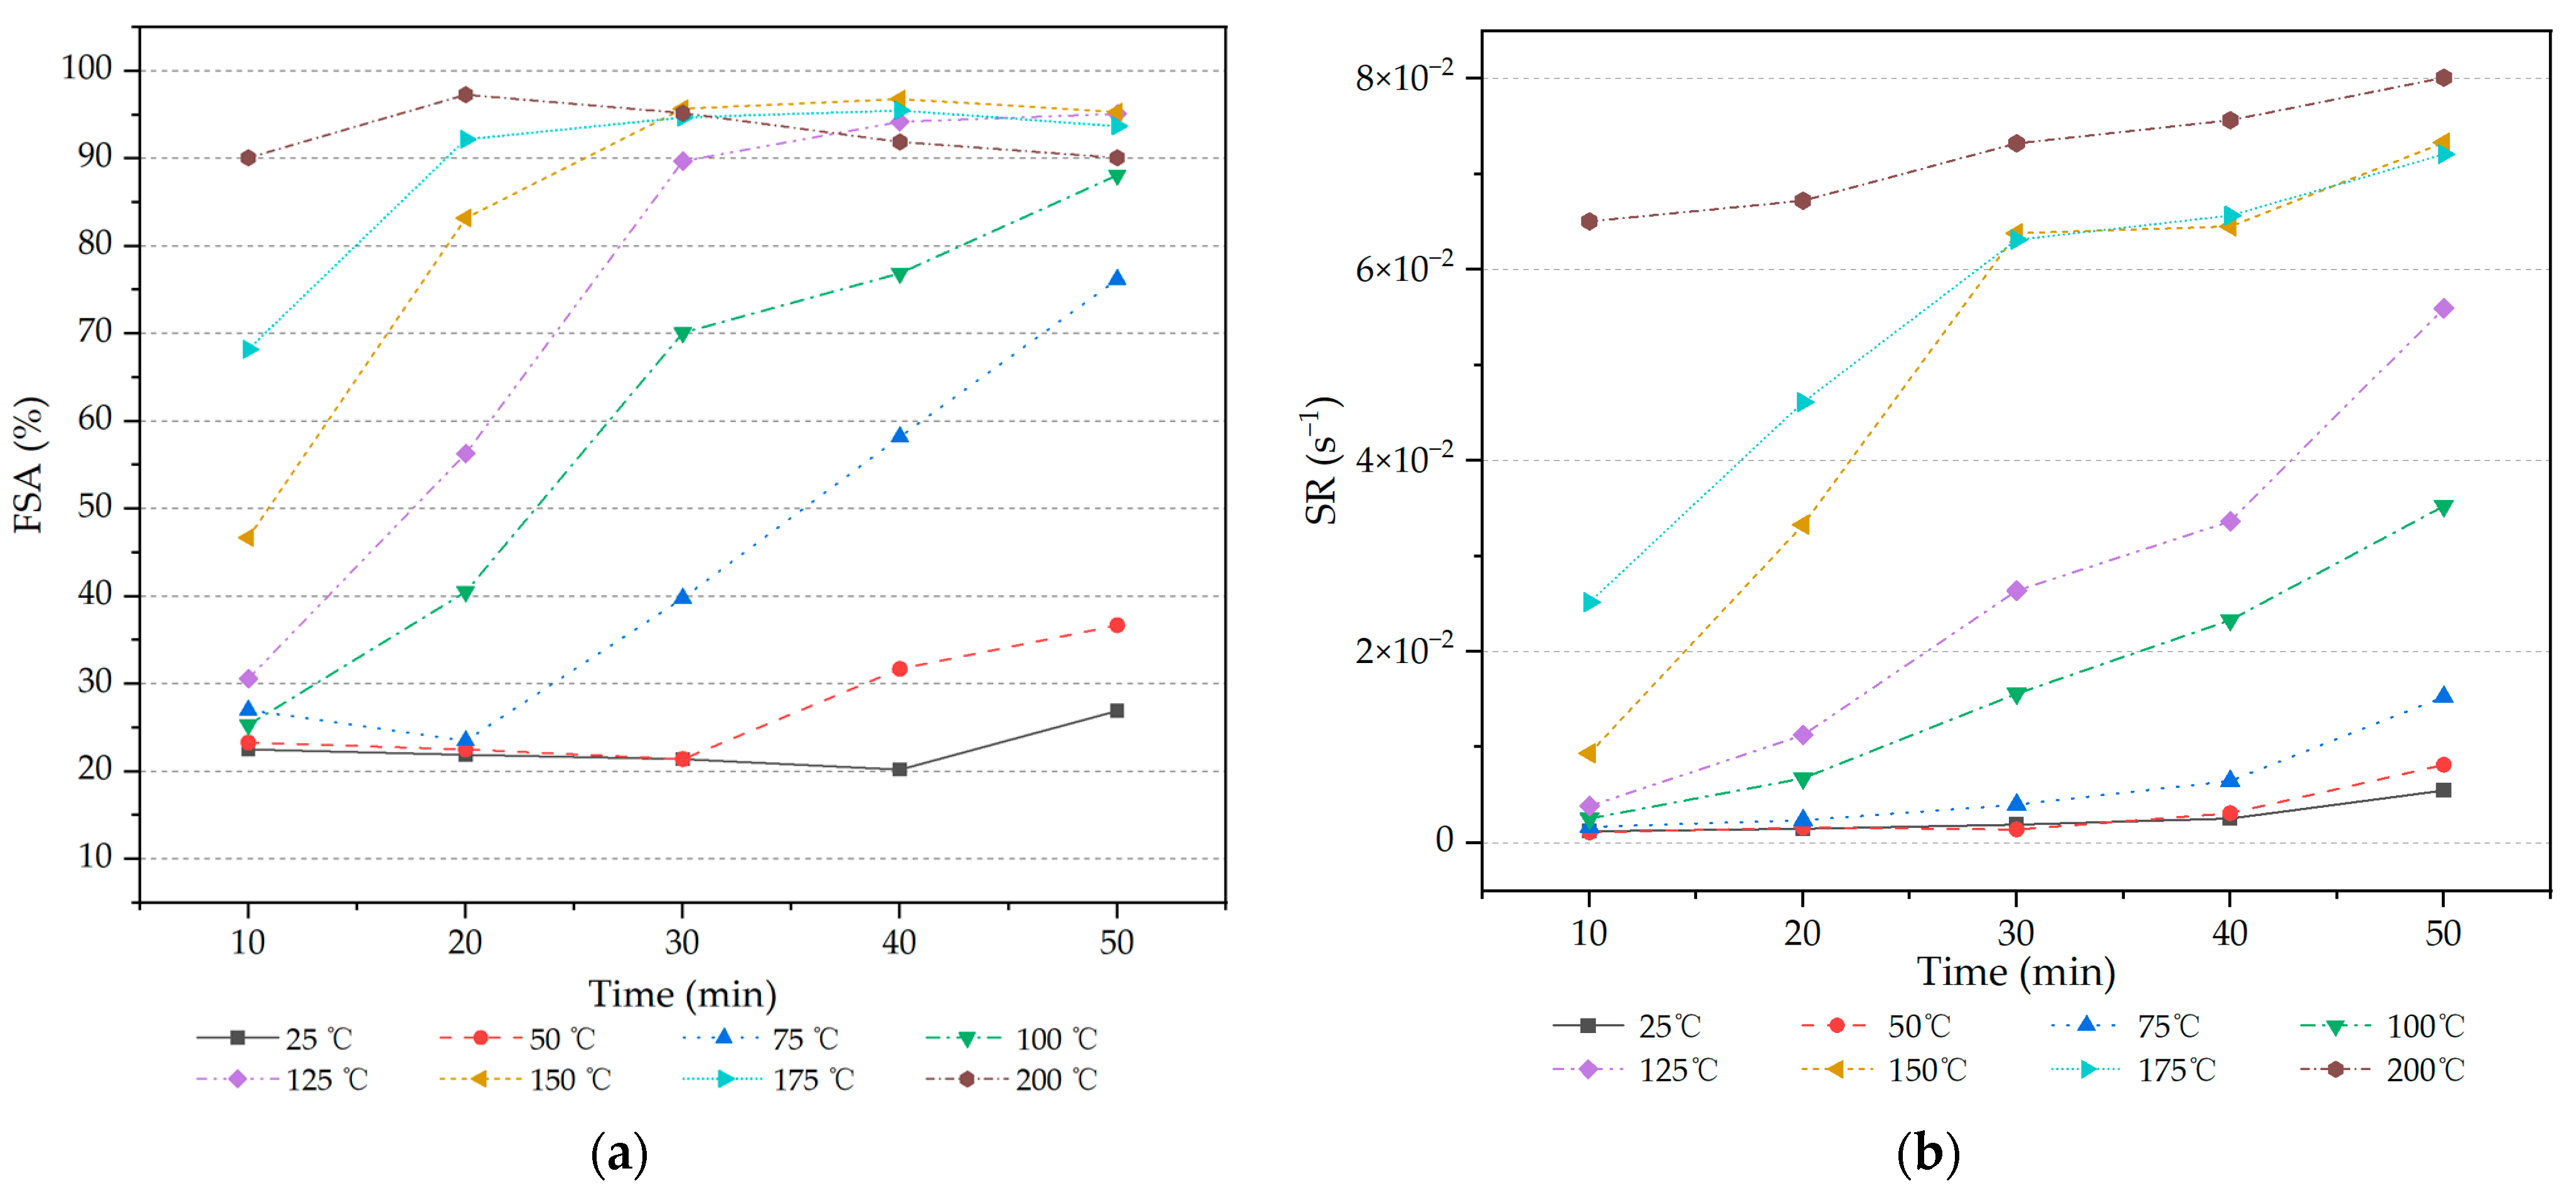
To further analyze the effects of temperature and time on the final shedding amount and rate, Figure 12 presents the relationships between temperature and the final shedding amount (Figure 12a) and temperature and shedding rate (Figure 12b).
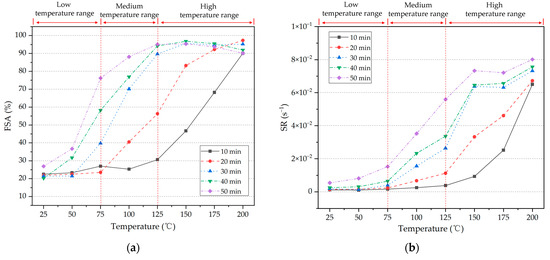
Figure 12.
Final shedding amount (FSA) and shedding rate (SR) of mud cake at different temperatures. (a) Temperature—FSA; (b) temperature—SR.
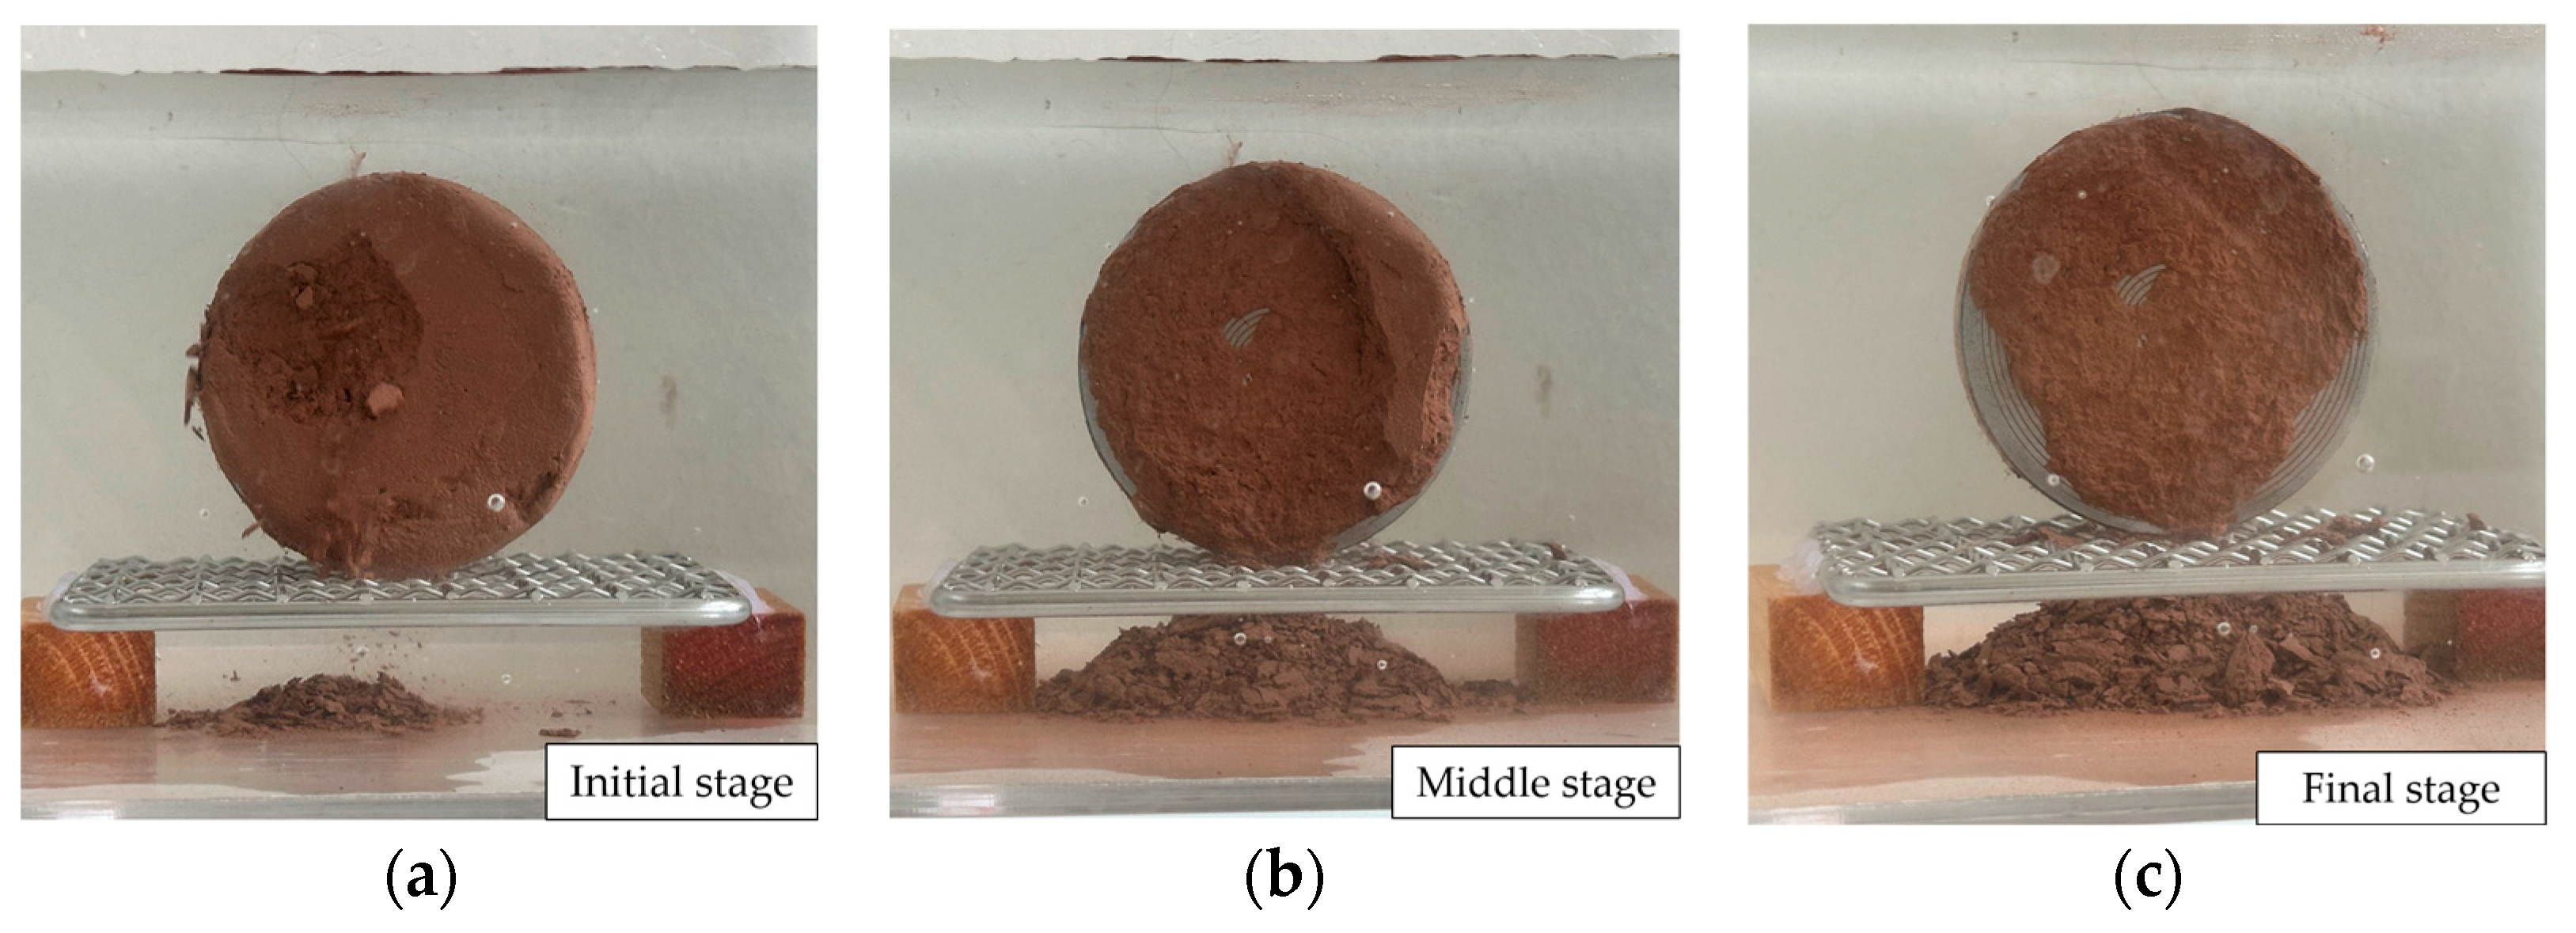
As shown in Figure 12a, in the lower temperature range (25 °C, 50 °C), the FSA values are relatively low and increase slowly. Specifically, at 25 °C, the FSA value changes little throughout the observation period, consistently being around 20% (Figure 13). At 50 °C, for a 50-min sample, the FSA value gradually increases from about 23.3% at 25 °C to 36.7%, indicating that the rise in surface temperature begins to accelerate the detachment process. However, during the first 30 min, the difference in temperature in the lower range has a minimal impact on FSA.

Figure 13.
Shedding process of sample T25-30. (a) Initial stage of shedding; (b) middle stage of shedding; (c) final stage of shedding.
As illustrated in Figure 12b, changes in the shedding rate (SR) in the low-temperature range are not significant. For 50-min samples, when the temperature is increased from 25 °C to 50 °C, the SR increases from 1.9 × 10⁻³ s−1 to 2.4 × 10⁻³ s−1, maintaining a relatively low shedding rate.
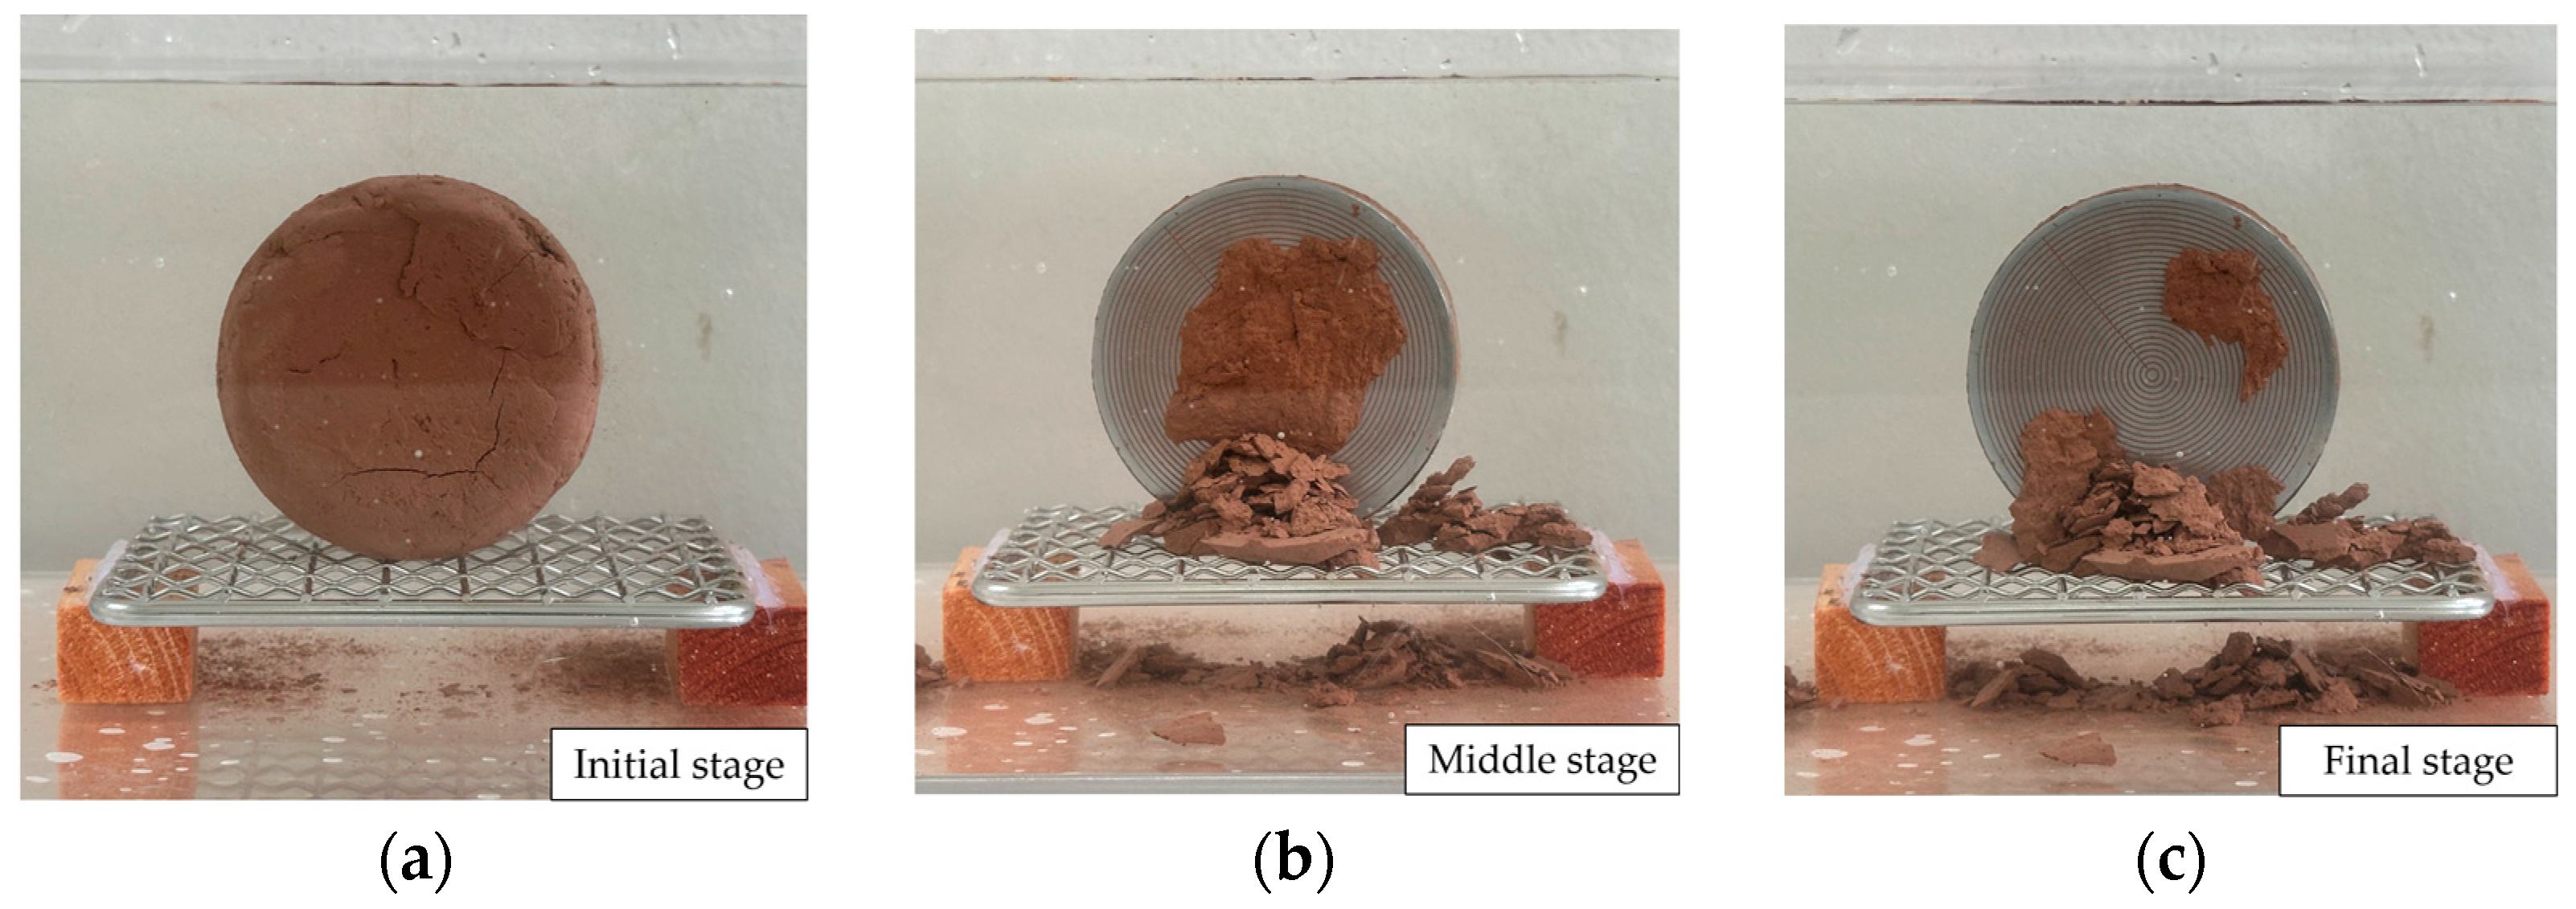
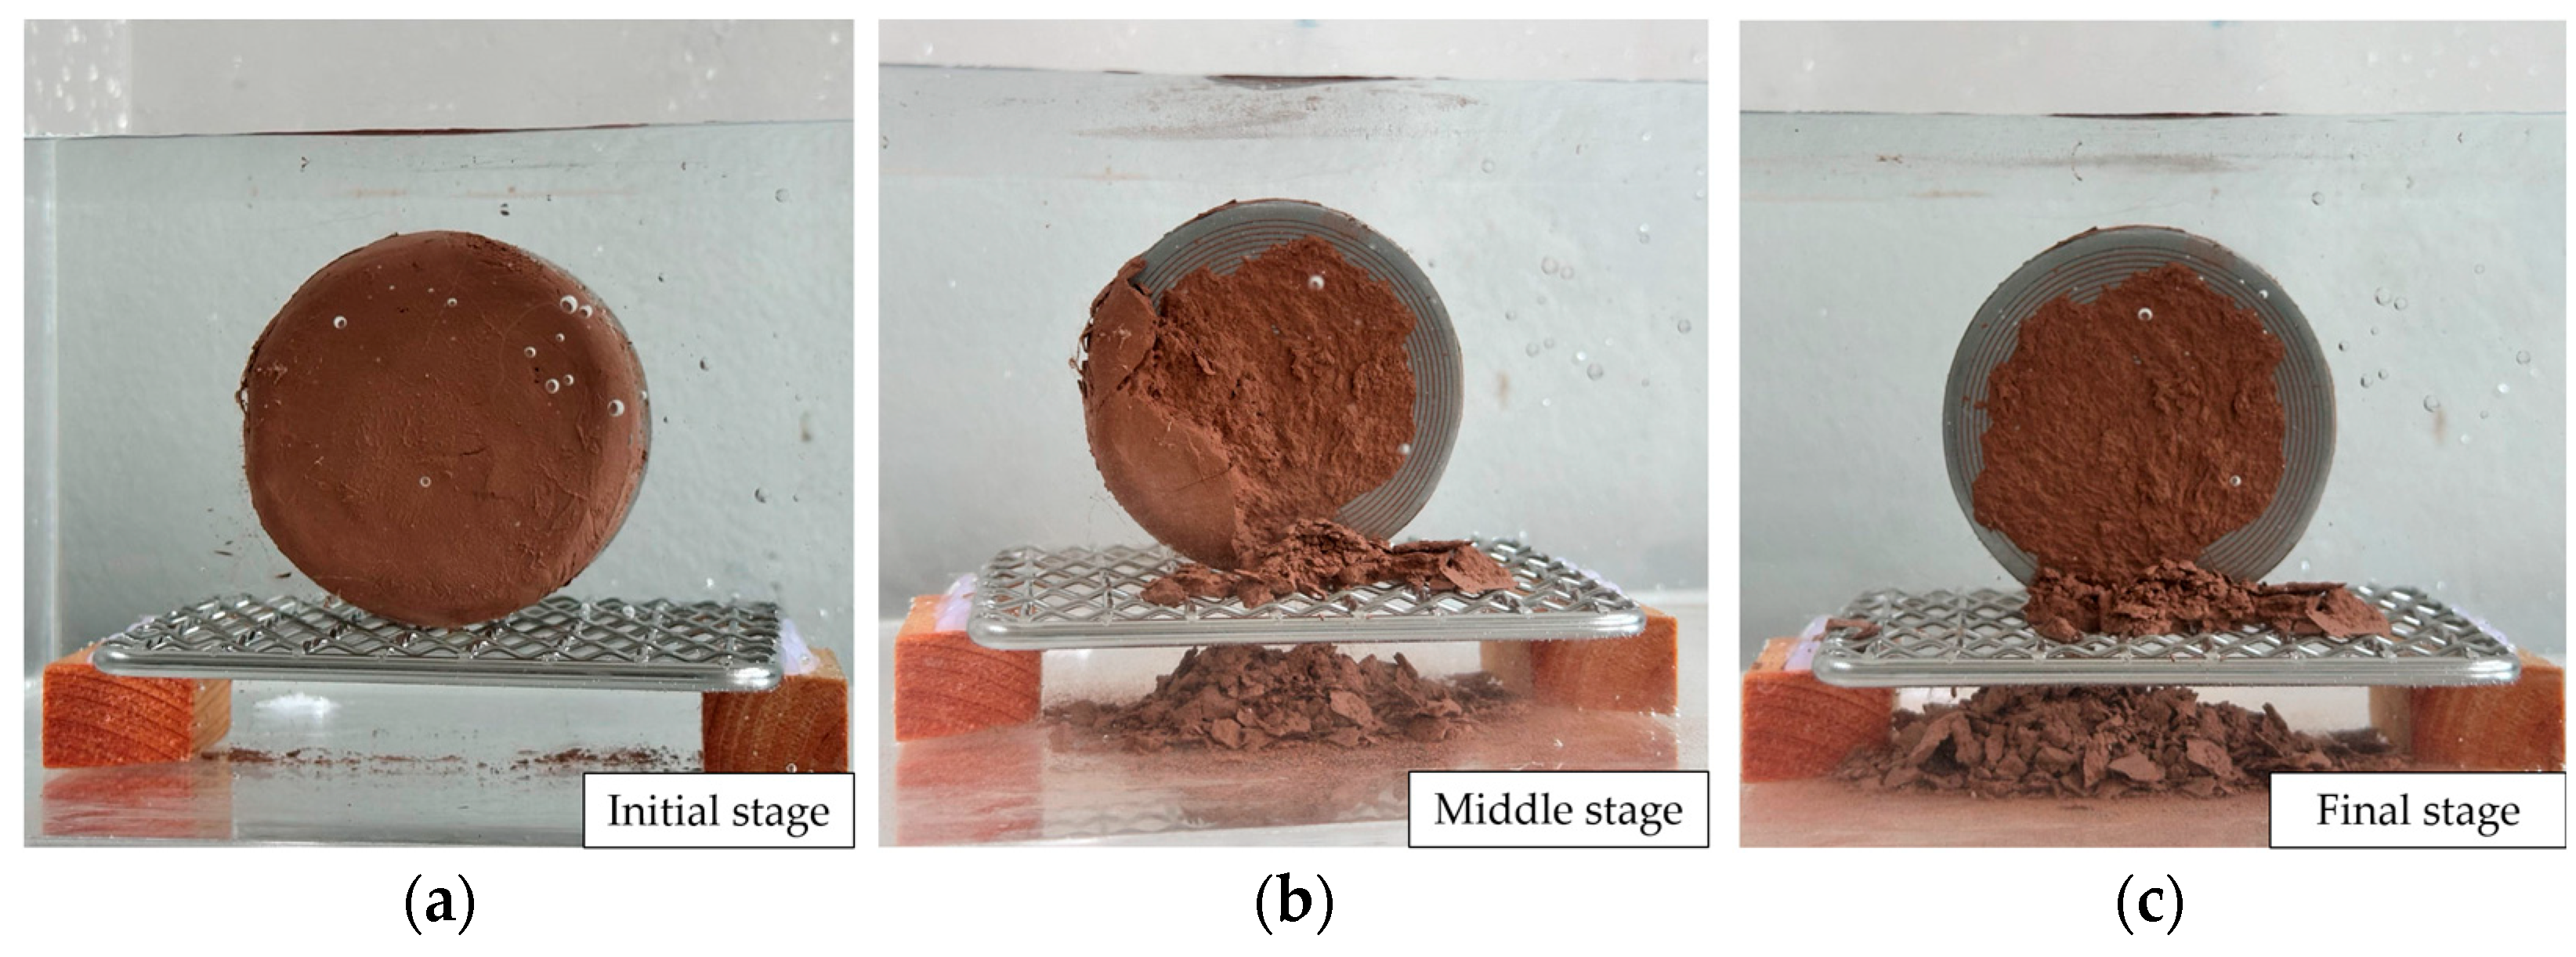
In the medium-temperature range (75 °C, 100 °C, 125 °C), the increase in FSA becomes significant. Figure 14 shows the shedding process of sample T100-30. For a 30-min sample at 75 °C, 100 °C, and 125 °C, the FSA values are 39.8%, 70.1%, and 89.7%, respectively, representing increases of 18.4%, 48.7%, and 68.3% over the FSA of sample T25-30 (21.4%). The growth rates are substantial.
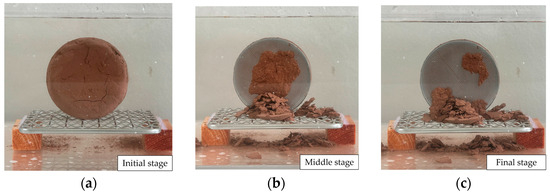
Figure 14.
Shedding process of sample T100-30. (a) Initial stage of shedding; (b) middle stage of shedding; (c) final stage of shedding.
This indicates that in the medium-temperature range, mud cake shedding is significantly influenced by temperature, and as the temperature increases, the components within the mud cake are more prone to shedding.
The shedding rate (SR) also accelerates with increasing temperature. The SR for sample T125-50 increased by approximately 58.7% compared to T100-50, and by about 267% compared to T75-50. Clearly, in the medium-temperature range, the increase in temperature significantly impacts mud cake adhesiveness and markedly accelerates the shedding process. The acceleration of the shedding process might be linked to changes in the internal structure of the material; the increase in temperature reduces the water content, which could weaken the internal binding forces within the mud cake or even cause cracks.
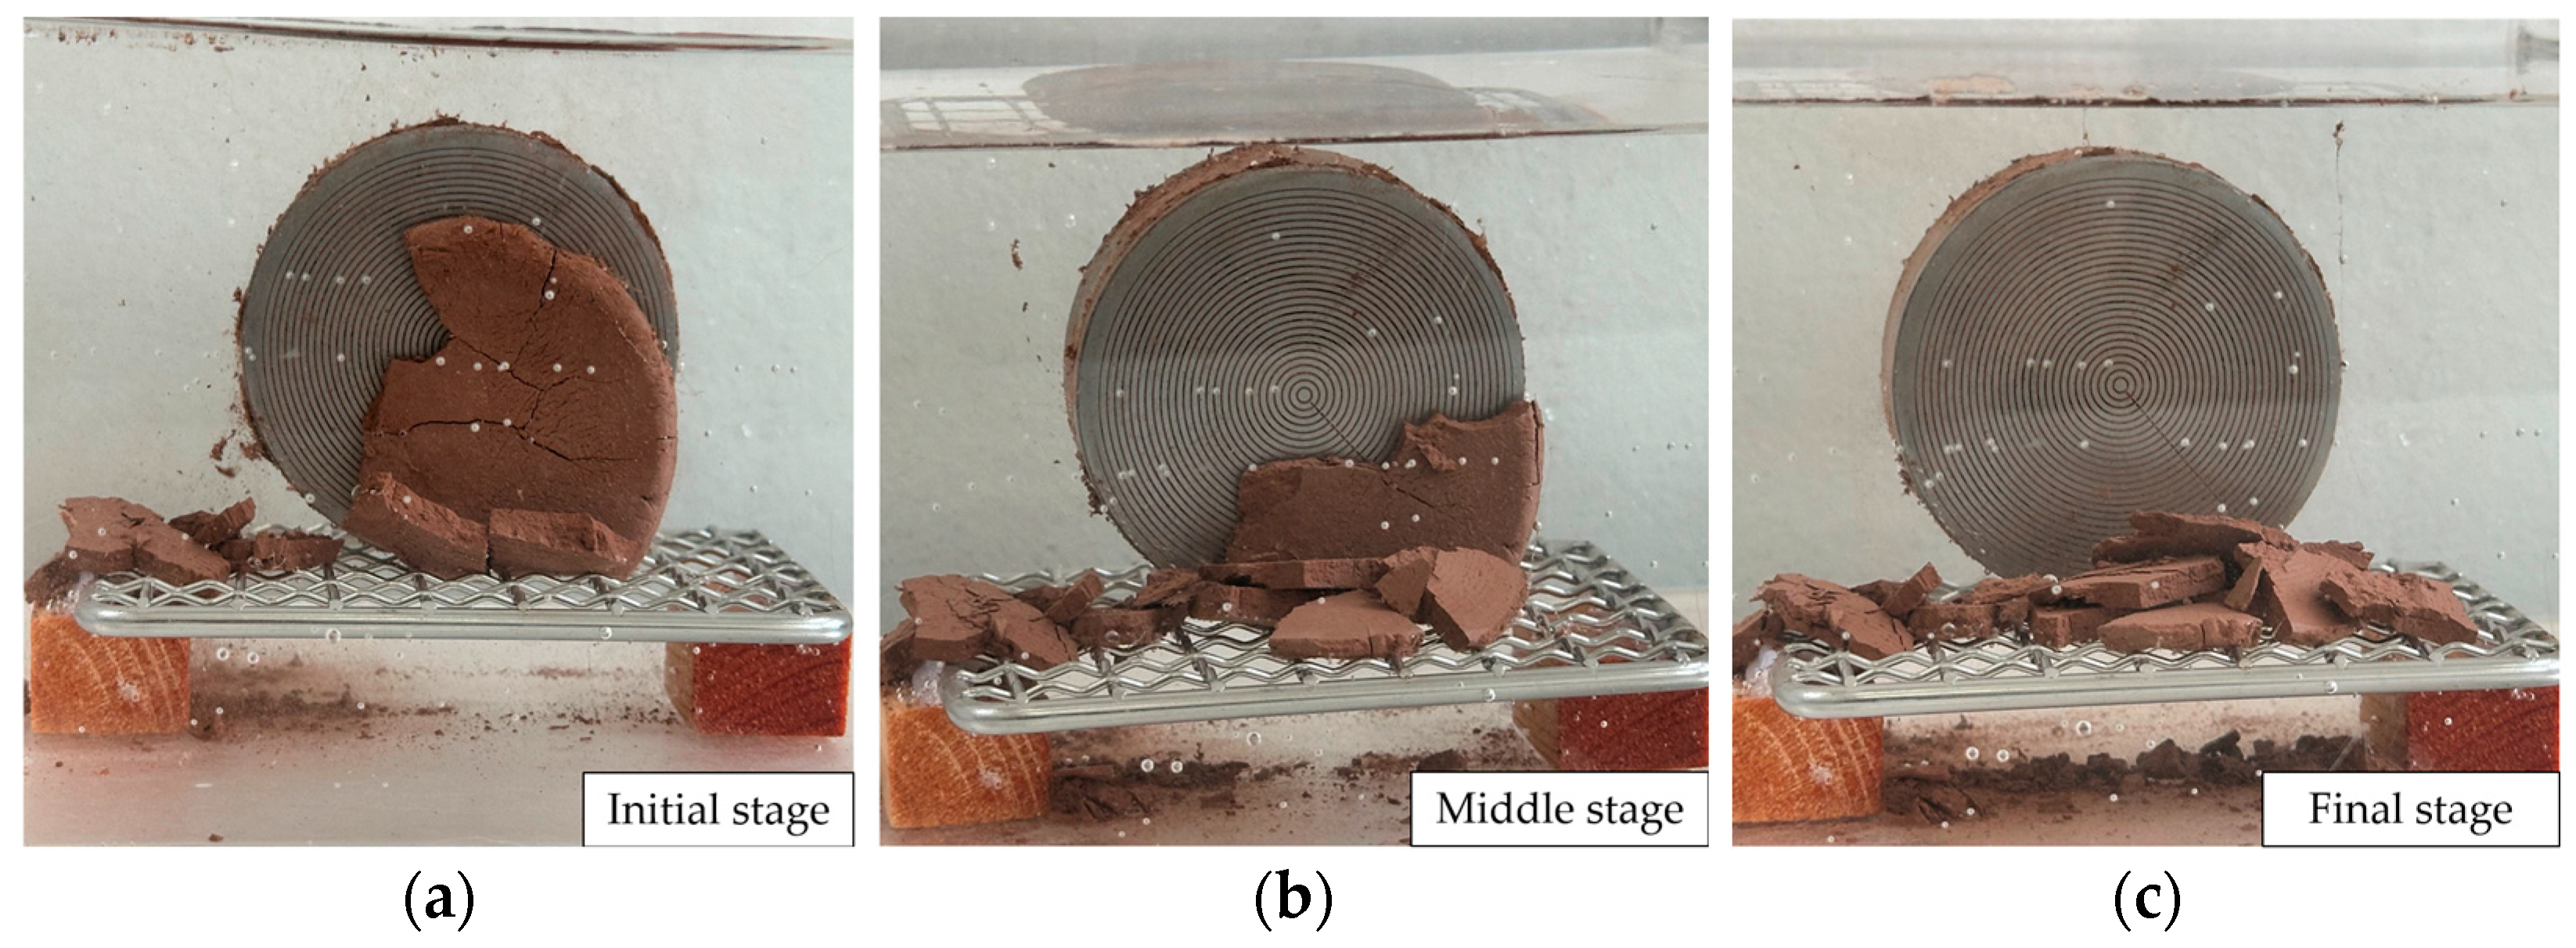
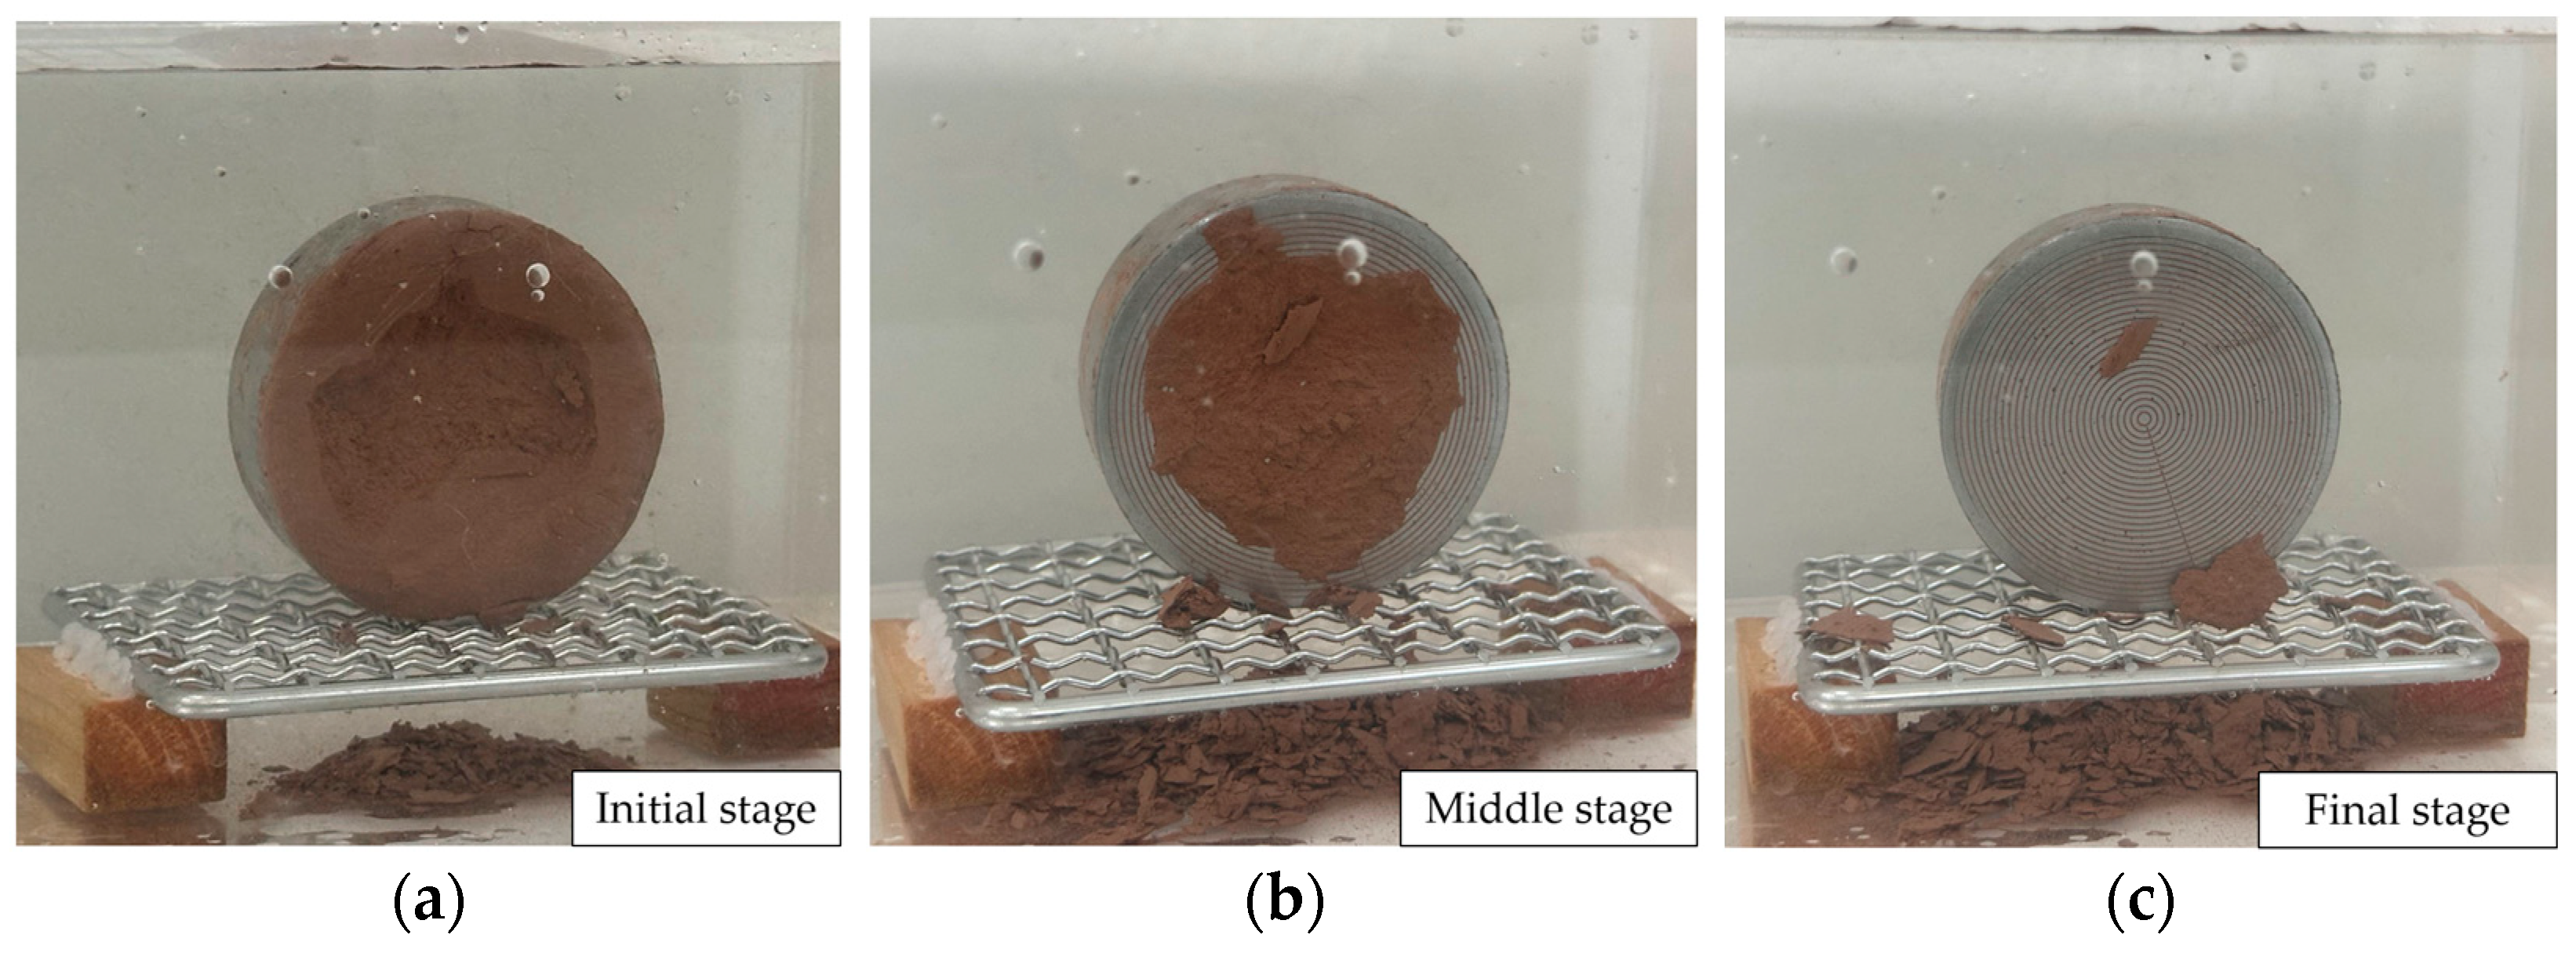
In the high-temperature range (150 °C, 175 °C, 200 °C), the FSA generally remains at high values. Over durations of 30, 40, and 50 min, the shedding rate of the samples is maintained at about 90%. When sample T175-30 is placed in pure water, the mud cake samples on the metal surface shed in chunks, as shown in Figure 15. The shedding completes within 20 s, with an FSA of 94.7% and an SR of 6.3 × 10⁻² s−1, marking increases of approximately 277% and 407%, respectively, compared to sample T25-30’s FSA (21.4%) and SR (1.5 × 10⁻³ s−1). This indicates that high temperatures greatly promote material detachment.
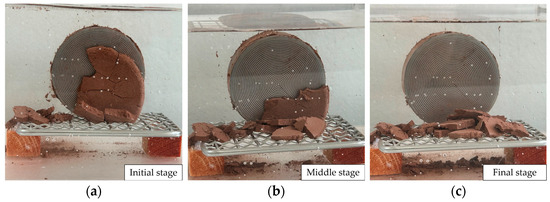
Figure 15.
Shedding process of sample T175-30. (a) Initial stage of shedding; (b) middle stage of shedding; (c) final stage of shedding.
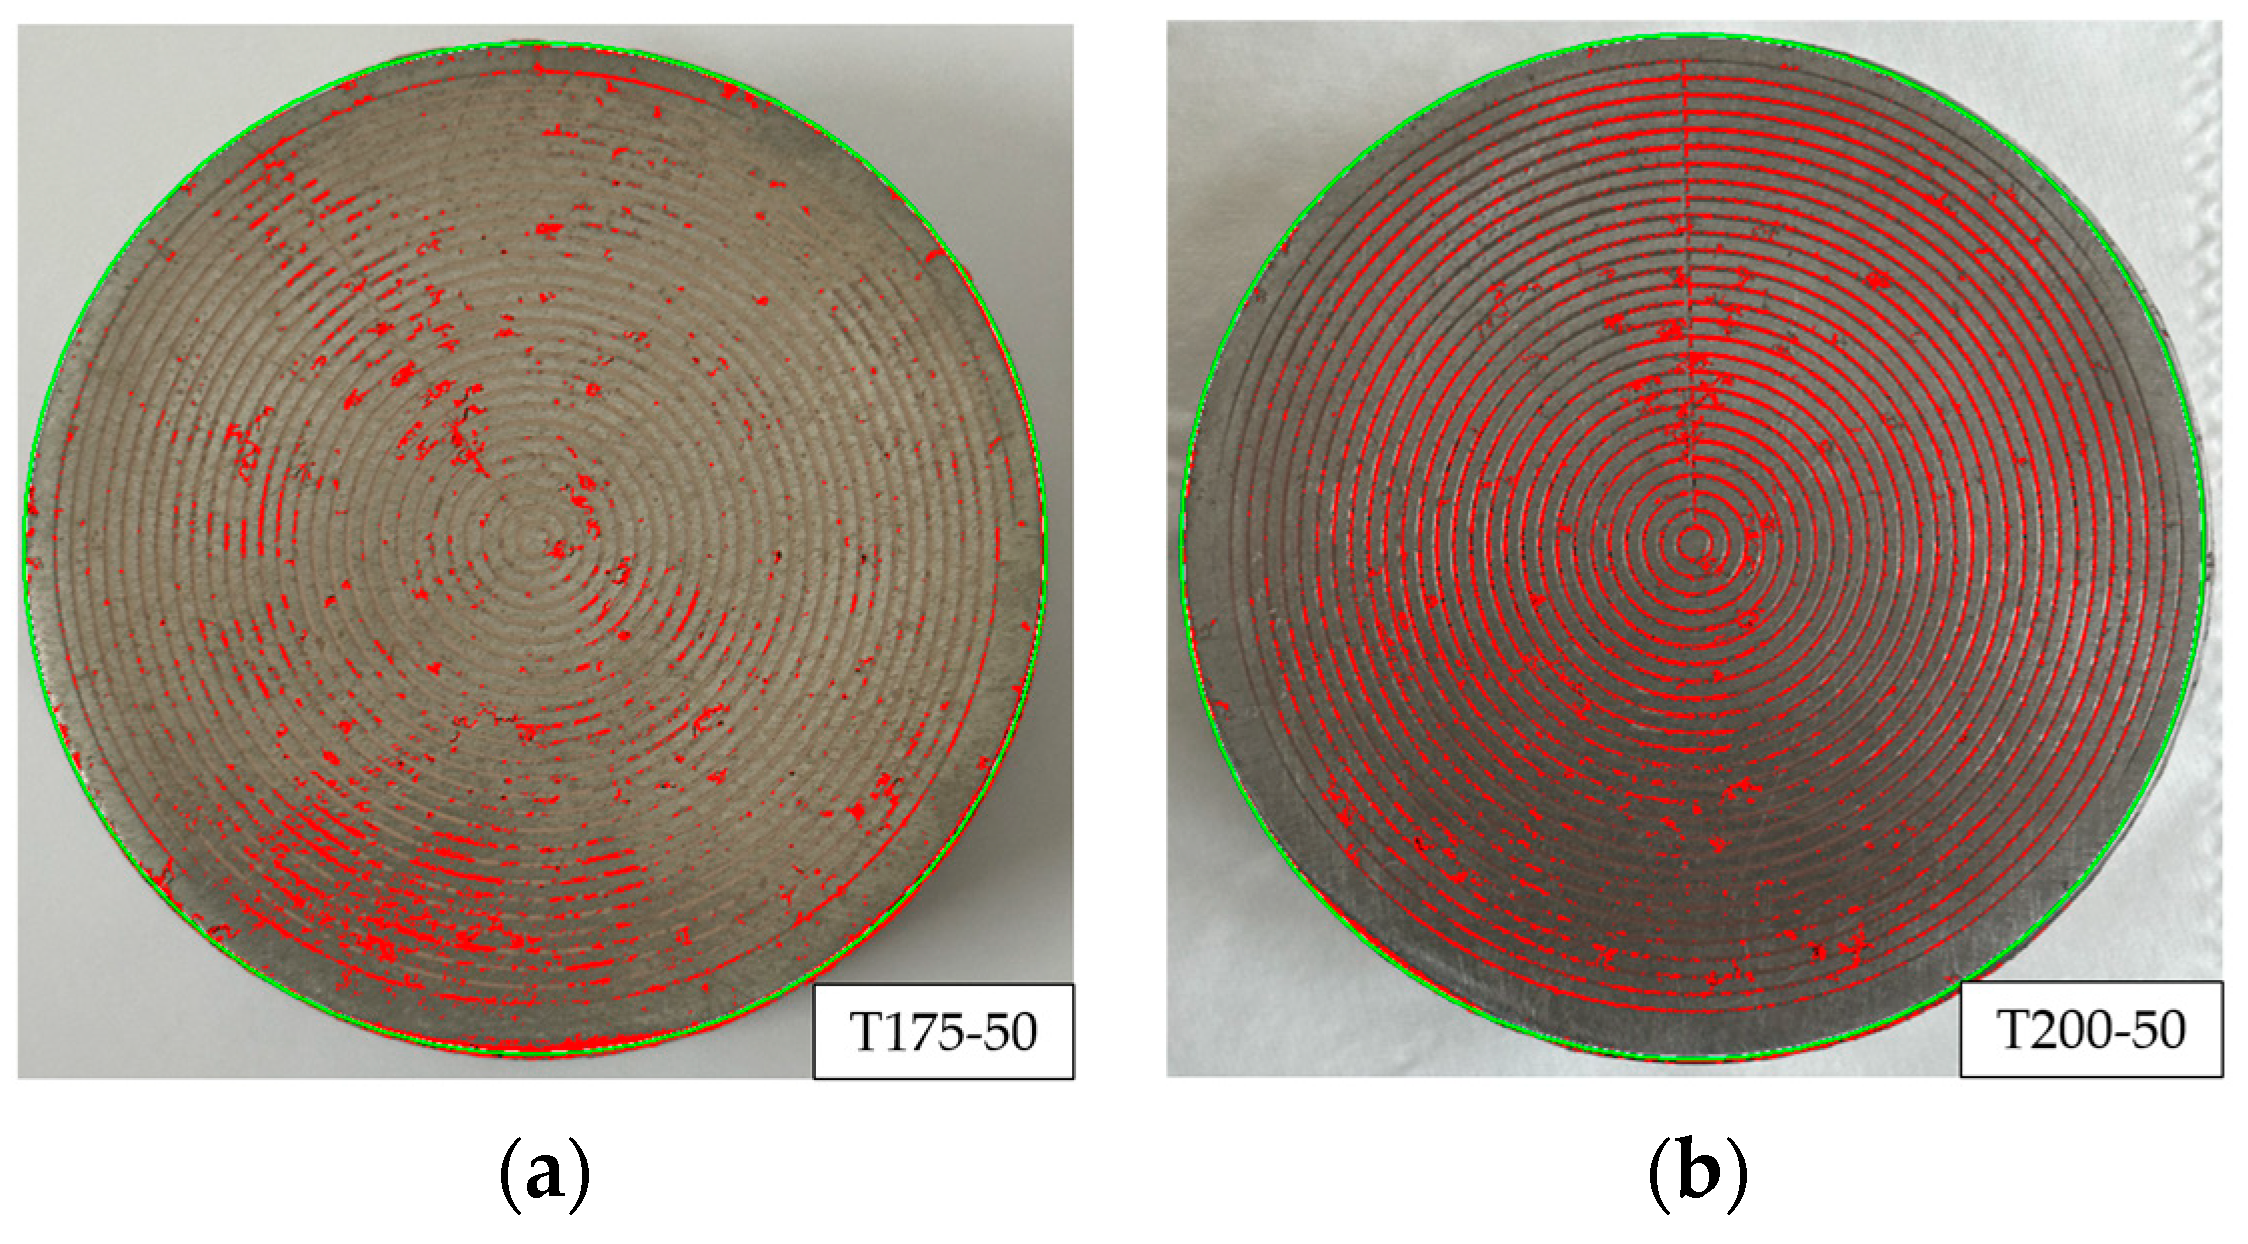
However, as the temperature increases further, shedding amounts begin to decrease under conditions of baking at 150 °C and 175 °C for more than 40 min, and at 200 °C for more than 30 min. This reduction may be due to the sintering of the mud cake at high temperatures, where soil particles adhere more firmly to the metal surface, as shown in Figure 16. This type of sintered material is difficult to shed by itself, thus leading to a reduction in shedding amounts.
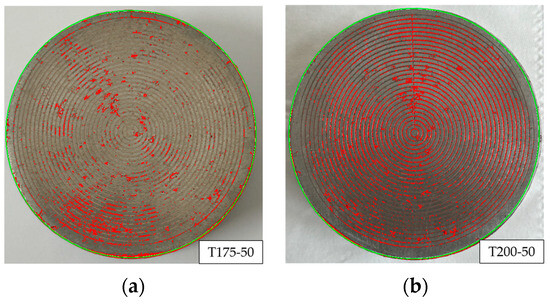
Figure 16.
Soil particles sintered on the cutterhead. (a) T175-50; (b) T200-50.
Activation energy [29] can further explain the experimental phenomena. In the low-temperature range, the system’s energy is insufficient to overcome the activation energy, resulting in lower FSA and SR. As the temperature increases, more molecules gain enough energy to overcome the activation energy, leading to a significant rise in FSA and SR in the medium-temperature range. At high temperatures, almost all molecules can overcome the activation energy, reaching the maximum reaction rate, and FSA approaches saturation. However, beyond a certain temperature, due to sintering, FSA and SR may actually decrease.
4.1.2. The Impact of Time on Mud Cake Shedding Amount and Rate
Figure 17 shows the effects of different times on the final shedding amount (FSA) and shedding rate (SR) of mud cake.
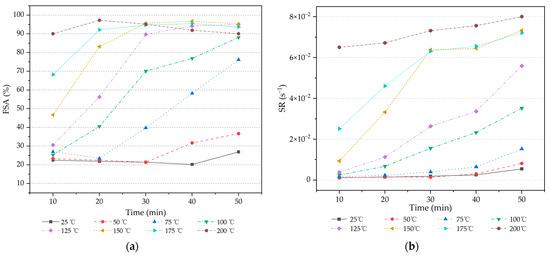
Figure 17.
Final shedding amount (FSA) and shedding rate (SR) of mud cake at different times. (a) Time—FSA; (b) time—SR.
At temperatures of 25 °C and 50 °C, the FSA of the mud cake samples changes little with the extension of baking time and even shows a slight decrease at 30 min. When the temperature ranges from 75 °C to 175 °C, the shedding amount significantly increases as the baking time extends. For instance, sample T100-50 shows an increase of about 62.8% in FSA compared to sample T100-10. Similarly, sample T125-50 shows an increase of about 64.5% in FSA compared to sample T125-10, as illustrated in Figure 18 and Figure 19.

Figure 18.
Shedding process of sample T125-10. (a) Initial stage of shedding; (b) middle stage of shedding; (c) final stage of shedding.
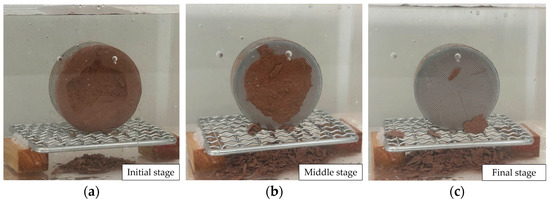
Figure 19.
Shedding process of sample T125-50. (a) Initial stage of shedding; (b) middle stage of shedding; (c) final stage of shedding.
At a temperature of 200 °C, the FSA significantly decreases over time, indicating that prolonged exposure to high temperatures intensifies the sintering of the mud cake.
The SR remains relatively low between temperatures of 25 °C and 75 °C over time. However, between 125 °C and 175 °C, there is a noticeable change over time. For example, the SR of sample T150-50 is 7.3 × 10⁻² s−1, which is approximately a 684% increase compared to the 9.3 × 10⁻³ s−1 of sample T150-10, suggesting that at high temperatures, the shedding rate significantly increases with time. However, at 200 °C, since the shedding rate starts at a higher level, the increase over time is limited.
4.2. The Impact of Water Content on Mud Cake Shedding
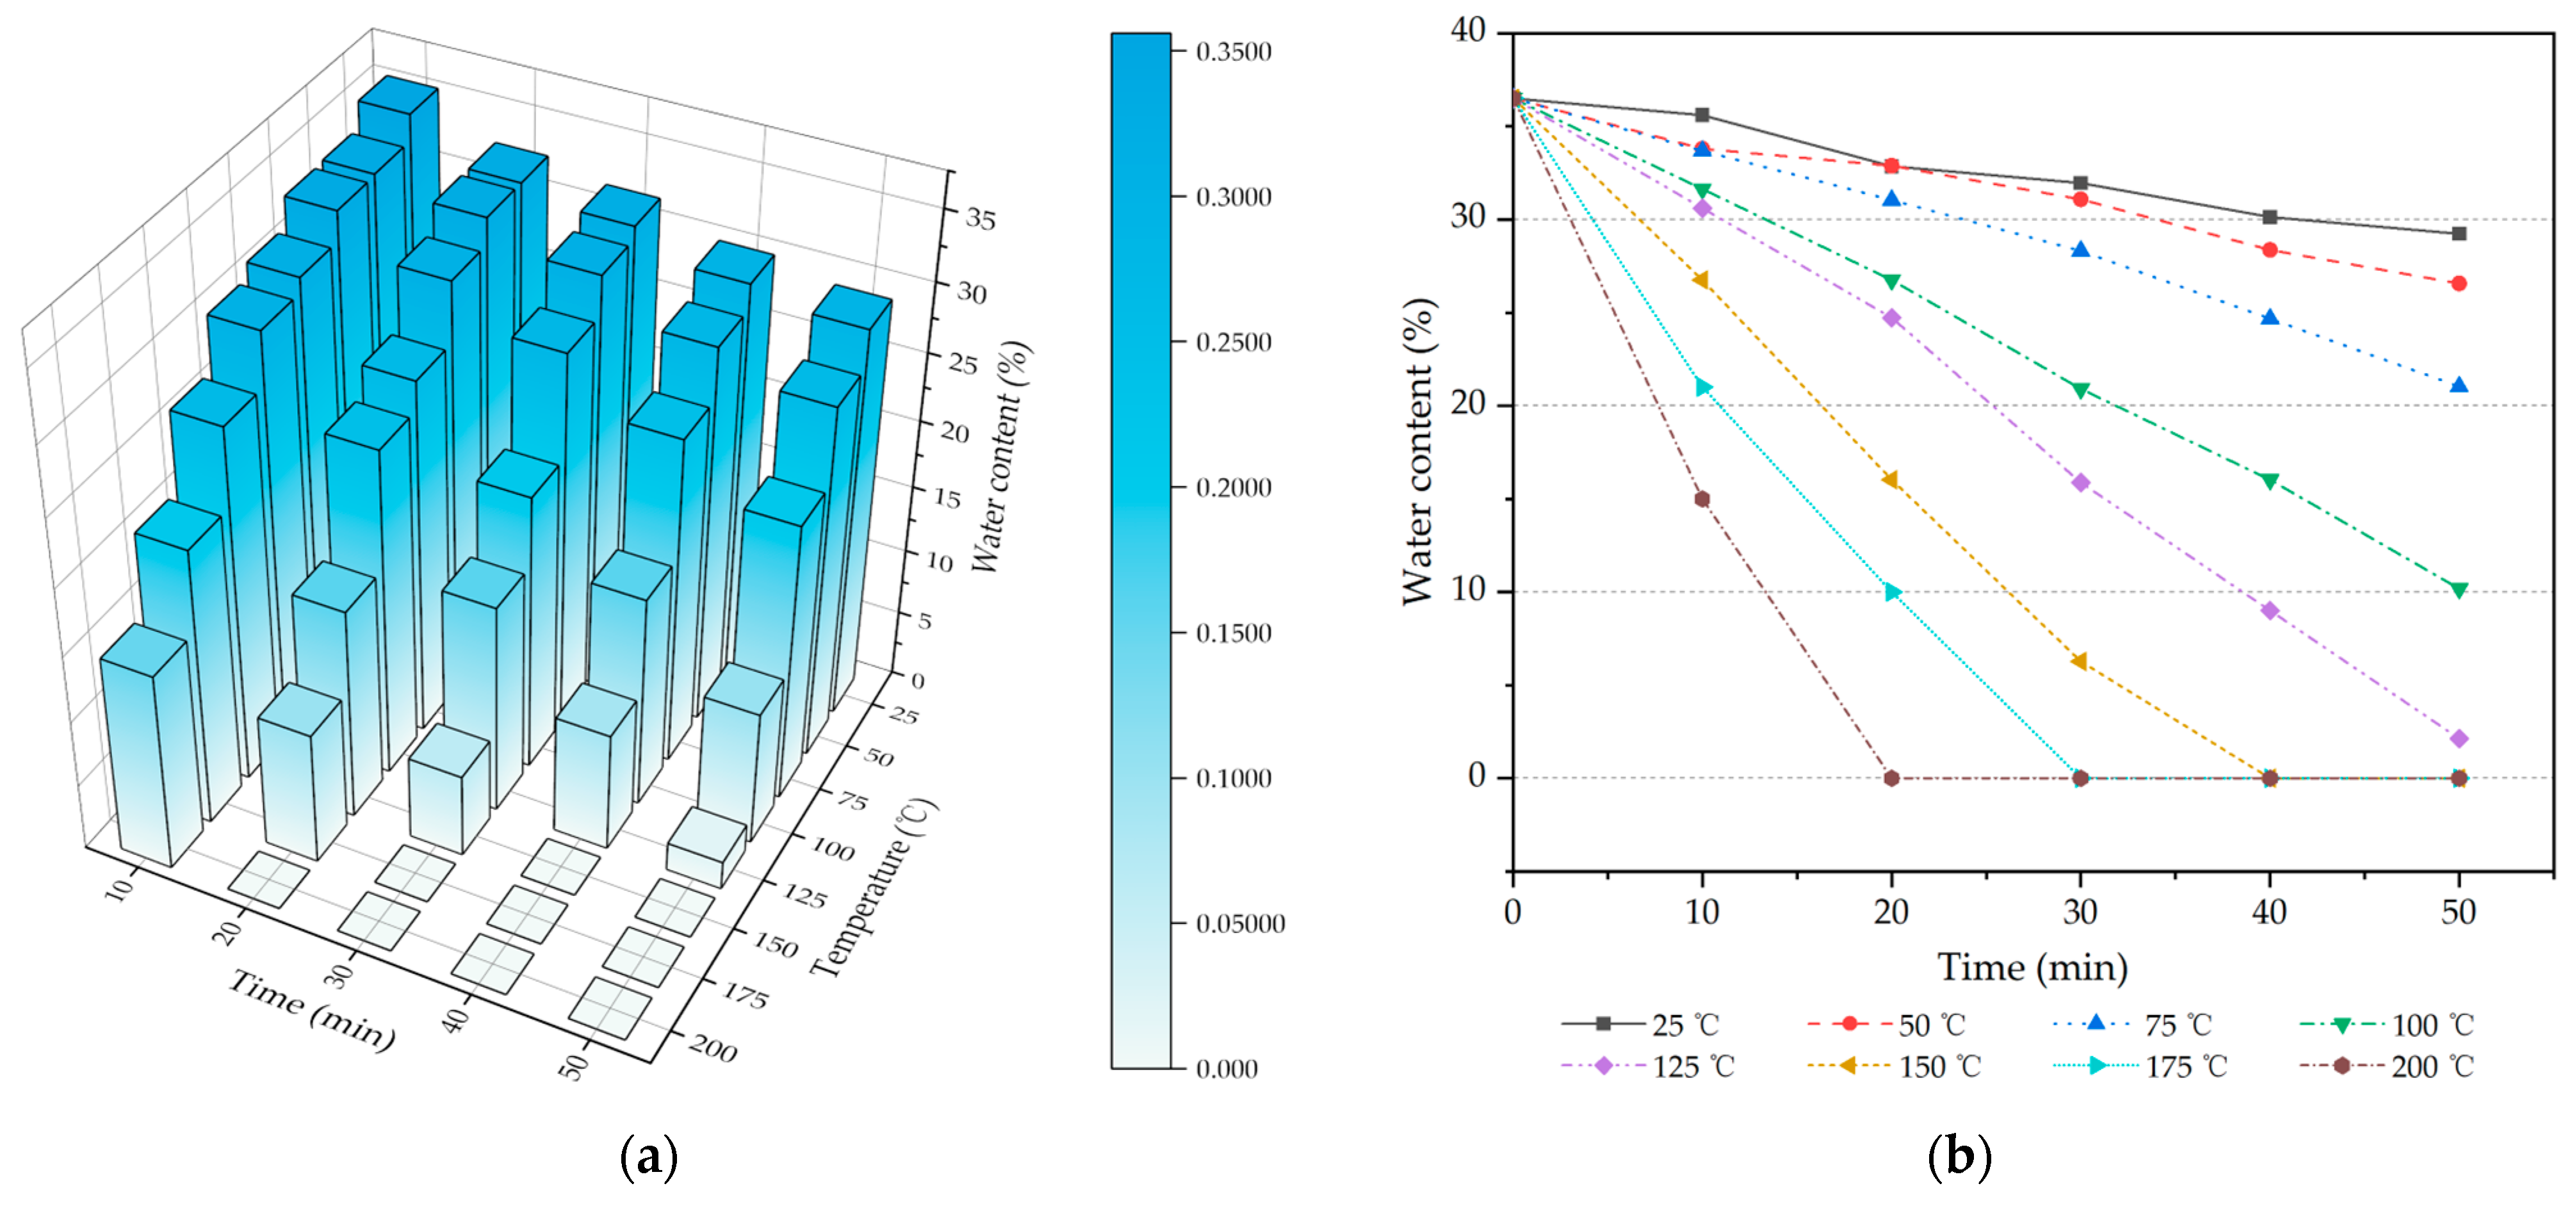
The most direct effects of different temperatures and durations are on the water content (water weight percentage) of mud cake samples. Figure 20 shows the changes in water content under various baking temperatures and times.
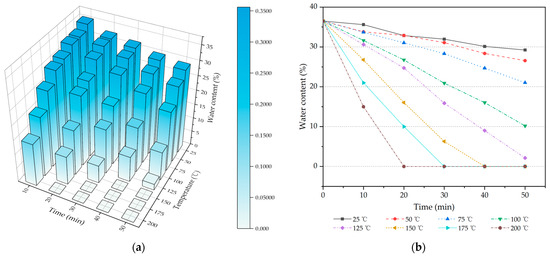
Figure 20.
Water content of mud cake at different temperatures and times. (a) Three-dimensional bar chart; (b) 2D point-line chart.
In the low-temperature range (25 °C, 50 °C), the soil temperature gradient is low, resulting in minimal short-term changes in soil moisture and energy. The change in water content from sample T25-10 to T25-30 is 6.4%.
In the medium-temperature range (75 °C, 100 °C, 125 °C), mud cake moisture is rapidly lost. By the 50th minute, the water content of the samples at 75 °C, 100 °C, and 125 °C had decreased by 15.5%, 26.3%, and 34.4%, respectively, from their initial levels.
In the high-temperature range (150 °C, 175 °C, 200 °C), all tests resulted in complete drying within 50 min. Specifically, at 200 °C, samples lost all moisture within 20 min.
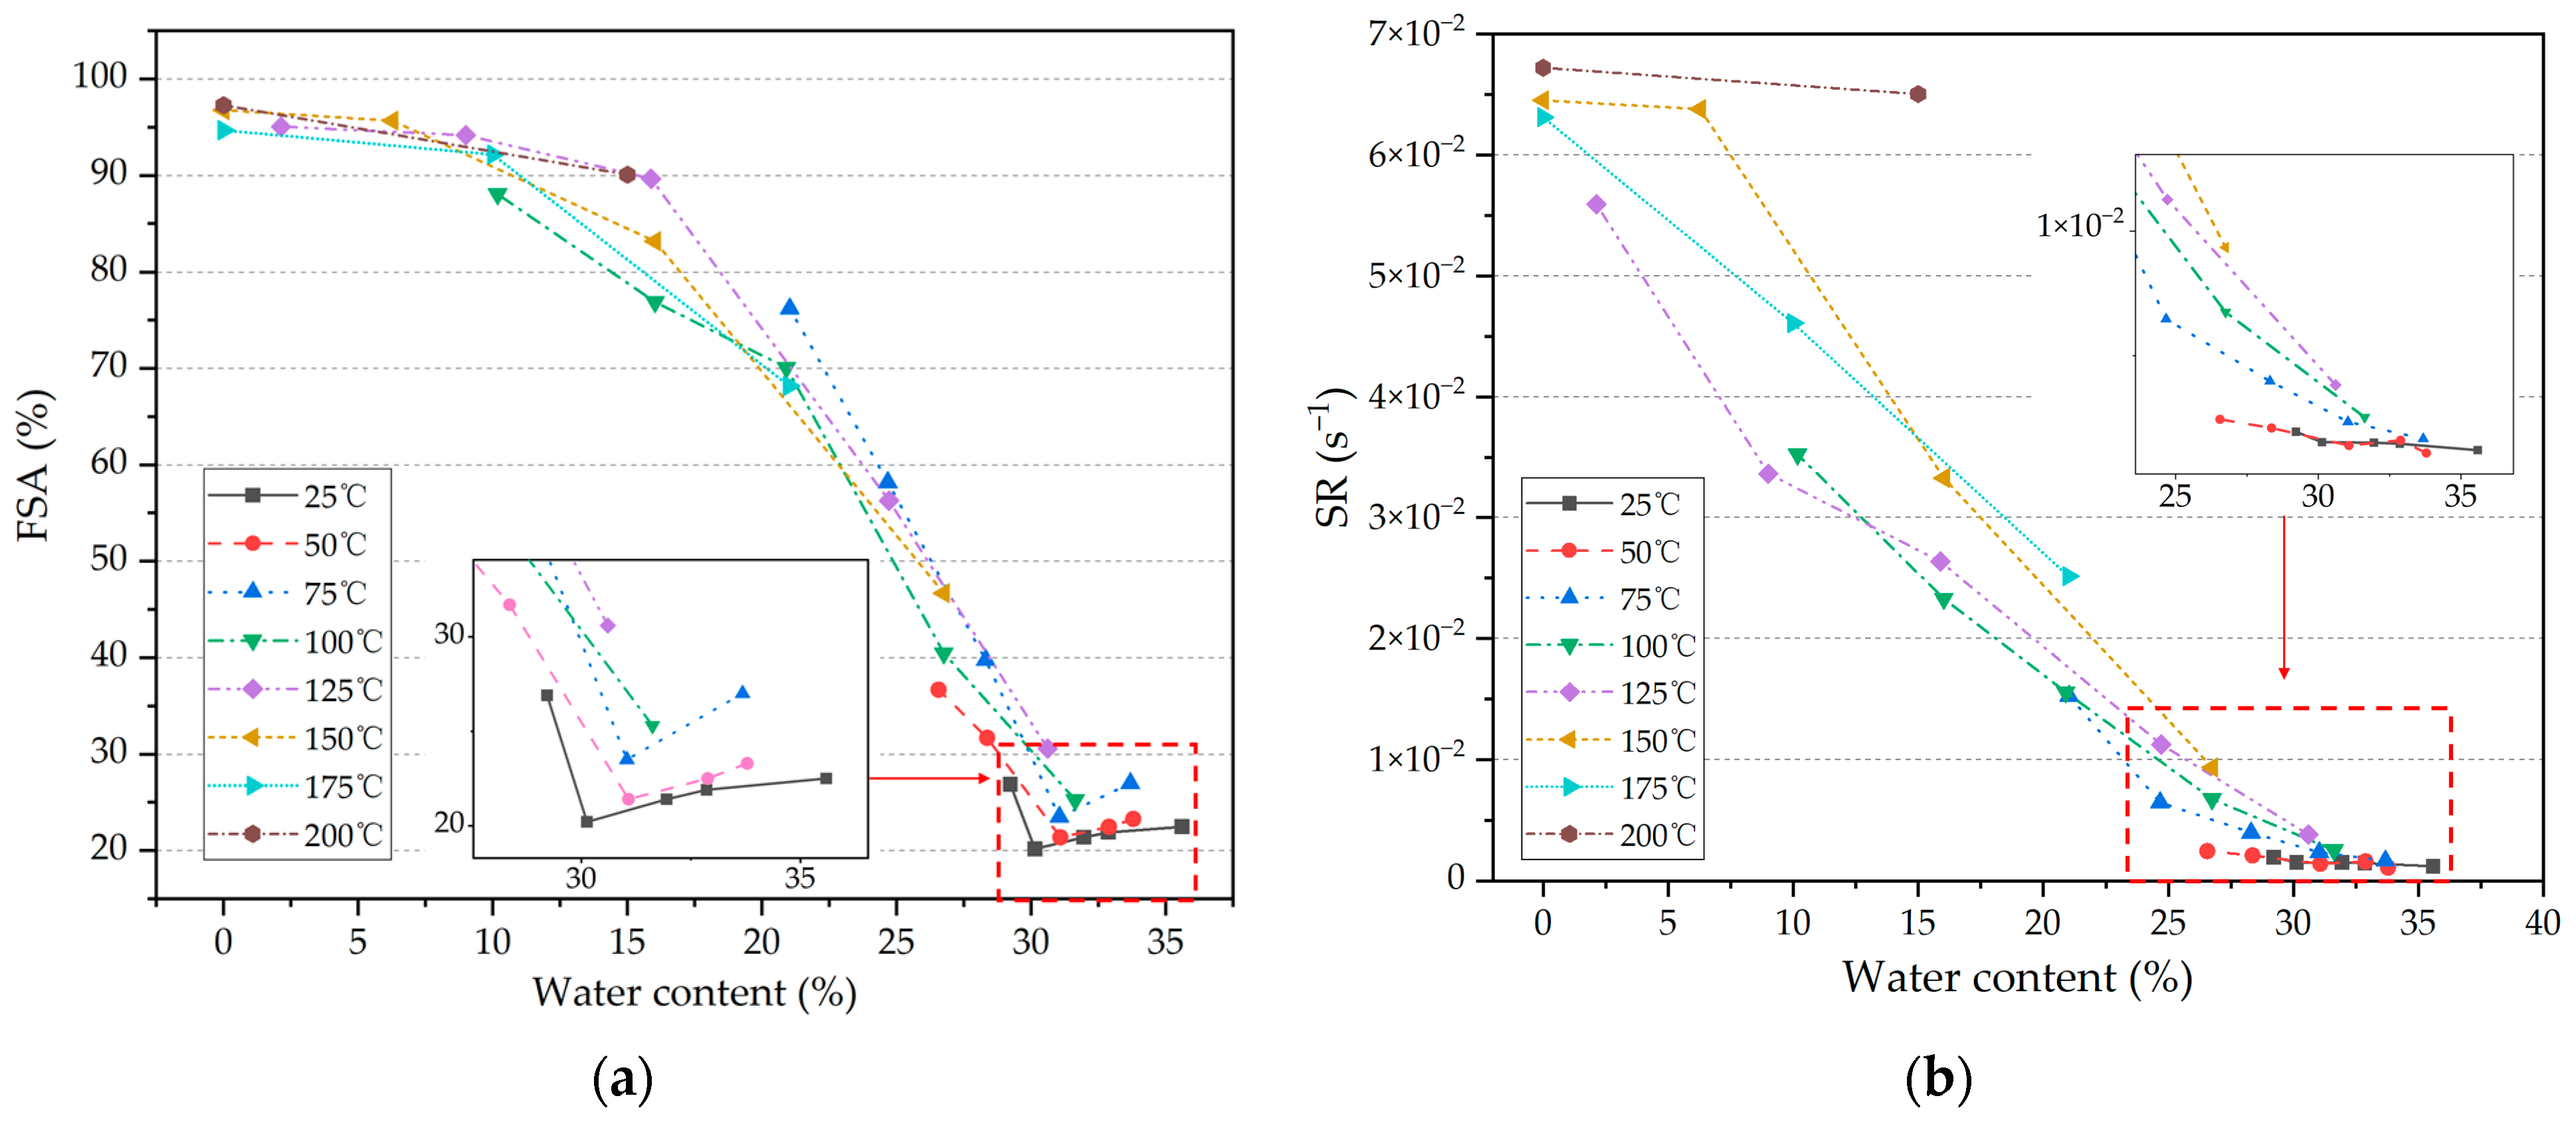
The loss of moisture significantly affects the shedding of mud cake samples. Figure 21 shows the shedding of mud cake samples at different water contents.
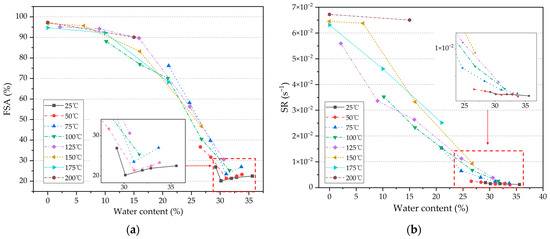
Figure 21.
Final shedding amount (FSA) and shedding rate (SR) of mud cake at different water contents. (a) Water content—FSA; (b) water content—SR.
In the low water content range (0%–10%), the FSA of samples consistently exceeds 90%, remaining at a very high level. However, the SR is significantly influenced by changes in water content. For instance, sample T125-50 with a water content of 2.1% experienced an approximately 66.2% increase in SR compared to sample T125-40, which had a water content of 9%.
When the water content is between 10% and 30%, the change in FSA becomes very significant. As shown in Figure 22, at 100 °C, the samples with water contents of 26.8% (T100-20 min), 20.0% (T100-30), and 10.2% (T100-50) have FSAs of 40.5%, 70.1%, and 88.1%, respectively. The SR also shows dramatic changes at this time; for example, the SR of sample T100-50 increased by 126% and 422% compared to T100-30 and T100-20, respectively. This indicates that changes in water content significantly affect the shedding effectiveness of mud cake.
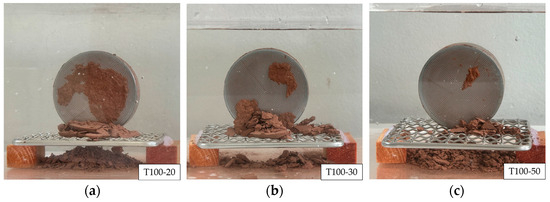
Figure 22.
Shedding performance of mud cake samples at different water contents (a) T100-20; (b) T100-30; (c) T100-50.
Contrary to expectations, the FSA does not decrease but shows an upward trend when the water content is around 30%. This phenomenon also appears in samples at 25 °C, 50 °C, and 75 °C.
Specifically, sample T25-40, with a water content of 30.1%, and sample T25-30, with a water content of 31.9%, show an FSA increase from 20.2% to 21.4%. At 50 °C, sample T50-30, with a water content of 31.1%, and sample T50-20, with a water content of 32.9%, see an FSA increase from 21.4% to 22.5%. Similarly, at 75 °C, sample T75-20, with a water content of 31.1%, and sample T75-10, with a water content of 33.7%, show an FSA increase from 23.5% to 27.1%.
The data indicate that when the water content reaches around 30%, the adhesiveness of the red-bed mud cake is at its strongest, and the shedding is minimal. As the water content exceeds this range, the adhesiveness of the mud cake begins to weaken.
The adhesion of the mud cake is strongest when its water content is around 30%. Therefore, it is recommended to change the adhesion characteristics of the mud cake by adjusting its water content, such as by adding water to the mud cake on the cutterhead.
4.3. The Results of Mud Cake Hardness Tests
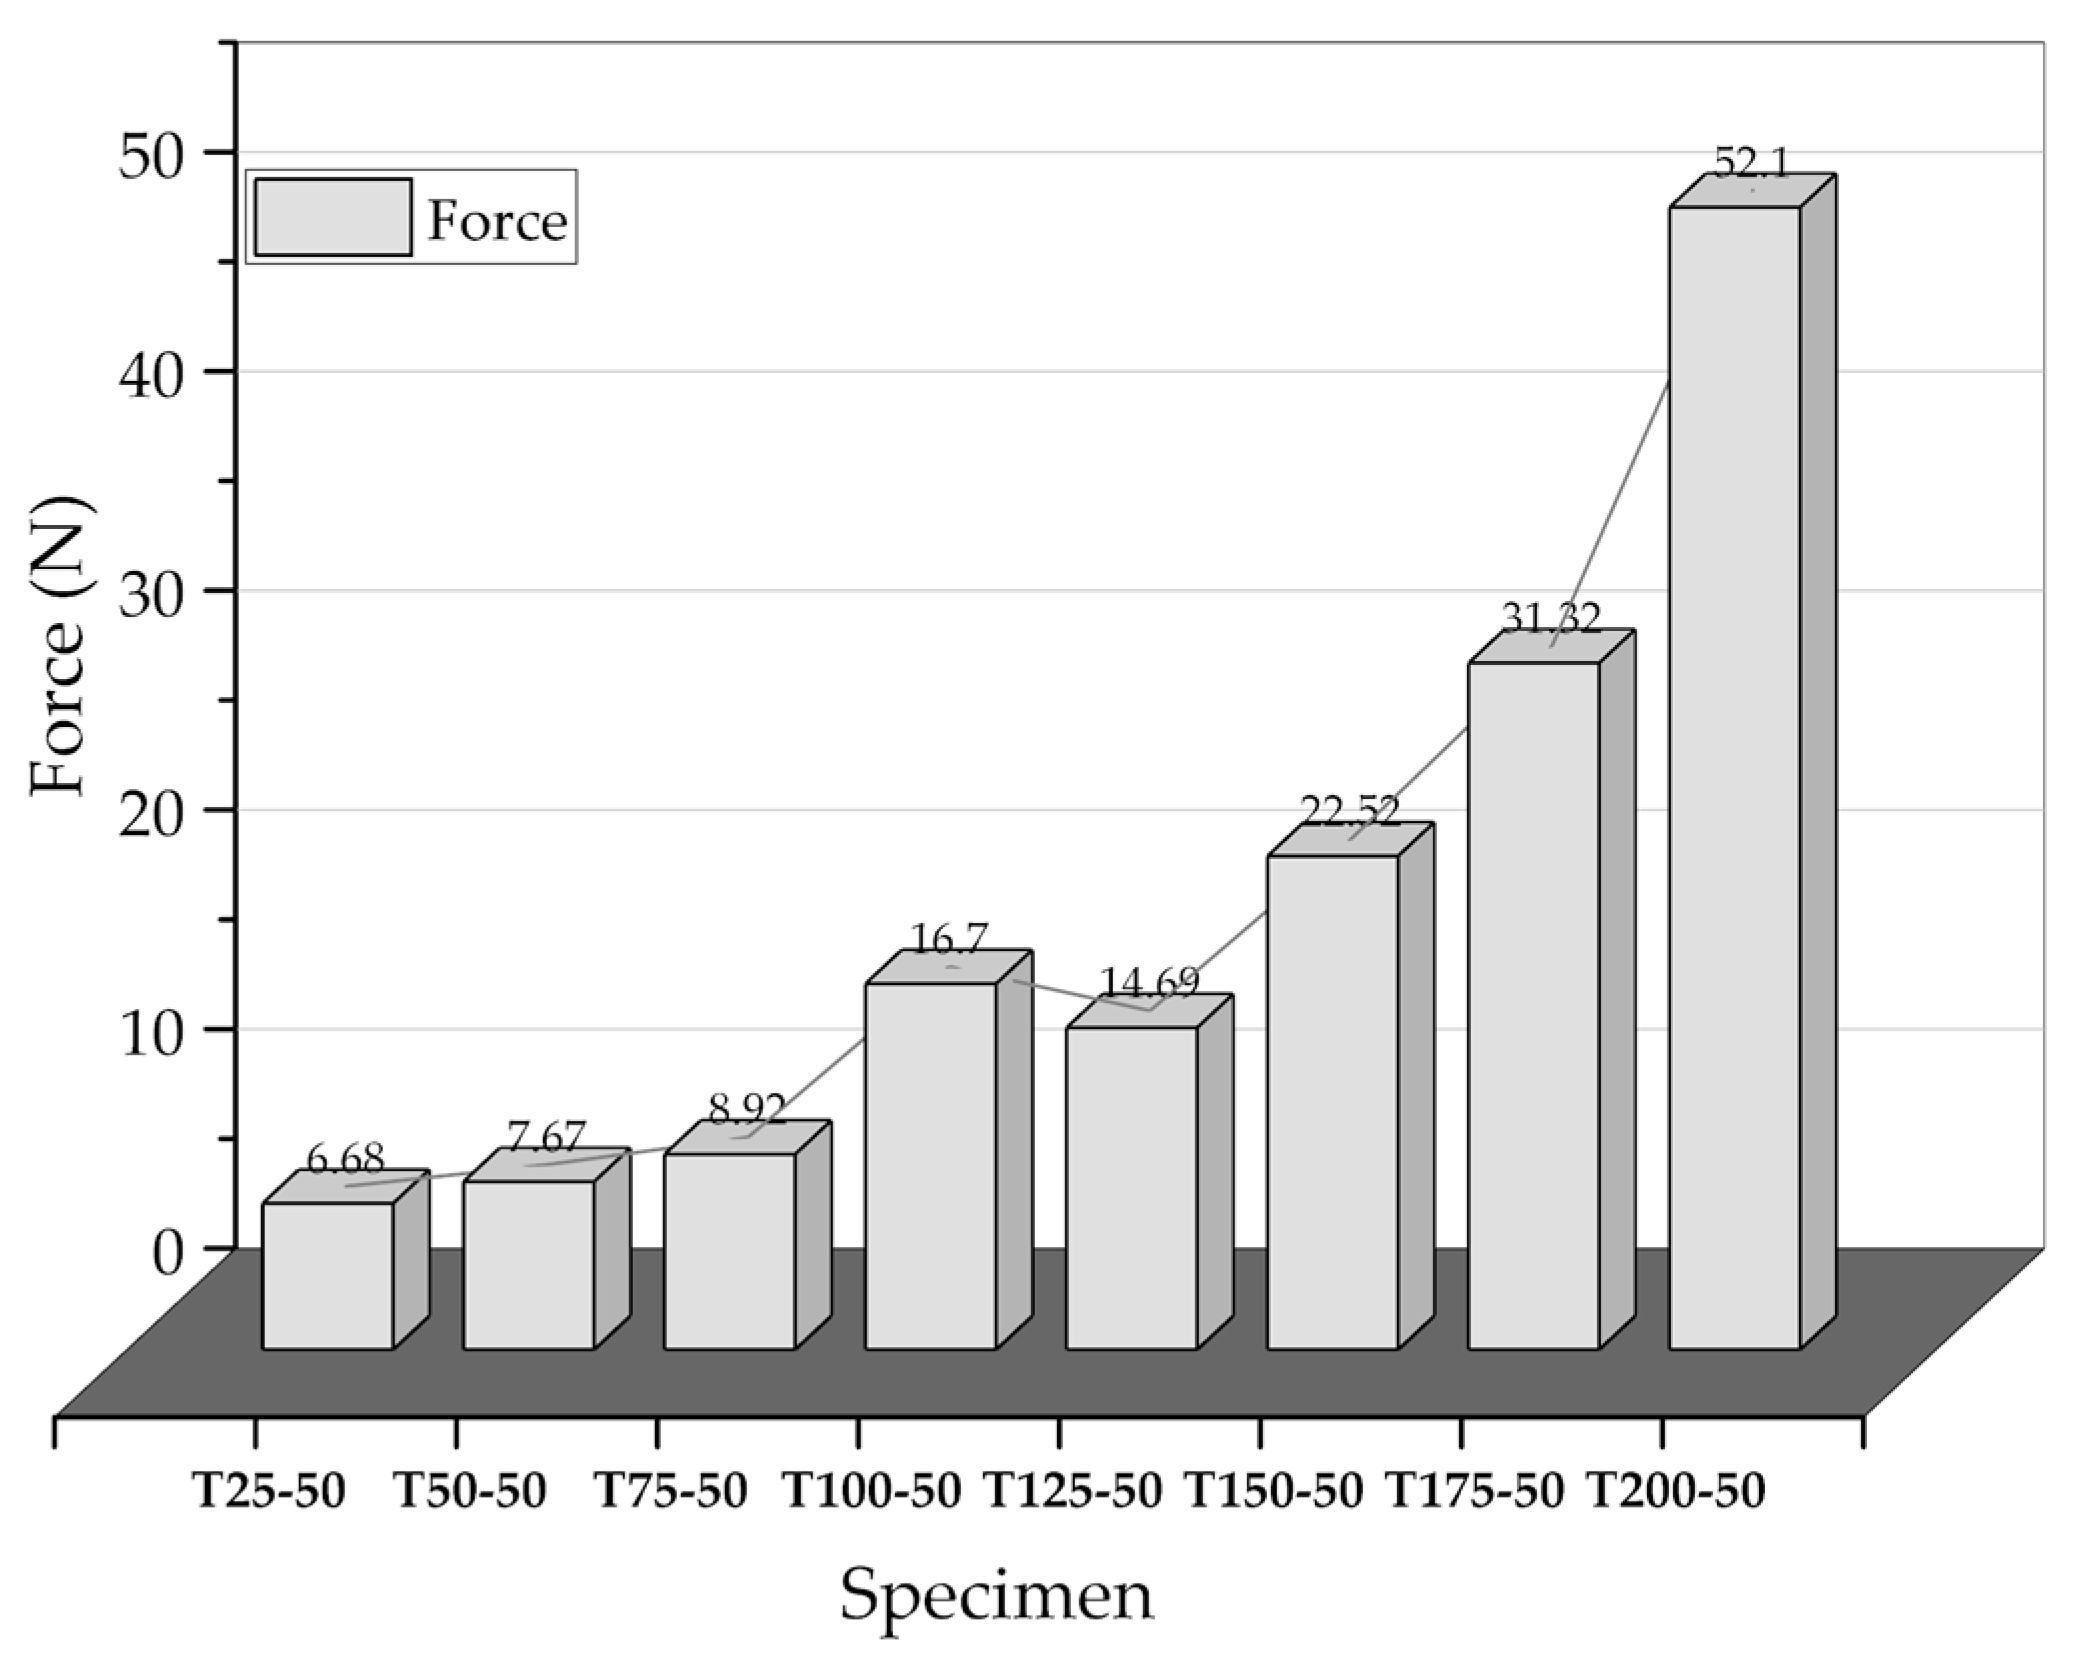
Figure 23 shows mud cake samples baked for 50 min under different temperature conditions (25 °C to 200 °C), tested with a pressure sensor to measure the force required to penetrate these samples.
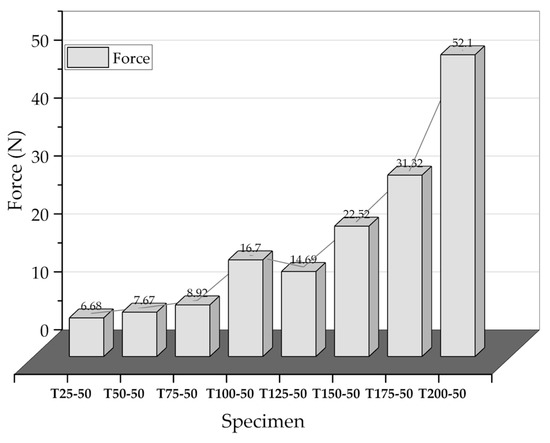
Figure 23.
Mud cake hardness test.
To further analyze the hardness variations of mud cake at different temperatures, Table 3 presents the force required to penetrate these samples as measured by a pressure sensor, and the percentage increase in force from one sample to the next.
Table 3.
Force Required to Penetrate Different Samples.
In the low-temperature range (25 °C and 50 °C), there is little difference in the force required to penetrate between the T25-50 and T50-50 samples. The surface of sample T25-50 is relatively smooth. During the pressure application, the higher water content makes the mud cake sample more pliable, requiring a penetration force of 6.70 N. After the penetration process, only slight indentations were observed on the contact surface, with no cracking of the soil, maintaining high integrity, as shown in Figure 24.
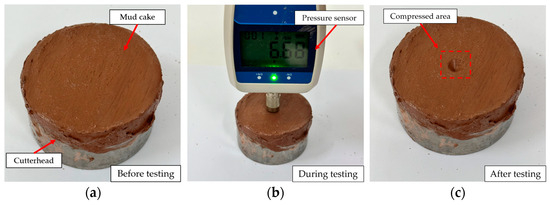
Figure 24.
Test process of sample T25-10. (a) Before testing; (b) during testing; (c) after testing.
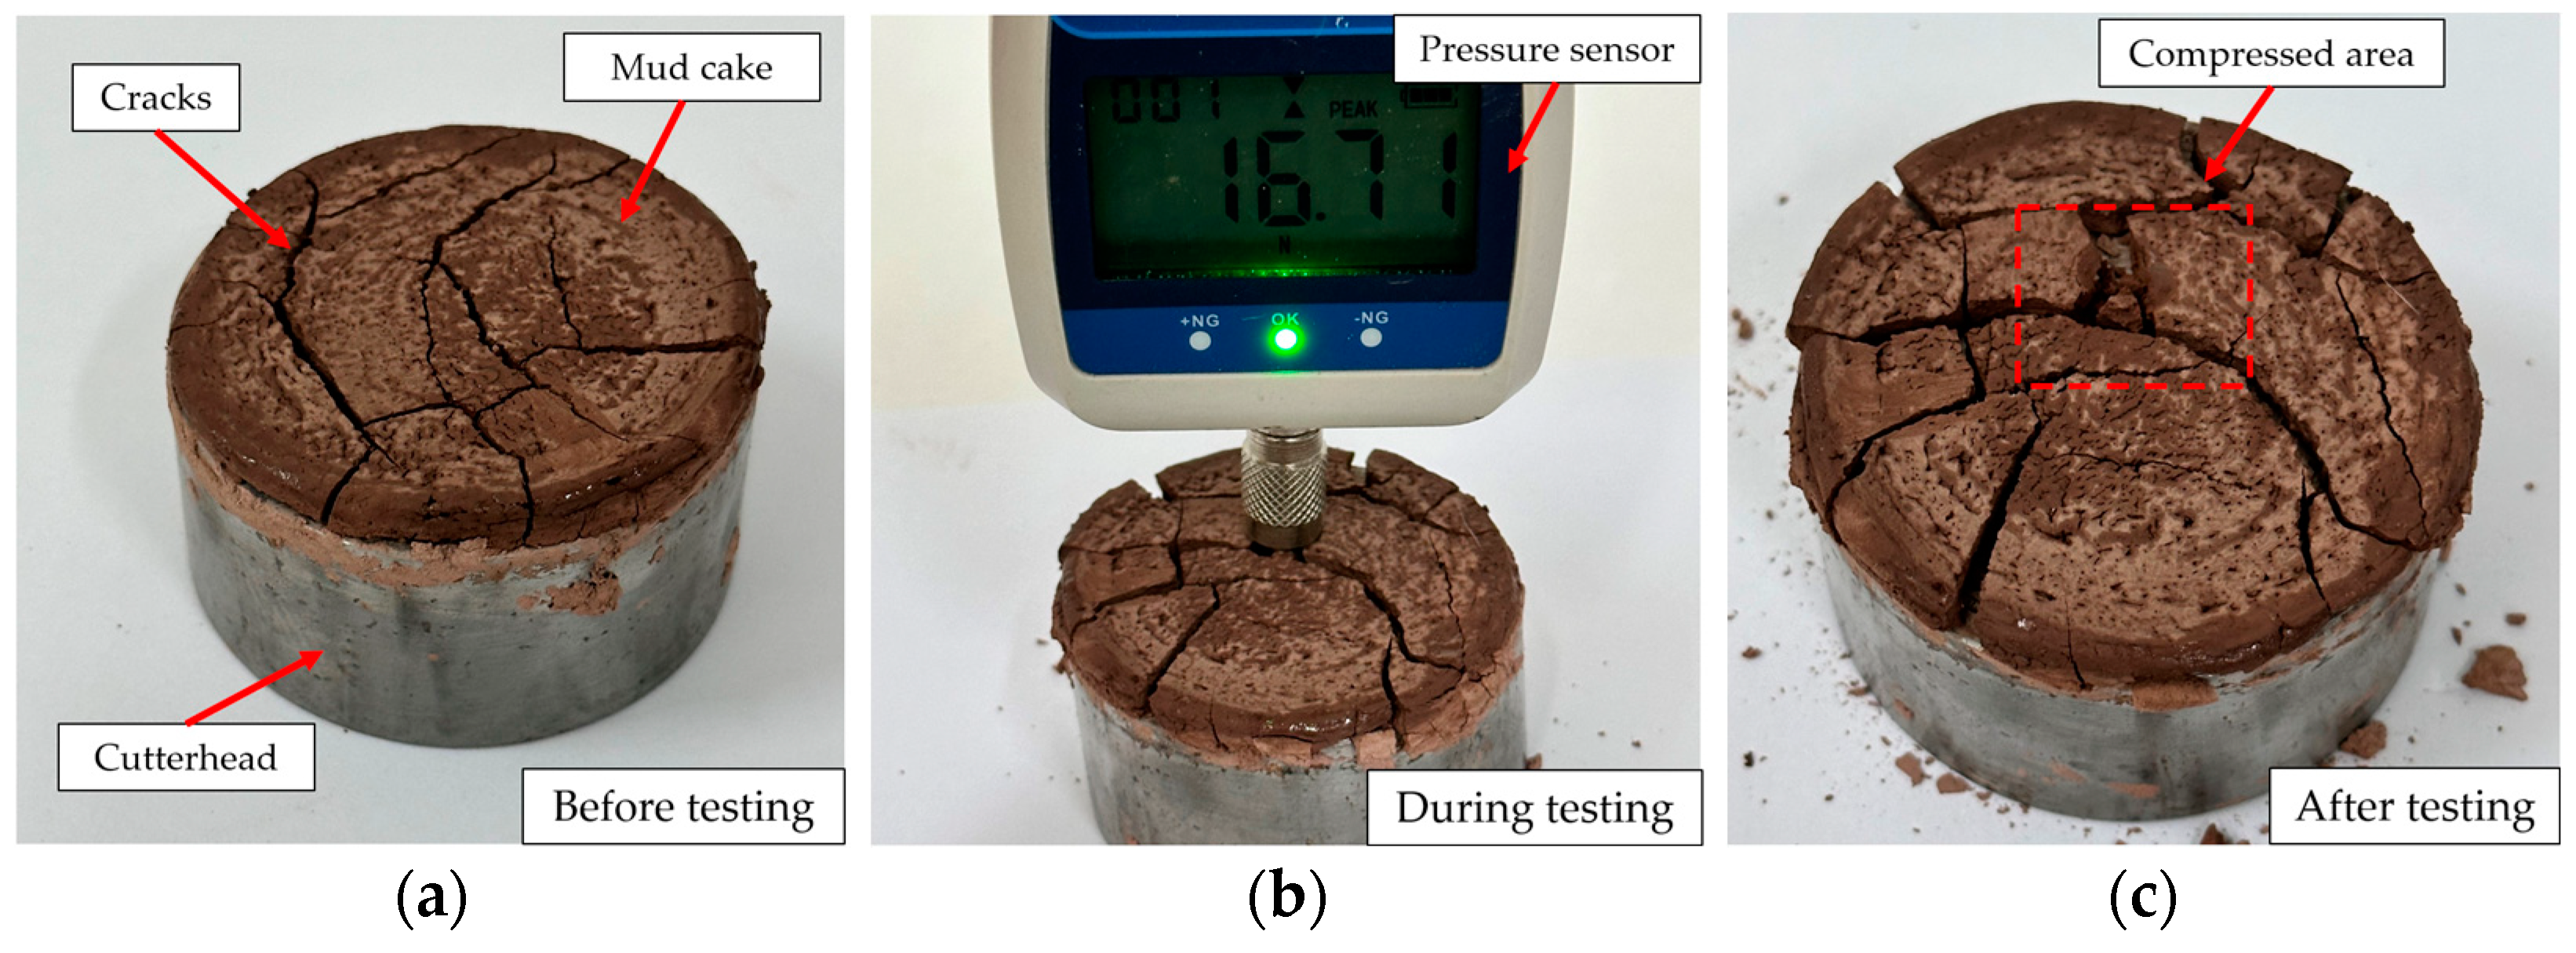
In the medium-temperature range, when the temperature reached 100 °C, the force required for the T100-50 sample increased by 87.2% (Table 3). At this point, the water content of the sample decreased to 10.2%. As the moisture significantly decreased, cracks began to appear on the surface of the sample. After the test, fragments were clearly visible at the contact surface with the cone head, and the cracks on the sample surface further expanded during the test, as shown in Figure 25.
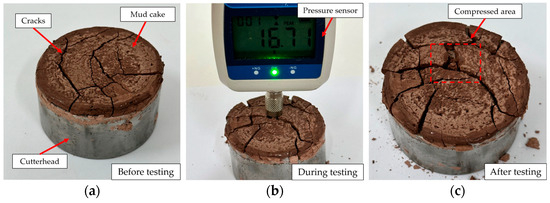
Figure 25.
Test process of sample T100-50. (a) Before testing; (b) during testing; (c) after testing.
When the temperature continued to rise to 125 °C, the water content of the T125-50 sample dropped to just 2.1%. Due to the rapid evaporation of moisture, numerous cracks formed on the surface, making the overall structure more brittle, and leading to a reduction in the force required for penetration.
In the high-temperature range (150 °C, 175 °C, 200 °C), the water content of samples T150-50, T175-50, and T200-50 decreased to 0%. As the temperature increased, the force required to penetrate these samples also significantly increased, reaching 22.52 N, 31.32 N, and 52.1 N, respectively. These values represent increases of 53.3%, 39.1%, and 66.3%, respectively, clearly showing the increased difficulty of penetration with rising temperatures.
Under these high-temperature conditions, the moisture inside the mud cake completely evaporated, leading to surface cracking and significant hardening and sintering within the samples, as shown in Figure 26. This hardening and sintering made the samples extremely hard and dense, greatly increasing the force required for penetration. After conducting the penetration tests, more pronounced cracking in the mud cake samples was observed, along with finely crushed fragments at the contact surface between the cone head and the mud cake.
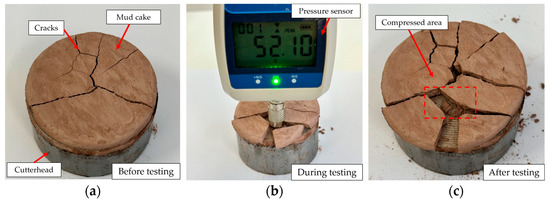
Figure 26.
Test process of sample T200-50. (a) Before testing; (b) during testing; (c) after testing.
These results indicate that temperature and water content are key factors affecting the hardness of mud cake. At lower temperatures, the gradual loss of moisture causes the mud cake to harden gradually, while rapid moisture loss and sintering at high temperatures significantly enhance the hardness and structural stability of the mud cake.
Based on the experimental results, it is recommended to equip a real-time temperature monitoring system on the cutterhead, maintaining the cutterhead temperature between 25 °C and 75 °C. Within this temperature range, the hardness of the mud cake on the cutterhead is relatively low, which facilitates smooth excavation. The cutterhead temperature should not exceed 125 °C, as beyond this temperature, the hardness of the mud cake significantly increases, and soil particles may also undergo sintering on the cutterhead.
5. Discussion
5.1. Water Film Theory
The water film on the soil surface is the basis of soil adhesion [30,31,32]. Fontaine’s water film theory indicates that soil adhesion on solid surfaces occurs in two contact states: discontinuous water rings and continuous water films. Some scholars have also applied this theory to study the mud cake problem [33]:
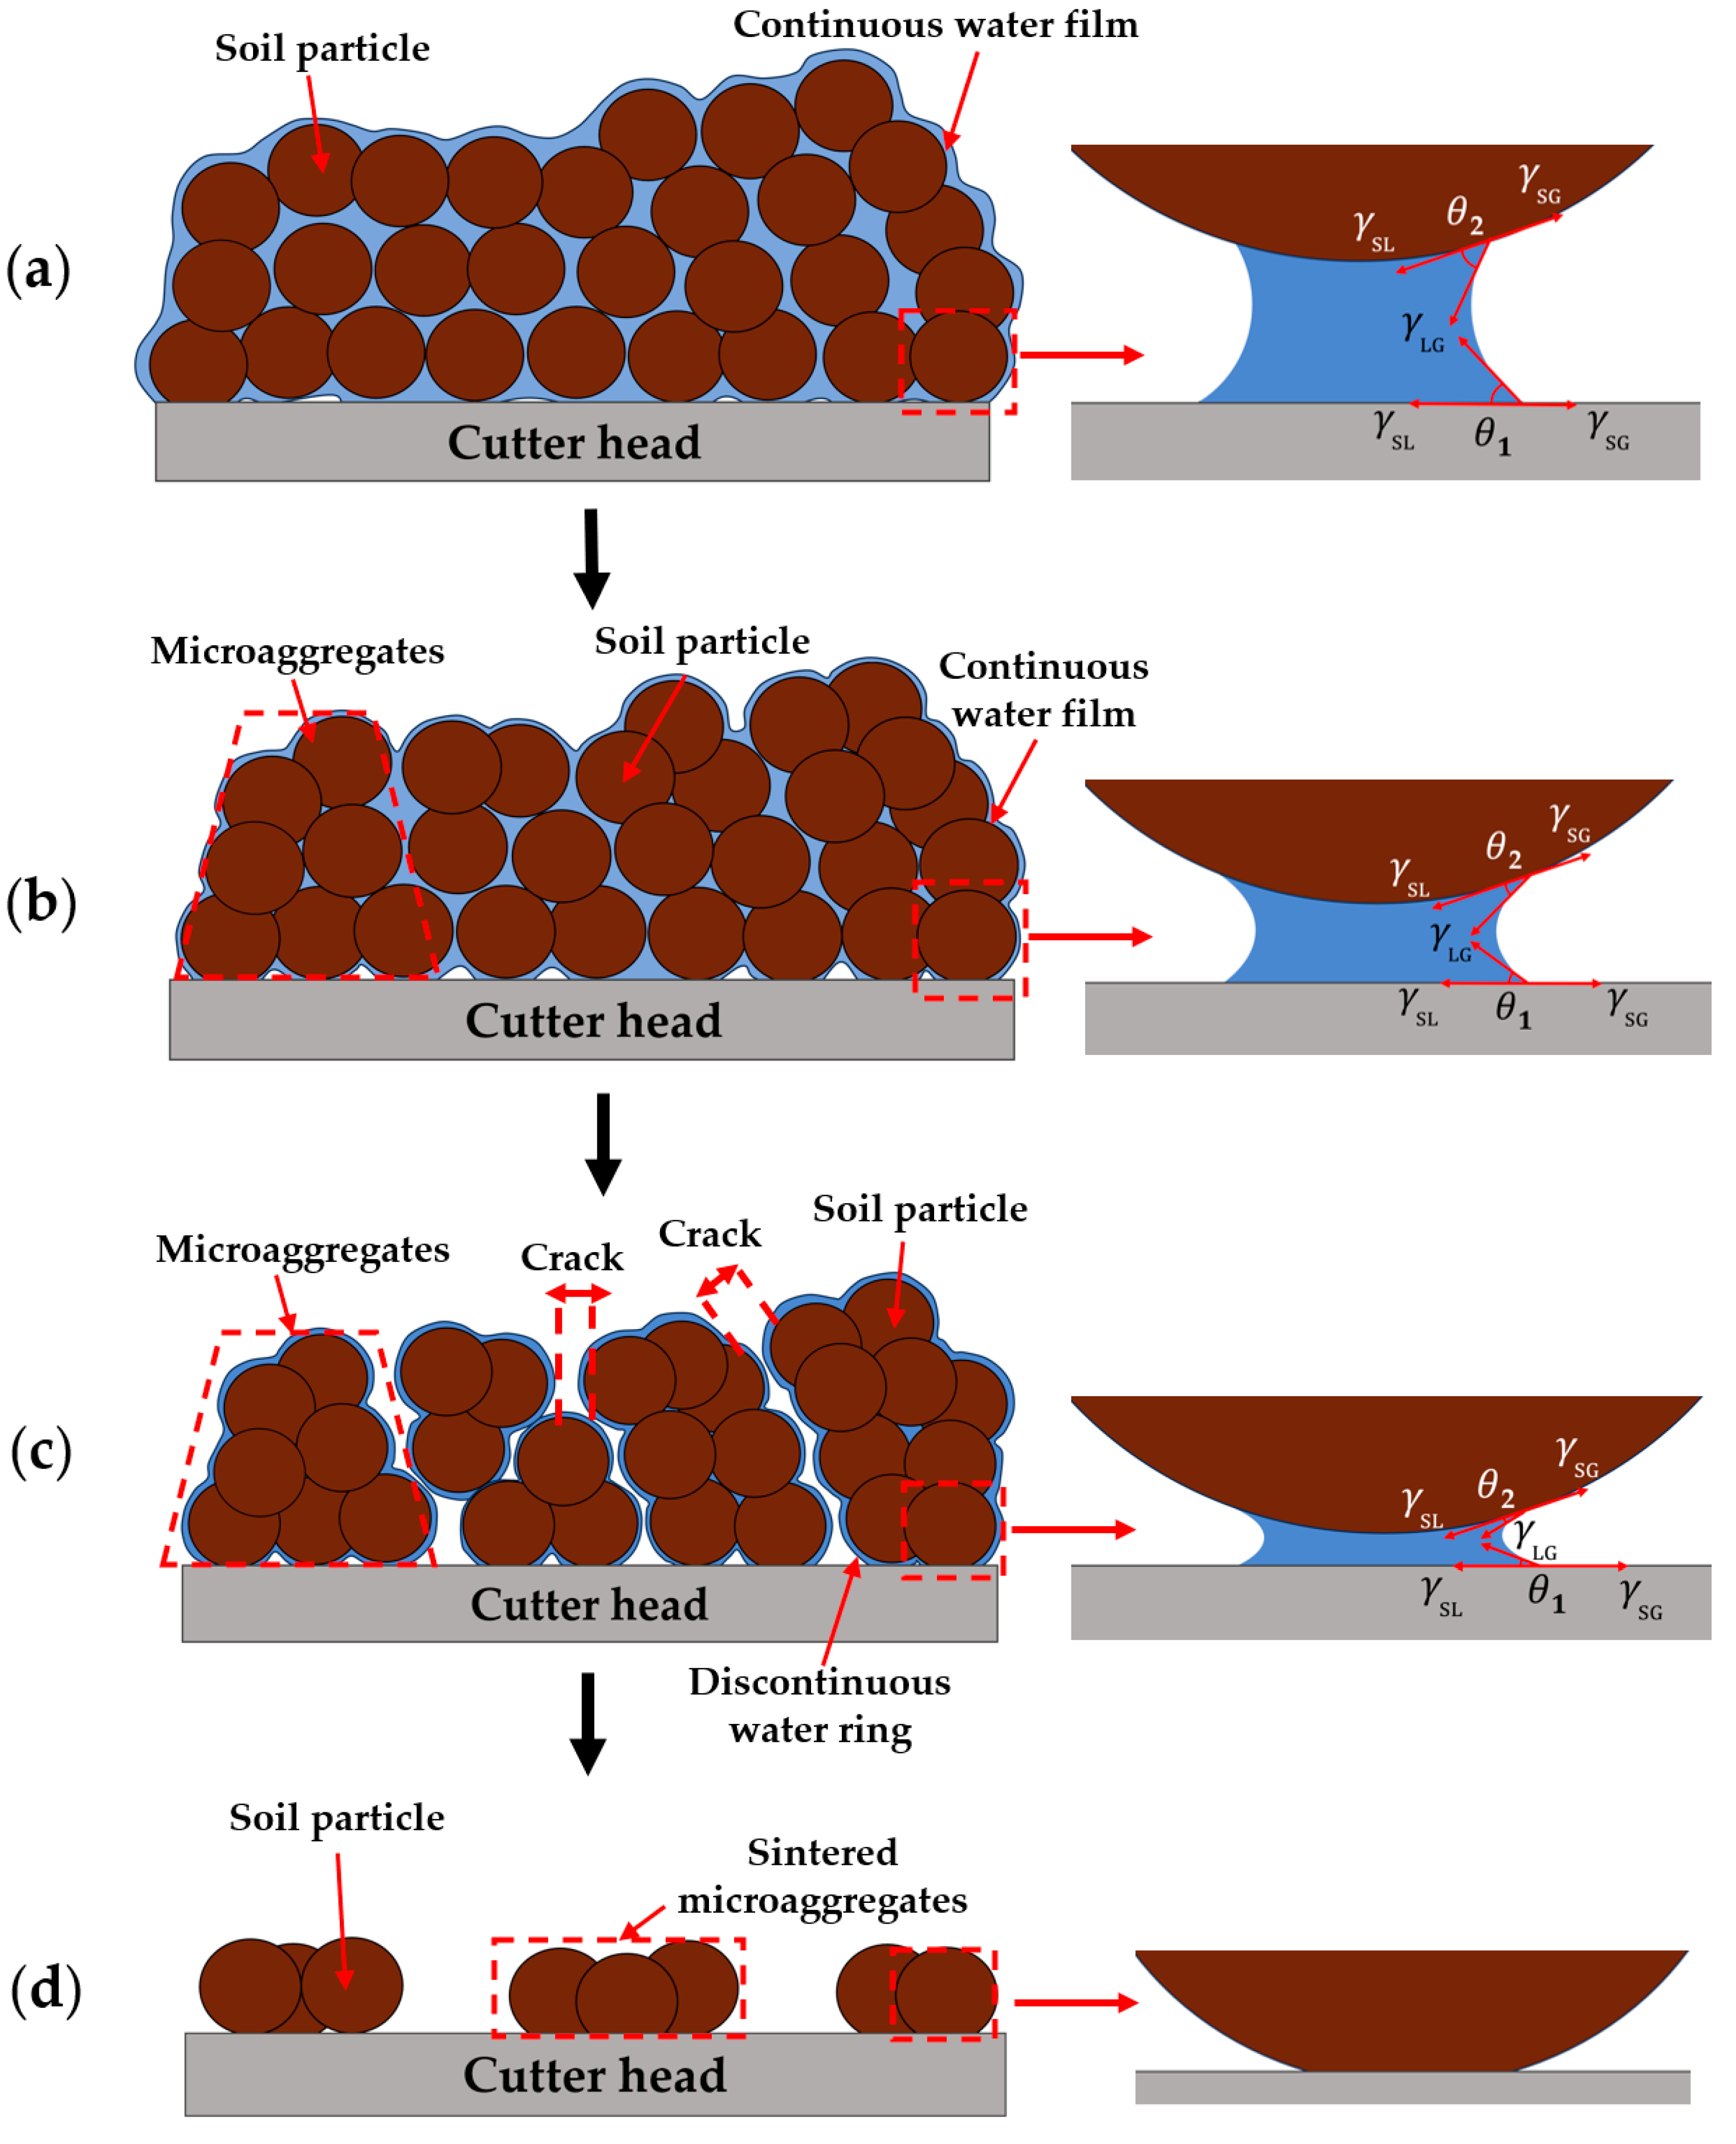
When the soil is relatively dry, with coarse particles, the contact is in the form of discontinuous water rings, as shown in Figure 27a. When the soil is moist and has fine, cohesive particles, the contact is a continuous water film. In this contact state, the soil particles are filled with water, and the water film closely connects the soil particles to the metal interface, as shown in Figure 27c.

Figure 27.
Adhesion mechanism at different water contents. (a) Natural water content; (b) suitable water content; (c) less water content; (d) dehydration state.
The formation of the water film is a macroscopic manifestation of the interfacial tensions among solid–gas, solid–liquid, and liquid–gas interfaces (Figure 27a). The relationship between them is expressed by Young’s equation, as shown in Equations (3) and (4).
where γLG represents the free energy between the liquid and gas interface; γSL is the free energy between the liquid and solid interface; γSG is the free energy between the solid and gas interface; θ is the angle between the solid–liquid interface and the liquid–gas interface at the three-phase junction, known as the contact angle.
Solids with strong intermolecular forces have higher surface free energy. However, the surface free energy of solids can be difficult to measure, so the contact angle is often used in engineering to characterize the interaction between liquids and solids at the interface. Generally, the smaller the contact angle, the stronger the hydrophilicity and the greater the soil adhesion.
5.2. Adhesion Mechanism at Different Water Contents
Figure 27 illustrates the changes in the water film and the adhesion of soil particles to the cutterhead as the water content gradually decreases with increasing temperature. Combined with experimental results, the process is mainly divided into four stages:
Stage 1: As shown in Figure 27a, when the soil particles in the mud cake adhere to the cutterhead at the natural water content (36.5%), the soil particles are surrounded by a water film due to the high water content. At this stage, the water film is thick, the soil particles are relatively loose, and the friction between particles is minimal.
Stage 2: As the temperature increases, the water content decreases to about 30%. At this stage, the water film becomes thinner due to the reduced water content. Additionally, several soil particles aggregate to form microaggregates, which are more compactly arranged, as shown in Figure 27b.
Stage 3: When the water content decreases further, the soil particles become more compact, leading to larger cracks between the different microaggregates, which appear as cracks in the mud cake on a macroscopic level. The water film between the microaggregates becomes thinner or disappears, forming discontinuous water rings, as shown in Figure 27c.
Stage 4: Continued high-temperature baking of the mud cake (temperatures exceeding 150 °C) causes some sintered micro-aggregates to adhere firmly to the cutterhead. These sintered micro-aggregates can be observed on the cutterhead after the mud cake sheds in water, as shown in Figure 27d. This phenomenon occurs because soil particles lose water at high temperatures, adhering more firmly to the metal surface. Additionally, hardness tests show that high-temperature sintered mud cake samples exhibit higher hardness. This indicates that the sintering process makes the mud cake structure more hardened and dense, increasing the difficulty of removing the mud cake. In shield tunneling construction, the occurrence of sintering in mud cakes greatly increases construction difficulty. A sintered mud cake has higher hardness and density, which not only increases the force required to cut the mud cake but also exacerbates tool wear and makes it harder to remove the mud cake from the tools, thus affecting construction progress.
The experimental results indicate that mud cake samples exhibit very strong adhesion at a water content of 30% (Stage 2). This is because, at Stage 1, the water film is thicker, resulting in smaller meniscus curvature and larger contact angles (θ1 and θ2) compared to Stage 2, leading to reduced water film tension and thus lower adhesion between soil particles and the cutterhead. Additionally, the water film may lubricate the adhesion interface, as a thicker water film reduces direct contact between particles, thereby decreasing friction between soil particles.
In Stage 3, as the water content decreases (below 30%), the water film becomes thinner, and the meniscus curvature increases compared to Stage 2. Although the final contact angles (θ1 and θ2) are smaller than in Stage 2, the reduction in water content causes the water film between microaggregates to thin and even break locally, leading to cracks where the water film breaks. During this stage, the surface tension of the water film decreases, reducing adhesion.
From the analyses of Stages 1 and 3, it is evident that during Stage 2, the water film is of moderate thickness, forming a continuous film while maintaining high surface tension. Additionally, the soil particles are more compact, resulting in greater friction between particles. Therefore, the adhesion is strongest at this stage.
6. Conclusions
This study developed a simulated shield tunneling mud cake adhesion device and conducted shedding and hardness tests. It thoroughly examined the variation patterns in red-bed geological mud cake influenced by temperature, time, and water content, along with their adhesion characteristics and mechanisms. The main conclusions are as follows:
Within the temperature range of 25 °C to 150 °C, the higher the temperature, the faster the shedding rate of the mud cake, and the final shedding amount also increases. However, when the temperature exceeds 150 °C, the shedding amount of sample T200-50 decreases by about 5% compared to sample T125-50. At this point, a small portion of the soil particles undergo sintering due to dehydration at high temperatures, becoming firmly attached to the metal surface and difficult to detach.
At low temperatures (25 °C and 50 °C), the final shedding amount and rate of mud cake change little over time. Within moderate temperatures (75 °C, 100 °C, 125 °C), the final shedding amount and rate significantly increase as time extends. However, at higher temperatures (150 °C, 175 °C, 200 °C), the final shedding amount decreases over time, with a notable sintering effect.
Water content is a crucial factor affecting the shedding amount of mud cakes, with the shedding amount showing a trend of decreasing and then increasing as water content varies. At about 30% water content, the adhesiveness of the mud cake is the strongest, and the shedding amount is the smallest.
The increase in temperature significantly enhances the hardness of mud cakes, especially at high temperatures (above 150 °C). The hardening and sintering effects of the mud cake increase the force required to penetrate them. The force required to penetrate sample T200-50 has increased by approximately 679% compared to sample T25-50, undoubtedly increasing the difficulty of removing the mud cake and shield tunneling.
Author Contributions
Writing—original draft and conceptualization, J.Y.; project administration, writing—review and supervision, X.X.; data curation, K.X.; investigation, C.G.; methodology, conceptualization, data analysis, writing—review, K.Z. All authors have read and agreed to the published version of the manuscript.
Funding
This research received no external funding.
Institutional Review Board Statement
Not applicable.
Informed Consent Statement
Not applicable.
Data Availability Statement
All data that support the findings of this study are available from the corresponding author upon reasonable request.
Conflicts of Interest
The authors declare no conflicts of interest.
References
- Zhou, C.; Ding, L.; Skibniewski, M.J.; Luo, H.; Zhang, H. Data based complex network modeling and analysis of shield tunneling performance in metro construction. Adv. Eng. Inform. 2018, 38, 168–186. [Google Scholar] [CrossRef]
- Avunduk, E.; Copur, H. Effect of clogging on EPB TBM performance: A case study in Akfirat waste water tunnel, Turkey. Geotech. Geol. Eng. 2019, 37, 4789–4801. [Google Scholar] [CrossRef]
- Zumsteg, R.; Puzrin, A.M.; Anagnostou, G. Effects of slurry on stickiness of excavated clays and clogging of equipment in fluid supported excavations. Tunn. Undergr. Space Technol. 2016, 58, 197–208. [Google Scholar] [CrossRef]
- Thewes, M.; Burger, W. Clogging of TBM drives in clay–identification and mitigation of risks. In Underground Space Use. Analysis of the Past and Lessons for the Future, Two Volume Set; CRC Press: Boca Raton, FL, USA, 2005. [Google Scholar]
- Ding, X.; Xie, A.Y.; Yang, H.; Li, S. Quantifying Multifactor Effects on Mud Cake Formation Risk for a Tunnel Boring Machine with the Analytical Hierarchy Process. Buildings 2023, 13, 355. [Google Scholar] [CrossRef]
- Basmenj, A.K.; Ghafoori, M.; Cheshomi, A.; Azandariani, Y.K. Adhesion of clay to metal surface; Normal and tangential measurement. Geomech. Eng. 2016, 10, 125–135. [Google Scholar] [CrossRef]
- Khabbazi Basmenj, A.; Mirjavan, A.; Ghafoori, M.; Cheshomi, A. Assessment of the adhesion potential of kaolinite and montmorillonite using a pull-out test device. Bull. Eng. Geol. Environ. 2017, 76, 1507–1519. [Google Scholar] [CrossRef]
- Khabbazi, A.; Ghafoori, M.; Tarigh Azali, S.; Cheshomi, A. Experimental and laboratory assessment of clogging potential based on adhesion. Bull. Eng. Geol. Environ. 2019, 78, 605–616. [Google Scholar] [CrossRef]
- Dash, B.; Murthy, V.; Chattopadhyaya, S. Design Aspects Governing Disc Cutters and Cutterheads of Hard Rock TBM—A Review. Min. Metall. Explor. 2024, 41, 219–237. [Google Scholar] [CrossRef]
- Farrokh, E. Layout design specifications of hard-rock TBM cutterheads at maximum cutter penetration and TBM advance. Arab. J. Geosci. 2021, 14, 2049. [Google Scholar] [CrossRef]
- Ji, F.; Liu, P.; Yang, Z.; Wen, B.; Hu, Q. Experimental study and mechanism analysis of high-pressure water jet for mud cake cutting during shield tunneling. Front. Earth Sci. 2024, 12, 1371212. [Google Scholar] [CrossRef]
- Djeran-Maigre, I.; Dubujet, P.; Vogel, T.M. Variation over time of excavated soil properties treated with surfactants. Environ. Earth Sci. 2018, 77, 67. [Google Scholar] [CrossRef]
- Zumsteg, R.; Plötze, M.; Puzrin, A.M. Effect of soil conditioners on the pressure and rate-dependent shear strength of different clays. J. Geotech. Geoenvironmental Eng. 2012, 138, 1138–1146. [Google Scholar] [CrossRef]
- Liu, P.; Yang, Z.; Ji, F.; Chen, P.; Hu, Q.; He, X. Study on Mudcake disintegration in clayey strata during shield tunneling: Effects of dispersants and bentonite slurry. Heliyon 2024, 10, e30663. [Google Scholar] [CrossRef] [PubMed]
- Yan, J.; Xue, X.; Gong, C.; Zhang, K. Study on the Characteristics and Mechanism of Shield Tunnel Mud Cake Disintegration in Complex Red-Bed Geology. Coatings 2024, 14, 567. [Google Scholar] [CrossRef]
- Kalayci Sahinoglu, U.; Ozer, U. The prediction of cutter wear from temperature measurements on TBM discs and cutting face. Arab. J. Geosci. 2020, 13, 207. [Google Scholar] [CrossRef]
- Farrokh, E.; Kim, D.Y. A discussion on hard rock TBM cutter wear and cutterhead intervention interval length evaluation. Tunn. Undergr. Space Technol. 2018, 81, 336–357. [Google Scholar] [CrossRef]
- Jin, D.; Zhang, Z.; Yuan, D. Effect of dynamic cutterhead on face stability in EPB shield tunneling. Tunn. Undergr. Space Technol. 2021, 110, 103827. [Google Scholar] [CrossRef]
- Qiu, T.; Zhang, Y. Experimental research on the impact of interface temperature on the adhesion properties of clay under the condition of different contacting time. Geofluids 2021, 2021, 4138102. [Google Scholar] [CrossRef]
- Ying, K.; Pan, X.; Lian, M.; Zou, F.; Xu, G.; Zhou, K.; Fang, Y. Effect of Soil-Cutterhead Interface Temperature on the Consolidation and Hardening of Mud Cake under Multi-factor Conditions. Arab. J. Sci. Eng. 2023, 48, 12931–12943. [Google Scholar] [CrossRef]
- Fu, J.; Xia, Y.; Lan, H.; Wu, D.; Lin, L. A case study on TBM cutterhead temperature monitoring and mud cake formation discrimination method. Sci. Rep. 2021, 11, 19983. [Google Scholar] [CrossRef]
- Yang, Y.; Li, X.; Jin, D.; Su, W.; Mao, J. Transient temperature field model for a cutterhead during slurry shield tunneling. Tunn. Undergr. Space Technol. 2021, 117, 104128. [Google Scholar] [CrossRef]
- Abuel-Naga, H.; Bergado, D.; Ramana, G.; Grino, L.; Rujivipat, P.; Thet, Y. Experimental evaluation of engineering behavior of soft Bangkok clay under elevated temperature. J. Geotech. Geoenviron. Eng. 2006, 132, 902–910. [Google Scholar] [CrossRef]
- Zhou, M.; Li, J.; Luo, Z.; Sun, J.; Xu, F.; Jiang, Q.; Deng, H. Impact of water–rock interaction on the pore structures of red-bed soft rock. Sci. Rep. 2021, 11, 7398. [Google Scholar] [CrossRef] [PubMed]
- Huang, K.; Kang, B.; Zha, F.; Li, Y.; Zhang, Q.; Chu, C. Disintegration characteristics and mechanism of red-bed argillaceous siltstone under drying–wetting cycle. Environ. Earth Sci. 2022, 81, 336. [Google Scholar] [CrossRef]
- Slanska, J. A red-bed formation in the South Bohemian Basins, Czechoslovakia. Sediment. Geol. 1976, 15, 135–164. [Google Scholar] [CrossRef]
- Xie, X.; Chen, H.; Xiao, X.; Wang, J.; Zhou, J. Micro-structural characteristics and softening mechanism of red-bed soft rock under water-rock interaction condition. J. Eng. Geol. 2019, 27, 966–972. [Google Scholar]
- Zhou, H.; Zheng, D.; Liu, J.; Yin, R. Fractal Characterization of the Microstructure of Red-Bed Soft Rocks and Kinetic Modeling of Interfacial Evolution. Appl. Sci. 2024, 14, 4458. [Google Scholar] [CrossRef]
- Piskulich, Z.A.; Mesele, O.O.; Thompson, W.H. Activation energies and beyond. J. Phys. Chem. A 2019, 123, 7185–7194. [Google Scholar] [CrossRef]
- Burbaum, U.; Sass, I. Physics of adhesion of soils to solid surfaces. Bull. Eng. Geol. Environ. 2017, 76, 1097–1105. [Google Scholar] [CrossRef]
- Fang, Y.; Zhuo, B.; Zhang, R.; Wang, Y.; Dou, L.; Yao, Y. Soil conditioning of clay based on interface adhesion mechanism: Microscopic simulation and laboratory experiment. Undergr. Space 2024, 18, 239–255. [Google Scholar] [CrossRef]
- Ewing, G.E. Ambient thin film water on insulator surfaces. Chem. Rev. 2006, 106, 1511–1526. [Google Scholar] [CrossRef] [PubMed]
- Cui, J.; Xu, G.; Fang, Y.; Chen, Z.; Yao, Z.; Tao, L.; Qu, L. Experimental assessment of Soil/metal interface adhesion behaviours of EPB shield Machines. Tunn. Undergr. Space Technol. 2023, 131, 104835. [Google Scholar] [CrossRef]


Disclaimer/Publisher’s Note: The statements, opinions and data contained in all publications are solely those of the individual author(s) and contributor(s) and not of MDPI and/or the editor(s). MDPI and/or the editor(s) disclaim responsibility for any injury to people or property resulting from any ideas, methods, instructions or products referred to in the content. |
© 2024 by the authors. Licensee MDPI, Basel, Switzerland. This article is an open access article distributed under the terms and conditions of the Creative Commons Attribution (CC BY) license (https://creativecommons.org/licenses/by/4.0/).