Article

CMAS Corrosion Resistance of Plasma-Sprayed YSZ and Yb2O3-Y2O3-Co-Stabilized ZrO2 Coatings under 39–40 KW Spraying Power

1
Key Laboratory of Pressure System and Safety, Ministry of Education, East China University of Science and Technology, Shanghai 200237, China
2
Shanghai Institute of Aircraft Mechanics and Control, Shanghai 200237, China
3
AECC Commercial Aircraft Engine Co., Ltd., Shanghai 200241, China
*
Authors to whom correspondence should be addressed.
These authors contributed equally to this work.
Coatings 2024, 14(8), 928; https://doi.org/10.3390/coatings14080928 (registering DOI)
Submission received: 5 July 2024 / Revised: 21 July 2024 / Accepted: 22 July 2024 / Published: 24 July 2024
(This article belongs to the Section Corrosion, Wear and Erosion)

Abstract

:
This study uses atmospheric plasma spraying (APS) technology to prepare thermal barrier coatings (TBCs) with yttrium-stabilized zirconia (YSZ) and Yb2O3-Y2O3-co-stabilized ZrO2 (YbYSZ) materials at different spraying powers. It analyzes the differences and changes in the microstructure, thermodynamic properties, and mechanical properties of the TBCs. The CaO-MgO-Al2O3-SiO2 (CMAS) resistance of coatings was tested using thermal cycling-CMAS experiments and isothermal corrosion experiments. Compared to YSZ coatings, YbYSZ coatings have lower thermal conductivity, a higher hardness and elastic modulus, a longer lifetime under thermal cycling-CMAS conditions, and lower penetration and degradation depths. Under thermal cycling-CMAS coupling conditions, the optimal power range for the longest thermal cycling lifetime for both coatings is 39–40 kW. Overall, compared to the YSZ material, the YbYSZ material exhibits superior properties.

1. Introduction

Thermal barrier coatings (TBCs) are metal or ceramic powders applied to component surfaces using methods, such as plasma spraying, chemical vapor deposition (CVD), and physical vapor deposition (PVD) [1,2,3,4,5]. These coatings protect substrates from high temperatures, oxidation, and thermal expansion, thereby enhancing erosion and corrosion resistance and extending the service life of the components [6,7]. The application of TBCs evidently holds greater potential and cost-effectiveness [8,9]. TBCs have been widely recognized and emphasized globally, becoming one of the primary methods for thermal protection [2,10]. A typical TBC system comprises three parts [11]: the top coat (TC), the bond coat (BC), and the metallic substrate. The common TC is composed of 6–8 wt% Y2O3-stabilized ZrO2 (6-8YSZ), which has both low thermal conductivity and a high thermal expansion coefficient [12]. The BC has an antioxidant effect and reduces thermal expansion mismatch [4]. Its composition mainly includes MCrAlY, where M is Ni or Co [13]. The substrate is usually a nickel-based superalloy from the hot-section component. It is important to always ensure the stability and reliability of TBCs under complicated service conditions. The issue of molten silicate corrosion is particularly prominent and is considered one of the threats to the service performance of TBCs [14].
Particles originating from dust, sand, or volcanic ash in the air are ingested by the gas turbine in service, melting and depositing on the TBC surface in high-temperature environments, forming glassy substances mainly composed of CaO-MgO-Al2O3-SiO2, known as CMAS [15,16,17]. Currently, the evaluation criteria for TBCs mainly fall into two aspects: durability and reliability [18]. When CMAS corrosion occurs under service conditions, the coating’s lifetime is significantly reduced. It is generally believed that when the service temperature exceeds 1200 °C, CMAS corrosion becomes the main cause of TBC failure [19].
The corrosion mechanisms of CMAS on TBCs mainly include the following two aspects: (1) When the coating is in service under CMAS conditions, molten CMAS adheres to and infiltrates the coating surface and reacts with the stabilizer Y2O3. This reaction accelerates the phase transformation of the coating, causing volume expansion and generating phase transformation stress within the coating. This stress leads to crack initiation and propagation, resulting in premature coating failure. Moreover, excessive cracks provide more pathways for CMAS infiltration, accelerating coating failure [20]. (2) When TBCs are in service at high temperatures, the formed thermal grown oxides (TGOs) react with molten CMAS to produce MgAl2O4 spinel and CaAl2Si2O8 anorthite [16]. This reaction causes a sharp increase in interlayer stress, resulting in coating spallation and failure. Researchers have revealed that the infiltration of CMAS into the coating during the cooling phase results in the formation of a glass phase within the ceramic layer. This, in turn, reduces the strain tolerance of the coating, thereby decreasing the service life [21,22].
The CMAS corrosion resistance of TBCs is influenced by both the coating material and its microstructure. Additionally, coating performance varies with different spraying process parameters. The effect of power on the CMAS corrosion resistance of TBCs is extremely complex. On one hand, higher power results in a denser coating structure with fewer inherent defects, which reduces the pathways for CMAS infiltration and thereby enhances CMAS corrosion resistance. Increased hardness and elastic modulus improve the coating’s resistance to particle impact. On the other hand, reduced porosity decreases the coating’s thermal insulation performance, and during service, the lower strain tolerance can lead to the accumulation of thermal stress within the coating, causing premature failure [23]. Studies have shown that Yb2O3 and Y2O3-co-stabilized ZrO2 (YbYSZ) coatings exhibit good CMAS corrosion resistance compared to conventional YSZ TBCs [24]. In both thermal cycling and thermal cycling-CMAS experiments, the YbYSZ coatings showed superior thermal cycling performance [25]. When the YBYSZ coating is exposed to CMAS corrosion, the low diffusion rate of Yb can effectively mitigate the degradation of the thermal barrier coating. Concurrently, Yb doping can augment the surface energy and Griffith work of YSZ materials, diminish the wetting angle of CMAS on the coating surface, and enhance the wetting performance [26]. The YbYSZ coating exhibited higher porosity compared to the YSZ material after exposure to high-temperature thermal conditions. Furthermore, it maintained a distinct columnar crystalline structure following high-temperature sintering at 1300 °C and CMAS corrosion for 32 h, thereby demonstrating superior resistance to sintering [27]. However, the current research primarily focuses on the CMAS corrosion resistance of YbYSZ materials, with a lack of comparative studies on the mechanical properties, thermodynamic properties, and other performance aspects of TBCs made from YbYSZ and YSZ materials.
In practical applications, the material properties of YbYSZ coatings need to consider parameters, such as the thermal conductivity, mechanical properties, and thermal expansion coefficient. However, there is currently a lack of comparative studies on the comprehensive material properties of YbYSZ coatings and YSZ coatings. Additionally, it is important to note that the spraying power has a significant impact on the quality of the coating. To compare the overall performance of coatings prepared from two different materials, this paper prepared YbYSZ and YSZ coatings under different spraying powers. The performance of these coatings was evaluated through the thermal cycling-CMAS test, CMAS isothermal corrosion test, and mechanical property tests. This research comprehensively analyzes the impact of the spraying power on the CMAS corrosion resistance of both coatings, comparing their performance under different power conditions to highlight the superiority of YbYSZ over YSZ.

2. Experimental Materials and Methods

2.1. Deposition of the TBCs

YbYSZ and YSZ coatings were prepared using atmospheric plasma spraying (APS) technology under different power ranges: 31–32 kW, 35–36 kW, 39–40 kW, 43–44 kW, and 47–48 kW. The TC and BC of the TBCs were prepared using an F4-MB APS system (Oerlikon Metco, Pfaeffikon, Switzerland). The metallic substrate used was Inconel-5188 with dimensions ɸ25.4 × 6.35 mm. Before preparing TBCs, the substrate must undergo pre-treatment through spraying. The metal substrate is cleaned ultrasonically with anhydrous ethanol to remove any oil stains from its surface. Additionally, sandblasting is performed on the substrate. Before spraying the BC layer, entire substrates were grit-blasted with 80# brown-corundum particles at a sandblasting pressure of 0.7 Mpa, resulting in a surface roughness of 3~4 μm. Before depositing the ceramic layer, a NiCrAlY bond coat with a thickness of about 80–100 μm was sprayed onto the grit-blasted substrate. The total thickness of the TC layers prepared in this study was maintained at approximately 300–350 μm. The two types of powders used for the TC were prepared using the same granulation process. The spraying powders used in this experiment are all commercial powders manufactured by third parties. The YSZ powder is manufactured by Beijing Sunspraying Technology Co, Ltd., Beijing, China. The YbYSZ powder is manufactured by Suzhou Meierbang Material Co., Ltd., Suzhou, China. The microstructural images and particle size distributions of the YSZ powders and YbYSZ spray powders are the same as those of the powders microstructure in the previously published papers [28]. During the coating preparation process, the spraying power was varied by adjusting the spraying current. The spraying process parameters are shown in Table 1. The chemical composition of the powder is shown in Table 2.

2.2. CMAS Powder Preparation

CMAS sources are quite diverse, including volcanic ash, dust, and fuel impurities, making field sampling challenging and resulting in regional variations in CMAS composition. Therefore, the composition of these powders is consistent with standard CMAS compositions reported in the literature [29], as shown in Table 3. The required oxide powders (from Shanghai Chemical Reagent Company, Shanghai, China) were weighed according to specific proportions and then thoroughly mixed using a high-speed planetary ball mill (ND8-L planetary ball mill, Nanjing NanDa Instrument Plant, Nanjing, China). The mixed powder was placed in a muffle furnace at 1550 °C for 4 h to ensure a complete reaction [30,31]. The resulting product was then processed through ethanol ball milling, drying, and sieving to obtain the CMAS powder used in this study.

2.3. Thermal Cycling-CMAS Test

A thermal cycling-CMAS test was used to simulate the thermal cycling-CMAS coupled conditions on the coatings to evaluate their service performance and lifespan. In this experiment, high-temperature gas generated by the combustion of propane and oxygen rapidly heated the surface of the sample coating. Concurrently, the back of the sample was continuously cooled by compressed air, creating a significant temperature gradient within the thermal barrier coating system. This setup aims to simulate the thermal load conditions experienced by thermal barrier coatings in the combustion chamber of an aircraft engine [32,33]. At the end of the heating phase, the sample disc was rotated to the cooling position, and compressed air quickly cooled the surface and back of the sample, reducing the sample temperature to about 100 °C within 60–80 s. This process generates a temperature gradient opposite to that of the heating phase within the thermal barrier coating system. In this study, the surface temperature of the coating was maintained at approximately 1300 °C, while the backside temperature of the sample was controlled at around 900 °C. To simulate the complex conditions of thermal cycling-CMAS coupling in actual service, each cycle consisted of 5 min of flame heating followed by 5 min of compressed air cooling. After every two thermal cycles, a 2 wt% CMAS ethanol slurry was uniformly applied to the coating surface, increasing the CMAS concentration on the coating surface by approximately 0.4 mg/cm2 each time. In this experiment, coating failure was determined when the degree of cracking or spalling reached 20% of the total coating surface area.

2.4. CMAS Isothermal Corrosion Test

The CMAS isothermal corrosion experiment was conducted in a muffle furnace. Due to the high experimental temperature, which exceeds the operating temperature of nickel-based superalloys, substrate-free coatings were used for this experiment. The specific preparation process for the coatings is as follows: Referring to the process parameters in Table 1, a TC approximately 1 mm thick was prepared on a 45# carbon steel substrate. The substrate was then etched with dilute hydrochloric acid to separate it from the ceramic layer, thus obtaining a free-standing sprayed coating. The slurry of CMAS powder was prepared by mixing it with anhydrous ethanol and coating it on sample at a concentration of 20 mg/cm2. The sample coated with CMAS powder was placed in a muffle furnace and held at 1300 °C for 1 h. Subsequently, the sample was cold-inlaid with epoxy resin and subsequently processed using a grinding and polishing machine for metallographic microstructure analysis. The microstructure of the corroded sample was observed using a scanning electron microscope to investigate the CMAS corrosion resistance behavior of the different coatings. Considering the numerous and unevenly distributed pores in the free-standing coatings, the observed CMAS penetration depth exhibited some variability. To obtain more accurate results, the average penetration depth from ten different locations was used as the representative CMAS penetration depth for the sample.

2.5. Characterization of Thermal and Mechanical Properties

The thermal conductivity measurement samples were square, free-standing coatings with dimensions of 1 cm × 1 cm × 1 mm. The thermal diffusivity (α) and specific heat capacity (C) of the materials were obtained using a laser flash analyzer (Linseis LFA1000, Selb, Germany). The density (ρ) of the free-standing coatings was determined using the Archimedes’ principle with water immersion. To minimize errors, each sample was measured three times at room temperature. The thermal conductivity (Κ) of the free-standing coatings was calculated using the following general formula [34]:
K = α · C · ρ
The hardness of the samples was measured using the indentation method with a Vickers hardness tester (HXD-1000TMC/LCD, Shanghai Taiming Optical Instrument Co., Ltd., Shanghai, China). A load of 300 gf was applied, and the indentation test positions were randomly distributed within the coating. To obtain reliable measurements, 15 points were selected on each sample, and the hardness of the sample was calculated as the average hardness of these 15 points. The elastic modulus (E) of the samples can be calculated using the following general formula [35]:
b a b a = α H E
where α = 0.45 is a constant for the Knoop indenter, H is the hardness, and b/a is the ratio of the indentation lengths of the small and large diagonals, with b/a being 1/7.11.

2.6. Material Phase and Structure Characterization

The microstructural morphology of the cross-sections of the samples before and after exposure to thermal cycling-CMAS coupling conditions and CMAS isothermal corrosion was observed using a scanning electron microscope (SEM, Hitachi S-3400N, Tokyo, Japan) equipped with an energy-dispersive spectrometer (EDS, Falion 60S, EDAX, Pleasanton, CA, USA). The images obtained using the above method were processed with the image analysis software Image J v1.8.0 [36]. The pore structures in the images were extracted and converted to binary images, and the contrast was adjusted. The porosity of the coating was calculated as the ratio of the pore area to the total area in the selected images. The porosity of the sample was taken as the average porosity of the selected positions. A phase analysis was conducted using an X-ray diffractometer (XRD, Rigaku Corporation 18kW/D/max2550VB/PC, Tokyo, Japan) with a continuous scan at a step size of 0.02° and a scan rate of 12°/min, covering a scanning angle range of 10–80°.

3. Results and Discussion

3.1. Microstructure and Phase Analysis of Sprayed Coatings

3.1.1. Cross-Section of Sprayed Coatings

The cross-sectional microstructure of the as-sprayed coatings at different power ranges is shown in Figure 1. Both types of as-sprayed coatings exhibit a layered structure with distinct pores and microcracks, which are typical characteristics of atmospheric plasma spraying coatings [3]. As the spraying power increases, the microstructure of the coatings changes significantly. At a lower power, the coatings have more pores and a certain number of horizontal cracks. As the porosity within the coatings gradually decreases, the coatings become denser, and exhibit a better molten state, with an increase in the number of vertical cracks. During the deposition process, the interparticle bonding rate within the coatings is about 30% [37], resulting in many poorly bonded or unbonded interfaces within the coatings. These interfaces are more prone to crack initiation and propagation. The formation of flattened particles significantly impacts the porosity within the coatings. The surface morphology of these flattened particles directly affects the interlayer bonding of the coatings [38]. Differences in the thickness of the powder droplets are related to the melting state and spreading degree of the flattened particles. Well-melted flattened particles are generally uniformly distributed and sufficiently spread, leading to minor thickness fluctuations. Over-melted flattened particles may excessively spread, causing the thickness to be too thin and prone to cracking. Poorly melted particles lead to uneven spreading, significant thickness fluctuations, and increased porosity between particles. These particles are challenging to merge and re-melt during the stacking process, resulting in more pores and horizontal cracks [39].
Through experimental research, Wang et al. [40] found that at a lower spraying power, the powder’s melting state is poor, and the spreading process of the flattened particles is somewhat hindered, resulting in uneven spreading. At a higher spraying power, the droplet temperature is significantly higher, the spreading speed is noticeably faster than the solidification speed, and the droplets can spread uniformly and sufficiently on the substrate. They established two models for the deposition process of the aforementioned types of particles [37,40]. In the first deposition model, the thickness of a single layer of flattened particles is uneven, the adhesion between lamellae is poor, and it is difficult to completely fill the gaps between adjacent lamellae, making the coating more prone to pores and horizontal cracks. In the second deposition model, the thickness of individual flattened particles is uniform, the gaps between the upper and lower layers are small, and the bonding between particles is relatively sufficient. However, the fracture of single flattened particles may penetrate into vertical cracks, making the coating more prone to larger vertical cracks.
By comparing the cross-sectional morphology of the two coatings at different power levels in Figure 1, we can find that the cross-sectional micromorphology of the YbYSZ and YSZ coatings prepared at the same power exhibits minimal disparity. The microscopic morphology of both the YbYSZ and YSZ coatings exhibits a trend toward increased density with a higher spraying power. Additionally, the pores continue to decrease with the increase in spraying power. To accurately determine the porosity of the as-sprayed coatings, 10 random positions were selected on each sample. These positions were imaged using the backscattered electron mode (BSE) of a scanning electron microscope. The porosity of the two coatings at different power ranges is shown in Figure 2. Both coatings exhibit the same trend, with the porosity gradually decreasing as the spraying power increases. This observation is consistent with the cross-sectional observations and the aforementioned theoretical analysis. Interestingly, at any given power range, the porosity of the as-sprayed YbYSZ coating is higher than that of the conventional YSZ coating. This is because the YbYSZ coating, compared to the YSZ coating, is doped with ytterbium, which increases the increased sintering properties of the coating to some extent. Liu’s study demonstrated that YbYSZ material can maintain an optimal columnar crystal structure even after sintering at 1300 °C for 32 h [41]. Good sintering resistance is crucial for increasing the porosity of YbYSZ materials. The presence of defects such as pores in the TBCs often results from the incomplete melting of the powder among other factors. Coatings produced using YbYSZ material, which exhibits superior sintering performance, tend to contain a higher quantity of insufficiently melted powder particles, consequently increasing the porosity. This makes it more difficult for the YbYSZ coating to form a dense structure during heat treatment, resulting in more small pores and cracks at the grain boundaries and leading to a higher porosity than the YSZ coating.

3.1.2. Surface Morphology of As-Sprayed Coatings

During the infiltration of molten CMAS into the coating, it first adheres to and wets the coating surface and then spreads and infiltrates the coating interior along its inherent defects under the driving force of capillary action. Therefore, reducing the wettability of the coating becomes a primary issue in CMAS resistance research. Currently, there are few studies on the wettability of TBC-CMAS systems, and the correlation and optimization methods between wettability and infiltration performance are not yet clear [42,43,44]. Yang et al. [45] show that the smoother the surface of the TBCs and the lower its roughness, the larger the contact angle with molten CMAS and the smaller the area of coating damage. Wenzel et al. [46] suggest that an increase in roughness can significantly enhance the original hydrophilic or hydrophobic properties. To explore the changes in the surface roughness of the coatings at different power levels, a three-dimensional profilometer was used to measure the surface roughness of all the coatings. Figure 3 shows the evolution of the surface roughness of the two coatings with different spraying powers. As the power increases, the surface roughness of both coatings continuously decreases, consistent with previous theories. The increase in spraying power allows the powder to absorb more heat, thereby melting and spreading more thoroughly, forming a smoother coating surface. Unexpectedly, within the full power range, there is no definite rule in the relationship of surface roughness between the two coatings. However, previous research by Liu et al. [27] indicated that at the same spraying power, the wetting angle of molten CMAS on the YbYSZ coating is larger than that on the YSZ coating. This phenomenon cannot be explained by changes in surface roughness alone; thus, in this study, surface roughness is not the main factor affecting the CMAS wetting angle of the two coatings. In addition to surface roughness, surface energy also affects the wettability of the coating. If the material’s surface energy is low, the wetting process of molten CMAS on the coating surface proceeds more slowly. Fang et al. [24] calculated the surface energy of YSZ and YbYSZ models using first-principles calculations, finding them to be 2.704 J/m2 and 2.637 J/m2, respectively. YbYSZ has a relatively lower surface energy, giving it a larger CMAS contact angle compared to YSZ. Therefore, YbYSZ material exhibits better resistance to CMAS wetting.

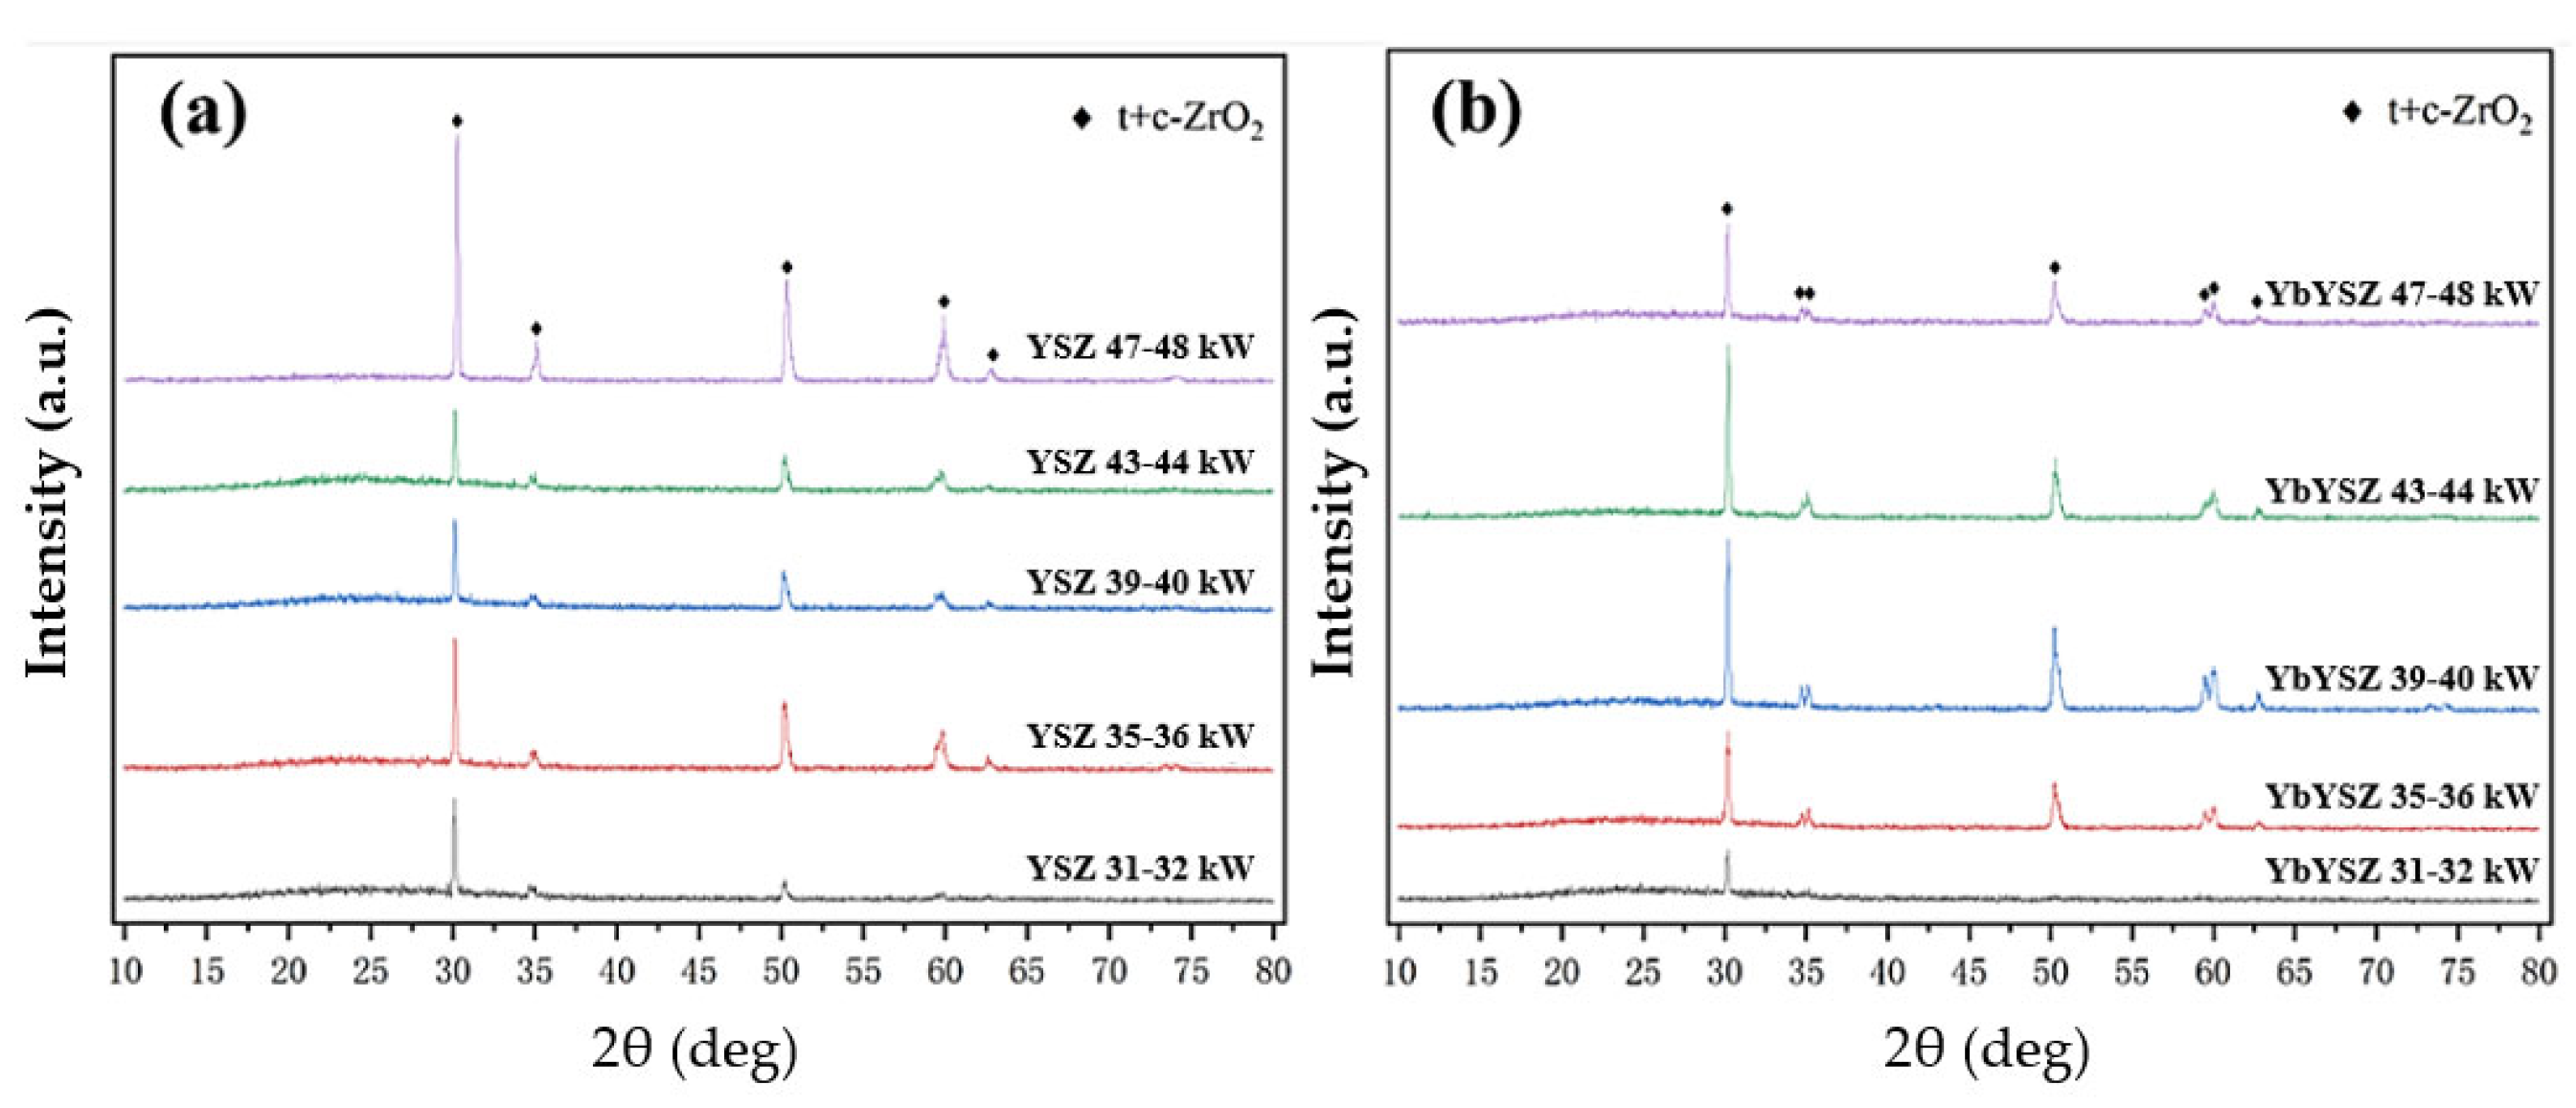
3.1.3. Phase Structure of As-Sprayed Coatings

Figure 4 shows the XRD patterns of the coatings at different power ranges. The variation in spraying power did not significantly affect the phase composition of the as-sprayed coatings, which mainly consisted of the tetragonal phase (t-phase) and cubic phase (c-phase). The unique toughening mechanisms of ferroelastic toughening and phase transformation toughening associated with the tetragonal phase significantly enhance the mechanical properties of the coatings, allowing them to maintain long-term durability under external mechanical loads [47,48]. The phase composition of the coatings is the same as that of the original powders. It indicates that the high temperatures generated during the spraying process did not cause phase transformation in the coating materials. Both materials maintained good phase stability throughout the process.

3.2. Thermophysical and Mechanical Properties of As-Sprayed Coatings

3.2.1. Thermophysical Properties of As-Sprayed Coatings

One of the key functions of TBCs is their excellent thermal insulation performance, which protects the substrate in high-temperature environments and reduces the surface temperature of engine hot-end components. Therefore, when evaluating the thermal properties of TBCs, the primary parameter of interest is thermal conductivity [49]. Figure 5 shows the trend of the thermal conductivity of the two coatings at room temperature with varying spraying power. As the spraying power increases, the thermal conductivity of both coatings shows a continuous upward trend. The increase in spraying power reduces the porosity within the coatings, making them denser. The reduction in the total amount of air gaps within the coatings decreases the obstruction to heat conduction, resulting in an increase in thermal conductivity. It is noteworthy that, across all the power ranges, the thermal conductivity of YbYSZ coatings is consistently lower than that of YSZ coatings. This indicates that the thermal insulation performance of TBCs made from YbYSZ material is superior to that of conventional YSZ coatings, ensuring the long-term service life of hot-end components. The shape of pores also has an important influence on thermal conductivity, especially for the microcrack/porous materials. Thermal conductivity relates to both the porosity and shape of pores as follows [50]:
K K 0 = ( 1 + 2 V π ( b a ) ) 1
where K is the thermal conductivity of the microcracked material; K0 is the thermal conductivity of the un-cracked material. V is the volume fraction of ellipsoidal pores. b is the major axis of the ellipsoid and a is the minor axis. In this study, the thermal conductivity of the two coatings prepared with YbYSZ and YSZ materials at different powers showed a tendency to increase with the decrease in porosity. The relevant changes can be seen in the revised draft.
Generally, in the theory of phonon heat transfer, the thermal conductivity of a material usually depends on the intensity of the phonon scattering. The main factors affecting the phonon scattering intensity are the number of oxygen vacancies within the crystal lattice and the substituted cation parameters of the material [51,52,53]. Due to differences in mass and volume, the substitution process of rare-earth atoms can cause lattice distortion, increasing the disorder of atomic arrangement within the lattice and promoting phonon scattering. In this study, the doping amount of rare-earth elements in YbYSZ and YSZ powders is the same. Therefore, the substitution of original atoms by rare-earth elements Y3+ and Yb3+ causes the same degree of disorder in the arrangement and generates the same number of oxygen vacancies. Thus, in this study, the number of oxygen vacancies is not the main factor affecting the degree of phonon scattering.
The substituted cation parameters can be considered the main factor causing the difference in thermal conductivity between the two materials. The substituted cations have a significant impact on the average free path of phonons. According to the literature reports [54,55], the relationship between thermal conductivity, the average free path of phonons, and substituted atomic parameters can be expressed as:
1 K ~ 1 l p ~ m m 2
1 K ~ 1 l p ~ r r 2
In Equations (3) and (4), K represents the thermal conductivity of the material. m and Δm represent the average mass of the substituted and substituting atoms and the average mass difference, respectively. r and Δr represent the average radius of the substituted and substituting atoms and the average radius difference, respectively.
The atomic radii of Yb, Y, and Zr are 98.5 pm, 101.9 pm, and 72 pm, respectively. Although the difference in the atomic radius between Yb and Zr is slightly smaller than that between Y and Zr, the atomic mass of Yb is 173.05, which is much larger than the atomic mass of Y (88.91). This causes a more significant change in thermal conductivity, indicating that, in this study, the effect of atomic mass on thermal conductivity is greater than that of atomic radius. Therefore, the thermal conductivity of YbYSZ material is lower than that of YSZ material [56].

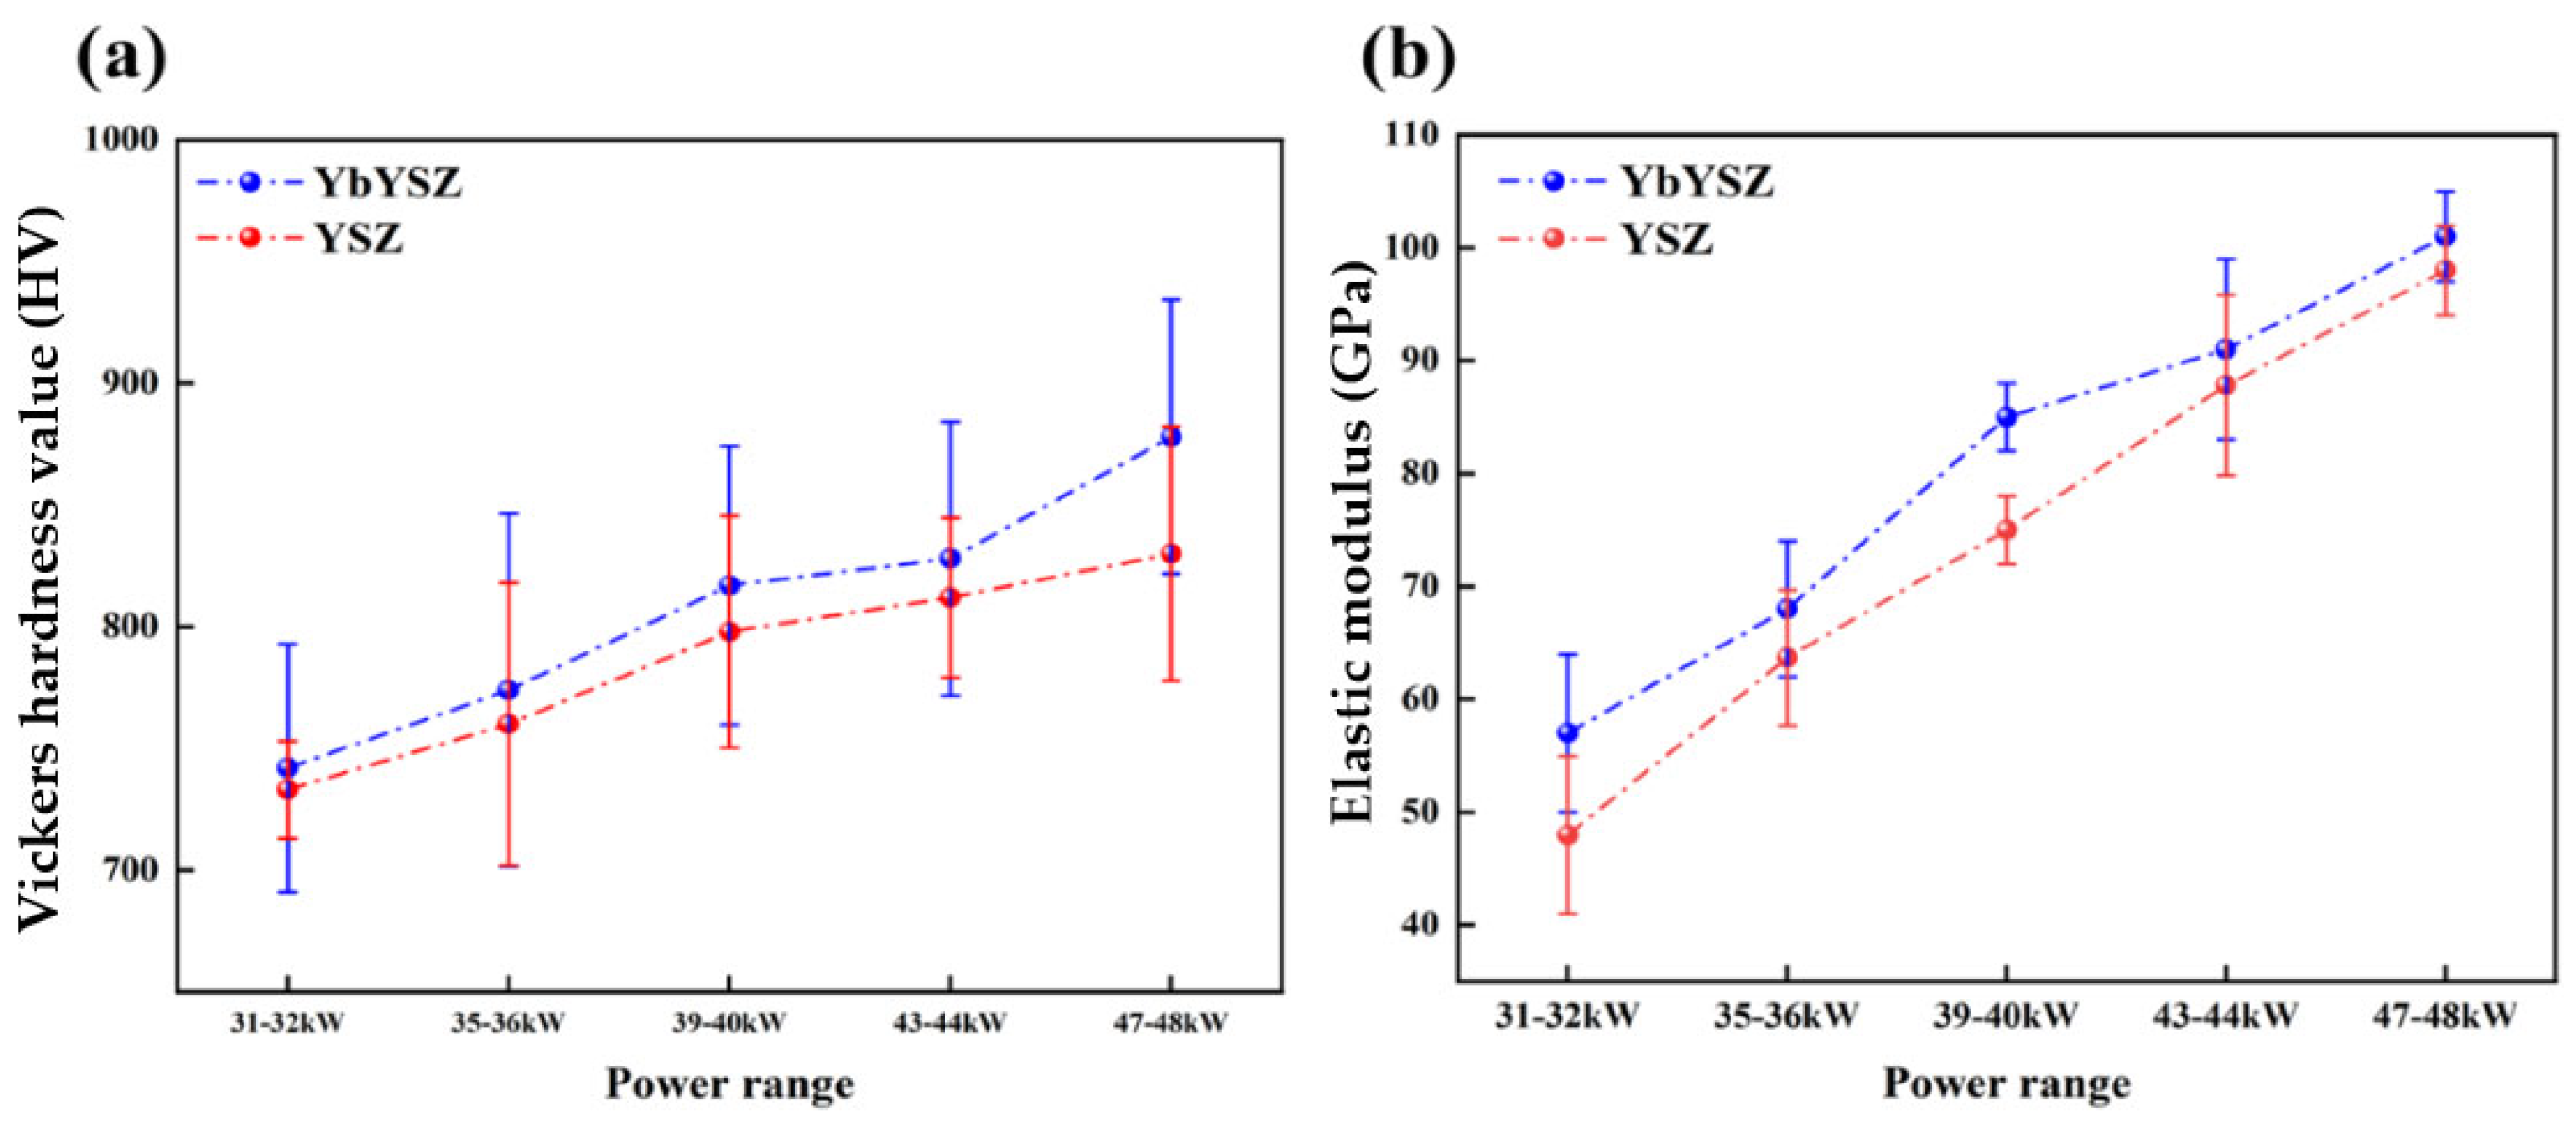
3.2.2. Mechanical Properties of As-Sprayed Coatings

The hardness of the coating is indicative of its capacity to withstand local pressure and wear induced by external loads, as well as, to a certain extent, its erosion resistance [57,58]. Higher hardness means the coating can better resist damage from friction, impact, or other external factors, which is crucial for maintaining the coating’s performance in actual working environments. It is an important parameter for assessing the mechanical properties of the coating. Besides hardness, another main parameter reflecting the mechanical properties of the coating is the elastic modulus, which represents the coating’s ability to deform and recover under stress. Specifically, a higher elastic modulus means the coating will deform less when subjected to external force.
This can be beneficial in some cases, such as when the coating is subjected to thermal expansion or mechanical impact, allowing it to maintain its shape and provide better protection. However, in other cases, a higher elastic modulus may lead to brittle behavior, making the coating prone to cracking or spalling. Figure 6 shows the changes in the mechanical properties of the coatings with varying spraying power. It is clear that with the increase in power, the hardness and elastic modulus of both coatings exhibit an upward trend. The main reason for this trend is that the internal defects of the coatings decrease with the increase in spraying power, leading to higher densification of the coatings and consequently improving their Vickers hardness and elastic modulus. Another important factor affecting the mechanical properties of the coatings is the type of material. The incorporation of the rare-earth element Yb can significantly improve the mechanical properties of the coating materials, such as the hardness, elastic modulus [59], and fracture toughness [60]. Within the scope of this study, the average hardness and average elastic modulus of the YbYSZ coatings are greater than those of the YSZ coatings. This means that under the same service conditions, the YbYSZ coatings have superior resistance to particle impact and a longer service life compared to conventional YSZ coatings.

3.3. Failure Mechanism of Plasma-Sprayed YbYSZ and YSZ Coatings under Thermal Cycling-CMAS Coupling Conditions

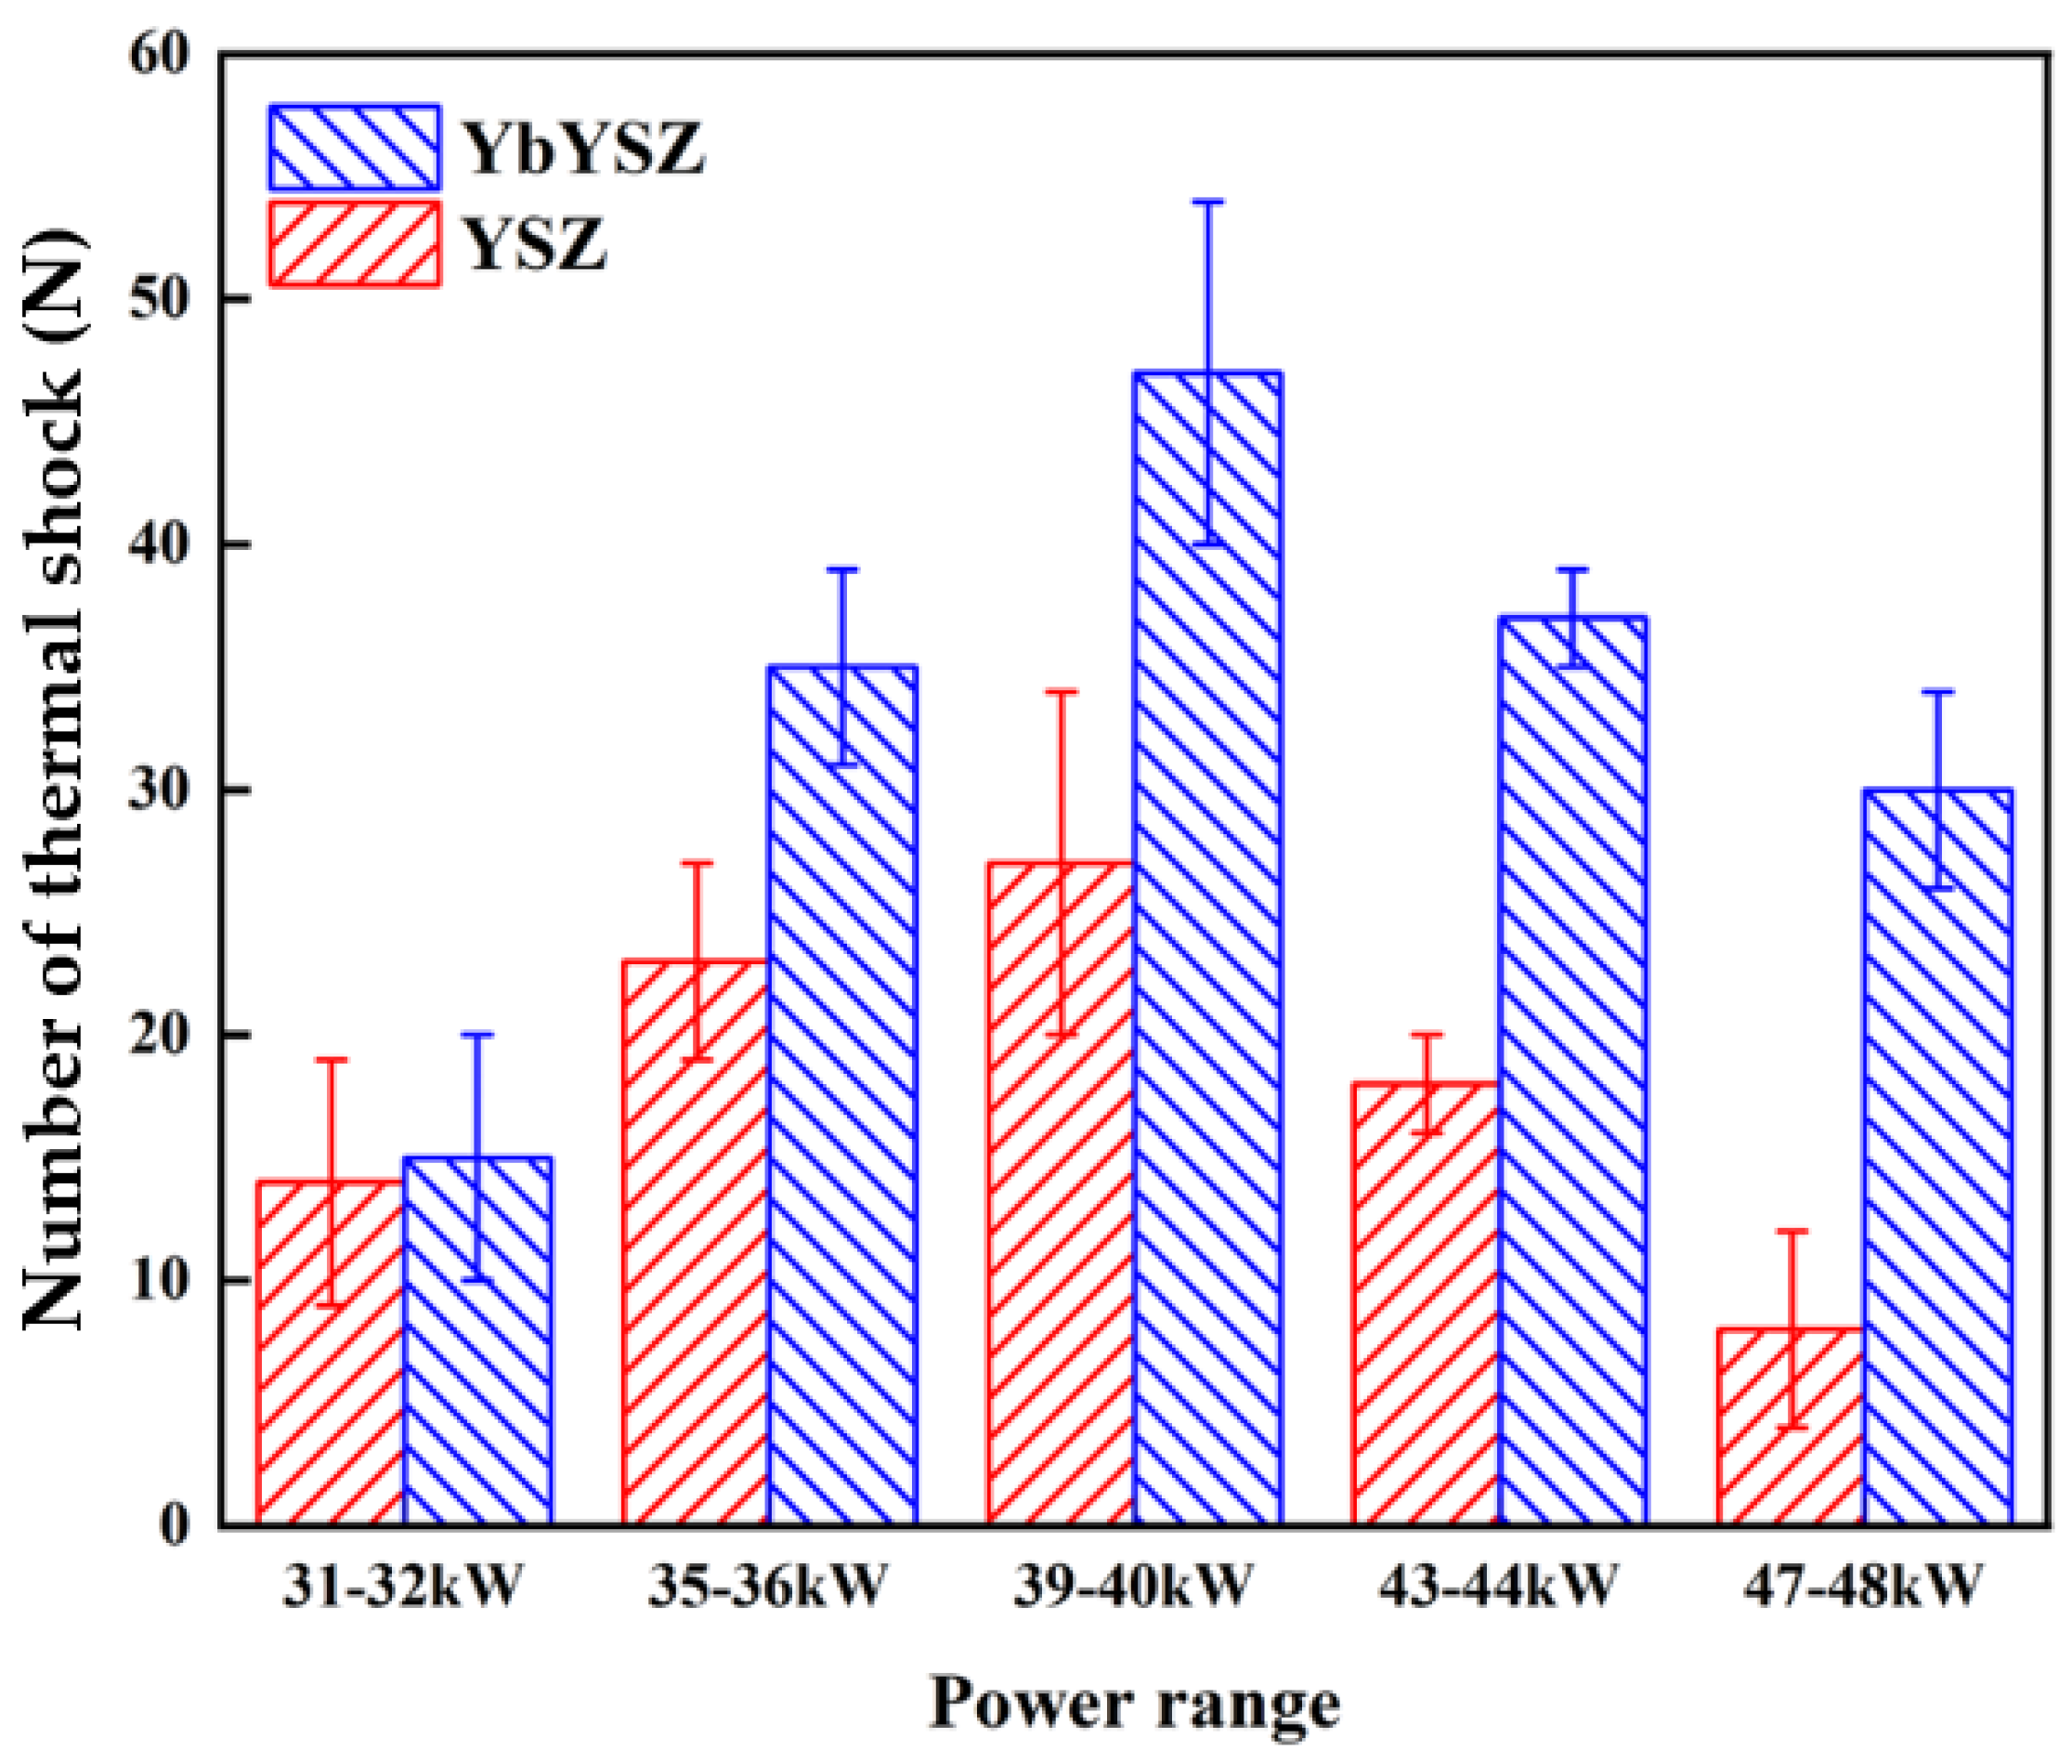
3.3.1. Coating Lifetime under Thermal Cycling-CMAS Coupling Conditions

Compared to other evaluation methods, simulating the thermal cycling-CMAS coupling conditions experienced in actual service using a gas flame shock rig is clearly more realistic, and the results obtained are more consistent with actual conditions. Figure 7 shows the lifespan comparison of the two coatings at different power ranges in this experiment. Both coatings exhibit a trend of a first increasing and then decreasing lifespan, with the maximum thermal cycling lifespan occurring at a spraying power of 39–40 kW. The maximum thermal cycling numbers for the YbYSZ and YSZ coatings are 47 and 27 cycles, respectively. At a lower spraying power, the coating has a higher porosity and more inherent defects, providing more pathways for CMAS to penetrate into the coating. Additionally, more pores can store CMAS, accelerating the sintering failure of the coating. However, the high porosity also gives the coating a higher strain tolerance, reducing the thermal stress levels generated during thermal cycling and allowing the coating to better withstand strain variations. At a higher spraying power, the coating is denser with fewer inherent defects, effectively blocking CMAS penetration. However, the lower strain tolerance leads to excessive stress during the thermal cycling-CMAS test, causing microcracks within the coating to gradually expand and eventually result in coating failure. Therefore, although this section discusses the impact of power on the lifespan of the two coatings under thermal cycling-CMAS coupling conditions, the essence is to study the balance point of the effects of CMAS corrosion and thermal cycling on the evolution of the coating’s microstructure. The goal is to achieve a longer service life and determine more suitable spraying parameters.
The experimental results show that the use of YbYSZ coatings can significantly improve the service performance of the coating system and greatly extend the long-term service life of the coating. Compared to conventional YSZ coatings, the thermal cycling lifespan of YbYSZ coatings increased by 7%, 52%, 74%, 105%, and 275% at different power ranges. Fang et al. [61] compared the lifespan of the two coatings under thermal cycling conditions and thermal cycling-CMAS coupling conditions. They found that the thermal cycling-CMAS coupling test significantly reduced the service life of the coatings compared to the thermal cycling test alone. However, while the lifespan of conventional YSZ coatings decreased by 76%, the lifespan of YbYSZ coatings only decreased by 30%. The research results confirm that YbYSZ coatings not only have a longer long-term service life but also maintain good reliability and stability in harsh environments.

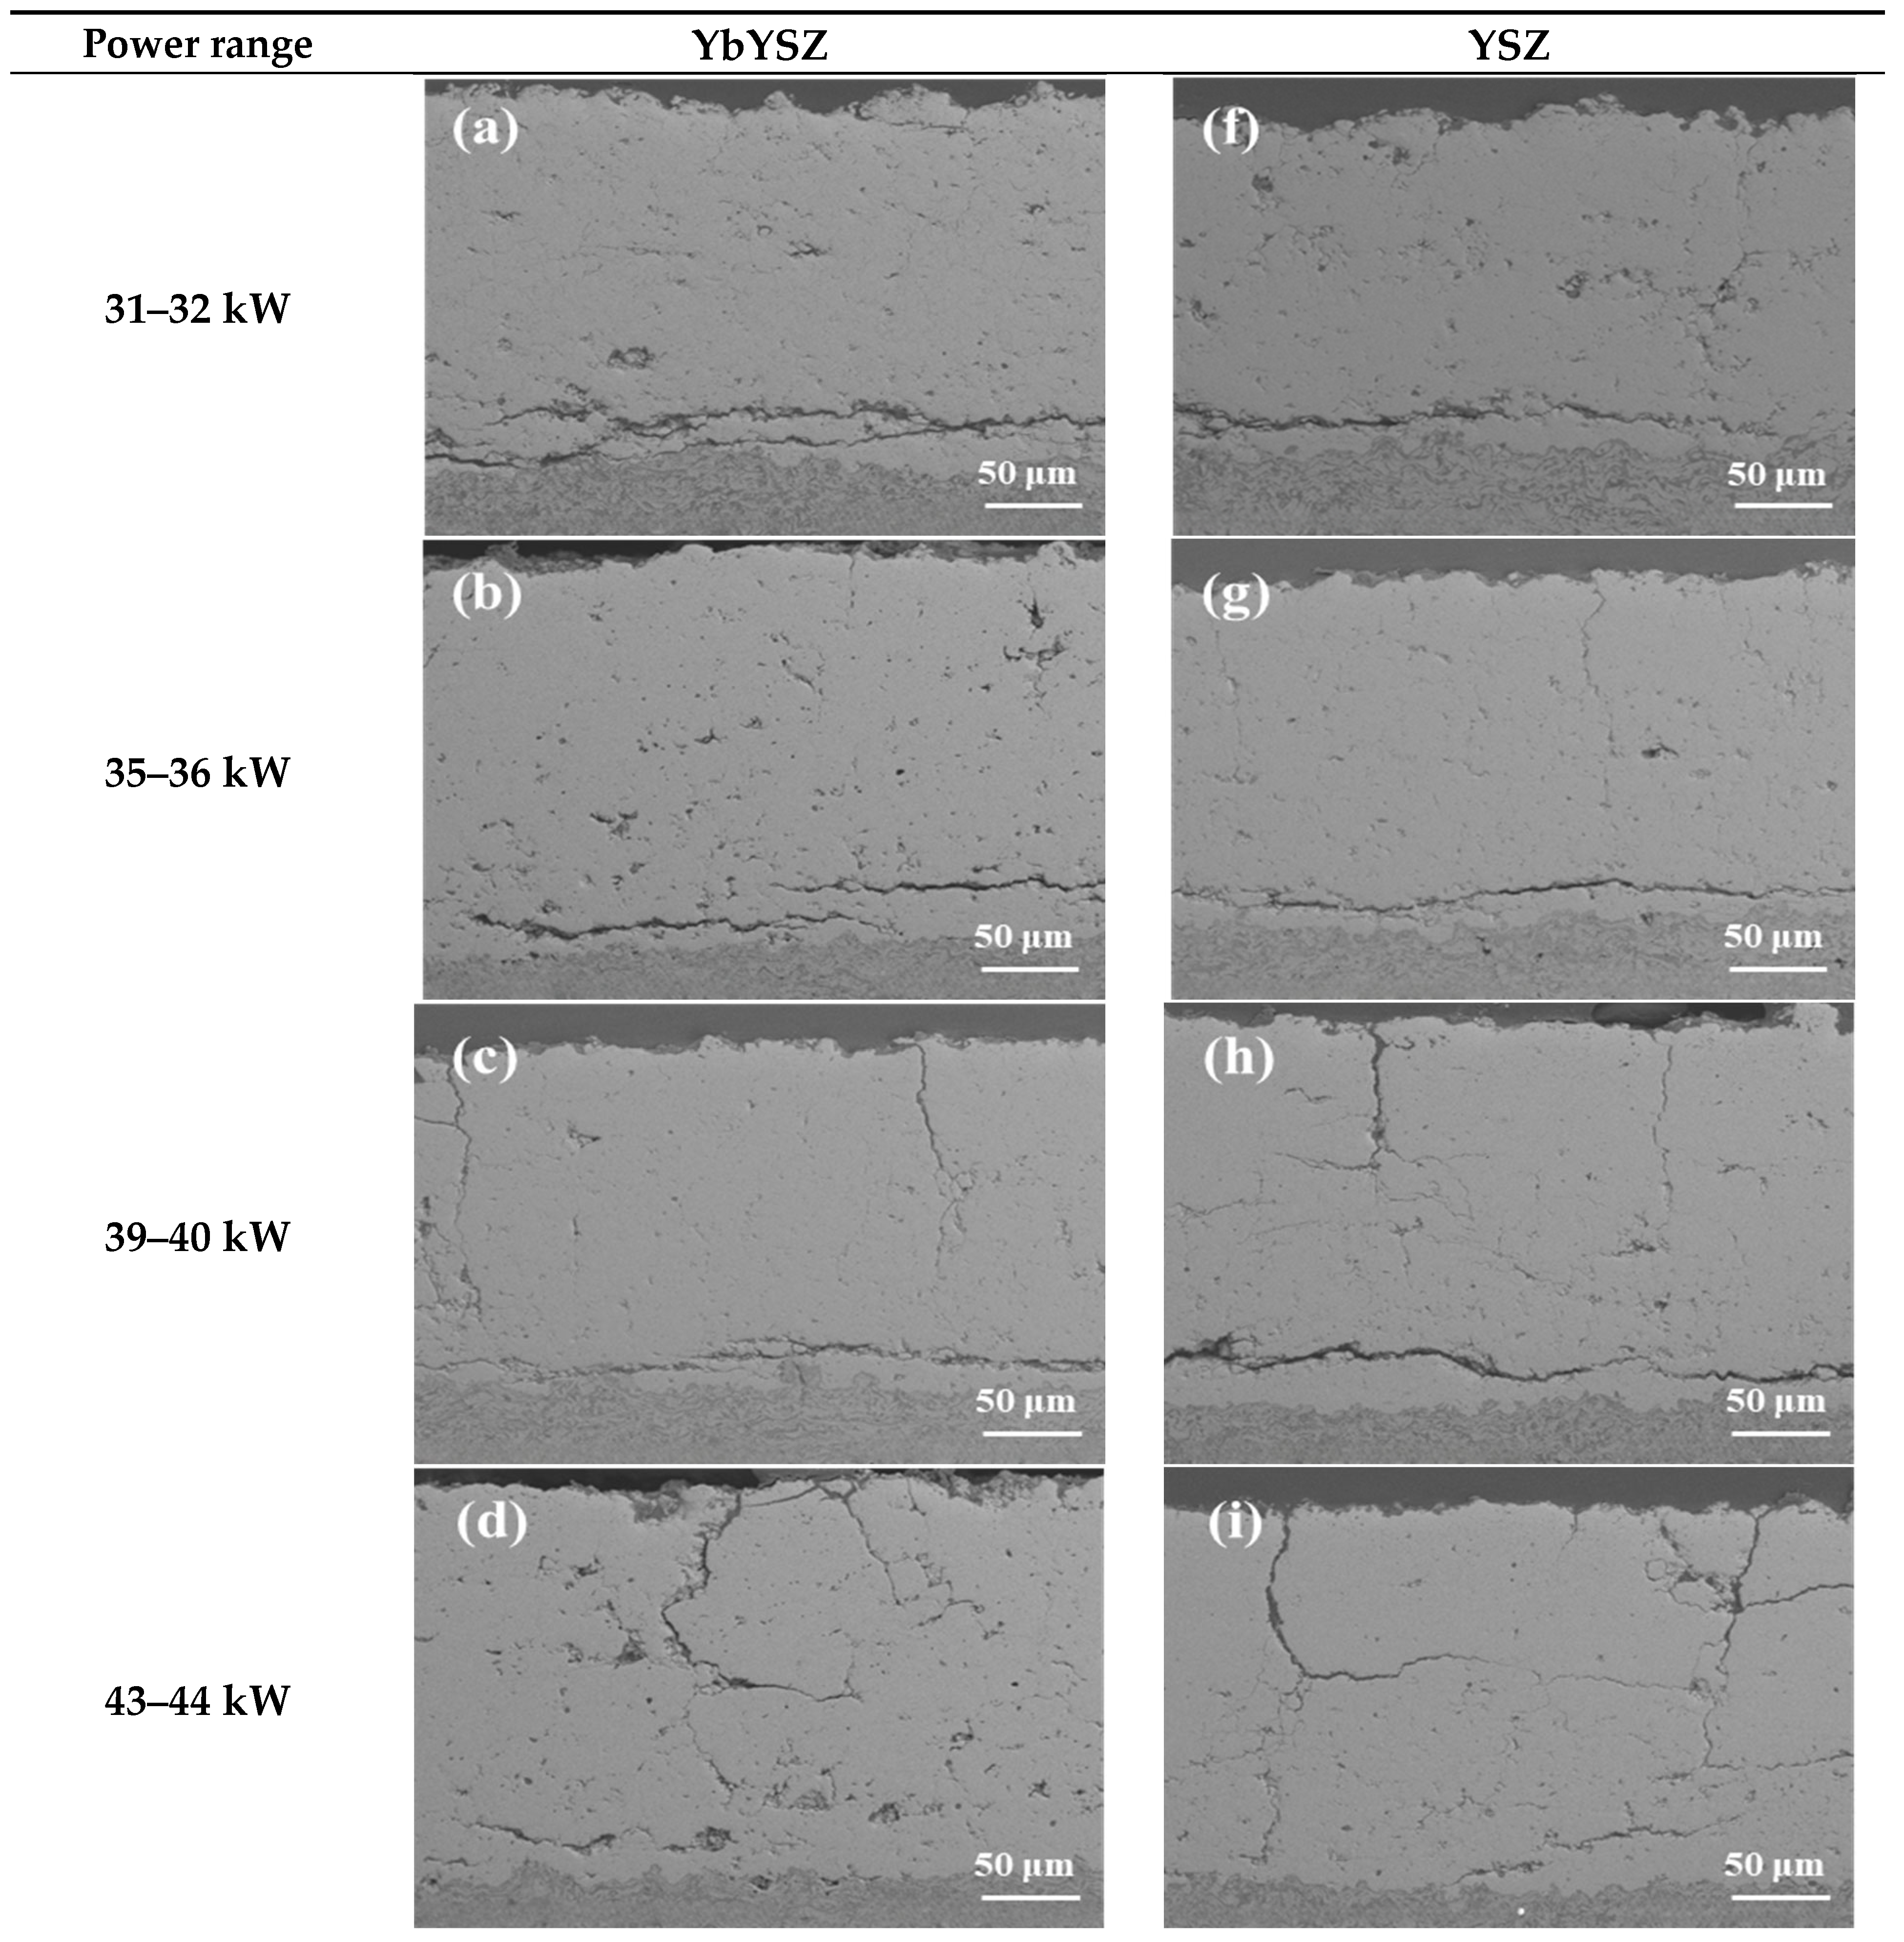
3.3.2. Cross-Sectional Morphology of Coatings under Thermal Cycling-CMAS Coupling Conditions

Figure 8 shows the cross-sectional microstructure of the two coatings at different power levels after failure under thermal cycling-CMAS coupling conditions. Both coatings exhibit similar failure modes after experiencing thermal cycling-CMAS coupling conditions. Sintering occurs within the coatings, making them denser. The porosity of the failed coatings varies with the power, as shown in Figure 8k. Although the YbYSZ coating endured the test for a longer time across all power ranges, its porosity remains larger than that of the YSZ coating, indicating superior service performance. Additionally, as the spraying power increases, the number of vertical cracks in both coatings increases. When the power range is 31–32 kW, 35–36 kW, or 39–40 kW, the cracking position after coating failure is located within the TC, 10–30 μm above the interface between the BC and the TC layer, resulting in through-type horizontal cracks at this location. Due to the significant difference in thermal expansion coefficients between the ceramic layer and the metal substrate, considerable thermal mismatch stress is generated during service, leading to through-cracks at the interface between the two layers and causing large-scale spalling of the coating.
When the spraying power is 44–44 kW and 47–48 kW, the failure mode of the coating is different from the other three power ranges, with more vertical cracks appearing. Mercer et al. [62] found that under capillary action, CMAS infiltrates and fills the gaps between the columnar grains of the ceramic layer. Due to the rapid cooling rate, a significant temperature gradient perpendicular to the coating surface forms within the alloy substrate and ceramic layer, resulting in uneven thermal stress distribution within the coating [63,64]. This phenomenon is particularly severe in denser coatings, where the low porosity cannot effectively relieve and release the thermal stress, exacerbating the stress unevenness. The thermal stress caused by the temperature gradient induces type I cracks within the coating, which continuously expand and connect with the defects in the coating, ultimately leading to the spalling failure of the coating.

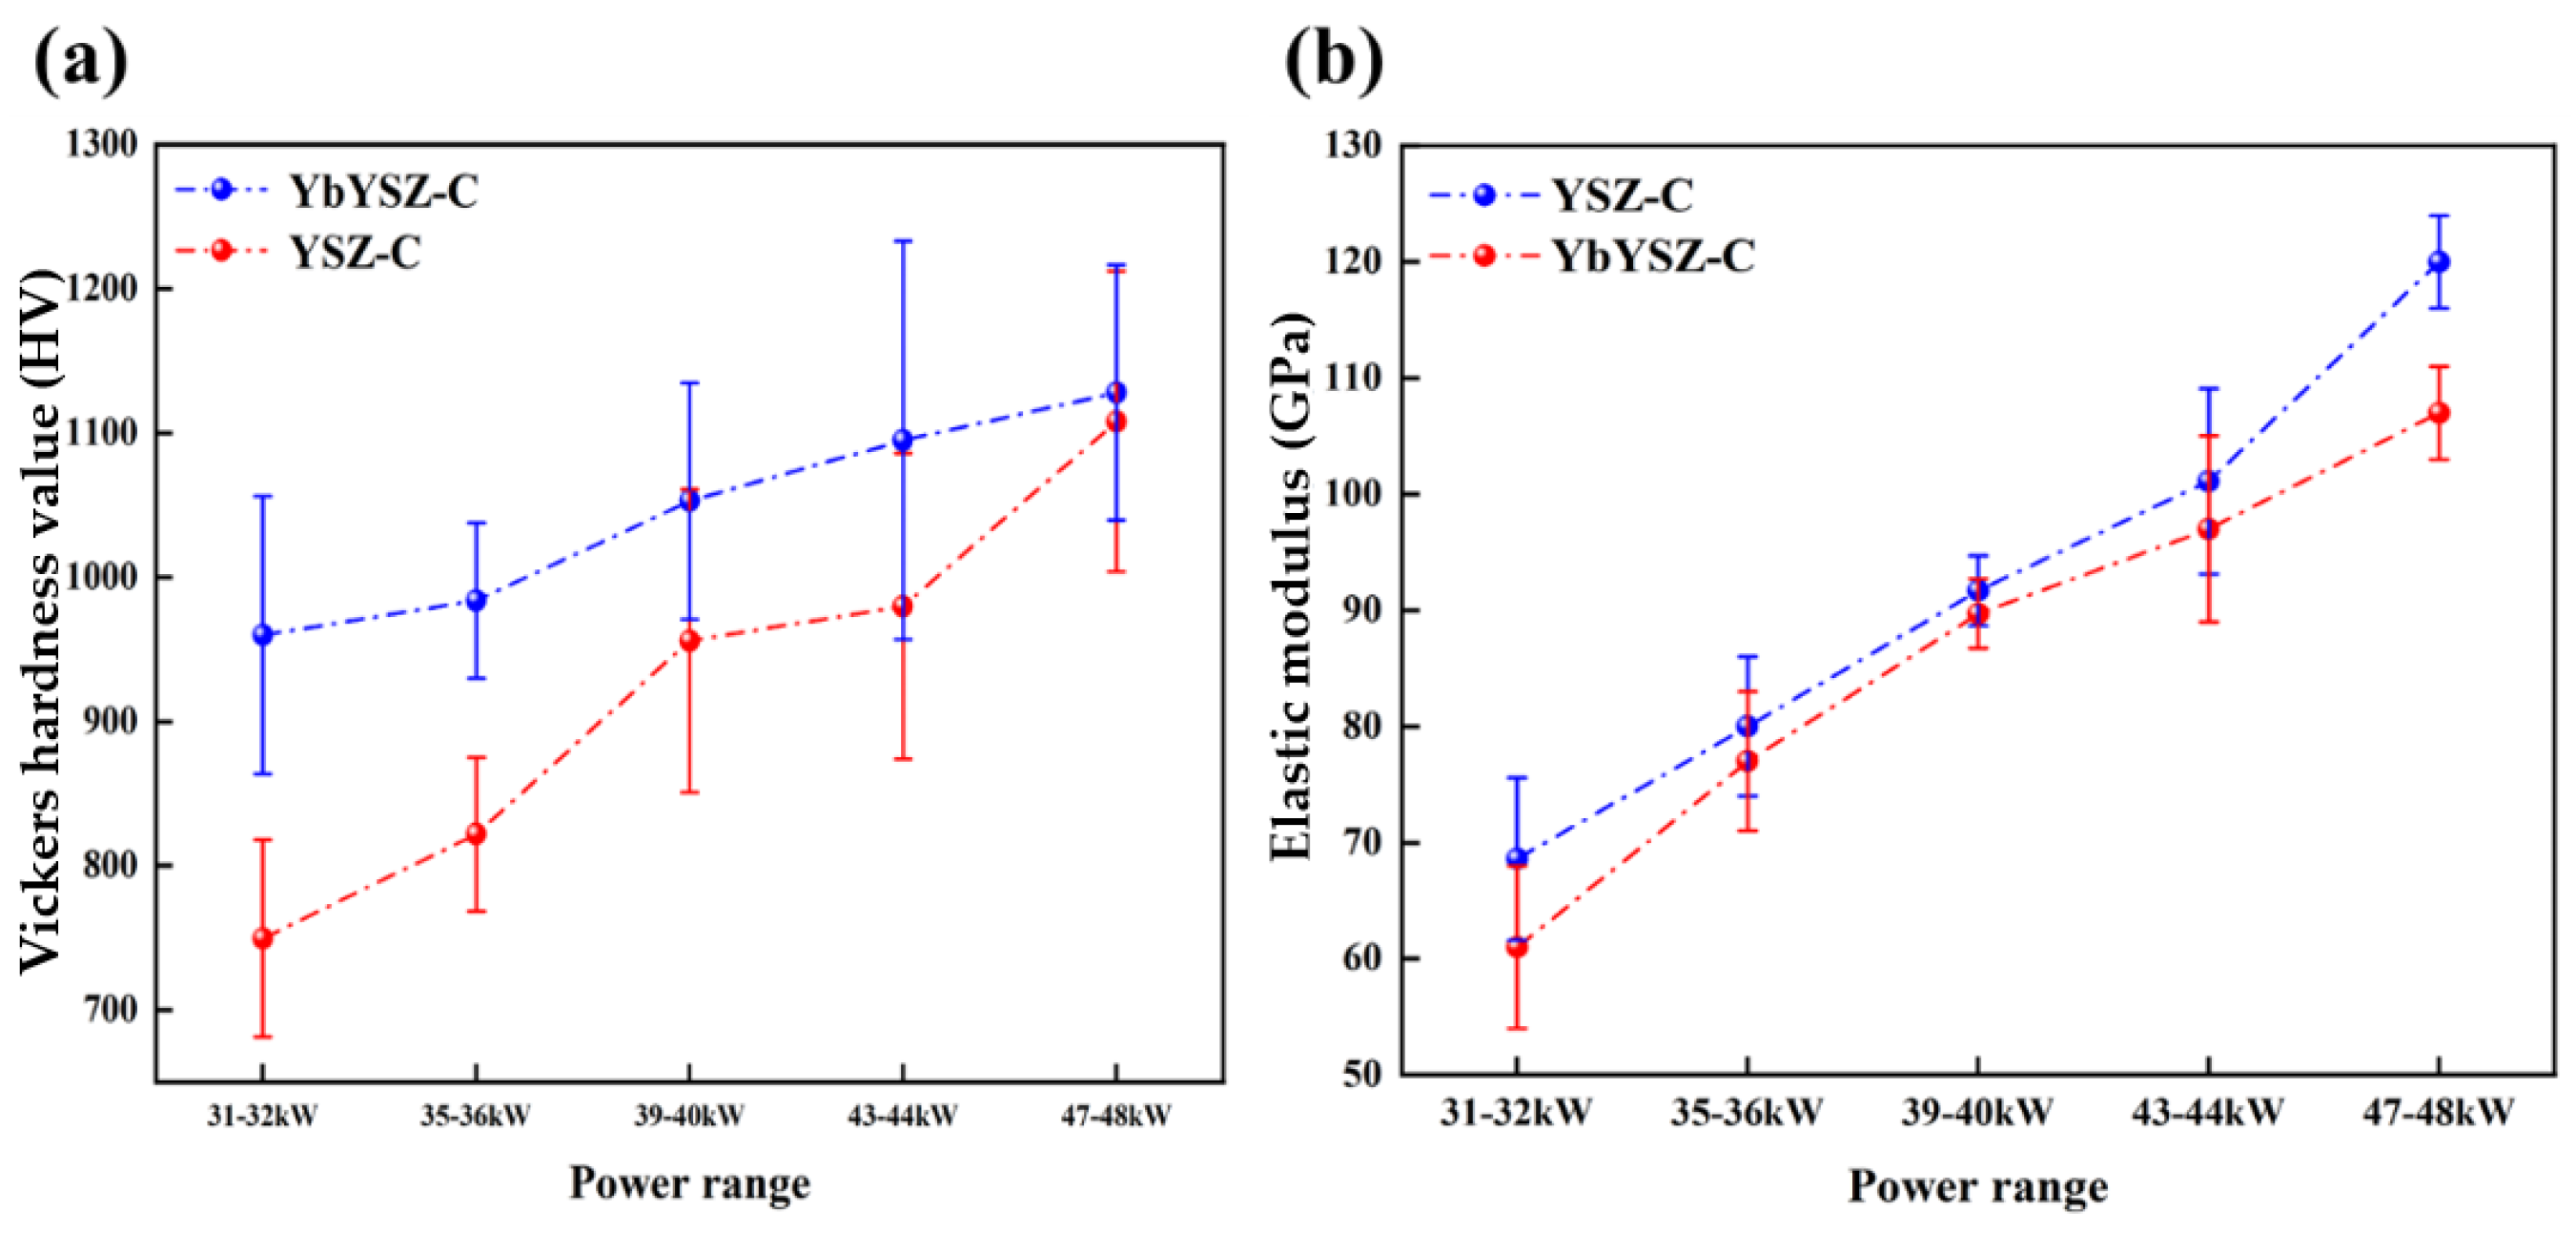
3.3.3. Mechanical Properties of Coatings under Thermal Cycling-CMAS Coupling Conditions

Figure 9 shows the mechanical properties of the coatings at failure across different power ranges. YbYSZ-C and YSZ-C, respectively, represent the samples of YbYSZ and YSZ after the thermal cycling-CMAS tests. Compared to Figure 6, it can be seen that the hardness and elastic modulus of the coatings have increased. This is due to the reduction in porosity caused by high-temperature sintering. Although the coatings under the 39–40 kW power range endured more thermal cycles and higher degrees of sintering, coatings sprayed at a higher power have fewer inherent defects and are denser. Because the number of thermal cycles is comparable, the hardness and elastic modulus of the coatings still show an upward trend with increasing power after undergoing thermal cycling-CMAS coupling conditions. Thanks to the incorporation of Yb3+, the coatings can maintain superior mechanical properties while retaining relatively high porosity, both before and after the cycles, thus providing a longer service life.

3.3.4. Phase Structure of Coatings under Thermal Cycling-CMAS Coupling Conditions

During the service of TBCs, their cracking and failure are mainly caused by several factors: the phase transformation of ZrO2 [65], thermal stress caused by temperature gradients [66], growth of thermally grown oxides (TGOs) [45], and high-temperature sintering. Figure 10 shows the XRD patterns of the coatings after thermal cycling failure. The phase structure of both coatings remained unchanged, consisting of the t-phase and c-phase. Roncallo et al. [67] investigated the effect of the cooling rate on the phase transformation of ZrO2 and found that a faster cooling rate is not conducive to phase transformation. In this study, compressed air was used to rapidly cool the front and back surfaces of the samples. Additionally, the thermal exposure time at high temperatures was relatively short. For the YbYSZ coating with the longest thermal cycling lifespan in the 39–40 kW power range, the total thermal exposure time was only 3.9 h. These two reasons combined are insufficient to induce phase transformation in ZrO2. Therefore, in this study, the failure of the coatings is not significantly associated with phase transformation.

3.4. CMAS Isothermal Corrosion Behavior

3.4.1. CMAS Infiltration Behavior

Figure 11 shows the cross-sectional morphology of the YbYSZ and YSZ coatings after 1 h of CMAS isothermal corrosion. There are many CMAS residues on the upper surface of the samples that have not infiltrated into the coatings. As CMAS continuously infiltrates and fills the coating pores, the coating is divided into a dense region with fewer pores and a loose region with more pores. The boundary between these two regions characterizes the penetration depth of the CMAS in the coating. From the analysis results, after 1 h of thermal exposure at 1300 °C, with an increasing power range, the penetration depth of the CMAS decreases as the spraying power increases. The penetration depths of the CMAS in the YbYSZ coatings are 429.46 μm, 389.22 μm, 361.12 μm, 337.09 μm, and 272.89 μm, respectively, which are 16.9%, 17.9%, 14.81%, 6.3%, and 14.4% lower than those in the YSZ coatings at the same power, demonstrating better inhibition of CMAS infiltration. The results of this study indicate that even though the YbYSZ coatings at the same power have a higher porosity, their ability to hinder molten CMAS infiltration is far superior to that of conventional YSZ coatings. YbYSZ coatings can better block CMAS infiltration.

3.4.2. CMAS Degradation Behavior

Molten CMAS undergoes liquid-phase infiltration and degrades the coating, severely threatening the structural integrity of the TBC system at high temperatures, making it a significant cause of coating failure [68,69]. Figure 12 shows the evolution of the average depth of the two coatings under isothermal corrosion conditions with varying spraying power. Careful observation of the CMAS and coating interface reveals that the integrity of the coating interface has been compromised. The region near the CMAS shows more degraded equiaxed particles with significantly widened grain spacing, forming a relatively loose degradation layer. Exposed particles can be seen in the pores on the CMAS-corroded surface. The destruction of the coating structure mainly stems from two aspects [10]: the transformation from t-ZrO2 to m-ZrO2 causes a 3%–5% volume expansion, leading to the structural damage of the coating, and CMAS penetrates along the grain boundaries, causing Yb3+ and Y3+ in the grains to diffuse from the zirconia crystal cells into the melt, leading to grain boundary degradation of the coating. As the spraying power gradually increases, the degradation depth of both coatings decreases. Fewer inherent defects reduce the pathways for CMAS infiltration into the coating, effectively mitigating the degradation behavior of CMAS on the coating.
From the analysis results, under isothermal corrosion test conditions, the degradation depths of the YbYSZ coatings are 12.11 μm, 10.64 μm, 9.89 μm, 8.16 μm, and 5.91 μm, respectively, which are 3.2%, 4.1%, 7.1%, 5.0%, and 11.6% lower than those of the YSZ coatings at the same power, demonstrating better inhibition of CMAS penetration. Studying the diffusion behavior of atoms in the CMAS melt helps to better control ZrO2 phase transformation and reduce the rate of grain degradation. Fang et al. [45] defined the parameter Re/Zr to compare the diffusion behavior of Yb3+ and Y3+ in CMAS and combined the first-principles calculations to demonstrate that Yb3+ has a lower diffusion rate under CMAS corrosion conditions than Y3+, maintaining a relatively low level. The lower diffusion rate gives the coating better chemical and structural stability. The slow increase in defects within the coating means that the melt cannot quickly degrade and penetrate the coating, thus exhibiting strong CMAS corrosion resistance. This means that YbYSZ coatings can better resist CMAS erosion, maintain good thermal insulation performance for a long time, and reduce equipment maintenance costs.
This investigation studied the effect of the spraying power on the CMAS corrosion resistance of YbYSZ and YSZ coatings. The failure behavior and the evolution of the mechanical properties were investigated under a thermal cycling-CMAS corrosion test. In addition, the infiltration and degradation behavior of CMAS corrosion in coatings were explored in a CMAS isothermal corrosion test. The main conclusions are as follows:
(1)
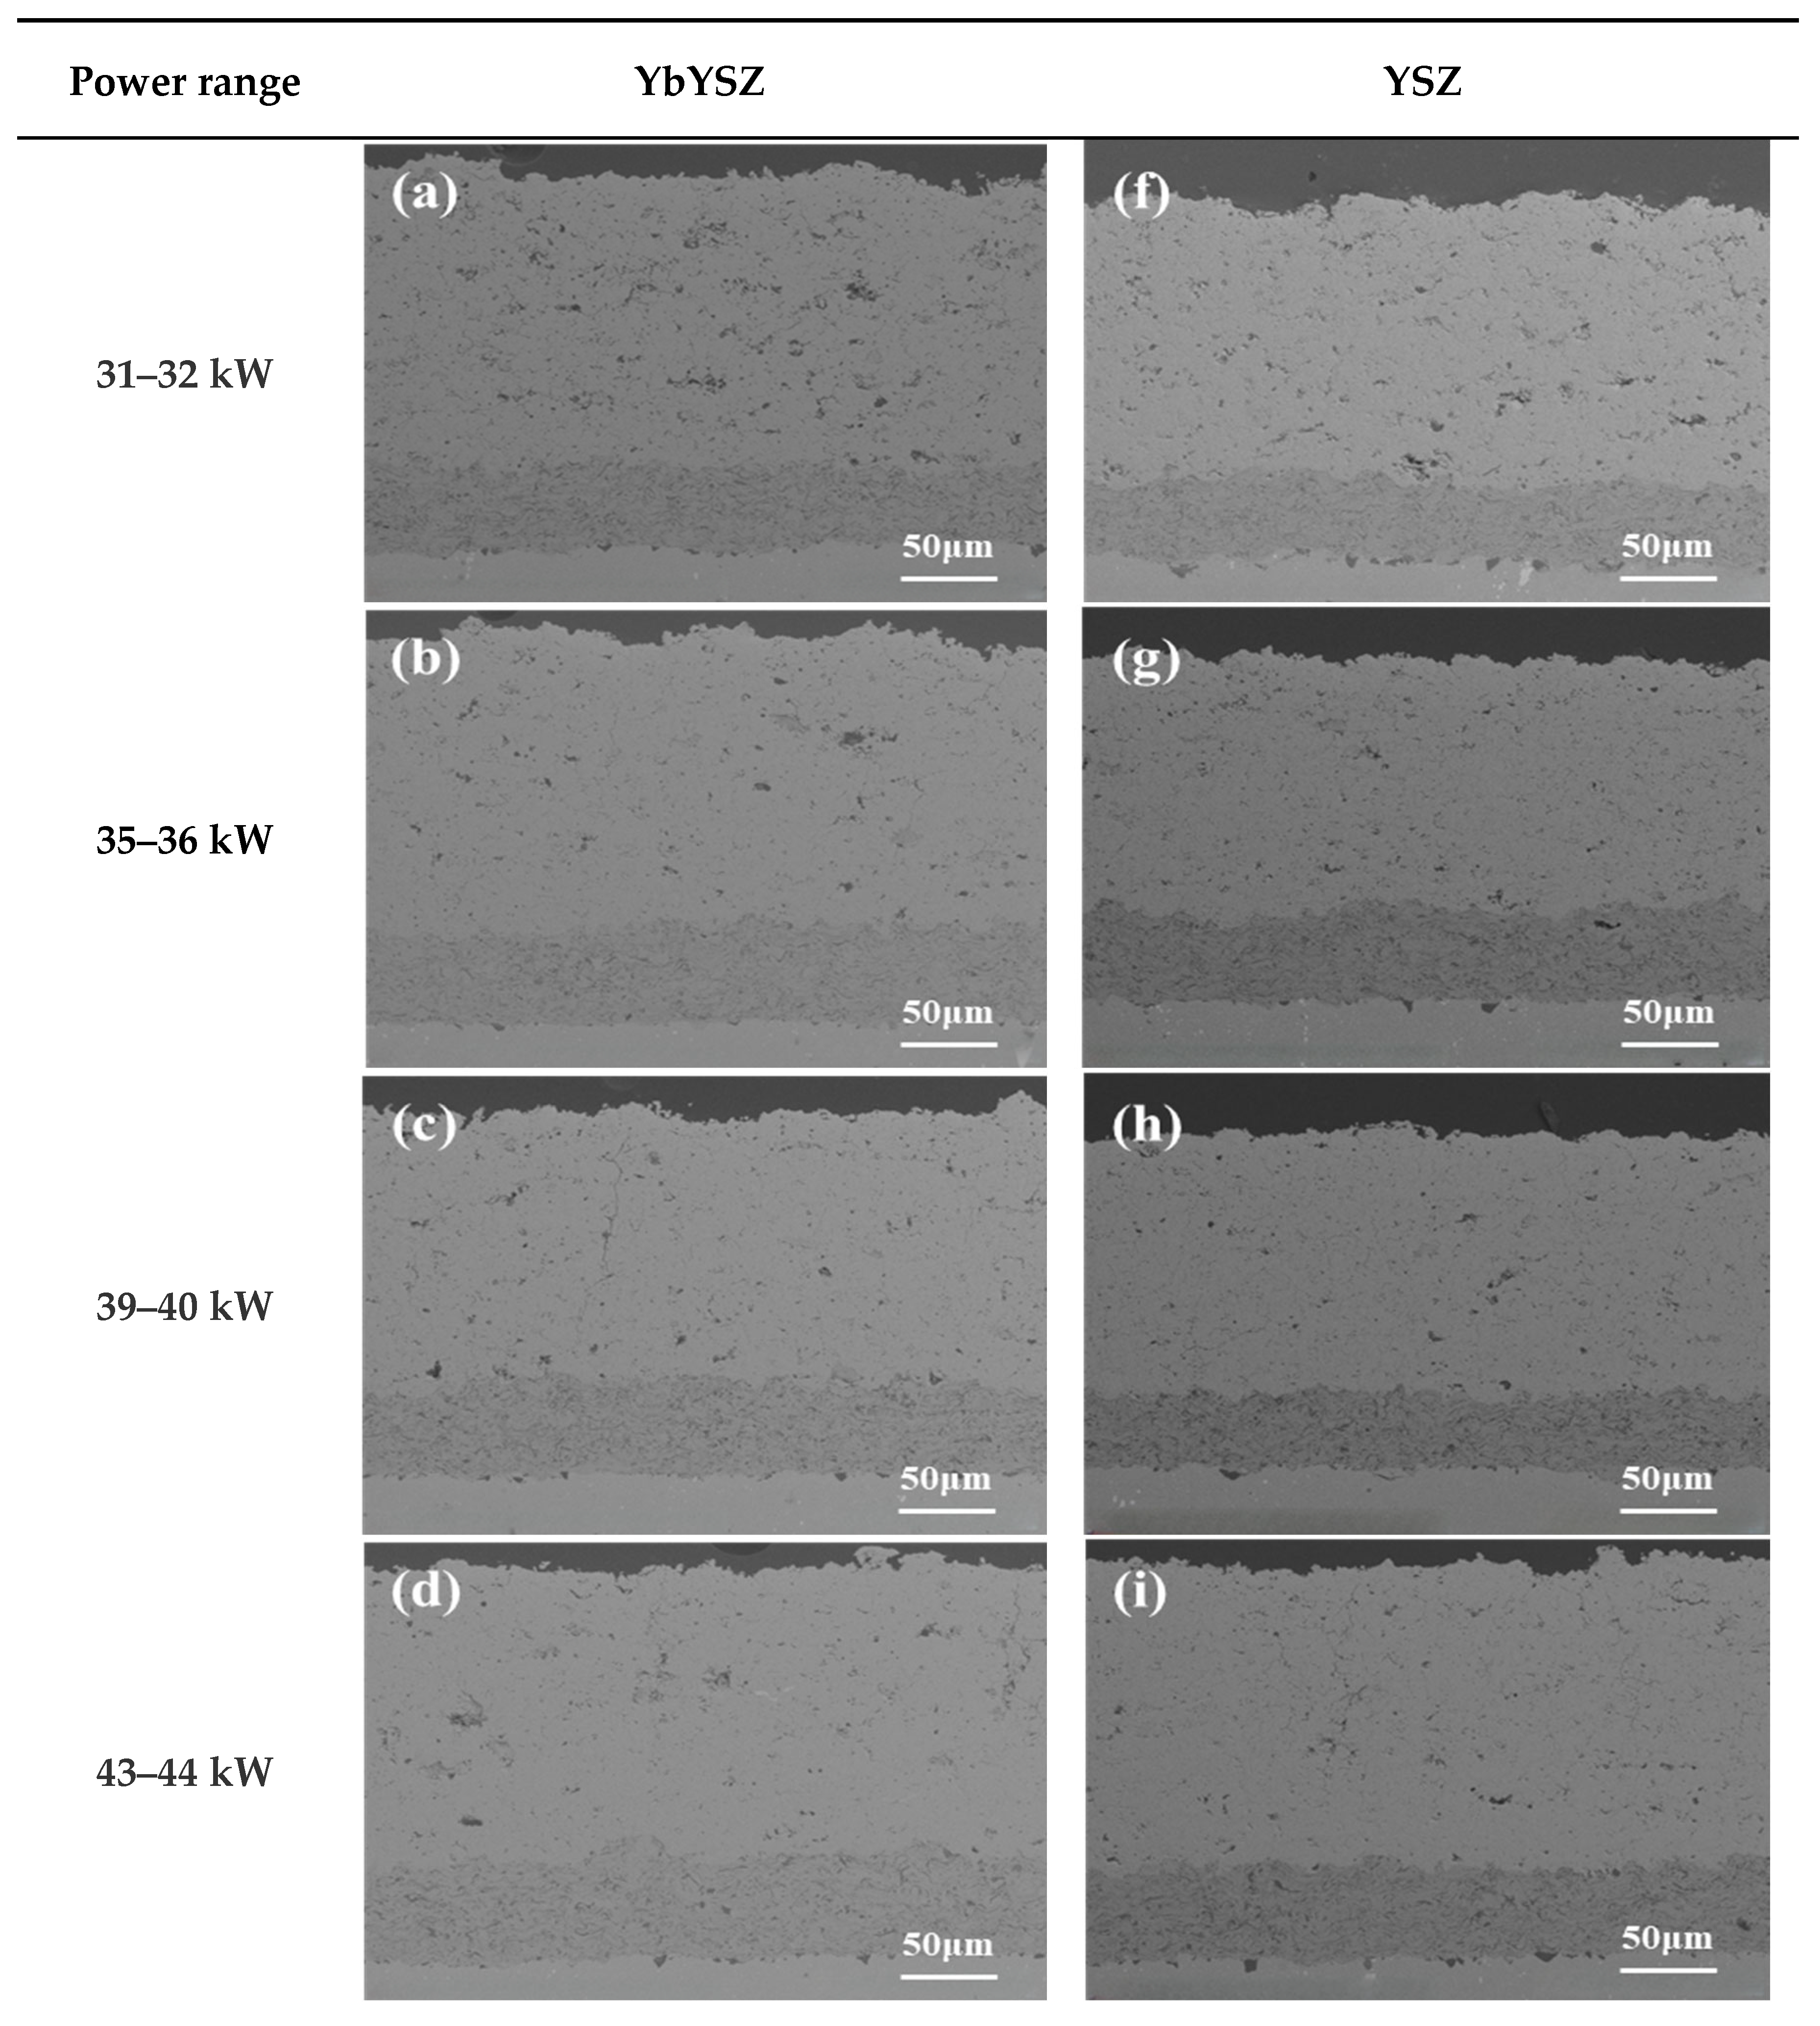
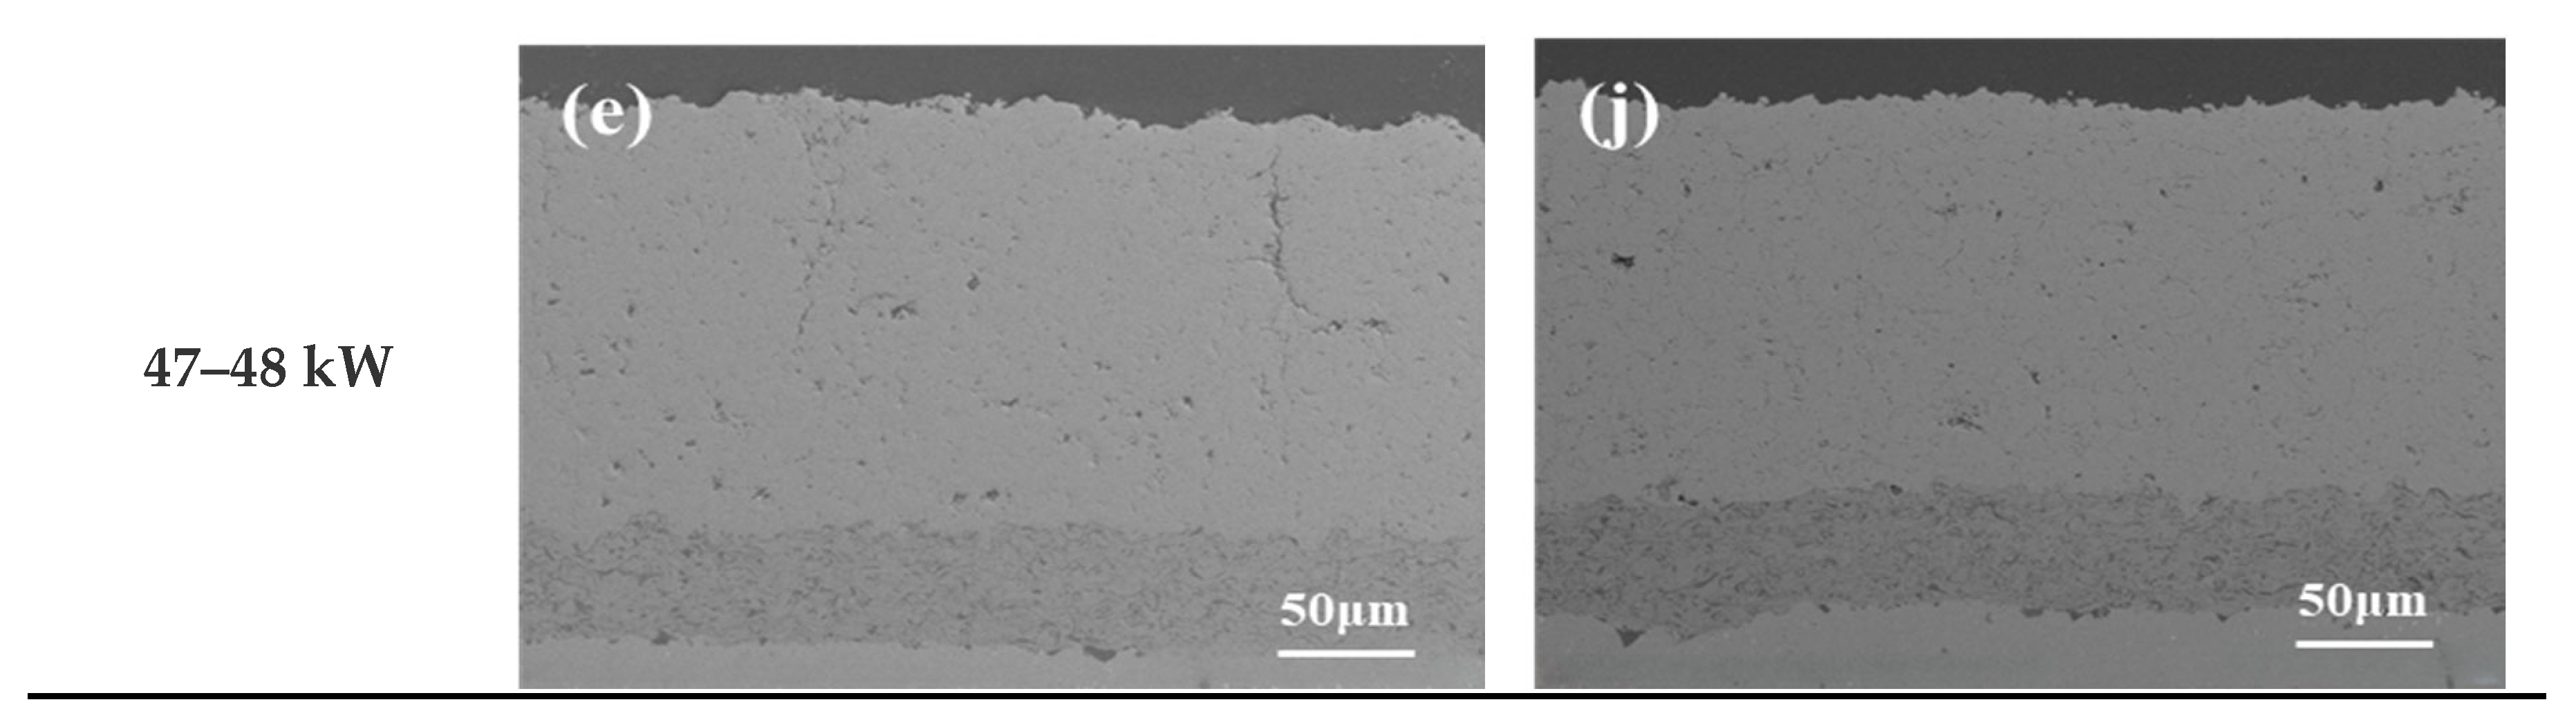
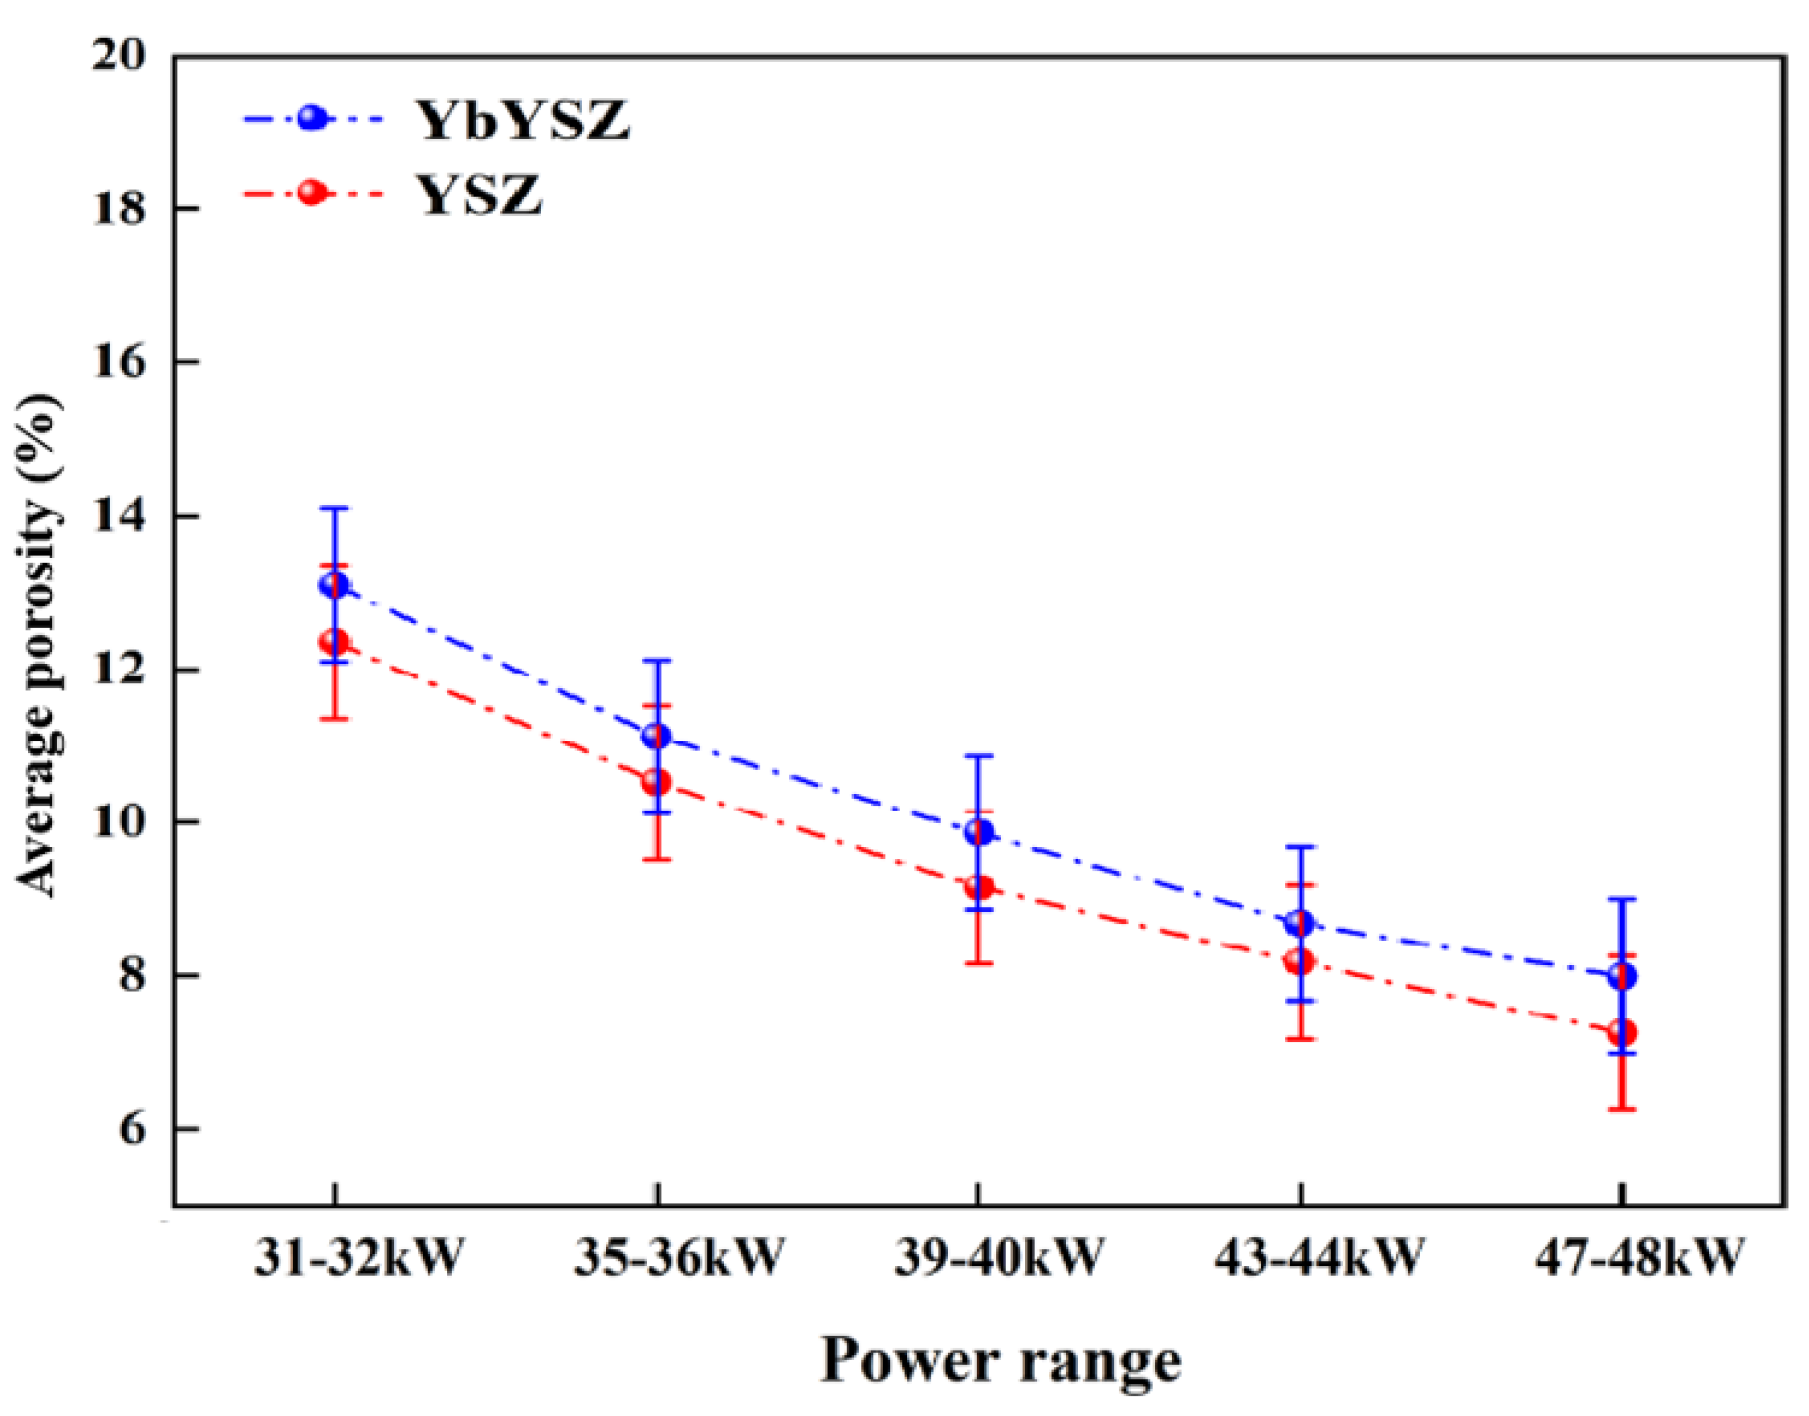
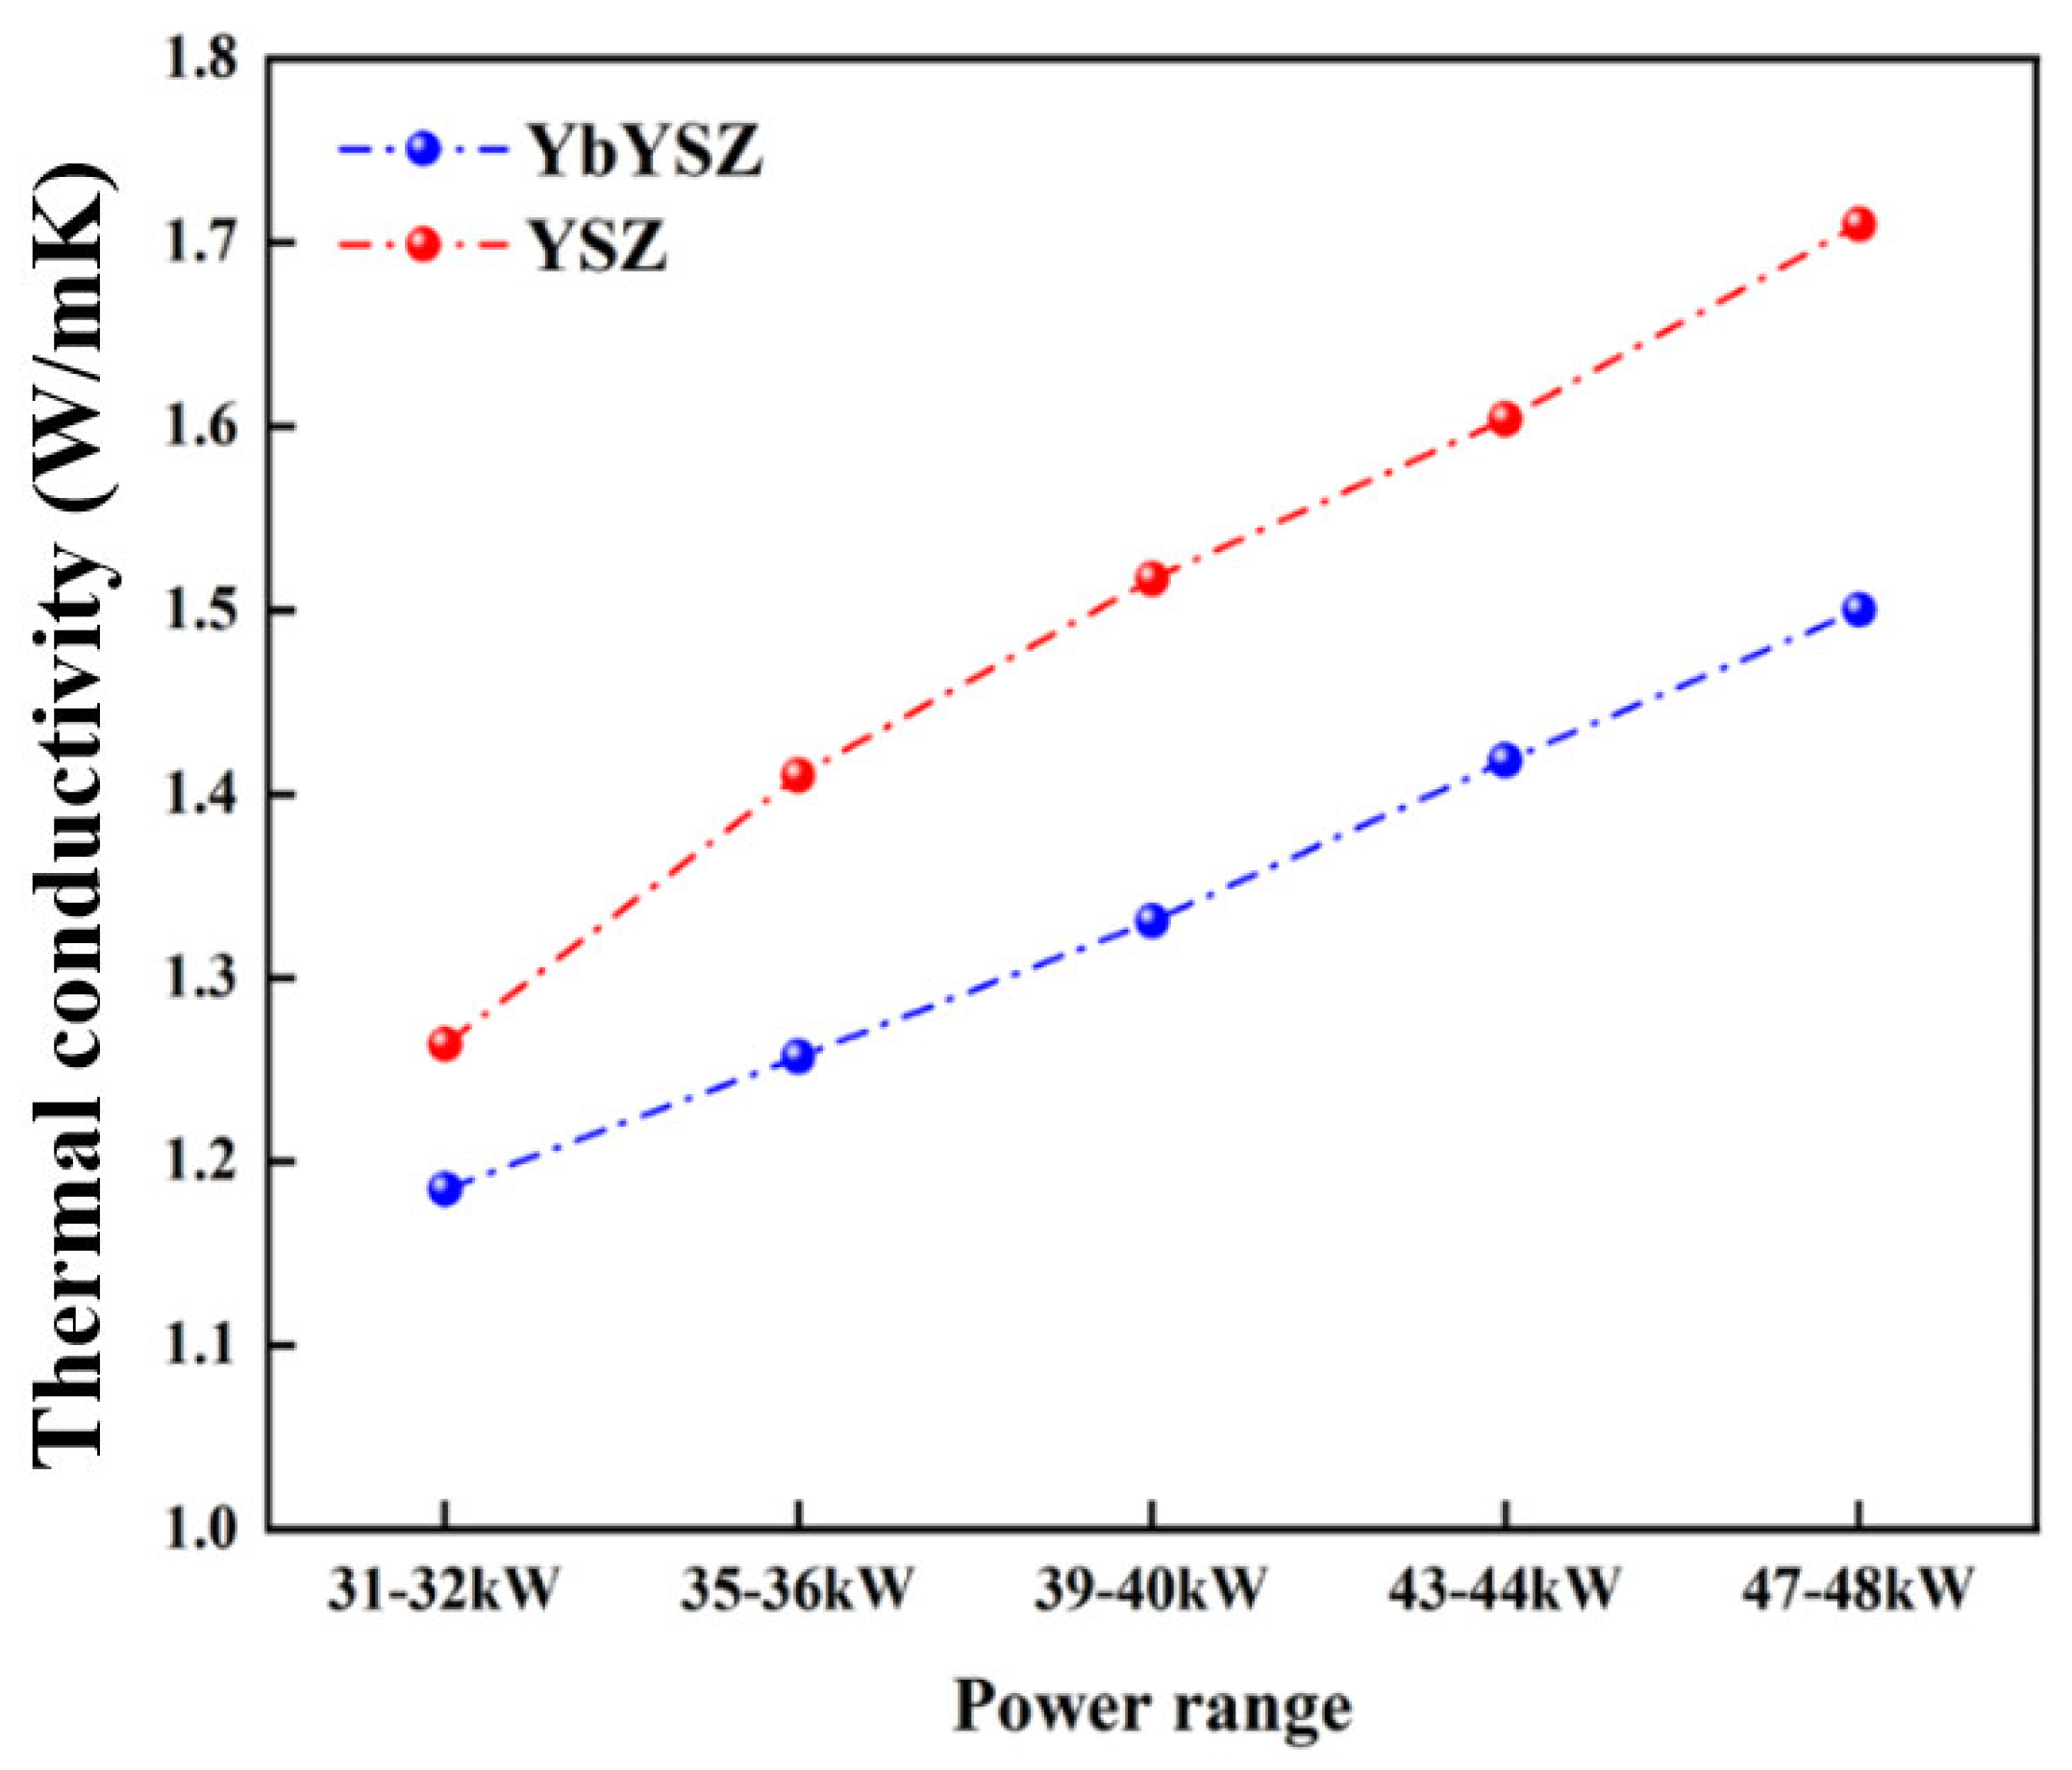
Within the scope of this study, the YbYSZ coating shows a higher porosity than the YSZ coating. As the spraying power increased from 31~32 kW to 47~48 kW, the porosity of the YbYSZ coating decreased from 13% to 8% but the more prone the coating is to larger vertical cracks. Meanwhile, increased spraying power helps reduce the surface roughness of the coatings. As the spray power increased, the thermal conductivity of both coatings increased. At the same spraying power, the thermal conductivity of the YbYSZ coating was lower than that of the YSZ coating. In addition, the thermal conductivity of the YbYSZ coating was 0.1~0.25 W/mK lower than that of the YSZ coating.
(2)
In thermal cycling-CMAS coupling conditions, the YbYSZ and YSZ coatings exhibited the longest life span within the power range of 39–40 kW. At lower power levels, the predominant failure mode was the formation of through-type horizontal cracks at the BC/TC layer interface. When the spray power exceeded 40–41 KW, the incidence of vertical cracks increased concomitantly, and these cracks connected and expanded with interlayer cracks, ultimately resulting in coating failure. The hardness and elastic modulus of both coatings demonstrated an upward trend following the coupling conditions.
(3)
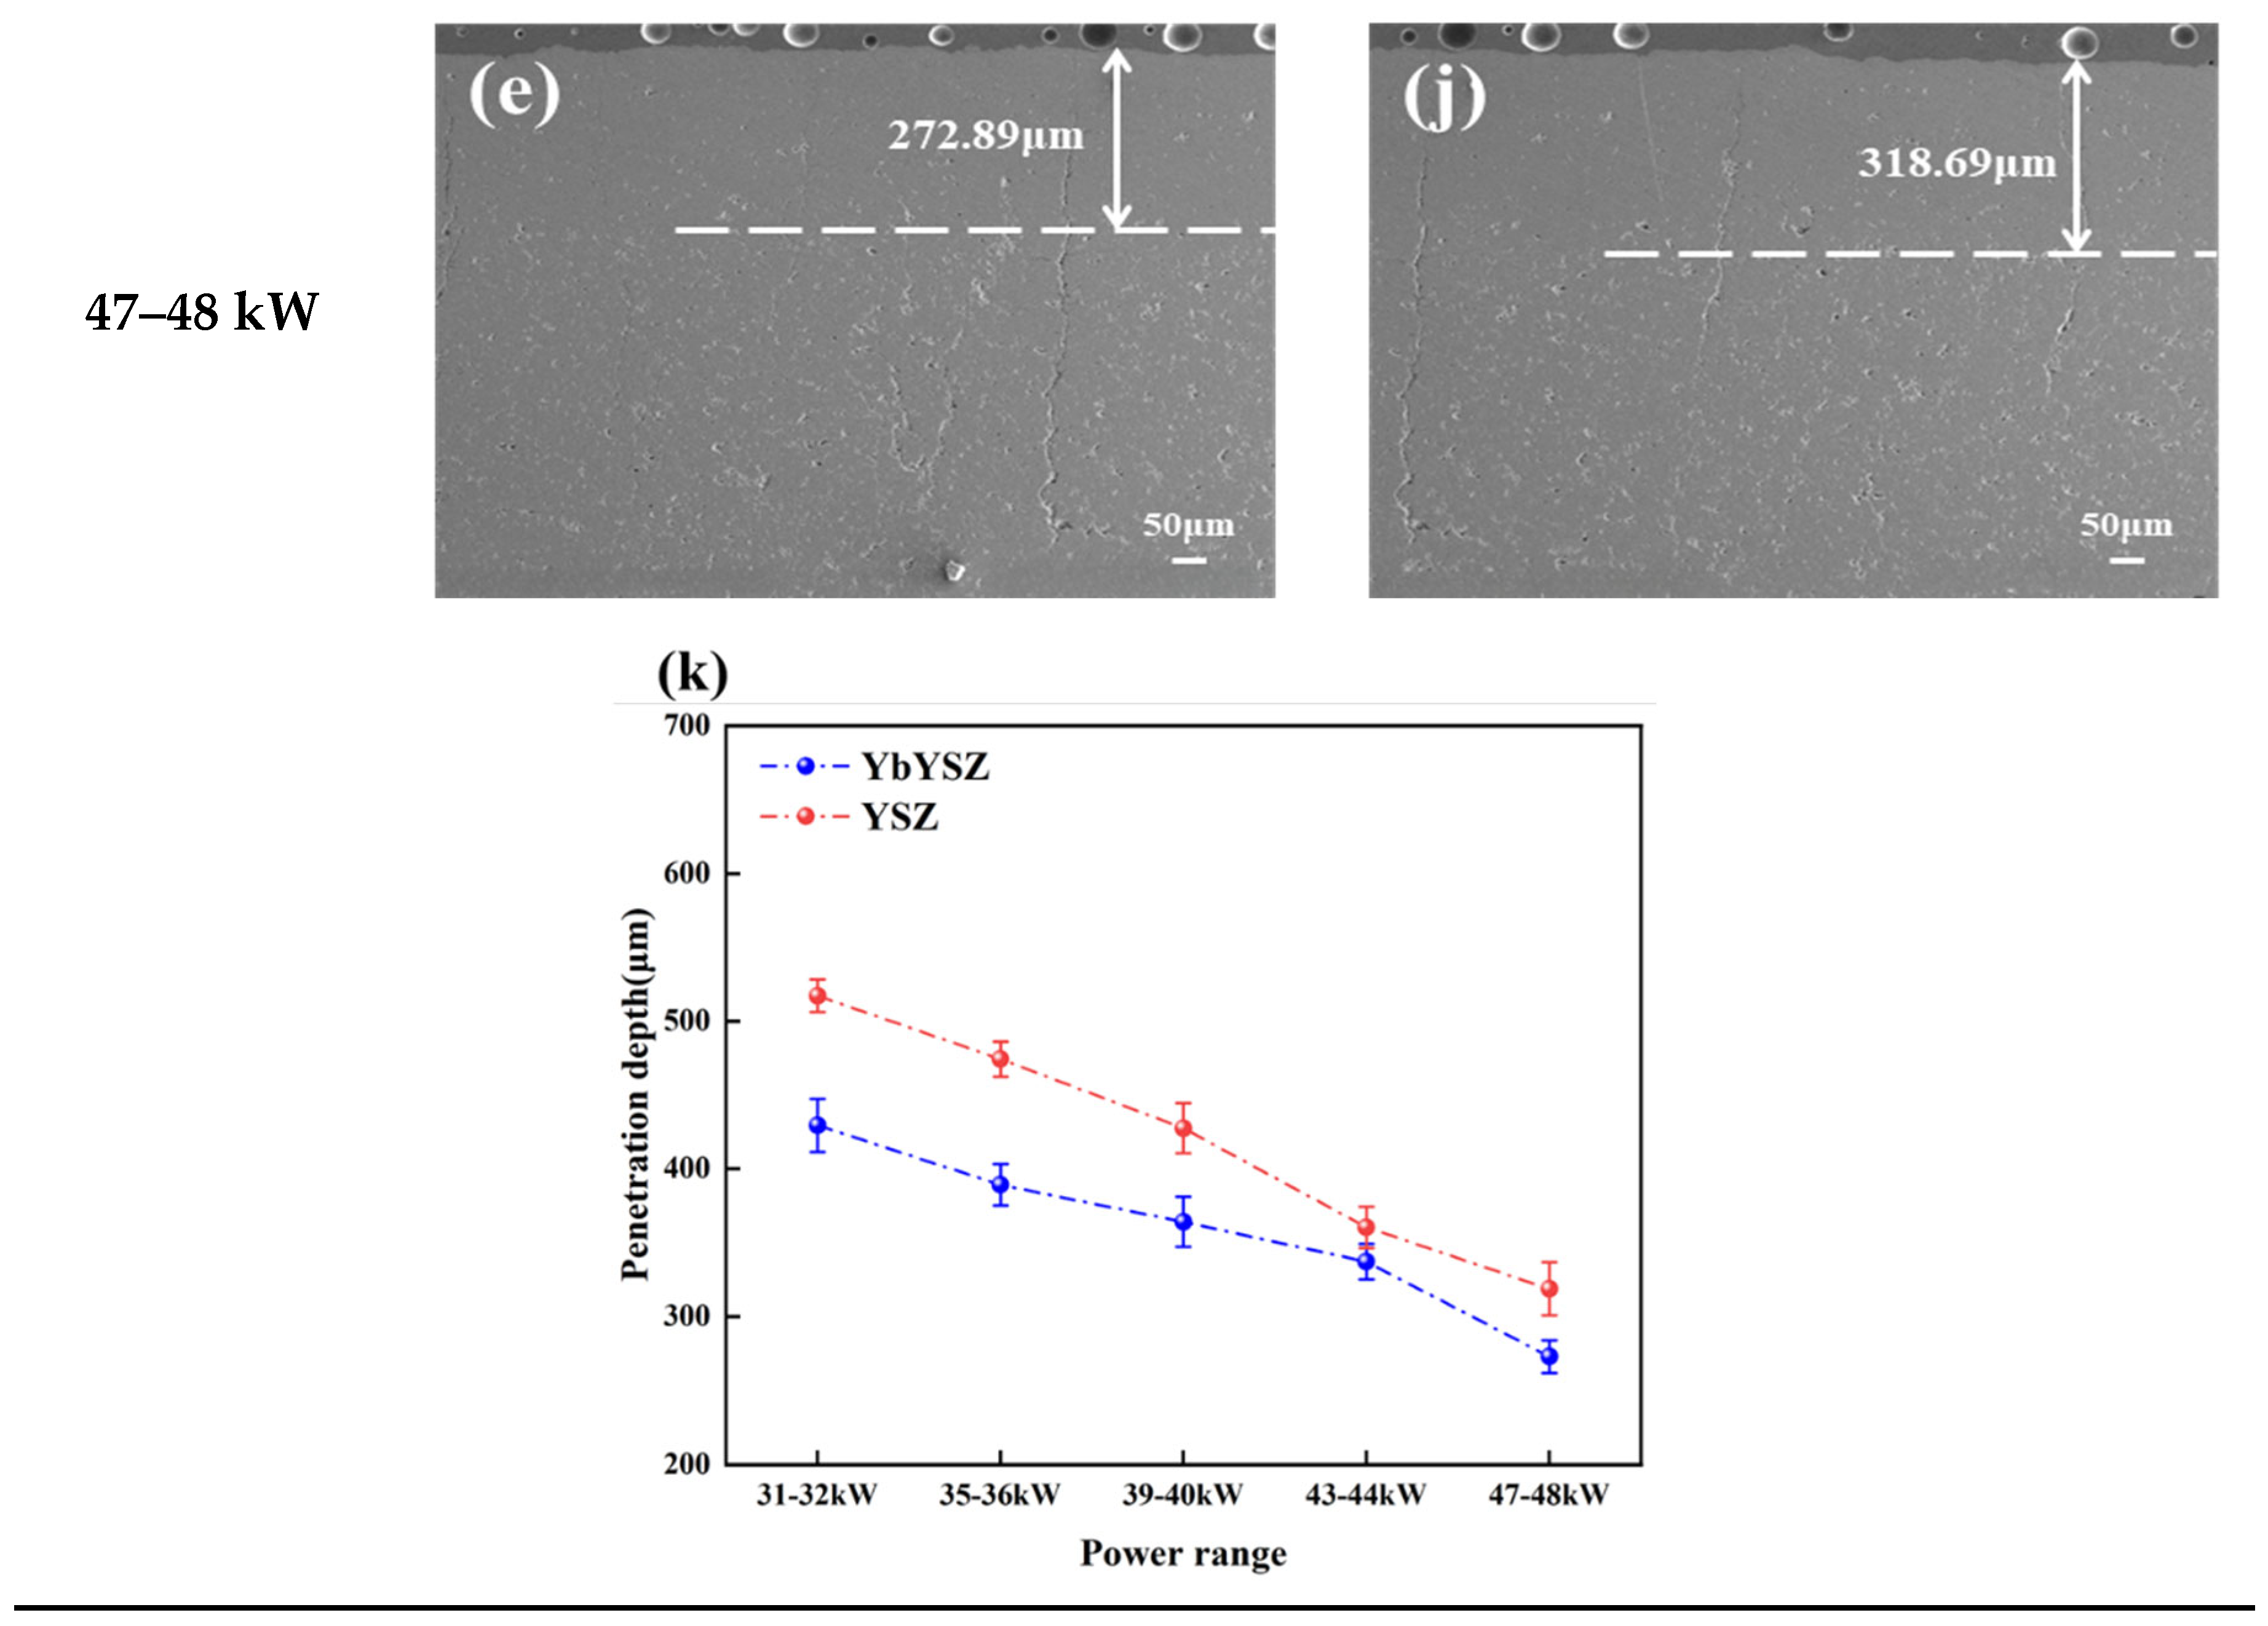
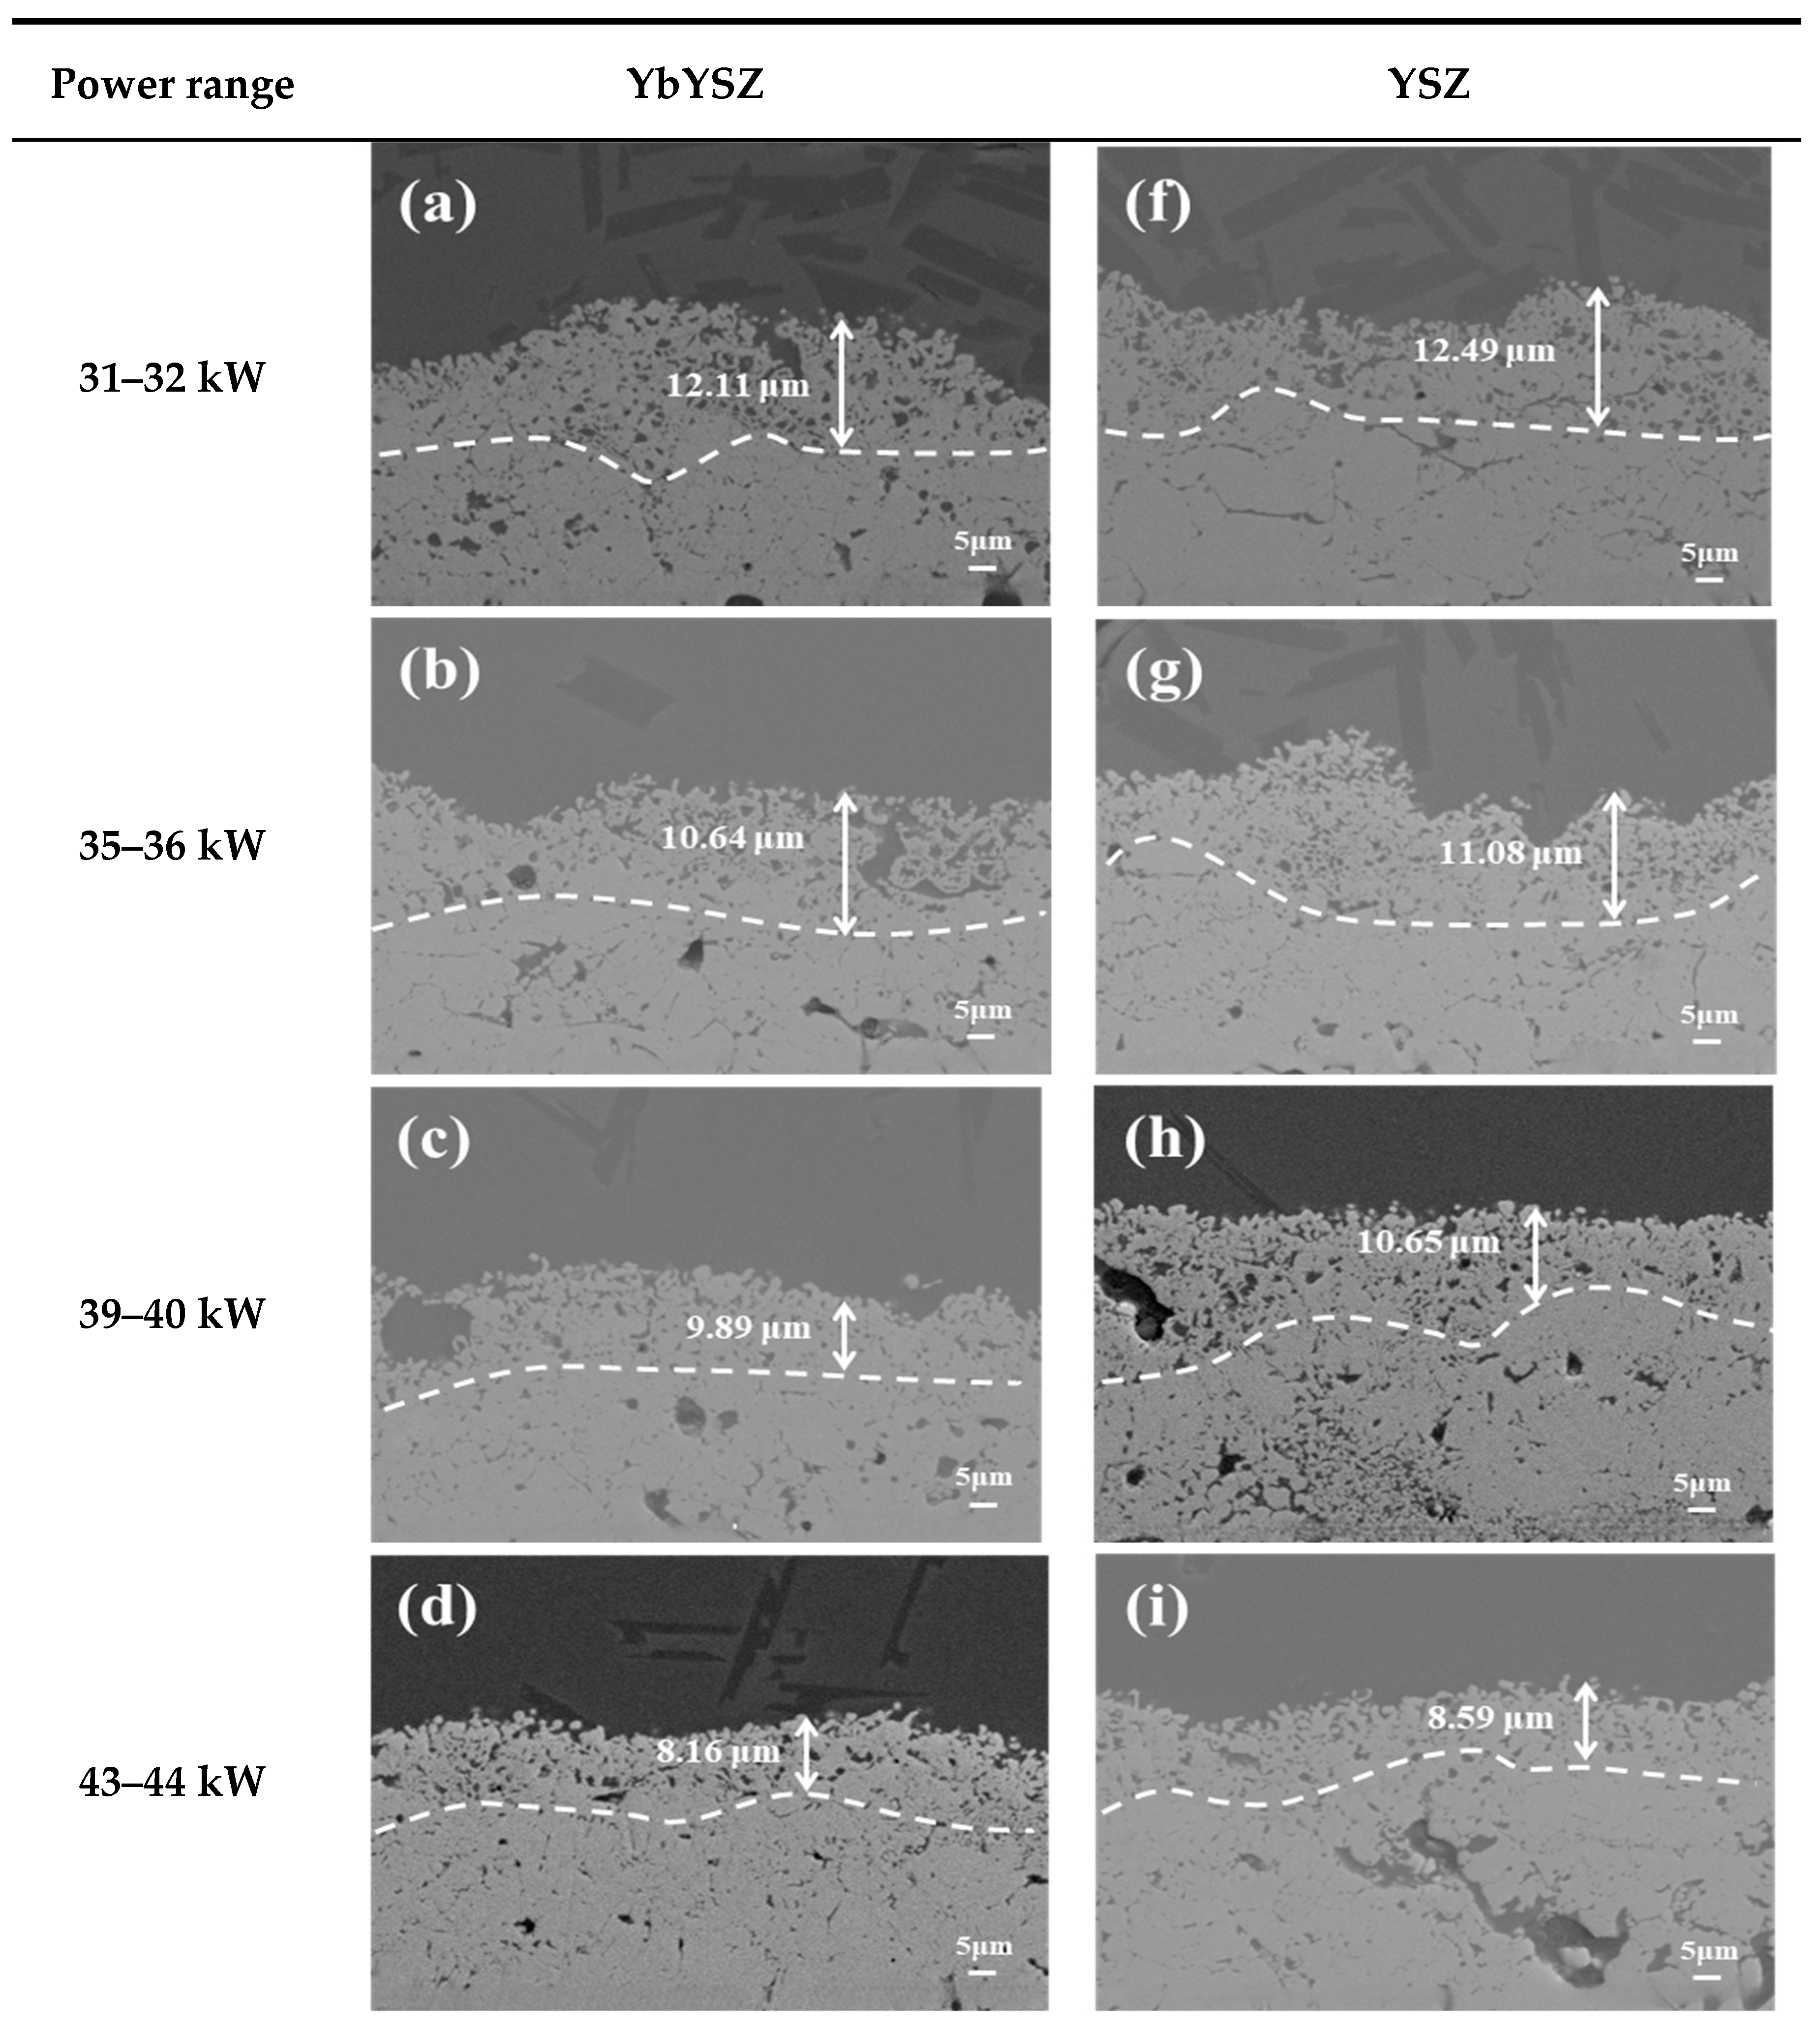
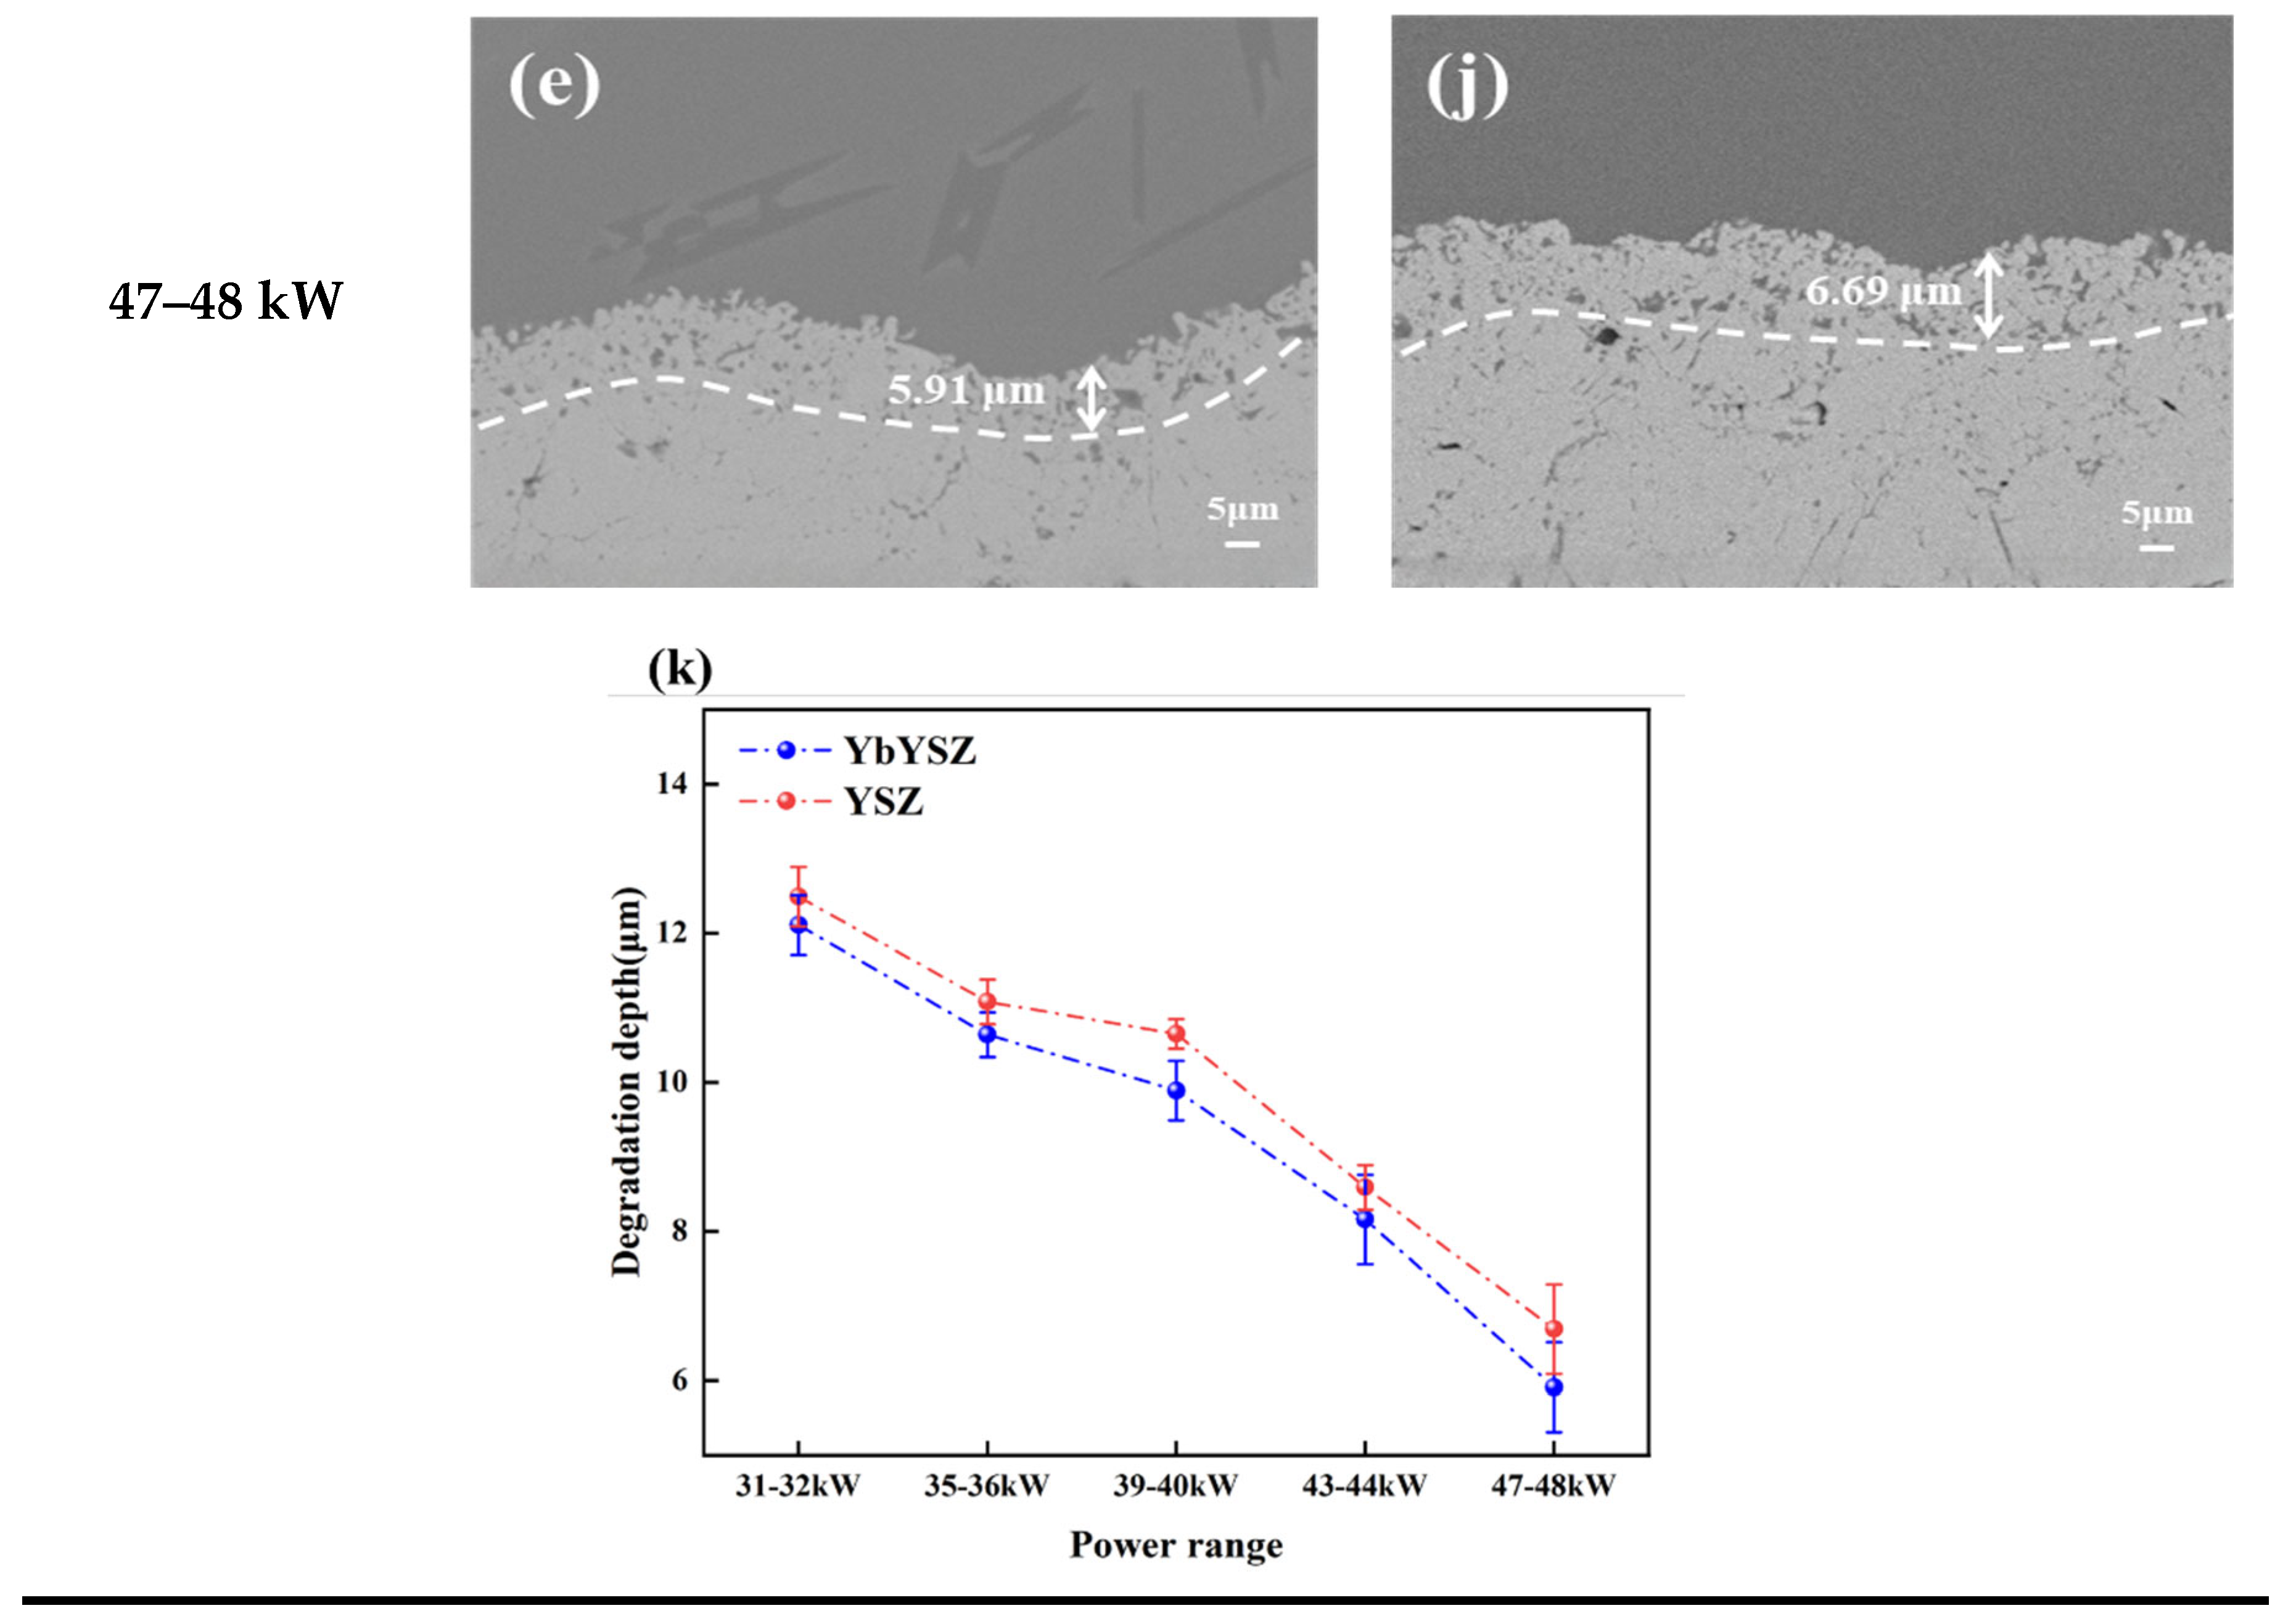
In the CMAS isothermal corrosion experiment, the infiltration and degradation depths of the CMAS in the coatings exhibited a decrease with an increase in the spraying power, which was attributed to a reduction in inherent defects. The penetration depths of the CMAS in the YbYSZ coatings were 429.46 μm, 389.22 μm, 361.12 μm, 337.09 μm, and 272.89 μm, respectively, which were 16.9%, 17.9%, 14.81%, 6.3%, and 14.4% lower than those in the YSZ coatings at the same power, demonstrating better inhibition of CMAS infiltration. The penetration and degradation depths of the CMAS in the YbYSZ coatings were observed to be lower than those in the conventional YSZ coatings, indicating that the former exhibited enhanced corrosion resistance to CMAS.

Author Contributions

Methodology, W.Z., W.L. and X.Z.; Software, J.W., S.Y. and P.L.; Validation, W.L.; Formal analysis, W.Z. and W.L.; Investigation, W.Z. and Y.L.; Resources, K.L.; Writing—original draft, W.Z.; Writing—review & editing, W.W.; Supervision, Y.L. and W.W.; Project administration, T.Y.; Funding acquisition, C.Z. All authors have read and agreed to the published version of the manuscript.

Funding

This research was sponsored by the National High Technology Research and Development Program of China (2023YFB3711200), National Natural Science Foundation of China (52175136, 52130511), Science Center for Gas Turbine Project (P2021-A-IV-002), Shanghai Joint Innovation Program in the Field of Commercial Aviation Engines, Shanghai Gaofeng Project for University Academic Program Development, and Key Research and Development Projects in Anhui Province (2022a05020004).

Institutional Review Board Statement

Not applicable.

Informed Consent Statement

Informed consent was obtained from all subjects involved in the study.

Data Availability Statement

Data is contained within the article.

Conflicts of Interest

Chengcheng Zhang is employed by AECC Commercial Aircraft Engine Co., Ltd. The funders had no role in the design of the study; in the collection, analyses, or interpretation of data; in the writing of the manuscript; or in the decision to publish the results.

References

  1. Ozgurluk, Y.; Doleker, K.M.; Ahlatci, H.; Ozkan, D.; Karaoglanli, A.C. The Microstructural Investigation of Vermiculite-Infiltrated Electron Beam Physical Vapor Deposition Thermal Barrier Coatings. Open Chem. 2018, 16, 1106–1110. [Google Scholar] [CrossRef]
  2. Wellman, R.; Whitman, G.; Nicholls, J.R. CMAS corrosion of EB PVD TBCs: Identifying the minimum level to initiate damage. Int. J. Refract. Met. Hard Mater. 2010, 28, 124–132. [Google Scholar] [CrossRef]
  3. Lavasani, H.Q.; Valefi, Z.; Ehsani, N.; Masoule, S.T. Studying the effect of spraying parameters on the sintering of YSZ TBC using APS method. Surf. Coat. Technol. 2019, 360, 238–246. [Google Scholar] [CrossRef]
  4. Xie, Z.; Liu, Q.; Lee, K.-I.; Zhu, W.; Wu, L.T.; Wu, R.T. The Effect of Bond Coat Roughness on the CMAS Hot Corrosion Resistance of EB-PVD Thermal Barrier Coatings. Coatings 2022, 12, 596. [Google Scholar] [CrossRef]
  5. Ozgurluk, Y.; Doleker, K.M.; Ozkan, D.; Ahlatci, H.; Karaoglanli, A.C. Cyclic Hot Corrosion Failure Behaviors of EB-PVD TBC Systems in the Presence of Sulfate and Vanadate Molten Salts. Coatings 2019, 9, 166. [Google Scholar] [CrossRef]
  6. Padture, N.P. Advanced structural ceramics in aerospace propulsion. Nat. Mater. 2016, 15, 804–809. [Google Scholar] [CrossRef] [PubMed]
  7. Padture, N.P.; Gell, M.; Jordan, E.H. Thermal Barrier Coatings for Gas-Turbine Engine Applications. Science 2002, 296, 280–284. [Google Scholar] [CrossRef] [PubMed]
  8. Zhang, X.; Deng, Z.; Li, H.; Mao, J.; Deng, C.; Deng, C.; Niu, S.; Chen, W.; Song, J.; Fan, J.; et al. Al2O3-modified PS-PVD 7YSZ thermal barrier coatings for advanced gas-turbine engines. NPJ Mater. Degrad. 2020, 4, 31. [Google Scholar] [CrossRef]
  9. Schilbe, J.E. Substrate alloy element diffusion in thermal barrier coatings. Surf. Coat. Technol. 2000, 133, 35–39. [Google Scholar] [CrossRef]
  10. Krause, A.R.; Garces, H.F.; Dwivedi, G.; Ortiz, A.L.; Sampath, S.; Padture, N.P. Calcia-magnesia-alumino-silicate (CMAS)-induced degradation and failure of air plasma sprayed yttria-stabilized zirconia thermal barrier coatings. Acta Mater. 2016, 105, 355–366. [Google Scholar] [CrossRef]
  11. Wu, J.; Guo, H.-b.; Zhou, L.; Wang, L.; Gong, S.-k. Microstructure and Thermal Properties of Plasma Sprayed Thermal Barrier Coatings from Nanostructured YSZ. J. Therm. Spray Technol. 2010, 19, 1186–1194. [Google Scholar] [CrossRef]
  12. Tian, H.; Wei, L.; He, L. Phase Composition and Stability, Sintering and Thermal Conductivity of Gd2O3 and Yb2O3Co-Doped YSZ. Coatings 2023, 13, 53. [Google Scholar] [CrossRef]
  13. Shi, L.; Xin, L.; Wang, X.; Wang, X.; Wei, H.; Zhu, S.; Wang, F. Influences of MCrAlY coatings on oxidation resistance of single crystal superalloy DD98M and their inter-diffusion behaviors. J. Alloys Compd. 2015, 649, 515–530. [Google Scholar] [CrossRef]
  14. Zou, L.; Gao, M.; Xu, N.; Zhang, J.; Chang, X. CMAS Corrosion Behavior of Nanostructured YSZ and Gd-Yb-Y-Stabilized Zirconia Coatings. Coatings 2023, 13, 1623. [Google Scholar] [CrossRef]
  15. Liu, H.; Cai, J.; Zhu, J. CMAS (CaO-MgO-Al2O3-SiO2) resistance of Y2O3-stabilized ZrO2 thermal barrier coatings with Pt layers. Ceram. Int. 2018, 44, 452–458. [Google Scholar] [CrossRef]
  16. Sun, Y.; Wu, H.; Chen, X.; Deng, C.; Wu, D.; Cao, X.; Li, W. Degradation of the plasma sprayed GdMgAl11O19 thermal barrier coating resistant to calcium-magnesium-aluminum-silicate attack at 1350 °C. Corros. Sci. 2020, 169, 108593. [Google Scholar] [CrossRef]
  17. Bansal, N.P.; Choi, S.R. Properties of CMAS glass from desert sand. Ceram. Int. 2015, 41, 3901–3909. [Google Scholar] [CrossRef]
  18. Busso, E.P.; Wright, L.; Evans, H.E.; McCartney, L.N.; Saunders, S.R.J.; Osgerby, S.; Nunn, J. A physics-based life prediction methodology for thermal barrier coating systems. Acta Mater. 2007, 55, 1491–1503. [Google Scholar] [CrossRef]
  19. Chen, X. Calcium-magnesium-alumina-silicate (CMAS) delamination mechanisms in EB-PVD thermal barrier coatings. Surf. Coat. Technol. 2006, 200, 3418–3427. [Google Scholar] [CrossRef]
  20. Rabiei, A.; Evans, A.G. Failure mechanisms associated with the thermally grown oxide in plasma-sprayed thermal barrier coatings. Acta Mater. 2000, 48, 3963–3976. [Google Scholar] [CrossRef]
  21. Mack, D.E.; Wobst, T.; Jarligo, M.O.D.; Sebold, D.; Valssen, R. Lifetime and failure modes of plasma sprayed thermal barrier coatings in thermal gradient rig tests with simultaneous CMAS injection. Surf. Coat. Technol. 2017, 324, 36–47. [Google Scholar] [CrossRef]
  22. Schlichting, K.W.; Padture, N.P.; Jordan, E.H.; Gell, M. Failure modes in plasma-sprayed thermal barrier coatings. Mater. Sci. Eng. A Struct. Mater. Prop. Microstruct. Process. 2003, 342, 120–130. [Google Scholar] [CrossRef]
  23. Huang, J.B.; Wang, W.Z.; Li, Y.J.; Fang, H.J.; Ye, D.D.; Zhang, X.C.; Tu, S.T. A novel strategy to control the microstructure of plasma-sprayed YSZ thermal barrier coatings. Surf. Coat. Technol 2020, 402, 126304. [Google Scholar] [CrossRef]
  24. Fang, H.; Wang, W.; Huang, J.; Li, Y.; Ye, D. Corrosion behavior and thermos-physical properties of a promising Yb2O3 and Y2O3 co-stabilized ZrO2 ceramic for thermal barrier coatings subject to calcium-magnesium-aluminum-silicate (CMAS) deposition: Experiments and first-principles calculation. Corros. Sci. 2021, 182, 109230. [Google Scholar] [CrossRef]
  25. Fang, H.; Wang, W.; Yang, Z.; Yang, T.; Wang, Y.; Huang, J.; Ye, D. Phase stability, thermal shock behavior and CMAS corrosion resistance of Yb2O3-Y2O3 co-stabilized zirconia thermal barrier coatings prepared by atmospheric plasma spraying. Surf. Coat. Technol. 2021, 427, 127864. [Google Scholar] [CrossRef]
  26. Liu, Y.; Liu, W.; Wang, W.; Zhang, W.; Yang, T.; Li, K.; Tang, Z.; Liu, C.; Zhang, C. Improvement on corrosion resistance of molten calcium-magnesium-alumina-silicate (CMAS) by Yb2O3-Y2O3 co-stabilized ZrO2 ceramic pellets. Corros. Sci. 2024, 227, 111754. [Google Scholar] [CrossRef]
  27. Liu, Y.; Liu, W.; Wang, W.; Zhang, W.; Yang, T.; Li, K.; Li, H.; Tang, Z.; Liu, C.; Zhang, C. Deposition characteristics, sintering and CMAS corrosion resistance, and mechanical properties of thermal barrier coatings by atmospheric plasma spraying. Surf. Coat. Technol. 2024, 482, 130623. [Google Scholar] [CrossRef]
  28. Liu, W.; Liu, Y.; Wang, W.; Yang, T.; Zhang, W.; Liu, C.; Zhang, C.; Tu, S. Damage Grading Evaluation of Thermal Barrier Coatings under CMAS Corrosion. Coatings 2023, 13, 1495. [Google Scholar] [CrossRef]
  29. Yu, Z.X.; Huang, J.B.; Wang, W.Z.; Yu, J.Y.; Wu, L.M. Deposition and properties of a multilayered thermal barrier coating. Surf. Coat. Technol. 2016, 288, 126–134. [Google Scholar] [CrossRef]
  30. Li, W.; Zhao, H.; Zhong, X.; Wang, L.; Tao, S. Air Plasma-Sprayed Yttria and Yttria-Stabilized Zirconia Thermal Barrier Coatings Subjected to Calcium-Magnesium-Alumino-Silicate (CMAS). J. Therm. Spray Technol. 2014, 23, 975–983. [Google Scholar] [CrossRef]
  31. Harder, B.J.; Ramirez-Rico, J.; Almer, J.D.; Lee, K.N.; Faber, K.T. Chemical and Mechanical Consequences of Environmental Barrier Coating Exposure to Calcium-Magnesium-Aluminosilicate. J. Am. Ceram. Soc. 2011, 94, S178–S185. [Google Scholar] [CrossRef]
  32. Bolcavage, A.; Feuerstein, A.; Foster, J.; Moore, P. Thermal shock testing of thermal barrier coating/bondcoat systems. J. Mater. Eng. Perform. 2004, 13, 389–397. [Google Scholar] [CrossRef]
  33. Traeger, F.; Vassen, R.; Rauwald, K.H.; Stöver, D. Thermal cycling setup for testing thermal barrier coatings. Adv. Eng. Mater. 2003, 5, 429–432. [Google Scholar] [CrossRef]
  34. Wu, J.; Wei, X.Z.; Padture, N.P.; Klemens, P.G.; Gell, M.; García, E.; Miranzo, P.; Osendi, M.I. Low-thermal-conductivity rare-earth zirconates for potential thermal-barrier-coating applications. J. Am. Ceram. Soc. 2002, 85, 3031–3035. [Google Scholar] [CrossRef]
  35. Huang, J.B.; Wang, W.Z.; Li, Y.J.; Fang, H.J.; Ye, D.D.; Zhang, X.C.; Tu, S.T. Novel-structured plasma-sprayed thermal barrier coatings with low thermal conductivity, high sintering resistance and high durability. Ceram. Int. 2021, 47, 5156–5167. [Google Scholar] [CrossRef]
  36. Marcomini, R.F.; Souza, D.M.P.F.d. Caracterização microestrutural de materiais cerâmicos utilizando o programa de processamento digital de imagens Image J. Cerâmica 2011, 57, 100–105. [Google Scholar] [CrossRef]
  37. Li, D.; Feng, J.; Zhao, H.; Liu, C.; Zhang, L.; Shao, F.; Zhao, Y.; Tao, S. Microstructure formed by suspension plasma spraying: From YSZ splat to coating. Ceram. Int. 2017, 43, 7488–7496. [Google Scholar] [CrossRef]
  38. Chen, R.; Wu, X.; Dudzinski, D. Influence of Thermal Cycle Frequency on the TGO Growth and Cracking Behaviors of an APS-TBC. J. Therm. Spray Technol. 2012, 21, 1294–1299. [Google Scholar] [CrossRef]
  39. Liu, T.; Luo, X.-T.; Chen, X.; Yang, G.-J.; Li, C.-X.; Li, C.-J. Morphology and Size Evolution of Interlamellar Two-Dimensional Pores in Plasma-Sprayed La2Zr2O7 Coatings During Thermal Exposure at 1300 °C. J. Therm. Spray Technol. 2015, 24, 739–748. [Google Scholar] [CrossRef]
  40. Wang, Y.; Han, Y.; Lin, C.; Zheng, W.; Jiang, C.; Wei, A.; Liu, Y.; Zeng, Y.; Shi, Y. Effect of spraying power on the morphology of YSZ splat and micro-structure of thermal barrier coating. Ceram. Int. 2021, 47, 18956–18963. [Google Scholar] [CrossRef]
  41. Liu, Y.; Zhang, W.; Wang, W.; Liu, W.; Yang, T.; Li, K.; Tang, Z.; Liu, C.; Zhang, C. Evolution of microstructure, thermophysical and mechanical properties and wetting behavior of plasma-sprayed Yb2O3 and Y2O3 co-stabilized ZrO2 coatings during high-temperature exposure and CMAS corrosion. Surf. Coat. Technol. 2024, 477, 130278. [Google Scholar] [CrossRef]
  42. Kang, Y.X.; Bai, Y.; Du, G.Q.; Yu, F.L.; Bao, C.G.; Wang, Y.T.; Ding, F. High temperature wettability between CMAS and YSZ coating with tailored surface microstructures. Mater. Lett. 2018, 229, 40–43. [Google Scholar] [CrossRef]
  43. Yin, B.; Sun, M.; Zhu, W.; Yang, L.; Zhou, Y. Wetting and spreading behaviour of molten CMAS towards thermal barrier coatings and its influencing factors. Results Phys. 2021, 26, 104365. [Google Scholar] [CrossRef]
  44. Guo, L.; Li, G.; Gan, Z. Effects of surface roughness on CMAS corrosion behavior for thermal barrier coating applications. J. Adv. Ceram. 2021, 10, 472–481. [Google Scholar] [CrossRef]
  45. Li, Y.; Li, C.-J.; Zhang, Q.; Yang, G.-J.; Li, C.-X. Influence of TGO Composition on the Thermal Shock Lifetime of Thermal Barrier Coatings with Cold-sprayed MCrAlY Bond Coat. J. Therm. Spray Technol. 2010, 19, 168–177. [Google Scholar] [CrossRef]
  46. Yang, S.-J.; Song, W.-J.; Dingwell, D.B.; He, J.; Guo, H.-B. Surface roughness affects metastable non-wetting behavior of silicate melts on thermal barrier coatings. Rare Met. 2022, 41, 469–481. [Google Scholar] [CrossRef]
  47. Loganathan, A.; Gandhi, A.S. Effect of phase transformations on the fracture toughness of t′ yttria stabilized zirconia. Mater. Sci. Eng. A Struct. Mater. Prop. Microstruct. Process. 2012, 556, 927–935. [Google Scholar] [CrossRef]
  48. Sun, Y.; Luo, J.; Zhu, J. Ferroelastic toughening of single crystalline yttria-stabilized t′ zirconia: A phase field study. Eng. Fract. Mech. 2020, 233, 107077. [Google Scholar] [CrossRef]
  49. Clarke, D.R. Materials selection guidelines for low thermal conductivity thermal barrier coatings. Surf. Coat. Technol. 2003, 163, 67–74. [Google Scholar] [CrossRef]
  50. Liu, H.; Li, S.; Li, Q.; Li, Y.; Zhou, W. Microstructure, phase stability and thermal conductivity of plasma sprayed Yb2O3, Y2O3 co-stabilized ZrO2 coatings. Solid State Sci. 2011, 13, 513–519. [Google Scholar] [CrossRef]
  51. Xu, Y.; Guo, X.; Lin, C.; Jiang, C.; Zheng, W.; Chang, C.; Zeng, Y. Thermal Properties and Microstructures Analysis of YSZ and YSZ-Al2O3Thermal Barrier Coatings. J. Therm. Spray Technol. 2020, 29, 574–581. [Google Scholar] [CrossRef]
  52. Talochkin, A.B.; Teys, S.A.; Suprun, S.P. Resonance Raman scattering by optical phonons in unstrained germanium quantum dots. Phys. Rev. B 2005, 72, 115416. [Google Scholar] [CrossRef]
  53. Klemens, P.G. Effect of point defects on the decay of the longitudinal optical mode. Phys. B Condens. Matter 2002, 316, 413–416. [Google Scholar] [CrossRef]
  54. Wang, J.; Sun, J.; Jing, Q.; Liu, B.; Zhang, H.; Yu, Y.; Yuan, J.; Dong, S.; Zhou, X.; Cao, X. Phase stability and thermo-physical properties of ZrO2-CeO2-TiO2ceramics for thermal barrier coatings. J. Eur. Ceram. Soc. 2018, 38, 2841–2850. [Google Scholar] [CrossRef]
  55. Qu, Z.; Sparks, T.D.; Pan, W.; Clarke, D.R. Thermal conductivity of the gadolinium calcium silicate apatites: Effect of different point defect types. Acta Mater. 2011, 59, 3841–3850. [Google Scholar] [CrossRef]
  56. Chen, D.; Wang, Q.; Liu, Y.; Ning, X. Investigation of ternary rare earth oxide-doped YSZ and its high temperature stability. J. Alloys Compd. 2019, 806, 580–586. [Google Scholar] [CrossRef]
  57. Lin, J.D.; Duh, J.G. Fracture toughness and hardness of ceria- and yttria-doped tetragonal zirconia ceramics. Mater. Chem. Phys. 2003, 78, 253–261. [Google Scholar] [CrossRef]
  58. Karthikeyan, S.; Balasubramanian, V.; Rajendran, R. Developing empirical relationships to estimate porosity and microhardness of plasma-sprayed YSZ coatings. Ceram. Int. 2014, 40, 3171–3183. [Google Scholar] [CrossRef]
  59. Borik, M.A.; Kulebyakin, A.V.; Myzina, V.A.; Lomonova, E.E.; Milovich, F.O.; Ryabochkina, P.A.; Sidorova, N.V.; Shulga, N.Y.; Tabachkova, N.Y. Mechanical characteristics, structure, and phase stability of tetragonal crystals of ZrO2-Y2O3 solid solutions doped with cerium and neodymium oxides. J. Phys. Chem. Solids 2021, 150, 109808. [Google Scholar] [CrossRef]
  60. Kan, Y.; Zhang, G.; Wang, P.; Van der Biest, O.; Vleugels, J. Yb2O3 and Y2O3 co-doped zirconia ceramics. J. Eur. Ceram. Soc. 2006, 26, 3607–3612. [Google Scholar] [CrossRef]
  61. Fang, H.; Wang, W.; Zhang, C.; Wang, Y.; Yang, T.; Yang, Z.; Liu, Y.; Ye, D. Comparative study on failure behavior of promising CMAS-resistant plasma-sprayed thermal barrier coatings in burner rig test with/without CMAS deposition. Ceram. Int. 2023, 49, 12390–12407. [Google Scholar] [CrossRef]
  62. Mercer, C.; Faulhaber, S.; Evans, A.G.; Darolia, R. A delamination mechanism for thermal barrier coatings subject to calcium-magnesium-alumino-silicate (CMAS) infiltration. Acta Mater. 2005, 53, 1029–1039. [Google Scholar] [CrossRef]
  63. Zhu, W.; Chen, H.Y.; Yang, L.; Zhou, Y.C.; Xu, G.N. Phase field model for diffusion-reaction stress field in the thermal barrier coatings corroded by the molten CMAS. Eng. Fail. Anal. 2020, 111, 104486. [Google Scholar] [CrossRef]
  64. Dai, H.; Xie, A.; Gao, L.; Zhang, J.; Zhang, X.; Lin, J. Effect of CMAS penetration behavior on stress evolution in TBCs under three-dimensional temperature gradients. Ceram. Int. 2024, 50, 660–671. [Google Scholar] [CrossRef]
  65. Ren, X.; Zhao, M.; Feng, J.; Pan, W. Phase transformation behavior in air plasma sprayed yttria stabilized zirconia coating. J. Alloys Compd. 2018, 750, 189–196. [Google Scholar] [CrossRef]
  66. Feng, Y.; Dong, T.-s.; Fu, B.-g.; Li, G.-l.; Liu, Q.; Wang, R. Thermal shock resistance of double-layer thermal barrier coatings. J. Mater. Res. 2020, 35, 2808–2816. [Google Scholar] [CrossRef]
  67. Roncallo, G.; Barbareschi, E.; Cacciamani, G.; Vacchieri, E. Effect of cooling rate on phase transformation in 6–8 wt% YSZ APS TBCs. Surf. Coat. Technol. 2021, 412, 127071. [Google Scholar] [CrossRef]
  68. Xia, J.; Yang, L.; Wu, R.T.; Zhou, Y.C.; Zhang, L.; Huo, K.L.; Gan, M. Degradation mechanisms of air plasma sprayed free-standing yttria-stabilized zirconia thermal barrier coatings exposed to volcanic ash. Appl. Surf. Sci. 2019, 481, 860–871. [Google Scholar] [CrossRef]
  69. Morelli, S.; Bursich, S.; Testa, V.; Bolelli, G.; Micciche, A.; Lusvarghi, L. CMAS corrosion and thermal cycling fatigue resistance of alternative thermal barrier coating materials and architectures: A comparative evaluation. Surf. Coat. Technol. 2022, 439, 128433. [Google Scholar] [CrossRef]
Figure 1. Cross-section morphology of YbYSZ coating (ae) and YSZ coating (fj) in different power ranges.
Coatings 14 00928 g001aCoatings 14 00928 g001b
Figure 2. The change in porosity of plasma-sprayed YSZ coating and YbYSZ coating with power.
Coatings 14 00928 g002
Figure 3. The surface roughness of plasma-sprayed YbYSZ and YSZ coatings varies with power.
Coatings 14 00928 g003
Figure 4. XRD patterns of coatings in different plasma spraying power ranges: (a) YbYSZ coating; (b) YSZ coating.
Coatings 14 00928 g004
Figure 5. Variation in thermal conductivity of plasma YbYSZ and YSZ coatings sprayed at different powers at room temperature.
Coatings 14 00928 g005
Figure 6. Changes in mechanical properties of plasma-sprayed YbYSZ and YSZ coatings with power: (a) Vickers hardness; (b) elastic modulus.
Coatings 14 00928 g006
Figure 7. Lifetime comparison of plasma-sprayed YbYSZ coating and YSZ coating under thermal cycling-CMAS coupling test conditions at different power levels.
Coatings 14 00928 g007
Figure 8. Changes in cross-section morphology and porosity (k) of YbYSZ coating (ae) and YSZ coating (fj) at different powers under thermal cycling-CMAS coupling conditions.
Coatings 14 00928 g008aCoatings 14 00928 g008b
Figure 9. Mechanical properties of plasma-sprayed YbYSZ coating and YSZ coating failure under different powers: (a) Vickers hardness; (b) elastic modulus.
Coatings 14 00928 g009
Figure 10. XRD spectra of YSZ coating (a) and YbYSZ coating (b) at different power levels after thermal cycling-CMAS test.
Coatings 14 00928 g010
Figure 11. CMAS penetration depth of coating with different powers under constant temperature corrosion test: (ae) YbYSZ coating; (fj) YSZ coating; and (k) penetration depth evolution.
Coatings 14 00928 g011aCoatings 14 00928 g011b
Figure 12. Degradation depth of coating in different power ranges under constant temperature corrosion test: (ae) YbYSZ coating; (fj) YSZ coating; and (k) degradation depth evolution.
Coatings 14 00928 g012aCoatings 14 00928 g012b
Table 1. Process parameters of plasma spraying YbYSZ and YSZ coating.
Spray ParameterBond CoatYbYSZYSZ
Power (kW)3631–4831–48
Ar (L/min)504040
H2 (L/min)999
Spray distance (mm)120100100
Gun speed (mm/s)900500500
Thickness (μm)80–100300–350300–350
Table 2. The chemical composition of the MCrAlY, YbYSZ, and YSZ powders.
SampleChemical CompositionSourceGrain Size
NiCrAlY Amdry 962, Sulzer Metco Inc., New York, NY, USA15–45 μm
YbYSZ4.0 mol.%-Yb2O3-0.5 mol.%Y2O3-ZrO2Suzhou Meierbang Material
Co., Ltd., Suzhou, China
15–45 μm
YSZ8 wt% Y2O3 + 92 wt% ZrO2Commercial 8YSZ powders15–45 μm
Table 3. The compositions of the simulated CMAS (mol.%).
SiO2CaOMgOAl2O3Na2OK2OFe2O3ZrO2
Original powder composition (mol.%)54.2834.334.613.920.900.931.37-
Disclaimer/Publisher’s Note: The statements, opinions and data contained in all publications are solely those of the individual author(s) and contributor(s) and not of MDPI and/or the editor(s). MDPI and/or the editor(s) disclaim responsibility for any injury to people or property resulting from any ideas, methods, instructions or products referred to in the content.

