Article

Using the Single-Constant Kubelka–Munk Model for Surface Color Prediction of Pre-Colored Fiber Blends

1
School of Packaging and Printing Engineering, Henan University of Animal Husbandry and Economy, Zhengzhou 450046, China
2
College of Information Science and Technology, Nanjing Forestry University, Nanjing 210037, China
*
Author to whom correspondence should be addressed.
Coatings 2024, 14(8), 948; https://doi.org/10.3390/coatings14080948
Submission received: 26 June 2024 / Revised: 22 July 2024 / Accepted: 27 July 2024 / Published: 29 July 2024
(This article belongs to the Section Surface Characterization, Deposition and Modification)

Abstract

:
This paper is committed to improving surface color prediction accuracy of the single-constant Kubelka–Munk (KM) model for pre-colored fiber blends without increasing the model complexity. The single-constant KM model is only applicable to certain media with a constant scattering coefficient. However, the scattered lights in pre-colored fiber blends are intertwined with a great deal of fiber surface reflections, making it impossible to obtain the true KM scattering coefficient. To solve this problem, we analyzed the propagation behavior of light beams within the pre-colored fiber blends, and proposed a light scattering correction equation to remove the effects of fiber surface reflections on the scattered lights. Then, an improved single-constant KM model was established based on the corrected spectral data. Pre-colored cotton fiber blended samples were prepared to assess the color prediction accuracy. The results show the improved model, with coefficients k1 = 0.9477 and k2 = 0.0523, achieved superior performance compared to the original single-constant KM model and the two-constant KM model. The average color difference (ΔE2000) of the improved model is 1.20, while the average ΔE2000 of the original single-constant KM model is 6.37, and that of the two-constant KM model is 1.58. Importantly, the improved model has not added complexity to the single-constant KM model since the light scattering correction equation is essentially used to pre-process the spectral data. It can be concluded that the improved model is beneficial and practical.

1. Introduction

In the textile industry, blending two or more differently pre-colored fibers together is an innovative approach to produce surface colors [1]. As shown in Figure 1, this technology dyes the fibers before spinning, while the traditional dyeing method is to spin first and then dye. The “dye first and then spin” process is considered more environmentally friendly because it allows for a significant quantity of undyed fibers to be retained in the yarns [2]. In contrast, the traditional “spin first and then dye” process requires that all fibers be dyed indiscriminately. The “dye first and then spin” process leads to a more efficient use of dyes and reduces the overall environmental impact of the dyeing process, making it a more sustainable and eco-friendly choice for textile production. Furthermore, unlike dye mixing, pre-colored fiber blending can be used to obtain products with unique nonsolid or mottled color effects [3], referred to as colored spun yarns and fabrics, which are very popular in the market.
In the production of colored spun yarns, a key process is color prediction, that is, building a relationship between the recipes of differently colored fibers (or primaries) and the target colors [4]. However, the coloring mechanism of fiber blends is not yet clear. In practice, the solution to color prediction still relies on the trial-and-error method, which has low efficiency, poor accuracy, and a lot of waste. Achieving efficient and accurate color prediction in colored spun yarns has become a major technological challenge faced by the industry.
The art of surface color prediction models for pre-colored fiber blends has been on-going for years, leading to several important models, such as the Kubelka–Munk (KM) model [2,4,5,6,7,8,9,10,11,12], Stearns–Noechel (SN) model [3,13,14,15], Friele model [16,17], and artificial neural network (ANN) model [18]. Generally, in all the models, the aim is to establish a reliable relation F(·) between the optical properties of the primaries and those of the fiber blends:
F ( R b ) = i c i F ( R i )
where Ri represents the spectral reflectance of the ith primary, and Rb represents the spectral reflectance of the fiber blends.
With the exception of the KM model, these models are data-driven models, which are mainly built by learning the mapping relationship F(·) from given training samples. Obviously, the performance of data-driven models depends heavily on the characteristics of the training samples used, and it is not an easy thing for such models to obtain good generalization ability. In the literature, numerous studies have been carried out on data-driven models, but they were often only applicable in specific situations [3], such as a specific fiber type, fiber fineness, fiber length, or form of blended samples.
Unlike data-driven models that rely on training samples, the KM model is a theoretical model derived from radiative transfer theory [19], which gives it better generalization ability. More specifically, the KM model attempts to establish the mapping relationship by deriving the propagation behavior of light within a blend. There are two kinds of KM model, namely, the single-constant model and the two-constant model [20]. In recent years, the two-constant KM model has received widespread attention, and has been proven to have better color prediction accuracy than data-driven models [6]. However, the two-constant model requires an absorption coefficient K and a scattering coefficient S for each primary within a blend, which usually need to be calculated by preparing a series of well-designed blended samples, making it difficult to implement [2,9]. In comparison, the single-constant KM model only requires one K/S coefficient, and K/S can be directly calculated from spectral reflectance R,
K / S = F ( R ) = ( 1 R ) 2 2 R
which makes the single-constant model very easy to implement and user-friendly. However, the single-constant KM model only holds true when the scattering coefficient S of the blended medium is constant, such as in traditional textile dyeing [20], in which the light scattering ability of the medium remains unchanged as the colorants change, since the scattering is introduced mainly by the textile substrate rather than the colorants inside it. Unfortunately, in the case of pre-colored fiber blends, it has been reported that the scattering coefficient of the blended medium is not constant, and it will change with the formulation of primary fibers [6]. In general, it is argued that the single-constant model is not suitable for color prediction of pre-colored fiber blends. Furferi et al. [7] pointed out that fiber blended media are obtained by mixing differently colored fibers together, rather than adding colorants to the substrate as in textile dyeing. They believed that the reason for the change in scattering coefficient is that there is no substrate in the fiber blended medium. Therefore, Furferi et al. [7] defined an “equivalent fabric substrate” that has no physical meaning and added it to the single-constant KM model as a correction term. This correction method showed good accuracy, but it is only available when there is a blending sample with a similar primary formulation to the target sample, which is used to calculate the “equivalent fabric substrate”. Wei et al. [8] considered that the change in scattering coefficient was caused by the optical interaction between primary fibers. To address this issue, they proposed searching for optically independent configurations in the fiber blended medium and to model them as theoretical primaries in the single-constant KM model. The method enabled the single-constant model to be applied to the fiber blended medium, and has been experimentally proven to obtain good color prediction results. However, the number of theoretical primaries modeled by this method is far more than the number of actual primaries, making the model much more complex than the original single-constant KM model and not so easy to implement.
In conclusion, although several color prediction models for pre-colored fiber blends have been proposed, they are difficult to apply in actual production. Reliable and practical color prediction models still need to be researched [1,11,12,15]. Considering the theoretical advantages of the single-constant KM model, this paper is committed to improving the single-constant model without increasing the model complexity. The proposed model establishes the mathematical relationship between the recipes of primaries and the blended colors. On the one hand, by knowing the recipes of primaries, the model can accurately predict the resulting blended color. This allows for precise digital proofing when developing new products, ensuring the final output meets the desired specifications. On the other hand, when a customer provides a target blended color sample, the model can determine the recipe of primaries needed to produce that target color. This facilitates accurate production color matching, ensuring the product meets the customer’s expectations.

2. Methods

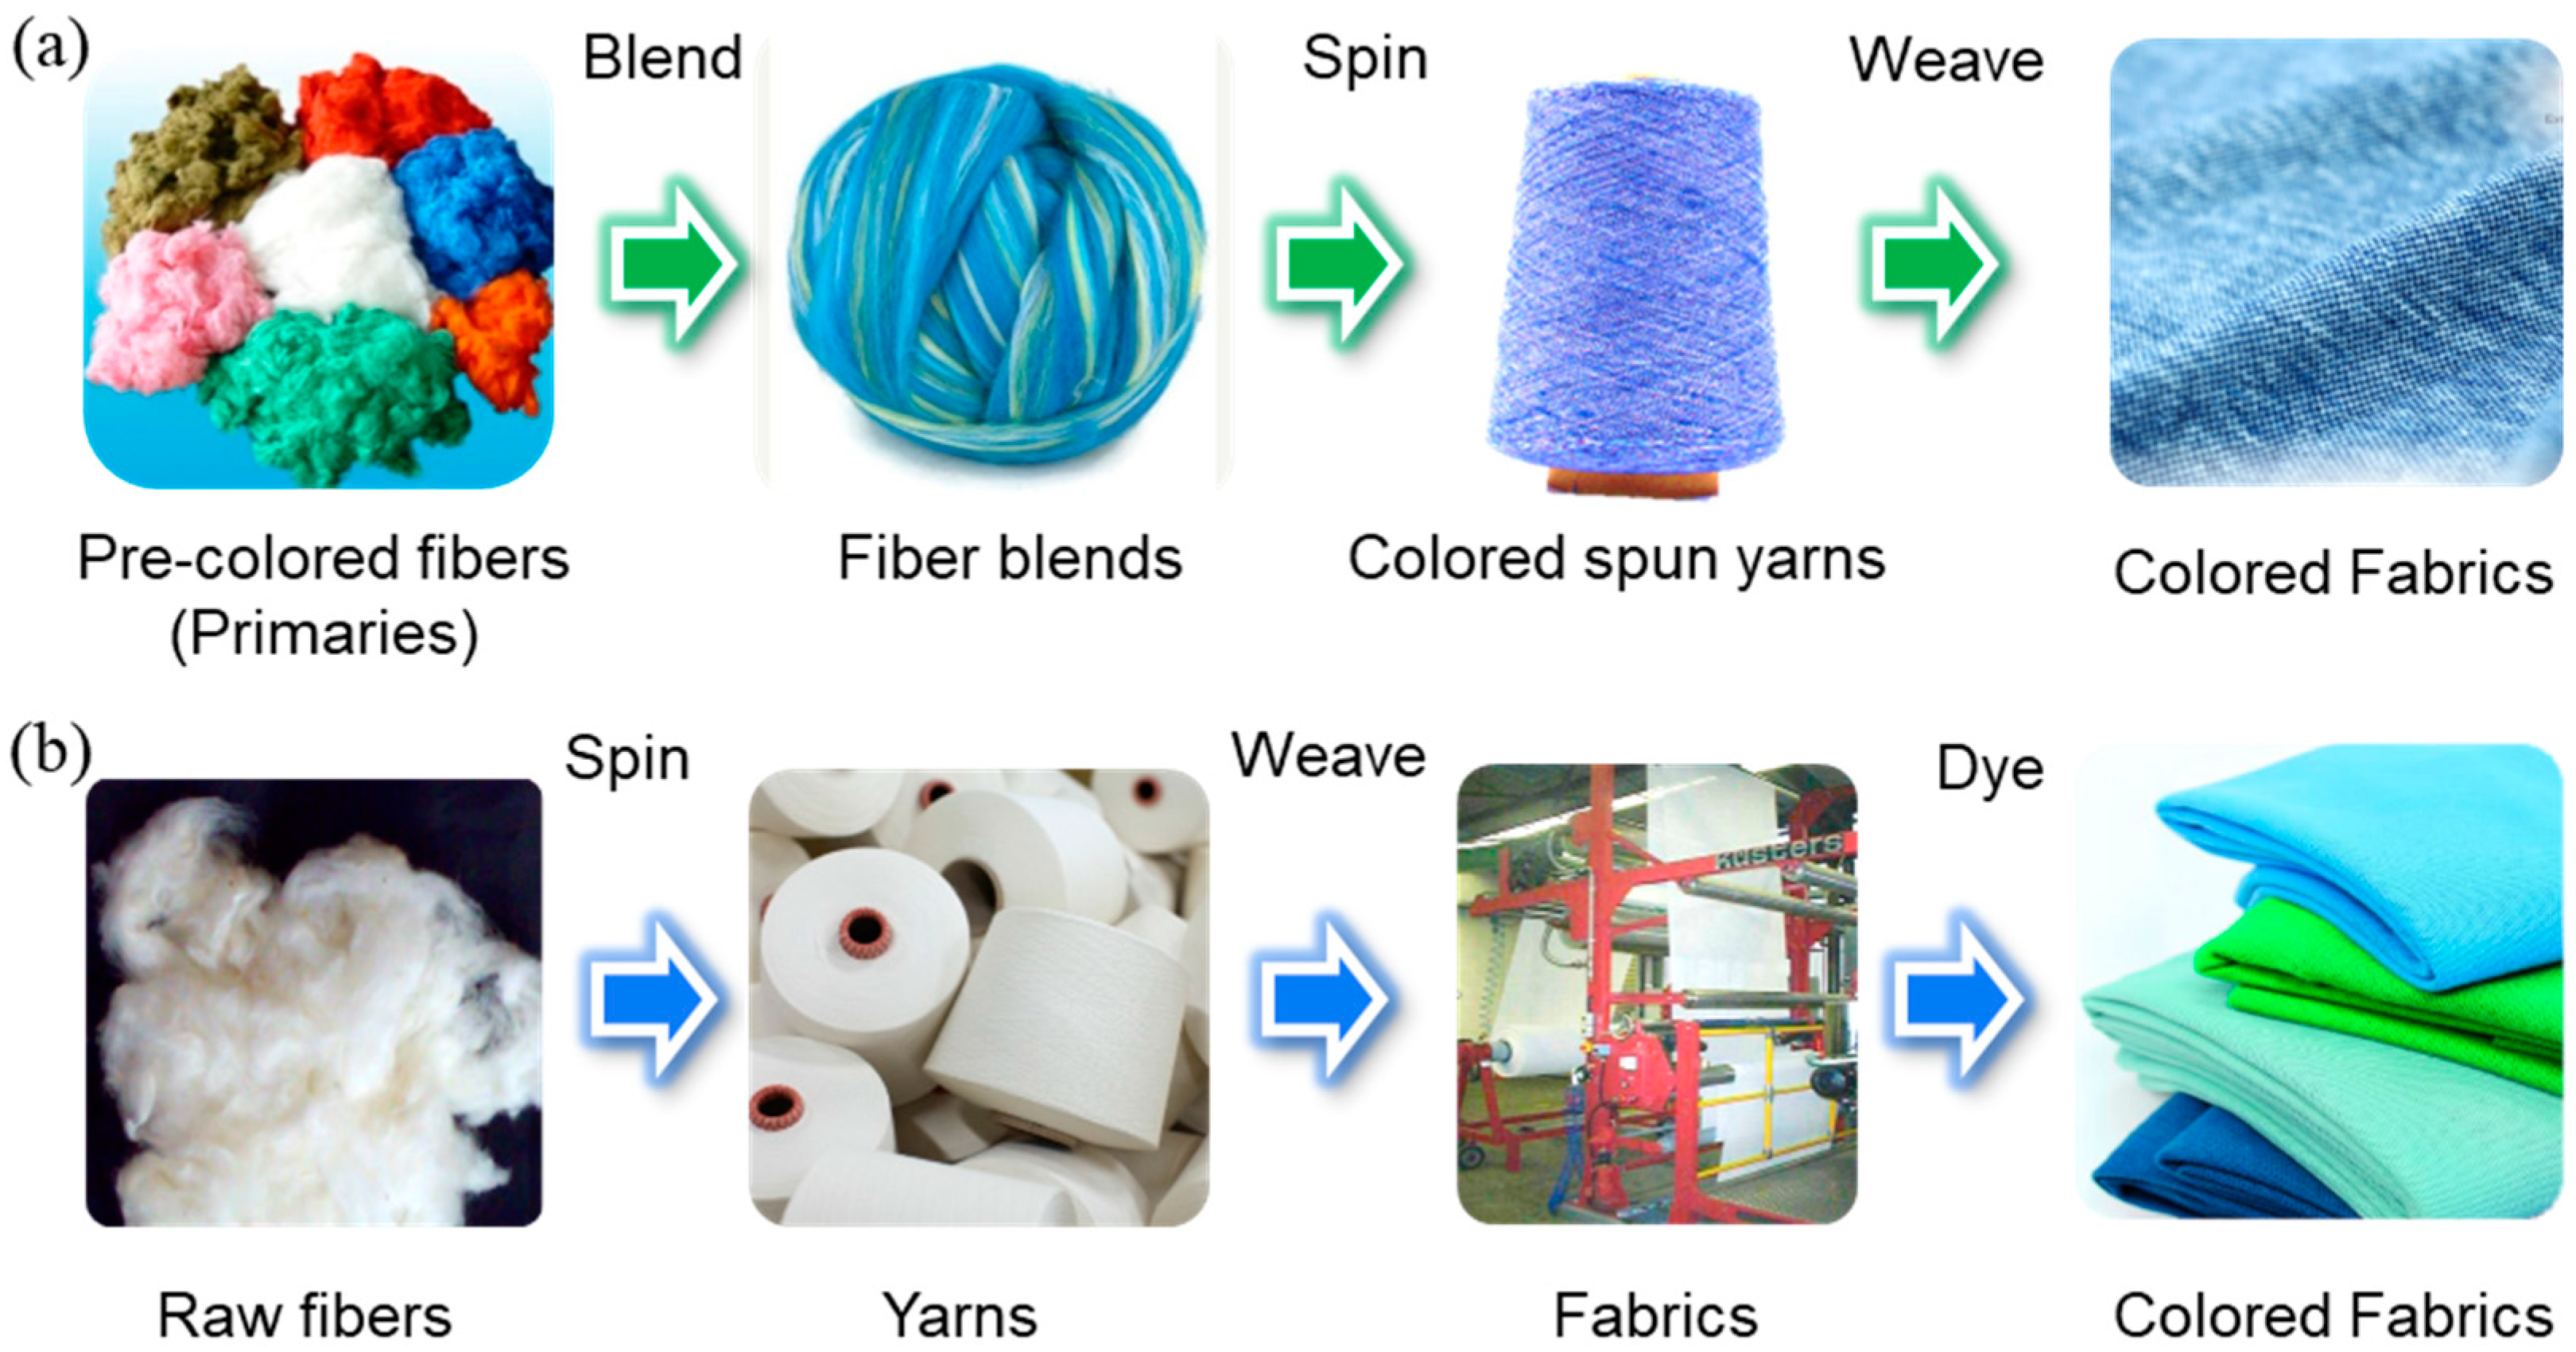
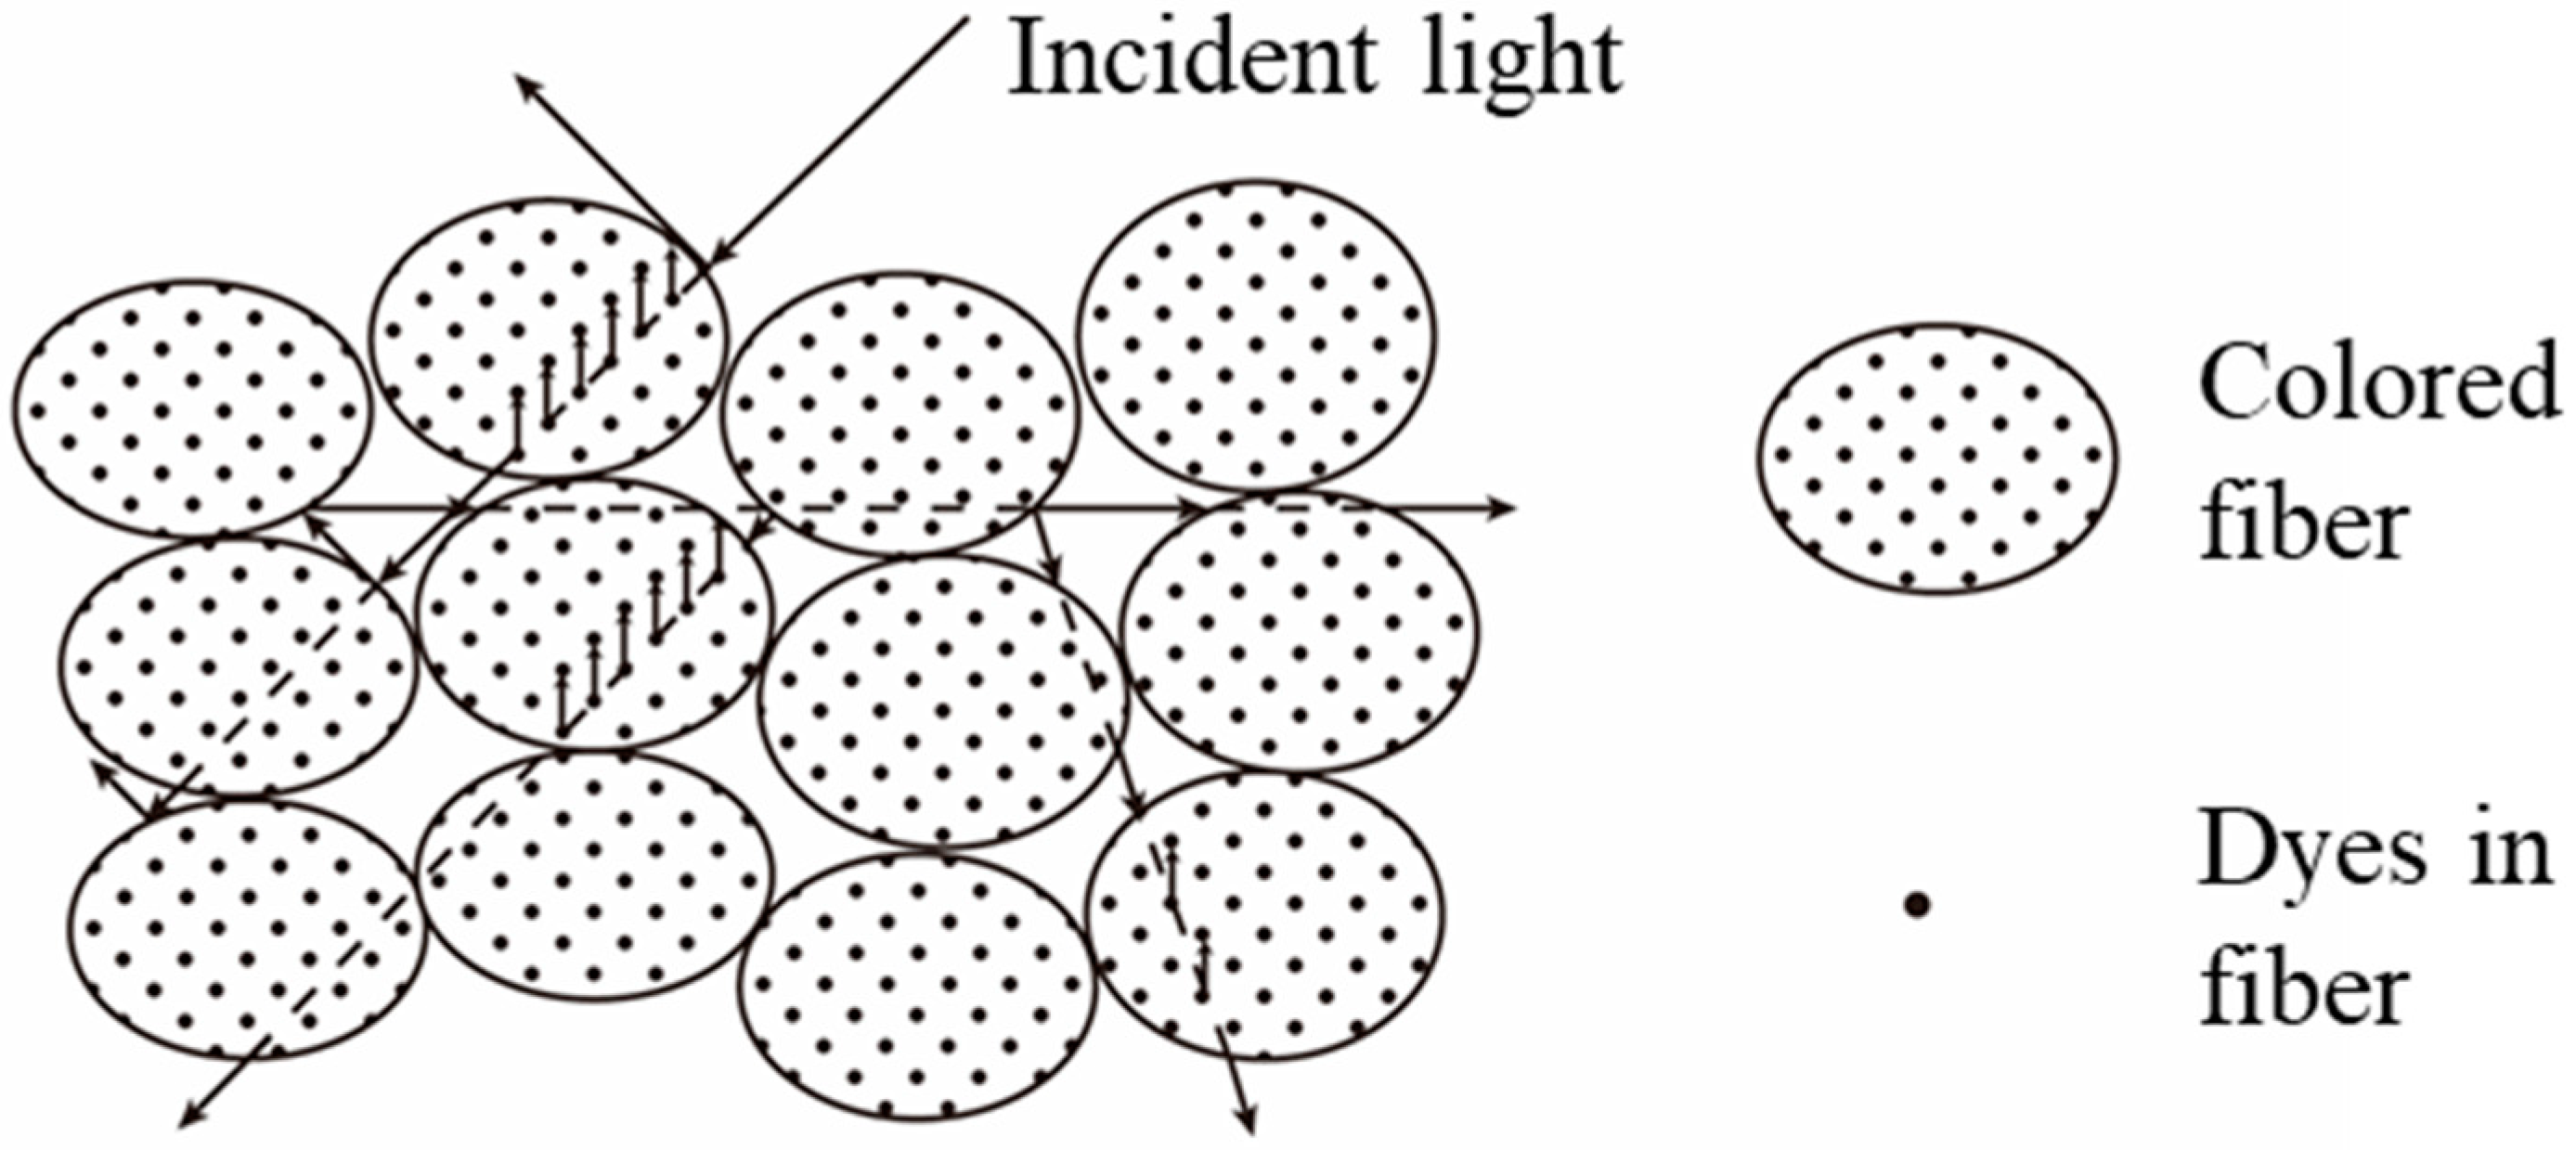
2.1. Light Scattering in the Medium of Pre-Colored Fiber Blending

As mentioned above, color prediction based on the single-constant KM model is only applicable for a certain blended medium with a constant scattering coefficient. In previous studies, it is generally accepted that light scattering in pre-colored fiber blends cannot be considered constant because there are complex light scattering effects.
In the pre-colored fiber blended medium, the primary fibers are considered “colorants” suspended in air “substrate”, which selectively absorb and scatter lights. In addition, the dye particles are dissolved in colored fibers and therefore also have scattering rules. As shown in Figure 2, the “scattering” is the combination of these two types of scattering: fiber scattering and dye scattering. The former is contributed from fiber surfaces, while the latter from dye particles inside the fibers.
However, fiber scattering at the fiber–air interfaces is not “true scattering”. In fact, what is called true scattering occurs when light encounters particles smaller than the incident wavelength, whereas the size of fibers is much larger than the visible light wavelength. The observed “fiber scattering” in Figure 2 is actually a great deal of reflections, but because these fiber–air interfaces are randomly oriented in different directions, the reflected light appears to be “scattered”. In other words, the light that travels from the blends back to the detector contains both reflected and scattered light. This is not allowed by the KM theory, which requires that any light captured by the detector must be scattered light from the sample.
From this perspective, the existence of “fiber scattering”, which is actually reflections from fiber surfaces, disturbs the constant KM scattering of the fiber blended medium, which is the essential reason why the single-constant model is not applicable for color prediction of pre-colored fiber blends.

2.2. Improved Single-Constant KM Model Based on Light Scattering Correction

Based on Section 2.1, there is reason to believe that if the reflections from fiber surfaces could be removed from the total scattering, the remaining scattering in fiber blends may be true KM scattering. This scattering may be constant, as assumed by the single-constant KM model. From this idea, we proposed a light scattering correction equation to remove the fiber surface reflections.
Referring again to Figure 2, when a beam of light is incident on a fiber bundle, there are many possibilities for how the light can propagate. For simplicity, we divide these light propagation behaviors into two types, namely, whether the light enters the fiber or not. The first type of light is reflected directly from the fiber surfaces without passing through any fibers, and captured by the detector. The second type of light enters a fiber and is scattered and absorbed by the dye particles inside it, and emerges from the bottom of the fiber. Then the exiting light may reflect from the surface of an underlying fiber, where it may either be captured by the detector or enter another fiber.
In the first case, the fiber surface reflections do not enter the KM scattering region of the fiber bundle, so its effect on the KM scattering is additive and may only cause a baseline displacement of the measured spectra by the detector. Therefore, it can be easily removed by being subtracted from the measured spectra. In the second case, the situation is much more complicated. The fiber surface reflections and the KM scattering are intertwined, and any light may encounter multiple reflective surfaces in many different directions and pass through multiple fibers. At this point, the effect of fiber surface reflections on the KM scattering is multiplicative, which may lead to local slope changes of the measured spectra.
It appears then that the effects of fiber surface reflections on the KM scattering can be both additive and multiplicative. In order to obtain accurate and reliable KM scattering, both of these need to be addressed. Therefore, we define a light scattering correction equation to describe these two effects by a linear model with an additive term and a multiplicative term, as follows:
R ^ = f ( R ) = k 1 R + k 2
where R ^ indicates the corrected spectra that removes the two effects of surface reflections; R indicates the measured spectra by the detector, also referred to as spectral reflectance; and k1 and k2 are calibration coefficients corresponding to multiplicative effects and additive effects, respectively. Then the K/S coefficient can be calculated from the corrected spectra:
K S = F ( R ^ ) = ( 1 R ^ ) 2 2 R ^
Since R ^ no longer contains surface reflections, the scattering coefficient S should remain constant, so the single-constant KM model could be applied to color prediction of the fiber blends. It is only necessary to measure the spectral reflectance of the primary fibers, and the spectral reflectance of the blends could be calculated by Equations (5)–(7):
( K S ) b = i c i ( K S ) i
R ^ b = F 1 [ ( K / S ) b ] = 1 + ( K / S ) b ( K / S ) b 2 + 2 ( K / S ) b
R b = f 1 ( R ^ b ) = R ^ b k 2 k 1
where (K/S)i is the K/S coefficient of the ith primary within the blends, and it is calculated by Equations (3) and (4) from the measured spectral reflectance; (K/S)b is the K/S coefficient of the blends; and ci is the mass proportion of the ith primary and subject to ci ≥ 0 and sum(ci) = 1. R ^ b is the corrected spectra reflectance of the blends calculated by the inverse function of Equation (4) from (K/S)b. Rb is the predicted spectral reflectance of the blends calculated by the inverse function of Equation (3). It is worth noting that in the improved single-constant KM model, the light scattering equation is used to pre-process the measured spectral reflectance, so it does not increase the complexity of the original single-constant KM model.
In the following sections, we design experiments to verify the effectiveness and accuracy of the improved model. Section 3 focuses on determining the calibration coefficients k1 and k2 through experimental procedures. In Section 4, we comprehensively compare the improved model with the original model using multiple metrics.

3. Experimental

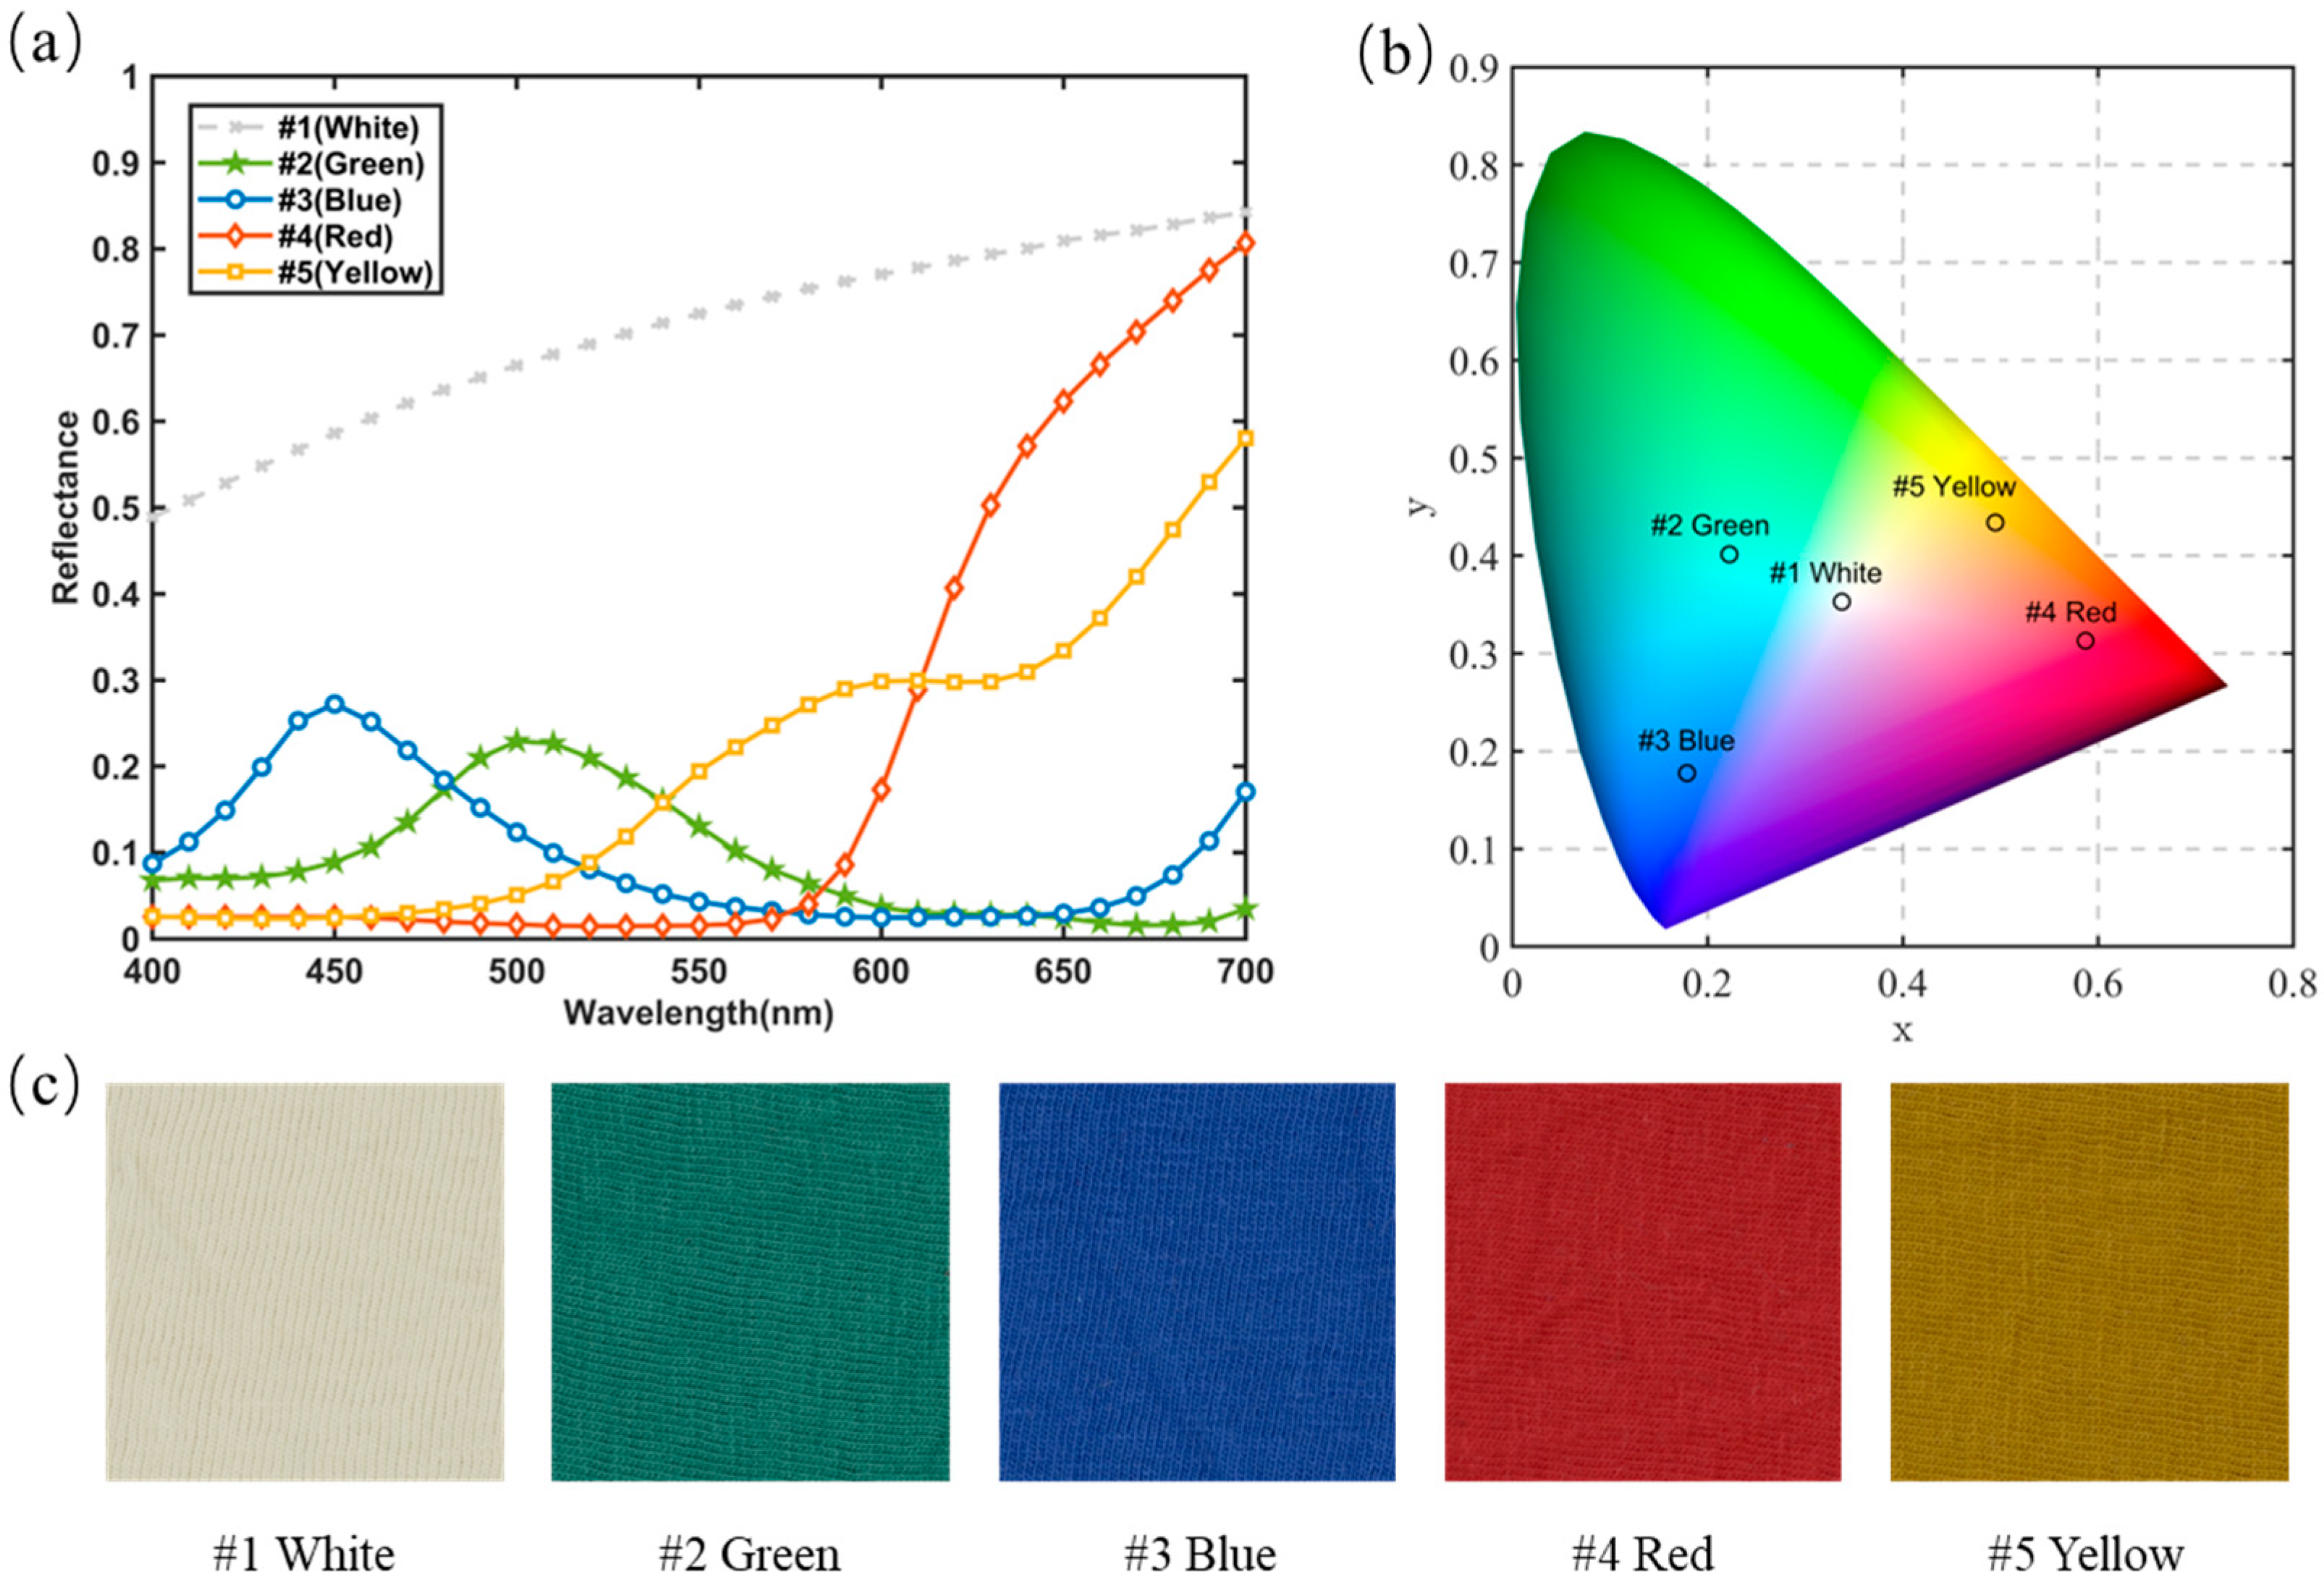
3.1. Sample Preparation

To verify the effectiveness of the improved single-constant KM model, five pre-colored cotton fibers were used as primaries to prepare blended samples. The fibers were provided by Guangdong Esquel Textile Co., Ltd. (Foshan, China), with a linear density of 1.67 dtex and an average length of 37 mm. dtex is the unit measuring the weight in grams of 10,000 m of fiber. The color information of the five primaries is shown in Figure 3, where primary #1 is undyed white, and primaries #2~#5 are colored fibers dyed with reactive dyes, and their colors are green, blue, red, and yellow respectively.
All samples involved in this study were prepared as fabrics. At first, the primary fibers or their blends with specific proportions were fed into a carding machine and carded three times to obtain cotton slivers. Then, the cotton slivers were spun into yarn by open-end spinning with the spinning parameters of count 29.2 tex and twist coefficient 450 atex. tex is the unit measuring the weight in grams of 1000 m of yarn, and atex is the unit of twist coefficient in the Tex system. Finally, the yarns were knitted into single jersey fabrics of 24 threads/inch via the knitting process.
In this study, besides the five primary fiber samples, 48 fiber blended samples were designed and prepared as described above, as shown in Table 1. According to the different uses of these samples, they were divided into two groups. Samples No. 1 to 16 belong to the first group, which are used to verify the light scattering correction equation described by Equation (3) and calculate its calibration coefficients k1 and k2. In addition, the first group of samples is also used to calculate the absorption coefficient K and scattering coefficient S for the five primaries in order to apply the two-constant KM model, which serves as a comparison model with the improved single-constant KM model. Samples No. 17 to 48 belong to the second group, which are used to test the color prediction accuracy of the improved KM model.

3.2. Sample Measurement

In this study, an X-rite Ci7800 spectrophotometer (Grand Rapids, MI, USA) with d/8 configuration was used to measure the spectral reflectance of the samples. The spectrophotometer has a built-in light source, which is a Pulsed Xenon D65 calibrated light source. All the samples were folded into four layers to avoid the translucency effect. To obtain stable and accurate measurement results, we adopted the maximum aperture of 25 mm and measured five times at different positions to take the average. The five positions were selected according to the five-point sampling method, as shown in Figure 4. Other measurement conditions were set to remove specular reflection (SCE) and exclude UV light. The measurement results were recorded as 31-dimension data in the wavelength range of 400–700 nm with intervals of 10 nm.

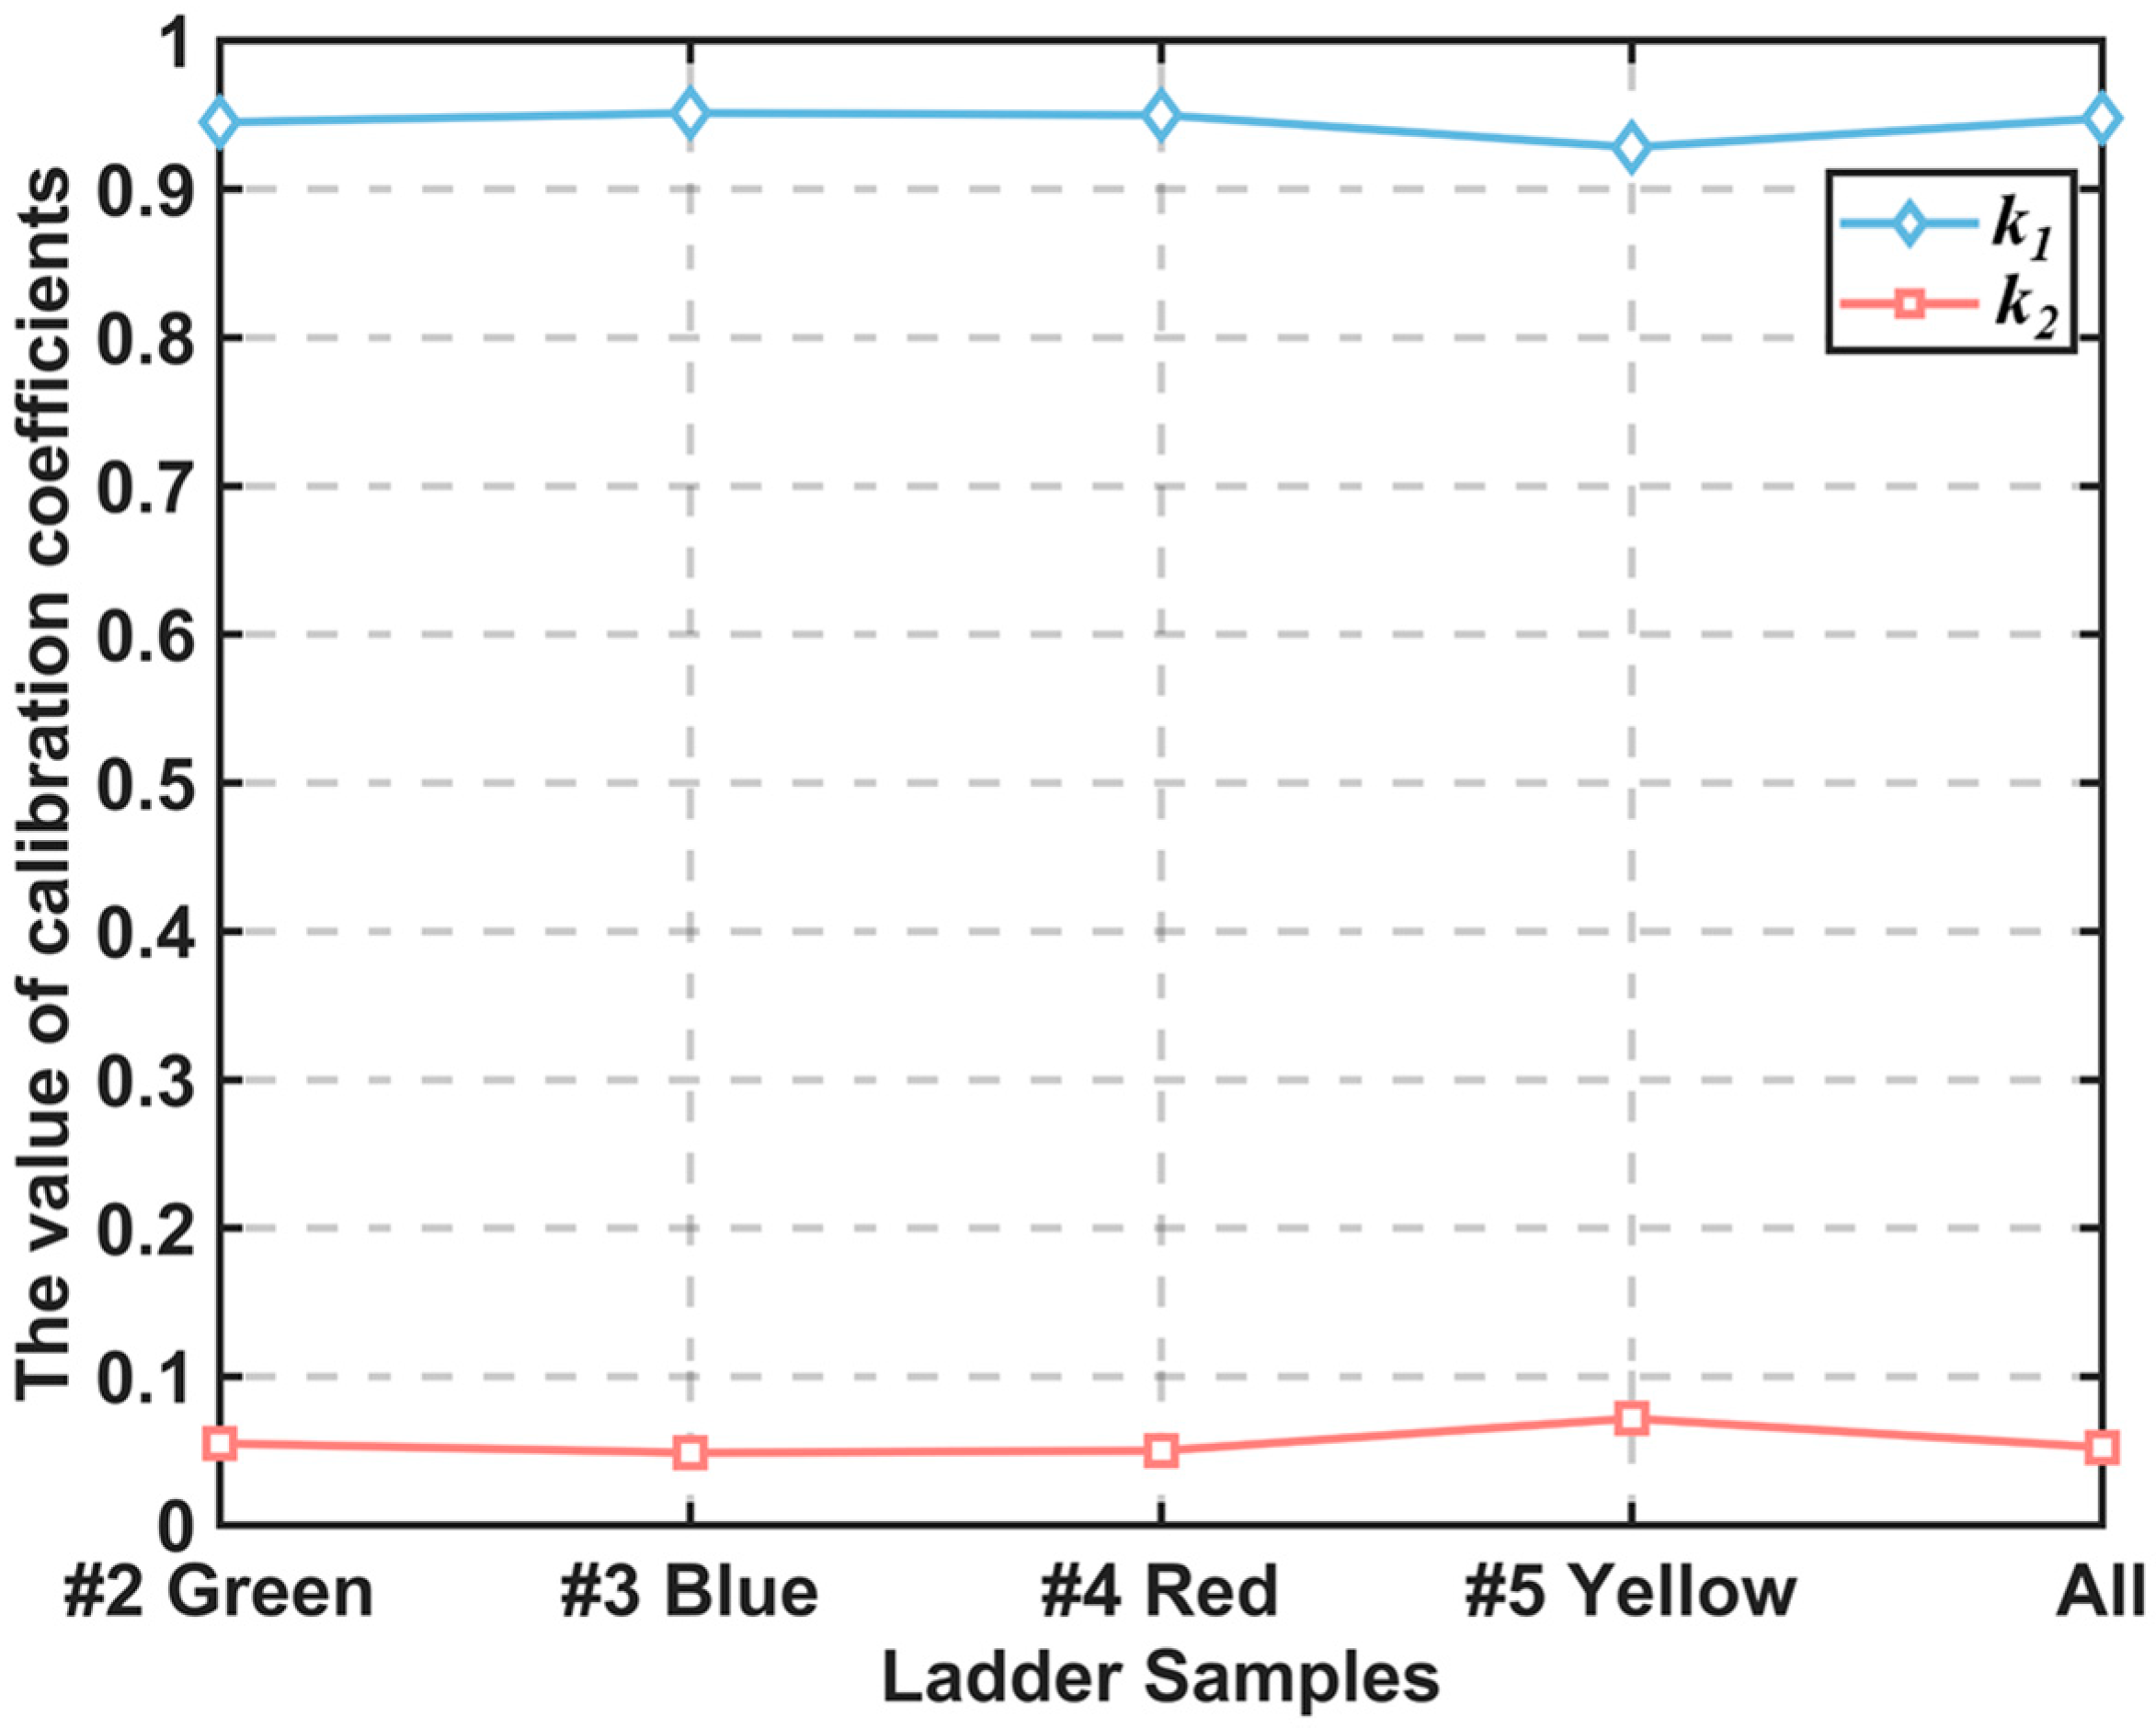
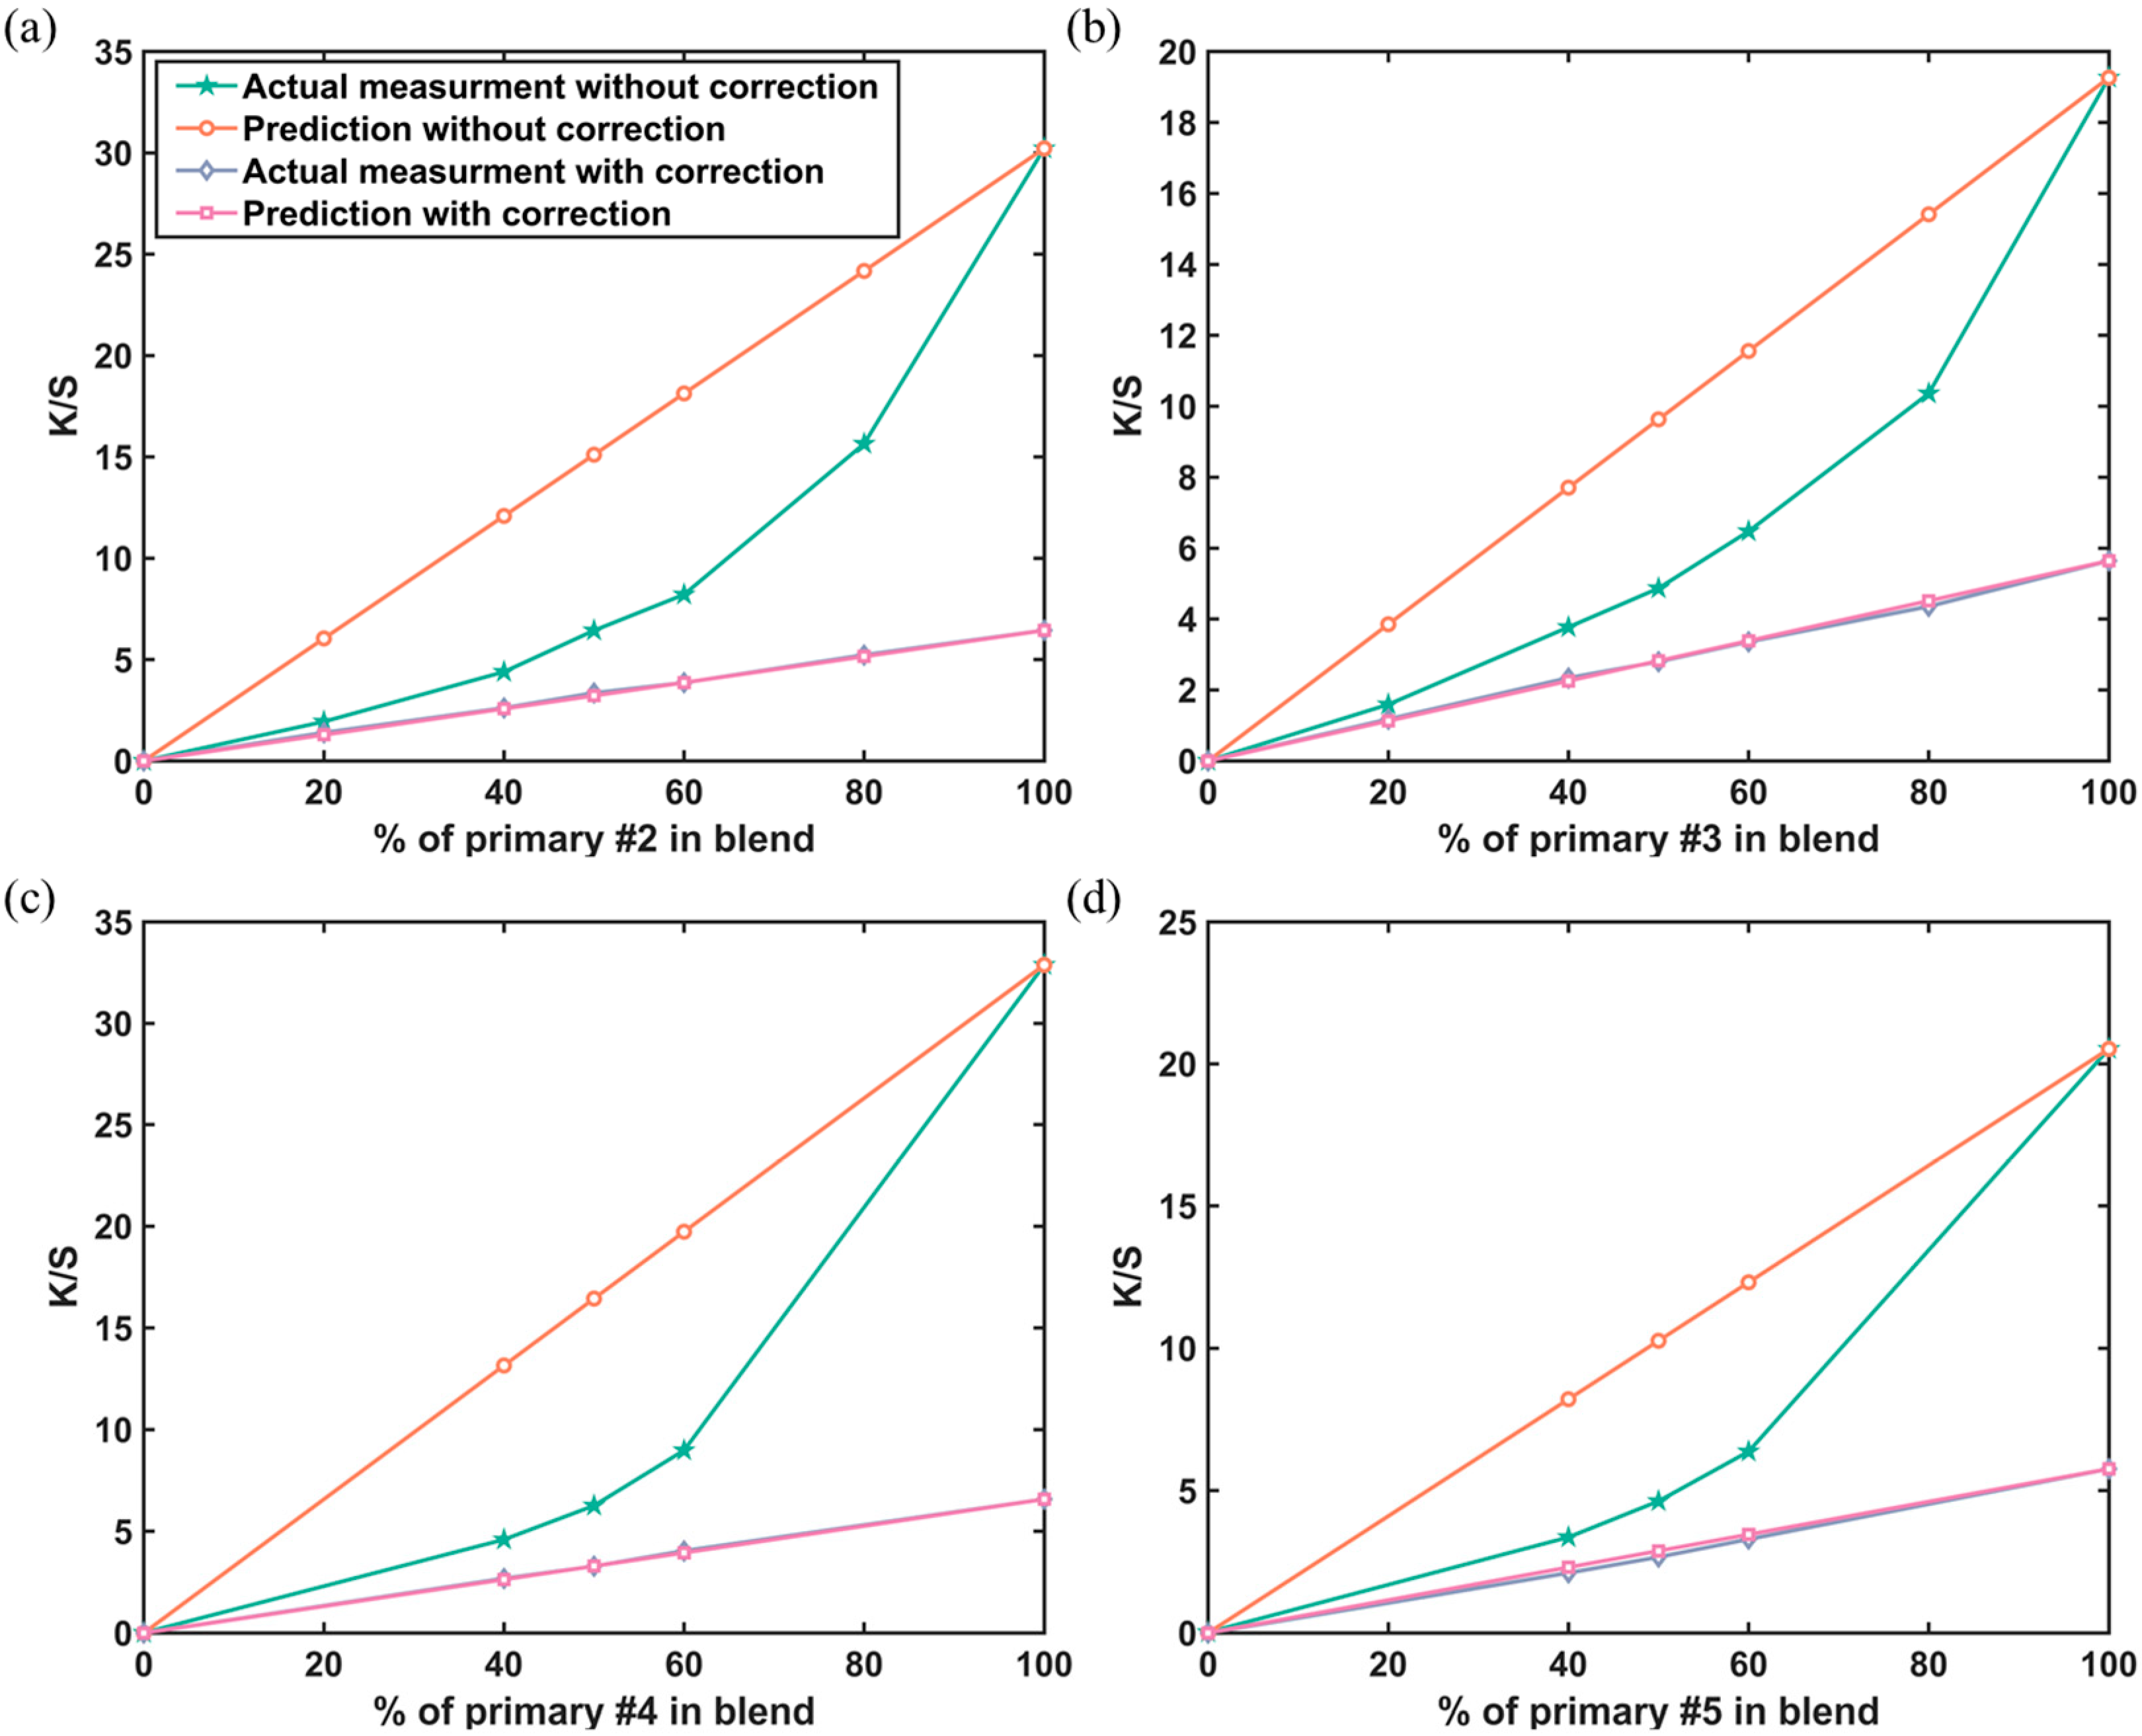
3.3. Determination of the Coefficients k1 and k2

In Section 2.2, we defined a light scattering correction equation to separate the surface reflections from KM scattering, making the single-constant KM model suitable for color prediction of fiber blends. In Equation (3), there are two calibration coefficients, k1 and k2, and their values need to be determined. Next, we determine the values of k1 and k2 experimentally.
Given that the ultimate purpose of the correction equation is to achieve the best match between the predicted spectral reflectance and the actual measured reflectance of blended samples, the calculation of k1 and k2 can be expressed as the following optimization model:
[ k ˜ 1 , k ˜ 2 ] = arg min [ k 1 , k 2 ] R b R m 2
where R b R m 2 is the objective function of the optimization model; 2 denotes 2-norm, measuring the Euclidean distance between Rb and Rm; Rm indicates the actually measured reflectance of the blends; Rb indicates the predicted reflectance of the blends. These could be calculated by Equations (3)–(7) once the recipes ci and the reflectance of the corresponding primaries Ri are known:
R b = f 1 { F 1 { i c i F [ f ( R i ) ] } }
To list the coefficients k1 and k2 in explicit form, the functions f(·) and f−1(·) are expanded, and the Equation (9) can be expressed as:
R b = { F 1 [ i c i F ( k 1 R i + k 2 ) ] k 2 } / k 1
As can be seen, the objective function contains nonlinear functions F(·) and F−1(·). In addition, considering that the spectral reflectance is between 0 and 1, the non-negative and the sum-to-one constraints should be imposed in the optimization model. Then, the optimization model shown in Equation (8) can be rewritten as:
[ k ˜ 1 , k ˜ 2 ] = arg min [ k 1 , k 2 ] { F 1 [ i c i F ( k 1 R i + k 2 ) ] k 2 } / k 1 R m 2 s u b j e c t   t o : [ k 1 , k 2 ] 0 , k 1 + k 2 = 1
Obviously, the above optimization model is a nonlinear optimization model with both a linear equality constraint and a linear inequality constraint. In this study, the interior point method [21] is adopted to solve this problem. The idea of the interior point method is to iteratively approach the optimal solution from the interior of the feasible set. When solving, the initial point is set to (1, 0) and the termination criterion is set to 1 × 10⁻⁶.
The first group of samples described in Section 3.1, labeled as No. 1 to 16, were used to calculate the coefficients k1 and k2. These samples are all binary blending samples, which are blends of primaries #2–5 and primary #1 in different proportions. They are also called ladder samples corresponding to primaries #2–5. When all samples are used to solve Equation (11), the optimal solution is k1 = 0.9477 and k2 = 0.0523. In addition, in order to compare whether the solution depends on the training samples, the ladder samples of primaries #2–5 are used for calculation. The results are shown in Table 2 and Figure 5.
It can be seen that as the training samples change, the calculation results of k1 and k2 only change slightly, indicating that they do not depend on the training samples. To further prove this inference, we took k1 = 0.9477 and k2 = 0.0523 for the light scattering correction equation (Equation (3)), and then calculated and compared the actual K/S and predicted K/S of the ladder samples before and after applying the correction. Figure 6a–d, respectively, show the calculation results of the four set of ladder samples at the maximum absorption wavelength. It is apparent that, after correction, the predicted K/S values of the four set of ladder samples are all very close to their actual measured K/S, although the coefficients k1 and k2 used are not optimal solutions for any set. The results once again show that the light scattering correction equation has good robustness.
Furthermore, what is interesting in Figure 6 is that after the correction, the K/S values of the ladder samples are linear to the percentage of the corresponding primary #2–5, which is consistent with the linear additive formula of the single-constant KM model shown in Equation (5). That is, the proposed scattering correction equation makes the single-constant KM model applicable to the fiber blended medium, demonstrating that the correction method can effectively remove the fiber surface reflections and retain the true constant KM scattering.
To further check the rationality of the scattering correction equation, the improved single-constant KM model was implemented to predict the spectral reflectance of the ladder samples, and the predicted results were compared with those of the original model without the correction. Given that the different samples showed similar results, Figure 7 only illustrates the predicted results for ladder samples of primary #2.
As shown in Figure 7, there are deviations between the predicted curves of the original single-constant KM model and the actual measured ones. It should be noticed that the deviations include both baseline shift and local slope changes, and this phenomenon is in line with the previous theoretical analysis in Section 2.2. When referring to our improved model, the predicted curves closely match the actual measured ones, indicating both of the above deviations are corrected by the light scattering correction equation as expected, that is, the light scattering correction equation is reasonable and beneficial.

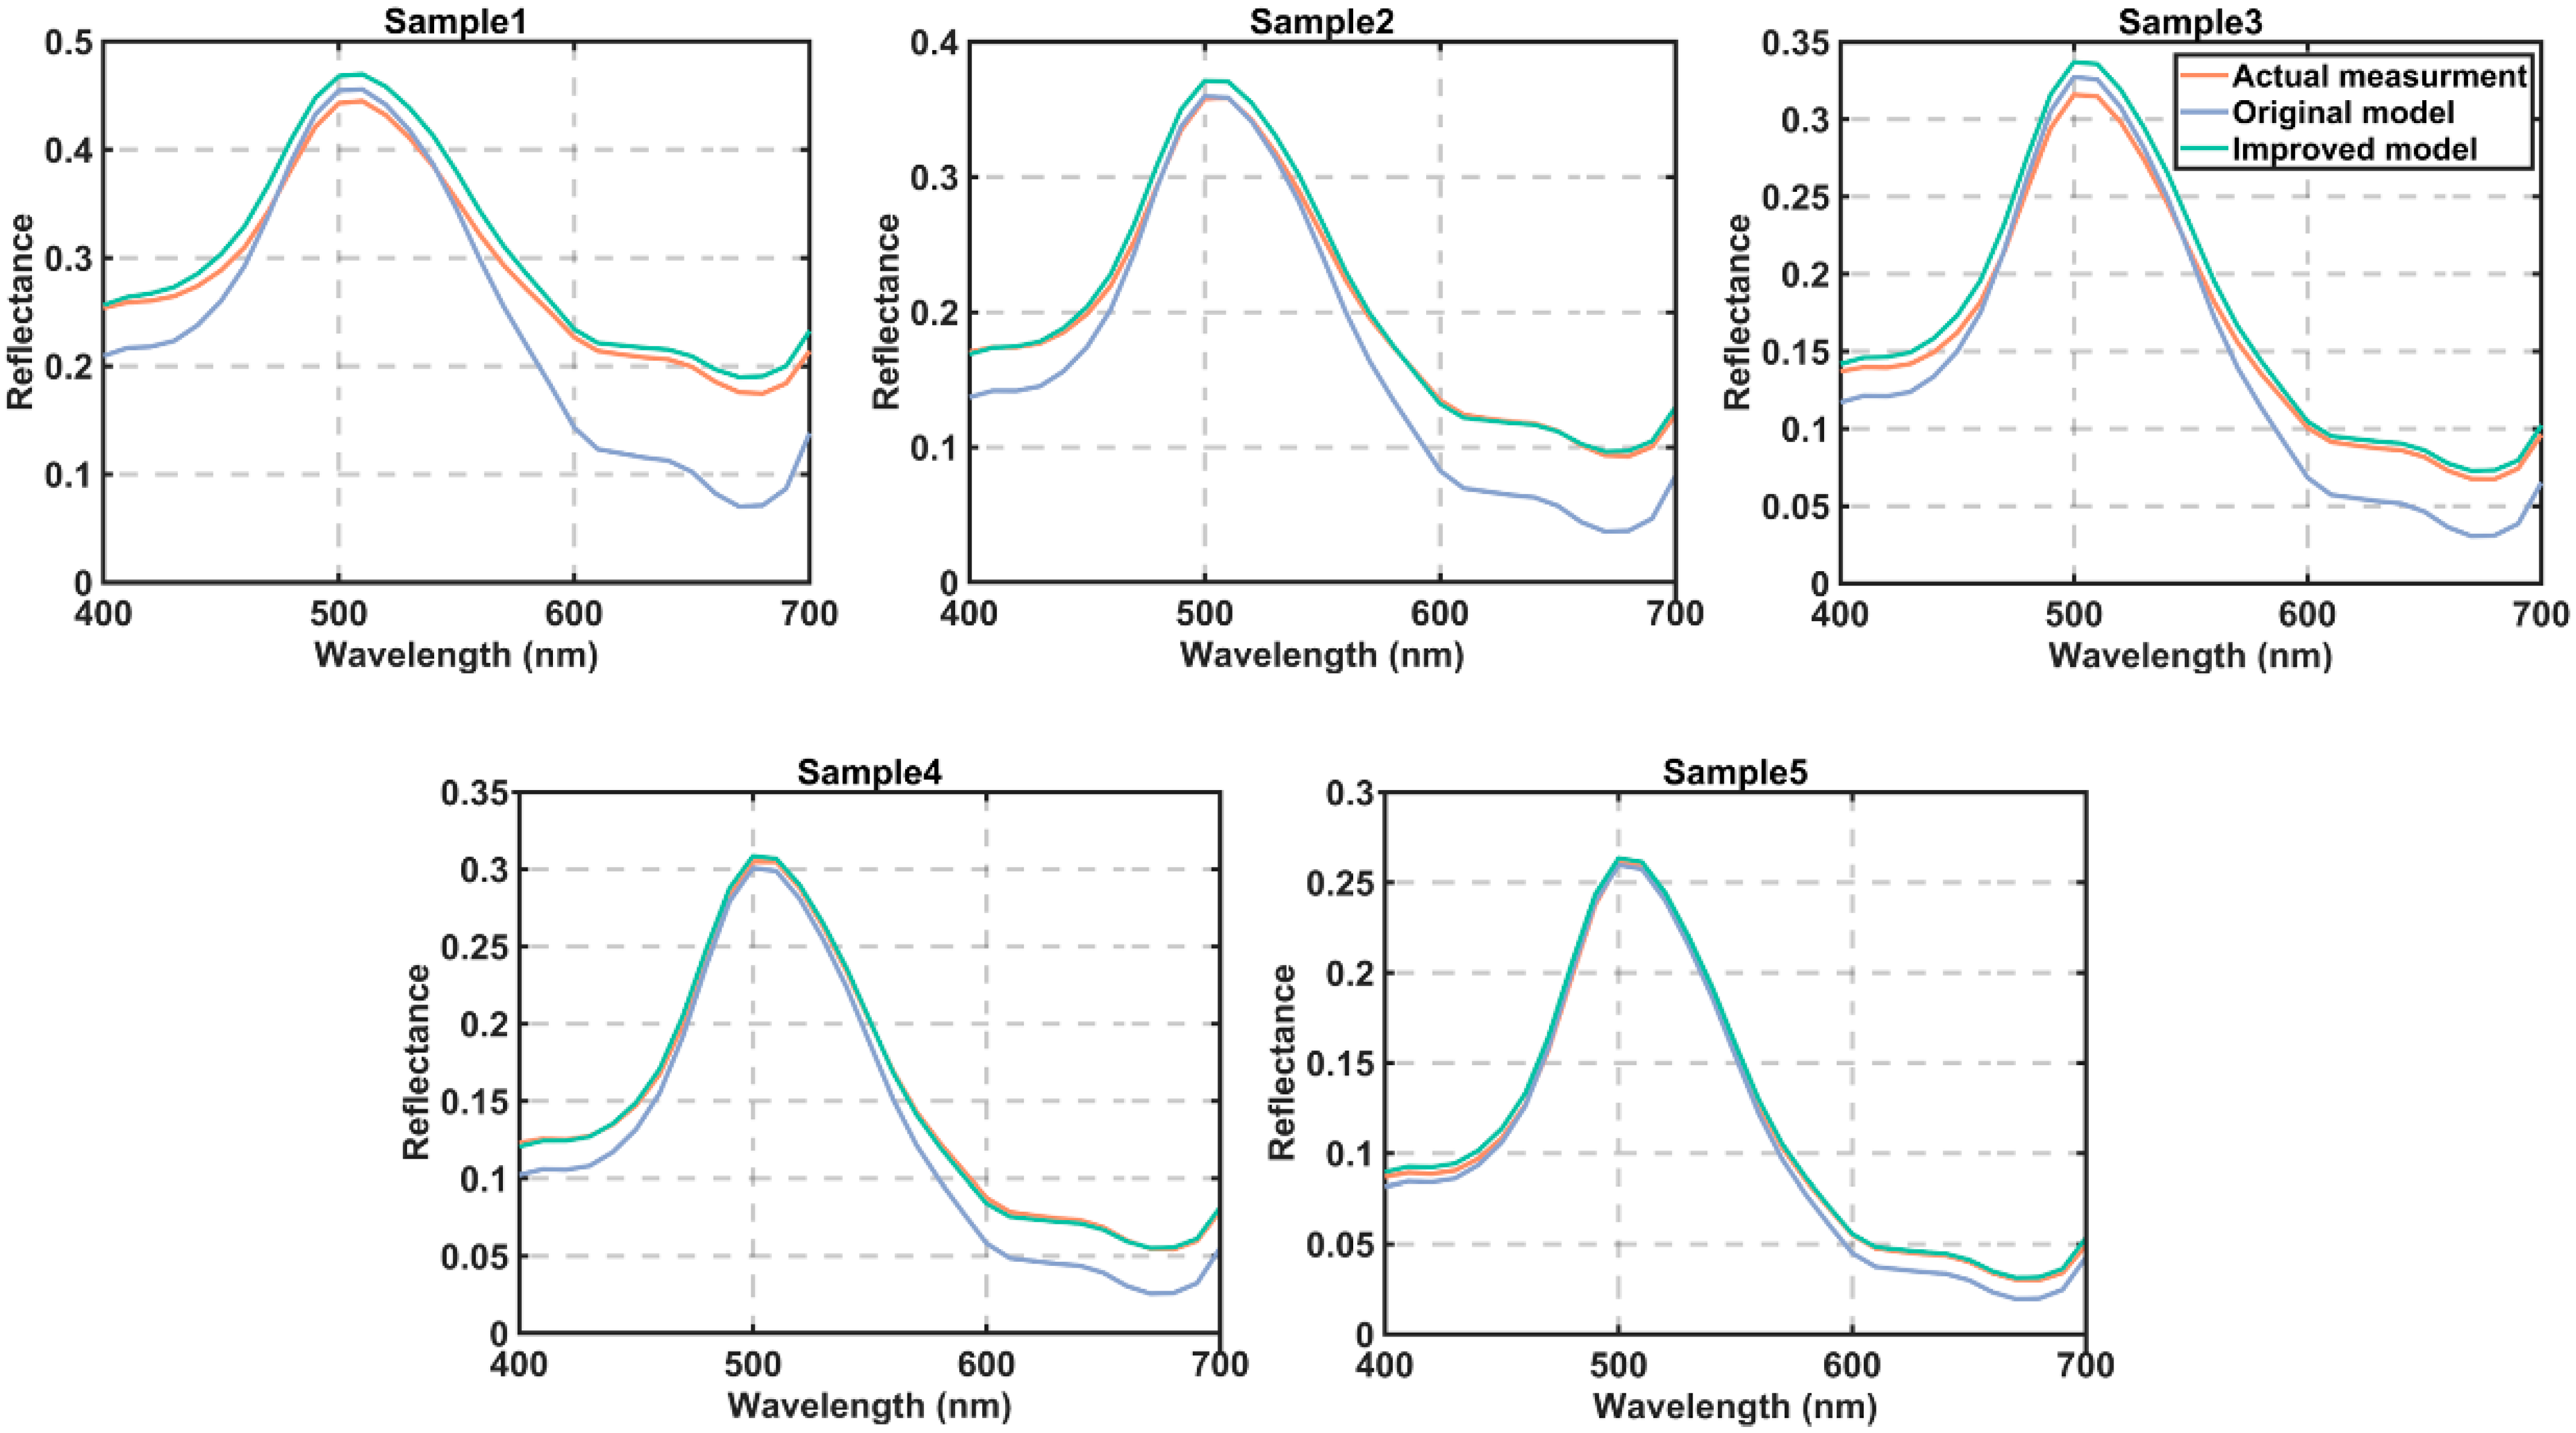
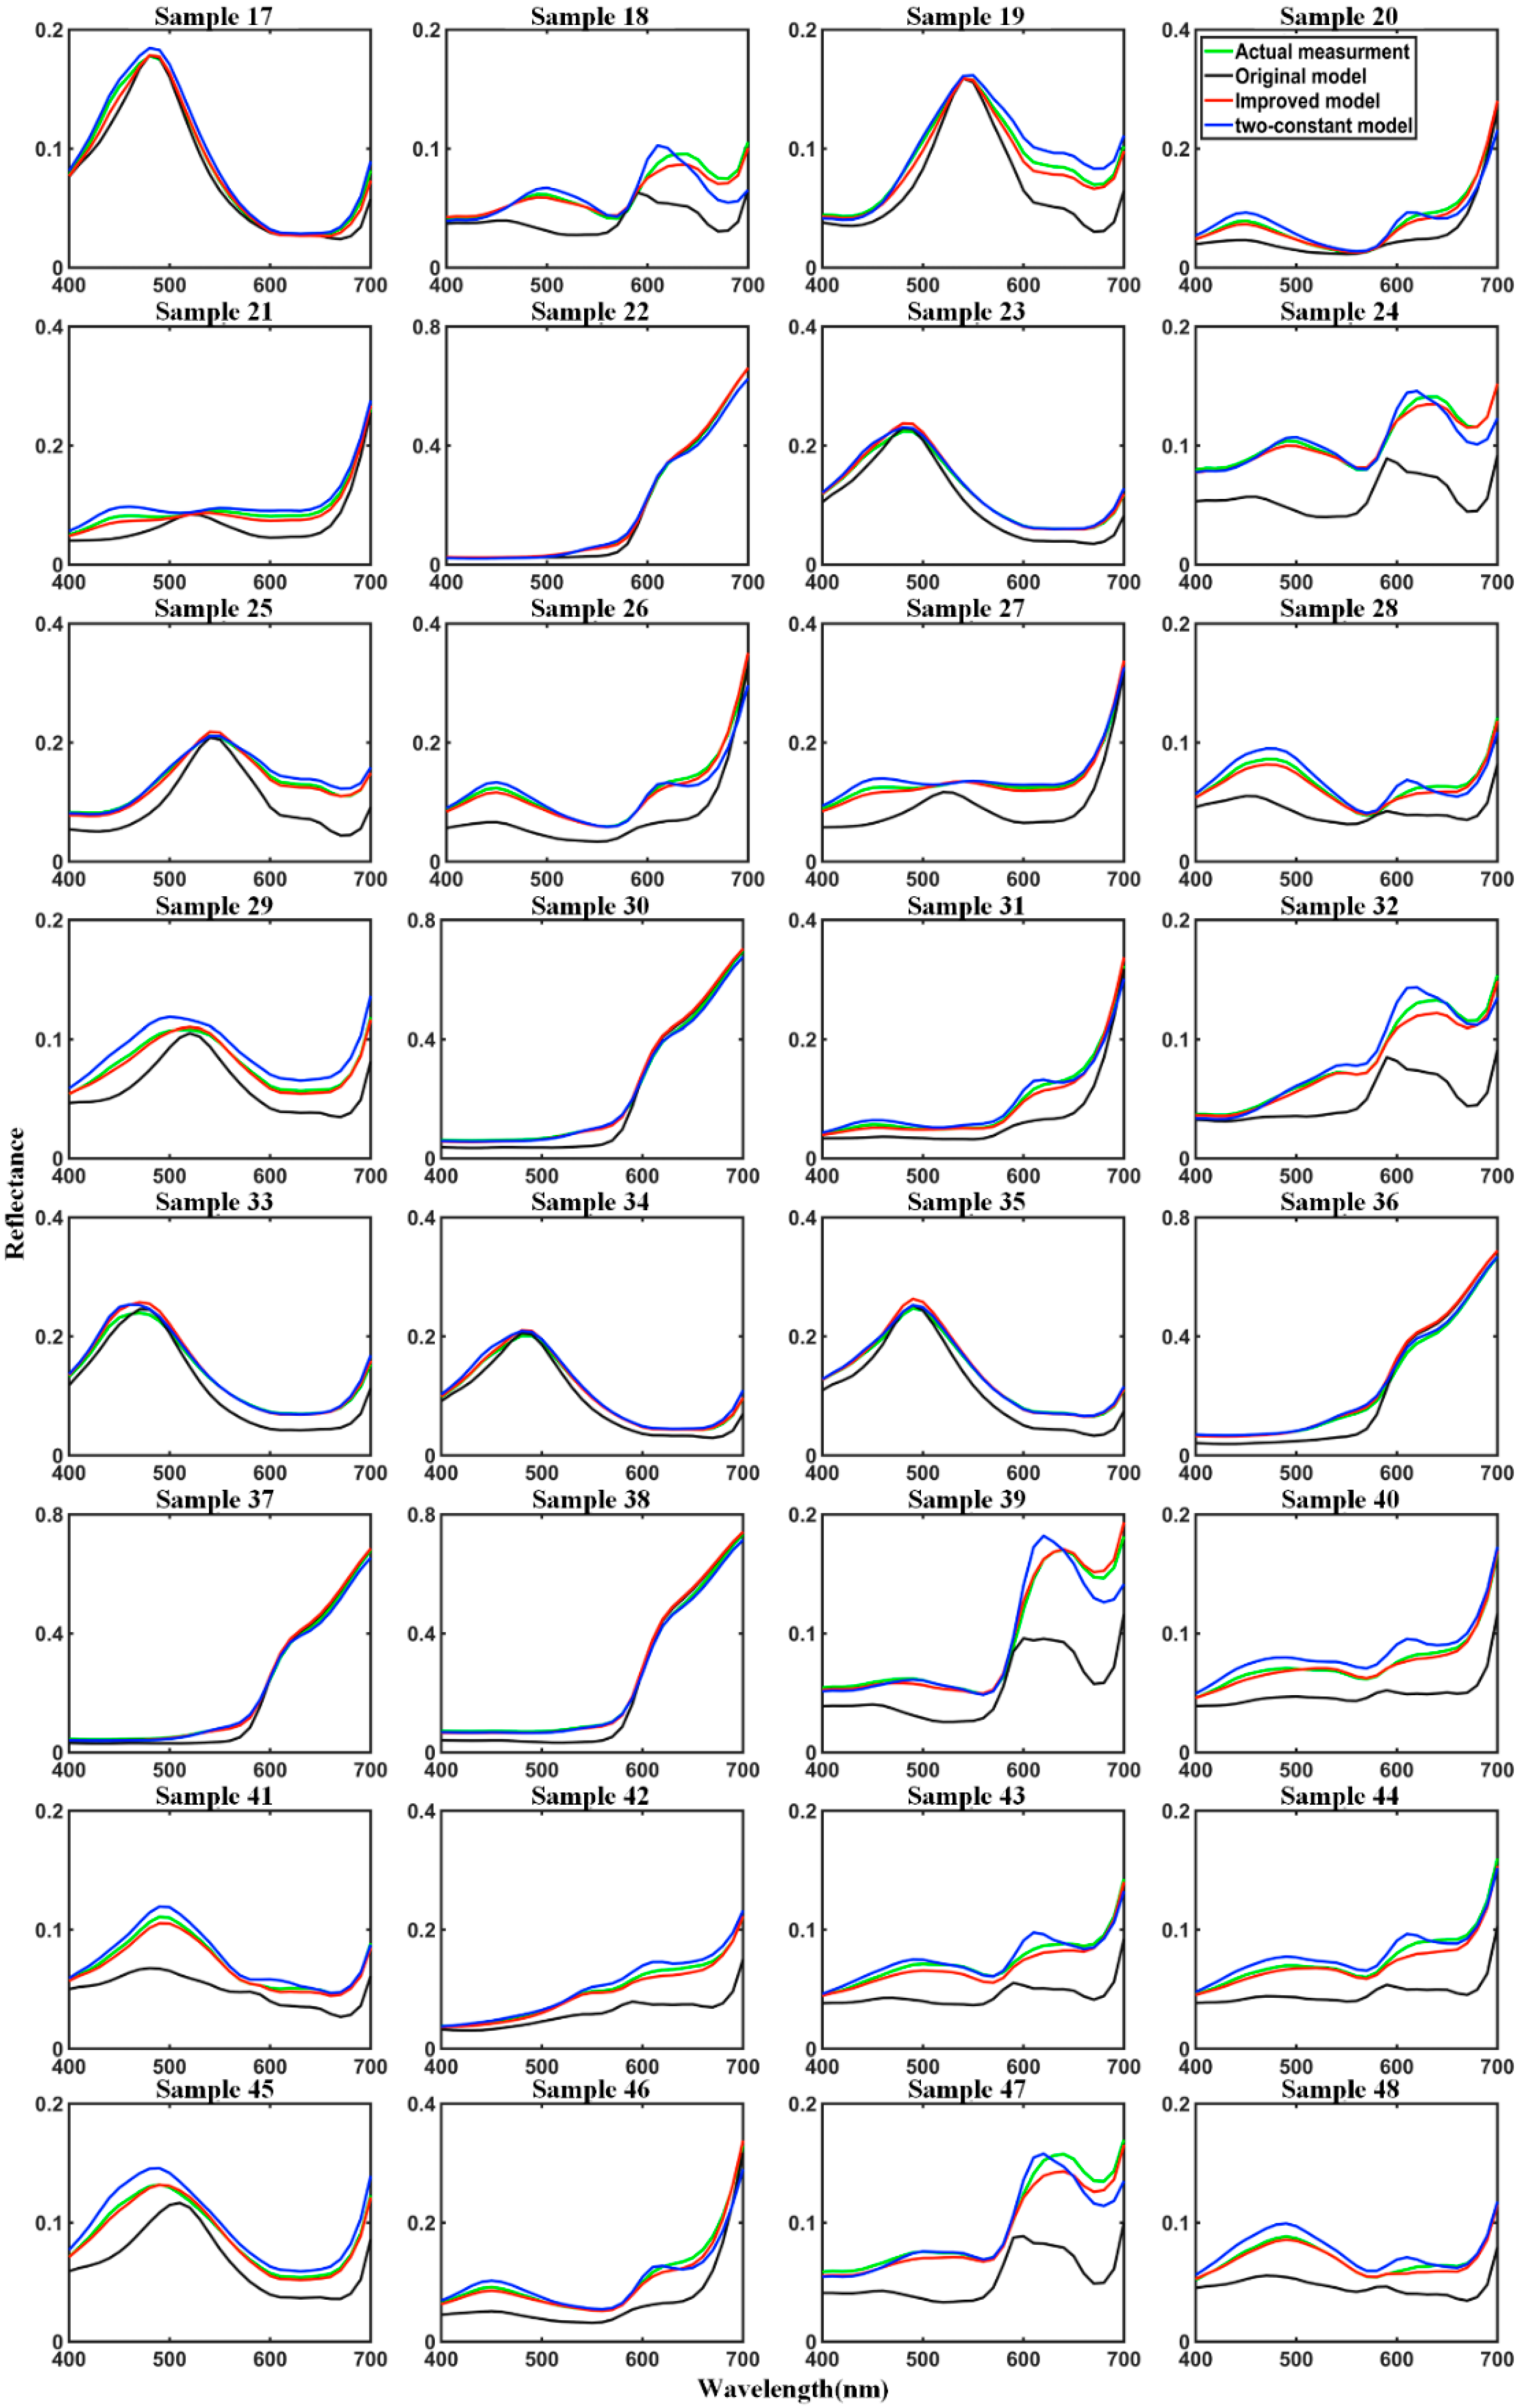
4. Results and Discussion

In this section, the second group of samples described in Section 3.1, labeled as No. 17 to 48, is used to test the color prediction performance of the improved single-constant KM model. We also compare our model against to the original single-constant KM model [12] and the two-constant KM model [9,10]. For the improved model, the coefficients of the light scattering correction equation are still k1 = 0.9477 and k2 = 0.0523. For the two-constant KM model, the absorption coefficient K and scattering coefficient S for the five primary fibers, with a total of ten unknowns, were calculated based on the linear least squares method [9,22]. To increase the confidence in the calculated values of K and S, the samples of No. 1 to 16 were used to create an overdetermined system of sixteen linearly independent equations in these ten unknowns.
The predicted spectral reflectance curves of all the 32 test samples are plotted in Figure 8. As can be seen, the curves predicted by the original single-constant KM model deviate greatly from the actual measured curves, proving that due to the existence of surface reflections of the fibers, the model is not applicable to the color prediction of fiber blends. The results are in line with the previous studies [7,8,12]. In the improved model, the light scattering correction equation was used to remove the surface reflections of fibers before application to the single-constant KM model, thereby improving the applicability of the single-constant KM model, such that the predicted curves match well to the actual measured curves. Moreover, for most samples, the curves predicted by the improved model match the actual curves even slightly better than those of the two-constant KM model.
To verify the quantitative performance for color prediction, we use four types of metrics. The ΔE2000 [23] and ΔEcmc [24] metrics measure the predicted color difference. The goodness-of-fit coefficient (GFC) [25], as in Equation (12), measures the similarity of the predicted spectral reflectance curves to the actual measured curves. The root mean square error (RMSE) [25], as in Equation (13), measures the overall error between the predicted spectral reflectance curves and the actual measured curves.
G F C = λ R ( λ ) R ^ ( λ ) λ [ R ( λ ) ] 2 λ [ R ^ ( λ ) ] 2
R M S E = R ( λ ) R ^ ( λ ) 2 2 N
where R ( λ ) and R ^ ( λ ) are the actual measured and predicted spectral reflectance, λ is the wavelength, and N is the number of wavelengths. In addition, the chromaticity values L*a*b* used to calculate the color difference ΔE2000 and ΔEcmc are calculated by integrating the spectral reflectance under the conditions of a standard illuminant D65 and CIE 1931 observer. The quantitative results are shown in Figure 9 and Table 3.
As is apparent from Figure 9 and Table 3, the four quantitative metrics obtained by the improved model show a striking improvement compared with the original model. For example, the average of ΔE2000 dropped from 6.37 to 1.20, with a decrease as high as 81%. Importantly, the improved model does not add complexity to the single-constant model since the light scattering correction equation was essentially used to pre-process the measured reflectance. While comparing the improved model with the two-constant KM model, there is no significant difference in the quantitative metrics. However, on average, the improved model is slightly better in all four quantitative metrics. In addition, the improved model does not require additional samples to solve K and S as the two-constant KM model does, so it is easier to implement. These results suggest that the improved model could provide more accurate color prediction for pre-colored fiber blends and is more practical.

5. Conclusions

In this paper, an improved single-constant KM model based on light scattering correction is proposed for color prediction of pre-colored fiber blends. A light scattering correction equation is established to remove the effects of fiber surface reflections on the KM scattering, and is used to pre-process the measured spectral reflectance in the improved single-constant KM model. The color prediction performance of the improved model was tested using 32 cotton fiber blended samples. As expected, the accuracy of the improved model was significantly better than that of the original single-constant KM model without light scattering correction. Surprisingly, the accuracy of the improved model was also slightly better than that of the two-constant KM model with higher model complexity. It can be concluded from the results that the improved model can provide more accurate color prediction for the pre-colored fiber blends and is more practical.
Although the accuracy of the improved single-constant KM model has been greatly increased, the average color differences of ΔE2000 and ΔEcmc are still greater than 1. Work is currently in progress with further correction to better control the color difference.

Author Contributions

C.-A.W.: Methodology, Investigation, Writing—original draft. M.L.: Data curation. S.L.: Writing—review and editing. D.X.: Validation. J.L.: Funding acquisition, Supervision. All authors have read and agreed to the published version of the manuscript.

Funding

This research was funded by Natural Science Foundation of Henan (No. 242300420687; No. 232300421384); Henan Provincial Science and Technology Research Project (No. 242102220034; No. 232102210177); Henan Province Higher Education Key Scientific Research Project Plan (No. 23A416008; No. 24A416003).

Institutional Review Board Statement

Not applicable.

Informed Consent Statement

Not applicable.

Data Availability Statement

The data presented in this study are available on request from the corresponding author.

Acknowledgments

The authors would like to acknowledge Guangdong Esquel Textile Co., Ltd. for providing materials.

Conflicts of Interest

The authors declare no conflicts of interest.

References

  1. Sun, X.; Xue, Y.; Liu, Y.; Zhang, G.; Liu, L.; Wang, L. Research on full color gamut mixing model constructed by CNC spinning and Stearns-Noechel color prediction method. Text. Res. J. 2023, 93, 1358–1370. [Google Scholar] [CrossRef]
  2. Yang, R.; Xu, Y.; Xie, C.; Wang, H. Kubelka-Munk double constant theory of digital rotor spun color blended yarn. Dyes Pigment. 2019, 165, 151–156. [Google Scholar] [CrossRef]
  3. Philips-Invernizzi, B.; Dupont, D.; Jolly-Desodt, A.M.; Cazé, C. Color formulation by fiber blending using the Stearns-Noechel model. Color Res. Appl. 2002, 27, 100–107. [Google Scholar] [CrossRef]
  4. Zhang, G.; Pan, R.; Zhou, J.; Wang, L.; Gao, W. Spectrophotometric color matching for pre-colored fiber blends based on a hybrid of least squares and grid search method. Text. Res. J. 2022, 92, 2569–2579. [Google Scholar] [CrossRef]
  5. Burlone, D.A. Formulation of blends of pre-colored nylon fiber. Color Res. Appl. 1983, 8, 114–120. [Google Scholar] [CrossRef]
  6. Burlone, D.A. Theoretical and practical aspects of selected fiber-blend color-formulation functions. Color Res. Appl. 1984, 9, 213–219. [Google Scholar] [CrossRef]
  7. Furferi, R.; Governi, L.; Volpe, Y. Methods for predicting spectral response of fibers blends. In Proceedings of the New Trends in Image Analysis and Processing—ICIAP 2015 Workshops: ICIAP 2015 International Workshops, Genoa, Italy, 7–8 September 2015. [Google Scholar]
  8. Wei, C.-A.; Wan, X.; Li, J. A modified single-constant Kubelka–Munk model for color prediction of pre-colored fiber blends. Cellulose 2018, 25, 2091–2102. [Google Scholar] [CrossRef]
  9. Li, J.; Xie, D.; Li, M.; Liu, S.; Wei, C.-A. Optimal learning samples for two-constant Kubelka-Munk theory to match the color of pre-colored fiber blends. Front. Neurosci. 2022, 16, 945454. [Google Scholar] [CrossRef] [PubMed]
  10. Yang, R.; He, C.; Pan, B.; Wang, Z. Color-matching model of digital rotor spinning viscose mélange yarn based on the Kubelka–Munk theory. Text. Res. J. 2022, 92, 574–584. [Google Scholar] [CrossRef]
  11. Wu, M.; Sun, X.; Lu, Z.; Chen, Y.; Zhang, Y.; Zhang, Q. Optimized combined spectral calibration model based on single-constant Kubelka–Munk theory for color prediction of pre-colored cotton fiber blends. Text. Res. J. 2024, 94, 1083–1095. [Google Scholar] [CrossRef]
  12. Wei, C.-A.; Xie, D.; Wan, X.; Liu, S.; Li, J. A novel correction method of Kubelka–Munk model for color prediction of pre-colored fiber blends. Fibers Polym. 2024, 25, 2139–2148. [Google Scholar] [CrossRef]
  13. Shen, J.; Zhou, X.; Ma, H.; Chen, W. Spectrophotometric prediction of pre-colored fiber blends with a hybrid model based on artificial neural network and Stearns-Noechel model. Text. Res. J. 2017, 87, 296–304. [Google Scholar] [CrossRef]
  14. Yang, L.; Bai, J.; Zhang, R.; Yi, D. The optimization of color-prediction models for colored cotton fiber yarns. Text. Res. J. 2019, 89, 4007–4014. [Google Scholar] [CrossRef]
  15. Sun, X.; Xue, Y.; Xu, Q.; Shen, J.; Xu, Z. Research on colored yarns for a full color phase mixing model and the Stearns–Noechel color prediction approach. Text. Res. J. 2023, 93, 206–220. [Google Scholar] [CrossRef]
  16. Philips-Invernizzi, B.; Dupont, D.; Cazé, C. Formulation of colored fiber blends from Friele’s theoretical model. Color Res. Appl. 2002, 27, 191–198. [Google Scholar] [CrossRef]
  17. Yang, R.; Zhang, K.; Wang, Z. Friele color matching model of digital rotor spinning viscose mélange fabric. Fibers Polym. 2022, 23, 1018–1023. [Google Scholar] [CrossRef]
  18. Hemingray, C.; Westland, S. A novel approach to using neural networks to predict the colour of fibre blends. Color. Technol. 2016, 132, 297–303. [Google Scholar] [CrossRef]
  19. Kubelka, P.; Munk, F. An article on optics of paint layers. Z. Tech. Phys. 1931, 12, 259–274. [Google Scholar]
  20. Yang, H.; Zhu, S.; Pan, N. On the Kubelka-Munk single-constant/two-constant theories. Text. Res. J. 2010, 80, 263–270. [Google Scholar] [CrossRef]
  21. Imre, P.; Tamás, T. Interior point methods for nonlinear optimization. In Nonlinear Optimization; Di Pillo, G., Schoen, F., Eds.; Springer: Berlin, Germany, 2010; Volume 1989, pp. 215–276. [Google Scholar]
  22. Walowit, E.; McCarthy, C.J.; Berns, R.S. An algorithm for the optimization of kubelka-munk absorption and scattering coefficients. Color Res. Appl. 1987, 12, 340–343. [Google Scholar] [CrossRef]
  23. Luo, M.R.; Cui, G.; Rigg, B. The development of the CIE 2000 colour-difference formula: CIEDE2000. Color Res. Appl. 2001, 26, 340–350. [Google Scholar] [CrossRef]
  24. Aspland, R.; Shanbhag, P. Comparison of color-difference equations for textiles: CMC (2:1) and CIEDE2000. AATCC Rev. 2004, 4, 26. [Google Scholar]
  25. Nguyen, R.M.H.; Prasad, D.K.; Brown, M.S. Training-based spectral reconstruction from a single RGB Image. In Proceedings of the Computer Vision—ECCV 2014, Zurich, Switzerland, 6–12 September 2014. [Google Scholar]
Figure 1. Coloration technology in textile production: (a) pre-colored fiber blending method; (b) traditional dyeing method.
Coatings 14 00948 g001
Figure 2. Light scattering in a pre-colored fiber blend cross-section.
Coatings 14 00948 g002
Figure 3. Five primaries used in the present study: (a) spectral reflectance; (b) chromaticity coordinates in CIE 1931 xy; (c) color images.
Coatings 14 00948 g003
Figure 4. Spectral reflectance measured in five positions with a 25 mm aperture from Sample No. 21.
Coatings 14 00948 g004
Figure 5. The optimal k1 and k2 calculated from different ladder samples.
Coatings 14 00948 g005
Figure 6. The actual K/S and predicted K/S of ladder samples before and after applying the light correction equation with k1 = 0.9477 and k2 = 0.0523: (a) ladder samples of primary #2; (b) ladder samples of primary #3; (c) ladder samples of primary #4; (d) ladder samples of primary #5.
Coatings 14 00948 g006
Figure 7. Spectral reflectance prediction results of ladder samples of primary #2.
Coatings 14 00948 g007
Figure 8. The predicted spectral reflectance curves obtained by different models.
Coatings 14 00948 g008
Figure 9. The quantitative results of color prediction. (a) ΔE2000; (b) ΔEcmc; (c) RMSE (%); (d) GFC.
Coatings 14 00948 g009
Table 1. The recipes of 48 fiber blending samples.
Sample No.Recipe (%)Sample No.Recipe (%)
#1#2#3#4#5#1#2#3#4#5
1Coatings 14 00948 i001802000025Coatings 14 00948 i00233.333.30033.3
2Coatings 14 00948 i003604000026Coatings 14 00948 i00433.3033.333.30
3Coatings 14 00948 i005505000027Coatings 14 00948 i00633.3033.3033.3
4Coatings 14 00948 i007406000028Coatings 14 00948 i008033.333.333.30
5Coatings 14 00948 i009208000029Coatings 14 00948 i010033.333.3033.3
6Coatings 14 00948 i011800200030Coatings 14 00948 i01233.30033.333.3
7Coatings 14 00948 i013600400031Coatings 14 00948 i0140033.333.333.3
8Coatings 14 00948 i015500500032Coatings 14 00948 i016033.3033.333.3
9Coatings 14 00948 i017400600033Coatings 14 00948 i01840204000
10Coatings 14 00948 i019200800034Coatings 14 00948 i02020404000
11Coatings 14 00948 i021600040035Coatings 14 00948 i02240402000
12Coatings 14 00948 i023500050036Coatings 14 00948 i02440002040
13Coatings 14 00948 i025400060037Coatings 14 00948 i02620004040
14Coatings 14 00948 i027600004038Coatings 14 00948 i02840004020
15Coatings 14 00948 i029500005039Coatings 14 00948 i03020250550
16Coatings 14 00948 i031400006040Coatings 14 00948 i032020302030
17Coatings 14 00948 i033050500041Coatings 14 00948 i034050251510
18Coatings 14 00948 i035050050042Coatings 14 00948 i036015151555
19Coatings 14 00948 i037050005043Coatings 14 00948 i038030203020
20Coatings 14 00948 i039005050 44Coatings 14 00948 i040025252525
21Coatings 14 00948 i041005005045Coatings 14 00948 i042103040020
22Coatings 14 00948 i043000505046Coatings 14 00948 i044200353510
23Coatings 14 00948 i04533.333.333.30047Coatings 14 00948 i046203004010
24Coatings 14 00948 i04733.333.3033.3048Coatings 14 00948 i048035302015
Table 2. The optimal k1 and k2 calculated from different ladder samples.
Primary#2 Green#3 Blue#4 Red#5 YellowAll
k10.94500.95130.94990.92820.9477
k20.05500.04870.05010.07180.0523
Table 3. Color prediction statistical results of four quantitative metrics.
ModelsOriginal KM ModelOur Proposed ModelTwo-Constant KM Model
Metrics
ΔE2000Avg.6.371.201.58
Max.13.002.473.57
Min.1.470.250.51
Std.2.320.540.67
ΔEcmcAvg.6.531.351.80
Max.15.752.583.81
Min.2.030.280.58
Std.2.970.620.83
RMSE (%) Avg.3.09120.57040.8541
Max.5.05982.05881.3589
Min.0.97020.23040.3581
Std.1.10010.36430.2582
GFCAvg.0.98520.99950.9978
Max.0.99911.00000.9999
Min.0.96370.99830.9843
Std.0.00980.00040.0033
Disclaimer/Publisher’s Note: The statements, opinions and data contained in all publications are solely those of the individual author(s) and contributor(s) and not of MDPI and/or the editor(s). MDPI and/or the editor(s) disclaim responsibility for any injury to people or property resulting from any ideas, methods, instructions or products referred to in the content.

