Abstract
The subject of the research is the possibility of using laser surface hardening to modify the tribological properties of ADI castings. ADI cast irons are a very progressive material; these cast irons find their application (due to their characteristic properties) in demanding applications. In these applications, the tribology of their surface is an essential parameter. This research focused on the change in tribological properties due to laser hardening of the surface layers. ADI cast iron samples processed at different isothermal holding temperatures were selected for the experiment. This is because these temperatures have a major influence on the initial structure (before laser exposure), which also affects the laser hardening process. To analyze the structural changes, metallographic examinations were performed. The microhardness was also measured on each sample in relation to the distance from the surface. The samples were also subjected to a tribological test (linear reciprocating tribometer) during which the coefficient of friction was recorded. The surface conditions after the tribological experiment were evaluated using an electron microscope. Tribological experiments revealed very different behavior of laser-hardened ADI cast iron surfaces depending on their isothermal holding temperature. At the same time, a homogeneous martensitic layer on the surface (a consequence of the relatively uniform distribution of carbon in the initial ausferritic structure) was achieved by laser, which contributed to a significant increase in hardness and wear resistance. A trend of decreasing friction coefficient as a function of isothermal holding temperature was observed for non-laser-hardened surfaces. This phenomenon supports the theory of a possible martensitic transformation of the high-carbon austenite contained in the structure of ADI castings.
1. Introduction
Graphitic cast irons have exceptional foundry properties that enable high-quality castings to be achieved. The mechanical properties of the casting, including tribological properties, are crucial parameters for many applications [1,2]. The tribology of the surface of graphitic cast irons is influenced by the graphite contained in the cast iron structure (graphite has certain lubricating effects due to its bonds in the crystal lattice). The shape of the graphitic formations is essential. Some studies [3] point out the different behavior of cast iron with graphite in the form of spheres and flakes. At the same time, however, graphite formations can act as surface heterogeneities that can initiate the formation of cracks in their surroundings [4,5,6,7]. The problem with the structure of graphitic cast irons was (and to some extent still is) relatively low mechanical properties. With the development of the process of modifying cast iron with magnesium to produce cast iron with graphite in the form of spheres, the mechanical properties have been significantly improved (cast irons with spherical graphite approach the mechanical properties of steels) [8,9]. With further efforts to improve the mechanical properties of graphitic cast irons (especially cast iron with spherical graphite), the austempering process was developed. The result of this heat treatment is ADI (Austempered Ductile Iron) or AGI (Austempered Gray Iron) [10,11].
Austempering is a very progressive heat treatment method, which can achieve several times the yield strength compared to the cast structure of the casting, while at the same time the cast iron processed in this way has relatively good tribological properties and excellent toughness [12]. Due to the combination of these mechanical properties, ADI cast irons find applications in the automotive, aerospace, and military industries [13]. Typical applications are gears, crankshafts, and camshafts. Very often these are applications where surface tribology is a major factor [14]. For this reason, it is important to focus on this issue and to consider various options for increasing the abrasion resistance of the ADI surface. One of the options may be the use of laser for surface hardening of ADI castings. This is the focus of this research. Specifically, this research focuses on the influence of the initial ausferritic structure (which is determined by the isothermal holding temperature, the influence of this temperature on the structural changes is still a matter of debate) on the surface laser hardening process. The aim is to map the structural changes after laser hardening and the change in tribological properties of the surface due to the laser treatment. Surface laser hardening has its specificities that made this method selected as a possible option to increase the wear resistance of ADI castings. A description of laser hardening (including the specific reasons for its selection) is given below. First, the process of austempering needs to be clarified.
The austempering process consists of several stages. The first phase is the austenitization of the casting; the cast iron is heated to 850–950 °C. At this temperature, the initial structure changes to austenitic. After austenitization, the casting is transferred to a salt bath at a temperature of 250–450 °C. At these temperatures, nucleation of acicular ferrite on graphite and its subsequent growth occurs. Carbon diffuses into the ferrite surroundings and the austenite is stabilized in this way. This results in a typical ausferritic structure consisting of acicular ferrite and high-carbon austenite [15,16,17,18,19]. The effect of isothermal tempering temperature is not fully understood even at present. Lower isothermal temperatures lead to higher nucleation of finer ferrite. Conversely, higher temperatures contribute to more intense diffusion, resulting in coarser ferrite and larger austenite blocks between the plates of acicular ferrite. According to the authors of [14,20,21,22,23], austenite (in the ausferritic structure of ADI) can be transformed to martensite at sufficiently high contact pressure. The authors of the studies agree that this phenomenon occurs mainly in ADI cast irons processed at higher temperatures; these cast irons contain block austenite, which is more susceptible to transformation. The transformation of austenite to martensite in the surface layers can significantly improve the surface tribology. However, this is a complicated issue on which there is no clear consensus even at present.
In this research, (due to its characteristic properties) laser surface hardening of ADI castings is tested. The laser is a powerful source of energy. When a laser is applied to the surface of a component, the heat entering the surface layers is significantly greater than the heat dissipated into the cold core. This creates a large thermal gradient. The laser action increases the surface temperature and transforms the initial structure into austenite. Subsequent movement of the laser to another location allows heat to be dissipated from its previous focusing location, thereby rapidly cooling the surface and transforming it to martensite. With induction hardening and flame hardening, the thermal gradient is not as large; additional cooling is required to harden the surface, and most commonly various water showers are used. In these methods, the shape of the burner or inductor must also follow the shape of the surface. The laser can be programmed to harden a variety of surface shapes and is also suitable for piece production. By very fast cooling of the surface during laser hardening, very fine structures with other possible specific elements can be achieved. In the case of the initial ausferritic structure, it would be possible to achieve very fine martensite (with better mechanical properties), but the question remains, for example, about the influence of carbon distribution in this initial structure [24,25,26,27].
2. Materials and Methods
The experimental part is focused on the analysis of the surface hardening of ADI (Austempered Ductile Iron) by laser and its influence on the tribological characteristics of the tested samples. The experiment thus includes the evaluation of the microstructure of the laser-hardened samples, the measurement of the hardness of the hardened layer (for each sample, the microhardness of the hardened layer was measured in relation to the distance from the surface), and the tribological analysis itself. The latter consists of testing the samples on a tribometer with linear reciprocating motion, during which the friction coefficient was recorded. This test was followed by an evaluation of the worn surfaces using scanning electron microscopy.
2.1. Tested Samples
For the experimental part, samples of ductile cast iron with nodular graphite were used; the chemical composition is shown in Table 1 (the chemical composition was analyzed by the OES method). These are samples that have an identical chemical composition but differ in isothermal holding temperature. This difference is also indicated by the marking of the samples, i.e., ‘k’-nodular graphite; the number after ‘k’ indicates the isothermal cure temperature (‘6’–60 min). The last three digits indicate the value of the isothermal cure temperature. The samples had dimensions of 40 × 30 mm2, and their thickness was 15 mm.

Table 1.
Chemical composition of the samples used (the remainder of the chemical composition consists of Fe).
2.2. Tribological Analysis
In the experimental part, laser-hardened and non-hardened surfaces of the samples were tested. It was thus possible to compare the change in their tribological properties. First, the tribological test itself was carried out on the MFT-5000 (Rtec Instruments, San Jose, CA, USA) tribometer. It is a multifunctional tribometer, so it is possible to test samples with both PIN-ON-DISC and PIN-ON-PLATE methods. The tribometer can also be equipped with high-temperature modules to allow tribological experiments to be performed at elevated temperatures. For this experiment, the PIN-ON-PLATE method without a temperature module was chosen. A hardened, chromium-alloyed steel (material-100Cr6, San Jose, CA, USA) ball with a diameter of 6.35 mm was used as PIN.
Each sample was clamped to a table that was movable relative to the PIN before testing. Subsequently, the PIN (steel ball) was clamped in a special fixture; the fixture with the clamp prevented any unwanted movement (rotation) of the PIN. For a correct measurement, it was necessary to set the fixture in a perpendicular position to the sample. Before running the test, it was necessary to clean the sample and the PIN to eliminate the influence of various contaminants that may have been present on the contact surfaces. For cleaning, isopropyl alcohol was used; cleanliness was checked visually. This was followed by setting the fixture to the initial position (using a special controller). After this step, the tribological test was started. During the experiment, the PIN was loaded with a predefined force (30 N). The PIN moved along a predefined path relative to the specimen; the distance between the movements was set to 5 mm, and the speed of movement was 5 mm/s. The baseline tribological test time was set to 30 min. However, a control measurement of 11 min was carried out at the same time. The different test lengths made it possible to observe the evolution of the surface wear as a function of time (the surface was analyzed by scanning electron microscopy). At the same time, it was possible to observe the measured values of the friction coefficient at the 10th min of the test for both types of measurements.
The friction coefficient was recorded throughout the measurement period. Since the linear reciprocating method was used, it would be possible to evaluate the static and dynamic friction coefficients. However, this option was not offered by the software of the tribometer used. Thus, the tables presented here show the average values of the friction coefficient measured during the test.
The surface condition of the samples after the tribological test was evaluated by scanning electron microscopy. To evaluate the effect of surface hardening on the tribology of cast irons, both hardened and non-hardened surfaces of the samples were analyzed, thus allowing their comparison with each other. For hardened surfaces, traces of both the 30 min and 11 min tests were imaged.
In scanning electron microscopy, imaging based on secondary electrons (specifically SEI and LEI) was used. An EDS analysis was also performed. The samples were previously cleaned of coarse impurities using compressed air.
2.3. Parameters of Laser Hardening
For the experimental part, the individual samples used were laser surface hardened. The laser hardening parameters used are shown in Table 2. The diode laser YAG laserline LDF 10,000–100 (made in Mülheim-Kärlich, Germany) was used for the experimental part; the wavelength of this laser is 940–1020 ± 10 nm. It is a laser commonly used for surface hardening of iron alloys. It has a suitable wavelength that guarantees sufficient absorption of radiation. Another factor for choosing this laser was its availability. The laser spot had the shape of a rectangle. One track (laser pass) was created on each sample. The laser power during surface hardening was 10 kW; thus, the laser power density was 62.5 W/mm2. The laser hardening parameters were chosen based on the experience of the authors of this article, the laser operator, and the literature (e.g., [28]).
Table 2.
Parameters of laser hardening.
3. Results
3.1. Microstructure of the Tested Samples
In this section, the microstructures of individual samples without laser hardening are shown. Furthermore, structural changes after surface hardening by laser are shown here. The section also includes graphical hardness dependences for a laser-hardened surface. All microstructures of the samples were obtained in the same way. First, the samples were cut on a special saw designed for the preparation of metallographic samples (this allows the samples to be separated without thermal influence on their structure). Subsequently, the samples were fixed in a special material (Bakelite). Then the samples were sanded with sandpaper of different grits; after sanding, the samples were polished and etched.
3.1.1. ADI 9k6 240
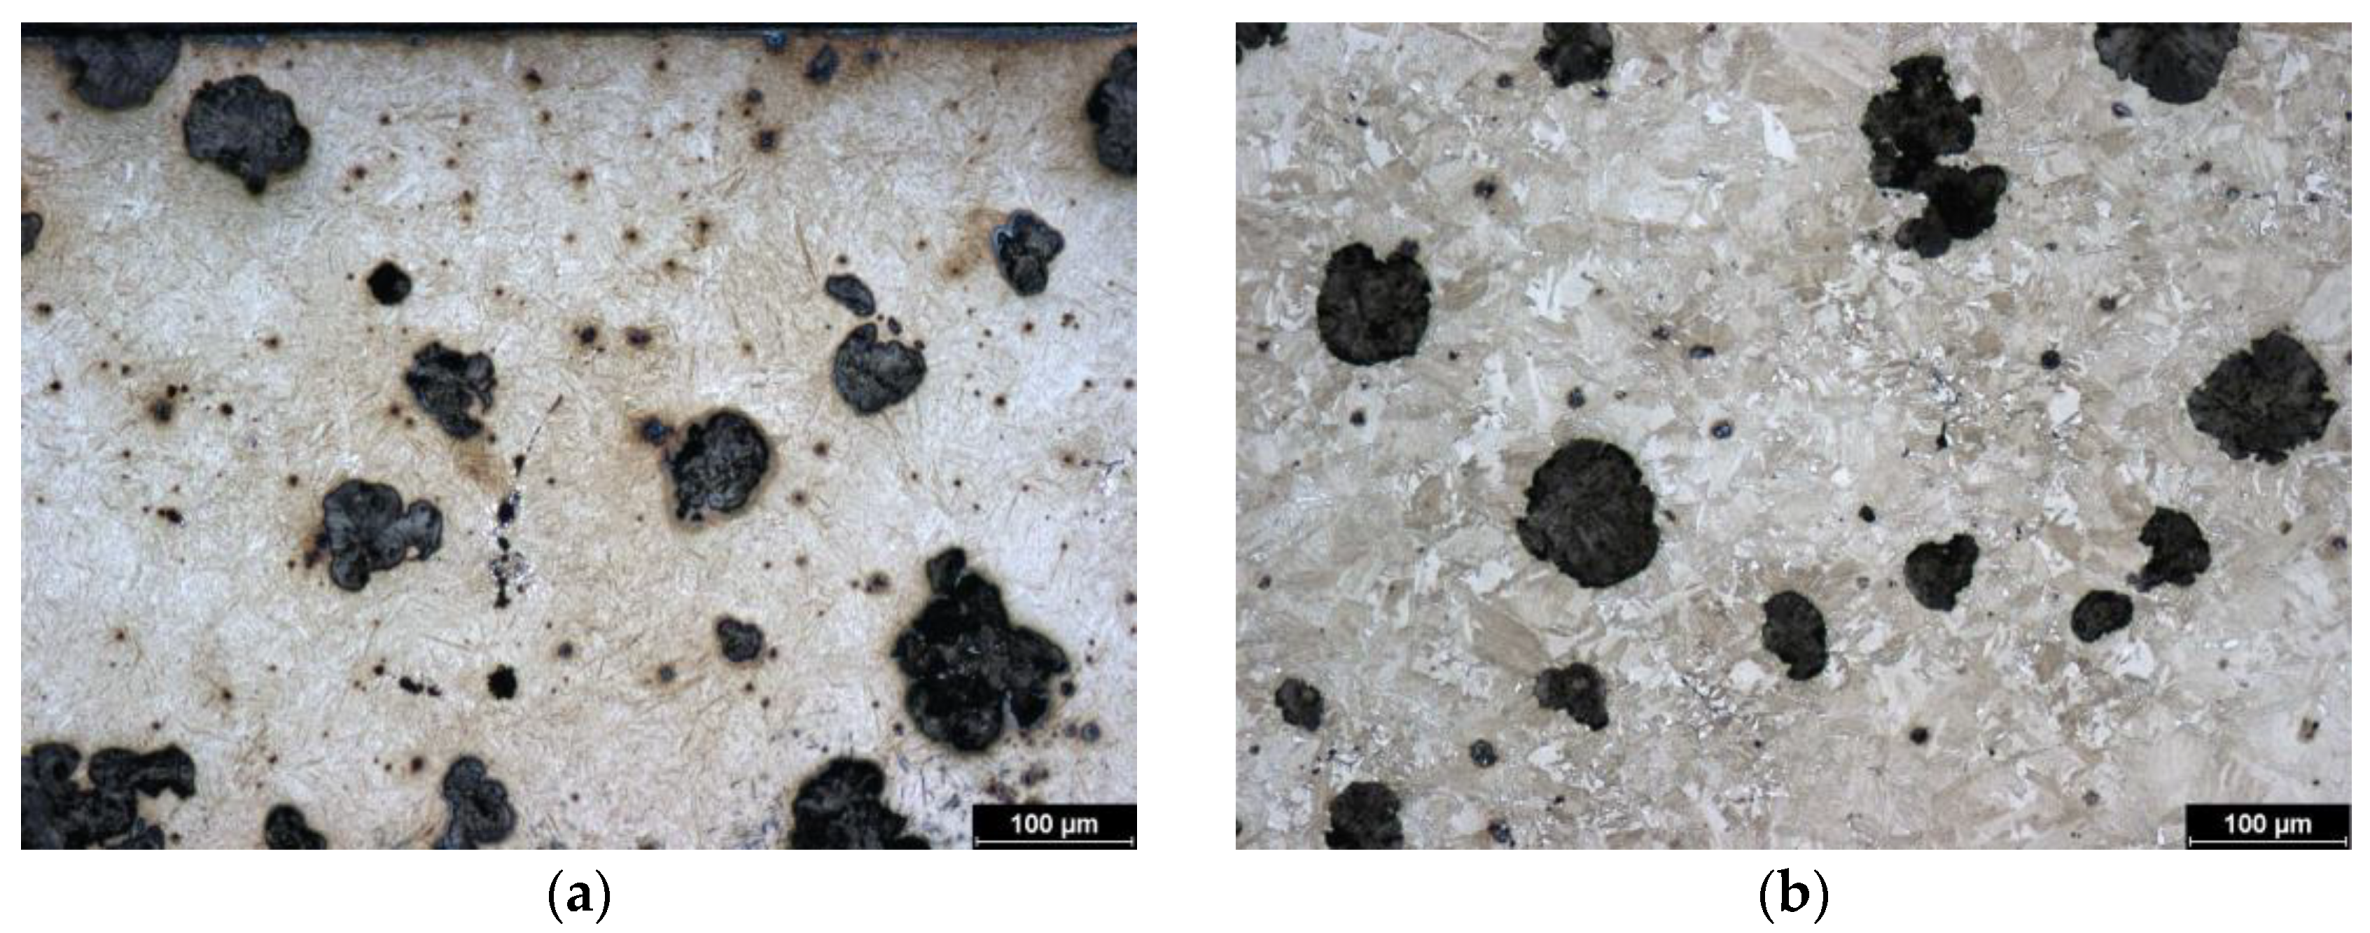
This is a sample of cast iron with spherical graphite that has been subjected to austempering, which is why it is referred to as ADI (Austempered Ductile Iron). This sample was heat treated at the lowest isothermal holding temperature (240 °C) of all the samples tested. Therefore, the initial structure of the sample is the finest. The structure consists of bainite, fine plates of acicular ferrite, and high-carbon austenite. However, this austenite does not form blocks but rather is in the form of a thin film. Figure 1b represents the initial (non-hardened) structure. Images were taken with a metallographic microscope.
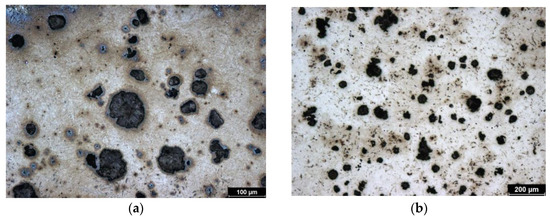
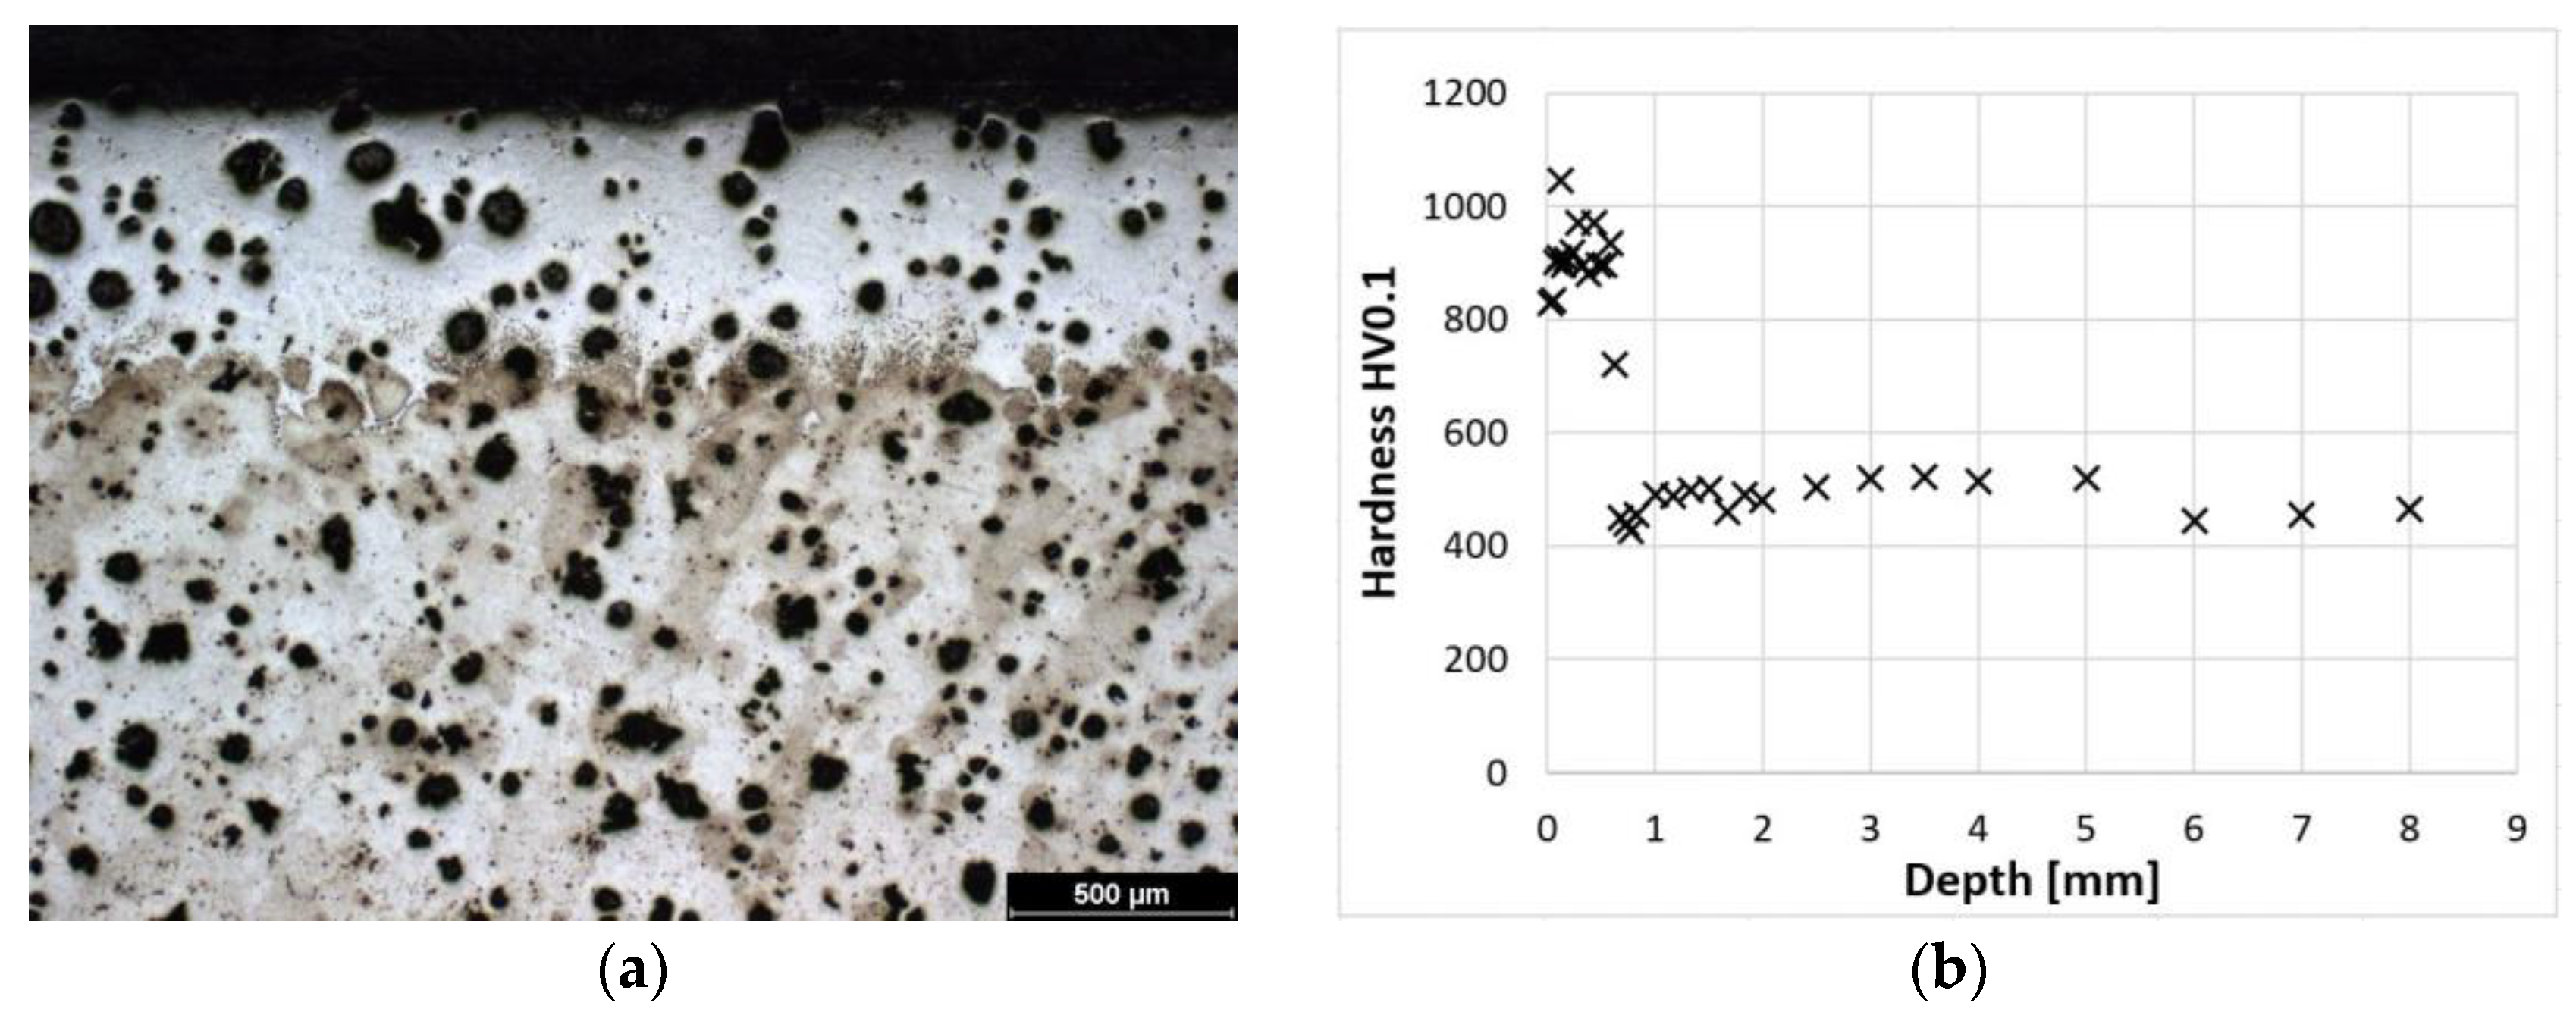
Figure 1.
Microstructure of ADI 9k6 240; (a) Detail of the structure of the laser-hardened surface of ADI 9k6 240; (b) Structure of the laser non-hardened core of the ADI 9K6 240 cast iron sample.
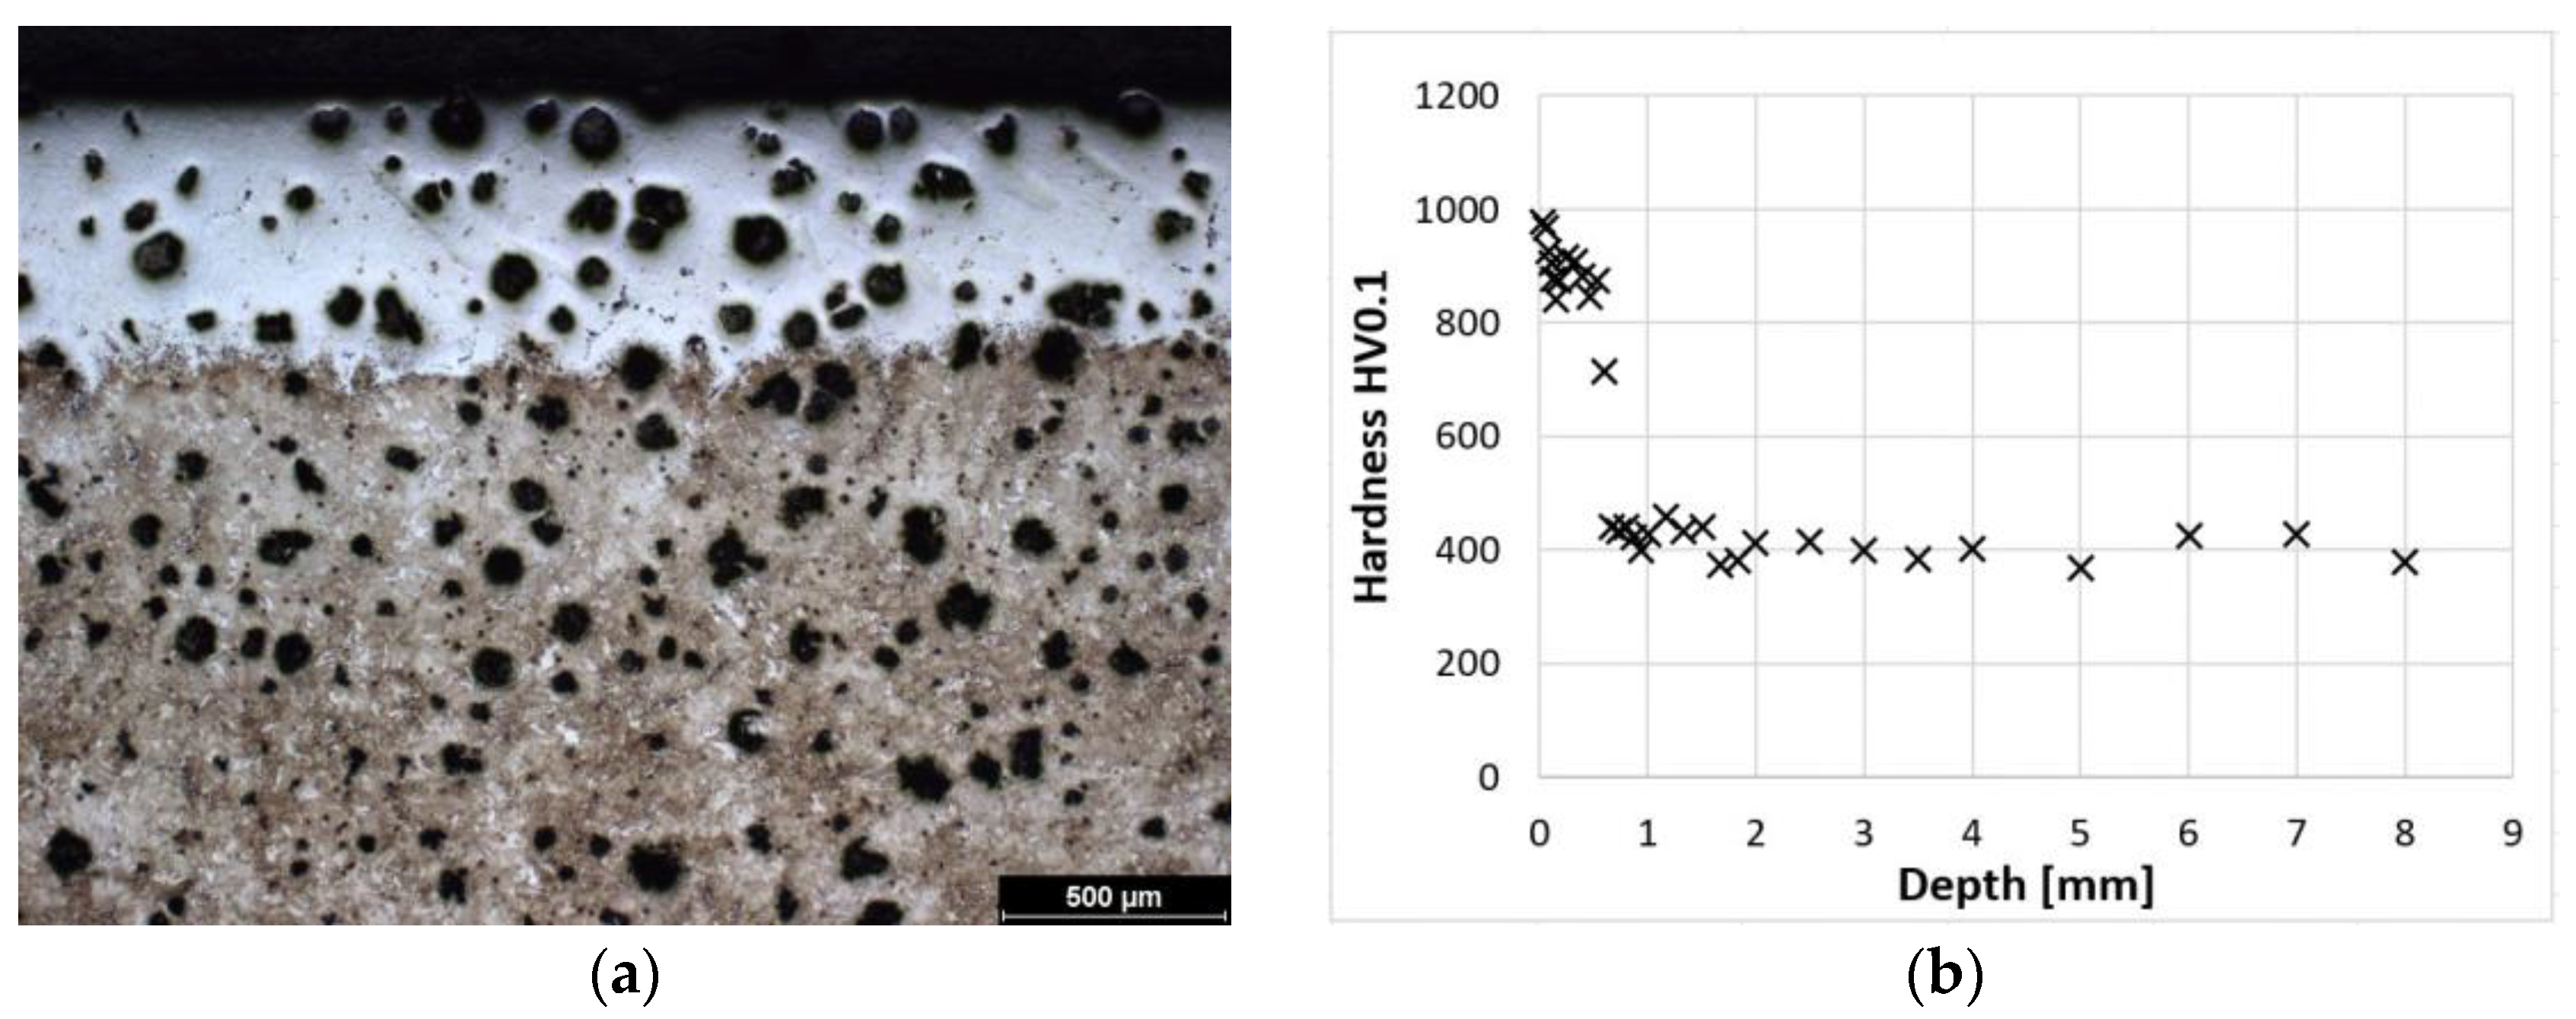
Figure 2a shows the microstructure of a laser-hardened surface. A detail of this laser-hardened structure is shown in Figure 1a. It can be seen from these photographs that the structure is predominantly composed of fine martensite and residual austenite (to a depth of approximately 0.5 mm). Figure 2b shows the dependence of hardness on distance from the surface. From these values, it can be seen that at the surface, the sample reaches a hardness of 900–1000 HV0.1. The microstructure of the hardened surface shows that the proportion of coarser martensite increases with increasing distance from the surface. The hardness of the cast iron decreases gradually to a depth of about 0.8 mm, where it stabilizes at the hardness values of the austempered cast iron itself.
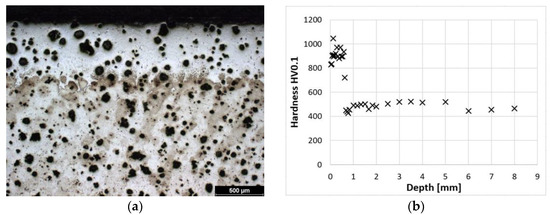
Figure 2.
ADI 9k6 240; (a) Structure of the laser-hardened surface of ADI 9k6 240; (b) Dependence of hardness on the distance from the ADI 9k6 240 surface.
3.1.2. ADI 9k6 310
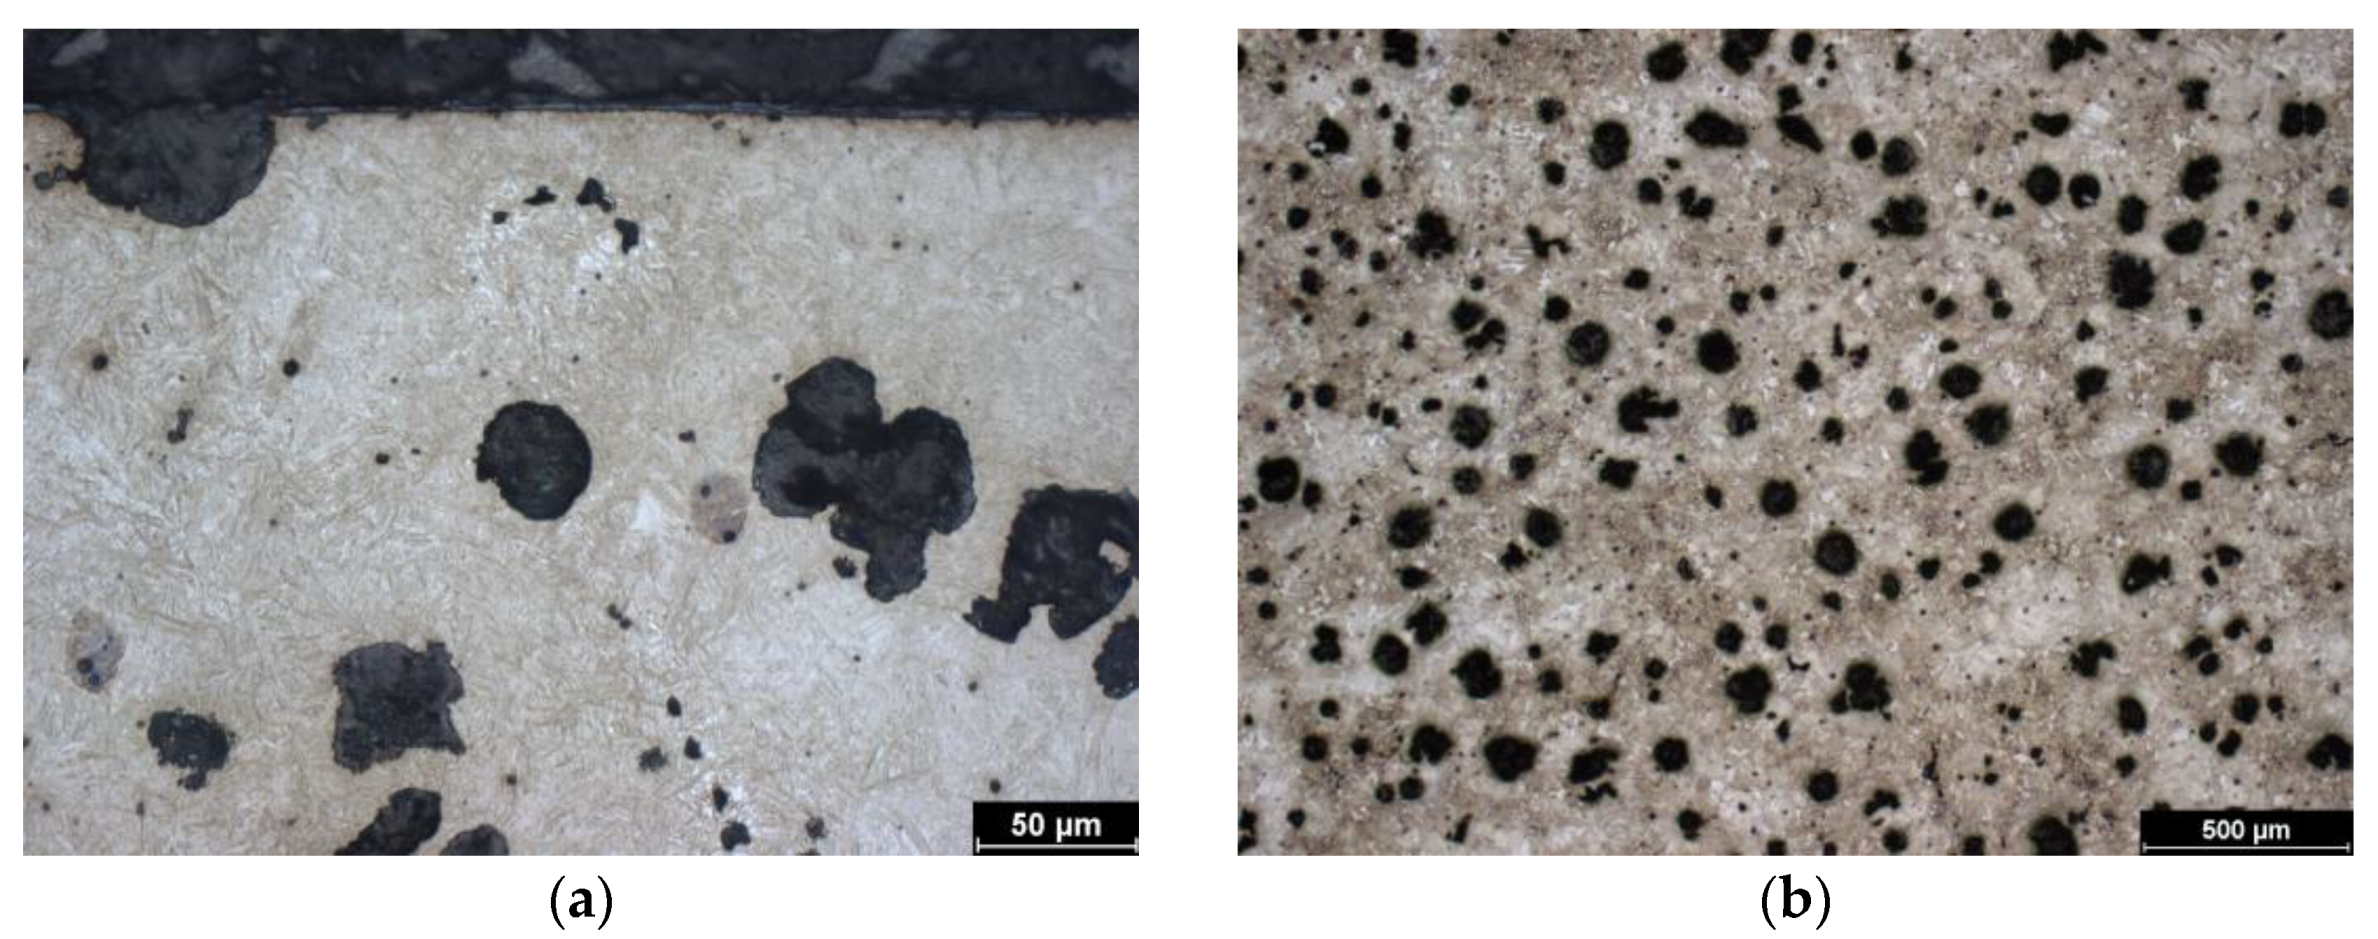
Similar to the previous sample, the starting material is austempered cast iron with spheroidal graphite. The isothermal holding temperature for this sample was 310 °C, which is an intermediate value compared to the other two samples. This is consistent with the structure. Due to the heat treatment, it is again composed of bainite, acicular ferrite, and high-carbon austenite. Due to the higher isothermal holding temperature (than in the previous case), the ferrite is coarser and the high-carbon austenite forms more bulky blocks. The initial structure is shown in the image of the unhardened core (Figure 3b).

Figure 3.
Microstructure of ADI 9k6 310; (a) Detail of the structure of the laser-hardened surface of ADI 9k6 310; (b) Structure of the laser non-hardened core of the ADI 9K6 310 cast iron sample.
Figure 4a shows the laser-hardened surface of the cast iron; a detail of the structure of the hardened layer is shown in Figure 3a. This laser-hardened layer is again composed of martensite and some residual austenite. However, when compared with the previous sample, it is noticeable that in this case, the martensite is coarser. Figure 4b shows a graphical dependence of the hardness versus distance from the surface. The coarser martensite contributes to the gradual decrease in hardness, and its proportion increases with distance from the surface. The hardness values are steady at the hardness of the initial cast iron structure. The course of hardness is very similar to the previous sample. Some of the significantly different hardness values are due to indentation in the graphite.
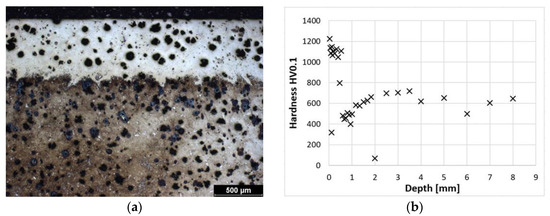
Figure 4.
ADI 9k6 310; (a) Structure of the laser-hardened surface of ADI 9k6 310; (b) Dependence of hardness on the distance from the ADI 9k6 310 surface.
3.1.3. ADI 9k6 400
The starting material is identical to the previous samples (austempered cast iron with spheroidal graphite). This sample was subjected to the highest isothermal heat treatment temperature of all the tested samples (400 °C). The relatively high temperature contributed to the creation of a coarser structure (compared to the previous samples); the initial microstructure (before the laser treatment) is shown in Figure 5b. The structure of the cast iron prior to laser surface hardening is again composed of bainite, acicular ferrite, and high-carbon austenite. The higher isothermal holding temperature contributed to the formation of block austenite; such austenite can transform to martensite under certain conditions. This phenomenon may affect the results of the tribological laser test of the non-hardened surface (as described earlier in this article).

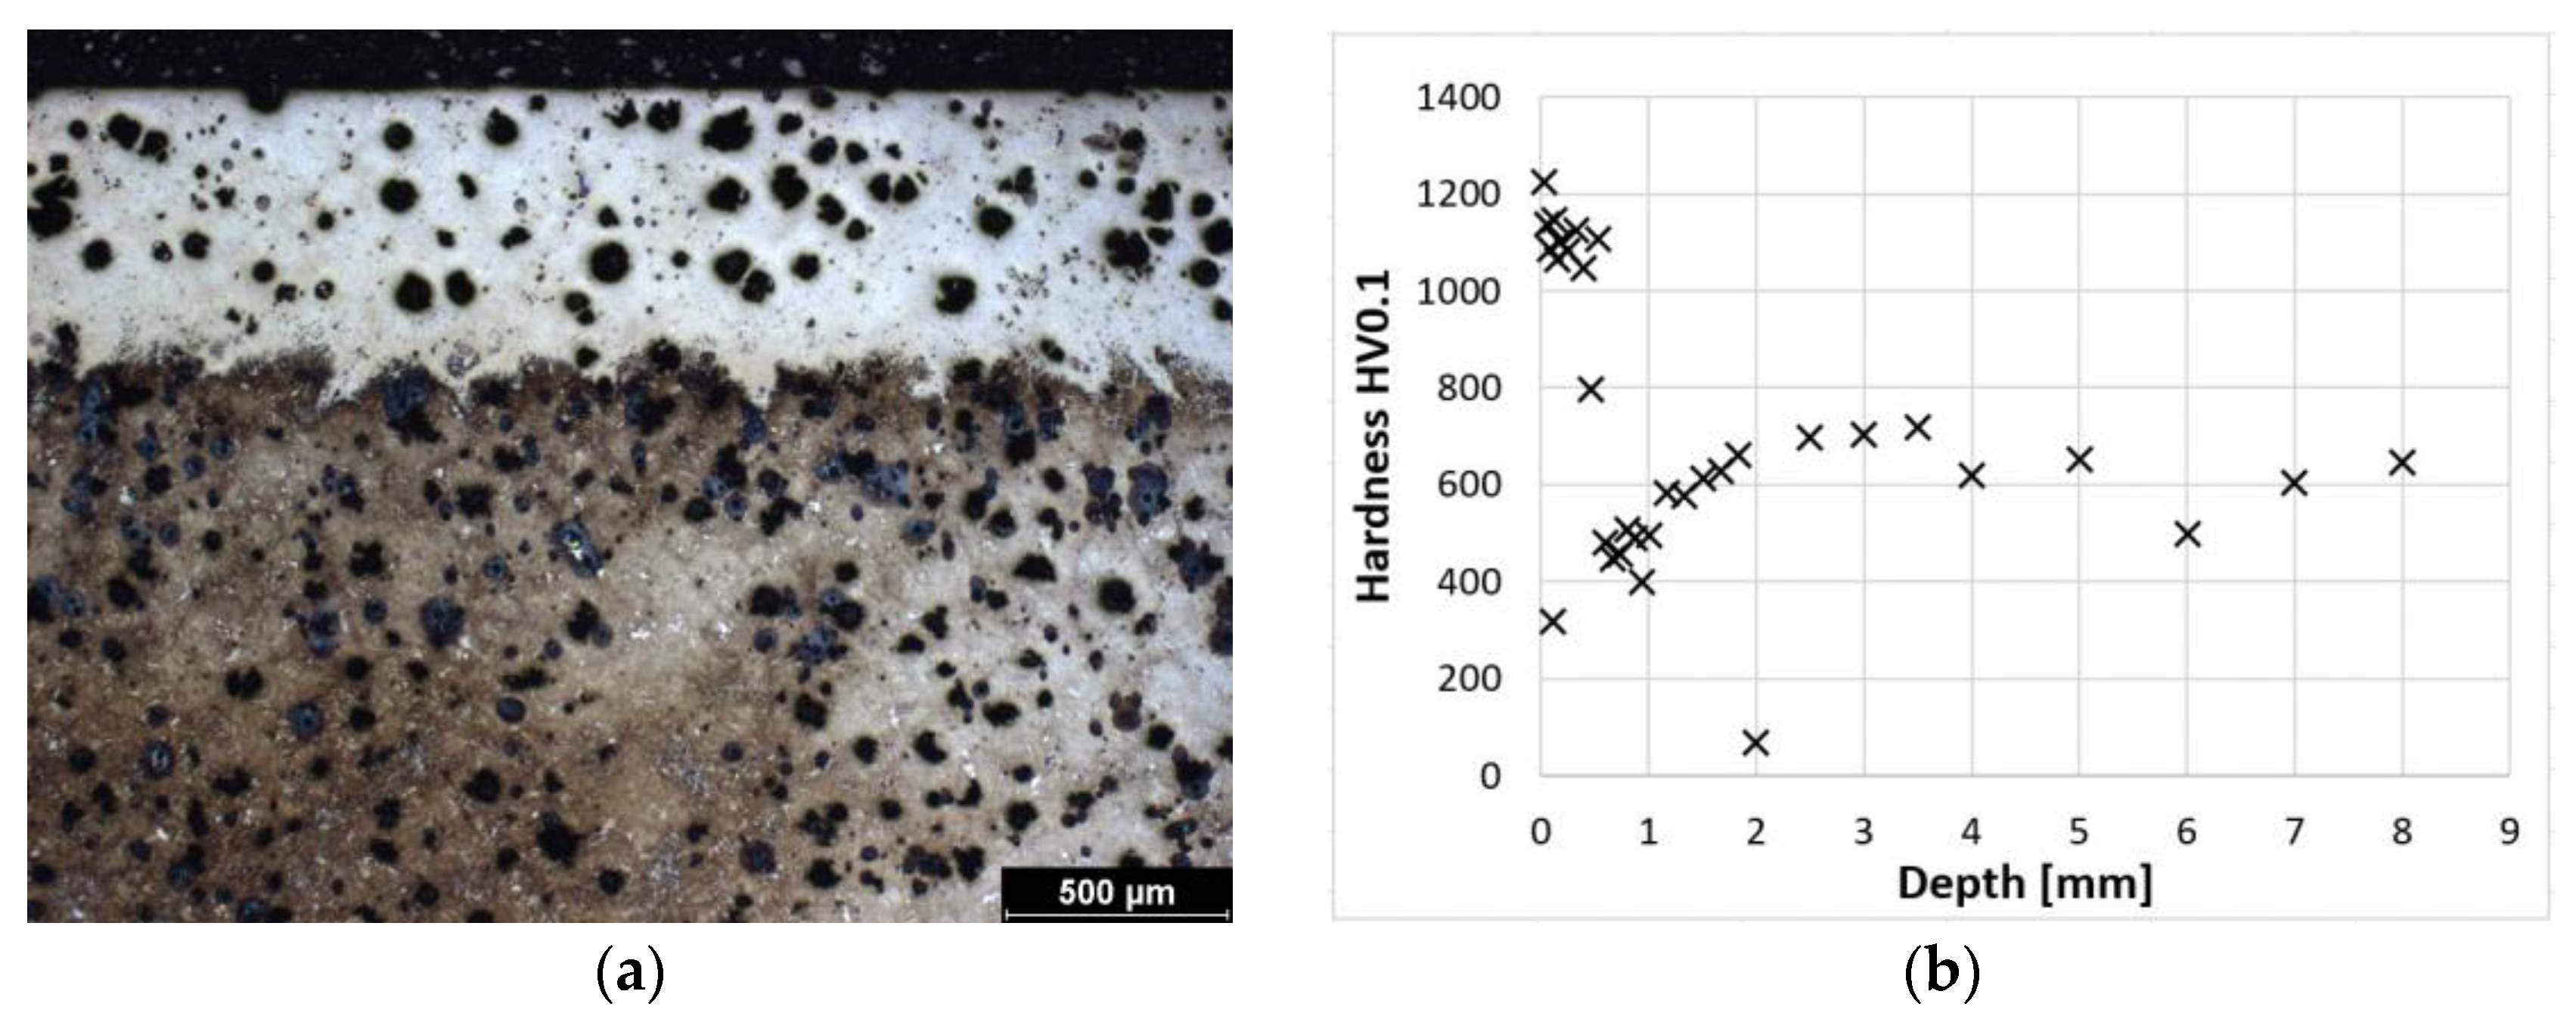
Figure 5.
Microstructure of ADI 9k6 400; (a) Detail of the structure of the laser-hardened surface of ADI 9k6 400; (b) Structure of the laser non-hardened core of the ADI 9K6 400 cast iron sample.
Figure 6a shows the laser-hardened surface of a sample of ADI 9k6 400 cast iron. The detail of this hardened structure is then shown by metallographic etching (Figure 5a). This hardened layer is composed of martensite and residual austenite, similar to the previous samples. The depth of the hardened layer is also very similar to the previous samples. At the surface, the layer is composed of relatively fine martensite (mainly to a depth of about 0.5 mm); then there is again a transition zone with coarser martensite, which leads to a decrease in hardness. The dependence of hardness on distance from the surface is shown in Figure 6b. The actual pattern is again very similar to the previously mentioned samples.

Figure 6.
ADI 9k6 400; (a) Structure of the laser-hardened surface of ADI 9k6 400; (b) Dependence of hardness on the distance from the ADI 9k6 400 surface.
3.2. Results of Tribological Analysis
This section records the values of the friction coefficient for each specimen tested. At the same time, tables with the resulting average values of the friction coefficient for the respective samples are given. This section also includes the evaluation of the wear test surfaces. These surfaces were analyzed by electron microscopy.
3.2.1. Progress of the ADI 9k6 240 Tribological Test
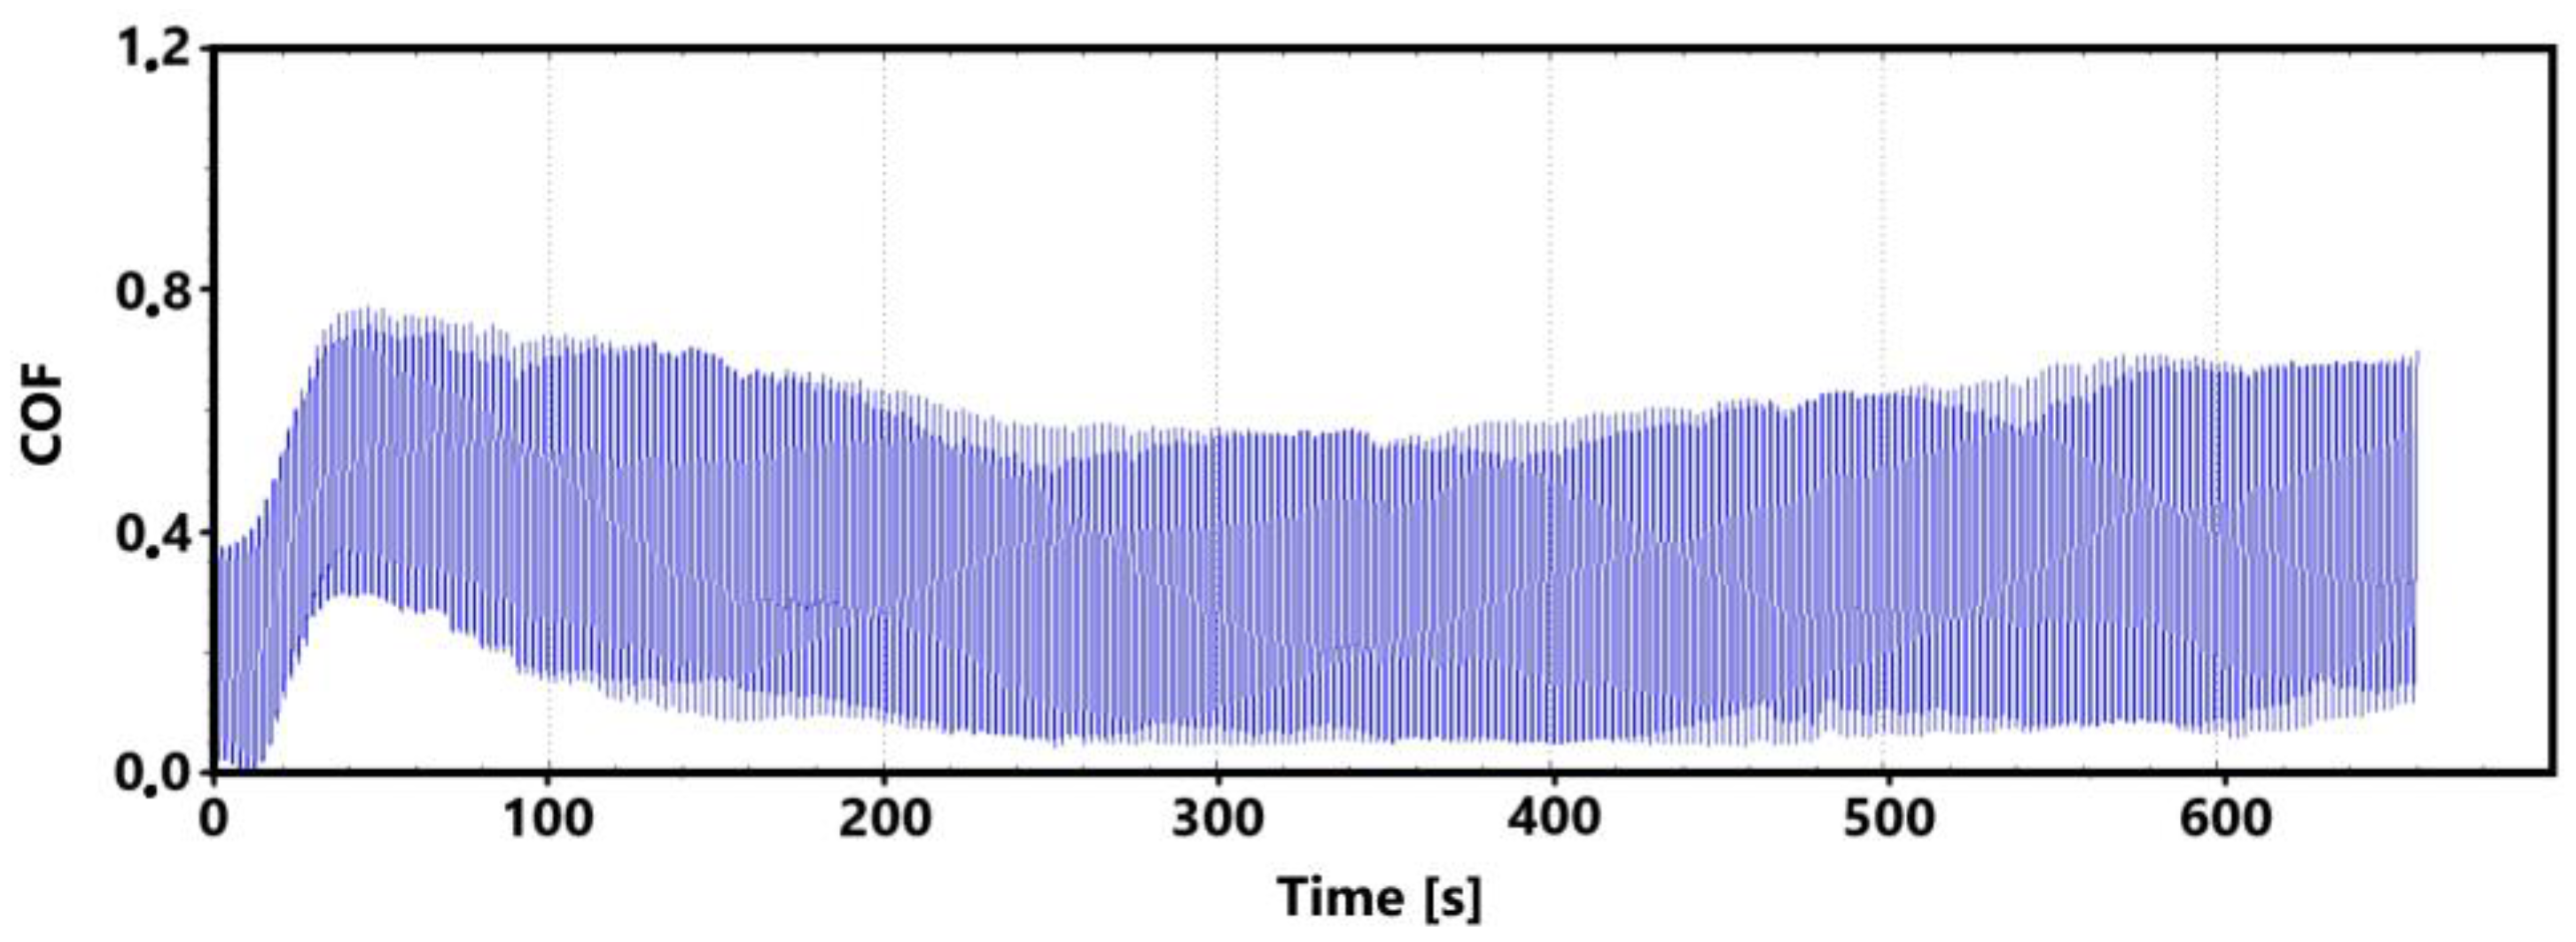
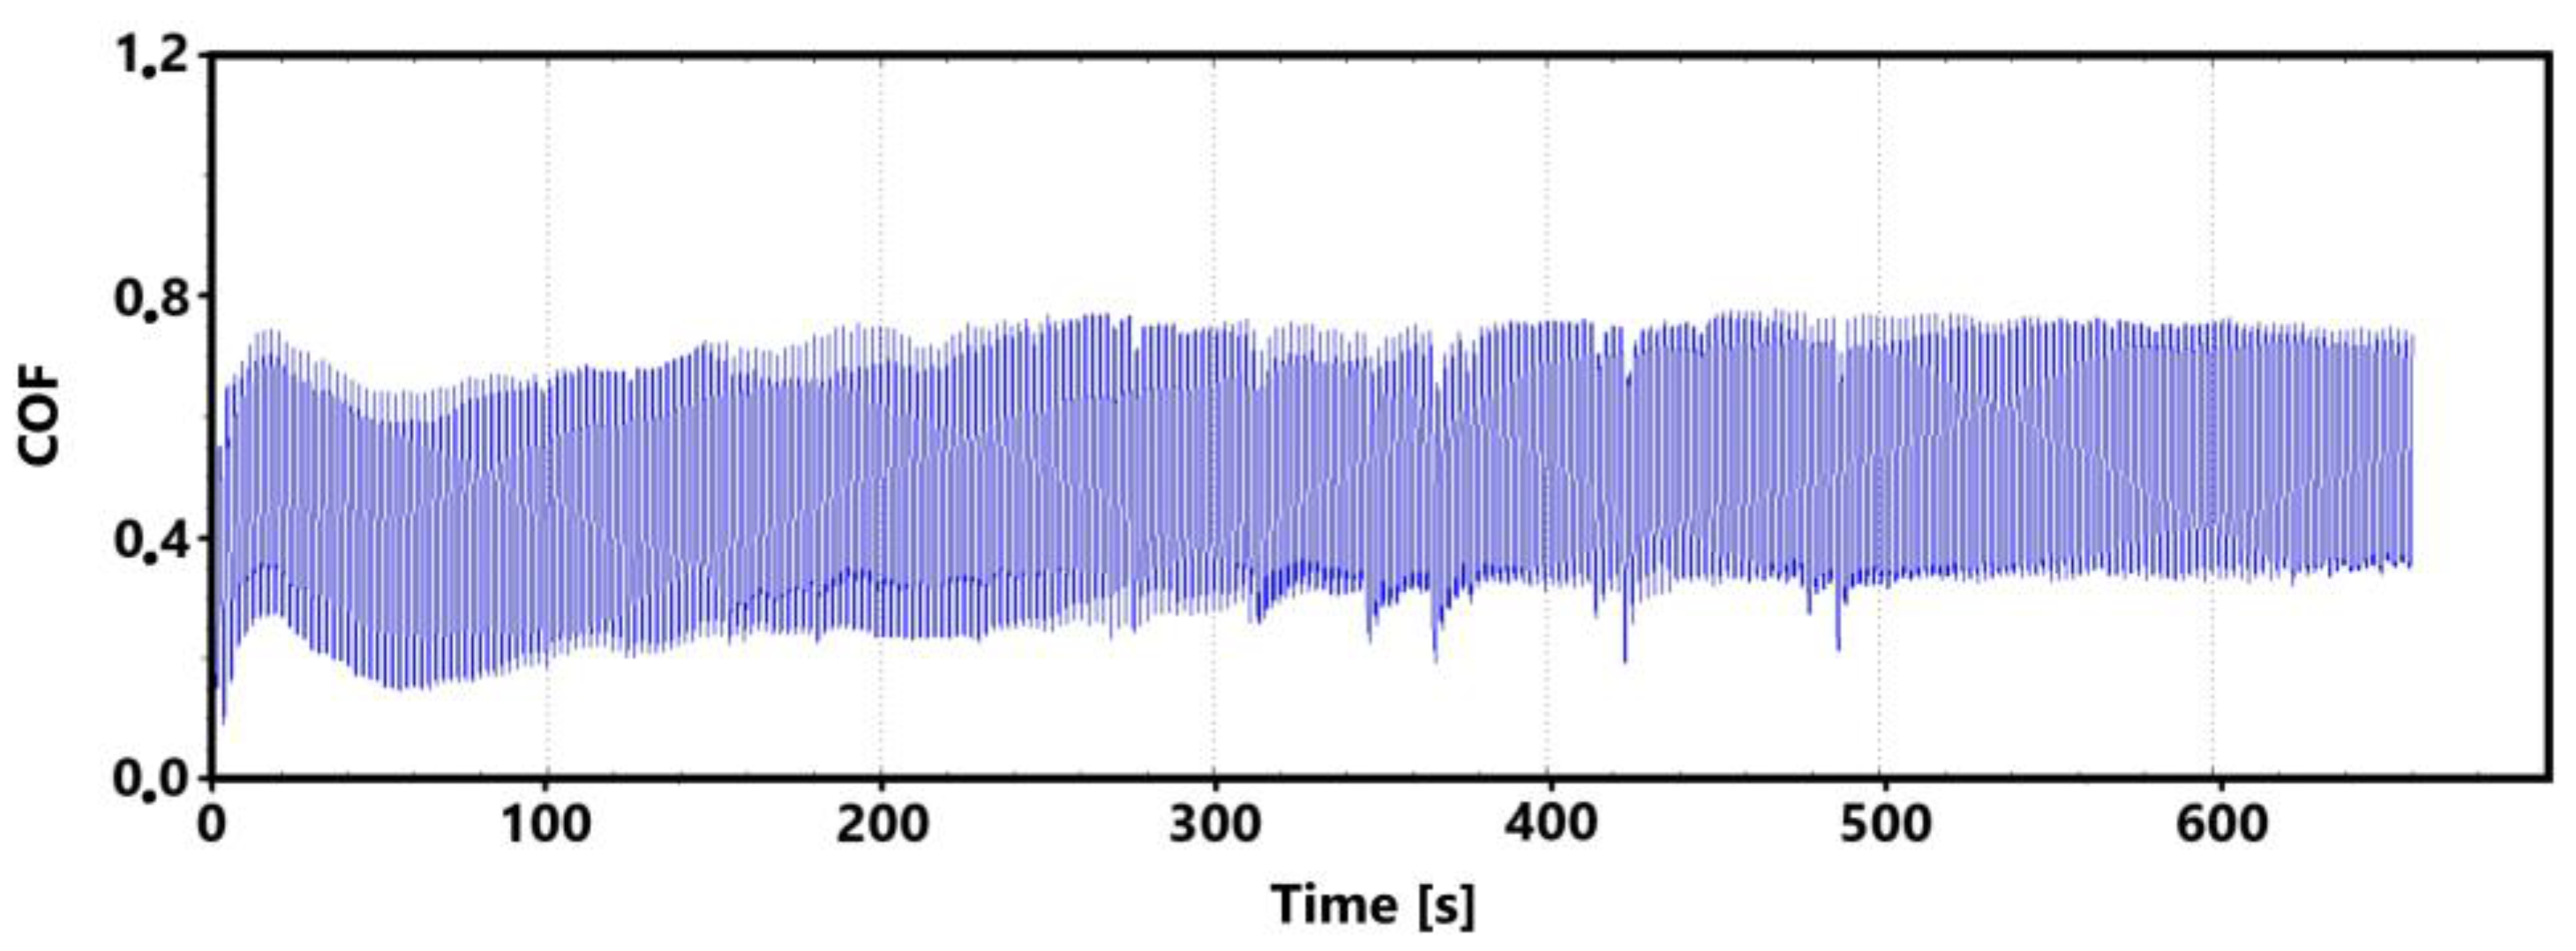
Figure 7 shows a record of the friction coefficient produced during a 30 min tribological test of a non-hardened surface. It can be seen from this record that there was a definite decrease and then an increase in the recorded values during the running-in of the tribological pair (non-hardened surface and pin). This phenomenon was also observed during the control 11 min measurement. The record of this measurement is shown in Figure 8. The periodic alternation of higher and lower values of the friction coefficient is caused by linear reciprocating motion. This is because there is an alternation of static (coefficient at rest) and dynamic (during movement) friction coefficients.
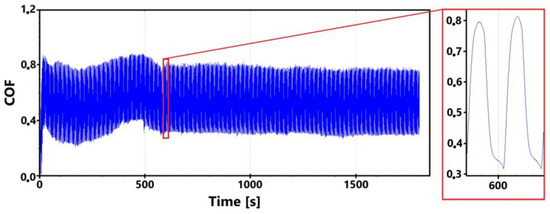
Figure 7.
Record of the friction coefficient of the laser non-hardened surface of the sample ADI 9k6 240 (30 min).

Figure 8.
Record of the friction coefficient of the laser non-hardened surface of the sample ADI 9k6 240 (control measurement, 11 min).
There may be a number of reasons for the fluctuations in the values at the beginning of the test. For example, it may be due to the release of large amounts of graphite, which can have a significant effect on friction. Another and more likely reason may be the formation of an oxide layer on the surface of the cast iron. The movement of the pin across the surface may erode this layer, thus creating separate parts of the oxide layer. The movement of these parts can then also have a significant effect on the value of the friction coefficient. It is evident from both recordings that the steady-state values occurred around the 10th min of the test. The range of values over which the friction coefficient varies in the 10th min of the test is very similar for both measurements.
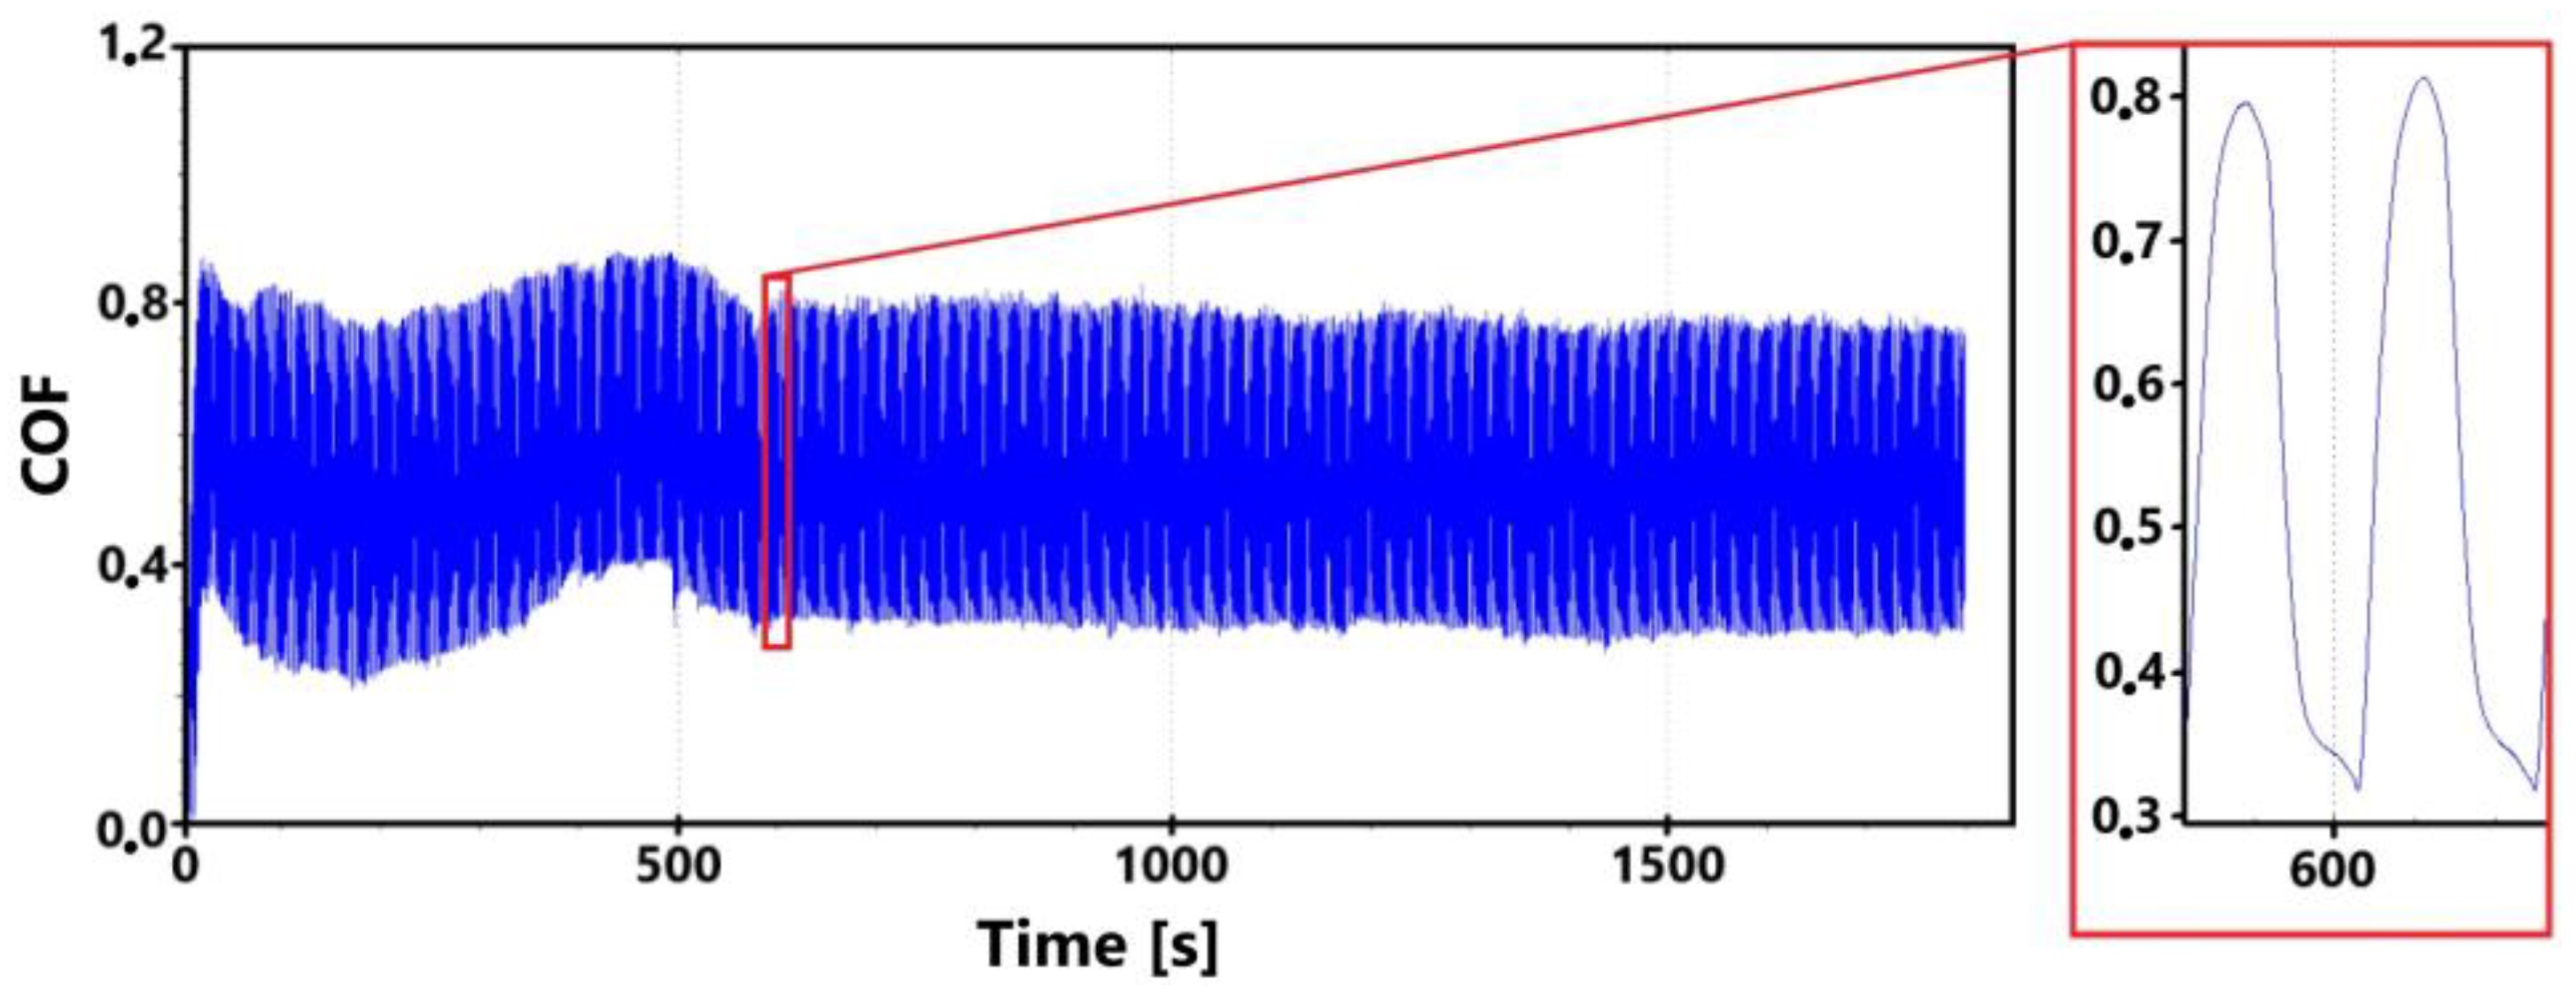
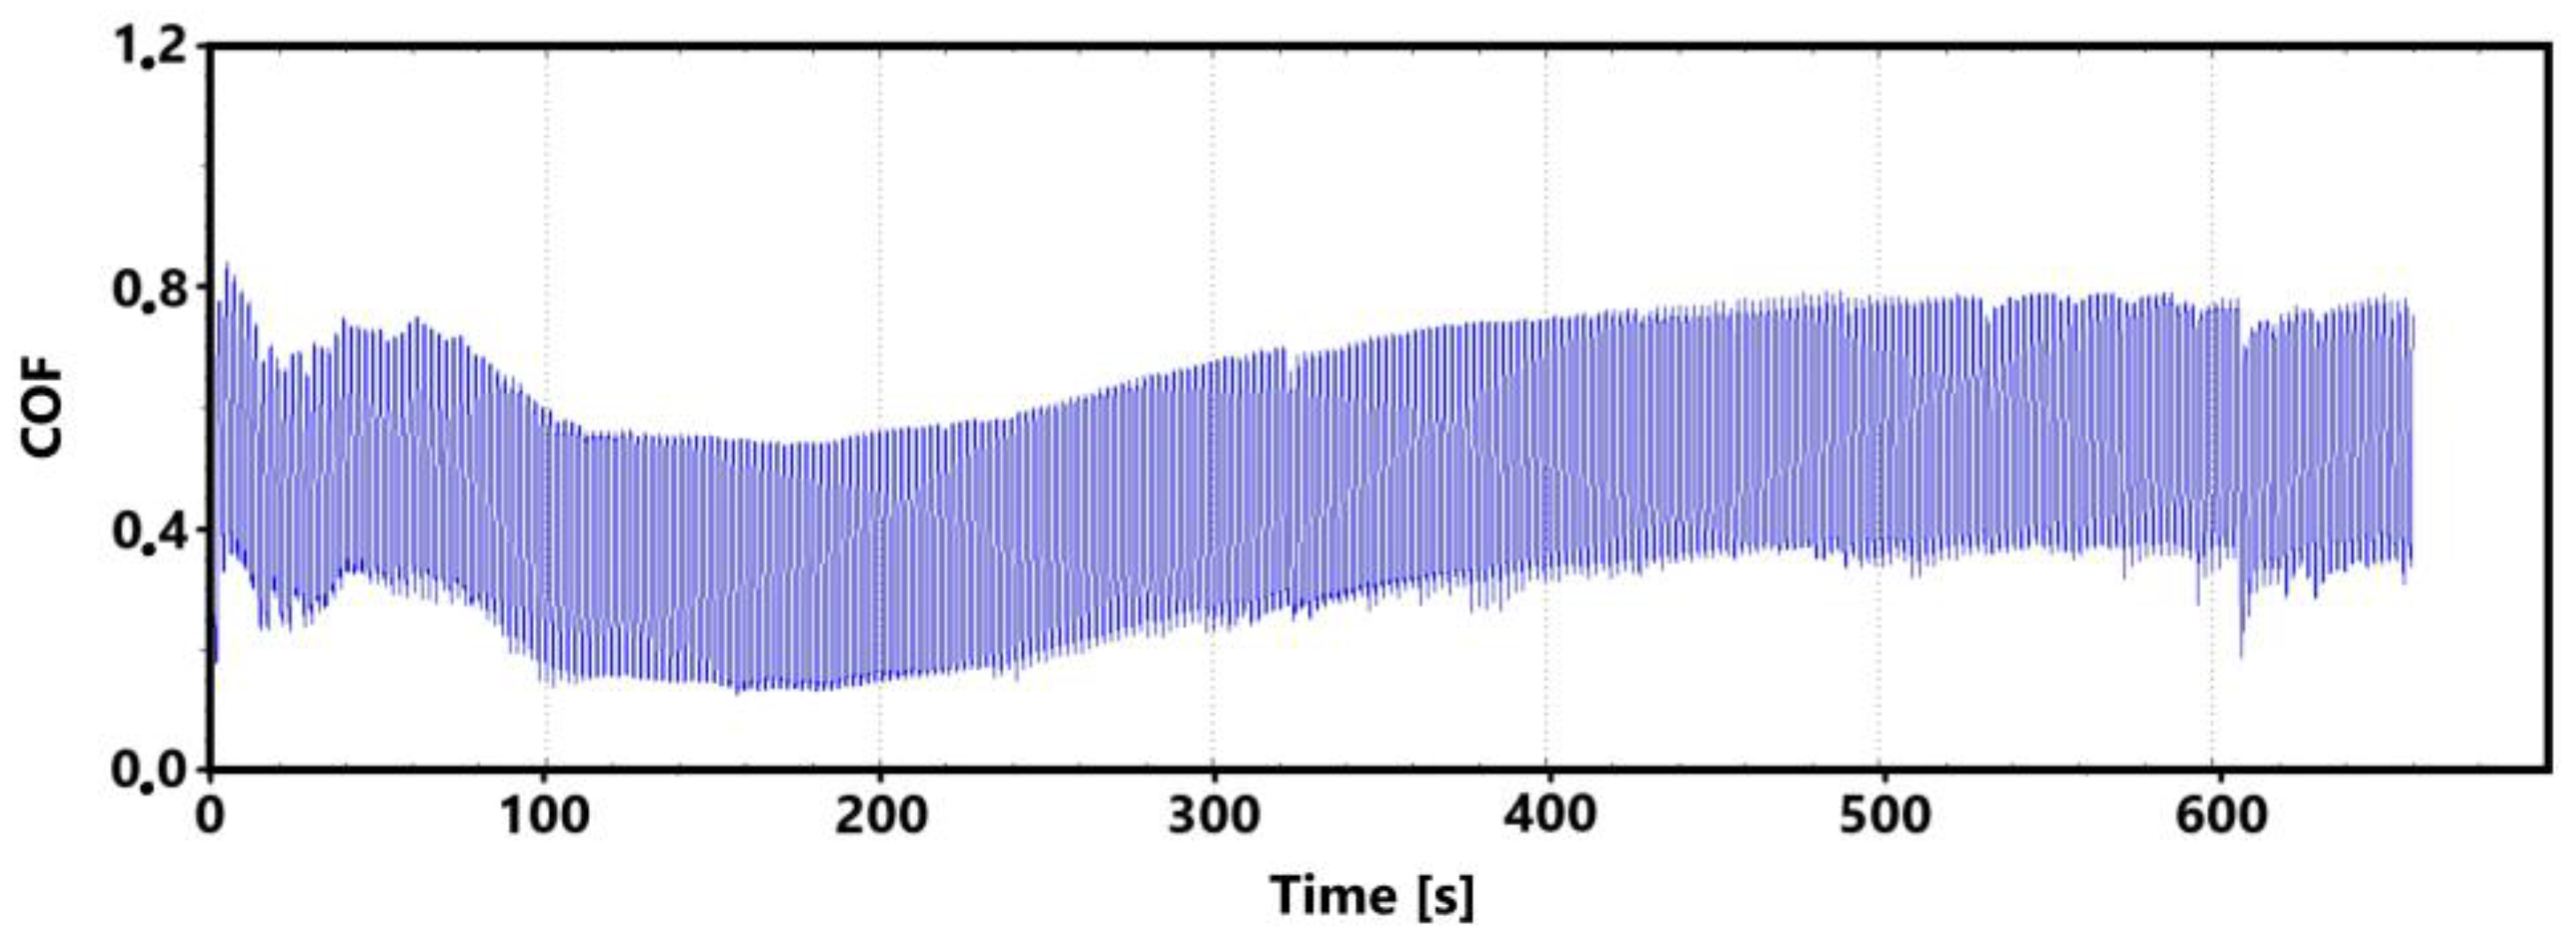
Figure 9 shows the graphical dependence of the friction coefficient values recorded during the 30 min tribological test of the laser-hardened surface. This figure shows a similar trend to that of the non-hardened surface. That is, the initial fluctuation in values that is associated with the running-in of the tribological pair.
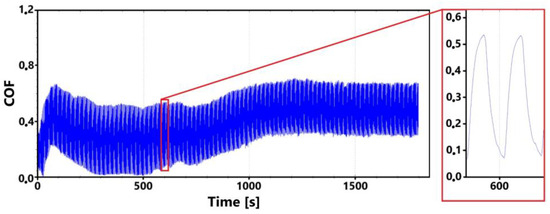
Figure 9.
Record of the friction coefficient of the laser-hardened surface of the sample ADI 9k6 240 (30 min).
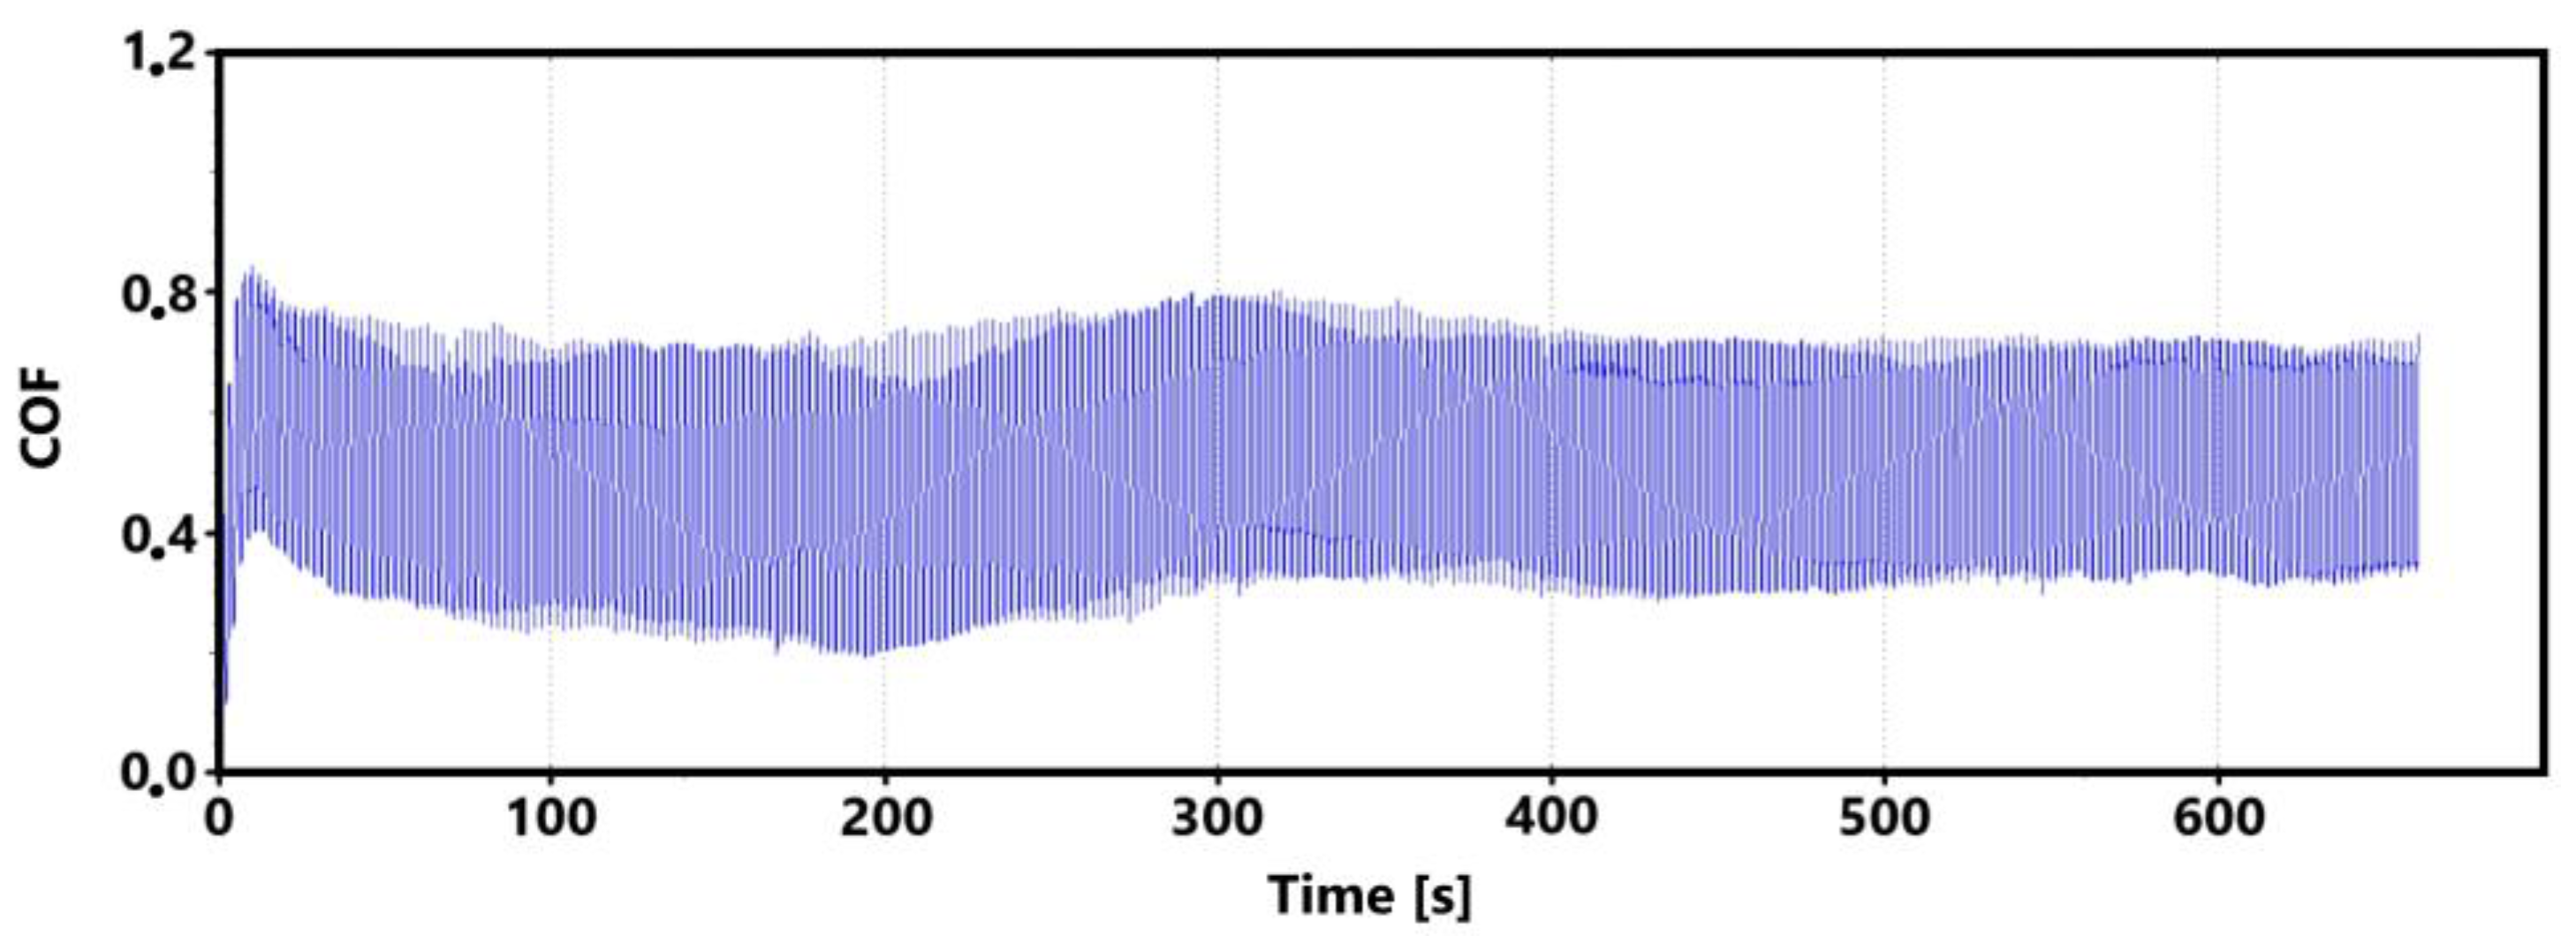
The initial increase with a later decrease in values can be associated with a number of factors. However, the most likely effect appears to be the formation of the oxide layer and its subsequent breaking during the test. Electron microscope analysis of the sample surface after the 11 min test (see Figure 10 for a record of the friction coefficient) shows that the oxide layer is relatively compact at the 11 min mark. Its subsequent disintegration and movement of parts of this layer (together with parts of the separated cast iron matrix) may be associated with an increase in the values of the friction coefficient.
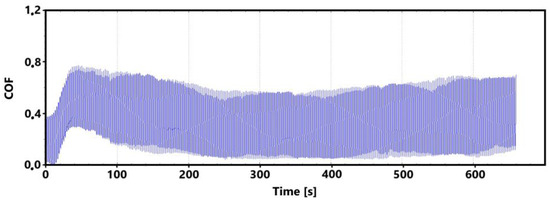
Figure 10.
Record of the friction coefficient of the laser hardened surface of the sample ADI 9k6 240 (control measurement, 11 min).
The records show that the behavior of hardened and non-hardened surfaces in the run-in phase is similar. However, the hardened surface shows a stabilization of values after a longer period of time. The fluctuation interval is larger for the hardened surface. This may be due to the harder and stronger surface of the quenched sample, which may have contributed to the stability of the emerging oxide layer.
3.2.2. Surface Analysis of ADI 9k6 240 Sample after Tribological Test
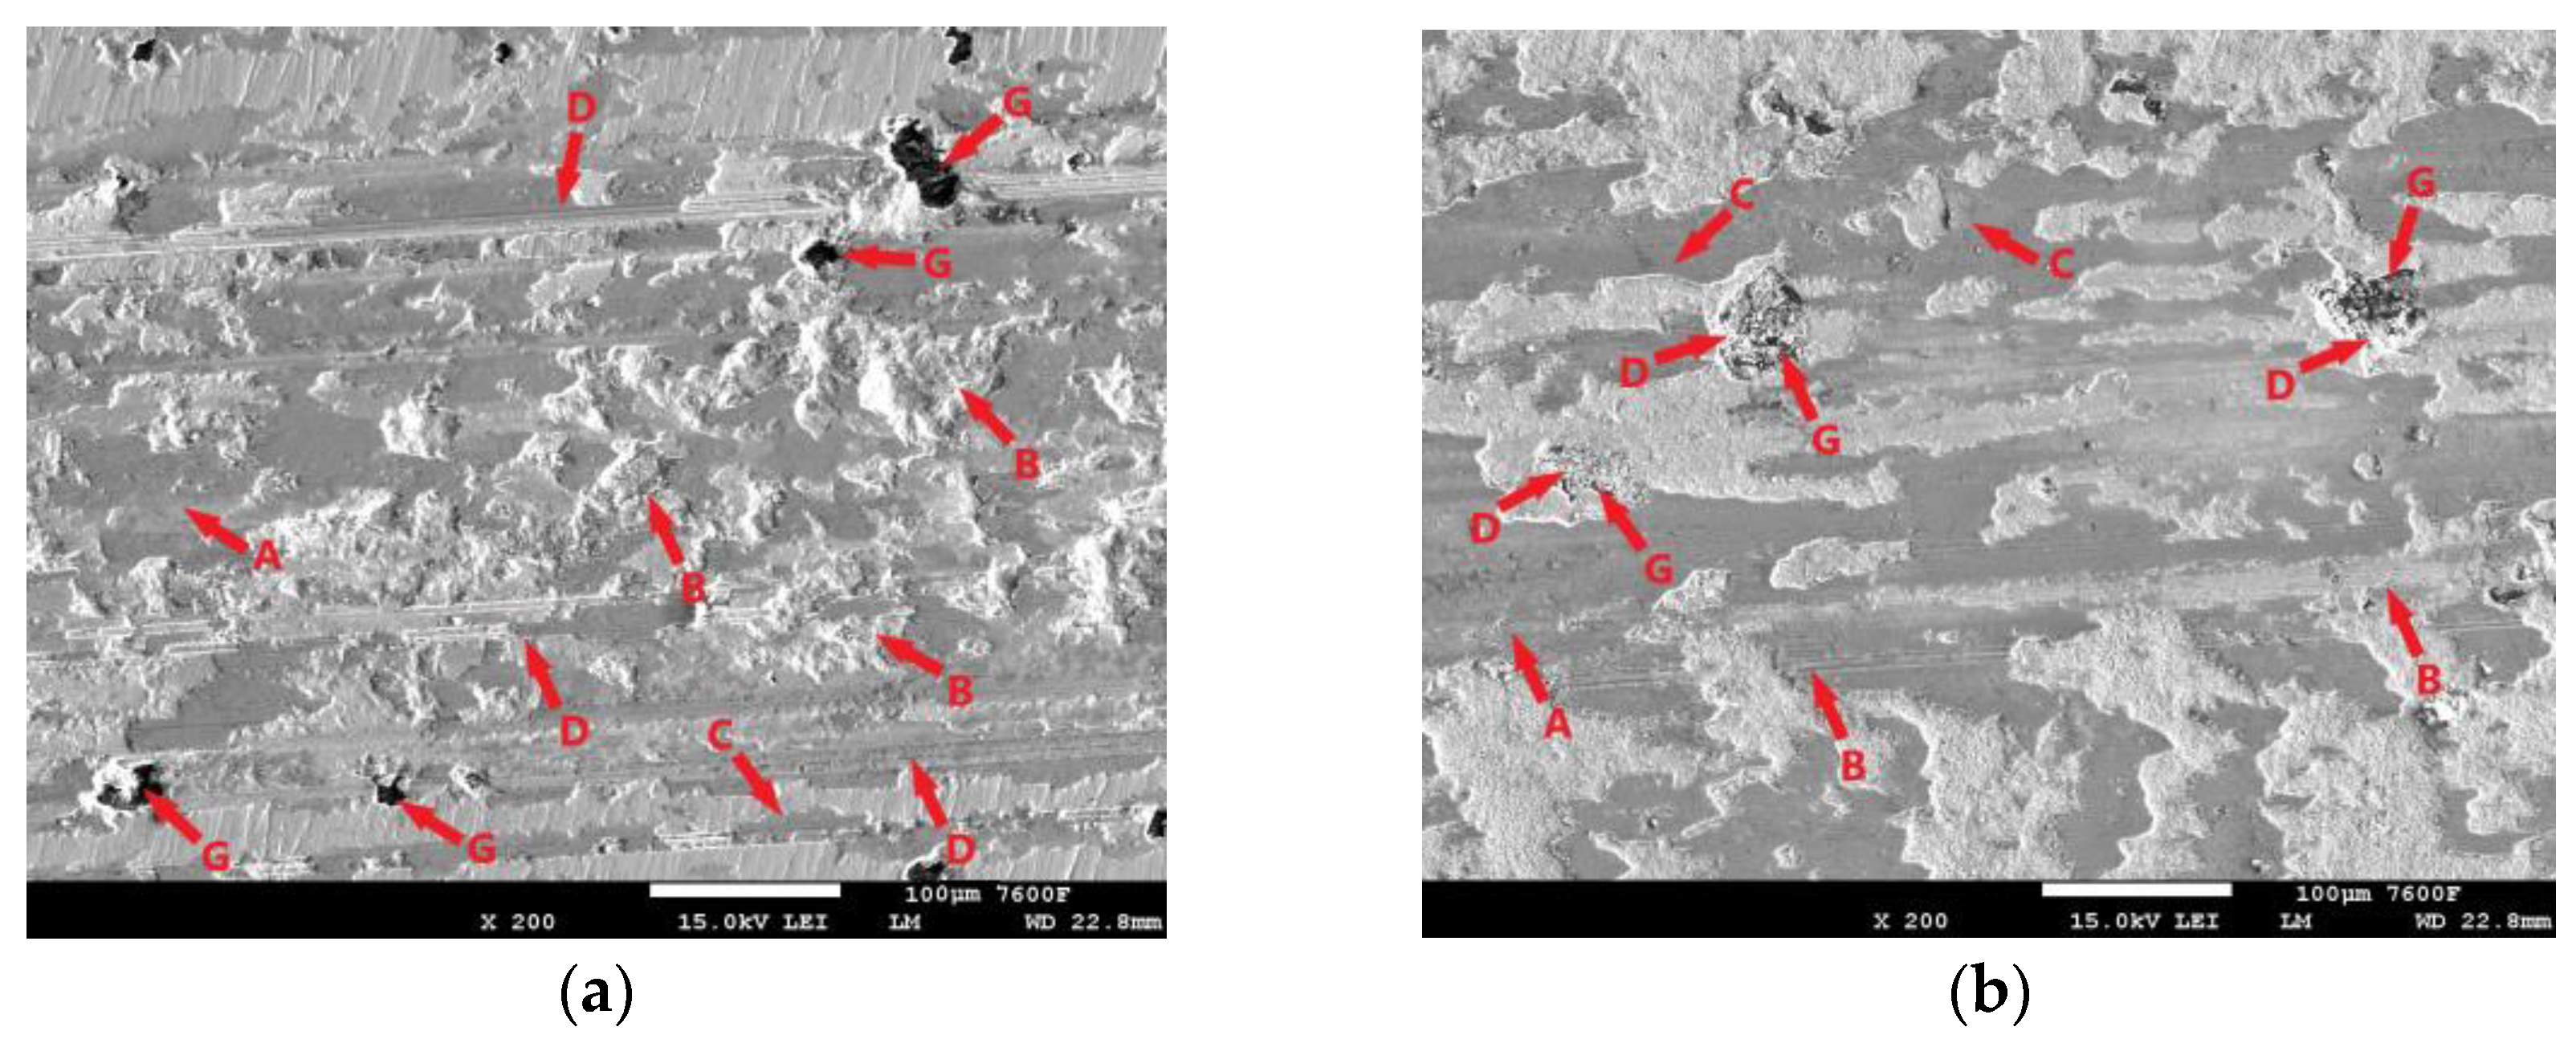
All tested samples showed significant oxidation of the base material during the tribological test. The oxidation layer can be observed, for example, in Figure 11i-A. EDS analysis of the worn surface was performed to confirm the oxidation. The analyzed area is shown in Figure 11ii(a). Figure 11ii(b) shows the iron distribution in the analyzed area, Figure 11ii(c) shows the carbon distribution, and Figure 11ii(d) shows the oxygen distribution. Thus, Figure 11ii(b) shows that the analyzed layer is darker relative to its surroundings and thus contains less iron relative to its surroundings. In the oxygen analysis 11ii(d), the analyzed layer contains a significantly higher amount of oxygen relative to its surroundings (the oxygen distribution is shown in blue in the figure). Thus, the EDS analysis confirmed the assumption that an oxide layer was formed during the tribological test, which could have had a major influence on the resulting surface tribology. Figure 11i shows the worn surface of the non-hardened ADI 9k6 240 specimen after the 30 min tribological test. The aforementioned oxide layer in this case is highly non-compact, showing a rather significant violation of integrity. One of the causes may be the deformation of the cast iron matrix that occurs due to the movement of the PIN on the surface. This in turn may contribute to the formation and propagation of cracks in this oxide layer. Further movement of the PIN may then lead to separation of parts of the layer (together with the cast iron matrix). These separated parts may then move during the test and move outside the main tribological test track (Figure 11i-D).
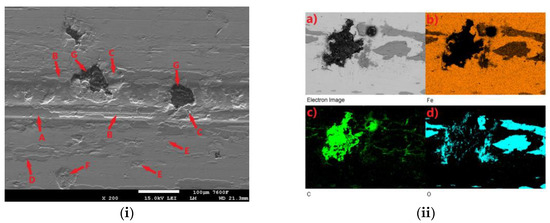
Figure 11.
ADI 9k6 240; (i) The surface of a non-laser-hardened ADI 9k6 240 sample; (ii) EDS analysis of the surface after the tribological test.
Another major factor that can contribute to the breaking of the oxide layer is the graphitic formations that the cast iron contains. If they are located just below the surface, they may be progressively exposed during the test (Figure 11i-G). Graphite is a stress concentrator. The thin layer of matrix that overlies it at the beginning of the test is deformed during the test, which can lead to subsequent fatigue and failure of integrity, and the graphite is gradually exposed. This mechanism is likely to result in significant separation of the matrix parts around the graphitic formations, as seen in Figure 11i-C. Traces of abrasive damage are also evident on the surface after tribological testing (Figure 11i-B). The movement of detached parts of the hard oxide layer, or the hardened part of the base material, could probably have contributed to the abrasion.
Figure 11i-E shows traces of adhesive damage. This was probably caused by close contact between the PIN (steel ball) and the cast iron matrix. Given the chemical composition, this is not surprising. The surface was probably protected from significant adhesive damage by an emerging oxide layer. The worn surface shows where there has been a significant separation of the base material of the cast iron (Figure 11i-F). There may be a number of causes. The separation may be due to fatigue of the cast iron surface layers, or adhesive wear, or the presence of graphite (which was not detected during the test) may have contributed.
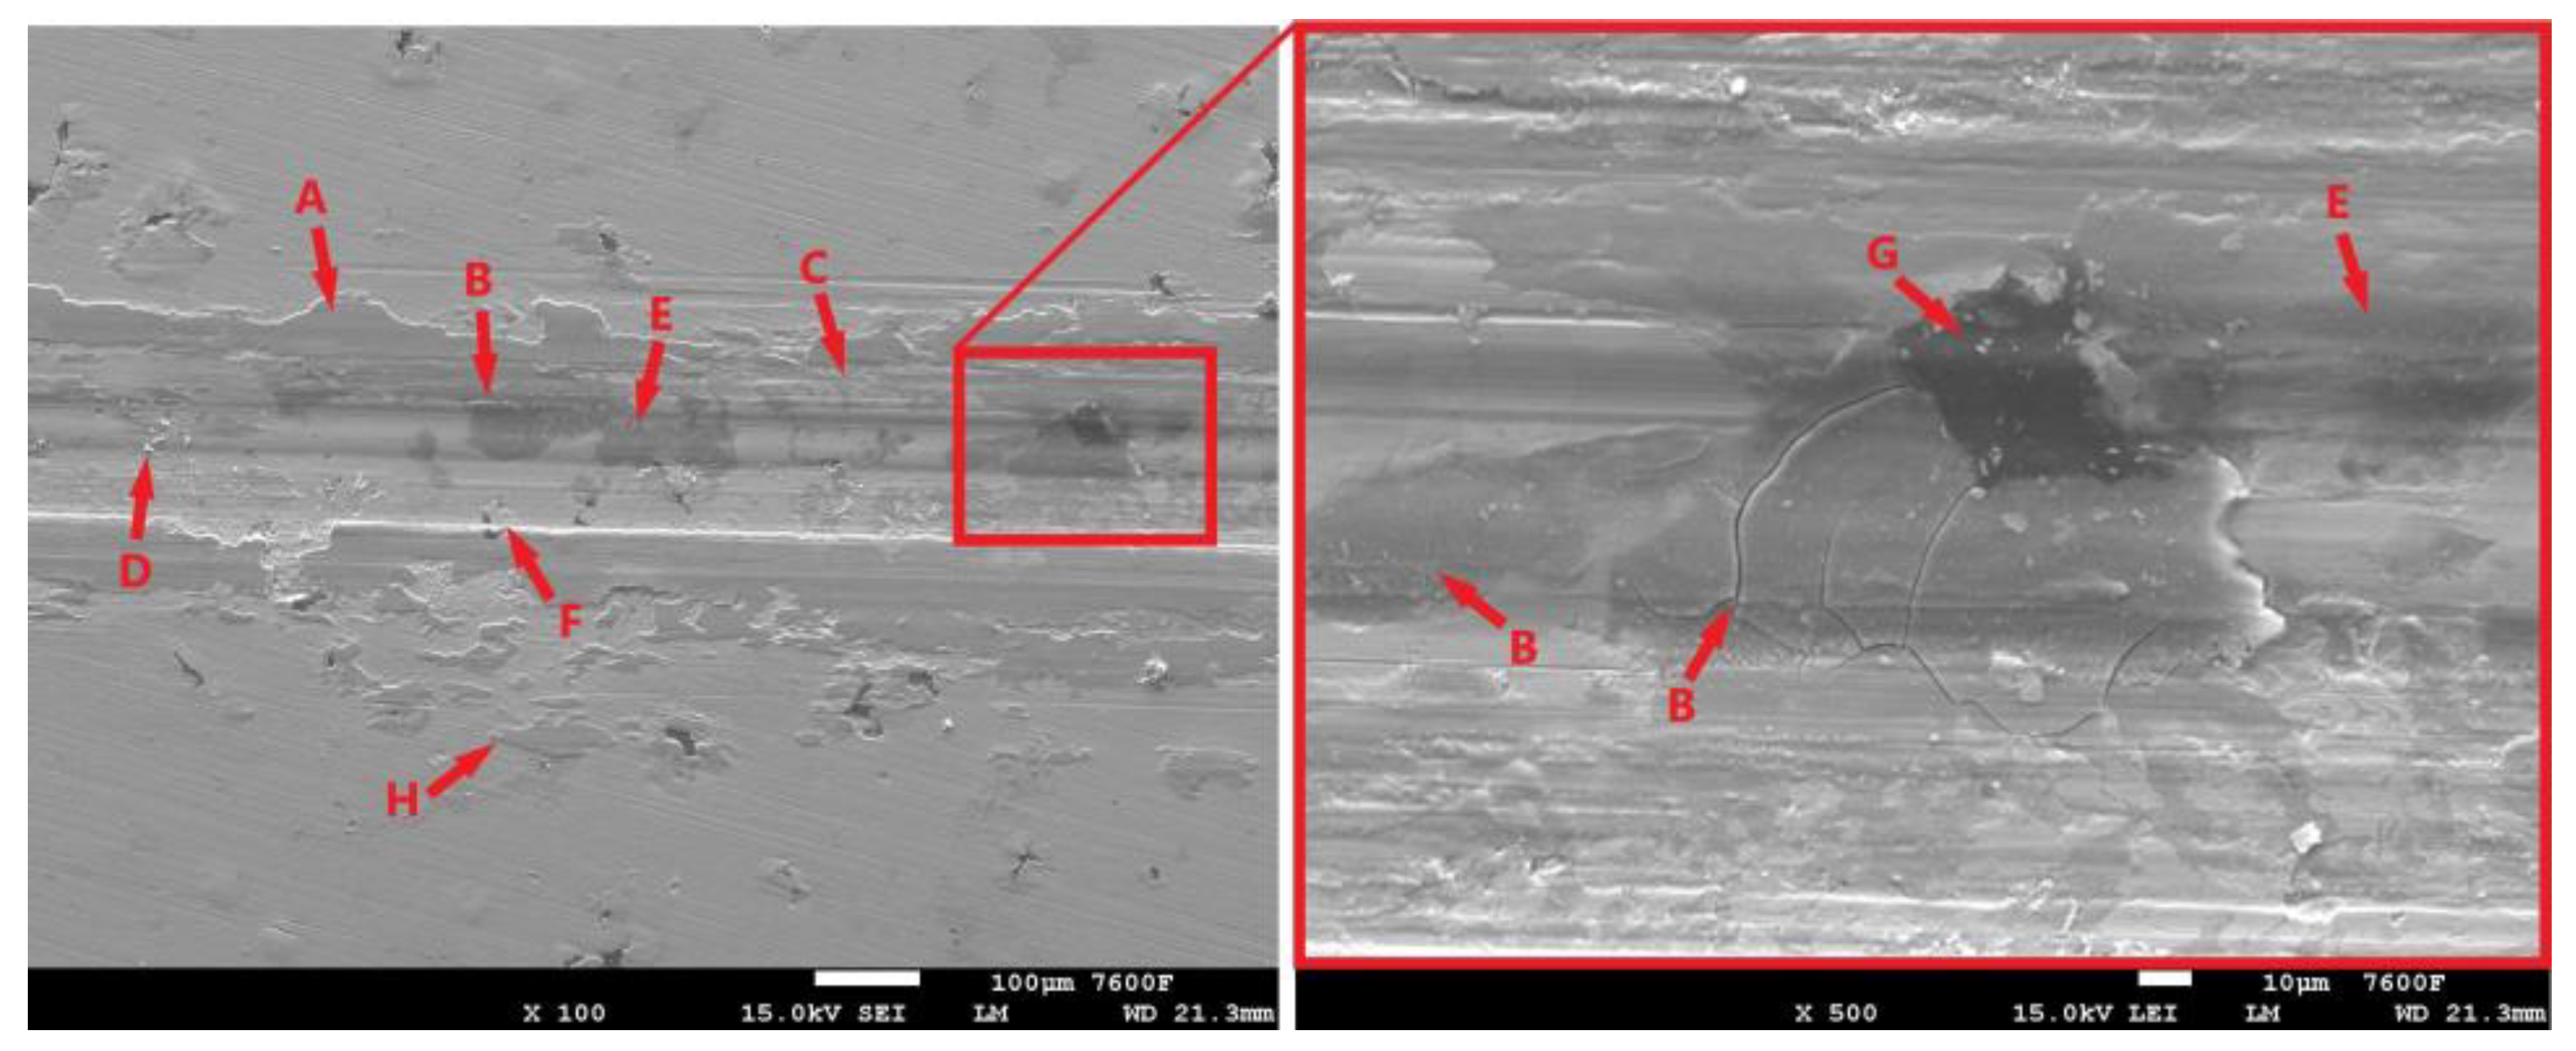
Figure 12 shows the condition of the laser-hardened surface after the 11 min tribological test. The resulting trace is relatively compact, with the oxide layer (Figure 12-A) showing no significant distortion. Nevertheless, some distortion did occur during testing. The detached portions of the oxide layer then moved from the breach location to the edge of the footprint during the test. Such separated and relocated portions can be seen in Figure 12-H. The surface of the specimen also shows signs of abrasion (Figure 12-C), likely due to the aforementioned movement of hard oxide particles or movement of the hardened and separated portion of the cast matrix (Figure 12-D).
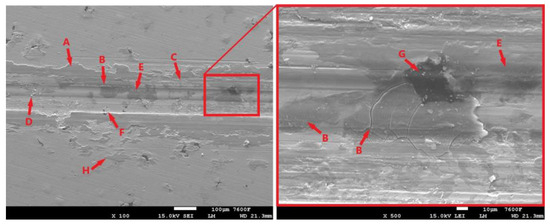
Figure 12.
The surface of the laser-hardened sample after an 11 min tribological test.
The surface image (Figure 12) also shows the influence of graphite formations. These formations, as already mentioned, are the heterogeneities of the structure around which the stress concentration increases. The thin matrix layer that overlies the graphite is intensely stressed. The result is fatigue and separation of that part of the matrix. The initial state can be seen clearly in Figure 12-F, while a more advanced stage with exposed graphite (Figure 12-G) can be seen in Figure 12-B. The cracks that form and gradually propagate around the graphitic formations are clearly visible in the figure. By stressing the graphite and surrounding matrix, it may also be released (Figure 12-E); in this way, some lubrication effect may occur, which may affect the resulting tribological behavior of the cast iron.
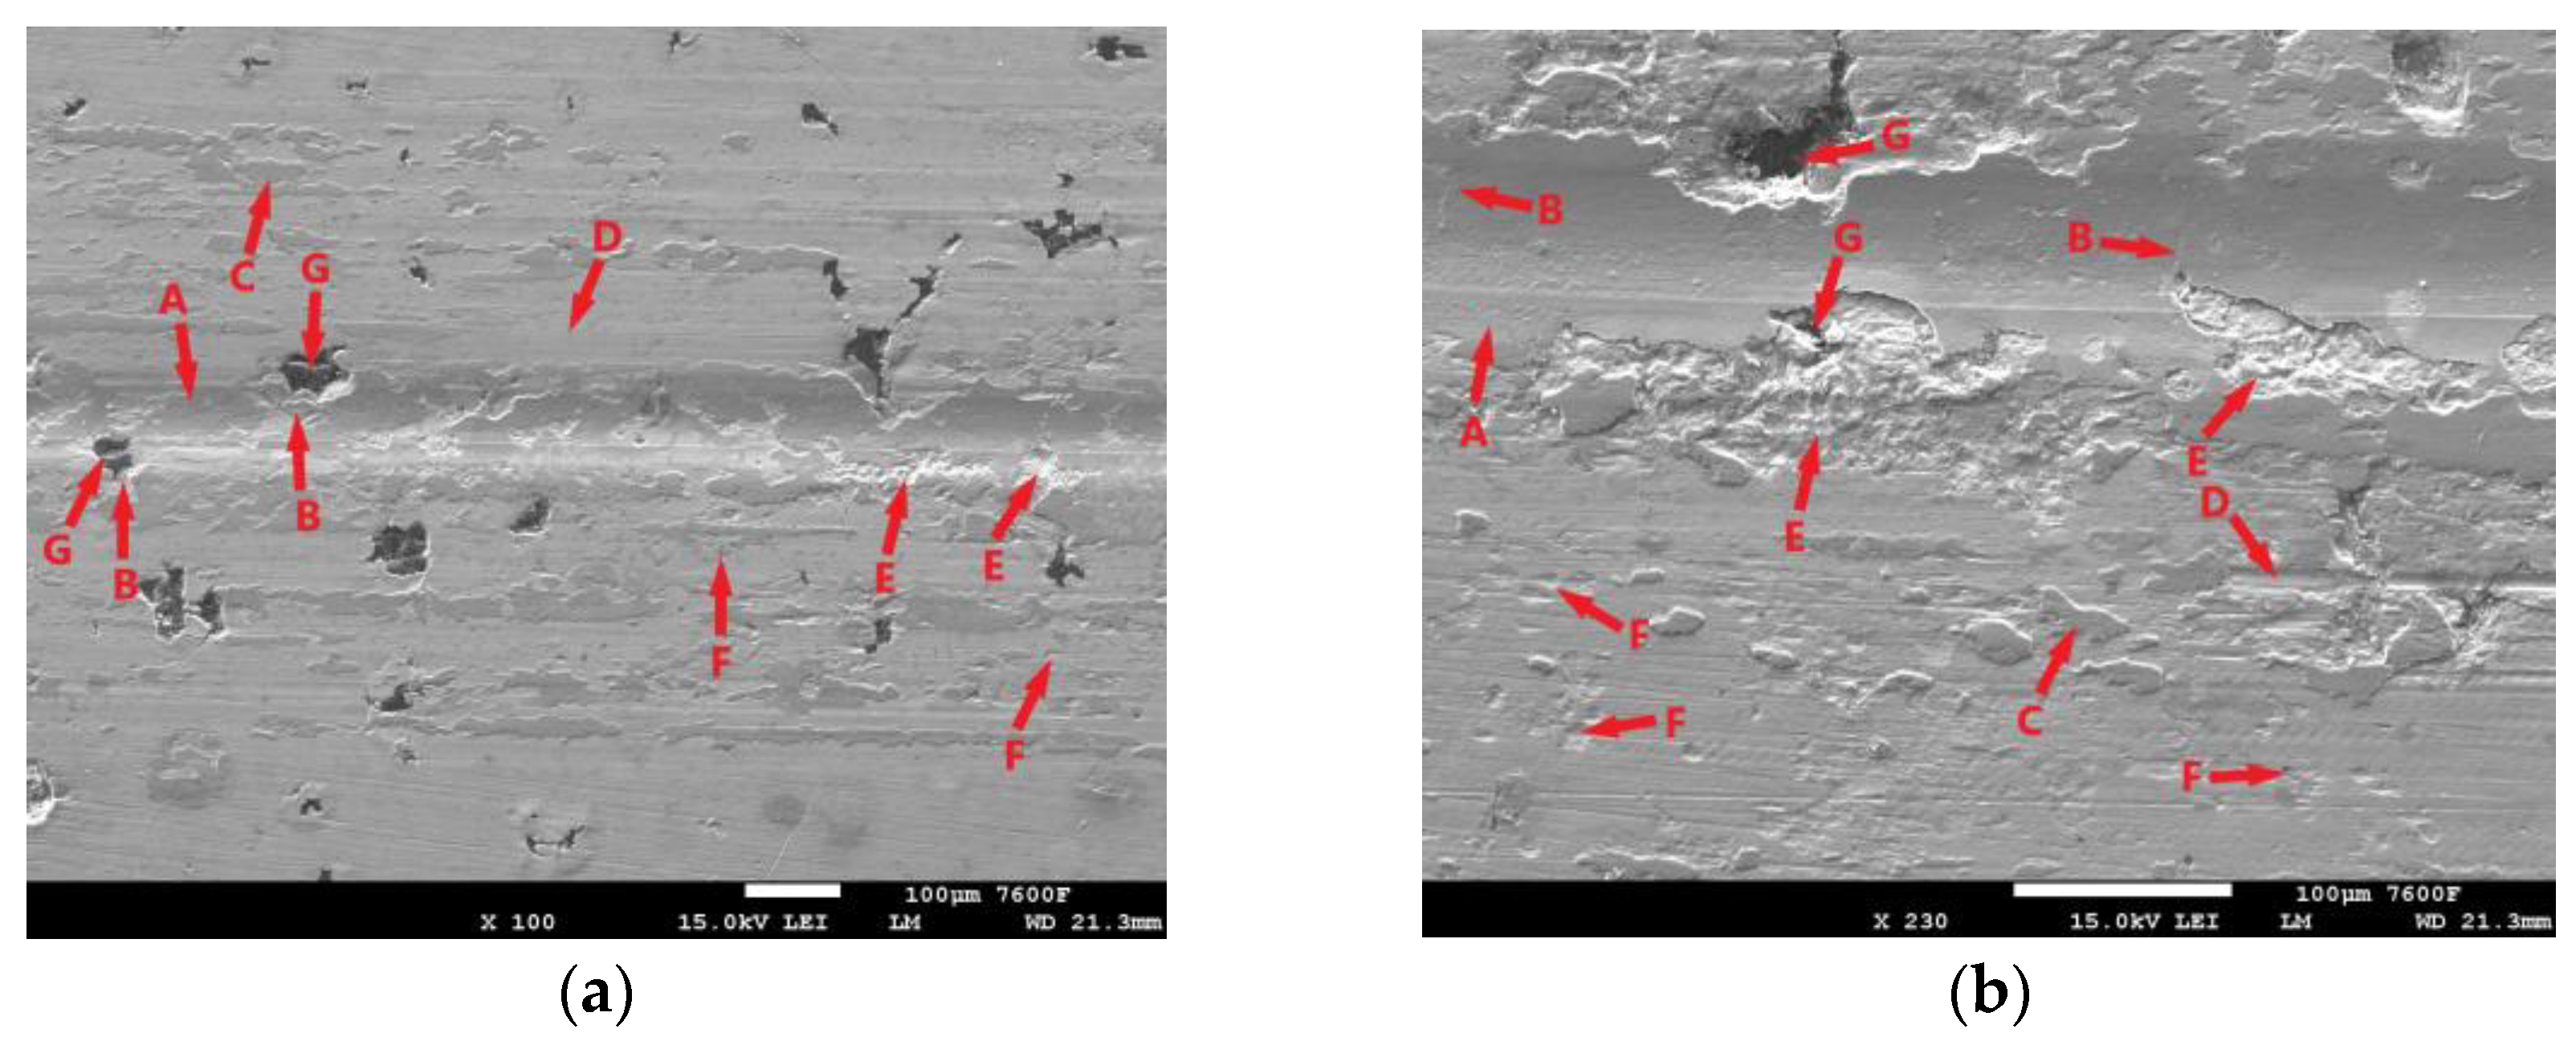
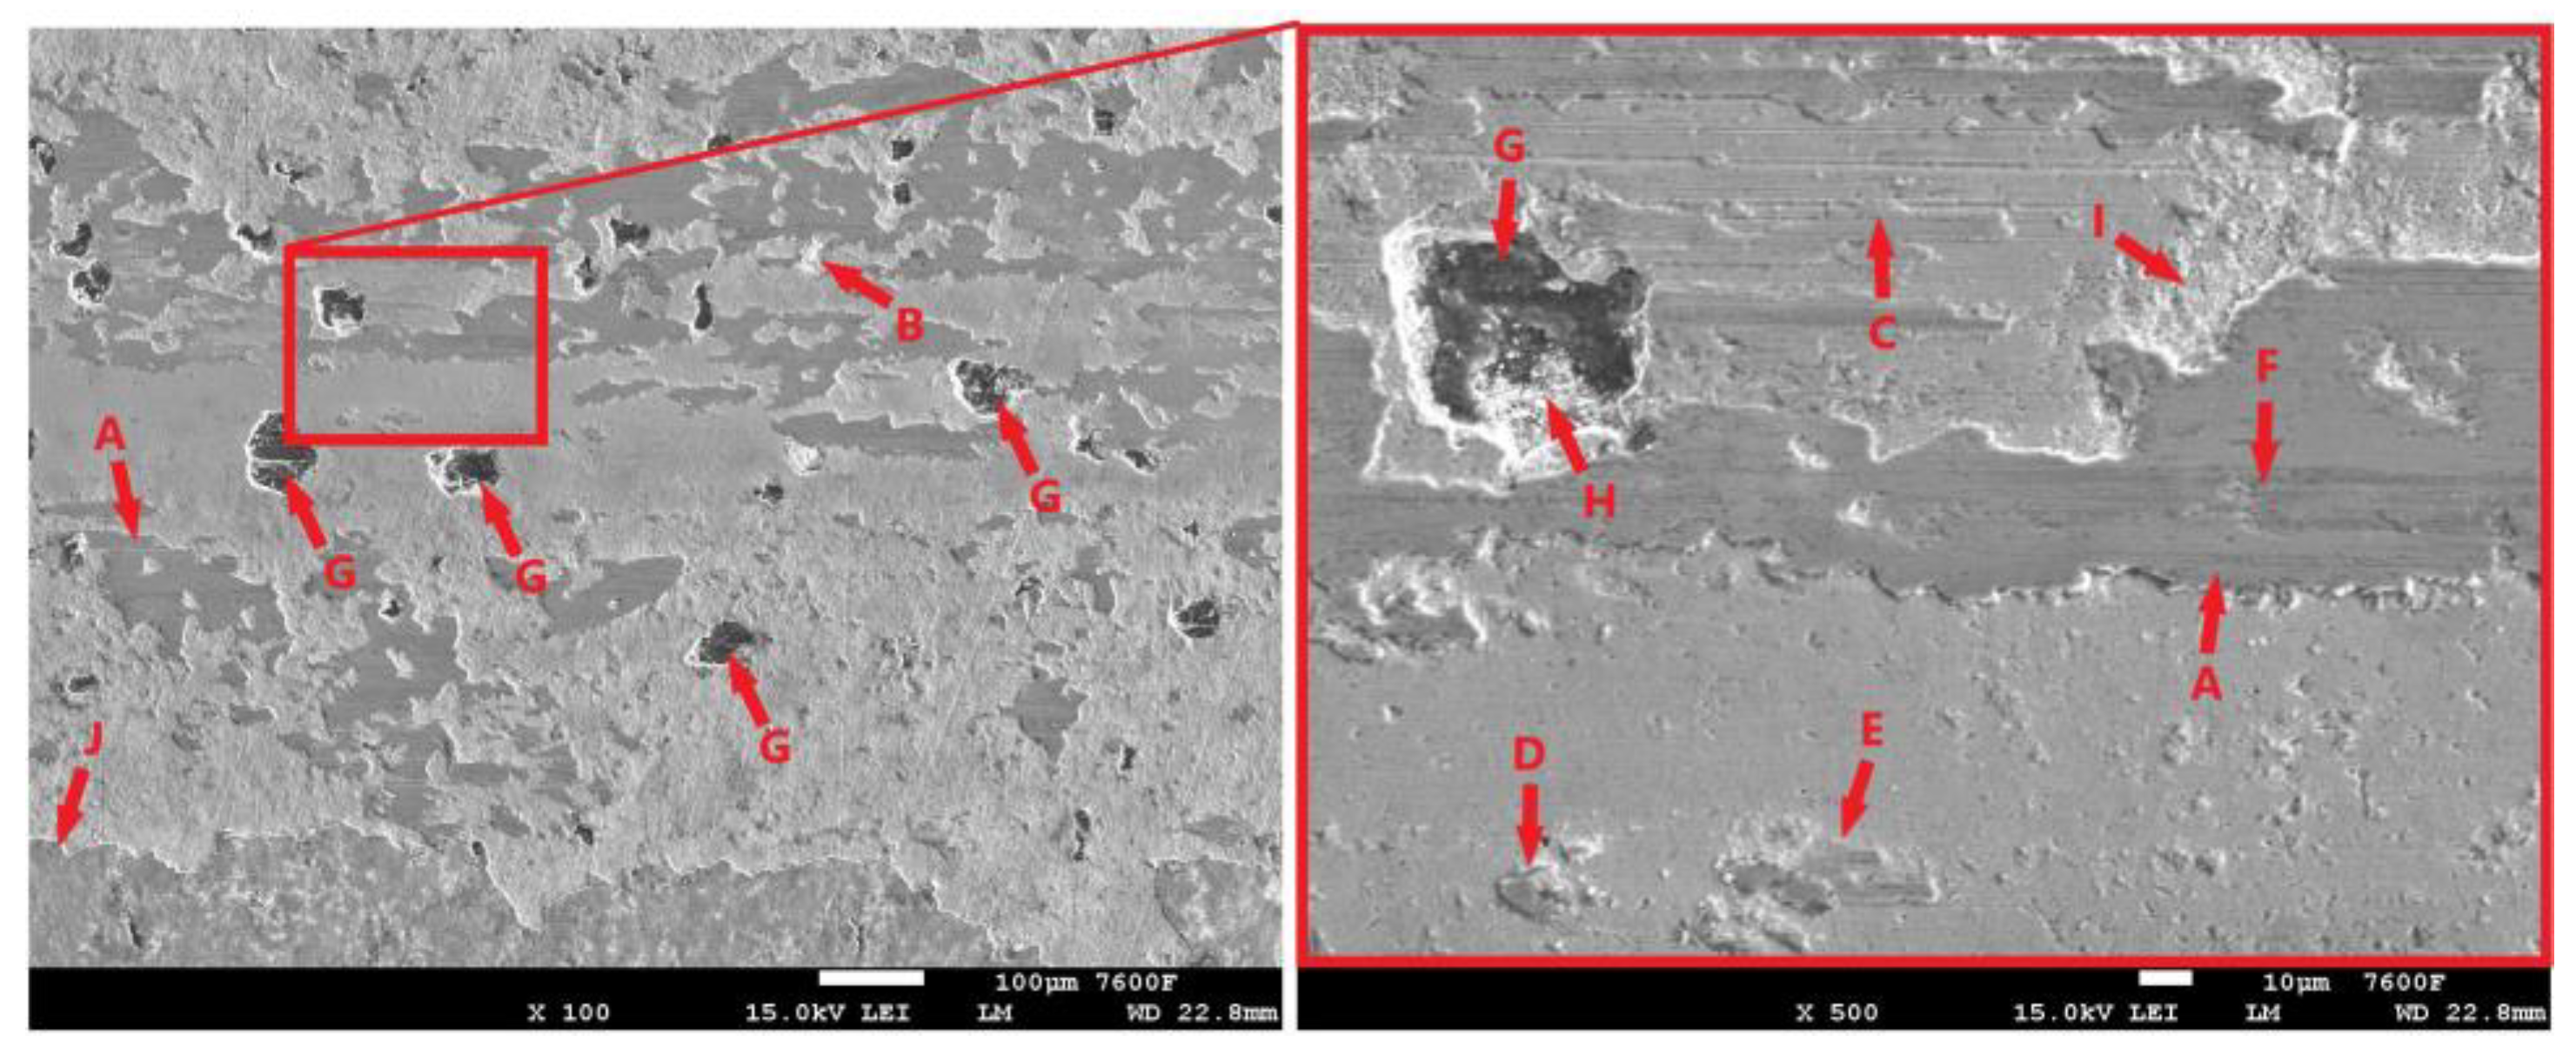
The surface of the laser-hardened specimen after the 30 min tribological test is shown in Figure 13. The trace produced by the PIN movement during the test is largely covered by an oxide layer (Figure 13a,b-A), but this layer is not very continuous. It shows considerable distortion, and cracks are visible (Figure 13b-B), which may propagate gradually with PIN movement and cause delamination. One of the causes of the disruption of the oxide layer may be the aforementioned presence of graphite (Figure 13a,b-G). The figure shows that there was also considerable disruption of the surrounding matrix around these graphitic formations (Figure 13a,b-B). During the test, hard parts of the oxide layer were separated and displaced (Figure 13a,b-C), which probably contributed significantly to the abrasive damage of the surface (Figure 13a,b-D). The figure also shows areas where significant separation of parts of the base material has occurred (Figure 13a,b-E); the presence of graphite is not evident in the surrounding area (it may be hidden beneath the surface), but this is probably the result of fatigue damage to the cast iron matrix. The surface also shows signs of adhesive damage (Figure 13a,b-F).

Figure 13.
ADI 9k6 240; (a) Surface of the laser-hardened sample after a 30 min tribological test; (b) Detail of the laser-hardened surface after a 30 min tribological test.
3.2.3. Progress of the ADI 9k6 310 Tribological Test
Figure 14 shows a record of the friction coefficient for the laser non-hardened surface of the ADI 9k6 310 specimen during the main 30 min test. This record shows an initial slight fluctuation in values. However, this fluctuation stabilized fairly quickly. At the same time, this phenomenon is also evident in the 11 min measurement (Figure 15).
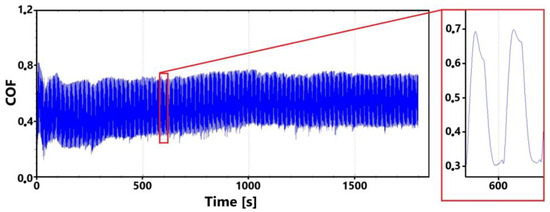
Figure 14.
Record of the friction coefficient of the laser non-hardened surface of the sample ADI 9k6 310 (30 min).
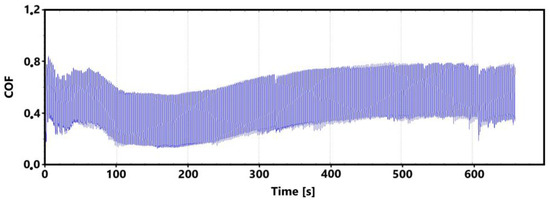
Figure 15.
Record of the friction coefficient of the laser non-hardened surface of the sample ADI 9k6 310 (control measurement, 11 min).
This initial variation in friction coefficient values may again (as with the previous sample 9k6 240) be due to a number of factors. One cause may be the flattening of surface micro-irregularities, or for example, the formation and subsequent failure of an oxide layer. The presence of this oxide layer on the test worn surface was already confirmed in the previous sample.
Figure 16 shows a record of the friction coefficient for the laser-hardened surface of specimen ADI 9k6 310 taken during a 30 min tribological test. In this case (similar to the non-hardened surface), a slight fluctuation in the values can be observed as the tribological pair is run in; however, these values stabilized fairly quickly. The variation in the friction coefficient values during tribological pair run-in is probably related to the formation and subsequent behavior of the oxide layer (together with the interaction of surface micro-irregularities).
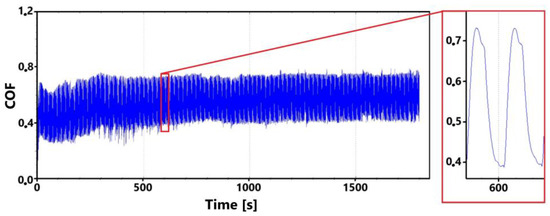
Figure 16.
Record of the friction coefficient of the laser-hardened surface of the sample ADI 9k6 310 (30 min).
A similar initial fluctuation of the friction coefficient values, including a relatively rapid settling, is also evident in the record of the control (11 min) measurement (Figure 17). The range of values over which the friction coefficient varies in the 10th min of both tests is again very similar.

Figure 17.
Record of the friction coefficient of the laser hardened surface of the ADI 9k6 310 sample (control measurement, 11 min).
3.2.4. Surface Analysis of the ADI 9k6 310 Sample after the Tribological Test
Figure 18a shows the surface condition of a non-hardened ADI 9k6 310 cast iron specimen after a 30 min tribological test. The surface of this sample shows significant damage after the test. The surface is again (as in the previous cases) partially covered by an oxide layer (Figure 18a-A), but this layer is considerably damaged. Together with the oxide layer, the surface layers of the base material have been significantly delaminated during the test (Figure 18a-B). Thus, the surface of the sample shows quite deep damage to the surface layers, essentially craters.
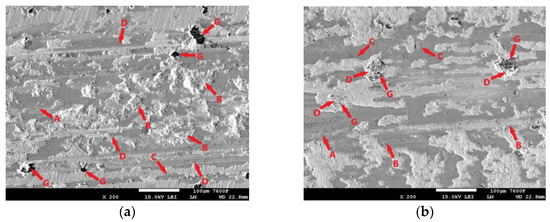
Figure 18.
ADI 9k6 310: (a) The surface of a non-laser-hardened ADI 9k6 310 sample after a 30 min tribological test; (b) The surface of the laser-hardened sample after an 11 min tribological test.
The delamination may have been contributed to by the graphite formations, which (as already mentioned in the previous sample) are essentially surface heterogeneities, and there is an increase in stress concentration in their vicinity. Thus, significant matrix loading and pumping of plasticity may be occurring in the vicinity of the graphite, which may subsequently cause delamination of the surface layers of the cast iron around the graphite (Figure 18a-G). However, this is probably not the primary cause of delamination in this case. The separation of the cast iron matrix occurred over essentially the entire footprint area created by the movement of the PIN during the tribological test. The likely cause of the significant delamination is fatigue damage to the cast iron matrix (adhesive wear may have contributed). The movement of the separated portions of the matrix or portions of the oxide layer (portions of which are visible in Figure 18a-C) is then likely to have also caused significant abrasive wear, traces of which are visible on the surface of the specimen (Figure 18a-D).
Figure 18b shows the condition of the laser-hardened surface after the 11 min tribological test. At first glance, the completely different behavior of the hardened and non-hardened surfaces is evident (Figure 18a). The test-damaged surface is again partially covered by an oxide layer (Figure 18b-A). By loading this layer during PIN movement, cracks can form, which can be seen in Figure 18b-C. The gradual propagation and interlocking of these cracks leads to the separation of the oxide layer from the base material. Compared to the non-hardened surface, no significant delamination of the cast iron matrix is evident on the laser-hardened surface. The matrix is not fundamentally damaged even around the graphite formations (Figure 18b-G). The matrix shows only minor signs of damage. Accumulated matrix fragments, together with parts of the oxide layer, are trapped on the exposed graphite (Figure 18b-D). The movement of these hardened fragments and hard parts of the oxide layer probably contributed strongly to the abrasive wear, traces of which are visible in Figure 18b-B.
Figure 19 shows the laser-hardened surface of ADI 9k6 310 after a 30 min tribological test. When comparing the hardened surface (Figure 19) and the non-hardened surface (Figure 18a) after an identical test length, a completely different behavior is visible at first glance. The hardened surface does not show areas (the aforementioned craters) where significant separation of the cast iron matrix has occurred. The trace of the tribological test is again partially covered by the oxide layer (Figure 19-A). The movement of the PIN during the test caused cracks to form, propagate, and interlock in this layer; the cracks are visible in Figure 19-F. The moving separated hard parts then probably contributed again to the abrasive damage, traces of which are visible in Figure 19-C.
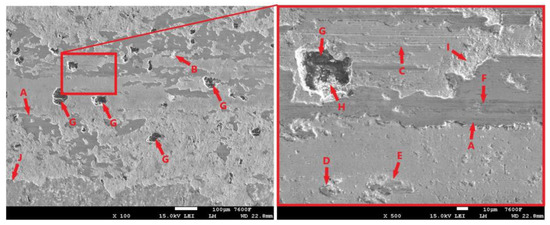
Figure 19.
Surface of the laser-hardened ADI 9k6 310 sample after a 30 min tribological test.
In general, the cast iron matrix did not show signs of significant delamination, with only minor traces of delamination visible on the surface (Figure 19-B). A portion of the matrix was separated with the oxide layer during the test (Figure 19-I). The laser-hardened matrix did not show significant distortion even around the aforementioned graphite heterogeneities (Figure 19-G). The amount of particles that accumulated on the graphite surface during the 11 min control test (Figure 18b-D) was greatly reduced during this main measurement (Figure 19-H). The surface of the cast iron also shows minor signs of adhesive wear (Figure 19-E). More fundamental damage could have been prevented by the oxide layer, which limited the contact between the PIN and the cast iron matrix. An oxide layer was present on the laser-blinded surface (Figure 19-J), but this was broken fairly quickly during the test.
3.2.5. Progress of the ADI 9k6 400 Tribological Test
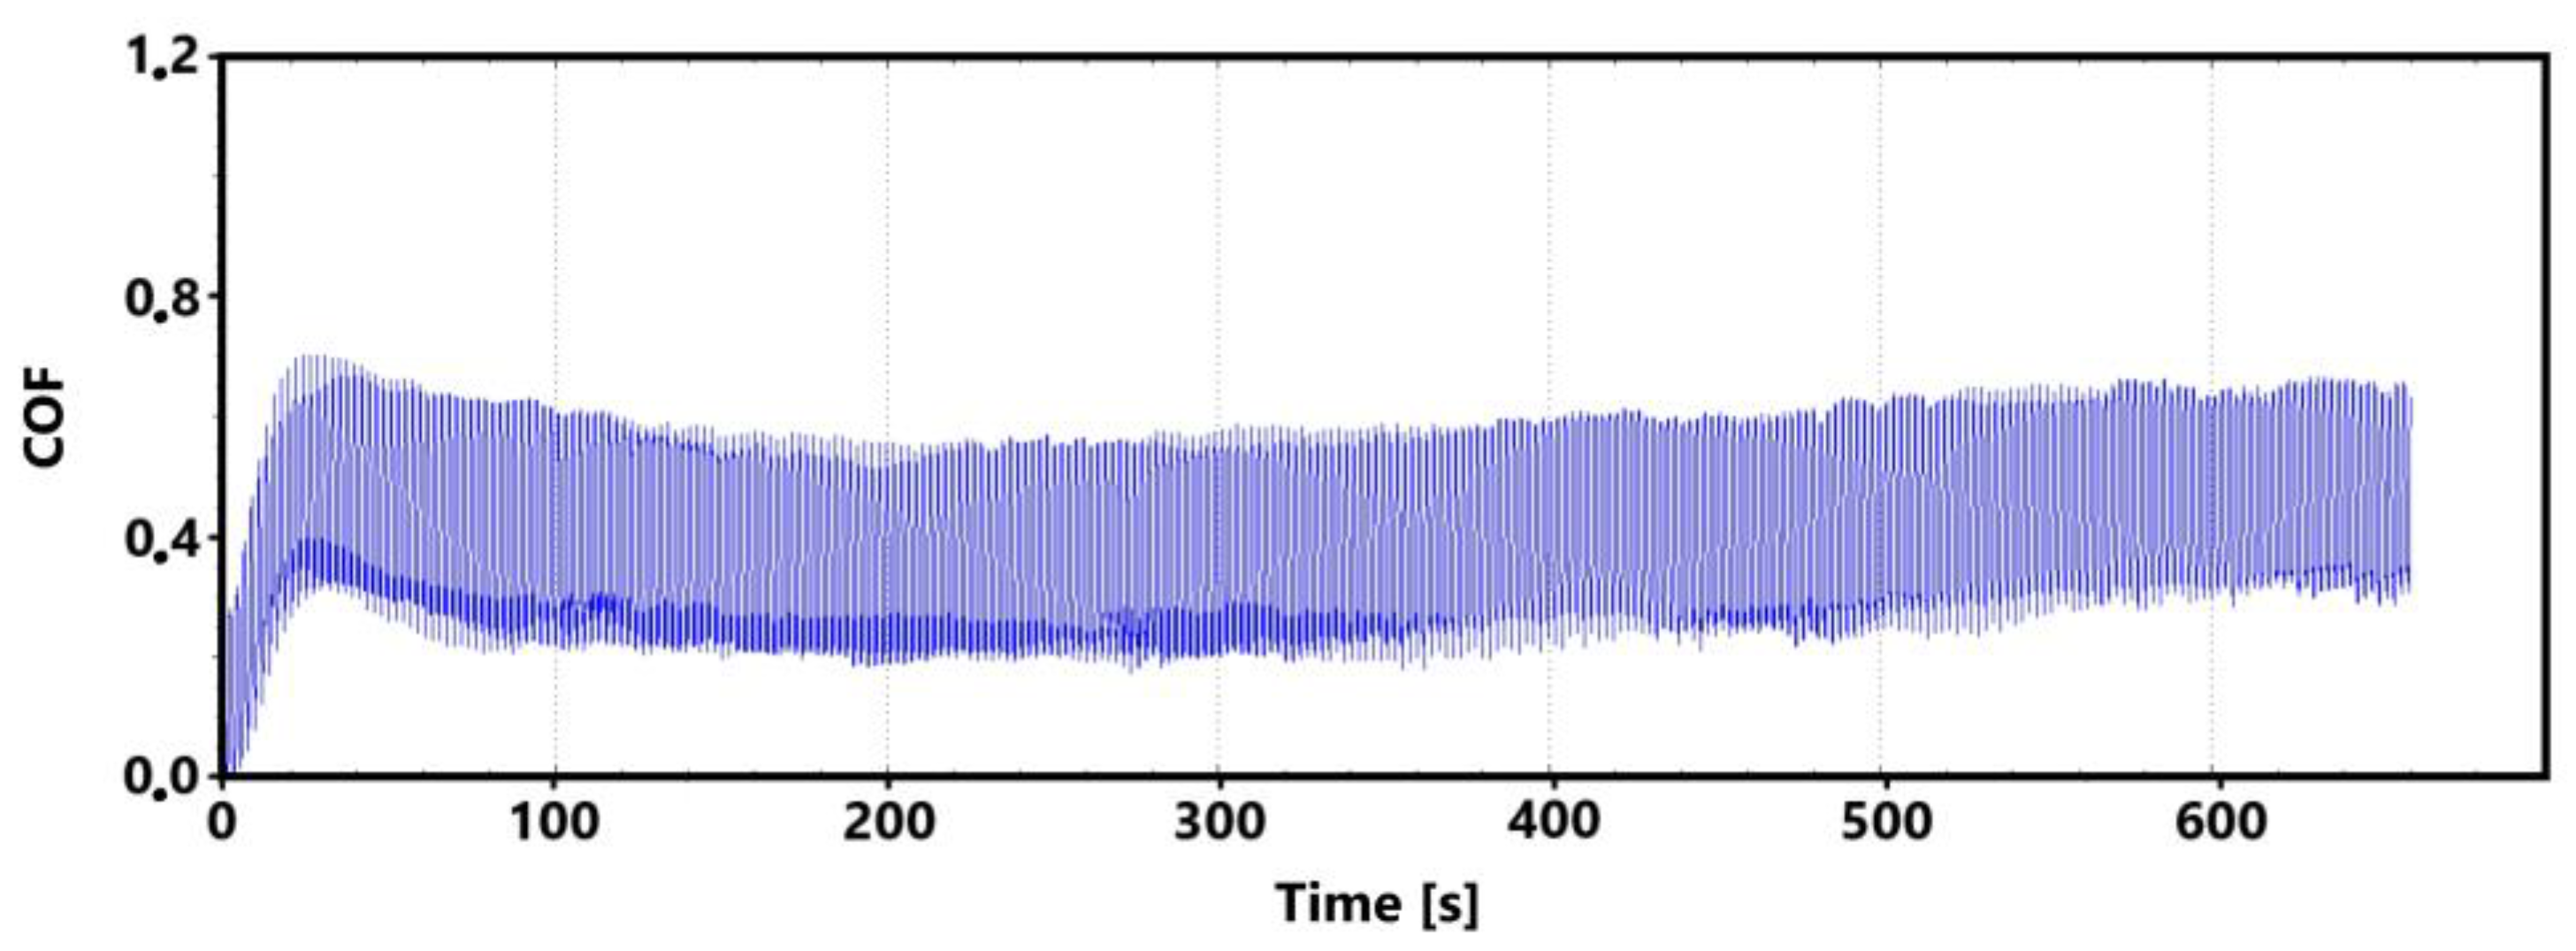
Figure 20 is a record of the friction coefficient for the non-laser-hardened surface of the ADI 9k6 400 specimen, which was subjected to a 30 min tribological test. It can be seen from this record that the values of the friction coefficient exhibit considerable scatter when the tribological pair is being run in.

Figure 20.
Record of the friction coefficient of the non-laser-hardened surface of the ADI 9k6 400 sample (30 min).
As mentioned several times, such dispersion of values can be caused by a number of factors. An example is the formation and subsequent breaking of the oxide layer; a larger graphite formation, which is gradually revealed, can also play a crucial role. In the 11 min control measurement (Figure 21), such significant dispersion of the value is not visible. The values of the friction coefficient stabilized only during the 16th minute of the test.

Figure 21.
Record of the friction coefficient of the non-laser-hardened surface of the ADI 9k6 400 sample (control measurement, 11 min).
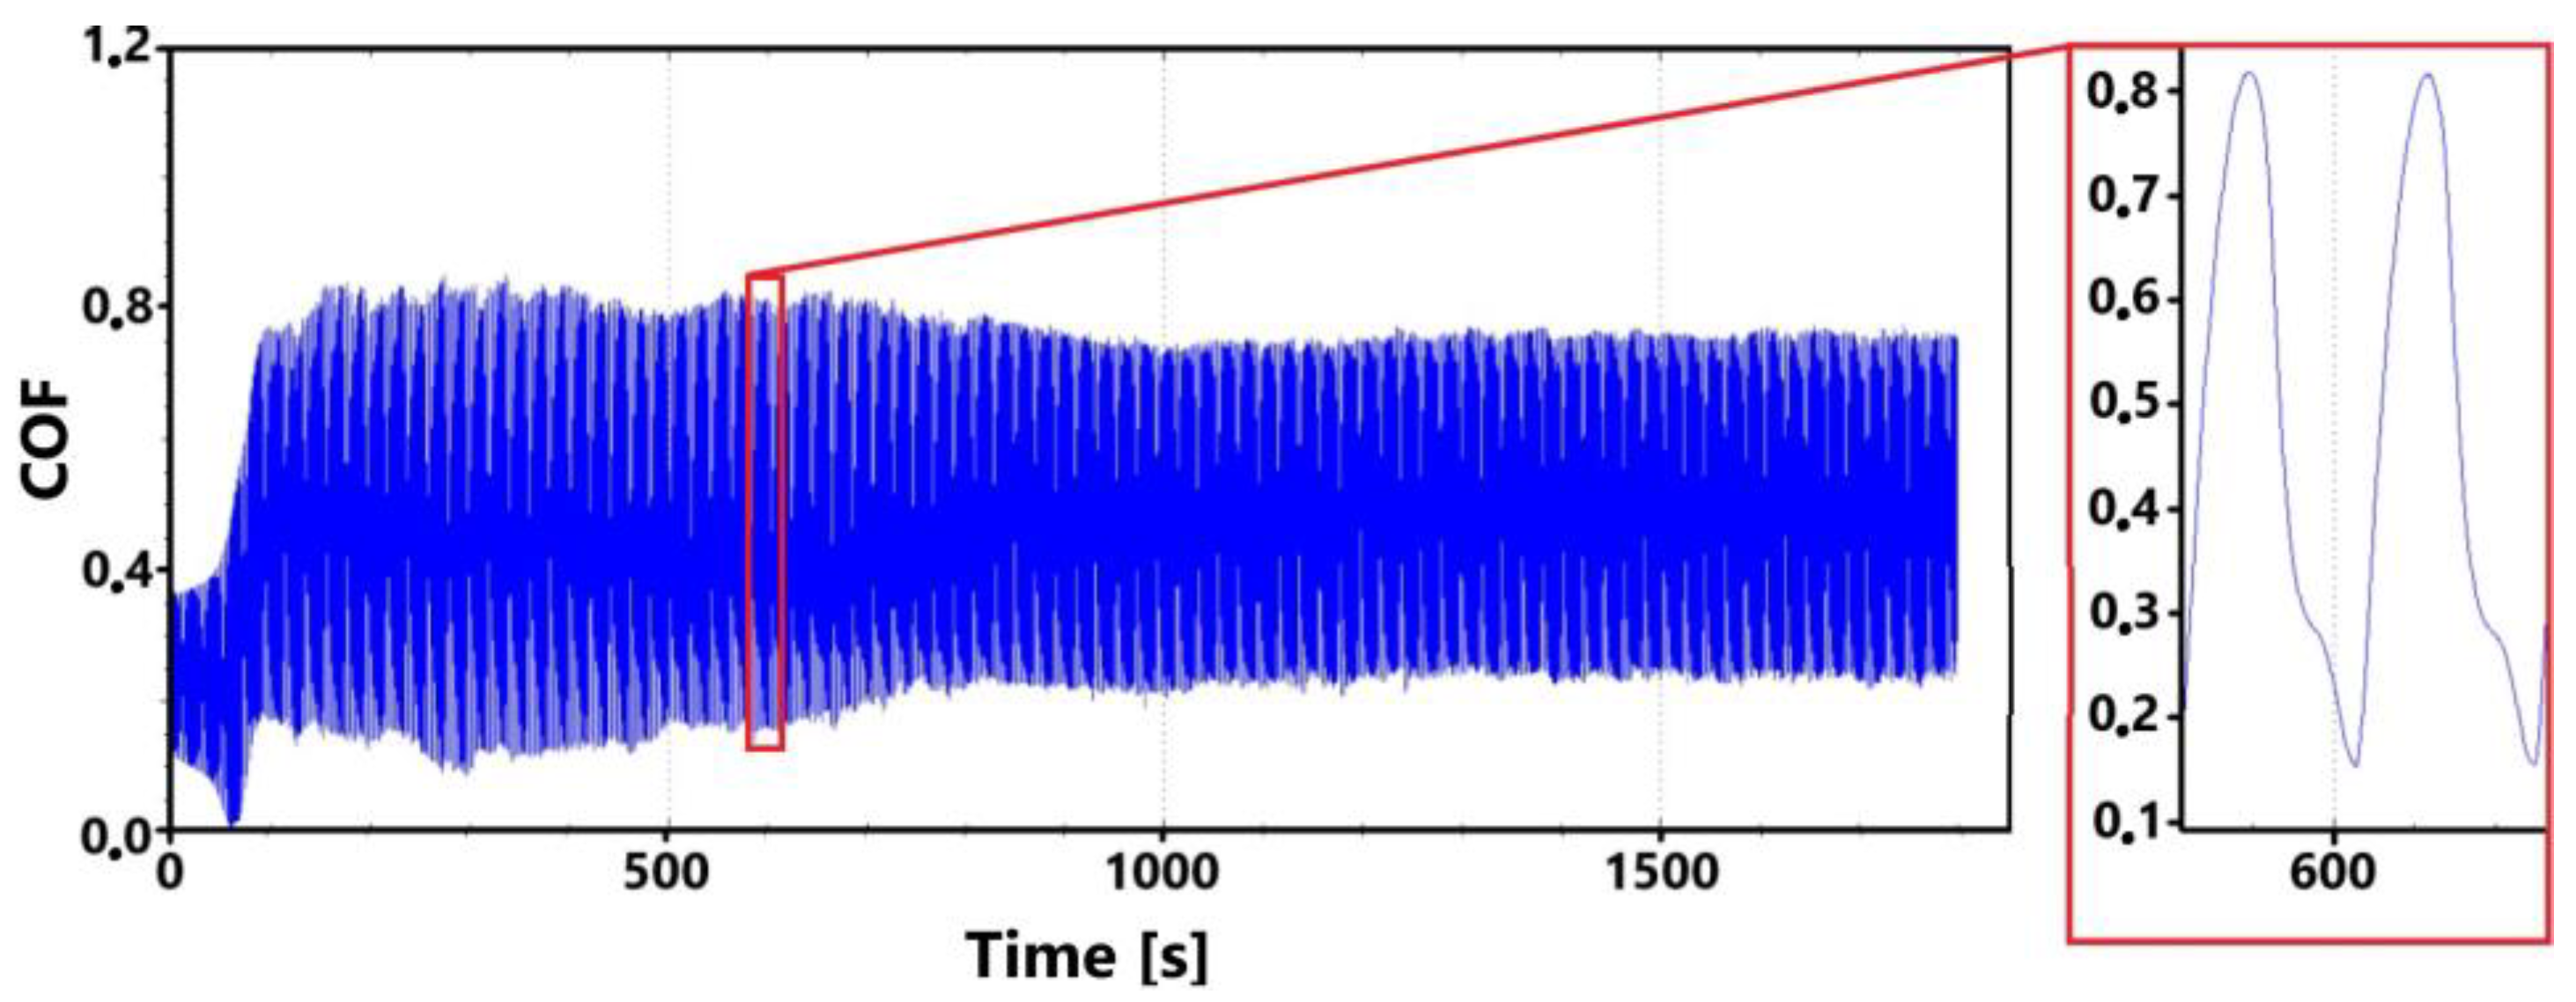
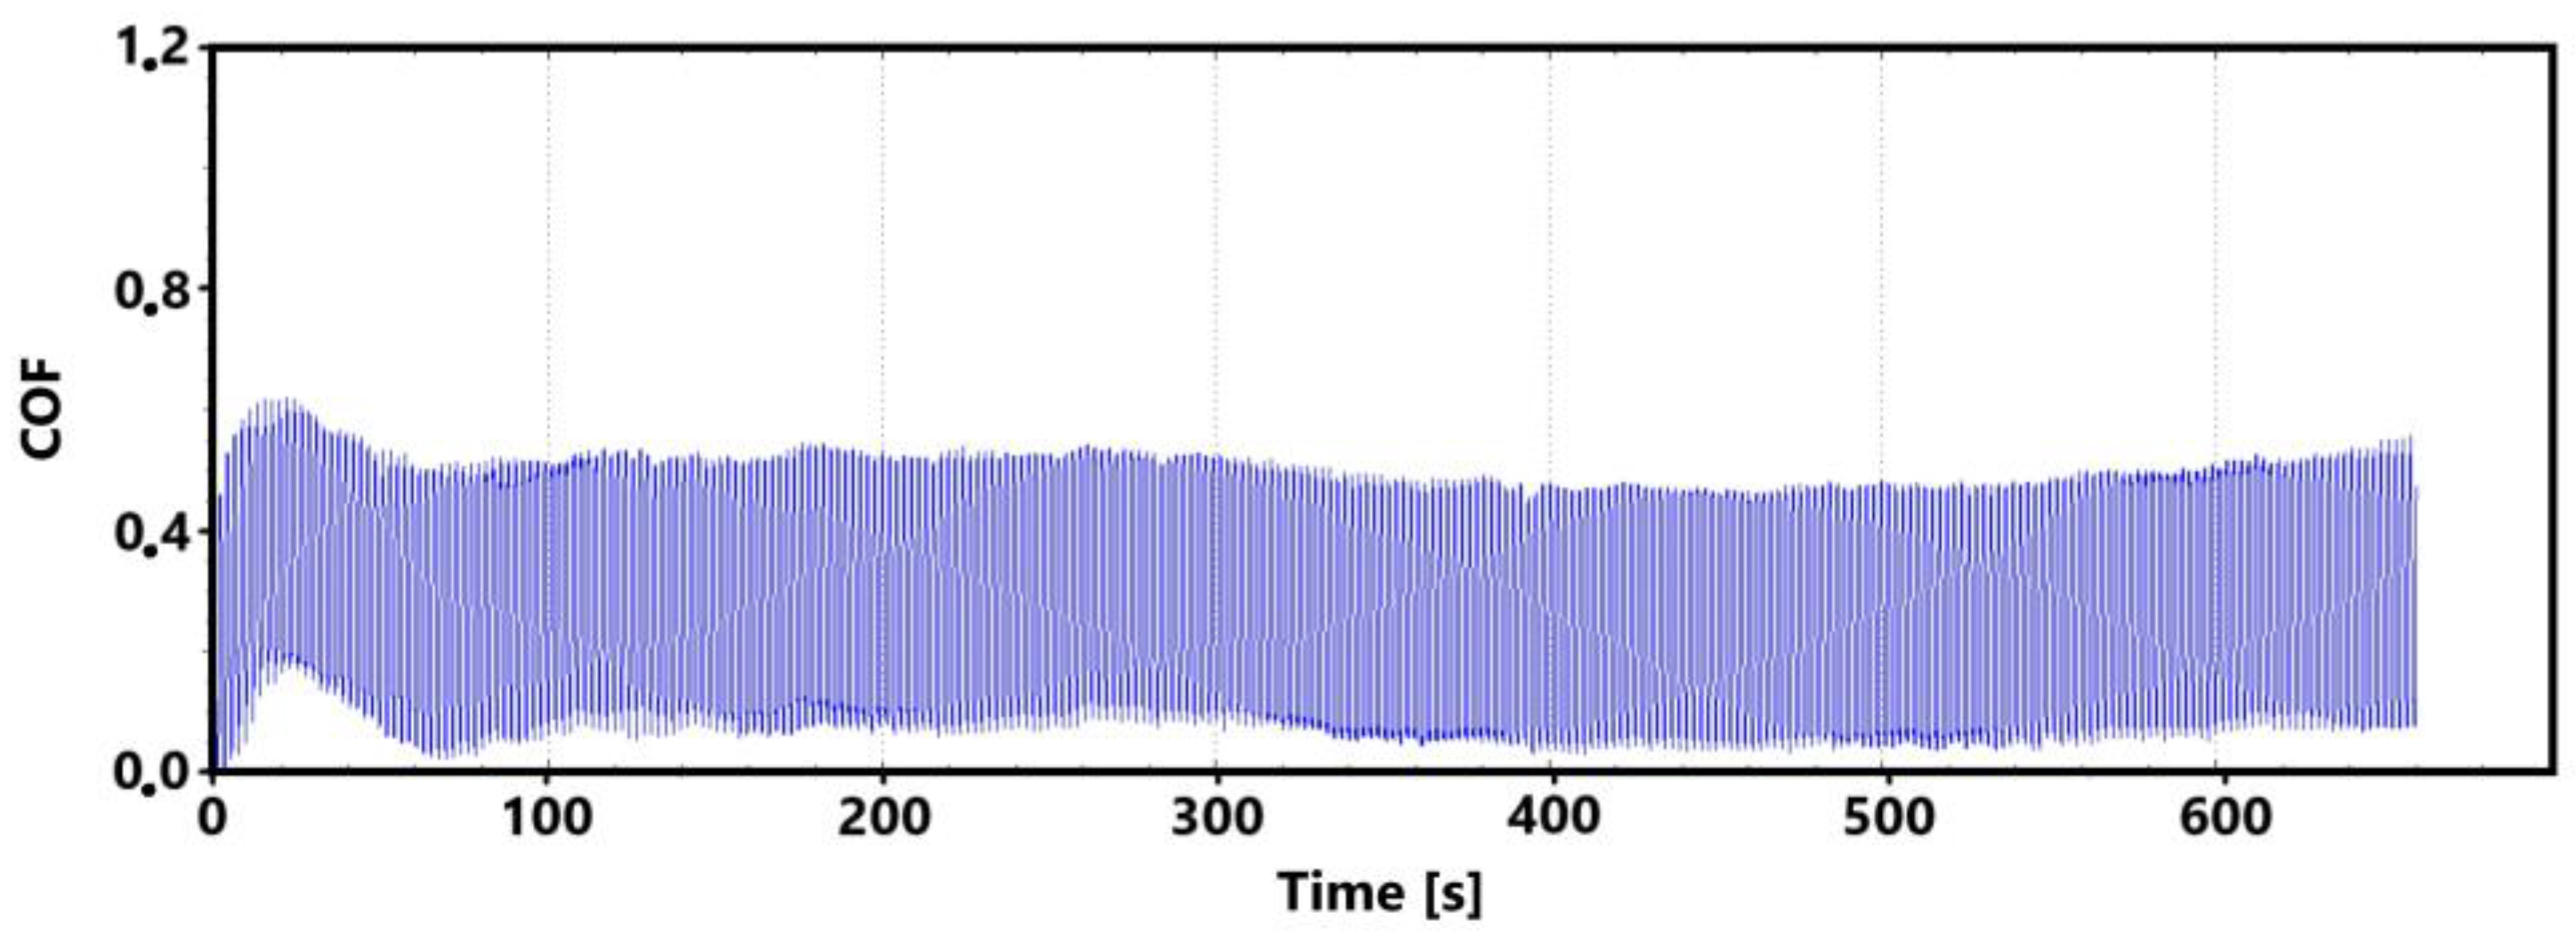
A record of the friction coefficient for the surface of the laser-hardened ADI 9k6 400 specimen is shown in Figure 22 for the main (30 min) test. It can be observed from this record that despite a slight initial fluctuation in the friction coefficient values as the tribological pair is being run in, the measured values are relatively stable until the 9th minute of the test. This initial stability was confirmed by the control (11th minute) measurement (Figure 23). However, a gradual increase in friction coefficient values can be observed thereafter in the recording (Figure 22). This increase may be due to a number of factors.
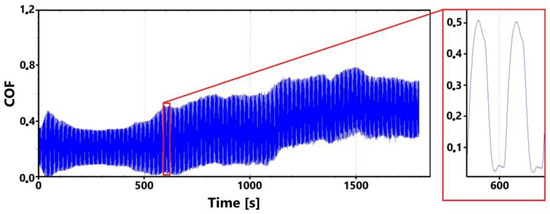
Figure 22.
Record of the friction coefficient of the laser-hardened surface of the ADI 9k6 400 sample (30 min).
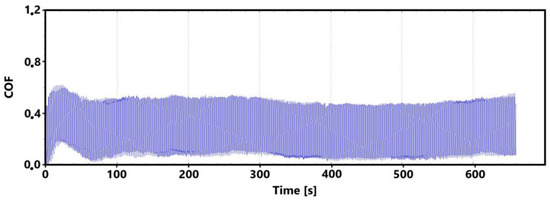
Figure 23.
Record of the friction coefficient of the laser-hardened surface of the ADI 9k6 400 sample (control measurement, 11 min).
The movement of the PIN leads to the displacement of separated parts, which is probably one of the main causes of the abrasive wear whose traces are visible on the sample surface. In this way, the values of the friction coefficient may have gradually increased.
Analysis of the hardened surfaces after the tribological test shows that the surface subjected to the 11 min tribological test is covered with a relatively compact oxide layer. On the other hand, the surface of the sample subjected to the longer 30 min test shows significant distortion of the oxide layer and the cast iron matrix.
3.2.6. Surface Analysis of the ADI 9k6 400 Sample after the Tribological Test
Figure 24a shows the surface of a non-hardened specimen that was subjected to a 30 min tribological test. The test-worn surface is largely covered again with an oxide layer (Figure 24a-A). However, this layer is not very continuous. Throughout the footprint (which was created by the movement of the PIN), particularly at its edge, there are visible areas where there has been a significant separation of the base material (Figure 24a-D). As this delamination occurs throughout the surface, it is unlikely to be due to the presence of graphite. In that case, there would be a local separation of the matrix. In this case, however, it is more likely to be fatigue damage to the surface layers of the cast iron. Adhesive wear may also have contributed to the delamination, traces of which are also visible on the surface of the sample (Figure 24a-J). Figure 24a also shows a place where a more pronounced separation of the matrix occurred around the graphite (Figure 24a-E,G). Graphite, as a surface heterogeneity and stress concentrator, contributes to the formation of cracks, which can gradually (under further loading) spread through the surface layers (Figure 24a-H). Areas are also visible on the surface where the oxide layer (Figure 24a-I) and the cast iron matrix (Figure 24a-D) have been broken, probably due to loading and deformation of the brittle oxide layer. The surface bears signs of the displacement of the oxide layers (Figure 24a-C); the main track mainly contains smaller fragments (Figure 24a-F). The movement of these separated parts of the surface then probably contributed to the abrasive damage to the surface; traces of abrasion are visible in Figure 24a-B.
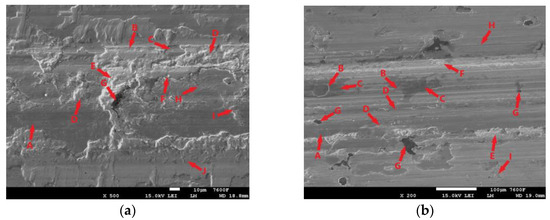
Figure 24.
ADI 9k6 400: (a) The surface of a non-laser-hardened ADI 9k6 400 sample after a 30 min tribological test; (b) The surface of the laser-hardened sample after an 11 min tribological test.
The laser-hardened surface of the ADI 9k6 400 sample after the 11 min tribological test is shown in Figure 24b. Again, an oxide layer is present on the surface (Figure 24b-A); in this case, it is quite compact. However, there are signs of its breakage. One reason for this breach may be graphite. The figure shows where heterogeneities in the form of graphite have affected the surrounding matrix, causing more intense stresses on the matrix. The consequence is the formation, propagation, and interconnection of cracks around these graphite formations (Figure 24b-B). These cracks likely released some graphite (Figure 24b-C), which was subsequently spread by the movement of the PIN. The exposed graphite is visible in Figure 24b-G.
The surface also contains cracks that are oriented in the longitudinal direction of the PIN trace (Figure 24b-D). Given the distribution of these cracks, they are probably not the result of the presence of graphite but of fatigue damage to the surface layers. Significant delamination is also evident at the edges of the trace (Figure 24b-E). Adhesive wear, traces of which are evident on the surface of the sample, may have contributed to the surface delamination (Figure 24b-I). Traces of abrasion are also evident on the surface (Figure 24b-H), the likely cause being the movement of detached parts of the surface (Figure 24b-F).
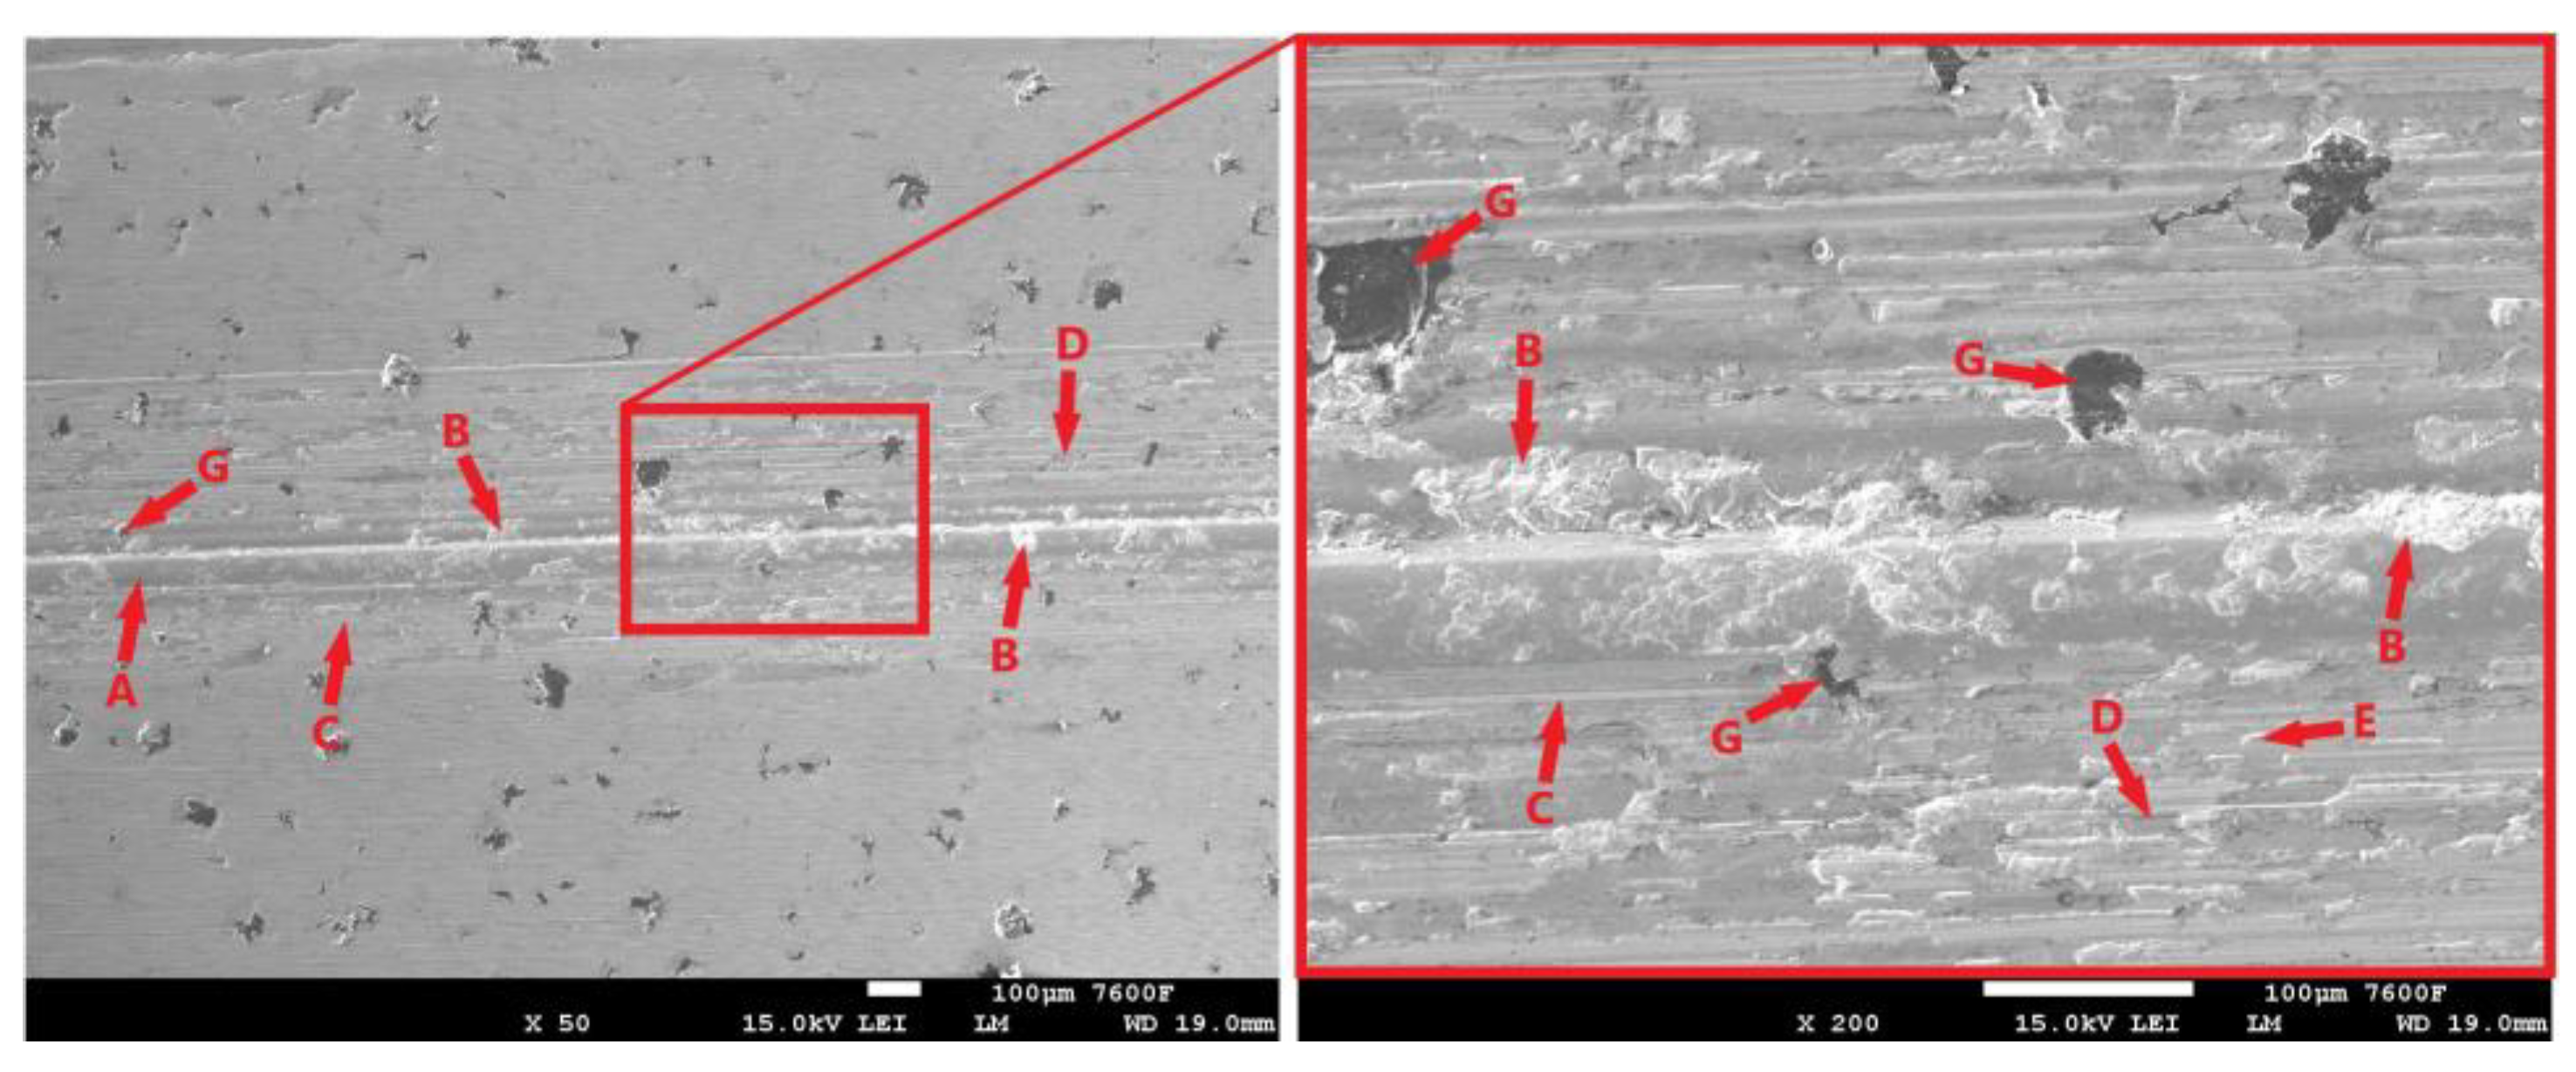
Figure 25 shows the surface of the laser-hardened sample after a 30 min tribological test. The surface is again covered with an oxide layer (Figure 25-A). Compared to the surface of the sample subjected to the shorter 11 min test (Figure 24-B), the oxide layer is significantly less compact in this case. The longitudinal cracks that were present on the sample surface after the shorter test apparently contributed to the delamination of the surface layers (Figure 25-B). The tribological test progressively revealed graphite formations that may have contributed to the delamination of the surface. However, the surrounding matrix around the exposed graphite formations did not appear to be fundamentally disturbed in any way. The movement of detached parts of the hard oxide layer (Figure 25-D) and parts of the base material was probably one of the main causes of the abrasive damage, traces of which are visible on the surface (Figure 25-C). Contact between the PIN and the exposed base material may have led to adhesive damage, traces of which are visible in Figure 25-E. More intense adhesive wear was probably prevented by the presence of the oxide layer.

Figure 25.
Surface of the laser-hardened ADI 9k6 400 sample after a 30 min tribological test.
3.3. Discussion
From the metallographic analysis of the tested cast iron samples, it is evident that the changes in structure associated with laser exposure are very similar for all tested samples. In the laser-hardened samples, the initial ausferritic structure has been transformed, while the surface layers of the hardened samples are mainly composed of martensite and residual austenite. At the same time, there are transition regions between the hardened surface and the non-hardened core, which are formed by coarser martensite.
The resulting values of the friction coefficient for each specimen are given in Table 3. Given the type of motion (linear reciprocating) that the PIN performed during the test, it would theoretically be possible to evaluate both the static and dynamic friction coefficients. However, the software of the tribometer used does not offer this possibility. For this reason, the average values of the (static and dynamic) friction coefficient are given in Table 3 below.
Table 3.
Average COF values for individual samples.
For the sample whose isothermal refinement temperature was the lowest of the tested samples (240 °C), ADI 9k6 240, the trend of the friction coefficient is quite clear. The laser-hardened surface shows significantly lower values than the non-hardened surface. It can also be seen from Table 3 that for the main and control measurements, the values are slightly different; the main reason for this is the run-in phase of the tribological pair, which, for the shorter (11 min) test, makes up a significantly larger proportion.
The same is true for the sample which, on the other hand, was isothermally cured at the highest temperature tested (400 °C). The ADI 9k6 400 sample also shows lower friction coefficient values for the laser-hardened surface. For this sample, there is a relatively high difference between the average friction coefficient values for the main and control measurements. This difference is probably related to the evolution of the values (seen in the record, Figure 22) during the test. This is because initially the tribological pair shows relatively stable values. This stability was confirmed by the control measurement, which largely consists of just this phase. The main measurement then showed a gradual increase in values, which could not be seen in the shorter control measurement. For this reason, the values for the two types of testing differ significantly. In the case of sample ADI 9k6 310, which was isothermally hardened at 310 °C, there is no significant difference between the values of the laser-hardened and non-hardened surfaces. The hardened surface even shows slightly higher friction coefficient values. Here, the different properties of the laser-hardened surface may play a role, which may be due to the different distribution of carbon in the starting material. As already mentioned, the distribution of carbon in isothermally hardened cast irons as a function of isothermal residence temperature is still a subject of research and discussion. Thus, it is not possible to clearly assess the influence of this factor. After the tamping phase, all three samples show very similar values of the friction coefficient.
Figure 26 shows the average friction coefficient values for the individual measurements graphically for better clarity. It is quite clear from this figure that the friction coefficient of the non-hardened surface decreased as the temperature of the tested samples increased with increasing isothermal hardening temperature. This dependence confirms some publications [29,30].
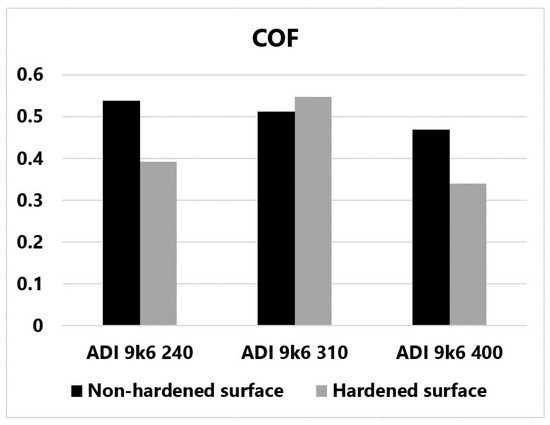
Figure 26.
Graphically displayed average COF values for individual samples.
According to the authors of these publications, austenite can be transformed into martensite under certain circumstances. The most important factor is a sufficiently high contact pressure. According to the authors, cast irons hardened at higher temperatures should be more susceptible to martensitic transformation. These cast irons contain the block austenite mentioned in the introduction. Thin-film austenite, which is contained in cast irons with lower isothermal holding temperatures, is not nearly as susceptible to martensitic transformation. The change in carbon concentration in the stabilized high-carbon austenite plays a crucial role here. Austenite with a higher carbon concentration is significantly more stable, and its martensitic transformation is strongly limited. Another factor may be the different nature of the loading of the larger block austenite. However, as already mentioned, this issue is still a subject of research and discussion. This issue is discussed in more detail in the introduction to this paper.
When analyzing the behavior of the tested samples by scanning electron microscopy, the most significant difference in behavior is seen in the ADI 9k6 310 sample. The surface of this non-hardened sample showed the worst behavior after the tribological test. After the 30 min test, the surface was covered with traces of deep matrix separation of the cast iron. These traces are evident across the full width of the footprint created by the movement of the pin. The separation and subsequent movement of the strengthened parts also resulted in significant abrasion of the sample surface. The laser-hardened surface, on the other hand, exhibited completely different behavior, the surface showed no signs of such fundamental disruption of the surface layers as in the case of the non-hardened surface. The oxide layer formed during the test is relatively non-compact. The surface also shows signs of abrasive wear. There was no significant surface disturbance even around the graphite, which has significant heterogeneity of structure and a significant stress concentration around it.
3.4. Conclusions
During surface laser hardening, all samples were transformed from the initial ausferritic structure to a homogeneous martensitic structure (the carbon distribution in the initial ausferritic structure is thus sufficiently uniform to obtain a homogeneous martensite layer). The metallography then shows that this martensite layer also contains a small proportion of residual austenite. The samples also show transition regions between the fine martensite in the hardened surface and the ausferritic core. This transition zone is made up of coarser martensite. The laser treatment increased the surface hardness up to 1100 HV0.1. This hardness gradually decreased to a depth of 0.8–1 mm, where it reached the level of the initial ausferritic structure.
During the tribological test, strong oxidation of the surface due to loading was observed for all samples. The oxide layer thus formed limited the development of adhesive wear. The change in the coefficient of friction due to surface laser hardening is not entirely clear. In the case of ADI 9k6 240 and ADI 9k6 400, the coefficient of friction decreased due to the laser treatment. For sample ADI 9k6 310, there was a slight increase in COF after laser hardening. This sample has the highest hardness after laser hardening and at the same time the greatest change in tribological properties. On the surface of the non-laser-hardened sample of this cast iron, areas of large damage were observed after tribological testing, essentially crater formation with separated base material. For the same cast iron after laser hardening, no major surface damage was observed after the tribological test (the surface was very compact even after the tribological test). All these phenomena may be related to the different carbon distribution in ADI castings depending on their isothermal retention temperature (the carbon distribution then also affects the properties of the martensitic structure formed).
Interesting is the trend (for unhardened specimens) of decreasing friction coefficient with increasing temperature of ADI isothermal holding of cast iron. Higher temperatures lead to a coarser structure that contains high-carbon austenite retained in relatively large blocks. Such austenite may be susceptible to martensitic transformation at sufficiently high contact pressures, which will essentially increase the strength and hardness of the surface layers. This may result in a reduction in the coefficient of friction.
Author Contributions
Conceptualization, L.Z.; methodology, L.Z., J.H. and J.K. (Jiří Kuchař); sample preparation, L.Z. and J.K. (Jan Krčil); investigation, L.Z., J.H. and J.K. (Jiří Kuchař); writing—original draft preparation, L.Z., J.H. and J.K. (Jiří Kuchař); writing—review and editing, L.Z. and J.K. (Jan Kudláček); supervision, J.K. (Jan Kudláček). All authors have read and agreed to the published version of the manuscript.
Funding
The research was funded by the Technology Agency of the Czech Republic, research project—Research center for surface treatments No. TE02000011.
Institutional Review Board Statement
Not applicable.
Informed Consent Statement
Not applicable.
Data Availability Statement
Data is contained within the article.
Acknowledgments
The research was supported with students by project SGS22/156/OHK2/3T/12—Influence of surface treatments on the quality of production technologies.
Conflicts of Interest
The authors declare no conflict of interest.
References
- Huai, W.; Zhang, C.; Wen, S. Graphite-based solid lubricant for high-temperature lubrication. Friction 2020, 9, 1660–1672. [Google Scholar] [CrossRef]
- Scharf, T.W.; Prasad, S. Solid lubricants: A review. J. Mater. Sci. 2013, 48, 511–531. [Google Scholar] [CrossRef]
- Hase, A. Visualization of the tribological behavior of graphite in cast iron by in situ observations of sliding interfaces. Tribol. Int. 2019, 138, 40–46. [Google Scholar] [CrossRef]
- Sugishita, J.; Fujiyoshi, S. The effect of cast iron graphites on friction and wear performance I: Graphite film formation on grey cast iron surfaces. Wear 1981, 66, 209–221. [Google Scholar] [CrossRef]
- Meier, L.; Hofmann, M.; Saal, P.; Volk, W.; Hofmann, H. In-situ measurement of phase transformation kinetics in austempered ductile iron. Mater. Charact. 2013, 85, 124–133. [Google Scholar] [CrossRef]
- Catalán, N.; Esteban, R.; Adrian, B.; Diego, C. Surface Laser Treatment of Cast Irons: A Review. Metals 2022, 12, 562. [Google Scholar] [CrossRef]
- Frocisz, L.; Matusiewicz, P.; Krawczyk, J. Effect of Varying the Volume Fractions of Ledeburitic Cementite and Graphite on the Tribological Properties of Commercially Used Cast Irons. Lubricants 2023, 11, 498. [Google Scholar] [CrossRef]
- Tewary, U.; Paul, D.; Mehtani, H.K.; Bhagavath, S.; Alankar, A.; Mohapatra, G.; Sahay, S.S.; Panwar, A.S.; Karagadde, K.; Samajdar, I. The origin of graphite morphology in cast iron. Acta Mater. 2022, 226, 117660. [Google Scholar] [CrossRef]
- Zhang, N.; Zhang, J.; Lu, L.; Zhang, M.; Zeng, D.; Song, Q. Wear and friction behavior of austempered ductile iron as railway wheel material. Mater. Des. 2016, 89, 815–822. [Google Scholar] [CrossRef]
- Wang, X.; Du, Y.; Liu, C. Tribological behaviour and wear mechanism of ADI with different hardness values. Mater. Sci. Technol. 2023, 39, 2409–2416. [Google Scholar] [CrossRef]
- Liu, C.; Du, Y.; Wang, X.; Zheng, Q.; Zhu, X.; Zhang, D.; Liu, D.; Yang, C.; Jiang, B. Comparison of the tribological behavior of quench-tempered ductile iron and austempered ductile iron with similar hardness. Wear 2023, 520–521, 204668. [Google Scholar] [CrossRef]
- Hu, Z.; Du, Y. Mechanical and Tribological Behavior of Austempered Ductile Iron (ADI) under Dry Sliding Conditions. Lubricants 2023, 11, 182. [Google Scholar] [CrossRef]
- Bai, J.; Xu, H.; Chen, X.; Cao, W.; Zhang, X.; Xu, Y. Effect of tempering temperature on the wear behaviour of martensitic ductile iron. Mater. Sci. Technol. 2023, 39, 744–755. [Google Scholar] [CrossRef]
- Wang, B.; Barber, G.; Qui, F.; Zou, Q.; Yang, H. A Review: Phase Transformation and Wear Mechanisms of Single-Step and Dual-Step Austempered Ductile Irons. J. Mater. Res. Technol. 2020, 9, 1054–1069. [Google Scholar] [CrossRef]
- Alaalam, M.; Grech, M. Effect of Austenitizing Conditions on the Impact Properties of an Alloyed Austempered Ductile Iron of Initially Ferritic Matrix Structure. J. Mater. Eng. Perform. 1998, 7, 265–272. [Google Scholar] [CrossRef]
- Tissi, G.; Fonseca, G. Influence of austempering time and austempering temperature in microstructure and mechanical properties in austempered ductile iron. Int. J. Res.-GRANTHAALAYAH 2020, 8, 51–62. [Google Scholar] [CrossRef]
- Hegde, A.; Gurumurthy, B.M.; Hindi, J.; Sharma, S.; Gowrishankar, M.C. Effect of austempering temperature and manganese content on the impact energy of austempered ductile iron. Cogent Eng. 2021, 8, 1939928. [Google Scholar] [CrossRef]
- Hsu, C.-H.; Lin, K.-T. A study on microstructure and toughness of copper alloyed and austempered ductile irons. Mater. Sci. Eng. A 2011, 528, 5706–5712. [Google Scholar] [CrossRef]
- Yang, J.; Putatunda, S.K. Improvement in strength and toughness of austempered ductile cast iron by a novel two-step austempering process. Mater. Des. 2004, 25, 219–230. [Google Scholar] [CrossRef]
- Balos, S.; Rajnovic, D.; Dramicanin, M.; Labus, D.; Eric, O.; Grbovic-Novakovic, J.; Sidjamin, L. Abrasive wear behaviour of ADI material with various retained austenite content. Int. J. Cast Met. Res. 2016, 29, 187–193. [Google Scholar] [CrossRef]
- Wang, B.; Qiu, F.; Barber, G.; Pan, Y.; Cui, W.; Wang, R. Microstructure, Wear Behavior and Surface Hardening of Austempered Ductile Iron. J. Mater. Res. Technol. 2020, 9, 9838–9855. [Google Scholar] [CrossRef]
- Mussa, A.; Krakhmalev, P.; Bergstrom, J. Wear mechanisms and wear resistance of austempered ductile iron in reciprocal sliding contact. Wear 2022, 498–499, 204305. [Google Scholar] [CrossRef]
- Batra, U.; Sharma, J.D. Wear Performance of Cu-Alloyed Austempered Ductile Iron. J. Mater. Eng. Perform. 2012, 22, 1136–1142. [Google Scholar] [CrossRef]
- Sandven, O.A. Laser surface hardening. In ASM Handbook Heat Treating; ASM International: Materials Park, OH, USA, 1991; Volume 4, pp. 665–689. [Google Scholar]
- Rajan, T.V.; Sharma, C.P.; Sharma, A. Laser Hardening. In Heat Treatment: Principles and Techniques, 2nd ed.; PHI Learning: New Delhi, India, 2011; pp. 148–151. [Google Scholar]
- Steen, W.M.; Mazumder, J. Laser heat treatment. In Laser Material Processing, 4th ed.; Springer: London, UK, 2010; pp. 297–309. [Google Scholar]
- Giorleo, L.; Semeraro, Q. Modelling of back tempering in laser hardening. Int. J. Adv. Manuf. Technol. 2011, 54, 969–977. [Google Scholar] [CrossRef]
- García Navas, V.; Lambarri, J.; Leunda, J.; Sanz, C.; Soriano, C. Effect of laser surface hardening on the microstructure, hardness and residual stresses of austempered ductile iron grades. Appl. Surf. Sci. 2011, 257, 7101–7106. [Google Scholar] [CrossRef]
- Du, Y.; Gao, X.; Wang, X.; Wang, X.; Ge, Y.; Jiang, B. Tribological behavior of austempered ductile iron (ADI) obtained at different austempering temperatures. Wear 2020, 456–457, 203396. [Google Scholar] [CrossRef]
- Zhang, J.; Zhang, N.; Zhang, M.; Zeng, D.; Song, Q.; Lu, L. Rolling-sliding wear of austempered ductile iron with different strength grades. Wear 2014, 318, 62–67. [Google Scholar] [CrossRef]


Disclaimer/Publisher’s Note: The statements, opinions and data contained in all publications are solely those of the individual author(s) and contributor(s) and not of MDPI and/or the editor(s). MDPI and/or the editor(s) disclaim responsibility for any injury to people or property resulting from any ideas, methods, instructions or products referred to in the content. |
© 2024 by the authors. Licensee MDPI, Basel, Switzerland. This article is an open access article distributed under the terms and conditions of the Creative Commons Attribution (CC BY) license (https://creativecommons.org/licenses/by/4.0/).