Article

Fatigue Behaviour and Life Prediction of YSZ Thermal Barrier Coatings at Elevated Temperature under Cyclic Loads

1
School of Energy and Power Engineering, Beihang University, Beijing 100191, China
2
College of Automation & College of Artificial Intelligence, Nanjing University of Posts and Telecommunications, Nanjing 210023, China
*
Author to whom correspondence should be addressed.
Coatings 2024, 14(8), 960; https://doi.org/10.3390/coatings14080960
Submission received: 10 July 2024 / Revised: 26 July 2024 / Accepted: 28 July 2024 / Published: 1 August 2024
(This article belongs to the Section Surface Characterization, Deposition and Modification)

Abstract

:
The concentration of interfacial normal stress at the free edges of thermal barrier coatings (TBCs) can result in coating spallation. Fatigue cracking is one of the main reasons for creating free edges under complex loads. It is crucial to investigate the fatigue cracking of coatings under cyclic loads to assess potential coating failure. To address this issue, a novel model was proposed to predict the fatigue life of the YSZ topcoat under stress parallel to the interface. Firstly, this study conducted uniaxial and tensile-torsional fatigue tests at elevated temperatures on specimens with atmospheric plasma-sprayed TBCs. The test results revealed that fatigue cracks appeared in the topcoat under cyclic loads, but these cracks did not propagate into the bondcoat or substrate immediately. The number of cycles before the topcoat cracked was found to be associated with the magnitude of the cyclic load. Secondly, this study analyzed the test conditions using the finite element method. Simulations indicated that the crack direction in the topcoat under complex loading conditions was aligned with the first principal stress direction. Finally, the fatigue life prediction model of the topcoat was established based on experiments and simulations. The predicted results fell within a fourfold scatter band.

1. Introduction

With the development of gas turbines to achieve better performance, the operating temperature requirements of turbine blades are increasing. The adoption of film-cooling technology and the preparation of thermal barrier coatings on the superalloy substrate are widely used for turbine blades to address these increased operating temperatures [1,2].
The widely-used thermal barrier coatings consist of a ceramic (7–8 wt% Yttria Stabilized Zirconia, i.e., YSZ) topcoat, and an MCrAlY bondcoat, which can be prepared by the atmospheric plasma spraying method (APS), the electron-beam physical vapor deposition method (EB-PVD), or the high-velocity oxygen-fuel method (HVOF) [3,4]. Multi-layer structures are prone to cracking and spalling under complex loads. The large-scale spallation of thermal barrier coatings can lead to the failure of cooling systems, which ultimately leads to turbine blade failures [5]. Therefore, evaluating the life of thermal barrier coatings is important for analyzing the life of turbines in gas turbine engines.
The primary task in analyzing the durability of coatings is to understand the underlying causes of coating failure. Coating failure mechanisms are complex [6]. The most prevalent failure mode is delamination due to strain mismatch [7]. This strain disparity between the coating and the substrate creates internal stresses within the coating. Significant shear and peel stresses are present at the edges of the coating or crack sites perpendicular to the coating interface. These interfacial stresses often serve as the initial trigger for delamination in multilayer structures under strain mismatch conditions [8,9,10], as shown in Figure 1. Several factors contribute to coating cracking, such as thermal cycling, which induces cracking due to cyclic thermal stresses [11]. Additionally, at elevated temperatures, plastic deformation and creep strain of the substrate may lead to coating cracking [12]. Moreover, cyclic mechanical stresses can also be responsible for coating cracks [13]. Nonetheless, there is limited research on the fatigue failure process of coatings on substrates under high temperatures, and there is also a scarcity of studies regarding the quantitative relationship between the magnitude of cyclic loads and the fatigue life of coatings.
In contemporary practice, prevalent fatigue life models encompass stress-based formulations (e.g., the Basquin model [14]), strain-based representations (e.g., the Manson–Coffin model [15]), and energy-based approaches [16]. Utilizing stress as a damage parameter to estimate fatigue life presents several advantages. First, it eliminates the necessity to differentiate between thermal strain and mechanical strain, making it especially convenient for thermal barrier coatings which subjected to thermal cycles. Second, by analyzing structural stress, fatigue life predictions can be made for areas experiencing asymmetric cyclic loads and significant stress gradients. This could be accomplished by introducing a parameter that is related to the local stress ratio and the local stress gradient. Consequently, stress-based fatigue life models are widely used in the fatigue life analysis of engineering structures. Typical stress-based fatigue life models include the Wöhler model [17] and the Basquin model [14].
Due to the complex shapes of actual coated structures, additional factors such as the effects of stress concentration and multi-axial loadings must be considered while predicting the fatigue life. Stress concentrations can occur in the coating near the cooling holes on the leading edges of turbine blades, which might greatly affect the fatigue strength of components [18]. Apart from the structural characteristics that cause stress concentration, the coating process introduces pores that also contribute to stress concentration within the material [19,20]. The stress concentrations induced by the pores in the materials can have nonnegligible effects on the mechanical properties of the structure [21]. Therefore, using life prediction models established for standard specimens to predict the fatigue life of structures with stress gradients is often overly conservative [22,23]. Under multi-axial loading conditions, the stress-strain response of materials becomes significantly more complex, affecting both the initiation and propagation paths of cracks. Then, a single fatigue life prediction model may not provide accurate results. Therefore, it is essential to modify fatigue analysis methods that account for the effects of multi-axial loads [24,25].
The work presented here intends to analyze the fatigue fracture of APS thermal barrier coatings under cyclic loads parallel to the coating interface and to establish a mathematical model to predict the fatigue life of the coatings. A series of fatigue tests were conducted on the superalloy specimens covered with thermal barrier coatings. The experimental process was monitored and parts of the specimens were investigated by the scanning electron microscope after tests. Finite element calculations were also performed to study the formation of the fatigue cracks. Based on the analysis of the above investigation, the fatigue life prediction model was proposed. Then the prediction results obtained from the proposed model were compared to the experimental results to validate the model’s accuracy.

2. Specimen Preparation and Experimental Procedure

2.1. Specimen Preparation

The substrate material of the specimens used for fatigue tests was directionally solidified alloy DZ411. The specimens were manufactured from 16 mm diameter bars. The nominal chemical composition of DZ411 alloy is listed in Table 1. The standard heat treatment regime of castings was as follows: solution treatment 1225 °C ± 10 °C, 2 h, air cooling; single aging, 1120 °C ± 10 °C, 2 h, air cooling; secondary aging, 850 °C ± 10 °C, 24 h, air cooling.
The specimens included uniaxial fatigue bars, uniaxial fatigue tubes with a radial hole, and one multiaxial fatigue tube with a radial hole. The diameter of the effective section of uniaxial fatigue bars was 6 mm. The length of the effective section was 12 mm. The outer diameter of the effective section of uniaxial fatigue tubes was 10 mm, and the inner diameter was 8 mm. Thus the thickness of the tube wall was 1 mm. The length of the effective section was 20 mm. The outer diameter of the effective section of multiaxial fatigue tubes was 12 mm, and the inner diameter was 10 mm. Thus the thickness of the tube wall was 1 mm. The length of the effective section was 30 mm. The radial holes in the tubes were set to simulate the cooling holes in the leading edge of the turbine blade. The diameter of the radial hole was 1 mm or 2 mm. The thermal barrier coatings covered the gauge section and the transition arc section, extending to the threaded position connecting to the fixture, while the multi-axis test specimen was sprayed up to the clamping section.
The bondcoat was prepared using the HVOF method, and consisted of MCrAlY powder with the following weight percentage composition: 10.5% Al, 18.6% Cr, 32.6% Co, 37.2% Ni, and 0.4% Y. The ceramic topcoat was made of 8% yttria-stabilized zirconia (8YSZ) and was applied using the Atmospheric Plasma Spraying (APS) method, with the weight percentage composition of 24.5% O, 67.5% Zr, and 8% Y. For coated bars, a 400 μ m thick topcoat and a 250 μ m thick bondcoat were prepared, while for thin-walled tubes, a 200 μ m thick topcoat and a 125 μ m thick bondcoat were applied. Geometries and images of different specimens are shown in Figure 2, Figure 3 and Figure 4. The regions with fill patterns are the position where the thermal barrier coatings cover.

2.2. Test Equipment

The fatigue tests at elevated temperatures were performed using the Instron 8852 servo-hydraulic system and an electric furnace with a capacity of 1000 °C. The fatigue testing process was recorded by a wide-range crack measuring instrument through the observation window of the furnace. This system allows for the capture of coating cracks at 100× magnification. Test equipment is shown in Figure 5a and the example of images obtained by the cracking measuring instrument is shown in Figure 5b.
For the uniaxial fatigue tests, specimens were connected to the fixtures via threaded ends, and an axial load was applied to the coated specimens through a hydraulic servo control system. In the tensile-torsional multiaxial fatigue tests, both axial force and torque were simultaneously transmitted to the specimens through the fixtures. The tests were load-controlled. The loading waveforms were in sinusoidal form at a frequency of 1 Hz.

3. Fatigue Experimental Procedure and Results

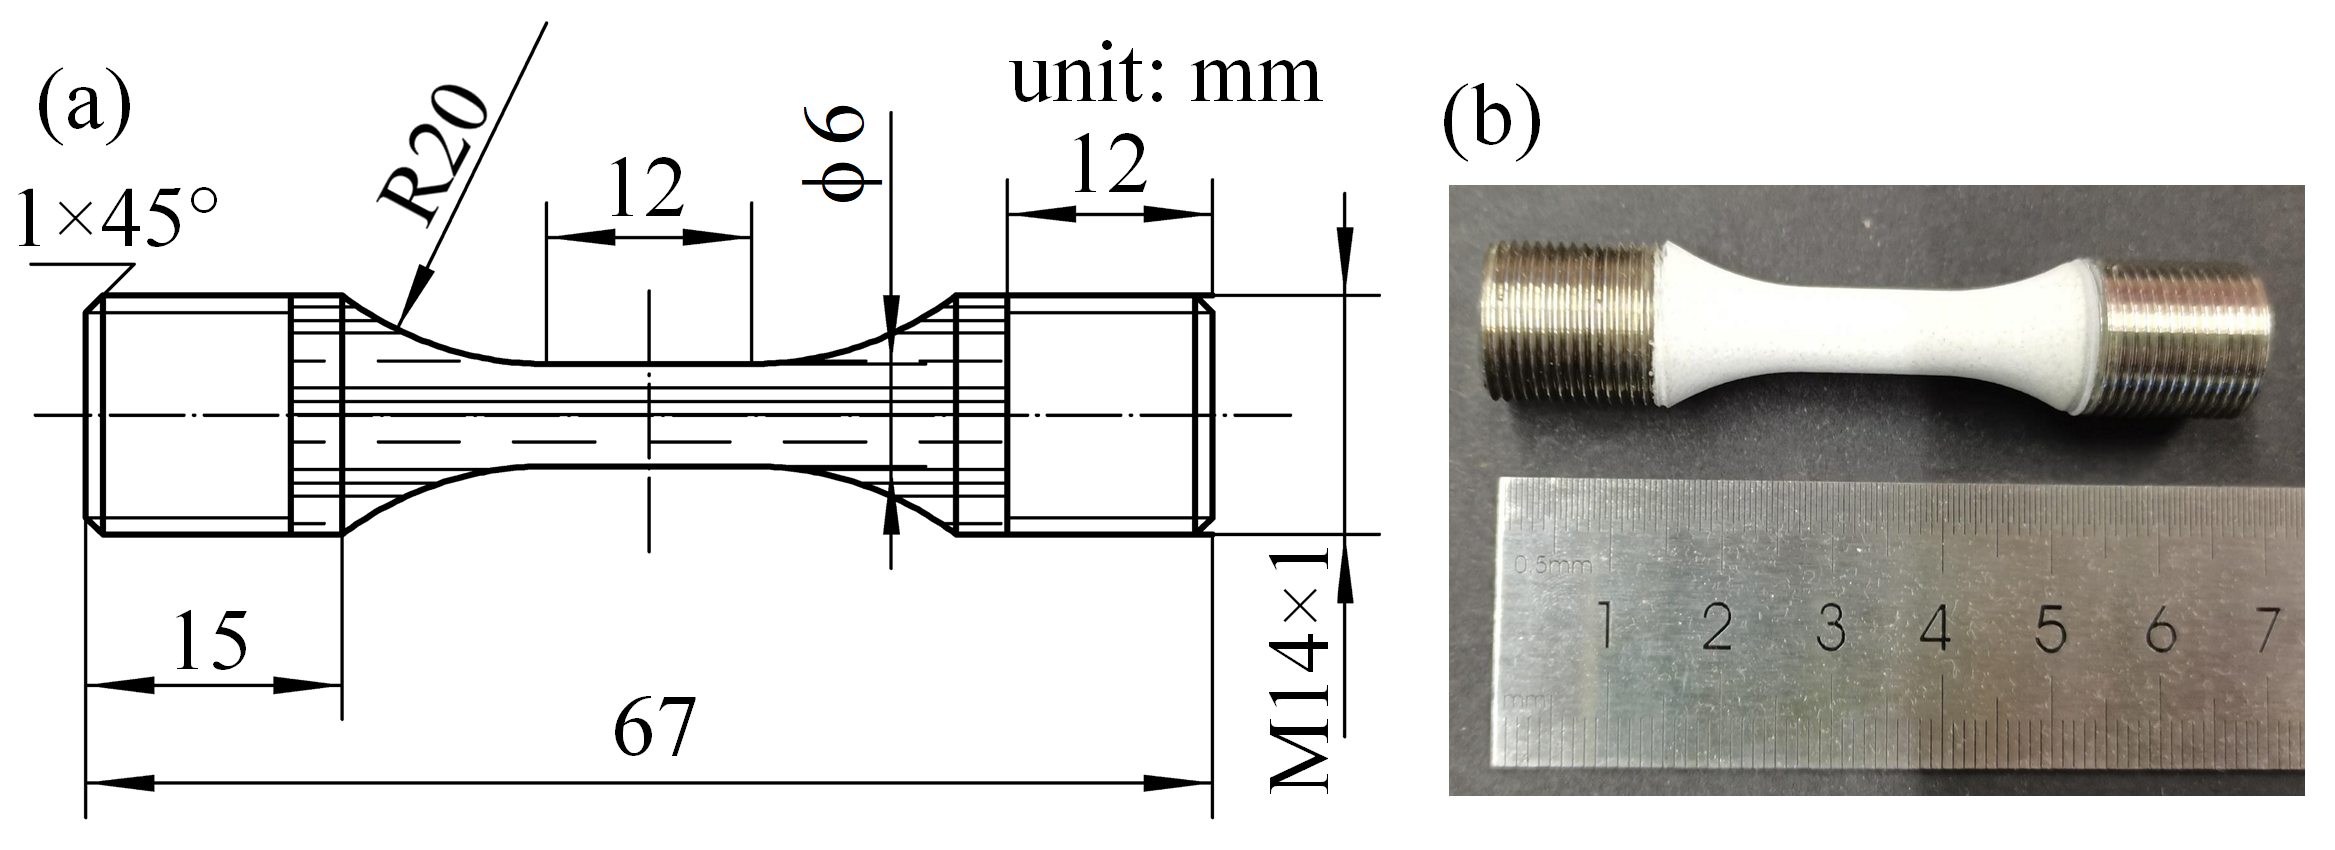
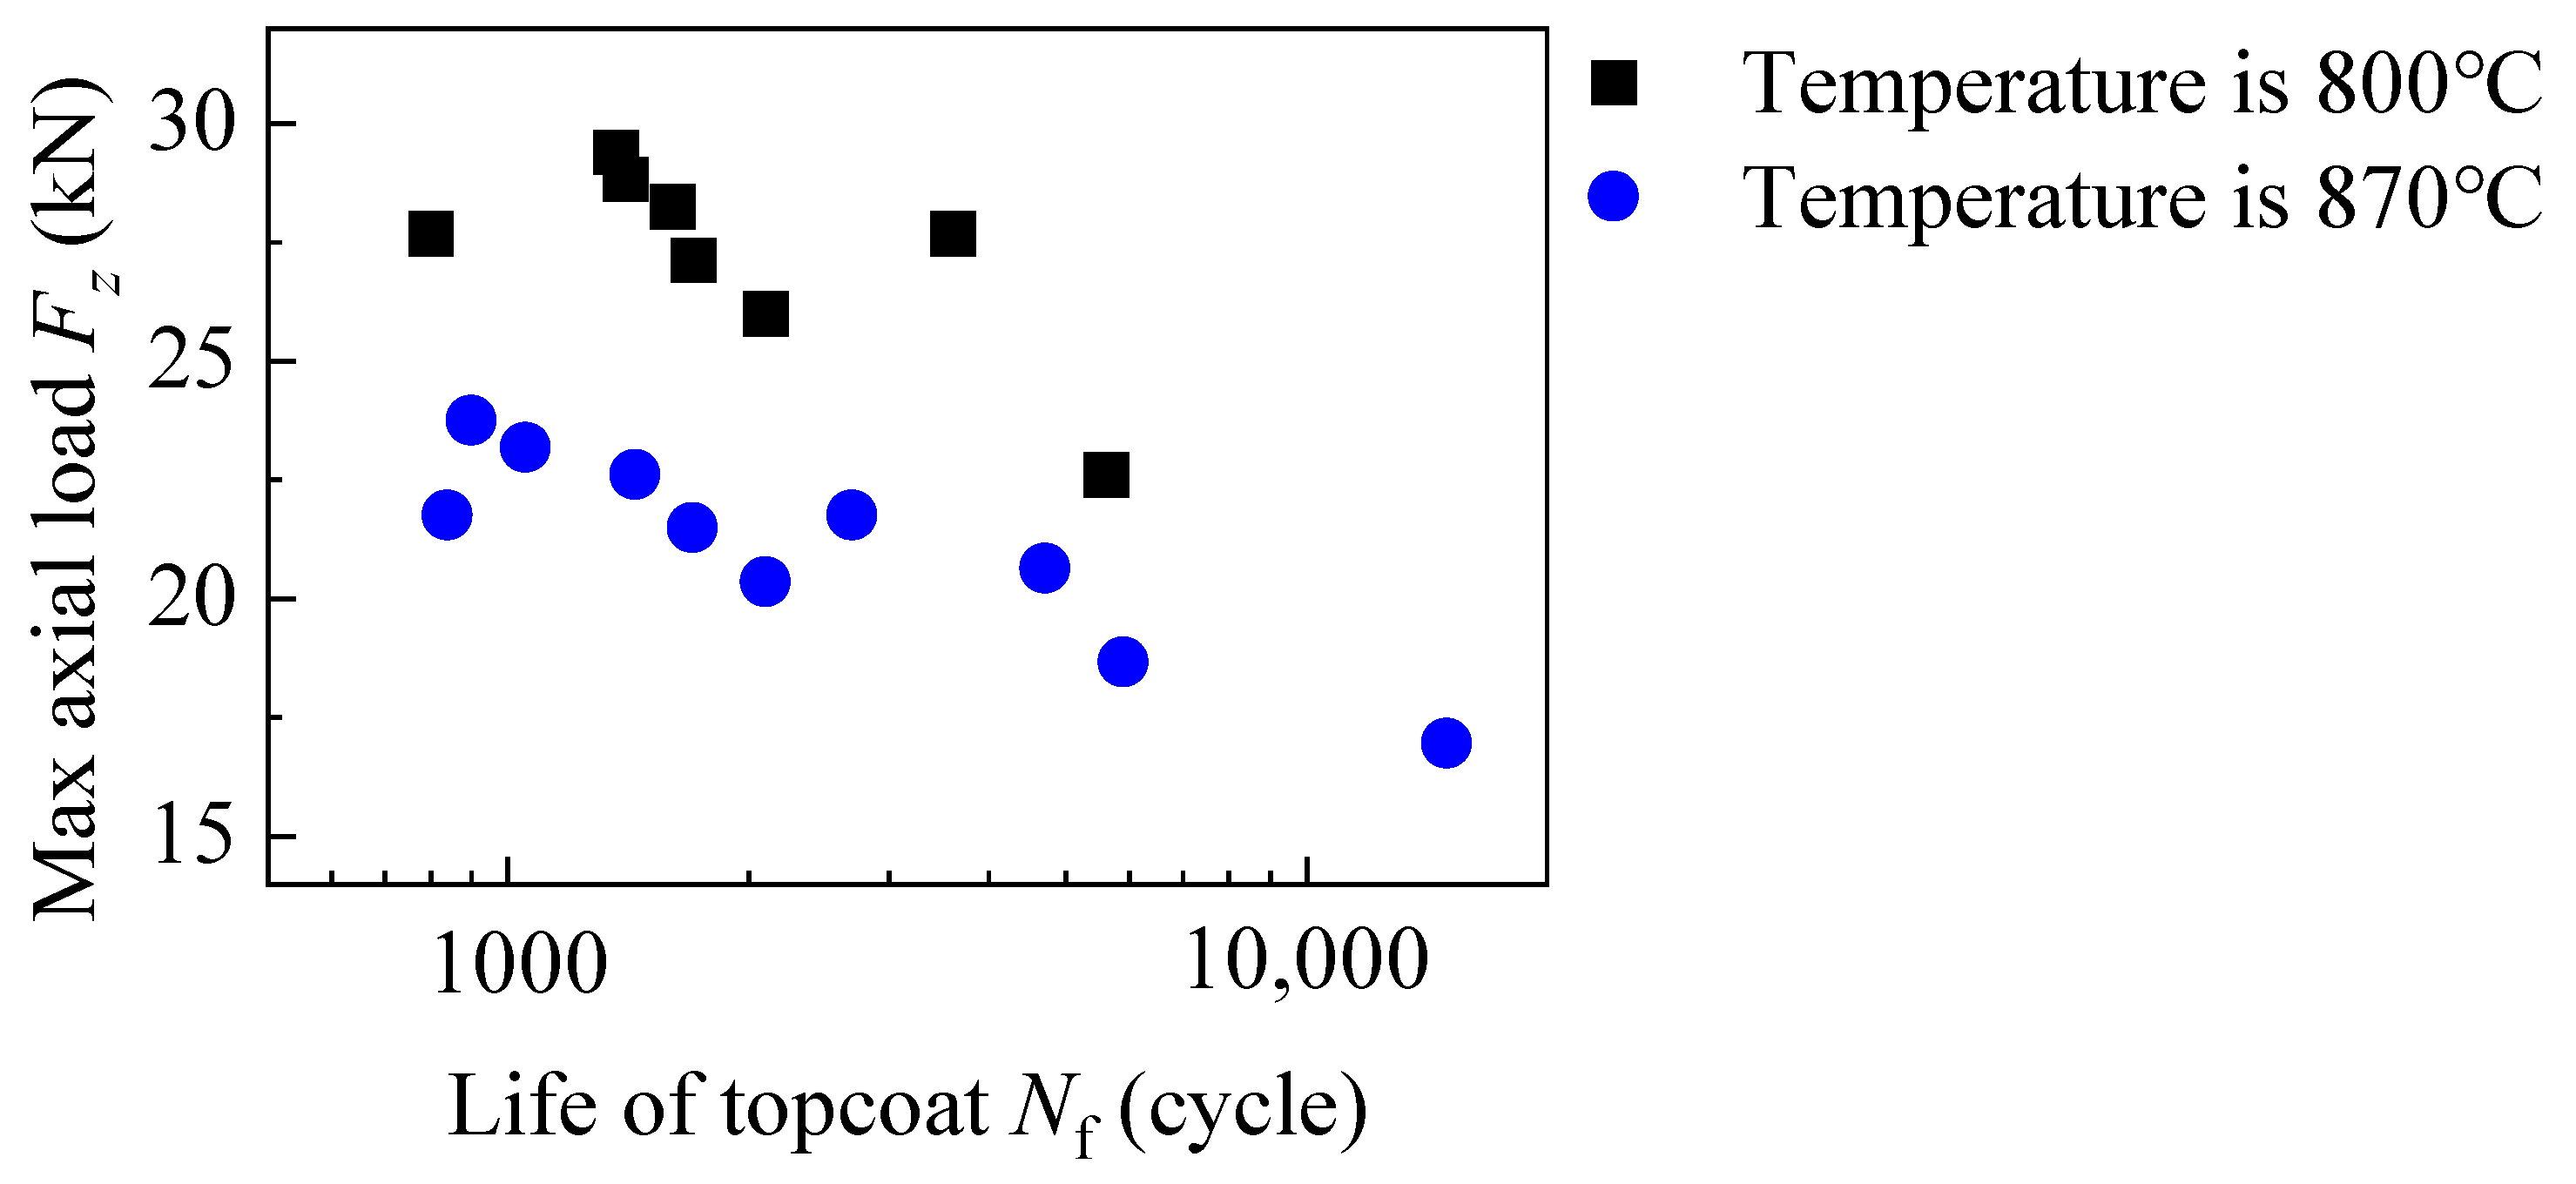
3.1. Uniaxial Fatigue Test of Rods

This study primarily focuses on the thermal barrier coatings to turbine blades, with a particular emphasis on their performance under high temperatures and centrifugal loads. The fatigue tests in this section were carried out at elevated temperatures of 800 °C and 870 °C, similar to the temperature in partial areas of turbine blades used in heavy gas turbines. The uniaxial fatigue tests with a stress ratio of 0.05 were conducted to simulate the loading and unloading processes of centrifugal loads. The load-controlled uniaxial fatigue tests were conducted on the DZ411 rods with TBCs. The stress ratio was 0.05. The detailed test parameters are listed in Table 2. The type of the uniaxial fatigue tests was defined as FAB in number rules, and the reference stress was defined as dividing the axial load by DZ411’s sectional area. Repeated tests under the same load were numbered consecutively. The number rule is the FAB-temperature-reference stress-number of the repeated test. At 100× magnification, the number of cycles in which cracks on the topcoat can be observed by the naked eye was taken as the fatigue life of the coating. The results are listed in Table 2 and are plotted in Figure 6.
The cracks opened and closed more evidently while the cyclic loading acted on the specimen. A single circumferential crack usually appeared first, and then the number of cracks increased as the number of cycles increased. Take specimens FAB-800-1020-1 and FAB-870-760-1 as examples, the images of specimens obtained during the experimental procedure are shown in Figure 7 and Figure 8.
Before the cross-sectional cut, the specimen was cold-mounted in epoxy resin to prevent the additional damage to the coating. The cylindrical specimen was cut along its axis with a water knife. The prepared sample is shown in Figure 9a. The scanning electron microscope (SEM) was performed on the sample and the image is shown in Figure 9b. In the SEM image, cracks were observed in the ceramic layer, extending from the top surface down to the interface with the bondcoat. However, these cracks did not propagate into the bondcoat. The interface between the topcoat and the bondcoat remained connected.
After the substrate fractured, as illustrated in Figure 10, the bondcoat was separated from the substrate near the fracture.
A high porosity is a typical characteristic of APS ceramic topcoat, and such microstructural features significantly reduce the fatigue resistance of the ceramic layer. Moreover, the distribution of pores in the ceramic layer is irregular and difficult to predict, leading to considerable variability in the results of tensile fatigue tests. For example, the evident crack can be observed in the specimen FAB-870-840-2 during the initial stage of the loading procedure, as shown in Figure 11.

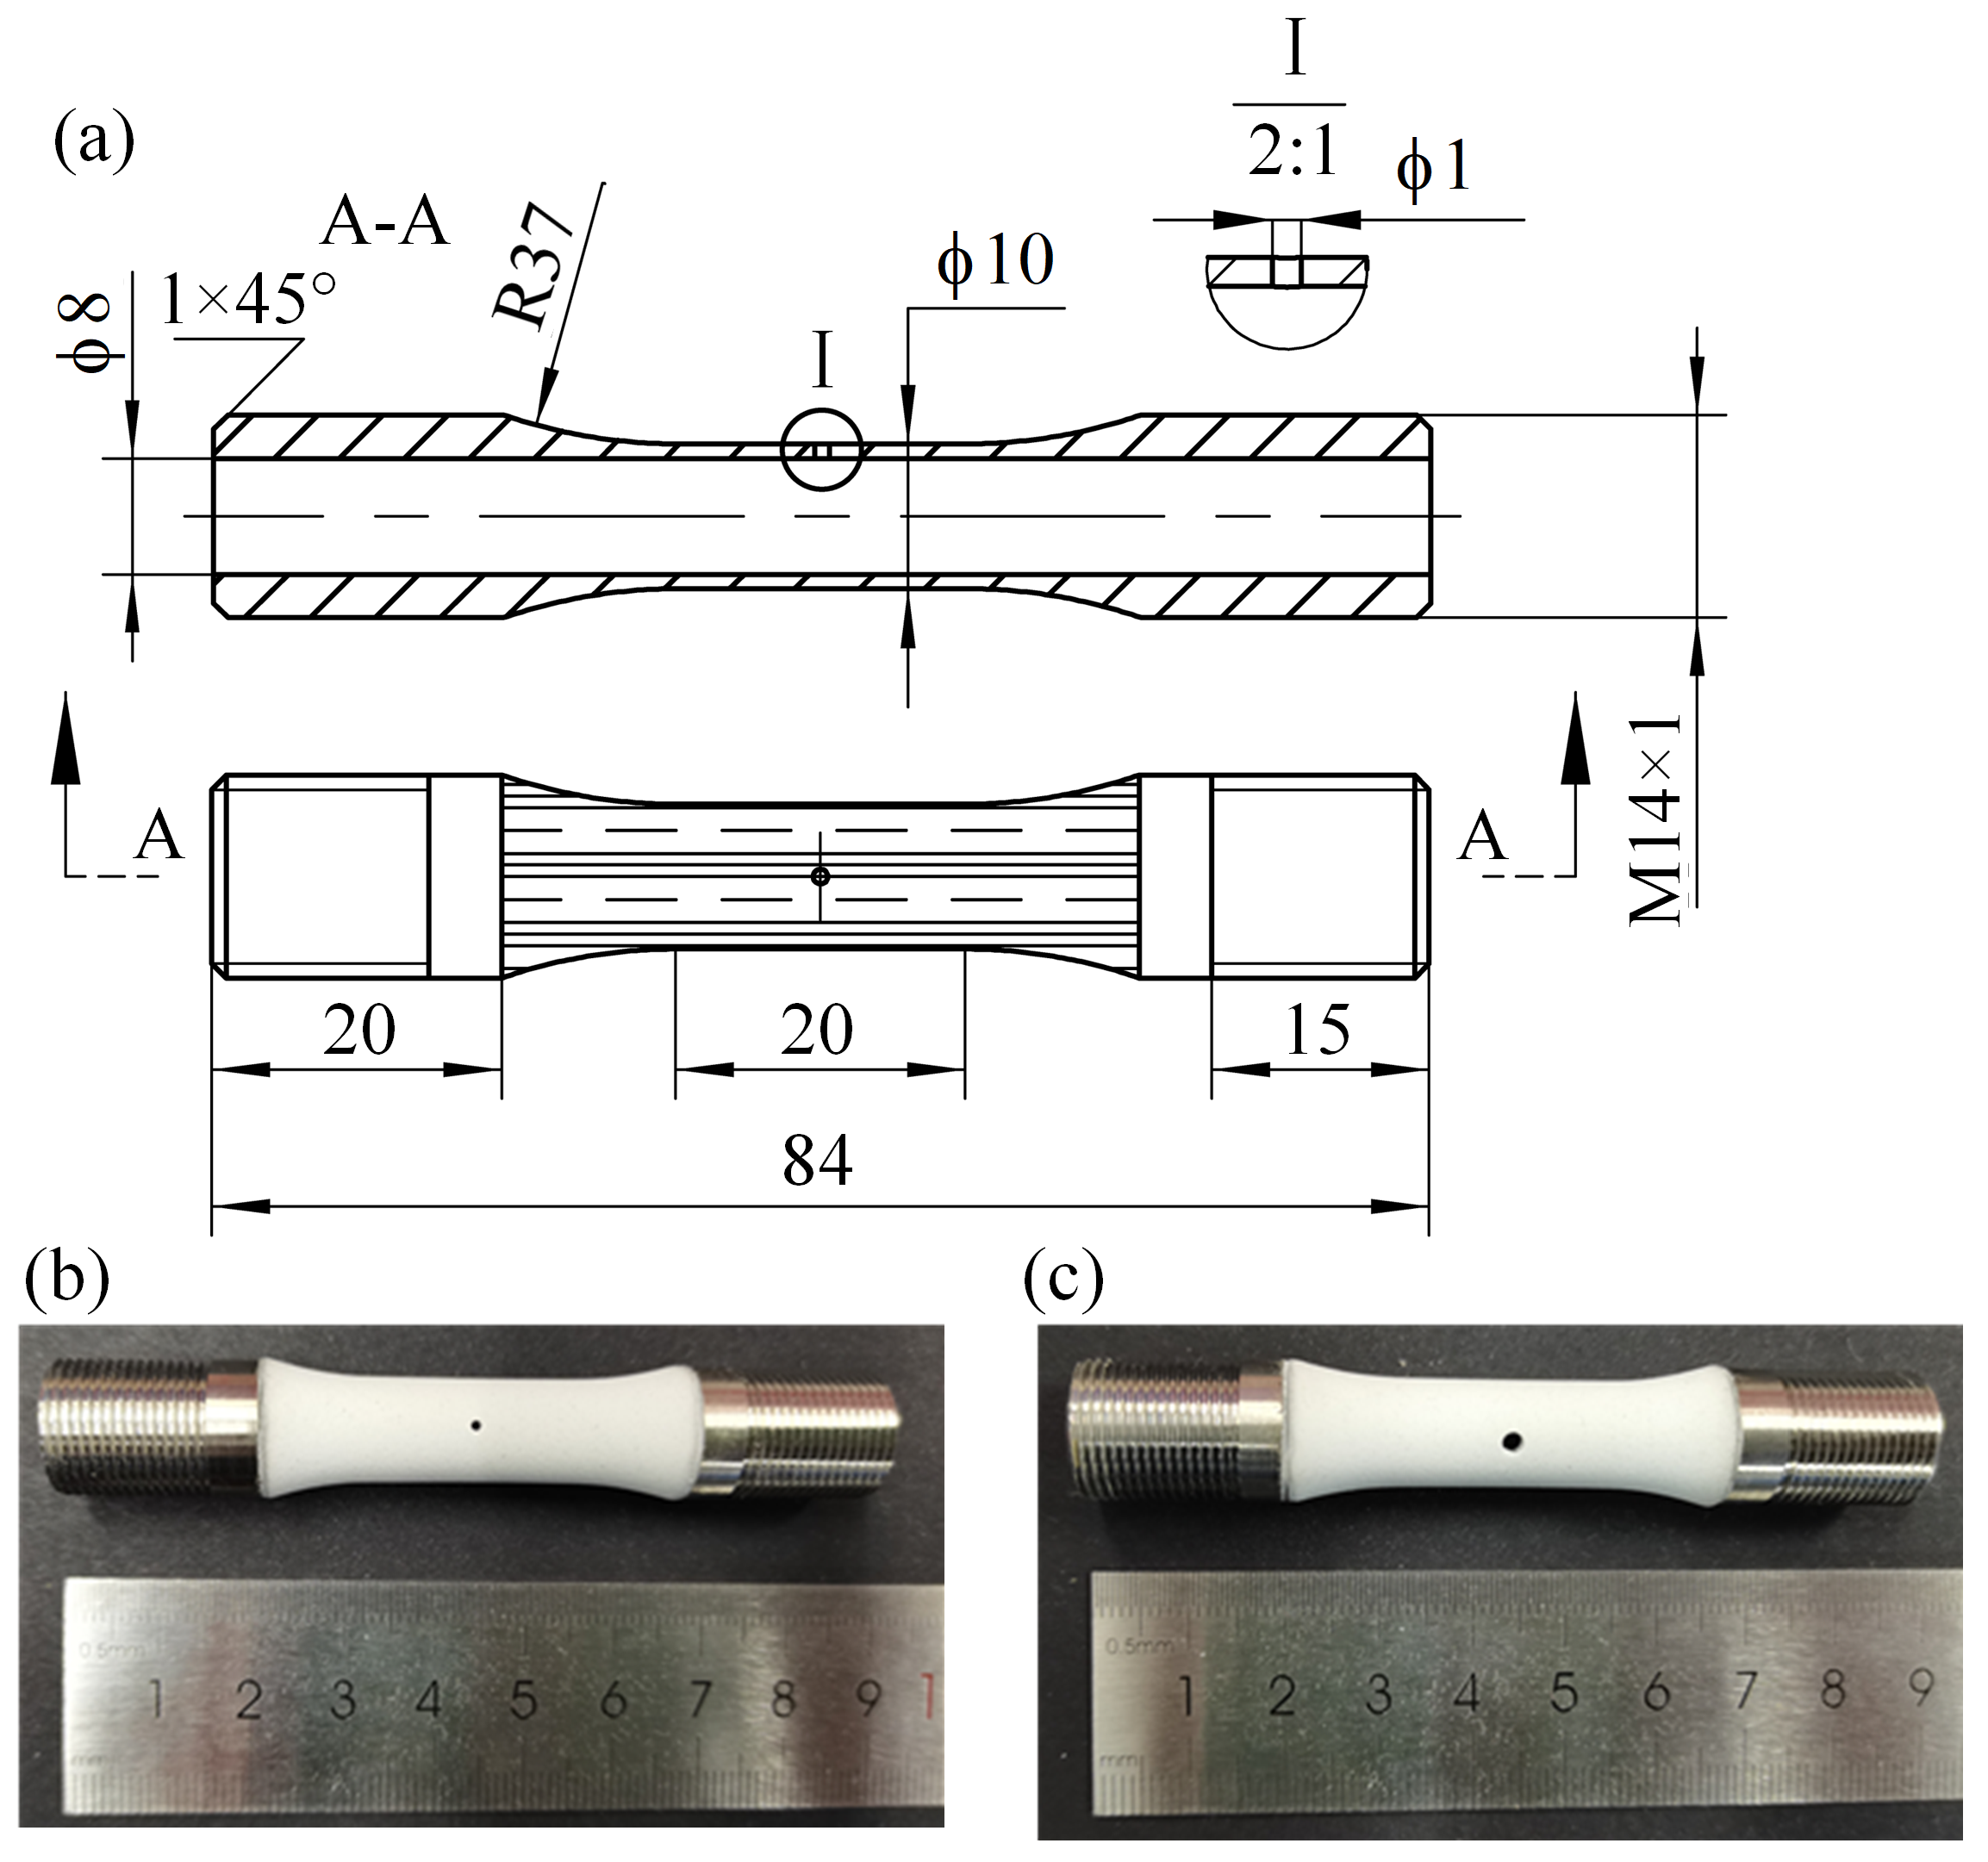
3.2. Uniaxial Fatigue Test of Tubes

Fatigue tests were also conducted on coated DZ411 tubes each with a single radial hole (shown in Figure 3) under similar uniaxial test conditions. The radial holes were designed to simulate the cooling holes on the turbine blades. Two levels of loads were selected at two temperatures for specimens with radial holes of different diameters, as detailed in Table 3. The specimens were designated as ‘FAT’. Throughout the tests, the experimental process at elevated temperatures was monitored through the observation window of a high-temperature furnace, by a wide-range crack measurement instrument. The time at which visible cracks in the coating were first detected was recorded as the coating’s fatigue life. The test data results are presented in Table 3.
During the experiment, it was observed that cracks in the topcoat consistently appeared at the edge of the radial hole. The crack direction was oriented at a 90° or −90° relative to the axial direction of the cylindrical tube. Define the sign of angles: a clockwise direction is considered positive, while a counterclockwise direction is considered negative. Taking specimens FAT-800-630-H2-1 and FAT-870-600-H1-1 as examples, as illustrated in Figure 12 and Figure 13. The coated tube which was tested until the substrate fractured, is shown in Figure 14. The coatings on the tube were relatively thin, and no significant delamination between the substrate and the bondcoat was observed after fracturing.

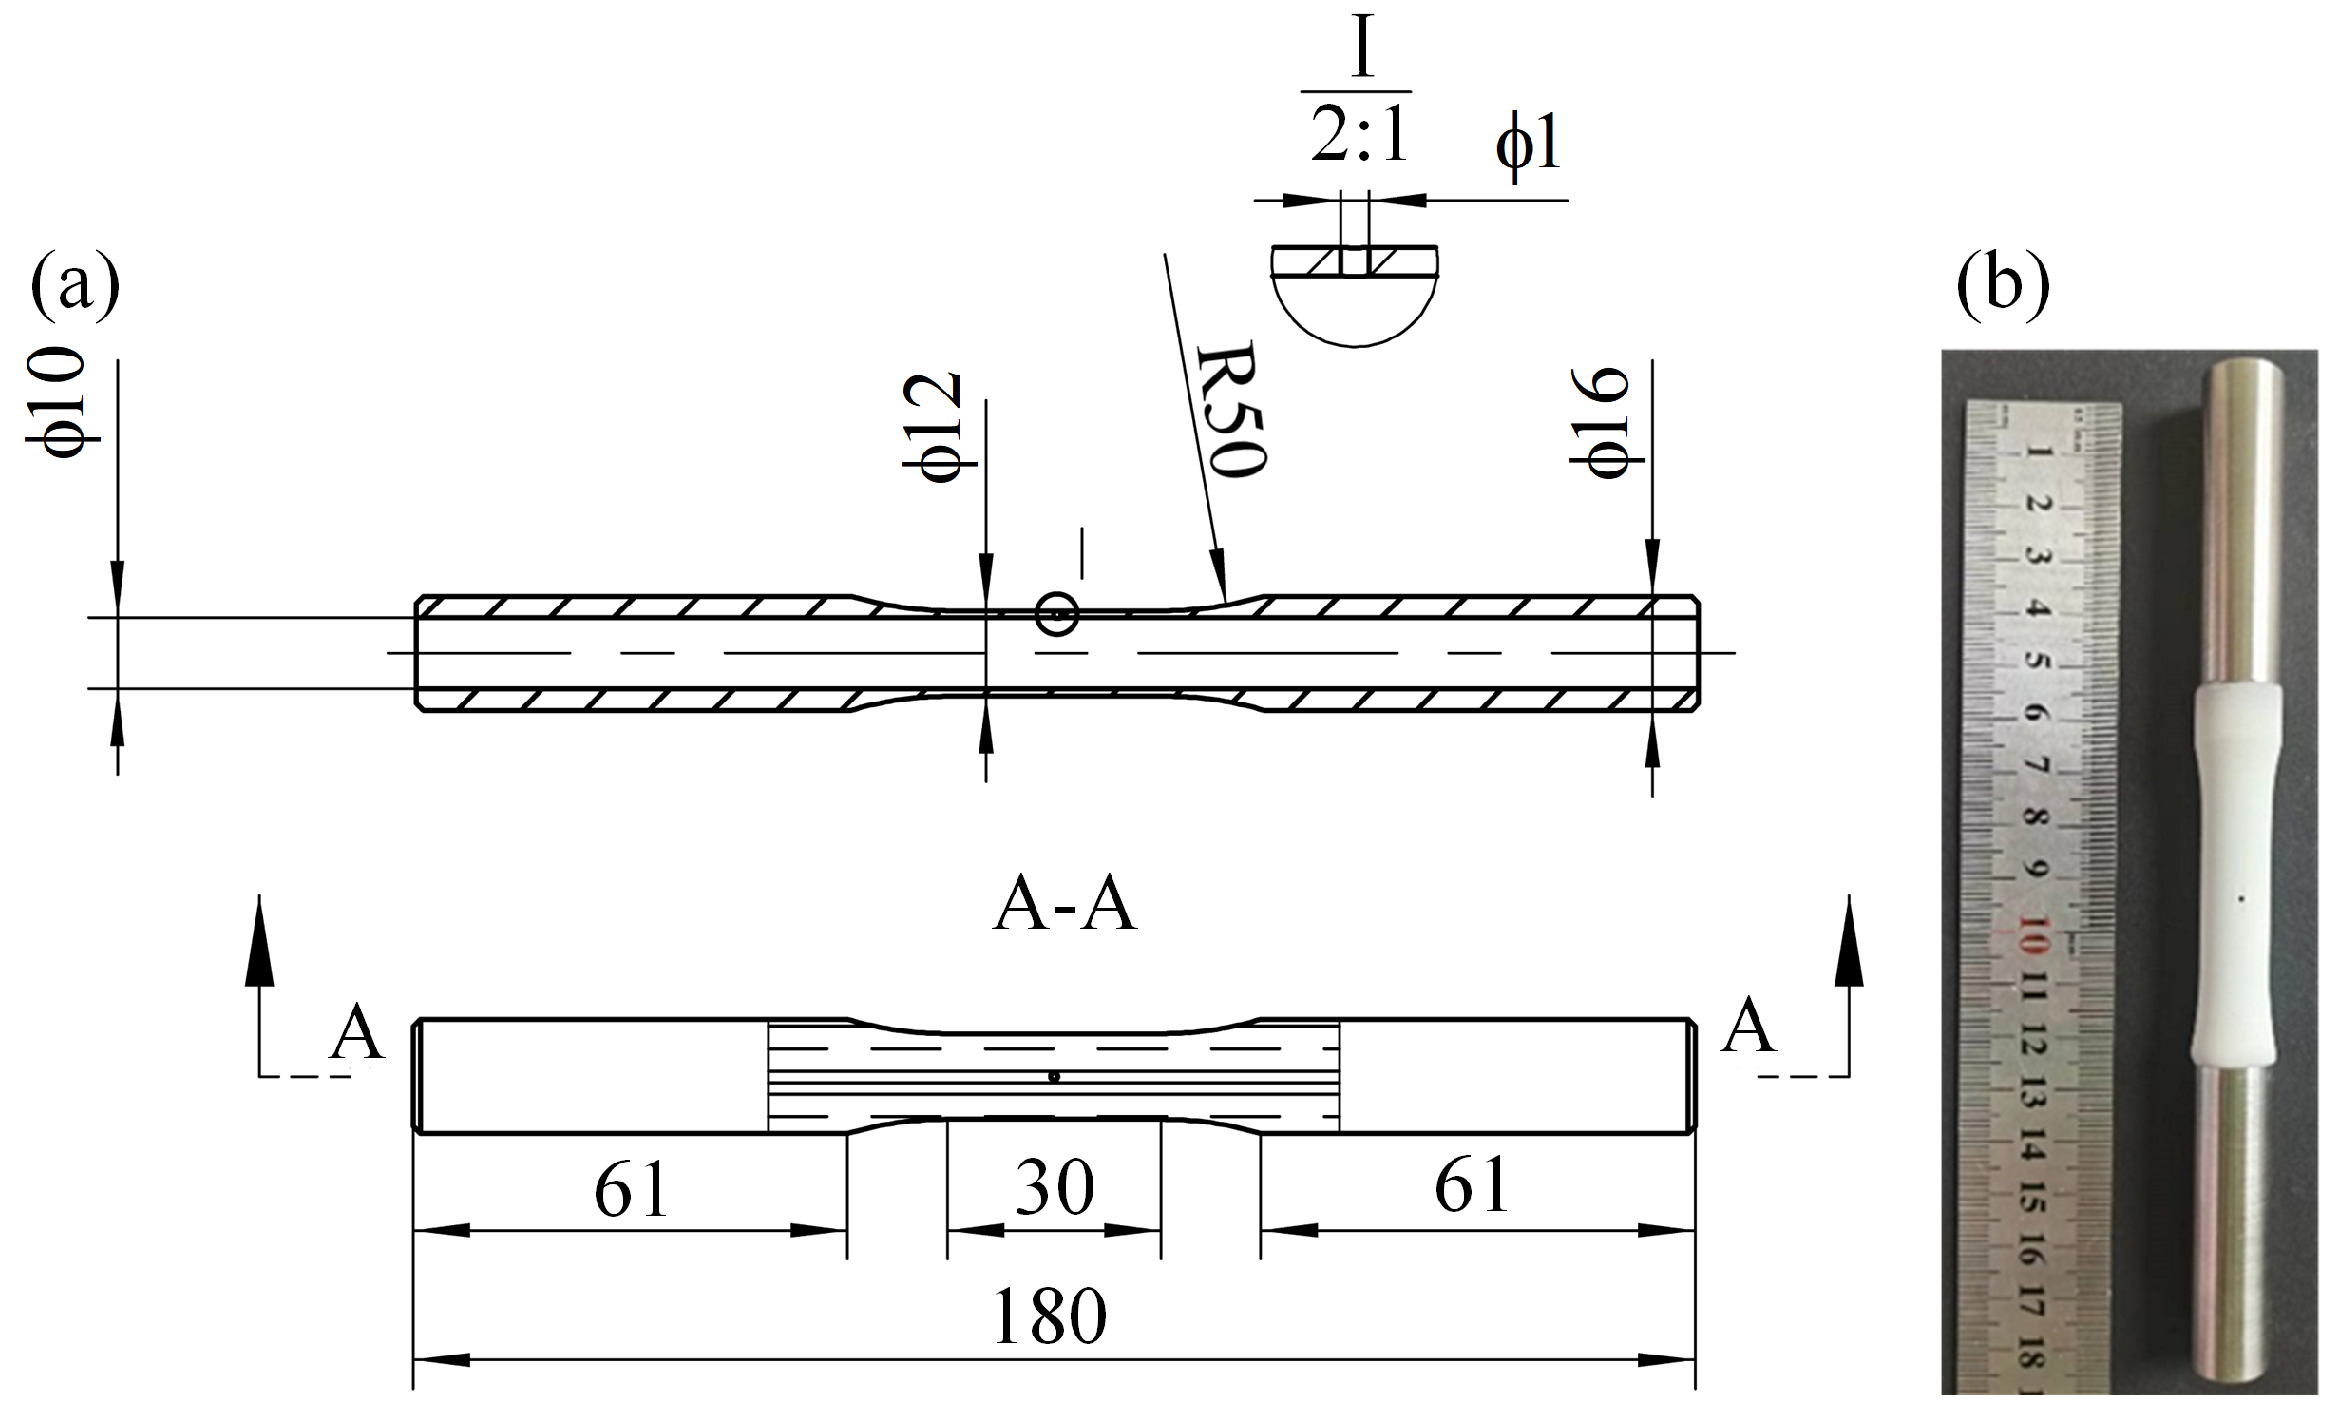
3.3. Multiaxial Fatigue Test of Tubes

To investigate the failure process of the coating around blade holes under complex loading conditions, a DZ411 tube with a radial hole was designed as shown in Figure 4. An axial-torsional cyclic fatigue test was conducted at a controlled load of 800 °C.
In the experiment, axial force and torque were controlled. The load ratio was −1. The frequency was 1 Hz. The maximum axial load and the torque were 22.98 kN and 84.2 N/m, respectively. The loading waveform was a sinusoidal wave and the loading path followed a circular trajectory with a 90° phase difference, as shown in the load spectrum (Figure 15). The post-fracture specimen is depicted in Figure 16, where no significant delamination between the substrate and the bondcoat was observed. After 30 cycles, cracks appeared in the topcoat around the hole. Unlike under uniaxial loading conditions, the direction of crack propagation was not at 90° or −90° but at −70° and 110°, as depicted in Figure 17.

4. Finite Element Analysis

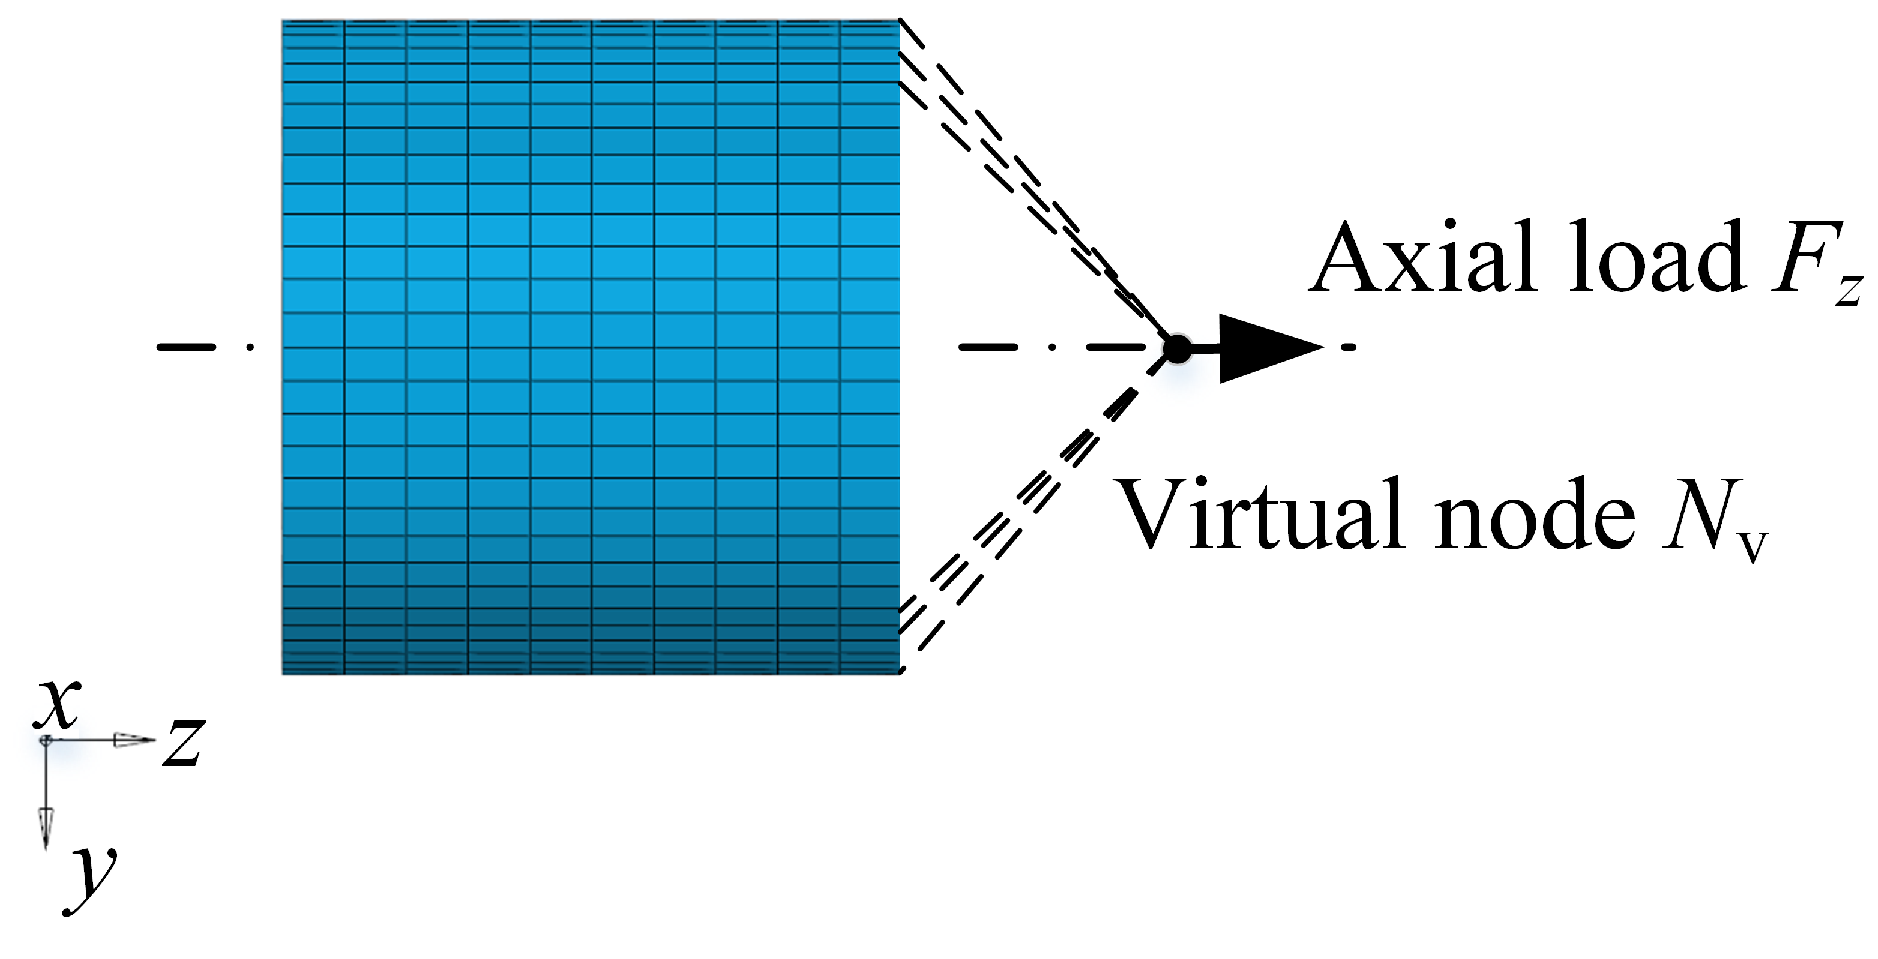
4.1. Computation Method

The results of uniaxial fatigue tests on coated circular rods show that the predominant failure mode of the coating is the occurrence of circumferential cracks in the ceramic layer with increasing cycles. Therefore, attention needs to be focused on the axial stress within the ceramic layer under axial loading. Firstly, it is necessary to calculate the axial stress within the topcoat corresponding to different axial loads. The material parameters used for the calculations are presented in Table 4 and Table 5, including elastic modulus, Poisson’s ratio, density, thermal expansion coefficient, and specific heat capacity. In the calculations, the anisotropy of the coating and substrate was disregarded, and the materials were treated as isotropic.
The thermal stress in the coating-substrate structure is considerable, greatly influencing the stress experienced by the coating. The methodology used to calculate thermal strain is outlined in reference [10].
ε T = α r ( T ) ( T T r )
Namely, the thermal strain ε T at temperature T is the product of the relative thermal expansion coefficient and the temperature difference. The temperature difference is defined as the difference between the current temperature T and the reference temperature T r .
The reference temperature in the thermal expansion coefficient measurement experiment is denoted as T 0 . The thermal expansion coefficient at temperature T is denoted as α 0 ( T ) . When the reference temperature is set to T r , the relative thermal expansion coefficient at temperature T could be calculated with Equation (2).
α r ( T ) = α 0 ( T ) + T r T 0 T T r α 0 ( T ) α 0 T r
Next, consider the effects of the preparation process on the reference temperature. The temperature is T c before the powder is sprayed, and the substrate is preheated to T s . Then, the equilibrium temperature expression for the coating-substrate system is expressed as Equation (3).
T b = ρ C h C c C T c + ρ B h B c B + ρ S h S c S T s ρ C h C c C + ρ B h B c B + ρ S h S c S
where ρ , h, c are the density, thickness and specific heat capacity, respectively. The subscript C, B and S denote the topcoat, the bondcoat and the substrate, respectively. Assuming that the multilayered material is stress-free at the equilibrium temperature T b , the reference temperature T r can be obtained, i.e.,
ε T , C ( T b ) = ε T , B ( T b ) = ε T , S ( T b )
The stress in the topcoat can be calculated using the finite element method. The element type used in the finite element calculations was Solid185. The interfaces between different materials share the nodes. A symmetric model was created to reduce the number of the mesh. The nodes on the side surface at one end were coupled along the axial direction, and a virtual node N v was placed 5 mm away from the side surface as the master node. The axial force F z was applied to the virtual node using the local stiffening method, as depicted in Figure 18.

4.2. Analysis of Computational Results

The calculated axial stress in the topcoat and the number of cycles until the topcoat cracks obtained from experiments, are plotted in Figure 19. The horizontal axis represents the number of cycles until the topcoat cracks, while the vertical axis represents the max axial stress in the topcoat. Both axes use a logarithmic scale. Combining that the load ratio is 0.05, the axial stress amplitude in the topcoat during one cycle can also be calculated. The stress amplitude and the number of cycles until the topcoat cracks are plotted in Figure 20.
The temperature difference between the two experimental conditions was 70 °C. It is assumed that the temperature difference has almost no influence on fatigue performance. The primary distinction lies in the thermal stress. Therefore, the stress ratio R σ varies. The stress ratio can be determined using the stress amplitude σ a and the maximum stress value σ max . The relationship between the stress ratio and the fatigue life is shown in Figure 21.
The failure in the coated tubes with a radial hole primarily occurred at the hole edge. The circumferential stress at the hole edge caused cracking in the topcoat. Therefore, the focus in this section is the circumferential stress. The outer radius of the DZ411 tube was 5 mm, and the inner radius was 4 mm. The thickness of the bondcoat was 125 μ m, and the thickness of the topcoat was 200 μ m. An axial force of 17.36 kN was applied to the coated tube under 870 °C. The calculation domain length was 20 mm, which was equal to the gauge length of the specimen. Two models were considered, with radial hole diameters of 1 mm and 2 mm, labeled as H1 and H2, respectively.
The distribution of circumferential stress in the topcoat near the hole edge in the two models is shown in Figure 22. The axial direction of the radial hole is z 1 axis, and the circumferential stress is along the circumferential direction of the radial hole. Additionally, the circumferential stress in the topcoat near the hole edge at 870 °C without applying an axial force was calculated, as shown in Figure 23. The maximum circumferential stress near the hole edge occurred in the direction perpendicular to the axial direction of the tube whether with or without the axial load, i.e., at 90° or −90° around the hole edge. The difference lies in the variation of the maximum stress locations. When an axial load was applied, the point of maximum circumferential stress was located between the upper and lower surfaces of the topcoat at the hole edge. As the hole diameter increased, the net cross-sectional area of the tube decreased, increasing the circumferential stress. Without axial load, only thermal stress existed. The maximum circumferential stress at the hole edge was located at the outer surface of the topcoat. As the hole diameter increased, the circumferential stress at the hole edge slightly decreased.
Subsequently, the stress near the hole edge under multi-axial loading at 800 °C was calculated. Figure 24 shows the variation in the first principal stress distribution in the topcoat near the radial hole during the loading process. Throughout one cycle, both the location and value of the maximum first principal stress point change continuously. In subfigure ➀ in Figure 24, the distribution corresponds to the uniaxial tensile state. The clockwise direction is positive. The location of the maximum value point is at −90°. The changes in location and value of the maximum first principal stress point near the hole edge in the topcoat during the loading process are depicted in Figure 25.
Considering that the structure and the load are symmetry, to avoid the step changes in the position of the maximum first principal stress point caused by numerical calculations, the position of the maximum first principal stress point was considered within ±90° from the 0° position.
The direction of the first principal stress at the maximum stress point is consistent with the tangential direction at the hole edge at that location. The direction of the first principal stress at the maximum stress point was consistent with the tangential direction of the hole edge at the maximum stress point. During one loading cycle, the maximum first principal stress point was located at approximately −68° (as indicated by the red circle in Figure 25), which is almost the same as the actual cracking position of the specimen (−70°, as indicated by the white line in Figure 17). The variation of the first principal stress at the point with the red circle is also plotted in Figure 25.

5. Proposal of Fatigue Life Model

The opening direction of fatigue cracks in the topcoat aligns with the direction of the first principal stress [30]. Therefore, a fatigue life model using the first principal stress as the damage parameter was proposed. Initially, a fatigue life model for YSZ, considering the influence of the stress ratio, was established using fatigue test data from smooth specimens. The form of the fatigue life model based on the equivalent stress σ eq is as follows,
lg ( N f ) = A 1 + A 2 lg ( σ eq A 4 )
where N f means fatigue life, i.e., the cycle number when the topcoat cracks. The equivalent stress σ eq is related to the stress ratio R σ . The expression of the equivalent stress is,
σ eq = σ max ( 1 R σ ) A 3
where A i is the fitting parameter.
The calculated stress ratio of the test data was concentrated between 0.3 and 0.45. Thus, the parameter A 3 related to the stress ratio was set to 0.5. During the fitting process, the parameter A 3 was not included in the least squares regression analysis. The next step was setting an initial value for A 4 . Let
A 4 = min ( σ eq ) 2
the σ eq can be obtained from Equation (6). Then, the linear least squares regression analysis on Equation (5) was performed. The fitting results for parameters A 1 and A 2 were then used as initial values for the nonlinear regression analysis of Equation (5) while A 4 was uncertain.
Following this procedure, the test data obtained at 870 °C (excluding the data of the specimen FAB-870-840-2 which cracked immediately upon loading) were used for obtaining parameters by fitting based on Equations (5) and (6). This yielded the parameters in the fatigue life model of the topcoat under stress parallel to the interface, as listed in Table 6.
After completing the parameter fitting, the Durbin–Watson test was used to evaluate the validity of the proposed fatigue life model [31,32]. The test statistic D m is given.
D m = i = 2 n ( δ SR , i δ SR , i 1 ) 2 i = 1 n δ SR , i 2
where n refers to the number of the data points and δ SR , i represents the standardized residual of the i-th data point sorted by increasing equivalent stress. The expression for δ SR , i is as follows:
δ SR , i = lg N f , e lg N f , p δ SD
δ SR , i is the ratio of the absolute deviation of the logarithmic predicted fatigue life from the logarithmic experimental fatigue life to the standard deviation. The expression for the standard deviation δ SD is as follows:
δ SD = i = 1 n [ lg N f , e lg N f , p ] 2 n k n
where k n denotes the number of fitting parameters. Since parameter A 3 is not included in the fitting process, in this case, k n = 3 . Substituting the data, the value of the statistic D m is 0.8190. If D m < 2 4.73 / n 0.555 , the model would be deemed unsuitable. In this case, the right-hand side of the inequality yields 0.6822, indicating that the model can describe the stress-fatigue life relationship of the YSZ topcoat undergoing stress parallel to the interface.
Using the load data at 800 °C, calculations based on the obtained material model were performed, and a comparison of experimental and predicted fatigue life is shown in Figure 26.
Eighty percent of the predicted lifetimes fell within the twofold scatter band, and one predicted lifetime fell outside the threefold scatter band. However, the one outside the threefold scatter band was lower than the actual experimental lifetime, indicating a conservative prediction. Most of the predicted lifetimes at 800 °C were conservative. It is likely due to the temperature being lower than the temperature corresponding to the data used for fitting the model parameters.
Under complex loading conditions, the effects of stress gradients and multiaxial loading on the coating’s life must also be considered [33,34]. Firstly, the stress distribution of circumferential stress around the hole edge in the coated tube with a radial hole was analyzed. The circumferential stresses for axial loading of 17.36 kN at 870 °C are provided as an example. The extraction path of the stress is shown in Figure 27, starting from the position where the max stress was located, taking along the circumferential direction of the tube. The circumferential stress-to-distance from the hole edge curve and the normalized circumferential stress-to-distance from the hole edge curve are shown in Figure 28a and Figure 28b, respectively. The normalized stress σ H / σ H , max represents the ratio of the stress at different points along the path to the maximum stress at the hole edge. The normalized distance x / r H , max represents the ratio of the distance from different points along the path to the hole edge to the notch characteristic parameter. In this case, the characteristic parameter is the hole radius.
According to reference [34], the stress gradient impact factor Y is defined as the reciprocal of twice the area enclosed by the normalized stress curve and the horizontal axis over the interval [0, 0.5], i.e.,
Y = 1 2 S 0.5
where, S 0.5 represents the integral area of the partial normalized curve. The stress gradient impact factor was 1.04 when the hole diameter was 1 mm, and the factor was 1.43 when the hole diameter was 2 mm. The hole diameter has an insignificant effect on the stress gradient impact factor. The stress-fatigue life model considering stress gradients is the same as Equation (5), but the expression of effective stress must include the stress gradient impact factor. The specific expression is as follows.
σ eq = Y m σ max ( 1 R σ ) A 3
where the stress gradient index factor m is related to the maximum stress. Considering the dimensionless nature of m, the relationship between m and σ max is expressed as follows.
m = A m ( σ max σ b ) B m
where σ b is the ultimate strength of the YSZ coatings, taken as 130 MPa in this case. Parameters A m and B m are fitting parameters, with fitting results A m = 6.286 and B m = 3.508 .
Finite element analysis was performed on a coated tube with a radial hole under uniaxial fatigue testing conditions, yielding the maximum stress and stress ratio listed in Table 7. The predicted life and experimental life are also listed in Table 7, with their comparison shown in Figure 29.
At 800 °C, the tube with a radial hole whose diameter was 2 mm under an axial load of 22.90 kN exhibited significant coating cracking at the hole edge during the initial cycle. The circumferential stress at the hole edge for this tube was the highest among the eight test conditions, which correlated with its earliest failure during testing. Prediction results obtained from the proposed model indicate that the life of the tube with a radial hole whose diameter was 2 mm was shorter, consistent with the experimental findings. The remaining predictions are fairly accurate, with a dispersion band within a factor of two.
According to the conclusion in Section 4, the direction of the first principal stress is the same as the actual cracking position. Thus, under complicated loading conditions, the first principal stress is suitable as a damage parameter. Under multiaxial conditions, considering the effect of non-proportional loading on life, the equivalent stress for life estimation is expressed as follows.
σ eq = ( 1 + α m Φ m ) Y m σ max ( 1 R σ ) A 3
where α m represents the material’s non-proportional strengthening coefficient under multiaxial loading, reflecting the material’s sensitivity to additional non-proportional strengthening, and was taken as 0.5 for life estimation. Φ m denotes the load non-proportionality, reflecting the impact of loading history and path on material reinforcement. In this case, it was a circular path loading with a phase difference of 90°, and the load non-proportionality was taken as 1. During calculations, the parameter was taken as the stress at the point of maximum principal stress value during loading, which was 246.91 MPa. According to the cyclic stress shown in Figure 15, the stress ratio was 0.03. The principal stresses along the radial path from the point of maximum principal stress were extracted for normalization to obtain the stress gradient impact factor, which was 1.45. The predicted life was calculated to be 104 cycles, approximately 3.5 times the experimental life, as shown in Figure 29.
Combining the life prediction results of tubes with holes under uniaxial conditions, the process outlined in this section shows that the life predictions under high-stress conditions align with the experimental results. Despite our efforts to emulate actual turbine blade loading conditions, it should be noted that certain factors, such as temperature gradients, creep effects, oxidation effects and thermal-mechanical cycles, were not fully considered in this study. However, the computational methods and models proposed in this study aim to provide methods for these scenarios. Additionally, further investigation may be necessary to fully comprehend the fatigue performance of thermal barrier coatings under extremely high temperatures (such as temperatures exceeding 1000 °C).

6. Conclusions

This study outlines uniaxial and tensile-torsion fatigue tests carried out at 800 °C and 870 °C on high-temperature alloy rods and tubes coated with thermal barrier coatings. The tests aimed to determine the number of cycles before coating cracked under different loads, along with the location and orientation of the cracks. A fatigue life model was proposed for coating cracks under cyclic stress parallel to the coating interface based on the observed experimental phenomena. Combining the finite element analysis, the model predicted the fatigue life of the coating under experimental loads, and comparison results confirmed the model’s accuracy. The main conclusions are as follows:
(1)
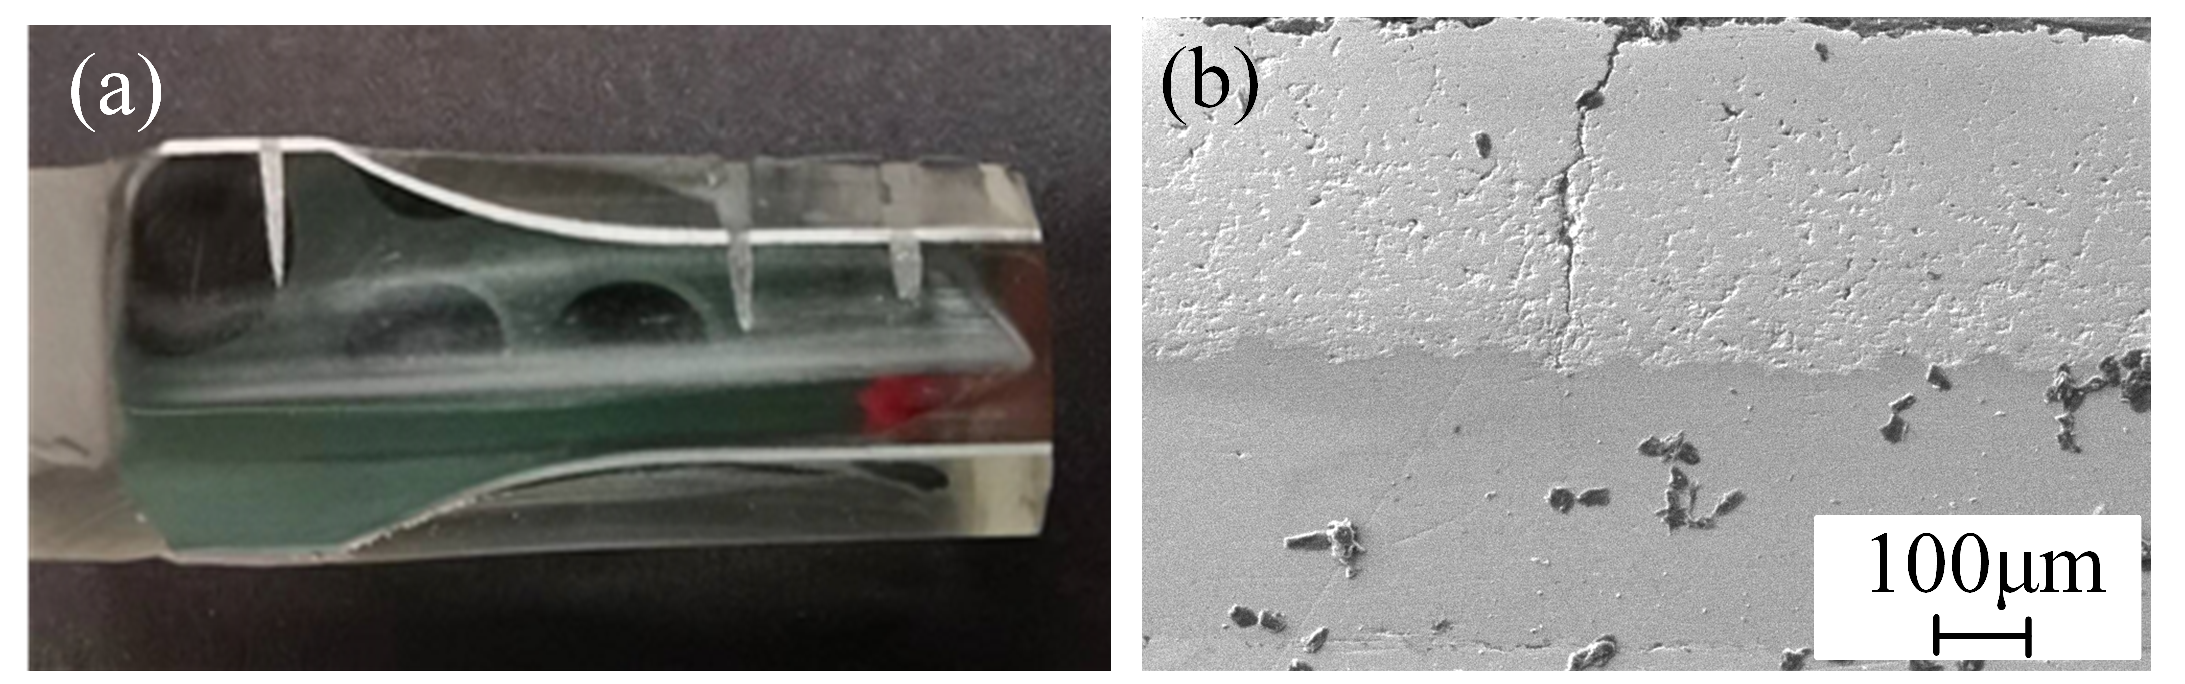
The study revealed that under cyclic stress, the ceramic topcoat on the high-temperature alloy might experience fatigue cracking before the substrate fractures. Specimens that did not fracture were embedded in epoxy resin and sectioned axially. The SEM images of the sectioned specimen revealed that cracks in the ceramic topcoat extended from the topcoat to the interface between the bondcoat and topcoat, but did not penetrate the bondcoat. Additionally, there were no interfacial cracks found in the bondcoat and substrate.
(2)
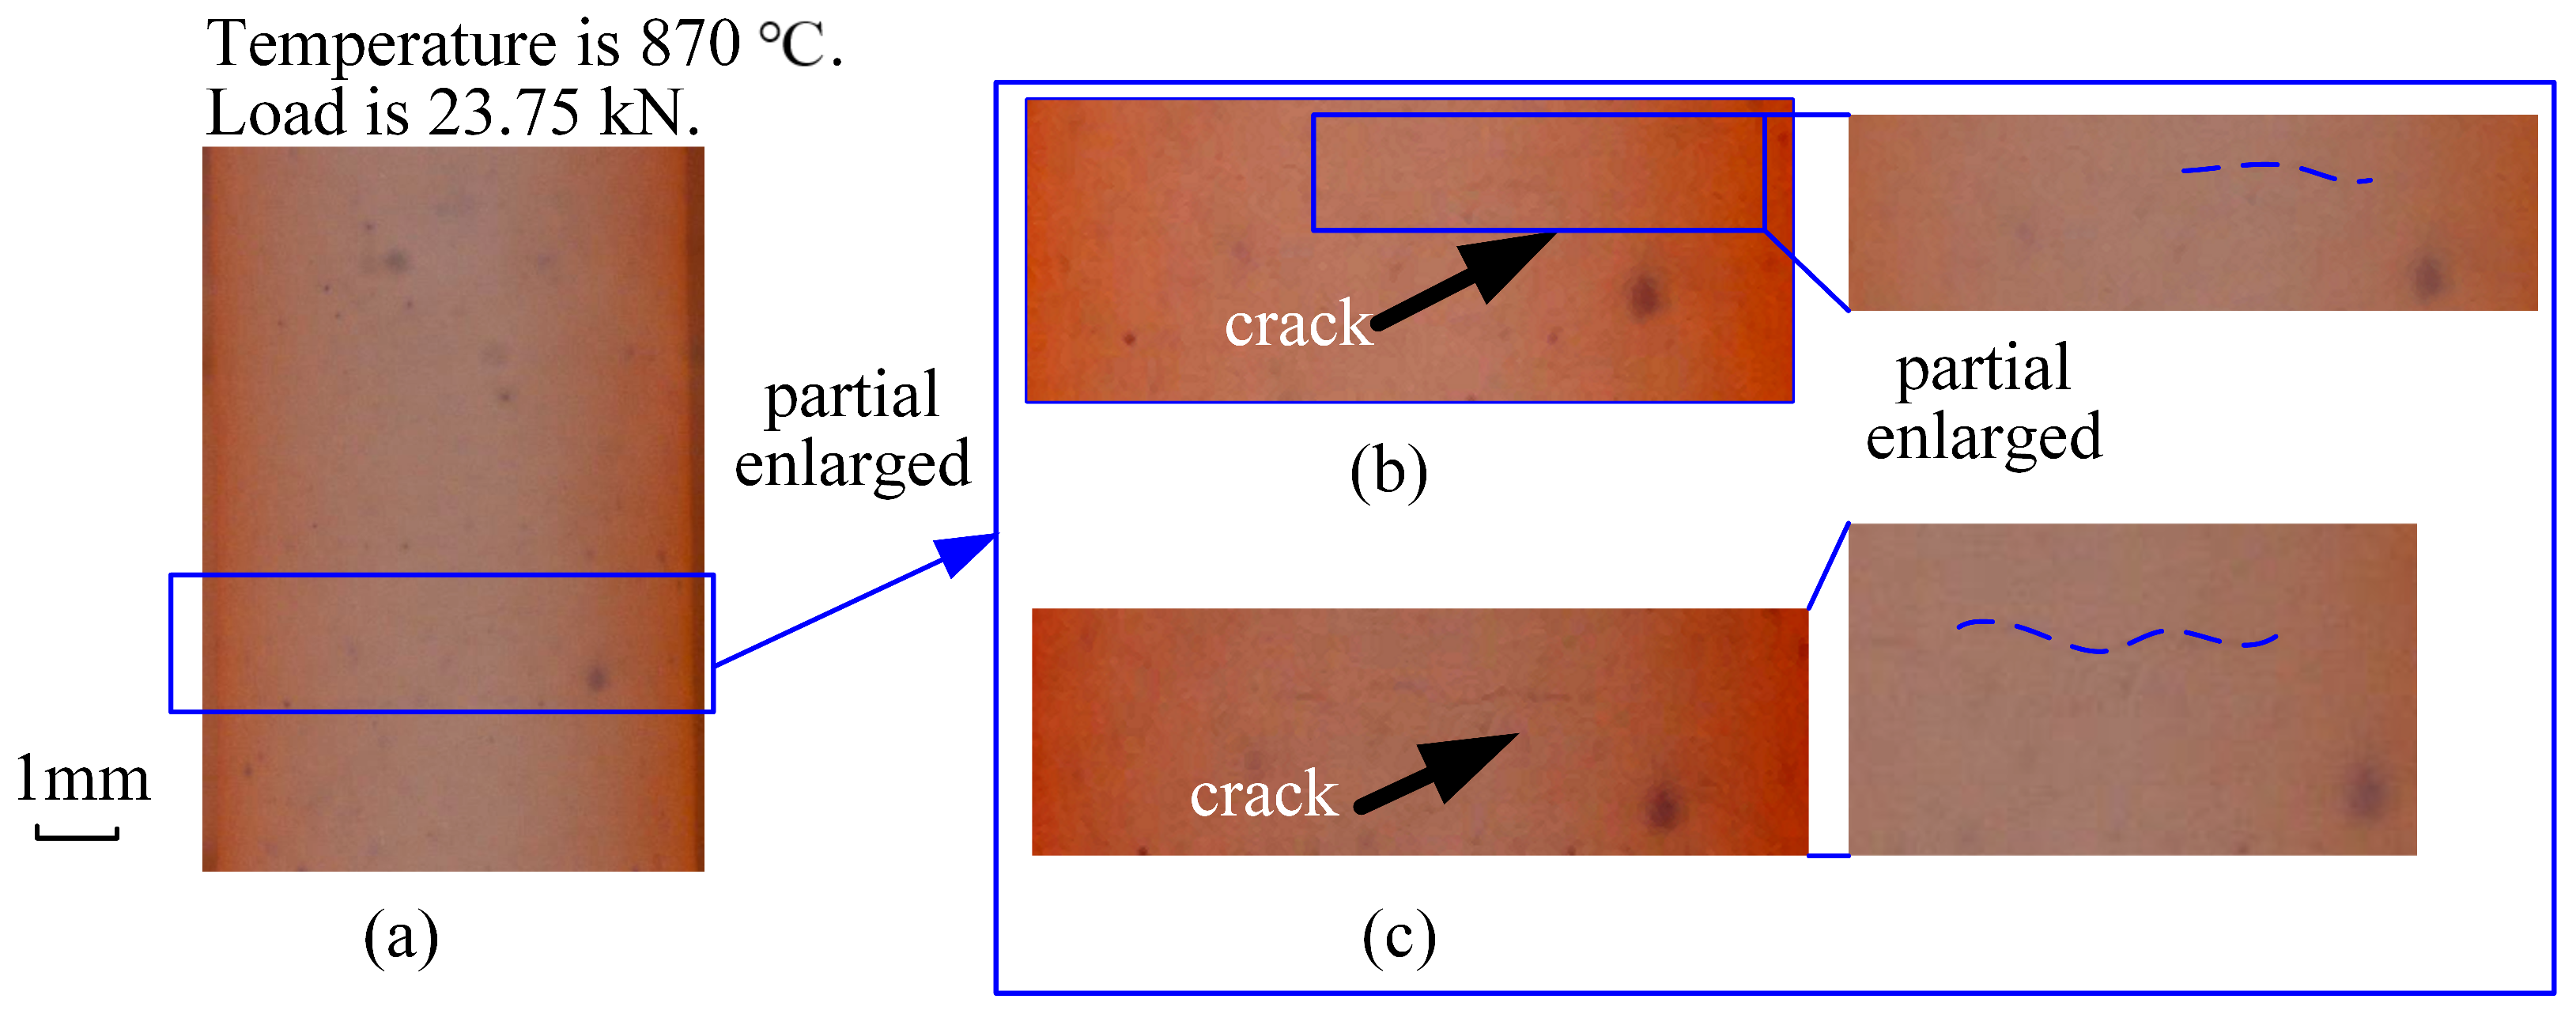
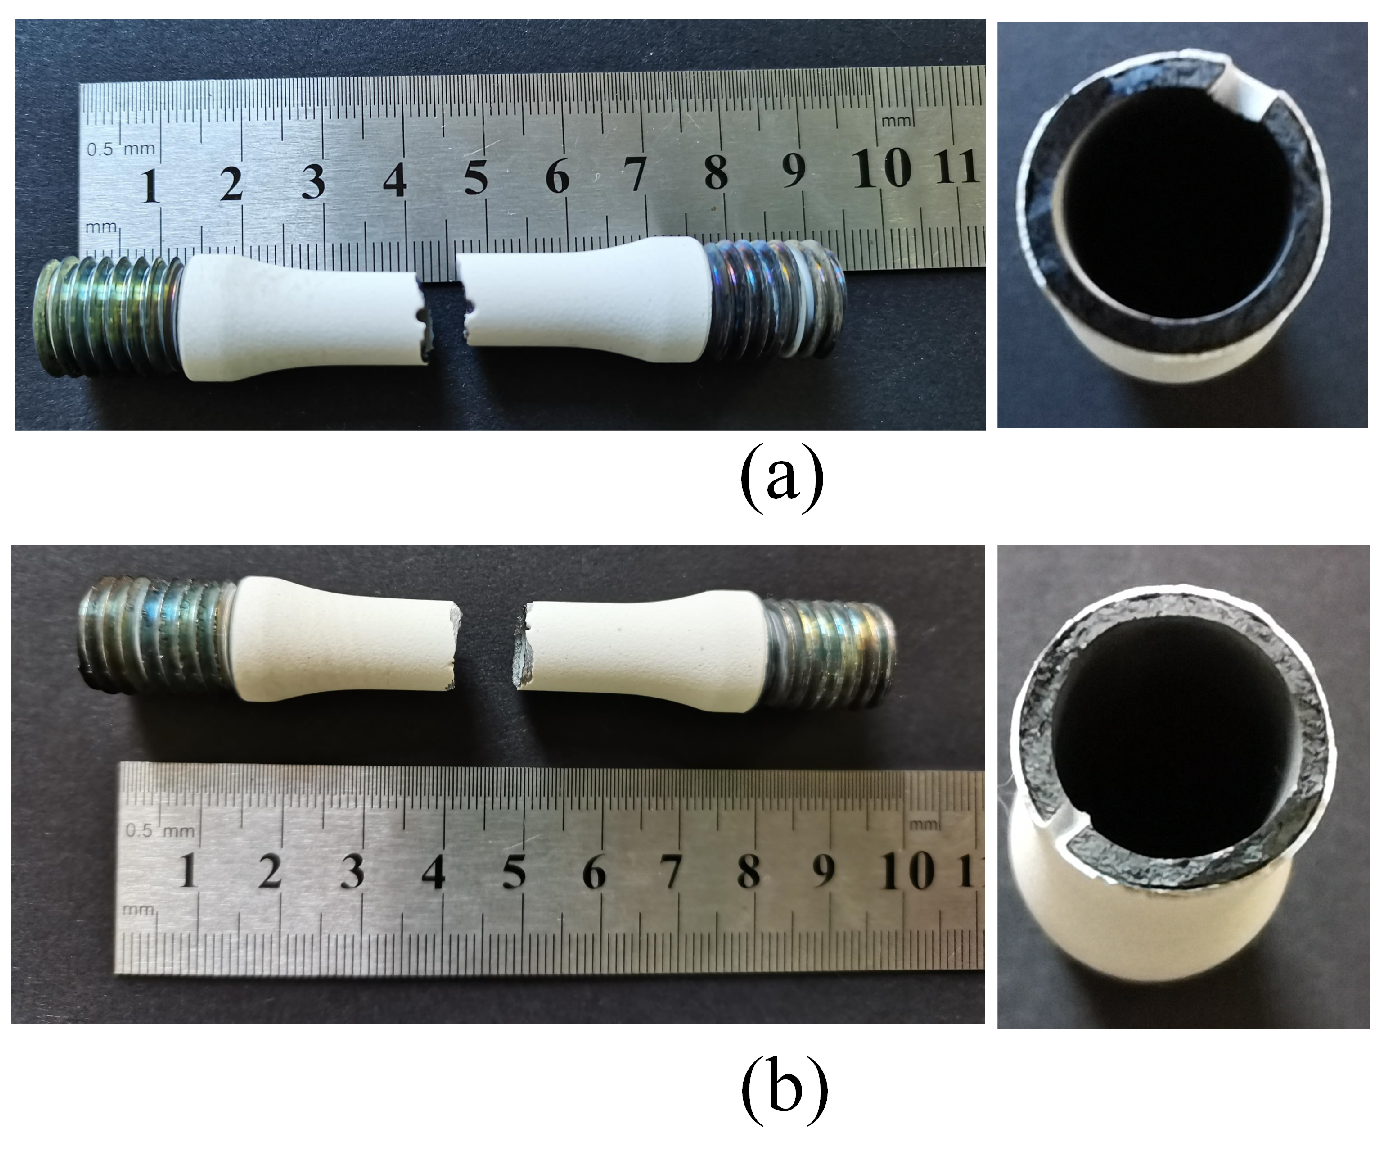
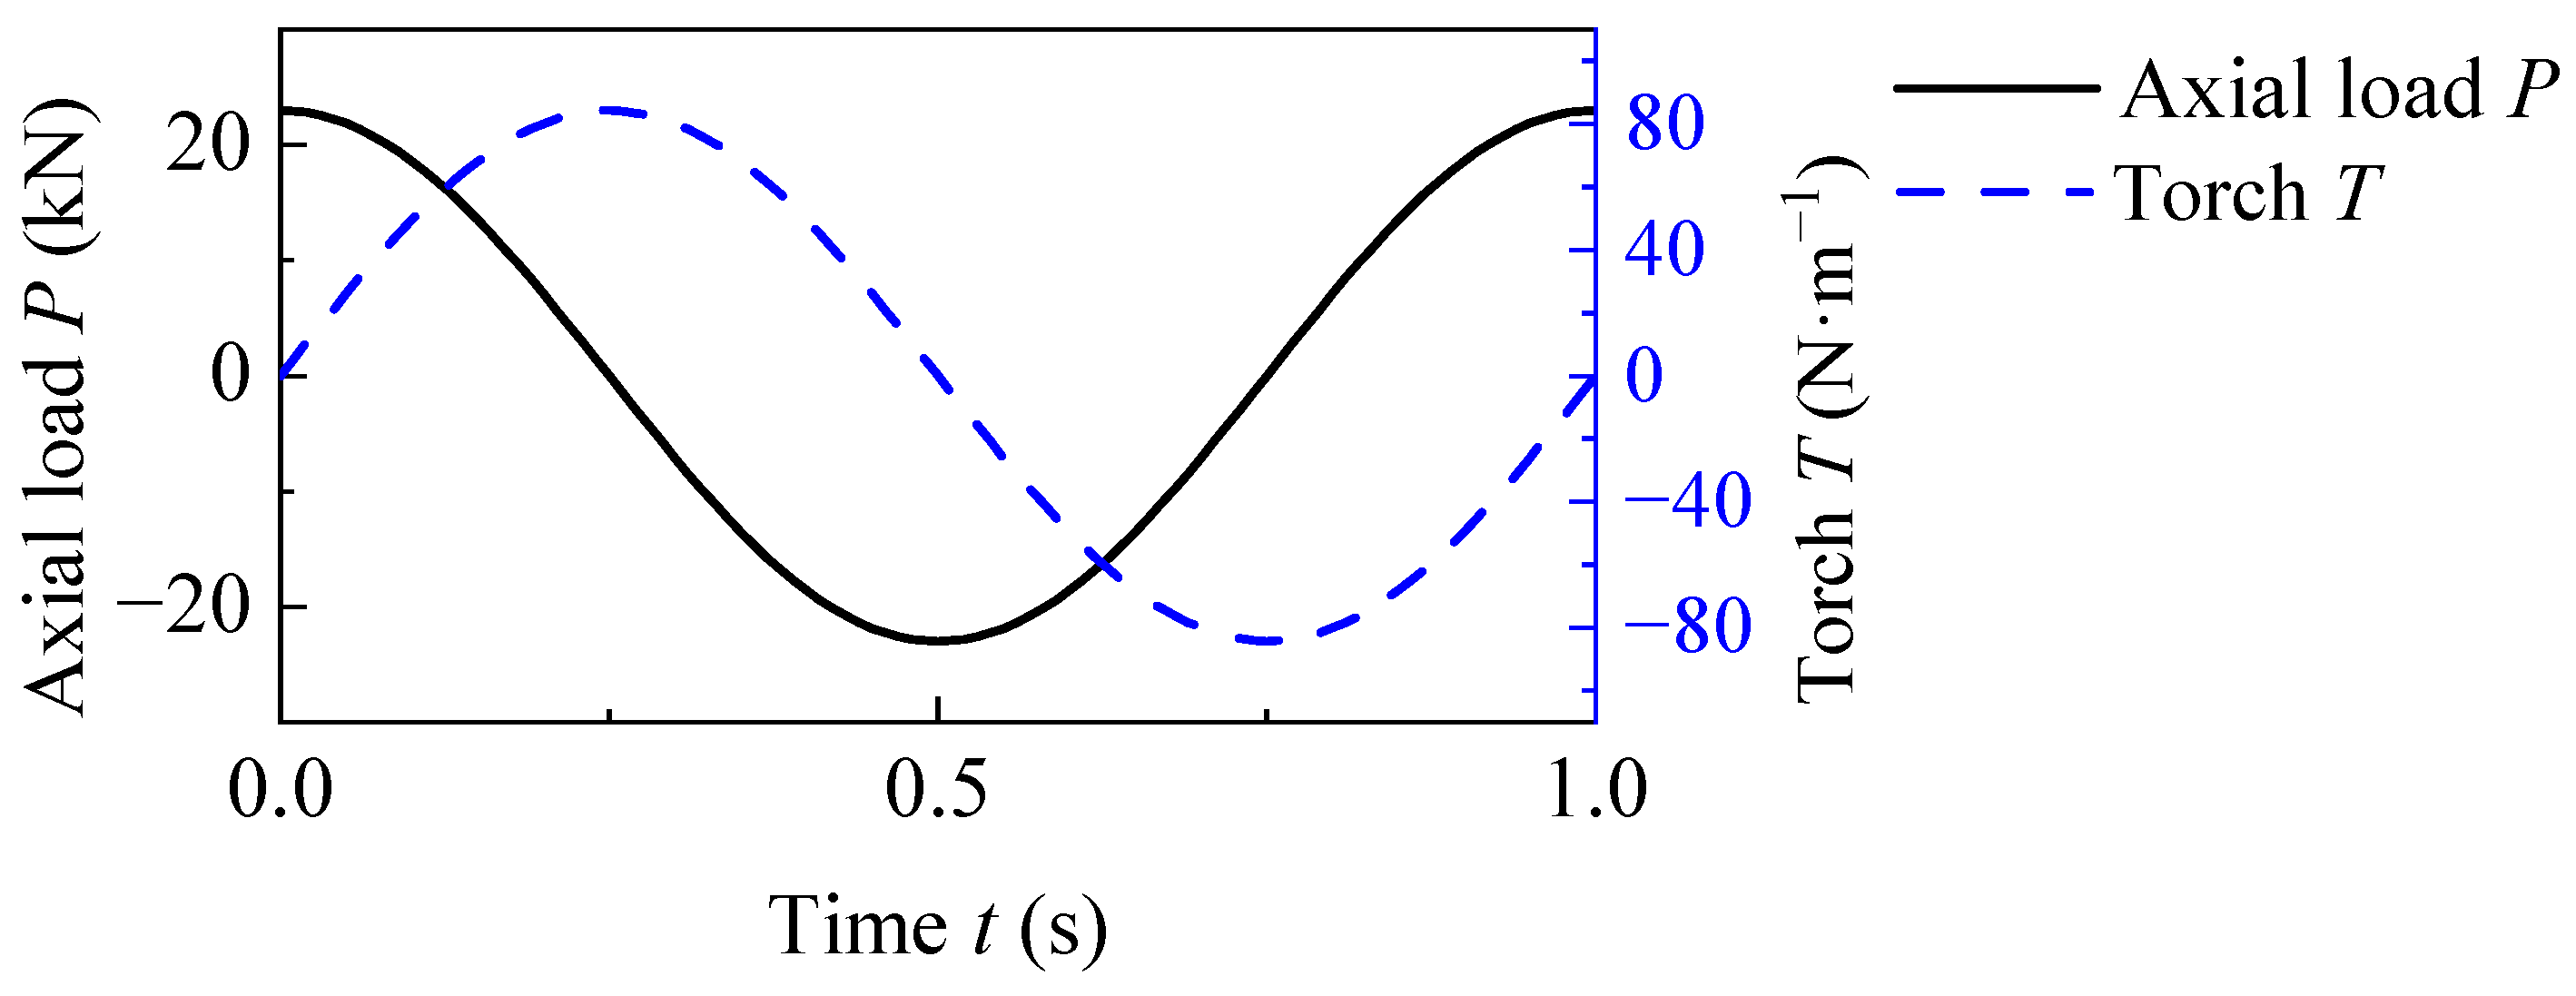
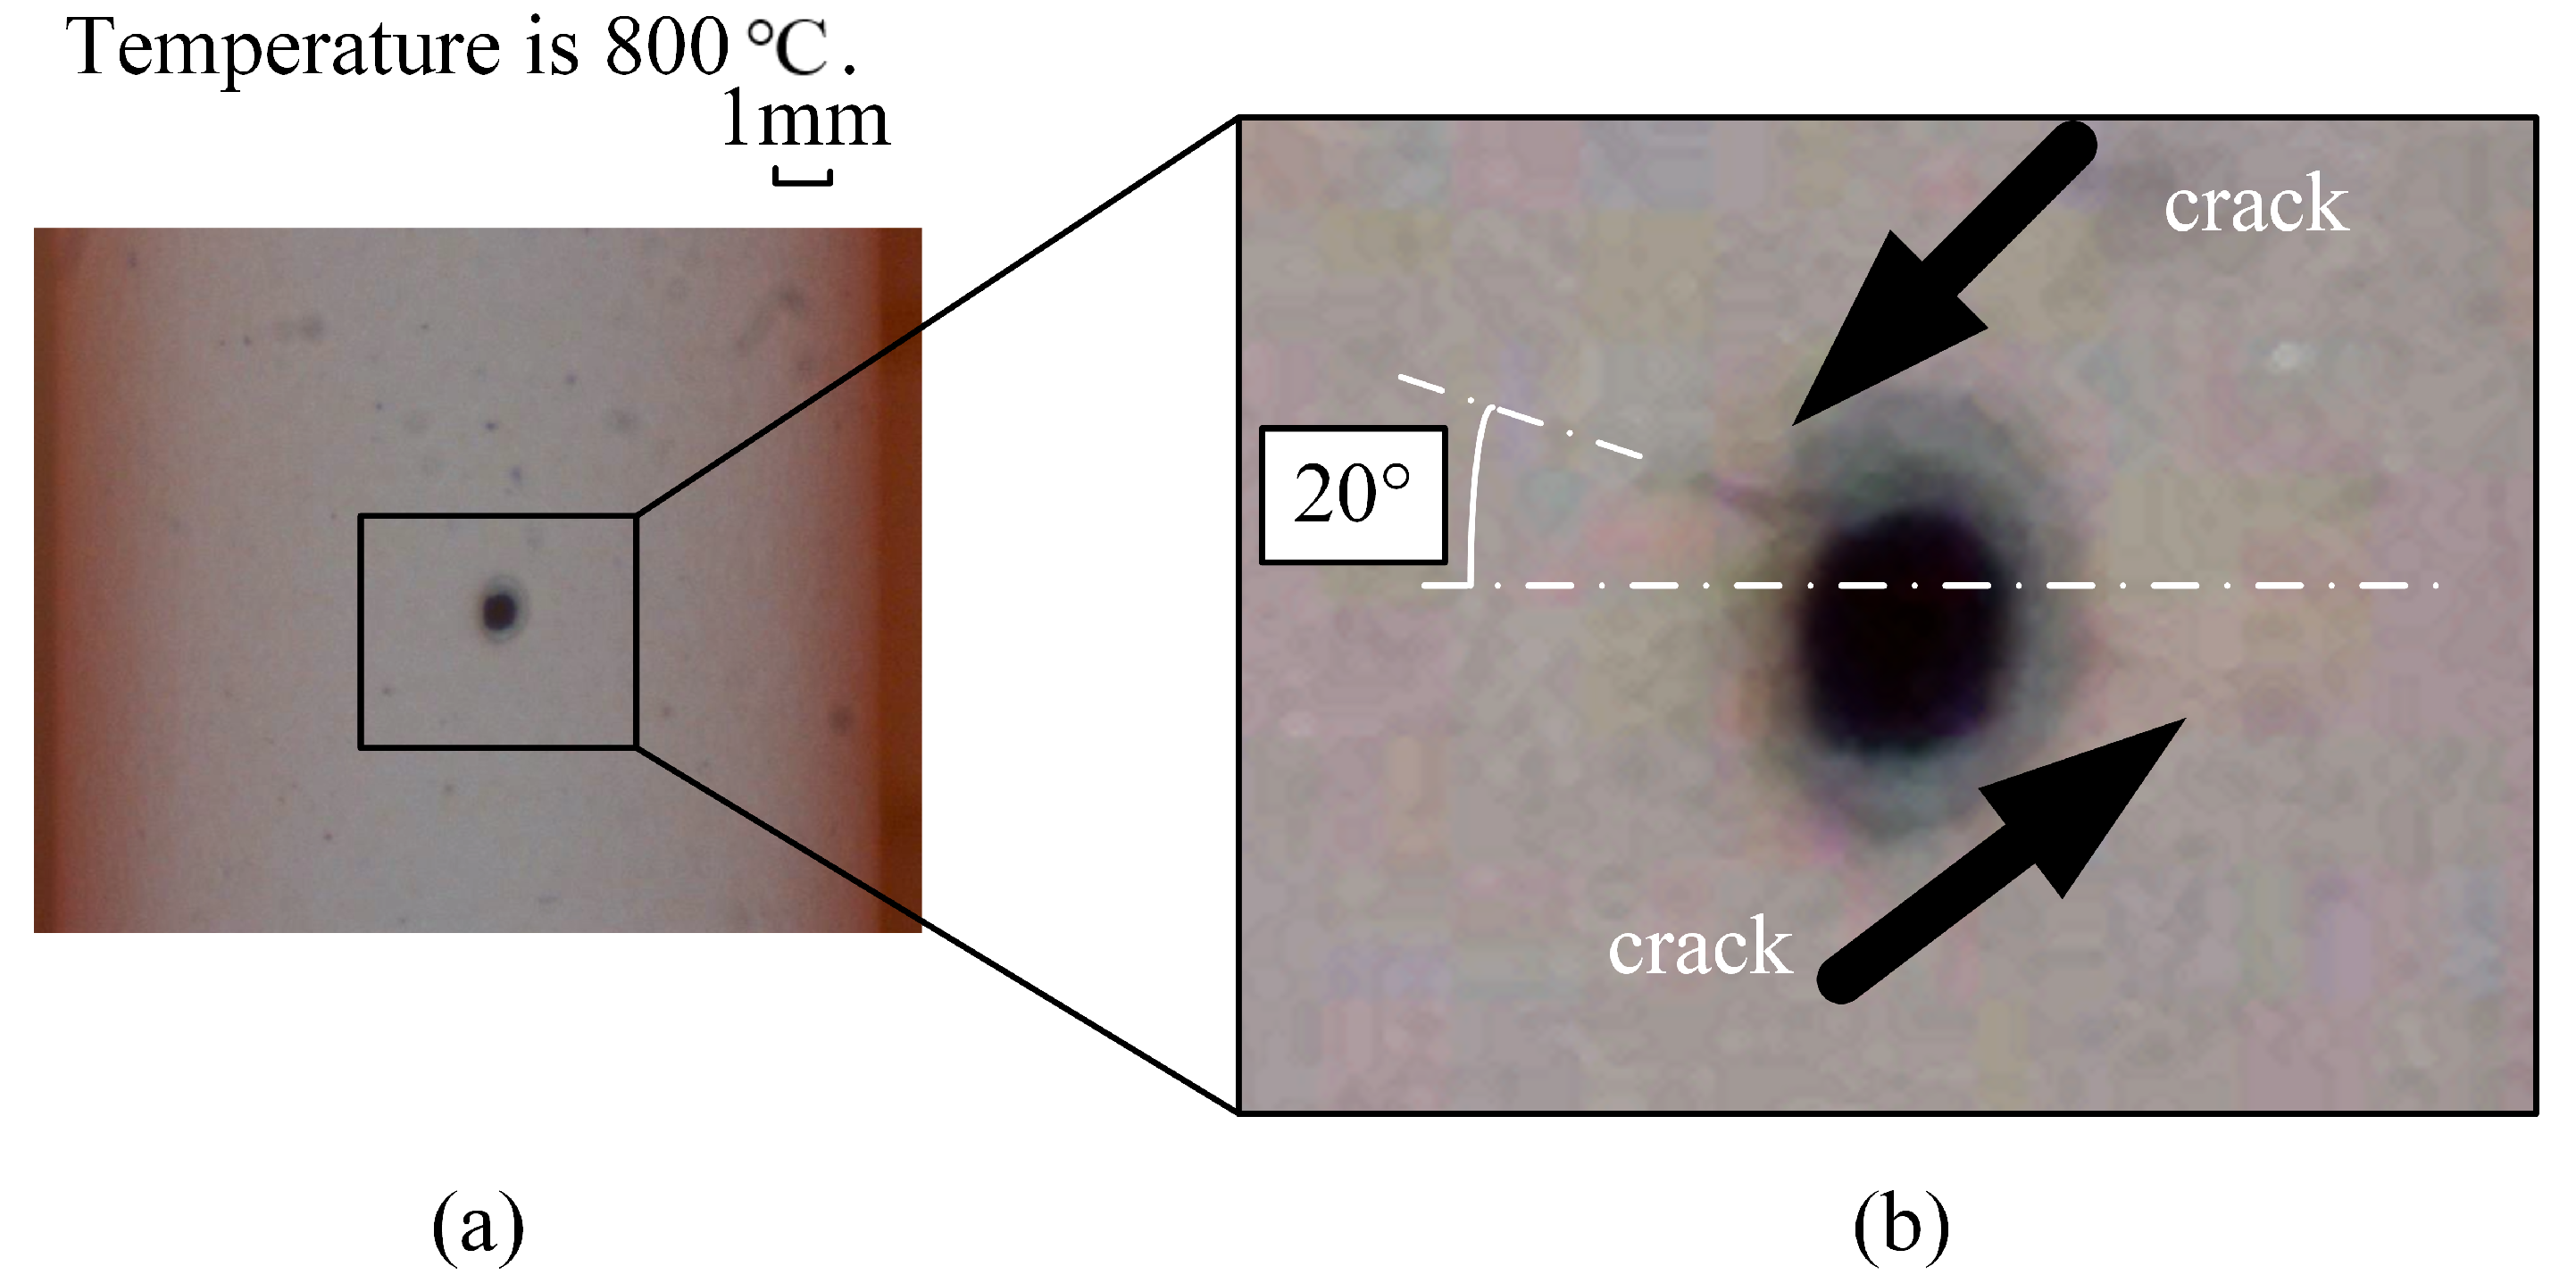
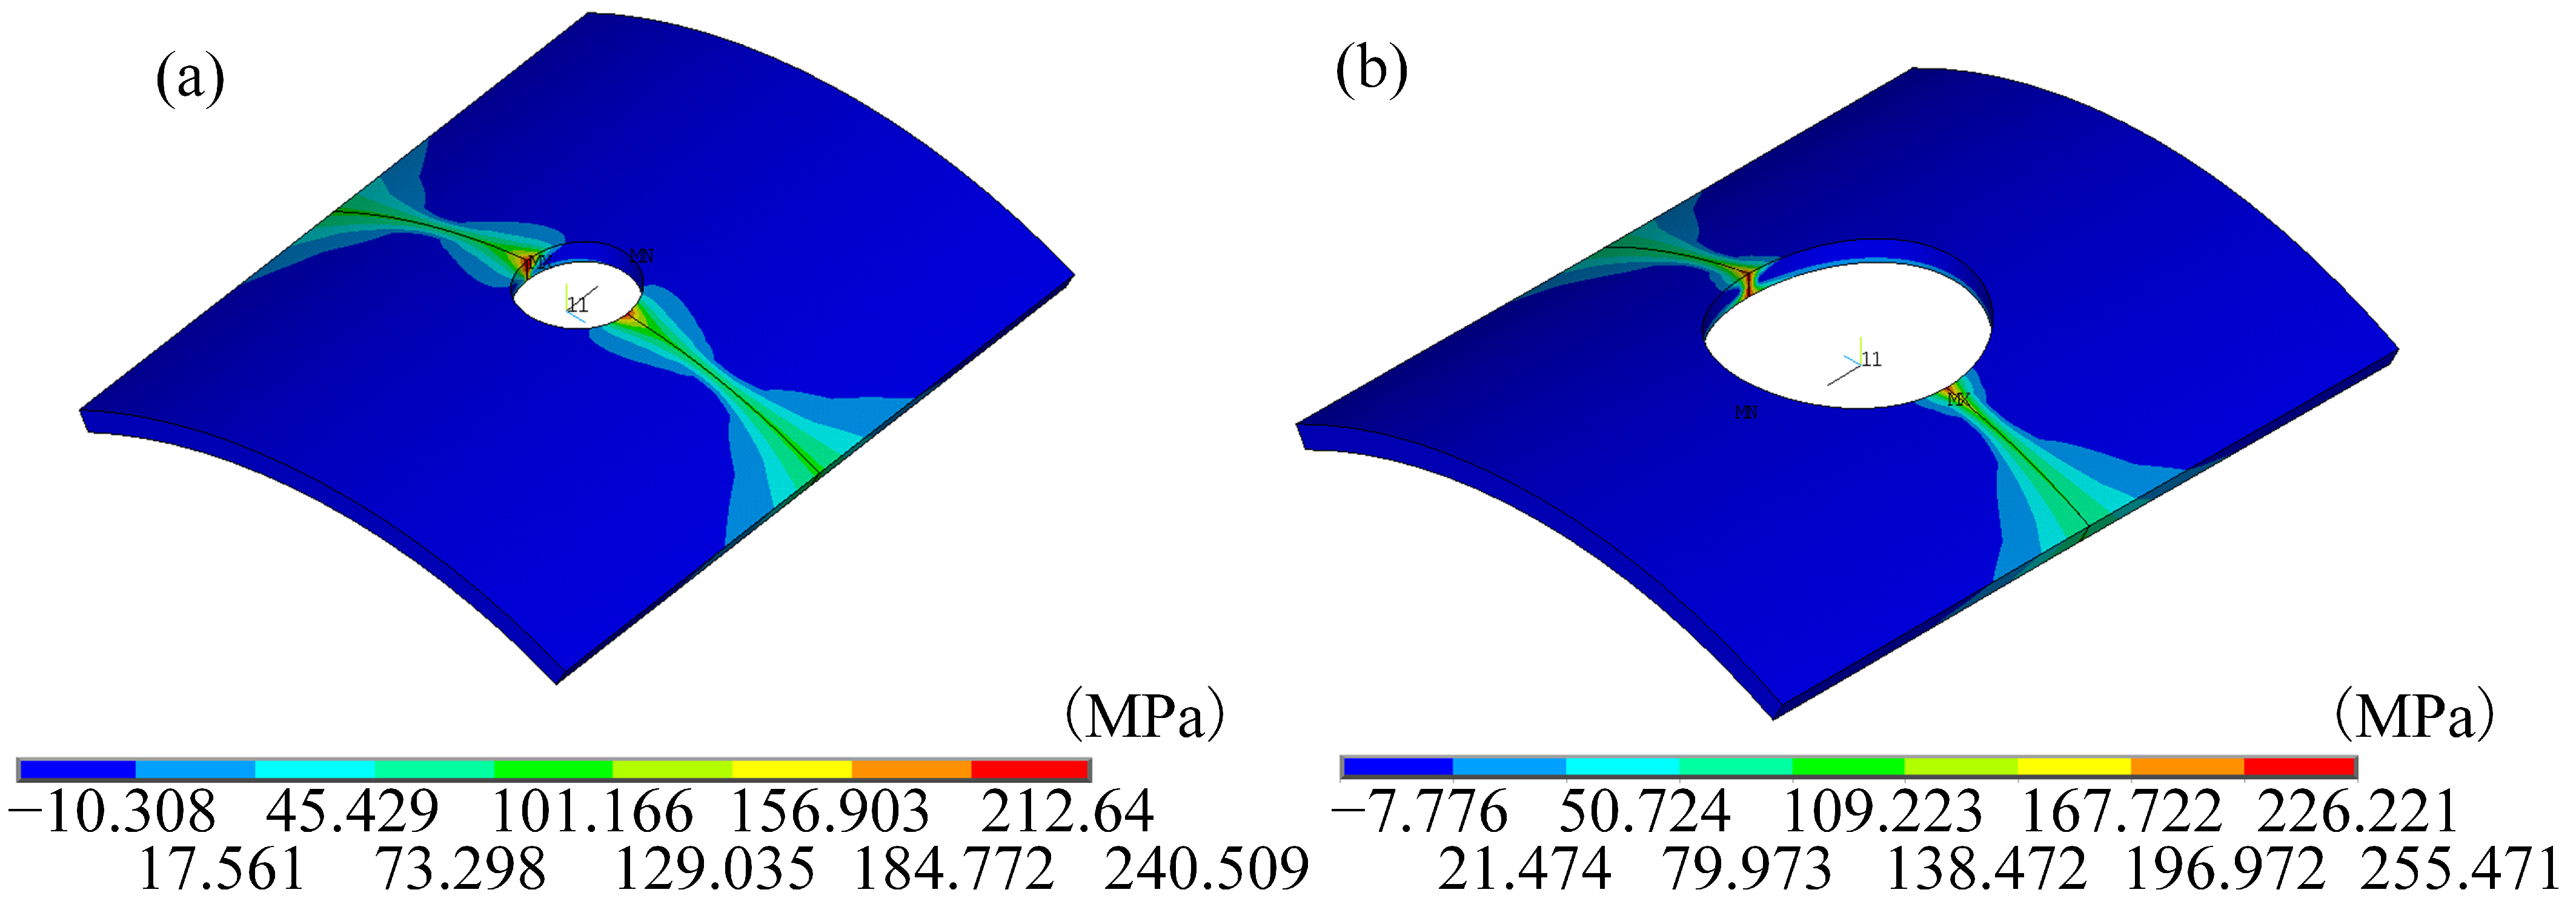
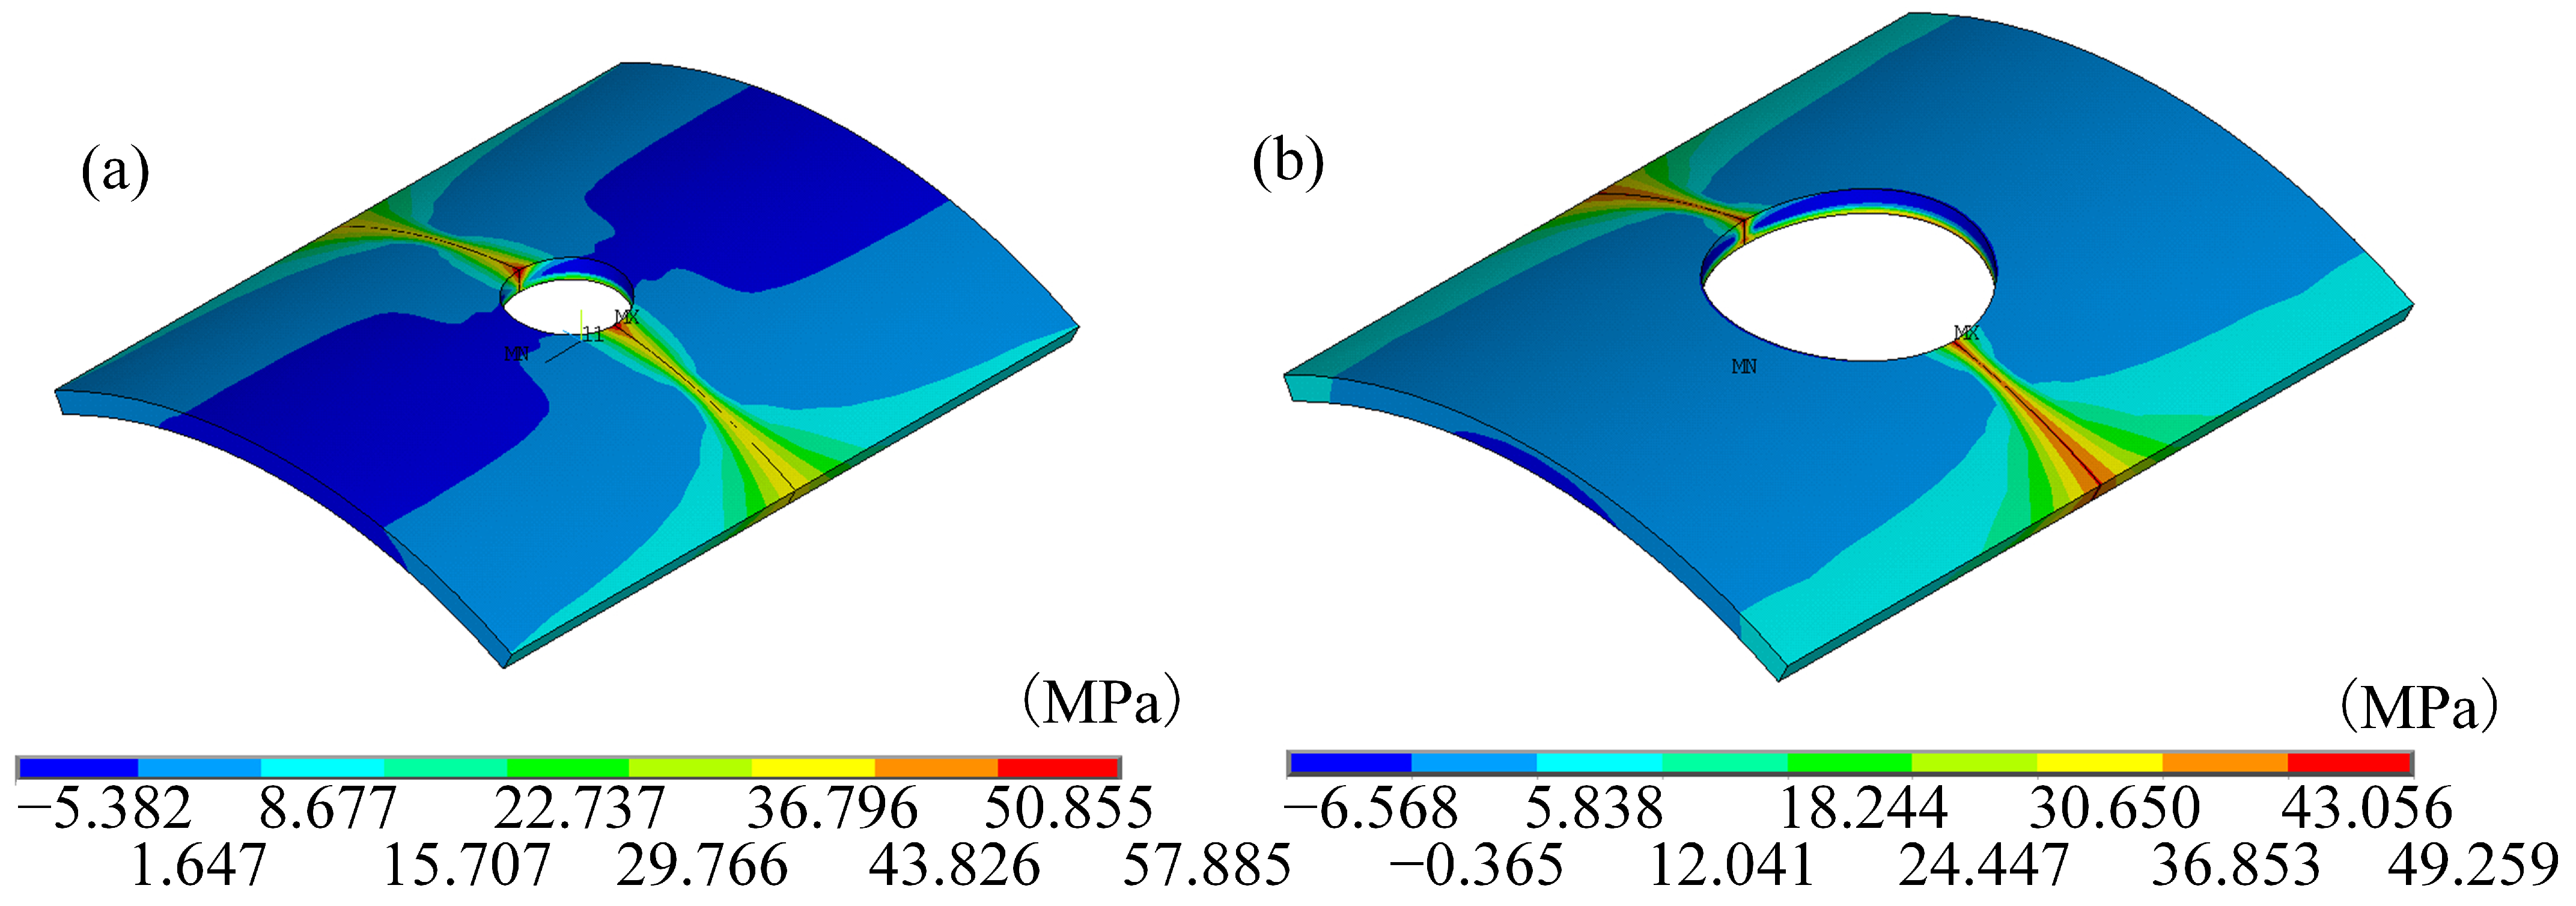
During axial tensile fatigue tests, cracks in the topcoat initially appeared perpendicular to the direction of the load. When subjected to tensile-torsion loads with a 90° phase difference, the cracks on the edges of the radial hole in the tube were oriented at −70° and 110° relative to the edges of the hole. Calculations revealed that the location of the maximum principal stress corresponded to the location of the initial crack, and the direction of the principal stress aligned with the direction of the crack opening.
(3)
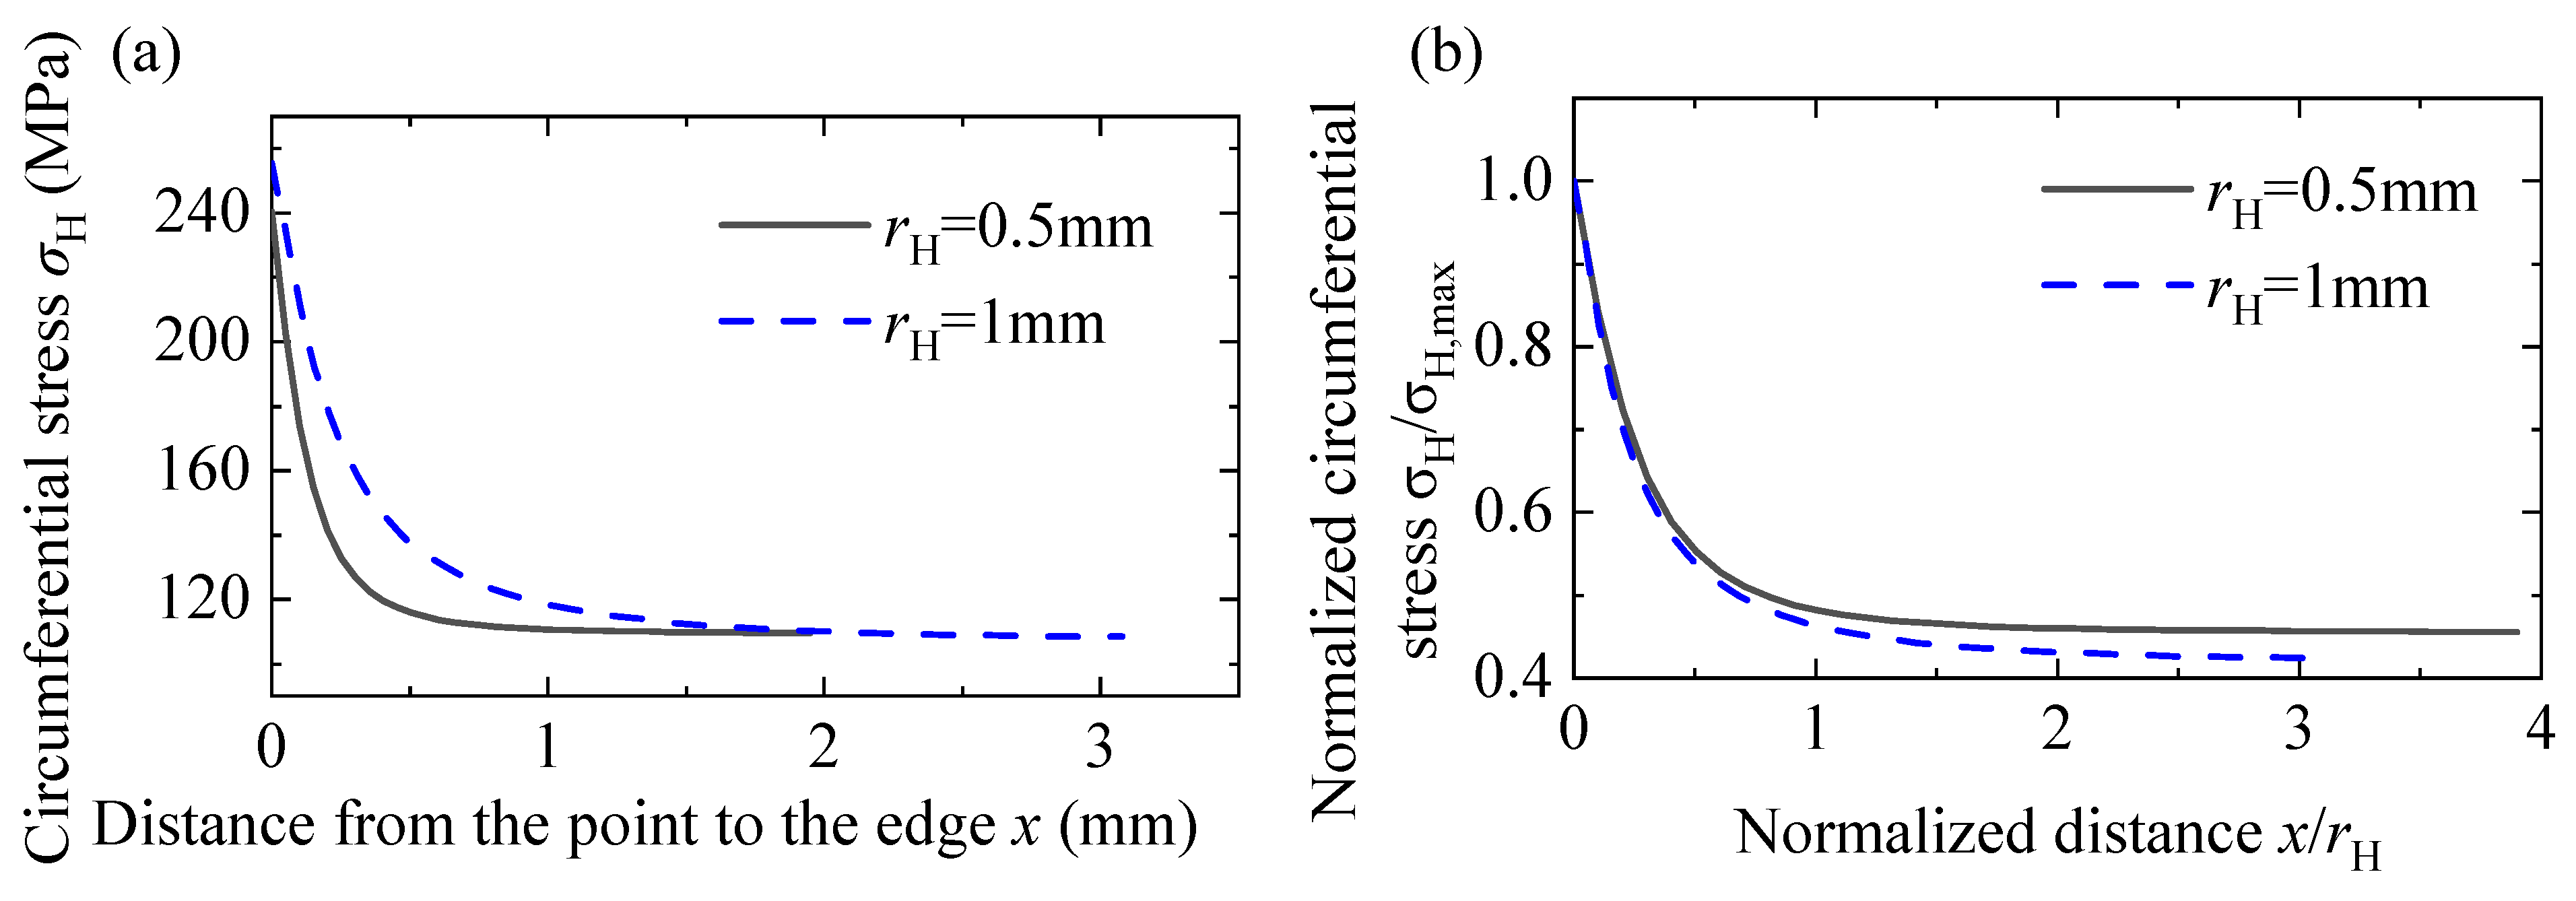
A fatigue life model was proposed, utilizing the maximum principal stress as the damage parameter, taking into account the stress gradient and the impact of multiaxial loads on fatigue life. This model was used to predict the cracking life of ceramic topcoat thin-walled tubes with radial holes under loads parallel to the coating interface. Excluding two data points where cracking occurred immediately upon loading, the life prediction results fell within a four-fold scatter band, with 77% of the prediction results falling within a two-fold scatter band.

Author Contributions

Q.T.: Methodology, Validation, Writing—original draft preparation. Y.W.: Conceptualization, Supervision. Y.Z.: Writing—review and editing. All authors have read and agreed to the published version of the manuscript.

Funding

This research was funded by the National Science and Technology Major Project grant number J2019-IV-0006-0074, Natural Science Foundation of Jiangsu Province of China (No. BK20230366), and the Natural Science Research Start-Up Foundation of Recruiting Talents of Nanjing University of Posts and Telecommunications (No. NY223044).

Institutional Review Board Statement

Not applicable.

Informed Consent Statement

Not applicable.

Data Availability Statement

Data in the paper are available from the authors.

Acknowledgments

The authors sincerely appreciate Tong-Hui Wang and Shun Yang for their help in experimental preparation.

Conflicts of Interest

The authors declare no conflicts of interest.

Abbreviations

The following abbreviations are used in this manuscript:
APSAtmospheric Plasma Spraying
BCBondcoat
EB-PVDElectron Beam Physical Vapor Deposition
FEMFinite Element Method
HVOFHigh-Velocity Oxygen-Fuel
SEMScanning Electron Microscope
TBCsThermal Barrier Coatings
TCTopcoat
YSZYttria Stabilized Zirconia

References

  1. Ebrahimzade, V.; Haasler, D.; Malzbender, J. Failure mechanism and lifetime of various laser-drilled APS-TBC systems under LCF conditions. Eng. Fail. Anal. 2021, 127, 105526. [Google Scholar] [CrossRef]
  2. Mensch, A.; Thole, K.A.; Craven, B.A. Conjugate heat transfer measurements and predictions of a blade endwall with a thermal barrier coating. J. Turbomach. 2014, 136, 121003. [Google Scholar] [CrossRef]
  3. Hardwicke, C.U.; Lau, Y.C. Advances in thermal spray coatings for gas turbines and energy generation: A review. J. Therm. Spray Technol. 2013, 22, 564–576. [Google Scholar] [CrossRef]
  4. Aleksanoglu, H.; Scholz, A.; Oechsner, M.; Berger, C.; Rudolphi, M.; Schuetze, M.; Stamm, W. Determining a critical strain for APS thermal barrier coatings under service relevant loading conditions. Int. J. Fatigue 2013, 53, 40–48. [Google Scholar] [CrossRef]
  5. Mehboob, G.; Liu, M.J.; Xu, T.; Hussain, S.; Mehboob, G.; Tahir, A. A review on failure mechanism of thermal barrier coatings and strategies to extend their lifetime. Ceram. Int. 2020, 46, 8497–8521. [Google Scholar] [CrossRef]
  6. Liu, Y.; Persson, C.; Wigren, J. Experimental and numerical life prediction of thermally cycled thermal barrier coatings. J. Therm. Spray Technol. 2004, 13, 415–424. [Google Scholar] [CrossRef]
  7. Gildersleeve, V.E.J.; Nakamura, T.; Sampath, S. Durability of plasma sprayed Thermal Barrier Coatings with controlled properties part II: Effects of geometrical curvature. Surf. Coat. Technol. 2021, 424, 127671. [Google Scholar] [CrossRef]
  8. Jiang, J.S.; Ma, X.F.; Wang, B. Stress analysis of the thermal barrier coating system near a cooling hole considering the free-edge effect. Ceram. Int. 2020, 46, 331–342. [Google Scholar] [CrossRef]
  9. Jiang, J.S.; Wu, D.; Wang, W.Z.; Zhao, X.F.; Ma, X.F.; Wang, B.; Shi, H.J. Fracture behavior of TBCs with cooling hole structure under cyclic thermal loadings. Ceram. Int. 2020, 46, 3644–3654. [Google Scholar] [CrossRef]
  10. Tao, Q.N.; Wang, Y.R.; Yang, S.; Liu, Y.H. Simulations of effects of geometric and material parameters on the interfacial stress of the thermal barrier coatings with free edges. Coatings 2023, 13, 1378. [Google Scholar] [CrossRef]
  11. Naumenko, D.; Shemet, V.; Singheiser, L.; Quadakkers, W.J. Failure mechanisms of thermal barrier coatings on MCrAlY-type bondcoats associated with the formation of the thermally grown oxide. J. Mater. Sci. 2009, 44, 1687–1703. [Google Scholar] [CrossRef]
  12. Schmidt, U.T.; Vöhringer, O.; Löhe, D. The creep damage behavior of the plasma-sprayed thermal barrier coating system NiCr22Co12Mo9-NiCoCrAlY-ZrO2/7Y2O3. J. Eng. Gas Turbines Power-Trans. ASME 1998, 121, 678–682. [Google Scholar] [CrossRef]
  13. Choi, S.R.; Zhu, D.M.; Miller, R.A. Deformation and tensile cyclic fatigue of plasma-sprayed ZrO2-8wt% Y2O3 thermal barrier coatings. In Proceedings of the 25th Annual Conference on Composites, Advanced Ceramics, Materials and Structures, Cocoa Beach, FL, USA, 21–27 January 2001; Ceramic Engineering and Science Proceedings. pp. 427–434. [Google Scholar]
  14. Basquin, O.H. The exponential law of endurance tests. Am. Soc. Test. Mater. Proc. 1910, 10, 625–630. [Google Scholar]
  15. Kurek, A. Using fatigue characteristics to analyse test results for 16Mo3 steel under tension-compression and oscillatory bending conditions. Materials 2020, 13, 1197. [Google Scholar] [CrossRef] [PubMed]
  16. Garud, Y.S. A new approach to the evaluation of fatigue under multiaxial loadings. J. Eng. Mater. Technol. 1981, 103, 118–125. [Google Scholar] [CrossRef]
  17. Carpinteri, A.; Montagnoli, F.; Invernizzi, S. Scaling and fractality in fatigue resistance: Specimen-size effects on Wohler’s curve and fatigue limit. Fatigue Fract. Eng. Mater. Struct. 2020, 43, 1869–1879. [Google Scholar] [CrossRef]
  18. Li, C.M.; Hu, Z.; Sun, C.Q.; Song, Q.Y.; Zhang, W.H. Probabilistic control volume method for evaluating the effects of notch size and loading type on fatigue life. Acta Mech. Solida Sin. 2020, 33, 141–149. [Google Scholar] [CrossRef]
  19. Li, S.J.; An, Y.L.; Zhou, H.D.; Chen, J.M. Plasma sprayed YSZ coatings deposited at different deposition temperatures, part 1: Splats, microstructures, mechanical properties and residual stress. Surf. Coat. Technol. 2018, 350, 712–721. [Google Scholar] [CrossRef]
  20. Tao, Q.N.; Wang, Y.R.; Wei, D.S.; Yang, S. Thermal oxidation description methodology of thermal barrier coatings on gas turbine blades considering service characteristics. Chin. J. Aeronaut. 2024, 37, 410–424. [Google Scholar] [CrossRef]
  21. Hassanifard, S.; Behdinan, K. Effects of voids and raster orientations on fatigue life of notched additively manufactured PLA components. Int. J. Adv. Manuf. Technol. 2022, 120, 6241–6250. [Google Scholar] [CrossRef]
  22. Fatemi, A.; Zeng, Z.; Plaseied, A. Fatigue behavior and life predictions of notched specimens made of QT and forged microalloyed steels. Int. J. Fatigue 2004, 26, 663–672. [Google Scholar] [CrossRef]
  23. Wang, J.L.; Wei, D.S.; Wang, Y.R.; Zhong, B. High-temperature LCF life estimation based on stress gradient effect of notched GH4169 alloy specimens. Fatigue Fract. Eng. Mater. Struct. 2017, 40, 1640–1651. [Google Scholar] [CrossRef]
  24. Leitner, M.; Vormwald, M.; Remes, H. Statistical size effect on multiaxial fatigue strength of notched steel components. Int. J. Fatigue 2017, 104, 322–333. [Google Scholar] [CrossRef]
  25. Kamal, M.; Rahman, M.M. Advances in fatigue life modeling: A review. Renew. Sustain. Energy Rev. 2018, 82, 940–949. [Google Scholar] [CrossRef]
  26. Bialas, M. Finite element analysis of stress distribution in thermal barrier coatings. Surf. Coat. Technol. 2008, 202, 6002–6010. [Google Scholar] [CrossRef]
  27. Mohammadi, M.; Poursaeidi, E.; Torkashvand, K. Finite element analysis of the effect of thermal cycles and ageing on the interface delamination of plasma sprayed thermal barrier coatings. Surf. Coat. Technol. 2019, 375, 243–255. [Google Scholar] [CrossRef]
  28. Ali, M.Y.; Nusier, S.Q.; Newaz, G.M. Creep effects on early damage initiation in a TBC system. J. Mater. Sci. 2004, 39, 3383–3390. [Google Scholar] [CrossRef]
  29. Academic Committee of Superalloys in Chinese Society for Metals China Superalloys Handbook; Standards Press of China: Beijing, China, 2012.
  30. Wei, S.; Fu-chi, W.; Qun-bo, F.; Zhuang, M. Lifetime prediction of plasma-sprayed thermal barrier coating systems. Surf. Coat. Technol. 2013, 217, 39–45. [Google Scholar] [CrossRef]
  31. Durbin, J.; Watson, G.S. Testing for serial correlation in least squares regression. I. Biometrika 1950, 37, 409–428. [Google Scholar] [CrossRef]
  32. Durbin, J.; Watson, G.S. Testing for serial correlation in least squares regression. II. Biometrika 1951, 38, 159–178. [Google Scholar] [CrossRef]
  33. Zhong, B.; Wang, Y.R.; Wei, D.S.; Wang, J.L. A new life prediction model for multiaxial fatigue under proportional and non-proportional loading paths based on the pi-plane projection. Int. J. Fatigue 2017, 102, 241–251. [Google Scholar] [CrossRef]
  34. Zhong, B.; Wang, Y.R.; Wei, D.S.; Zhang, K.S.; Wang, J.L. Multiaxial fatigue life prediction for powder metallurgy superalloy FGH96 based on stress gradient effect. Int. J. Fatigue 2018, 109, 26–36. [Google Scholar] [CrossRef]
Figure 1. Illustration of the spalling process of the APS YSZ coatings: (a) The original state of the coating. (b) The cracks in the coatings. (c) The interfacial stress in the coatings near the cracks. (d) The spalling of the coatings due to the interfacial stress.
Coatings 14 00960 g001
Figure 2. Illustration of the uniaxial fatigue bar: (a) Geometries of the specimen. (b) Image of the specimen.
Coatings 14 00960 g002
Figure 3. Illustration of the uniaxial fatigue tube: (a) Geometries of the specimen with a hole that is 1 mm in diameter. (b) Image of the specimen with a hole that is 1 mm in diameter. (c) Image of the specimen with a hole that is 2 mm in diameter.
Coatings 14 00960 g003
Figure 4. Illustration of the multiaxial fatigue tube: (a) Geometries of the specimen. (b) Image of the specimen.
Coatings 14 00960 g004
Figure 5. Illustration of the test equipment: (a) The test equipment. (b) The image obtained by the cracking measuring instrument.
Coatings 14 00960 g005
Figure 6. The life of the topcoat for different axial loads applying on the rods.
Coatings 14 00960 g006
Figure 7. The images of the specimen FAB-800-1020-1 during the experimental procedure (the cracks are marked with the red dashed lines): (a) Prestress is 0.2 kN. (b) 600 cycle, no cracking. (c) 1800 cycle, single crack. (d) 2500 cycle, multiple cracks.
Coatings 14 00960 g007
Figure 8. The images of the specimen FAB-870-760-1 during the experimental procedure (the cracks are marked with the blue dashed lines): (a) Prestress is 0.2 kN. (b) 420 cycle, no cracking. (c) 1950 cycle, single crack. (d) 3800 cycle, multiple cracks.
Coatings 14 00960 g008
Figure 9. The specimen FAB-800-800-1 of the interrupted fatigue experiment: (a) Illustration of the prepared sample. (b) SEM image of the profile.
Coatings 14 00960 g009
Figure 10. The specimen FAB-870-760-1 after fracturing: (a) The specimen. (b) The fracture.
Coatings 14 00960 g010
Figure 11. The images of the specimen FAB-870-840-2 during the experimental procedure (the cracks are marked with the blue dashed lines): (a) Prestress is 0.2 kN. (b) Initial loading. (c) 2800 cycle.
Coatings 14 00960 g011
Figure 12. The images of the specimen FAT-800-630-H2-1 during the experimental procedure (the cracks are marked with the red dashed lines): (a) Prestress is 0.2 kN. (b) 420 cycle.
Coatings 14 00960 g012
Figure 13. The images of the specimen FAT-870-600-H1-1 during the experimental procedure (the cracks are marked with the blue dashed lines): (a) Prestress is 0.2 kN. (b) 540 cycle.
Coatings 14 00960 g013
Figure 14. The specimens FAT-800-630-H2-1 and FAT-870-600-H1-1 after fracture: (a) FAT-800-630-H2-1. (b) FAT-870-600-H1-1.
Coatings 14 00960 g014
Figure 15. The load spectrum of the multiaxial fatigue test.
Coatings 14 00960 g015
Figure 16. The specimen of the multiaxial test after fracture: (a) The specimen. (b) The fracture surface.
Coatings 14 00960 g016
Figure 17. The images of the specimen during the multiaxial experimental procedure: (a) Prestress is 0.2 kN. (b) 70 cycle.
Coatings 14 00960 g017
Figure 18. The Illustration of the loading method during calculations.
Coatings 14 00960 g018
Figure 19. The fatigue life of the topcoat versus the maximum stress in the topcoat.
Coatings 14 00960 g019
Figure 20. The fatigue life of the topcoat versus the stress amplitude in the topcoat.
Coatings 14 00960 g020
Figure 21. The fatigue life of the topcoat versus the stress ratio.
Coatings 14 00960 g021
Figure 22. The contour of the circumferential stress near the hole edge in the topcoat when the temperature is 870 °C and the axial load is 17.36 kN: (a) The diameter of the hole is 1 mm. (b) The diameter of the hole is 2 mm.
Coatings 14 00960 g022
Figure 23. The contour of the circumferential stress near the hole edge in the topcoat without the axial load when the temperature is 870 °C: (a) The diameter of the hole is 1 mm. (b) The diameter of the hole is 2 mm.
Coatings 14 00960 g023
Figure 24. The trend of the first principal stress near the hole edge in the topcoat when the temperature is 800 °C under multiaxial load.
Coatings 14 00960 g024
Figure 25. The first principal stress at the hole edge when the temperature is 800 °C under multiaxial load: (a) The axial load, the torque, the value of the max first principal stress, and the maximum stress position. (b) The first principal stress of point P m during a cycle.
Coatings 14 00960 g025
Figure 26. Predicted versus experimental life by the proposed fatigue life model under uniaxial load.
Coatings 14 00960 g026
Figure 27. The Illustration of the extraction path of the stress.
Coatings 14 00960 g027
Figure 28. The distance-stress curve at 870°C (the axial load is 17.36 kN): (a) The distance from the point to the edge versus the circumferential stress. (b) The normalized distance versus the normalized stress.
Coatings 14 00960 g028
Figure 29. Predicted versus experimental life by the proposed fatigue life model under complex load.
Coatings 14 00960 g029
Table 1. Chemical composition of DZ411 (wt%).
ElementCCrCoNiWMoAlTiTaB
Content (%)0.07∼0.1213.5∼14.39.0∼10.0rest3.5∼4.11.3∼1.72.8∼3.44.6∼5.22.5∼3.10.007∼0.02
ElementSiPSPbBiAsSnSb
Content (%, ≤)0.20.0050.010.00050.00010.0050.0020.001
Table 2. Uniaxial fatigue test results of rods with thermal barrier coatings.
NumberTemperature (°C)Max Load (kN)Life of Topcoat (Cycle)
FAB-800-1040-180029.41   1360
FAB-800-1020-128.84   1400
FAB-800-1000-128.27   1600
FAB-800-980-127.71   3600
FAB-800-980-2     800
FAB-800-960-127.14   1700
FAB-800-920-126.01   2100
FAB-800-800-122.62   5600
FAB-870-840-187023.75     900
FAB-870-840-2         1
FAB-870-820-123.18   1050
FAB-870-800-122.62   1440
FAB-870-770-121.77     840
FAB-870-770-2   2700
FAB-870-760-121.49   1700
FAB-870-730-120.64   4700
FAB-870-720-120.36   2100
FAB-870-660-118.66   5900
FAB-870-600-116.9715,000
Table 3. Uniaxial fatigue test results of tubes with thermal barrier coatings.
NumberTemperature
(°C)
Max Load
(kN)
Diameters of
Radial Hole (mm)
Life of Topcoat
(Cycle)
FAT-800-810-H1-180022.901  100
FAT-800-810-H2-12    1
FAT-800-630-H1-117.811  300
FAT-800-630-H2-12   60
FAT-870-600-H1-187017.361  270
FAT-870-600-H2-12   90
FAT-870-450-H1-112.7211380
FAT-870-450-H2-121300
Table 4. The material parameters of YSZ, Al2O3, MCrAlY and DZ411 [26,27,28,29].
PropertyTemperature
(°C)
Elastic
Modulus
(GPa)
Poisson’s
Ratio
Thermal
Expansion
Coefficient
(10−6K−1)
Density
(kg·m−3)
Specific Heat
Capacity
(J·kg−1·K−1)
Material
YSZ
(TC) [26,27]
   2017.50.2blank5200437
  22016.3
  42015.2
  62014.0
  82012.9
102011.7
Al2O3
(TGO) [28]
   22386.00.2576.03978857
  566347.68.0
1149312.18.9
MCrAlY
(BC) [28]
   22137.90.2715.167320501
  566124.015.37
1149  93.817.48
DZ411
(sub) [29]
   25129.90.311.98344469
  100128.011.9474
  200126.012.4482
  300123.012.6491
  400118.012.9501
  500114.013.2511
  600110.013.6522
  700106.014.0534
  800101.014.5547
  900  95.015.0561
1000  86.015.6575
Table 5. The thermal expansion coefficient of 8YSZ prepared by APS.
Temperature (°C)50100150200250300350400450500550
Themal Expansion Coefficient
( 10 6 K 1 )
12.1611.8111.4112.0811.8811.5311.6611.6811.6611.6611.66
Temperature (°C)600650700750800850900950100010501100
Themal Expansion Coefficient
( 10 6 K 1 )
11.4311.5111.4611.4111.4111.3311.2811.2111.1810.9610.66
Table 6. The fitting results of parameters in the fatigue life model of the topcoat under stress parallel to the interface.
ParameterA1A2A3A4
Value 4.7926−1.18920.570.8073
Table 7. The max circumferential stresses at the hole edge, and the stress ratio, as well as the corresponding life prediction results.
Temperature
(°C)
Hole Diameter
(mm)
Max Load
(kN)
Max Stress
(MPa)
Stress RatioPredicted Life
(Cycle)
Test Life
(Cycle)
800122.90288.440.201  153  100
800117.81233.370.237  317  300
870117.36240.510.277  297  270
870112.72190.160.33820181380
800222.90310.610.169  126    1
800217.81249.900.198  238   60
870217.36255.470.232  230   90
870212.72199.630.28310151300
Disclaimer/Publisher’s Note: The statements, opinions and data contained in all publications are solely those of the individual author(s) and contributor(s) and not of MDPI and/or the editor(s). MDPI and/or the editor(s) disclaim responsibility for any injury to people or property resulting from any ideas, methods, instructions or products referred to in the content.

