
Data-Driven Optimization of Plasma Electrolytic Oxidation (PEO) Coatings with Explainable Artificial Intelligence Insights

 ,
,  ,
, 
Abstract
1. Introduction
2. Materials and Methods
2.1. PEO Treatments
2.2. Data Pre-Processing and ML Model Building
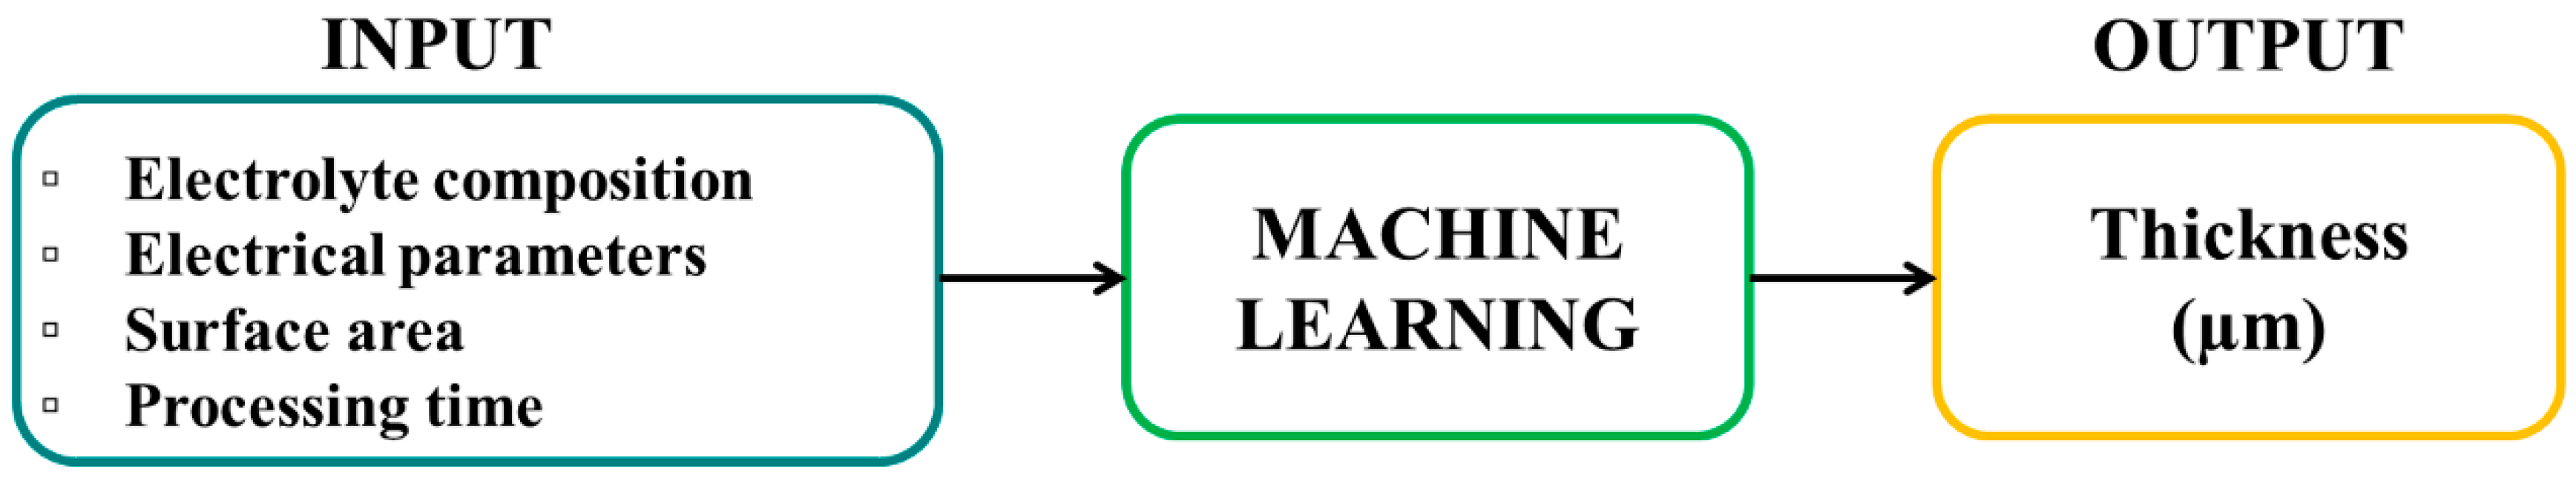
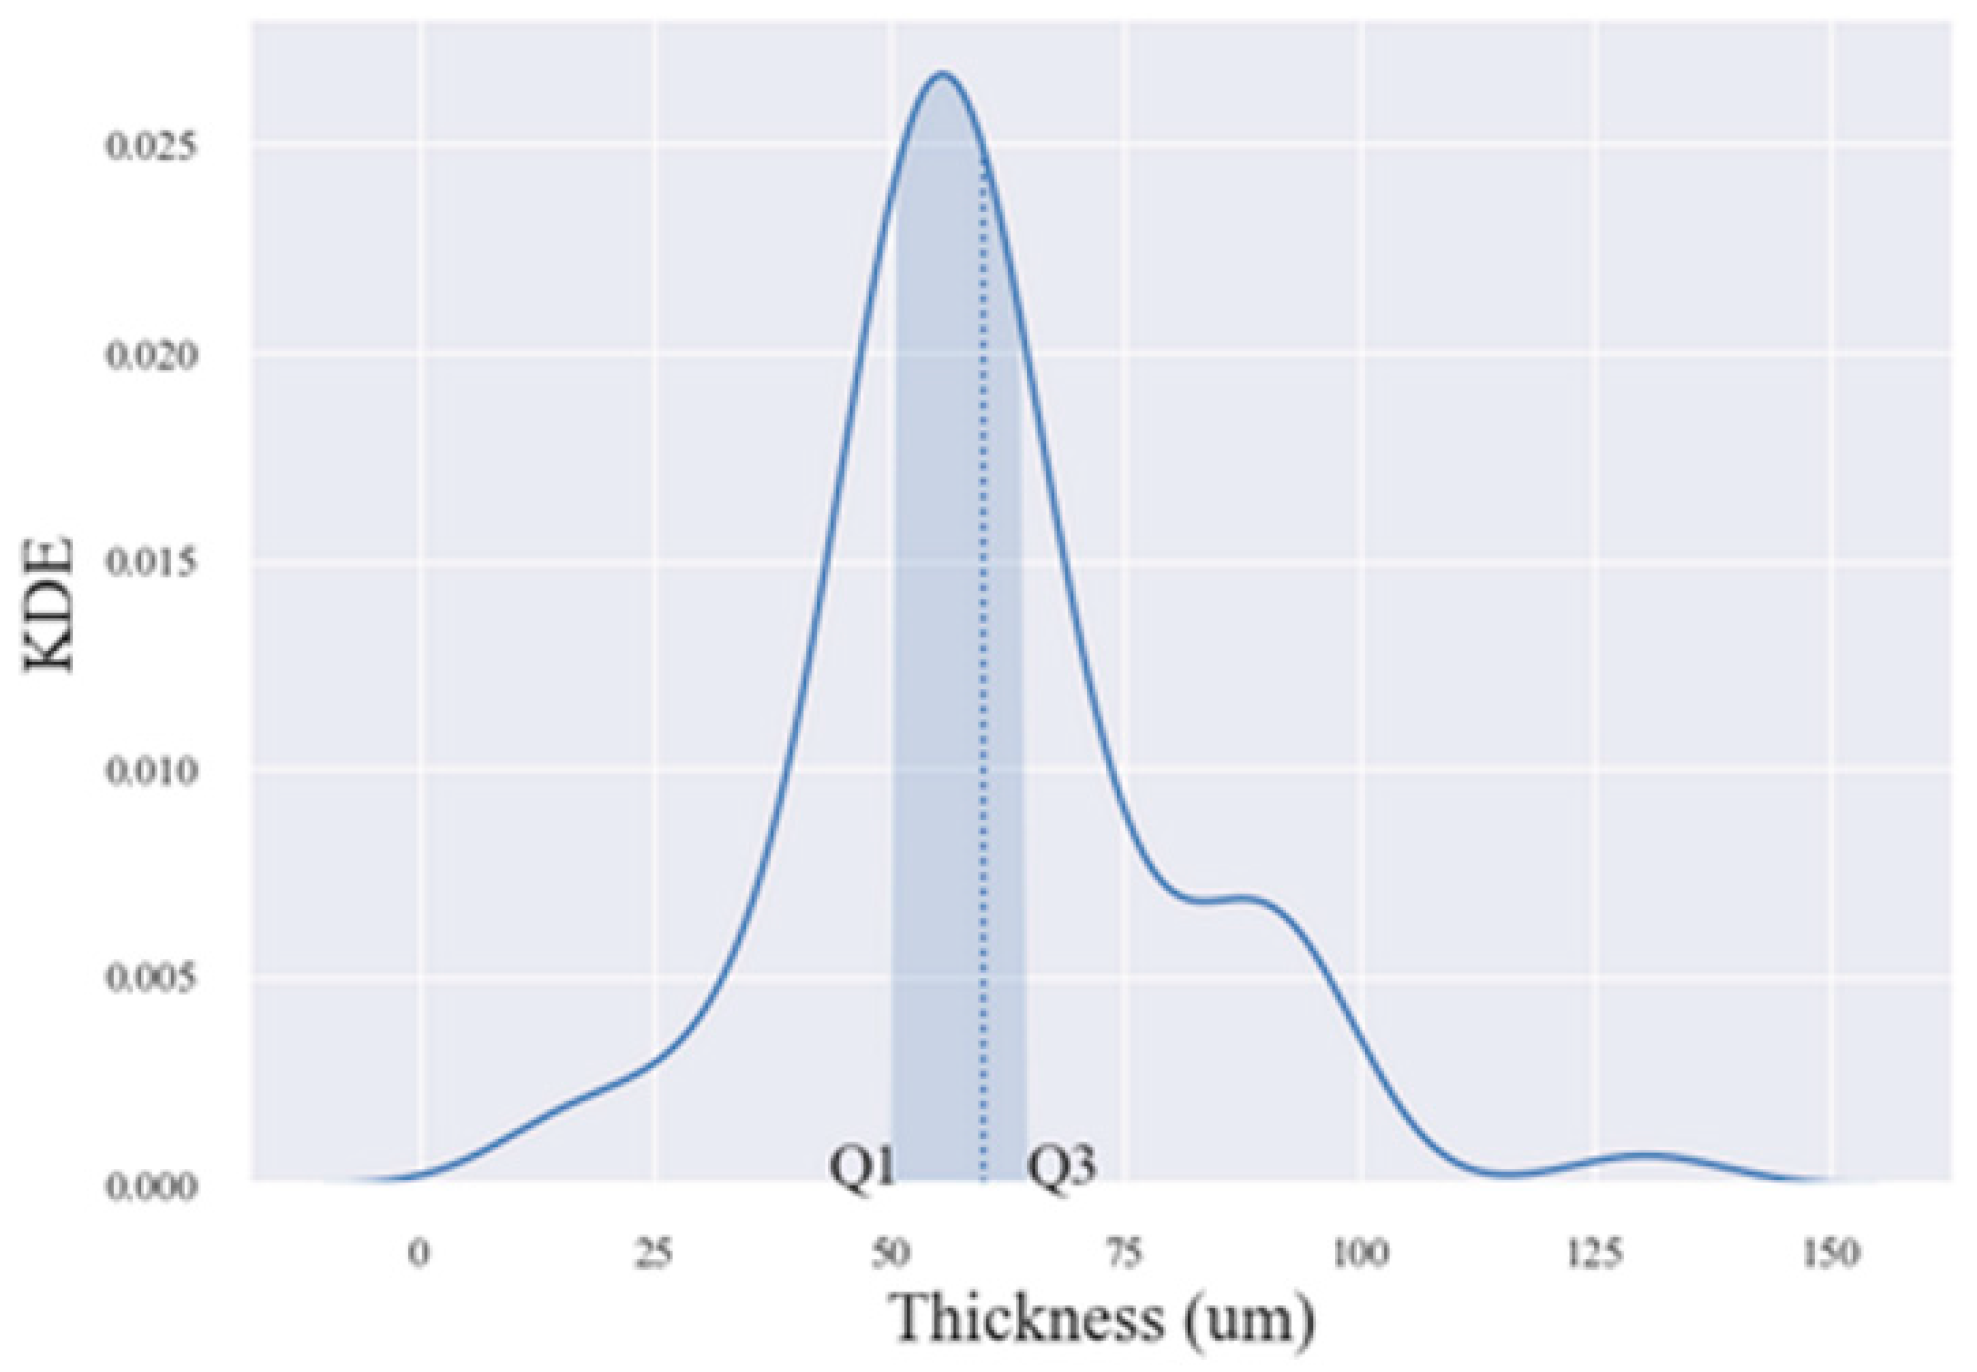
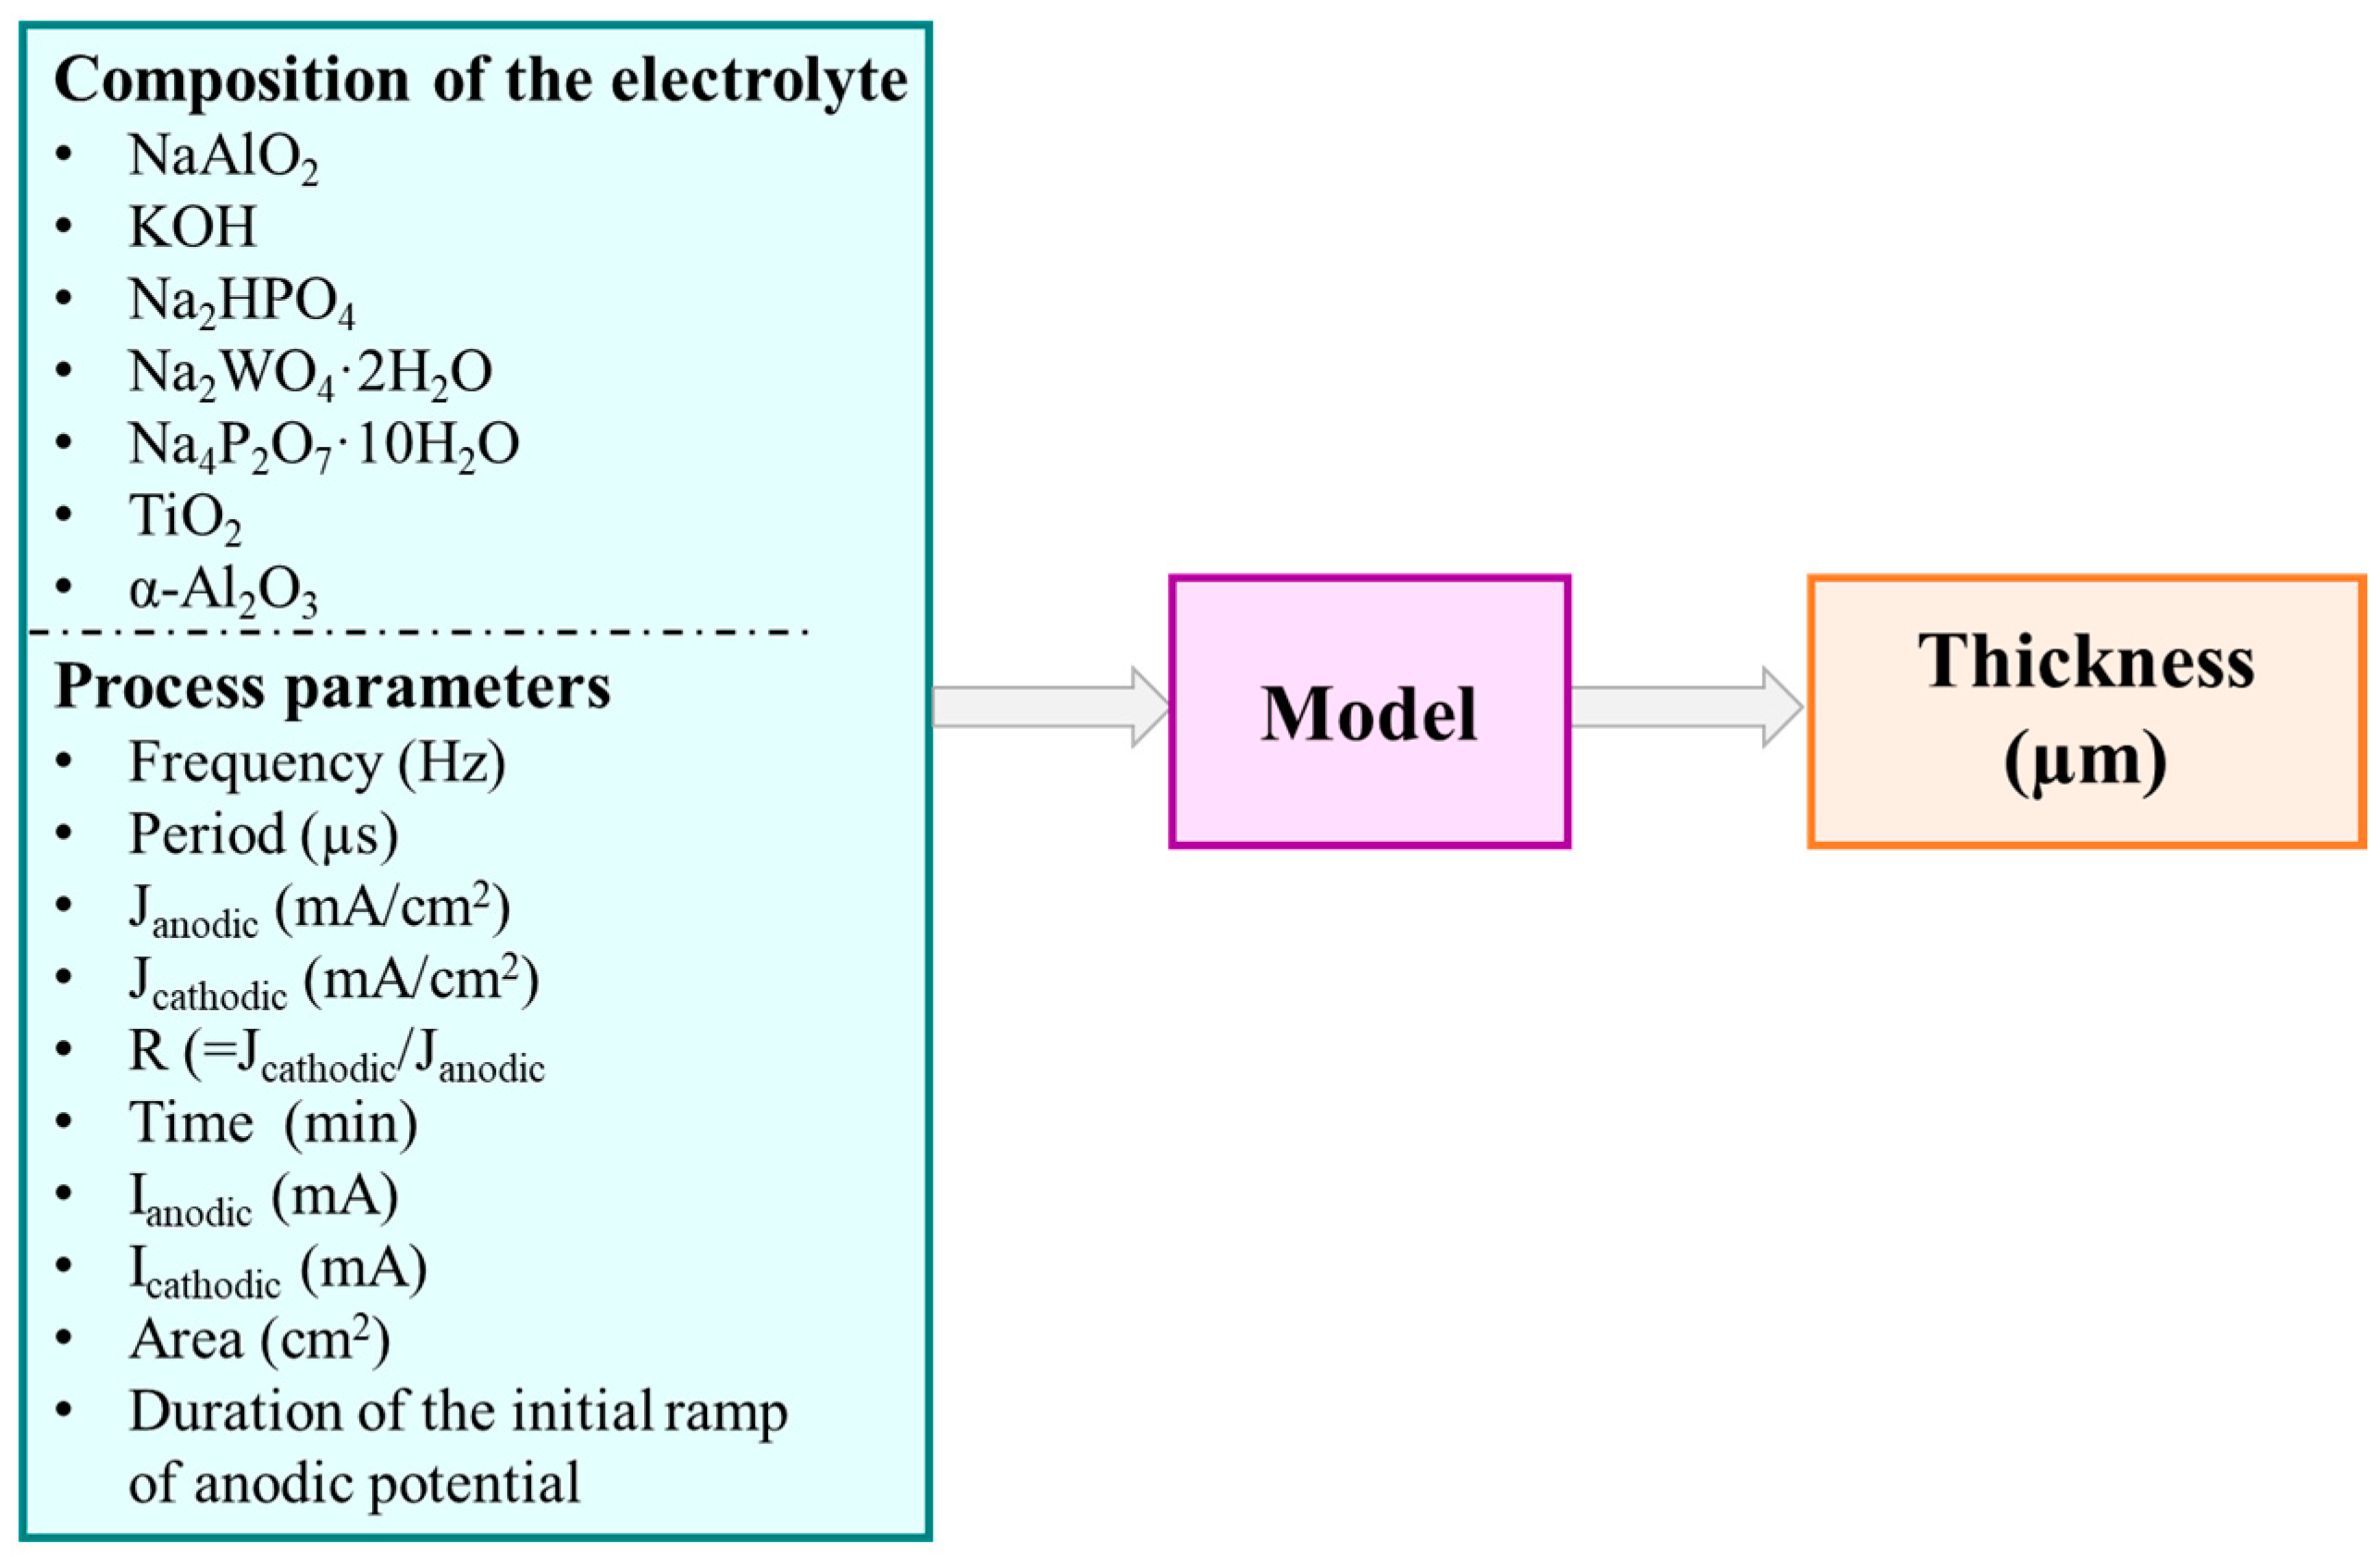
2.2.1. Input Variables and Pre-Processing
2.2.2. Tested Models
3. Results and Discussion
3.1. Modelling of PEO Processes
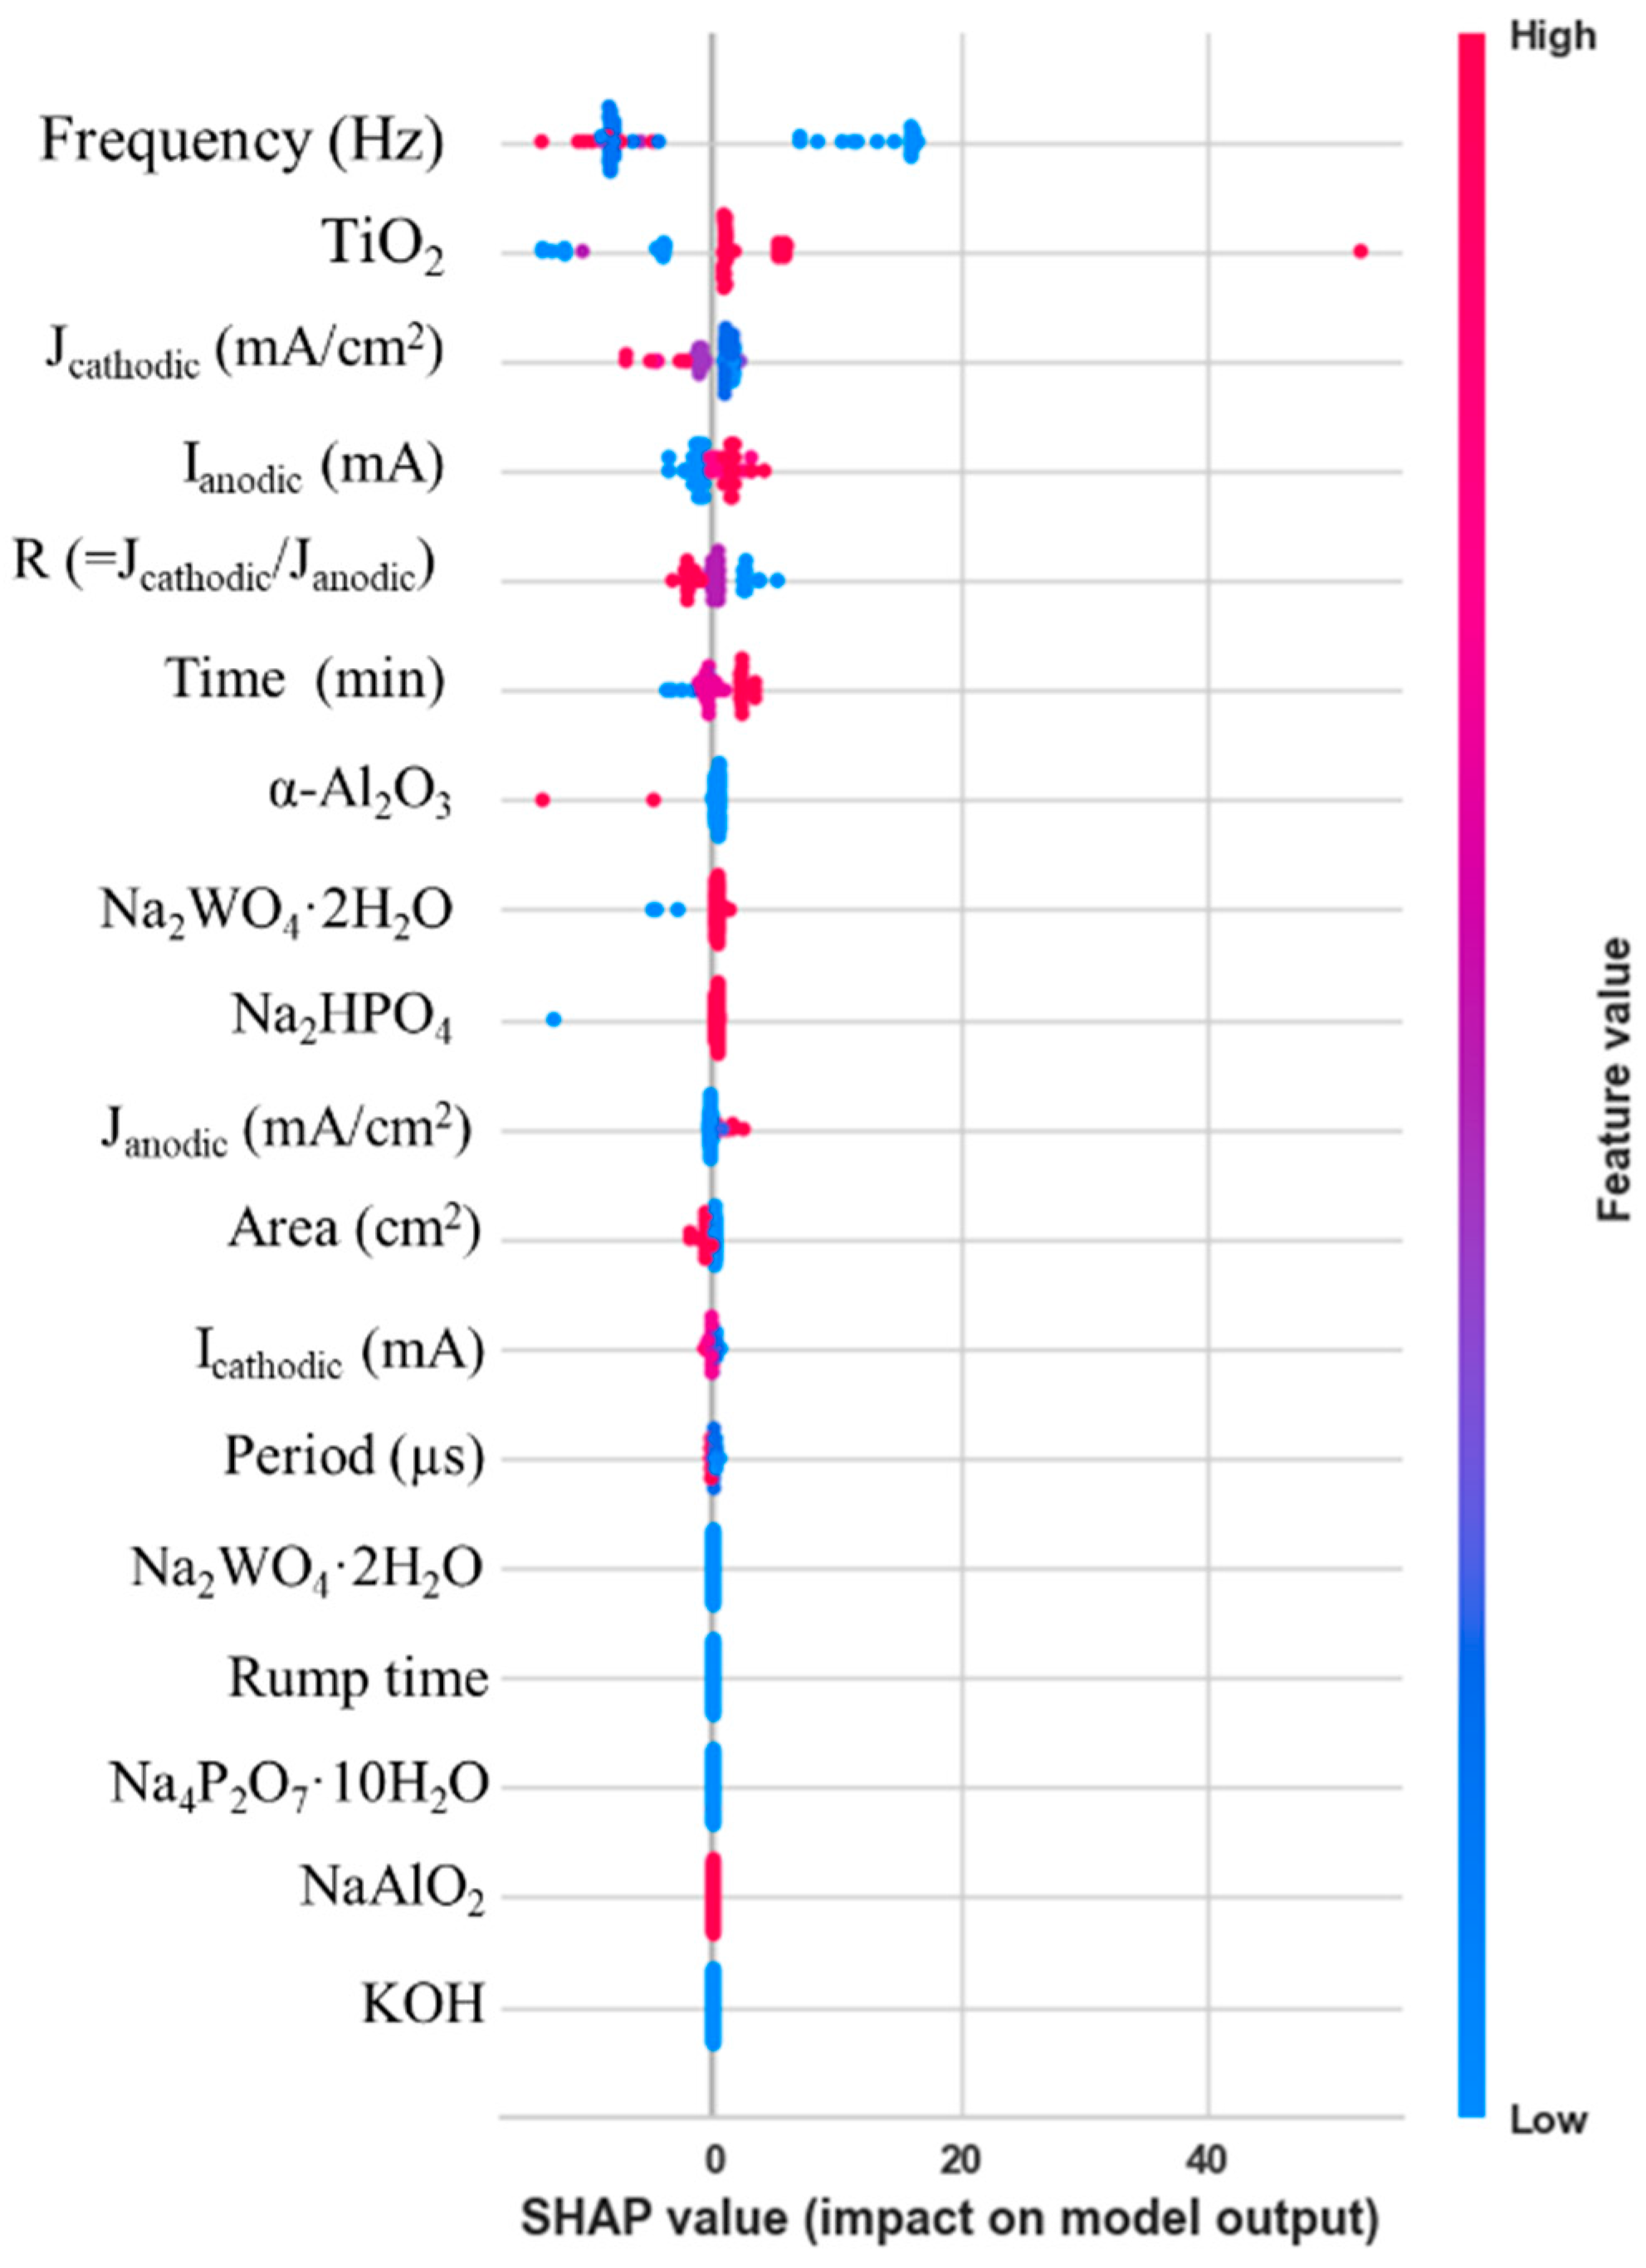
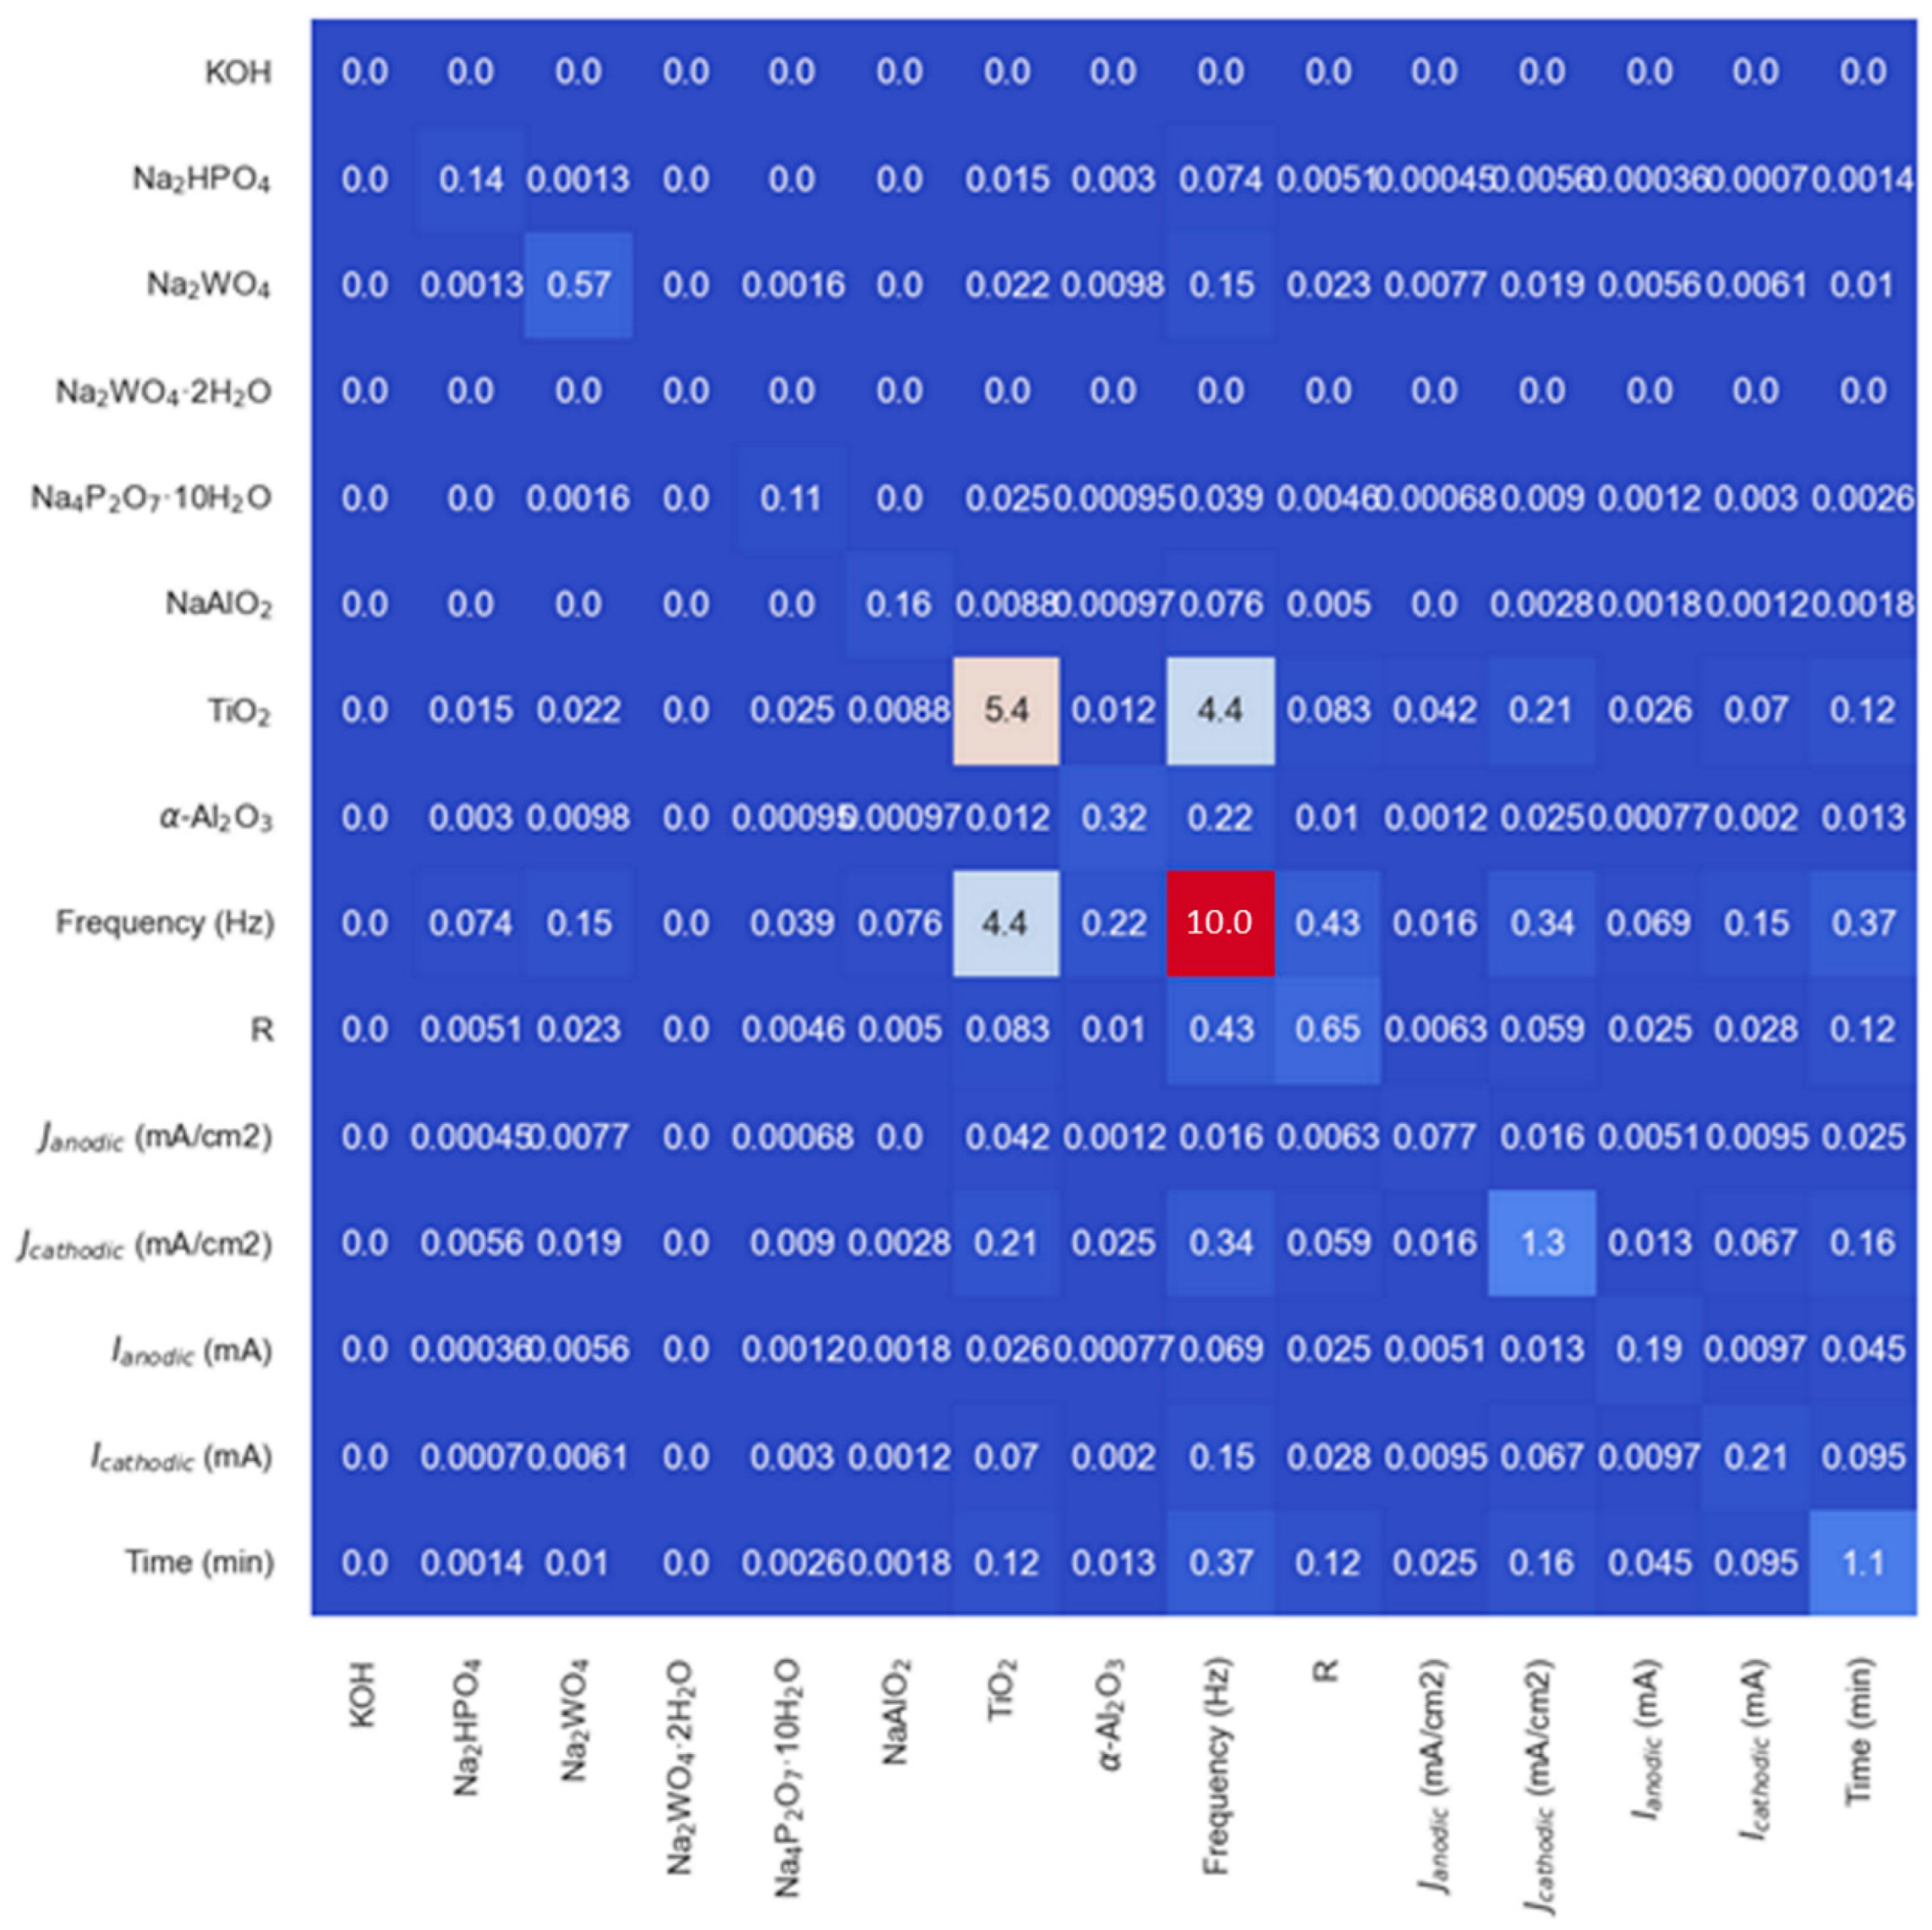
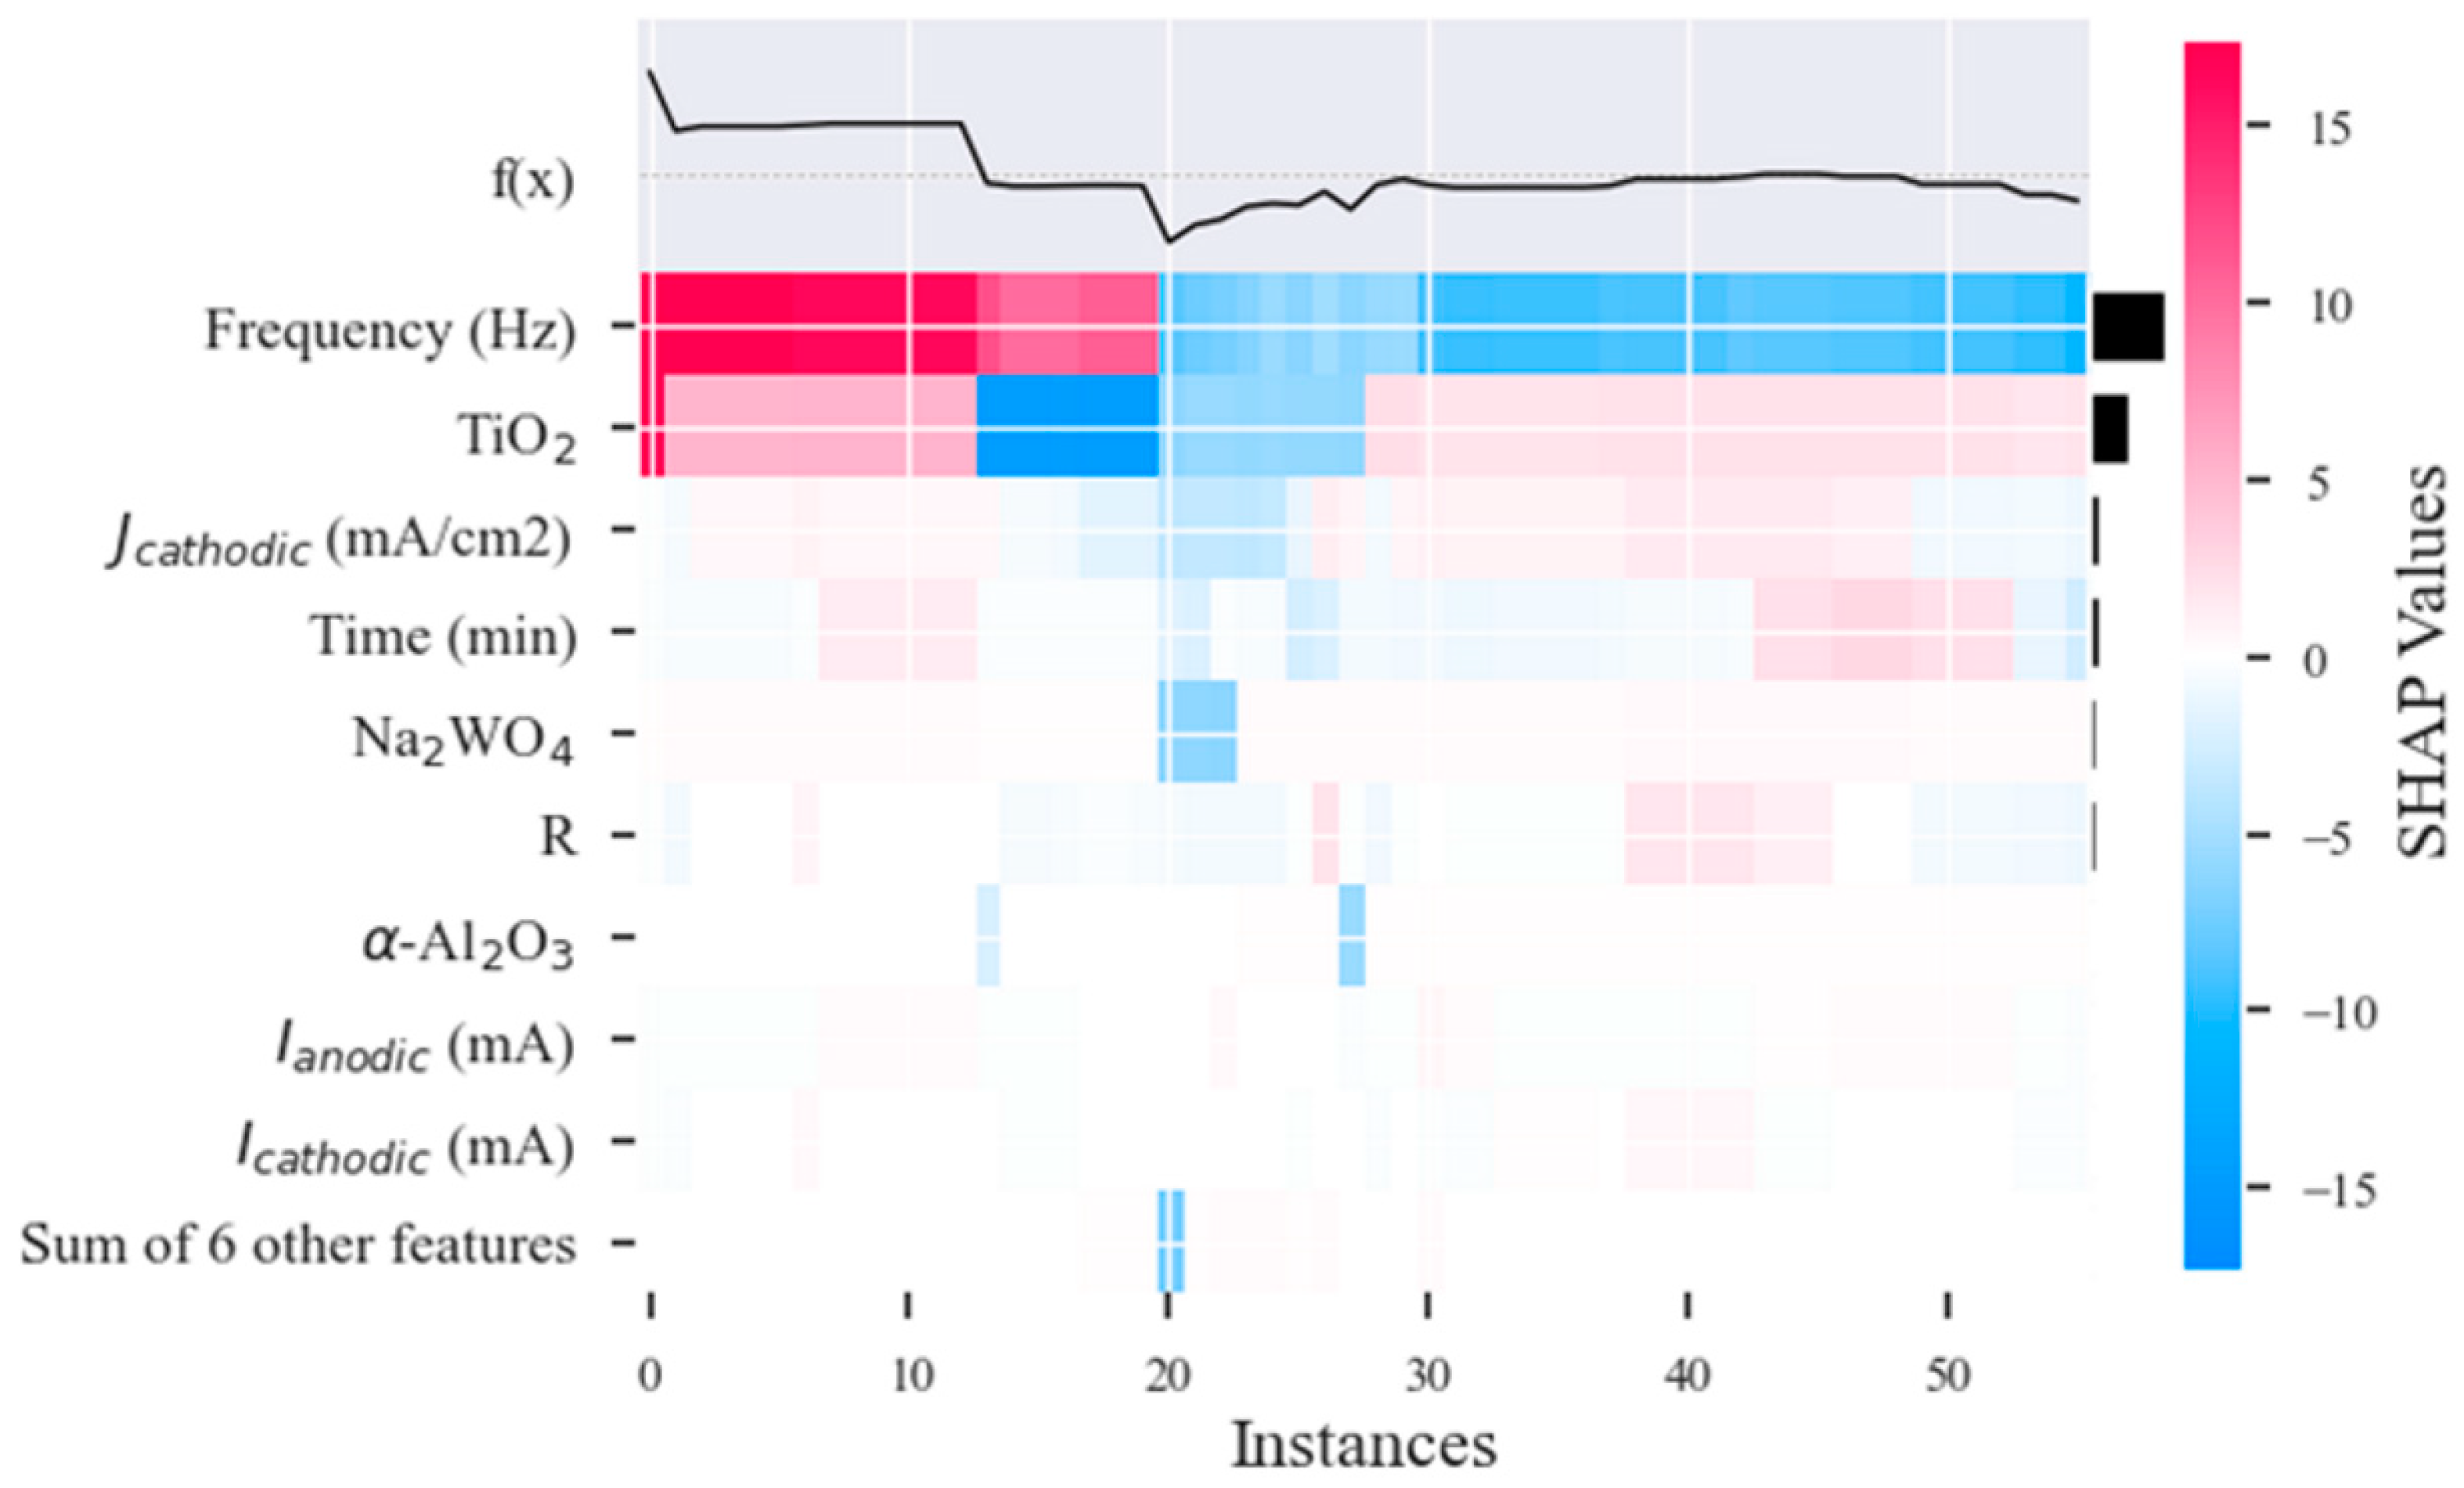
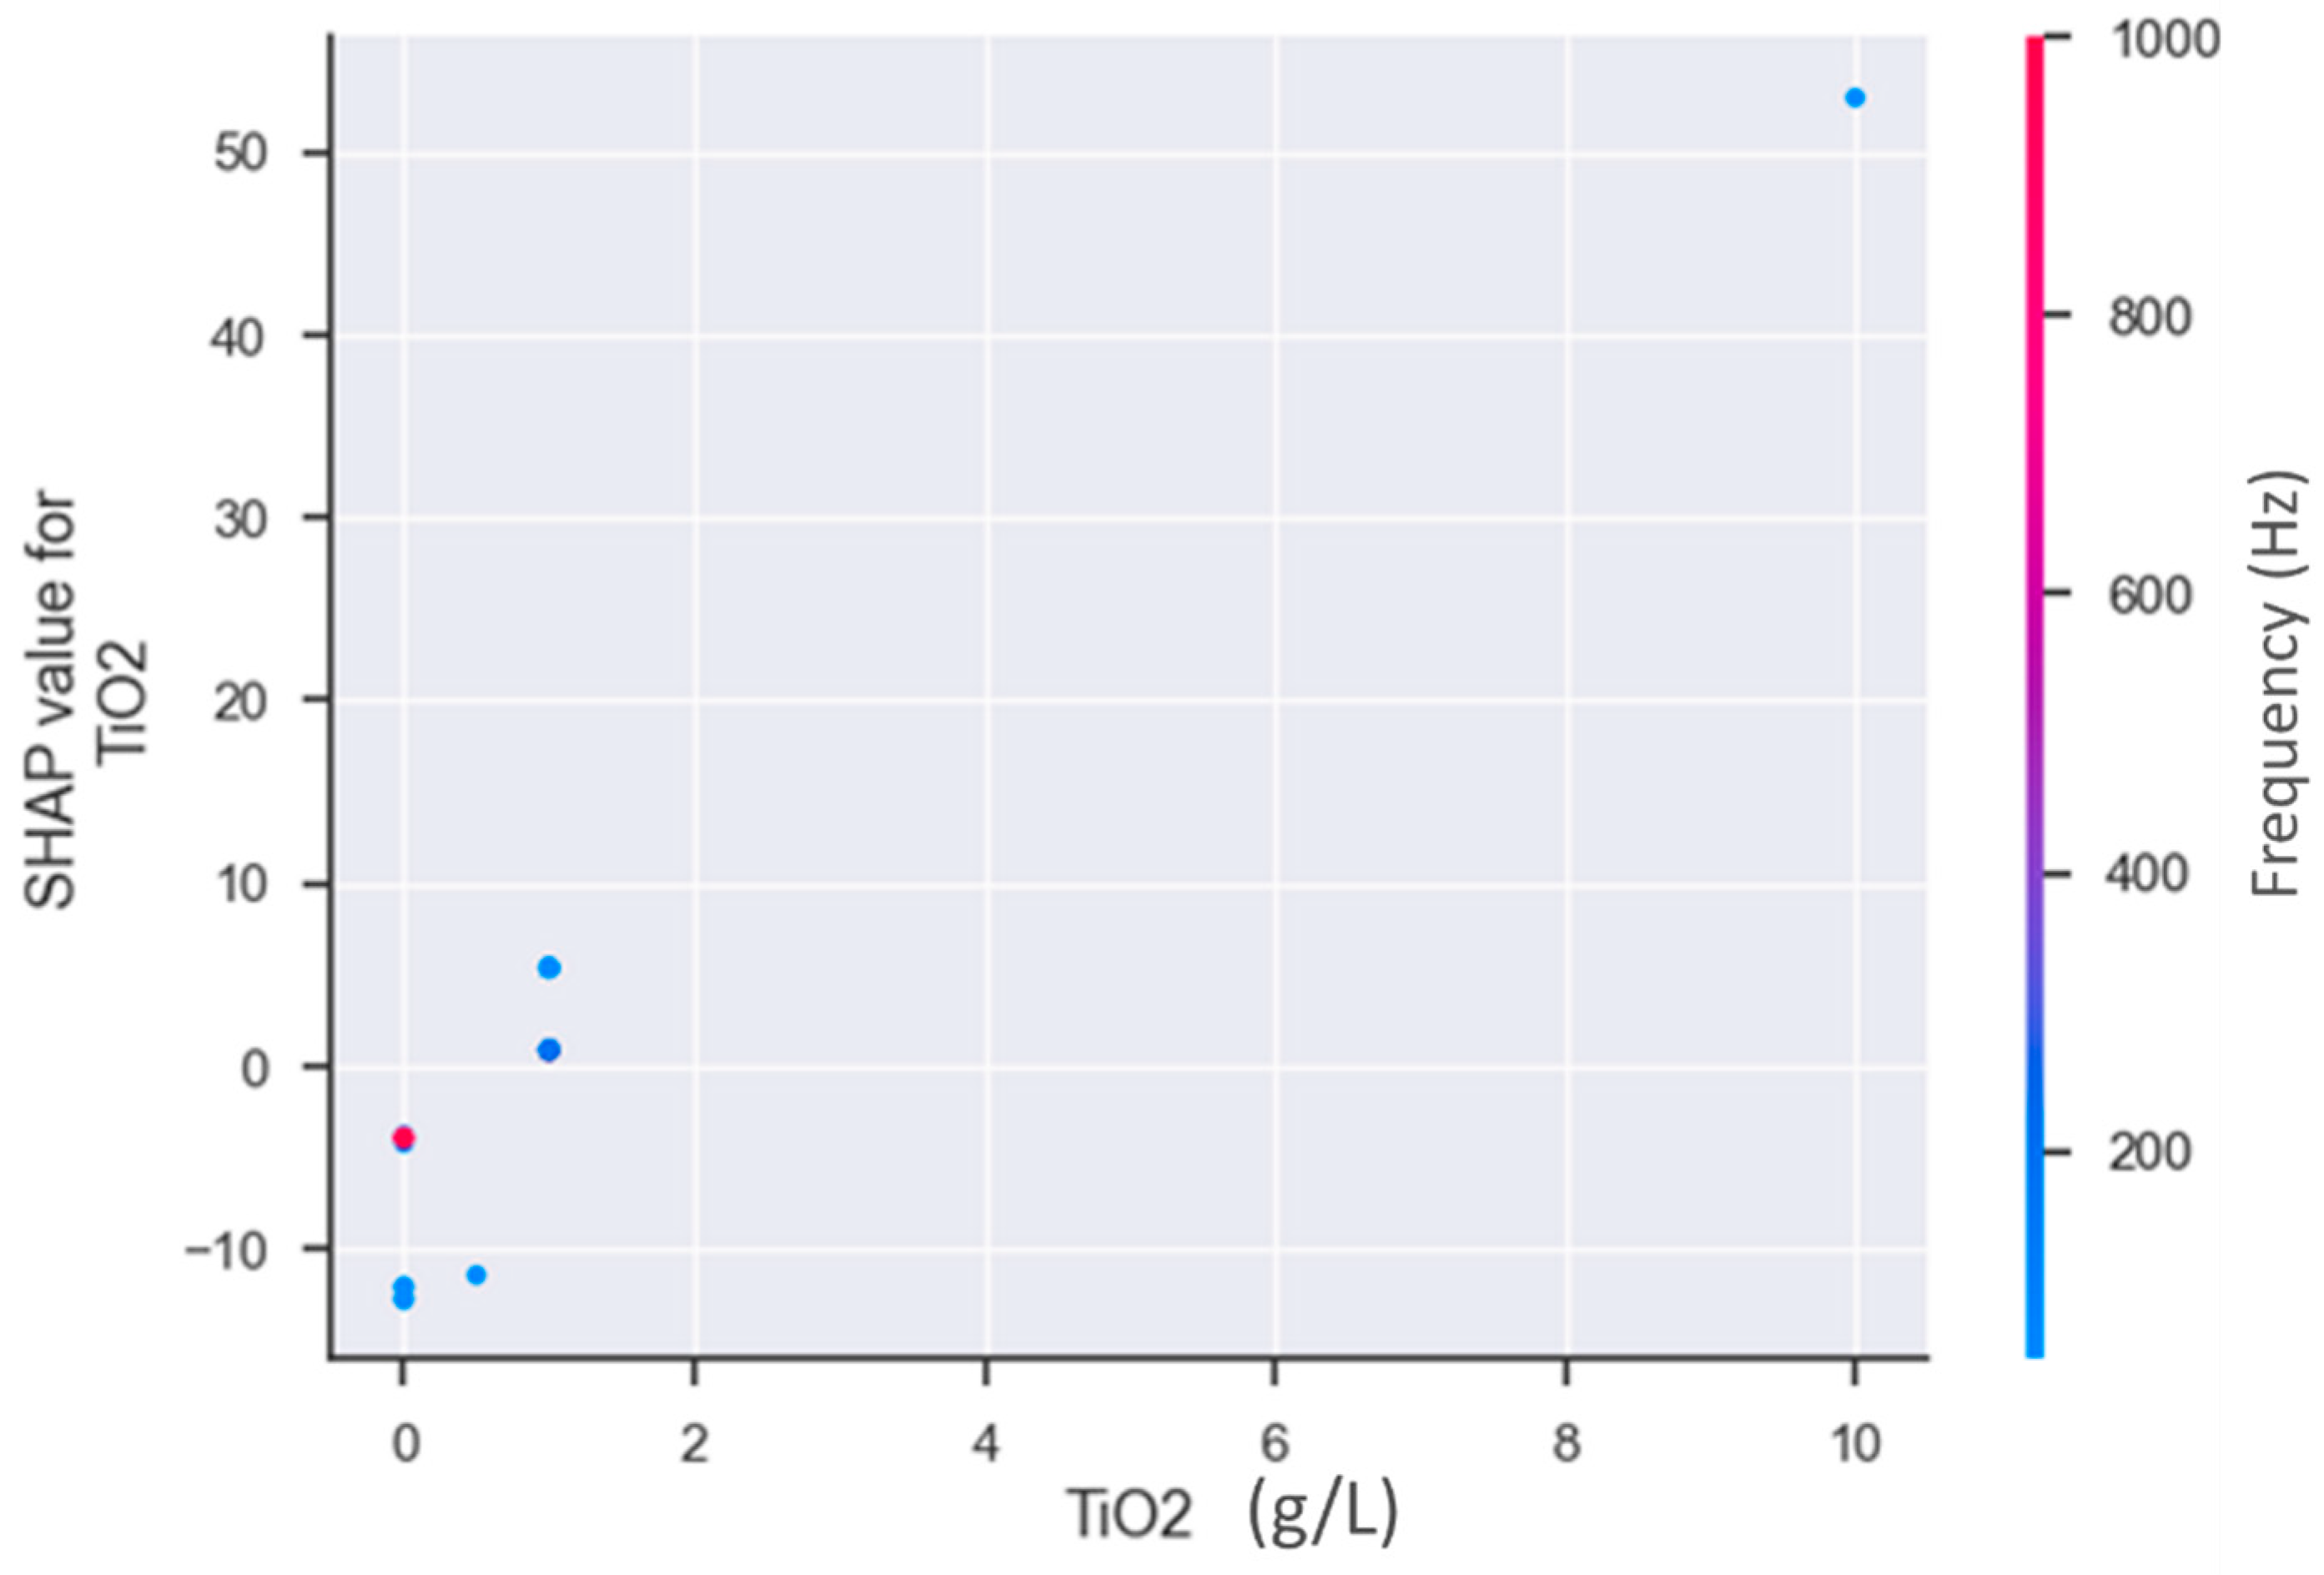
3.2. Data-Driven Optimization of PEO Processes Assisted by AI Methods
4. Conclusions
Author Contributions
Funding
Institutional Review Board Statement
Informed Consent Statement
Data Availability Statement
Conflicts of Interest
References
- Kaseem, M.; Fatimah, S.; Nashrah, N.; Ko, Y.G. Recent Progress in Surface Modification of Metals Coated by Plasma Electrolytic Oxidation: Principle, Structure, and Performance. Prog. Mater. Sci. 2021, 117, 100735. [Google Scholar] [CrossRef]
- Fernández-López, P.; Alves, S.A.; López-Ortega, A.; San José-Lombera, J.T.; Bayón, R. High Performance Tribological Coatings on a Secondary Cast Al–Si Alloy Generated by Plasma Electrolytic Oxidation. Ceram. Int. 2021, 47, 31238–31250. [Google Scholar] [CrossRef]
- Cheng, Y.; Cao, J.; Mao, M.; Peng, Z.; Skeldon, P.; Thompson, G.E. High Growth Rate, Wear Resistant Coatings on an Al–Cu–Li Alloy by Plasma Electrolytic Oxidation in Concentrated Aluminate Electrolytes. Surf. Coat. Technol. 2015, 269, 74–82. [Google Scholar] [CrossRef]
- Fernández-López, P.; Alves, S.A.; Azpitarte, I.; San-José, J.T.; Bayón, R. Corrosion and Tribocorrosion Protection of Novel PEO Coatings on a Secondary Cast Al-Si Alloy: Influence of Polishing and Sol-Gel Sealing. Corros. Sci. 2022, 207, 110548. [Google Scholar] [CrossRef]
- Lu, X.; Mohedano, M.; Blawert, C.; Matykina, E.; Arrabal, R.; Kainer, K.U.; Zheludkevich, M.L. Plasma Electrolytic Oxidation Coatings with Particle Additions—A Review. Surf. Coat. Technol. 2016, 307, 1165–1182. [Google Scholar] [CrossRef]
- Dehnavi, V.; Luan, B.L.; Shoesmith, D.W.; Liu, X.Y.; Rohani, S. Effect of Duty Cycle and Applied Current Frequency on Plasma Electrolytic Oxidation (PEO) Coating Growth Behavior. Surf. Coat. Technol. 2013, 226, 100–107. [Google Scholar] [CrossRef]
- Sikdar, S.; Menezes, P.V.; Maccione, R.; Jacob, T.; Menezes, P.L. Plasma Electrolytic Oxidation (Peo) Process—Processing, Properties, and Applications. Nanomaterials 2021, 11, 1375. [Google Scholar] [CrossRef] [PubMed]
- Martin, J.; Melhem, A.; Shchedrina, I.; Duchanoy, T.; Nominé, A.; Henrion, G.; Czerwiec, T.; Belmonte, T. Effects of Electrical Parameters on Plasma Electrolytic Oxidation of Aluminium. Surf. Coat. Technol. 2013, 221, 70–76. [Google Scholar] [CrossRef]
- Mohedano, M.; Lopez, E.; Mingo, B.; Moon, S.; Matykina, E.; Arrabal, R. Energy Consumption, Wear and Corrosion of PEO Coatings on Preanodized Al Alloy: The Influence of Current and Frequency. J. Mater. Res. Technol. 2022, 21, 2061–2075. [Google Scholar] [CrossRef]
- Matykina, E.; Arrabal, R.; Skeldon, P.; Thompson, G.E. Optimisation of the Plasma Electrolytic Oxidation Process Efficiency on Aluminium. Surf. Interface Anal. 2010, 42, 221–226. [Google Scholar] [CrossRef]
- Zhang, X.M.; Tian, X.B.; Yang, S.Q.; Gong, C.Z.; Fu, R.K.Y.; Chu, P.K. Low Energy-Consumption Plasma Electrolytic Oxidation Based on Grid Cathode. Rev. Sci. Instrum. 2010, 81, 103504. [Google Scholar] [CrossRef] [PubMed]
- Ntomprougkidis, V.; Martin, J.; Nominé, A.; Henrion, G. Sequential Run of the PEO Process with Various Pulsed Bipolar Current Waveforms. Surf. Coat. Technol. 2019, 374, 713–724. [Google Scholar] [CrossRef]
- Nominé, A.; Nominé, A.V.; Braithwaite, N.S.J.; Belmonte, T.; Henrion, G. High-Frequency-Induced Cathodic Breakdown during Plasma Electrolytic Oxidation. Phys. Rev. Appl. 2017, 8, 031001. [Google Scholar] [CrossRef]
- Rogov, A.B.; Yerokhin, A.; Matthews, A. The Role of Cathodic Current in Plasma Electrolytic Oxidation of Aluminum: Phenomenological Concepts of the “Soft Sparking” Mode. Langmuir 2017, 33, 11059–11069. [Google Scholar] [CrossRef] [PubMed]
- Rogov, A.B.; Huang, Y.; Shore, D.; Matthews, A.; Yerokhin, A. Toward Rational Design of Ceramic Coatings Generated on Valve Metals by Plasma Electrolytic Oxidation: The Role of Cathodic Polarisation. Ceram. Int. 2021, 47, 34137–34158. [Google Scholar] [CrossRef]
- Geebarowski, W.; Pietrzyk, S. Influence of the Cathodic Pulse on the Formation and Morphology of Oxide Coatings on Aluminium Produced by Plasma Electrolytic Oxidation. Arch. Metall. Mater. 2013, 58, 241–245. [Google Scholar] [CrossRef]
- Godja, N.; Hansal, W.E.G.; Mann, R.; Kleber, C.; Hansal, S. Pulsed Plasma Electrolytic Oxidation Processes for Aeronautical Applications and Their Technical Application. Trans. IMF 2013, 91, 321–329. [Google Scholar] [CrossRef]
- Tagirova, K.; Aubakirova, V.; Vulfin, A. Neural Network Control System for the Process of Plasma Electrolytic Oxidation. In Advances in Automation V—RusAutoCon 2023; Lecture Notes in Electrical Engineering; Springer: Cham, Switzerland, 2024; Volume 1130, pp. 321–333. [Google Scholar] [CrossRef]
- Finke, A.; Escobar, J.; Munoz, J.; Petit, M. Prediction of Salt Spray Test Results of Micro Arc Oxidation Coatings on AA2024 Alloys by Combination of Accelerated Electrochemical Test and Artificial Neural Network. Surf. Coat. Technol. 2021, 421, 127370. [Google Scholar] [CrossRef]
- Rodriguez, L.; Paris, J.Y.; Denape, J.; Delbé, K. Micro-Arcs Oxidation Layer Formation on Aluminium and Coatings Tribological Properties—A Review. Coatings 2023, 13, 373. [Google Scholar] [CrossRef]
- Varol, T.; Canakci, A.; Ozsahin, S.; Erdemir, F.; Ozkaya, S. Artificial Neural Network-Based Prediction Technique for Coating Thickness in Fe-Al Coatings Fabricated by Mechanical Milling. Part. Sci. Technol. 2018, 36, 742–750. [Google Scholar] [CrossRef]
- Baptista, M.; Mishra, M.; Henriques, E.; Prendinger, H. Using Explainable Artificial Intelligence to Interpret Remaining Useful Life Estimation with Gated Recurrent Unit. Preprint 2021, 5–7. [Google Scholar] [CrossRef]
- Hart, S. Shapley Value. In Game Theory; Eatwell, J., Milgate, M., Newman, P., Eds.; The New, Palgrave; Pal-grave Macmillan: London, UK, 1989. [Google Scholar] [CrossRef]
- Tsai, D.S.; Chou, C.C. Review of the Soft Sparking Issues in Plasma Electrolytic Oxidation. Metals 2018, 8, 105. [Google Scholar] [CrossRef]
- Cheng, Y.; Teng, F.; Cheng, Y. A Systematic Study of the Role of Cathodic Polarization and New Findings on the Soft Sparking Phenomenon from Plasma Electrolytic Oxidation of an Al-Cu-Li Alloy. J. Electrochem. Soc. 2022, 169, 071505. [Google Scholar] [CrossRef]
- Gȩbarowski, W.; Pietrzyk, S. Growth Characteristics of the Oxide Layer on Aluminium in the Process of Plasma Electrolytic Oxidation. Arch. Metall. Mater. 2014, 59, 407–411. [Google Scholar] [CrossRef]
- Martin, J.; Nominé, A.; Brochard, F.; Briançon, J.L.; Noël, C.; Belmonte, T.; Czerwiec, T.; Henrion, G. Delay in Micro-Discharges Appearance during PEO of Al: Evidence of a Mechanism of Charge Accumulation at the Electrolyte/Oxide Interface. Appl. Surf. Sci. 2017, 410, 29–41. [Google Scholar] [CrossRef]
- Hakimizad, A.; Raeissi, K.; Golozar, M.A.; Lu, X.; Blawert, C.; Zheludkevich, M.L. Influence of Cathodic Duty Cycle on the Properties of Tungsten Containing Al2O3/TiO2 PEO Nano-Composite Coatings. Surf. Coat. Technol. 2018, 340, 210–221. [Google Scholar] [CrossRef]
- Troughton, S.C.; Clyne, T.W. Cathodic Discharges during High Frequency Plasma Electrolytic Oxidation. Surf. Coat. Technol. 2018, 352, 591–599. [Google Scholar] [CrossRef]
- Toulabifard, A.; Rahmati, M.; Raeissi, K.; Hakimizad, A.; Santamaria, M. The Effect of Electrolytic Solution Composition on the Structure, Corrosion, and Wear Resistance of PEO Coatings on AZ31 Magnesium Alloy. Coatings 2020, 10, 937. [Google Scholar] [CrossRef]
- Ceriani, F.; Casanova, L.; Massimini, L.; Brenna, A.; Ormellese, M. TiO2 Microparticles Incorporation in Coatings Produced by Plasma Electrolytic Oxidation (PEO) on Titanium. Coatings 2023, 13, 1718. [Google Scholar] [CrossRef]
- Aljohani, T.; Aljadaan, S.; Rubayan, M.; Khoshnaw, F. Impact of Processing Parameters in Plasma Electrolytic Oxidation on Corrosion Resistance of Magnesium Alloy Type AZ91. Eng. Rep. 2021, 4, e12459. [Google Scholar] [CrossRef]
- Lv, G.; Chen, H.; Gu, W.; Li, L.; Niu, E. Effects of Current Frequency on the Structural Characteristics and Corrosion Property of Ceramic Coatings Formed on Magnesium Alloy by PEO Technology. J. Mater. Process. Technol. 2008, 8, 9–13. [Google Scholar] [CrossRef]
- Bala Srinivasan, P.; Liang, J.; Balajeee, R.G.; Blawert, C.; Störmer, M.; Dietzel, W. Effect of Pulse Frequency on the Microstructure, Phase Composition and Corrosion Performance of a Phosphate-Based Plasma Electrolytic Oxidation Coated AM50 Magnesium Alloy. Appl. Surf. Sci. 2010, 256, 3928–3935. [Google Scholar] [CrossRef]


| Variable | Description | Units |
|---|---|---|
| Electrolyte composition | Sum of electrolyte composition elements (e.g.: “10 g/L NaAlO2 + 10 g/L Na2HPO4”) | g·L−1 |
| Frequency | Pulse frequencies applied during the processes (i.e., 1000; 500; 200; 100; 50 Hz) | Hz |
| Janodic | Anodic (+) current densities applied during the processes (i.e., 213; 175; 137.5; and 125 mA·cm−2) | mA·cm−2 |
| Jcathodic | Cathodic (−) current densities applied during the processes (i.e., 100; 125; 137.5; 140; 150; 175; 210; 227.5; 245; and 255.6 mA·cm−2) | mA·cm−2 |
| R | Relation between the cathodic and anodic current densities: R = Jc/Ja (i.e., 0.8; 1.0; 1.2; 1.3; 1.4) | - |
| Ianodic | Anodic (+) currents applied during the processes (i.e., 1885; 2639; 2862.5; 3148.75; 3212 mA) | mA |
| Icathodic | Cathodic (−) currents applied during the processes (i.e., 1508; 1885; 2111.2; 2262; 2290; 2639; 2862.5; 3148.7; 3166.8; 3430.7;3435; 3694.6; 3854.5 mA) | mA |
| Time | Duration of the PEO processes (i.e., 20; 30; 36; 40; 45 min) | min |
| Area | Total coated areas (i.e., 15.08; 22.90 cm2) | cm2 |
| Duration of the initial ramp of potential | Duration of the initial ramp of potential applied at the beginning of the processes (V+ = 300 V and V− = 50 V) (i.e., 15; 30 s) | s |
| Thickness | Coating layer thickness—this is the ML model output | µm |
| Model | RMSE | R2 |
|---|---|---|
| Random forest “without electrolyte” | 9.27 | 0.74 |
| Random forest “with electrolyte” | 7.54 | 0.83 |
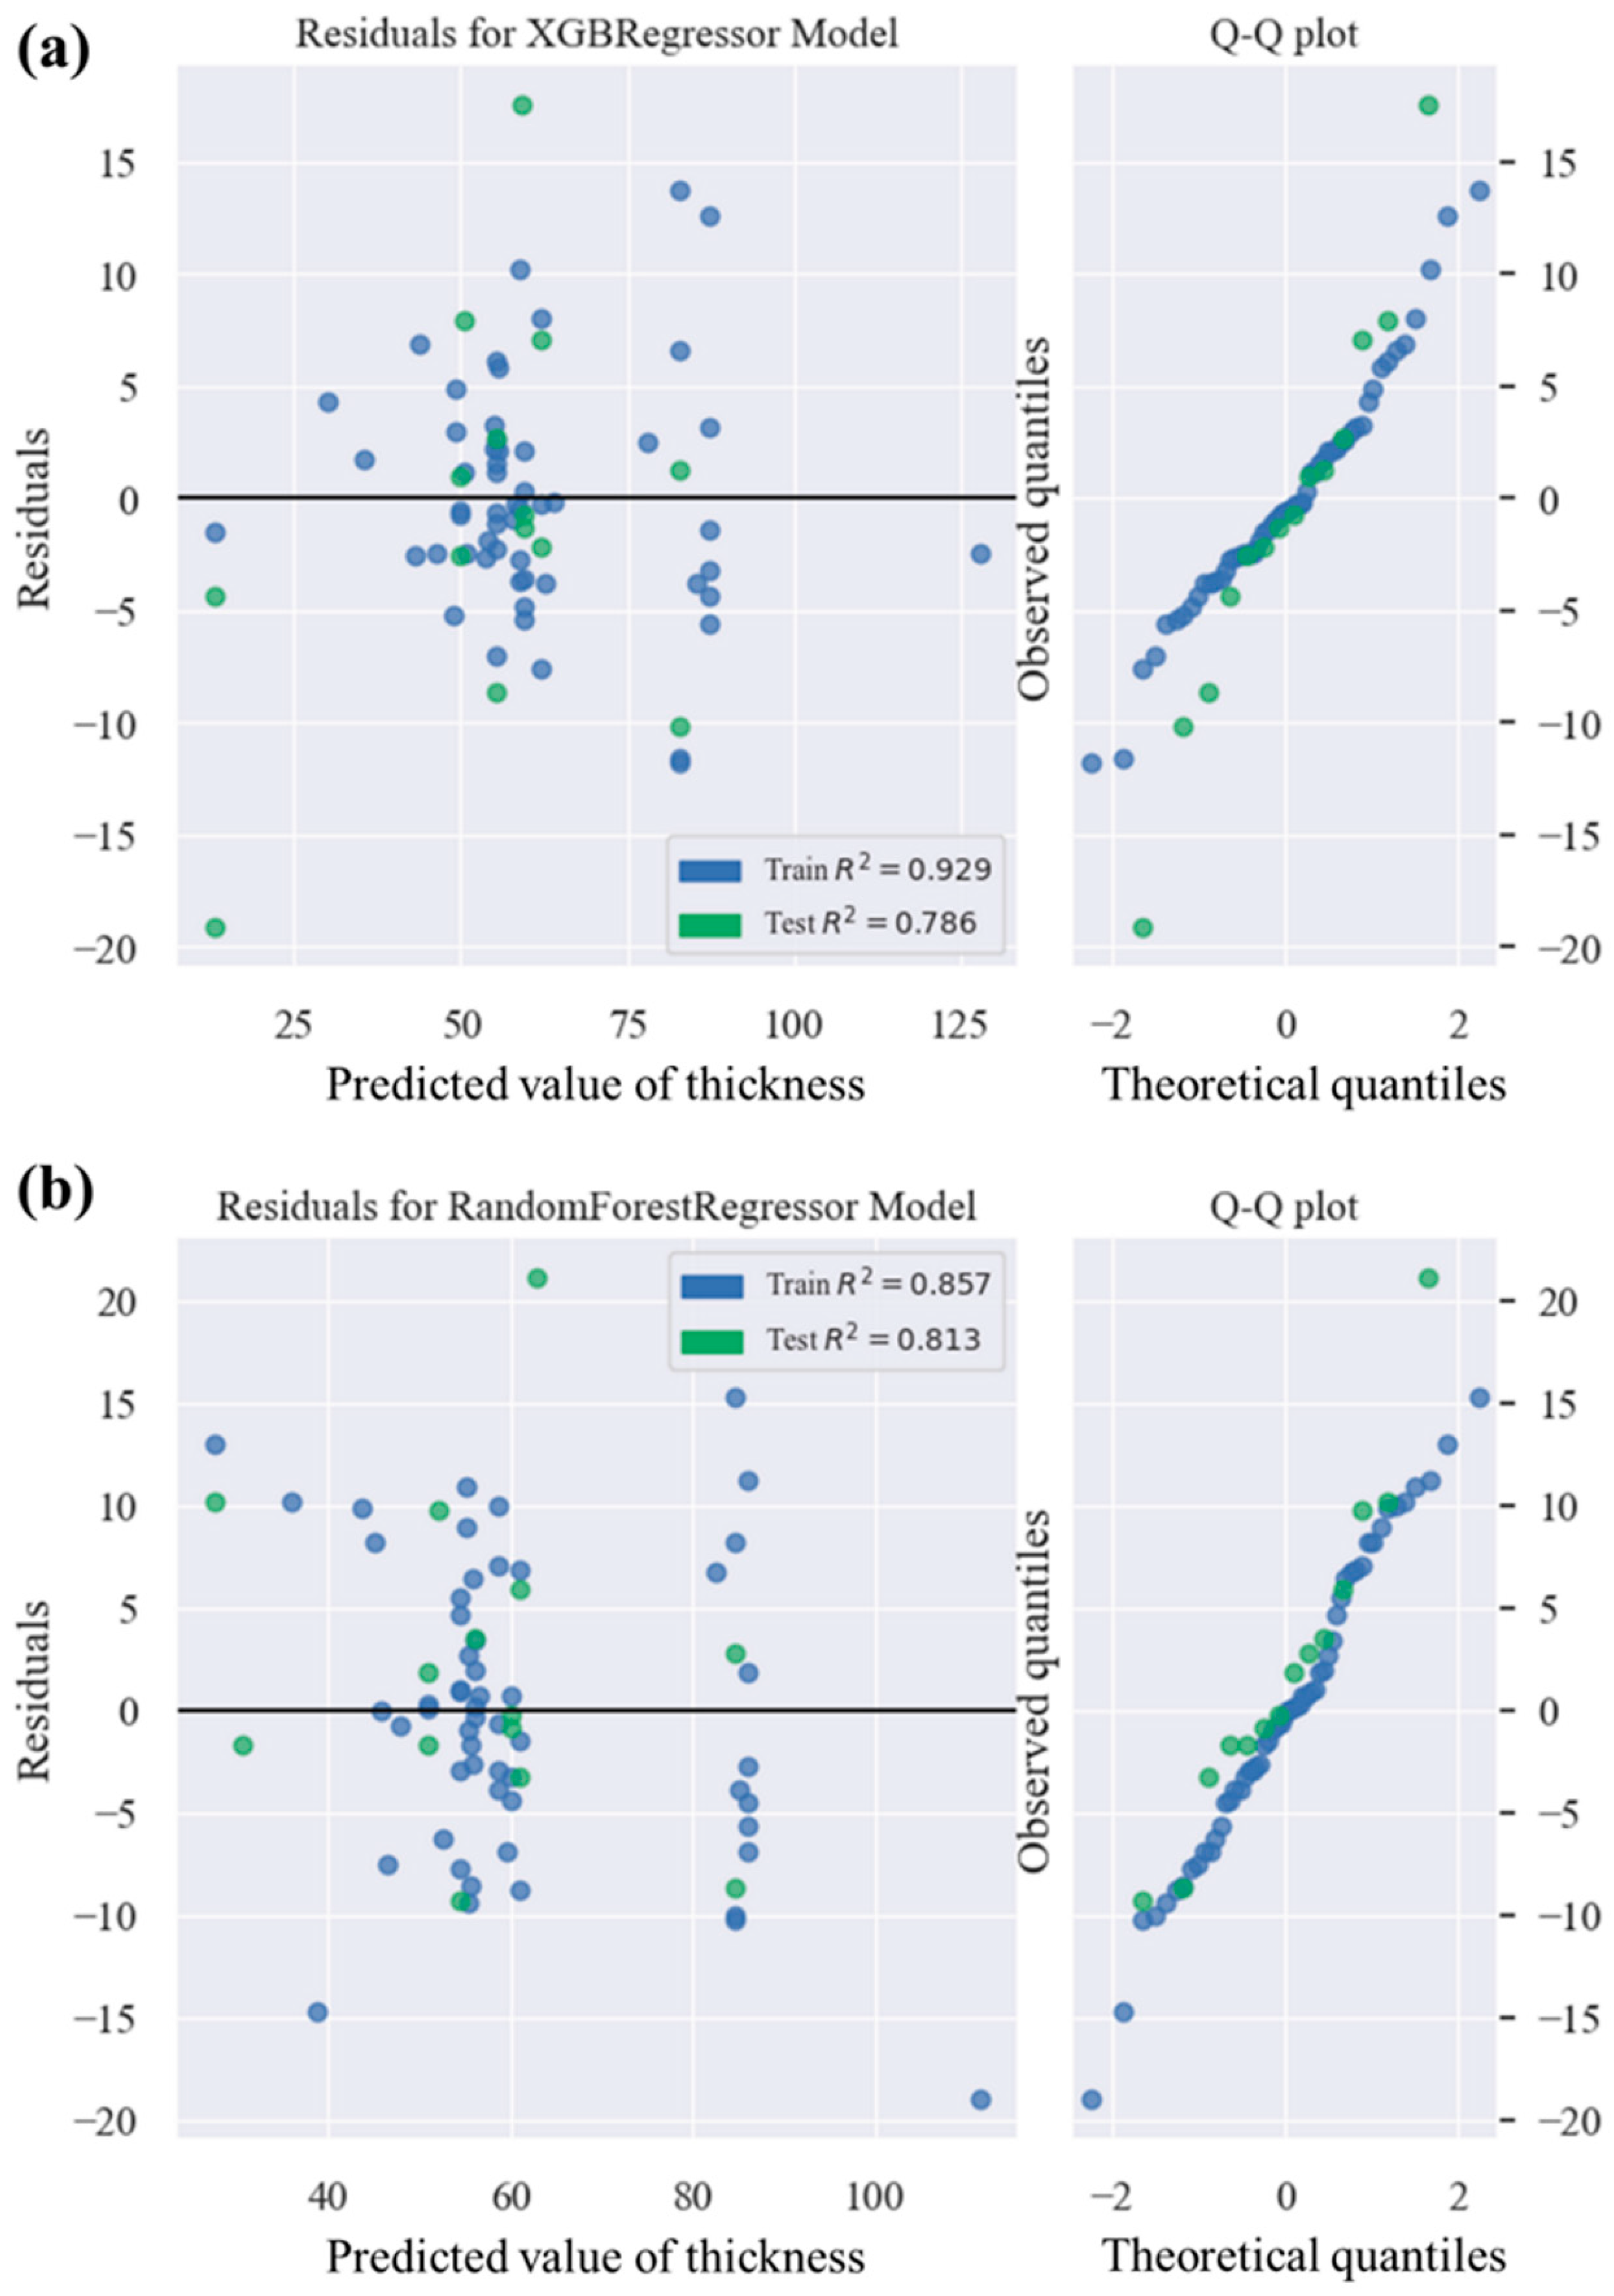
| Model | RMSE | R2 |
|---|---|---|
| XGBoost “default” | 11.42 | 0.44 |
| XGBoost “optimized” | 8.48 | 0.81 |
| Random forest “default” | 12.07 | 0.37 |
| Random forest “optimized” | 7.93 | 0.81 |
Disclaimer/Publisher’s Note: The statements, opinions and data contained in all publications are solely those of the individual author(s) and contributor(s) and not of MDPI and/or the editor(s). MDPI and/or the editor(s) disclaim responsibility for any injury to people or property resulting from any ideas, methods, instructions or products referred to in the content. |
© 2024 by the authors. Licensee MDPI, Basel, Switzerland. This article is an open access article distributed under the terms and conditions of the Creative Commons Attribution (CC BY) license (https://creativecommons.org/licenses/by/4.0/).
Share and Cite
Fernández-López, P.; Alves, S.A.; Rogov, A.; Yerokhin, A.; Quintana, I.; Duo, A.; Aguirre-Ortuzar, A. Data-Driven Optimization of Plasma Electrolytic Oxidation (PEO) Coatings with Explainable Artificial Intelligence Insights. Coatings 2024, 14, 979. https://doi.org/10.3390/coatings14080979
Fernández-López P, Alves SA, Rogov A, Yerokhin A, Quintana I, Duo A, Aguirre-Ortuzar A. Data-Driven Optimization of Plasma Electrolytic Oxidation (PEO) Coatings with Explainable Artificial Intelligence Insights. Coatings. 2024; 14(8):979. https://doi.org/10.3390/coatings14080979
Chicago/Turabian StyleFernández-López, Patricia, Sofia A. Alves, Aleksey Rogov, Aleksey Yerokhin, Iban Quintana, Aitor Duo, and Aitor Aguirre-Ortuzar. 2024. "Data-Driven Optimization of Plasma Electrolytic Oxidation (PEO) Coatings with Explainable Artificial Intelligence Insights" Coatings 14, no. 8: 979. https://doi.org/10.3390/coatings14080979
APA StyleFernández-López, P., Alves, S. A., Rogov, A., Yerokhin, A., Quintana, I., Duo, A., & Aguirre-Ortuzar, A. (2024). Data-Driven Optimization of Plasma Electrolytic Oxidation (PEO) Coatings with Explainable Artificial Intelligence Insights. Coatings, 14(8), 979. https://doi.org/10.3390/coatings14080979