Article

Optimisation of the Encapsulation of Grape Pomace Extract by Spray Drying Using Goat Whey Protein as a Coating Material

Faculty of Food Technology Osijek, Josip Juraj Strossmayer University of Osijek, F. Kuhača 18, HR-31 000 Osijek, Croatia
*
Author to whom correspondence should be addressed.
Coatings 2024, 14(9), 1101; https://doi.org/10.3390/coatings14091101
Submission received: 4 July 2024 / Revised: 11 August 2024 / Accepted: 23 August 2024 / Published: 1 September 2024
(This article belongs to the Special Issue Novel Advances in Food Contact Materials)

Abstract

:
The aim of this research was to determine the optimal conditions for the process of the microencapsulation of phenol-rich grape pomace extract (GPE) using spray drying and goat whey protein (GW) as a coating. The encapsulation was carried out with the aim of protecting the original bioactive components extracted from grape pomace to ensure their stability and protection from external agents, as well as antioxidant activity, during the conversion of the liquid extract into powder and during storage. Using the response surface methodology, an inlet air temperature of 173.5 °C, a GW ratio of 2.5 and a flow rate of 7 mL/min were determined as optimum process parameters. Under these conditions, a high yield (85.2%) and encapsulation efficiency (95.5%) were achieved with a satisfactorily low moisture content in the product (<5%). The amount of coating had the greatest influence on the MC properties. GW showed a more pronounced stabilising effect on the phenolic compounds in GPE during a longer storage period compared to anthocyanins. The results obtained indicate the potential of GW as a coating and are an example of the possible upcycling of GPE and GW, which can lead to a high-quality product that can be a functional ingredient.

1. Introduction

The solid by-product of processing grapes into wine and other related products is grape pomace. This material consists of skins, seeds, stalks and the remaining pulp. It is rich in bioactive elements whose beneficial effects on human and animal health are of increasing scientific interest, including polyphenols, dietary fibre, single-cell proteins and volatile organic compounds. If this by-product is disposed of without further processing, it leads to a number of environmental problems, pollution and financial losses. The potential to create value-added products and reduce waste in the wine industry has focussed much attention on adding value to grape by-products, particularly pomace (the solid remains of grapes after pressing them into juice or wine). Numerous techniques for processing and transforming the various by-products of the wine industry can be used to produce products such as pharmaceuticals, natural colourants, biogas, bioethanol, animal feed, nutraceuticals and functional foods. It is important to emphasise that grape pomace contains a high concentration of fibre and phenolic compounds. Combined with a variety of processing and transformation techniques, this adds value to the product and gives it properties such as antioxidant, antiproliferative, cardioprotective and similar effects [1]. The extraction of phenolic substances from grapes and encapsulation of the obtained extract by spray drying is one of the potential ways for upcycling this by-product [2,3,4,5,6]. There are numerous encapsulation methods, such as coacervation, freeze drying, spray chilling, ion gelation or extrusion [7]. Each of the above encapsulation methods aims to protect the bioactive component from harmful external influences such as high temperature, pH, pressure and the like. In addition, they also enable controlled release at the desired location and time, as well as prolonging and maintaining stability [8]. Each of the mentioned methods has its own advantages and disadvantages, and we have chosen the spray drying method. Spray drying is characterised by its scalability, cost efficiency, fast processing and versatility in producing fine, uniform particles. It is particularly advantageous for the encapsulation of heat-sensitive materials and offers improved stability and controlled release properties [9]. While other encapsulation methods offer specific advantages for certain applications, spray drying is often favoured for industrial-scale encapsulation due to its balance of efficiency, cost and product quality [10]. In addition to optimal spray drying conditions, the selection of a suitable coating material is essential to make this process as successful and loss-free as possible [11]. A perfect coating material should be tasteless, colourless, odourless, inexpensive, readily available, stable, non-toxic and non-reactive with other feed ingredients [12]. In addition, a variety of properties of the encapsulated particles produced, including geometrical parameters, surface morphology and texture, are influenced by the coatings used during the encapsulation process. These properties also influence the in vitro release behaviour of the encapsulated compounds. Encapsulated bioactive compounds should be released from the prepared particles under controlled conditions, i.e., at the desired location where the biological properties of the compounds can be recognised [8].
Whey and whey proteins are by-products discounted by industry and are considered “alternative green” coatings or “green biopolymers” used as wall materials in encapsulation processes. The term “alternative green” refers to the origin of these biopolymers, which are derived from by-products and waste, mostly from the food industry, and thus represent a sustainable alternative to conventionally used coatings such as maltodextrin and gum arabic. Whey proteins in particular are protein-type coatings of animal origin that are obtained from the by-products of the dairy industry. Due to their relatively low price, easy availability and numerous positive properties, whey-based coatings are increasingly used in encapsulation processes. They can be used alone or in combination with other coatings, typically of the carbohydrate type [13,14].
Whey is a yellow-green liquid that is left behind during the production of cheese or casein [15,16]. It can be produced from different milks such as camel [17], goat [18], sheep [19], buffalo [20], donkey [21,22] or cow [23,24]. Macwan et al. [25] estimated that about 157 million tonnes of cheese whey is produced worldwide, which accounts for about 95% of the total whey produced during milk processing in general. In their report, Buchanan et al. [26] estimate that the amount of whey produced as a by-product could increase to 203–241 million tonnes per year worldwide by 2030 if the trend of annual increases in cheese production of 1%–2% is maintained. This figure may be even higher if the whey produced in the manufacture of other dairy products, such as Greek yoghurt, is included. The properties of whey depend on the type of milk (goat, cow, sheep, buffalo, donkey or camel) used, and within the same species it can vary according to the breed, diet and general health of the animal, as well as the degree of lactation [27]. Just like grape pomace, liquid whey is also considered a major pollutant, an ecological and economic problem if it is exposed to the environment untreated. To address this issue, various techniques have been employed to process whey into value-added products such as probiotics, hydrogen, methane, electricity, whey protein, whey powder and whey permeate [28].
Whey proteins are widely used in encapsulation processes like spray drying because of their beneficial properties, which include a high solubility in water, strong interaction with polyphenols, aggregation properties, and a GRAS (generally recognised as safe) classification [29]. Additionally, whey protein isolate coating is transparent, odourless and tasteless, with desirable barrier properties to oxygen and lipids [30]. Whey proteins are used during spray drying as coating materials for the purpose of protecting polyphenols [31,32], volatile components [33], oils and fats [34]. Whey proteins and polyphenols interact both covalently and non-covalently to form conjugates [35]. Several studies have documented the potential benefits and uses of whey protein and polyphenol conjugates in enhancing the functional and technological characteristics of bioactive substances like proteins [35,36].
According to the data available in the FAOSTAT online database [37], buffalo and cow’s milk are the most produced and processed milks in the world. In 2021, only 2.1% of the total milk produced was goat’s milk, and only 1.8% of the total cheese produced was goat’s cheese. It is therefore logical that buffalo/cow milk and dairy products are mainly the subject of scientific research, while research dealing with other types of milk and dairy products is very rare. Goat whey is generally not fully utilised as a coating material in the encapsulation process. In this paper, we emphasise the novelty of utilising goat whey in encapsulation processes. Goat whey differs from whey obtained from other milk sources in several important aspects that can affect its effectiveness and application. Some of these aspects are a lower content of beta-lactoglobulin compared to cow’s whey, resulting in easier digestibility and a lower allergic potential, and a higher content of alpha-lactalbumin, which provides a broader amino acid profile. It contains more medium-chain fatty acids, which makes it easier to digest and can improve the release and absorption of encapsulated bioactive compounds. It contains higher concentrations of calcium and phosphorus and lower amounts of lactose, making it more suitable for people with lactose intolerance [38,39]. Goat whey proteins are more digestible and have a higher bioavailability, which may increase the nutritional benefit of the encapsulated nutrients [40]. The differences in immunoglobulins and growth factors, with antimicrobial activity and no toxicity [41], may provide additional health benefits and make goat whey a better choice for functional foods. The unique protein and fat composition of goat whey may influence its behaviour in encapsulation processes, potentially improving the stability, release profile and overall performance of the encapsulated materials [39].
Therefore, the subject of this research was to investigate the possibility of using goat whey protein (GW) as a coating material for the encapsulation of grape pomace extract (GPE) by spray drying. The main objective of this work was to determine the optimal process parameters for the homogenisation of the mixture of core (GPE) and wall material (GW), as well as the conditions of spray drying itself. The influence of the process parameters on the properties of the resulting microcapsules (MCs) was also investigated.

2. Materials and Methods

2.1. Chemicals and Reagents

Goat whey protein (GW) in powder form with a protein content of 78.6% (Carrington Farms, Closter, NJ, USA) was used as a coating material. We bought methanol of HPLC grade and glacial acetic acid (99.5%) from Macron Fine Chemicals (Gliwice, Poland). The supplier of sodium carbonate (anhydrous, p.a.) was T.T.T. (Sveta Nedjelja, Croatia). The Folin–Ciocalteu phenol reagent was obtained from CPAchem (Bogomilovo, Bulgaria), while Lab Expert (Shenzhen, Guangdong, China) provided the 96% ethanol (p.a.). The standards for the UHPLC analysis of phenolic compounds were obtained from Sigma Aldrich (Saint Louis, MO, USA), Extrasynthese (Genay, France), Acros Organics (Geel, Belgium) and Applihem (Darmstadt, Germany). The chemicals used for simulated digestion (enzymes, bile extract) were obtained from Sigma Aldrich (Saint Louis, MO, USA). The salts used for the preparation of solutions and buffers were obtained from Acros Organics (Geel, Belgium), Gram Mol (Zagreb, Croatia) and Kemika (Zagreb, Croatia).

2.2. Grape Pomace

Grape pomace of the Cabernet Sauvignon variety (Vitis vinifera L.), which remained after the production of red wine, was supplied by the Erdut Winery (Erdut, Croatia, harvest 2017). The sample obtained consisted of the stalks, skin, seeds and remaining pulp. The grape pomace was air-dried in a thin layer at room temperature for one week, i.e., to a dry matter content of over 90%, and stored in a hermetically sealed container. Before extraction, a certain amount of the stored sample was removed from the hermetically sealed container and ground in an ultracentrifugal mill (Retsch ZM 200, Haan, Germany) to a particle size of ≤1 mm, and then a solid–liquid extraction was performed.

2.3. Grape Pomace Extract Preparation

A solid–liquid extraction method with 50% aqueous ethanol as solvent was used to prepare the GPE [8,42,43]. The extraction of phenolic compounds from grape pomace was carried out in a shaking water bath (Julabo SW-23, Seelbach, Germany) for two hours at 80 °C and 200 rpm and with a solid–liquid ratio of 1:4 (w/v). The samples were extracted and then centrifuged for 10 min at 11,000 rcf (Z 326 K, Hermle Labortechnik GmbH, Wehingen, Germany). After centrifugation, the supernatant was evaporated in a rotary evaporator (Büchi, R-210, Flawil, Germany) at 48 mbar and 50 °C to half the initial volume in order to reduce the ethanol content in the extract. A corresponding volume of redistilled water was used to replace the removed ethanol. In this way, a liquid, phenol-rich grape pomace extract was obtained, which was used to produce the encapsulation mixture for spray drying.

2.4. Optimisation of Spray Drying Conditions Using the Response Surface Methodology

In order to achieve optimal conditions for the encapsulation of GPE by the spray drying method with GW, the optimisation of the spray drying parameters was carried out. Based on the available research results of other authors in the field of encapsulation by spray drying, important process factors for spray drying were selected as independent variables, and the levels of the independent variables were determined based on the results of the preliminary studies.
A Box–Behnken experimental design with three repetitions in the centre (15 experimental runs) was selected for the design of the experiments and the optimisation of the homogenisation and spray drying process parameters, and the response surface method (RSM) with numerical optimisation was used to evaluate the influence of the independent variables of each response, e.g., on the selected MC properties. The responses were analysed using the second-order polynomial model:
Y = β 0 + j = 1 k β j X j + j = 1 k β j j X j 2 + j = 1 k 1 i = 1 k β i j X i Y j
where Y = the response function predicted by the model, β0 = the constant of the response polynomial equation, βj = the coefficient of the linear term of the response polynomial equation, βjj = the coefficient of the quadratic term of the response polynomial equation, βij = the coefficient of the interaction term of the response polynomial equation, Xi and Xj = the examined independent variables (process conditions) and k = the number of variables.
A response surface was created on the basis of the mathematical model obtained. This provides a visual representation of the effects of the analysed parameters on the observed models. The 3D response surface is represented as a surface in three dimensions. By comparing the results of the RSM with the experimental results obtained under the specified optimal spray drying conditions, the success of the optimisation was verified by additional experiments.
The programme Design-Expert, v.13 (Stat-Ease, Minneapolis, MN, USA) was used for the experimental design and parameter optimisation, as well as for process modelling by means of a non-linear regression analysis and statistical analysis (ANOVA) of the significance of the investigated process parameters on selected physicochemical MC properties.
The encapsulation mixture of GPE and GW was carried out in a glass vessel on a SMHS-6 magnetic stirrer with a heating plate and 30 mm stirring bar (Witeg Labortechnik GmbH, Wertheim, Germany) at 50 °C and 600 rpm for 10 min. After stirring and before spray drying, the encapsulation mixture was stabilised at room temperature for 5 min.
Spray drying of the previously prepared encapsulation mixture was carried out on a B-290 mini spray dryer (BÜCHI Labortechnik AG, Flawil, Switzerland) with a nozzle cap diameter of 1.5 mm and a needle diameter of 0.5 mm. The inlet air temperature was 180 °C. The pumping rate was 25%, while the air flow was approx. 600 L per hour.
The inlet air temperature, the GW proportion in the “core/coating” ratio (w/w) and the feed flow of the previously homogenised encapsulation mixture were optimised process parameters for spray drying in the ranges shown in Table 1. Spray drying was carried out using a B-290 mini spray dryer (BÜCHI Labortechnik AG, Flawil, Switzerland) with an air flow of approx. 600 L per hour and nozzle diameter 15 µm. Finally, the optimal encapsulation conditions by spray drying were selected by numerical optimisation with respect to the physicochemical properties of the obtained MCs, which were determined using the methods described in Section 2.5.
In microencapsulation by spray drying, the powder produced (MC) was collected in a separating flask and quantitatively transferred directly into sealed sample containers and stored in the dark at 4 °C prior to analysis.

2.5. Microcapsule Characterisation

2.5.1. Encapsulation Efficiency

The encapsulation efficiency (EE, %) represents the ratio between the cross-linked phenolic substances inside the MC and the phenolic substances that remained adsorbed on the surface of the MC, and it was calculated after determining the mass fraction of the total phenolic content in the MC (TPC, mgGAE/gdb) and the mass fraction of the phenolic content on the surface in the MC (SPC, mgGAE/gdb) according to Vu et al. [44] using Equation (2):
E E % = T P C S P C T P C × 100
The TPC in the MC is expressed as the mass of gallic acid equivalents per dry basis of the MC (mgGAE/gdb), and it was determined spectrophotometrically according to the Folin–Ciocalteu method by measuring the absorbance at 765 nm. The MC sample was prepared by vortexing 15 mg MCs with 3 mL ethanol/glacial acetic acid/water (50:8:42, v/v/v) and then filtering them through a 0.45 μm PTFE filter [45]. A volume of 40 µL of the filtrate prepared in this way was mixed with 3160 µL distilled water and then with 200 µL Folin–Ciocalteu reagent. After 8 min, 600 µL of 20% (w/v) sodium carbonate was added, and the mixture was incubated at 40 °C for 30 min and the absorbance was measured.
An MC sample was prepared for the evaluation of SPC content using the technique of Tolun et al. [45] For this purpose, 24 mg MCs was dissolved in 3 mL ethanol/methanol (1:1, v/v), and the sample was filtered through a 0.45 μm PTFE filter. Subsequently, the SPC content was determined by applying the Folin–Ciocalteau method mentioned above to determine the TPC content in the MC. The results are expressed as mass of gallic acid equivalents per dry MC base (mgGAE/gdb).
All determinations of TPC and SPC were determined in triplicate.

2.5.2. Moisture Content Determination

Moisture content (wm, %db) in GW and MCs was determined thermogravimetrically on a HR73 moisture analyser (Mettler Toledo, Columbus, OH, USA) using a standard drying method at 105 °C with switch off criteria 5 [46]. All determinations were performed in three parallel repetitions, and moisture content was expressed on the dry basis of samples.

2.5.3. Encapsulation Yield

The encapsulation yield (Y, %) was calculated as the ratio between the total mass of dry matter MCs and the mass of initial solid content in the feed solution (theoretically calculated), expressed as a percentage according to Catalkaya et al. [47].

2.5.4. Determination of the Solubility Properties of the Microcapsules

The solubility properties of the MCs, i.e., water solubility index (WSI, %), water adsorption index (WAI) and swelling power (SP), were determined according to the method described by Lee et al. [48] by mixing 0.1 g of MC and 10 mL of redistilled water in a pre-weighed, clean and dry 50 mL Falcon test tube. The contents of the test tube were shaken with a vortex (DLAB SCIENTIFIC MX-S, Beijing, China) and tempered in a water bath (Witeg WSB-30, Wertheim am Main, Germany) at 60 °C for 30 min. The solution was then cooled in cold water and centrifuged for 10 min at 11,000 rpm (Hermle Z 326 K, Gosheim, Germany). The supernatant was decanted into a Petri dish of known mass and dried for 3 h at 105 °C in an electric dryer (Memmert UFE 500, Schwabach, Germany). After cooling the Petri dishes in a desiccator for 1 h, the mass of the Petri dishes was determined by weighing, i.e., the mass of the dry supernatant remaining at the bottom of the Petri dishes was calculated, which represents the mass of the dissolved MCs.
In addition, the mass of undissolved (swollen) MCs was determined by weighing the Falcon tubes with wet sediment after centrifugation and decanting the supernatant.
Based on the results obtained, the values of WSI, WAI and SP were calculated according to Equations (3)–(5) as follows:
W S I % = m d r y   s u p e r n a t a n t g m d r y   b a s i s   o f   M C g × 100
W A I   = m w e t   s e d i m e n t   l e f t   b e h i n d   i n   t h e   F a l c o n   t u b e g m d r y   b a s i s   o f   M C g
S P   = m w e t   s e d i m e n t   l e f t   b e h i n d   i n   t h e   F a l c o n   t u b e g m d r y   b a s i s   o f   M C g × 1 W S I   % 100

2.5.5. Determination of Density and Compressibility Properties of Microcapsules

The bulk density (BD, g/cm3) and tapped density (TD, g/cm3) for the MS were determined according to the method described by Boyano-Orozco et al. [49]. The BD was determined by measuring the volume occupied by 1 g of MCs in a 25 mL graduated cylinder, while the TD was determined as the ratio between the mass of the MC sample and the volume occupied by the sample after 1250 taps using an AutoTap device (Anton Paar, Graz, Austria). All measurements were performed in triplicate.
The determination of BD and TD enabled the calculation of the compressibility parameters, namely the Hausner ratio (HR) and the Carr index (CI, %) [50], which were calculated according to Equations (6) and (7):
H R   = T D B D
C I % = T D B D T D × 100

2.5.6. Determination of Colour Parameters

The objective colour measurement of GW and MCs was performed with a Chroma Meter CR 400 (Konica Minolta, Japan) using the CIELab colour measurement system and a chamber for measuring the colour of powder materials (CR-A50). Colour parameters: L* (black/white vector; direct measure of lightness), a* (redness/greenness vector) and b* (yellowness/blueness vector) were performed in three measurements for each sample, and the mean values of the measured parameters were used to calculate other colour parameters. The values of the total colour difference (ΔEab) between GW and MCs were calculated to determine the possible correlation between the colour and the content of phenolic substances in MCs. The total colour difference was calculated according to Equation (8) as follows:
Δ E a b ( ) = L o L 2 + a o a 2 + b o b 2
where the index “o” indicates the colour parameter of the pure coating (GW).
In addition, the values of hue (h*, hue angle) and chroma (C*, saturation) were calculated according to Equations (9) and (10) as follows:
h ( ° ) = tan 1 b a
C ( ) = a 2 + b 2

2.5.7. Determination of Individual Phenolic Compounds and Anthocyanins by UHPLC

In this study, ultra-high-performance liquid chromatography (UHPLC Nexera XR, Shimadzu, Kyoto, Japan) with a photodiode detector was used to analyse the individual phenolic compounds and anthocyanins in CSE both qualitatively and quantitatively, as described in the study by Šelo et al. [51]. A reversed-phase Kinetex® C18 Core-Shell column (100 4.6 mm, 2.6 m, Phenomenex, Torrance, CA, USA) was used for the separation. The MC samples were prepared according to Tolun et al. [45] with minor modifications, by dissolving 0.1 g MCs in 1.5 mL of a water/methanol/HCl mixture (89:10:1 v/v/v) and then centrifuging them at 14,000 rpm for 3 min (Z 326 K, Hermle Labortechnik GmbH, Wehingen, Germany). Prior to UHPLC analysis, the supernatants were filtered using 0.45 μm membranes (Chromafil Xtra PTFE, Macherey-Nagel GmbH & Co. KG, Dueren, Germany). The GPE was also filtered in the same way before UHPLC analysis. LabSolutions 5.87 software was used to process the data. The compounds were identified by comparing the retention times and UV–Vis spectra of the individual phenolic compounds and anthocyanins with those of real standards analysed under the same chromatographic conditions. The calibration curves generated with the external standards were used for quantification.

2.5.8. Determination of Antioxidant Activity by DPPH, FRAP and ABTS Methods

The antioxidant activity of GPE and MCs was determined by DPPH, FRAP and ABTS assays as described in the study by Šelo et al. [51]. Measurements were performed in triplicate for all assays, and the final results were expressed in Trolox equivalents per dry mass of grape pomace or MC powder (mgTE/gdb). In brief, 0.1 mL of the extract was added to the tubes and mixed with 3.9 mL ethanol solution of DPPH radical (0.026 mgDPPH/mL). After 30 min of incubation in the dark, the absorbance of the reaction mixture was measured at 515 nm. Absolute ethanol served as a blank. A diluted ABTS + radical solution (950 µL) was added to 50 µL of the extracts, and the absorbance was measured at 734 nm after 10 min incubation in the dark. The control sample was prepared in the same way, but ethanol was used instead of the extract. Absolute ethanol served as a blank. The FRAP assay was performed as follows: 2.7 mL of FRAP reagent was mixed with 270 µL of distilled water and 150 µL of the prepared sample (see Section 2.5.7). The incubation was carried out in the dark at 37 °C for 40 min, then the absorbance was measured at 592 nm. The blank sample was prepared in the same way, but distilled water was used instead of the extract.

3. Results and Discussion

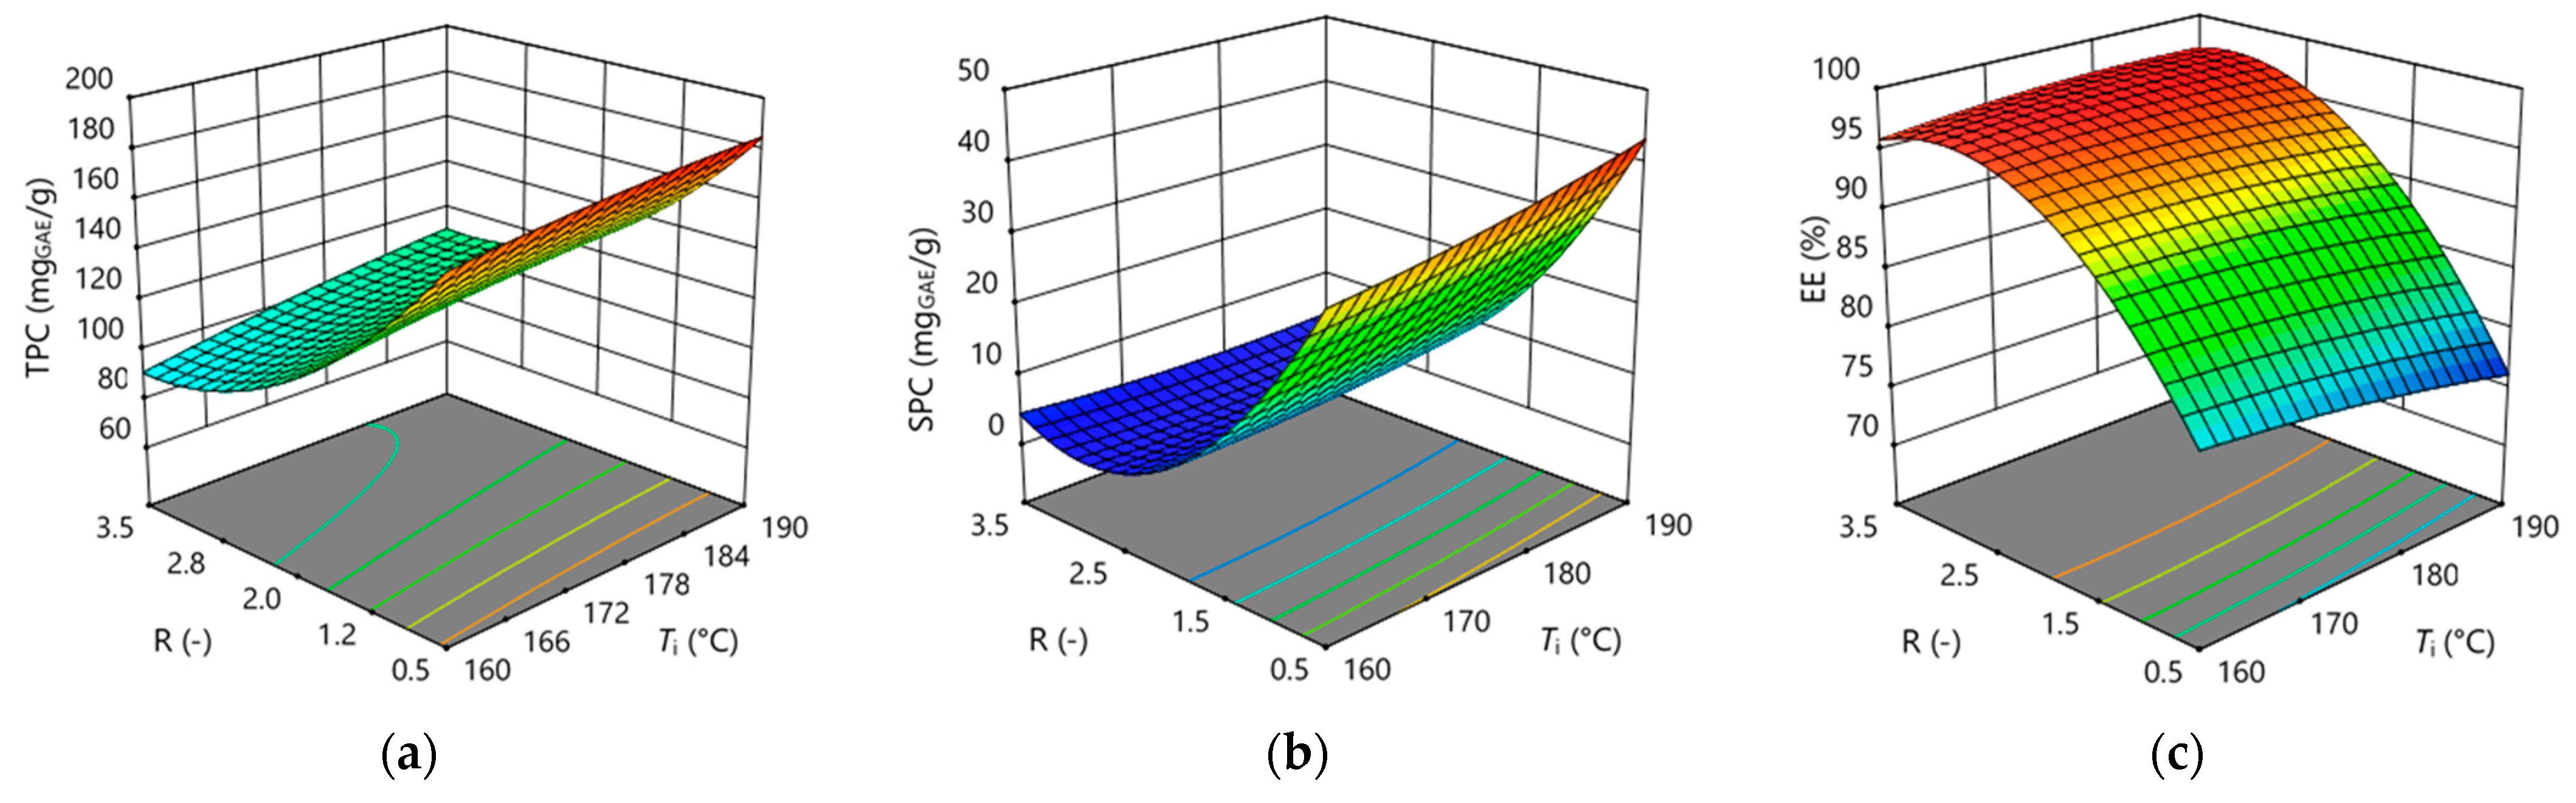
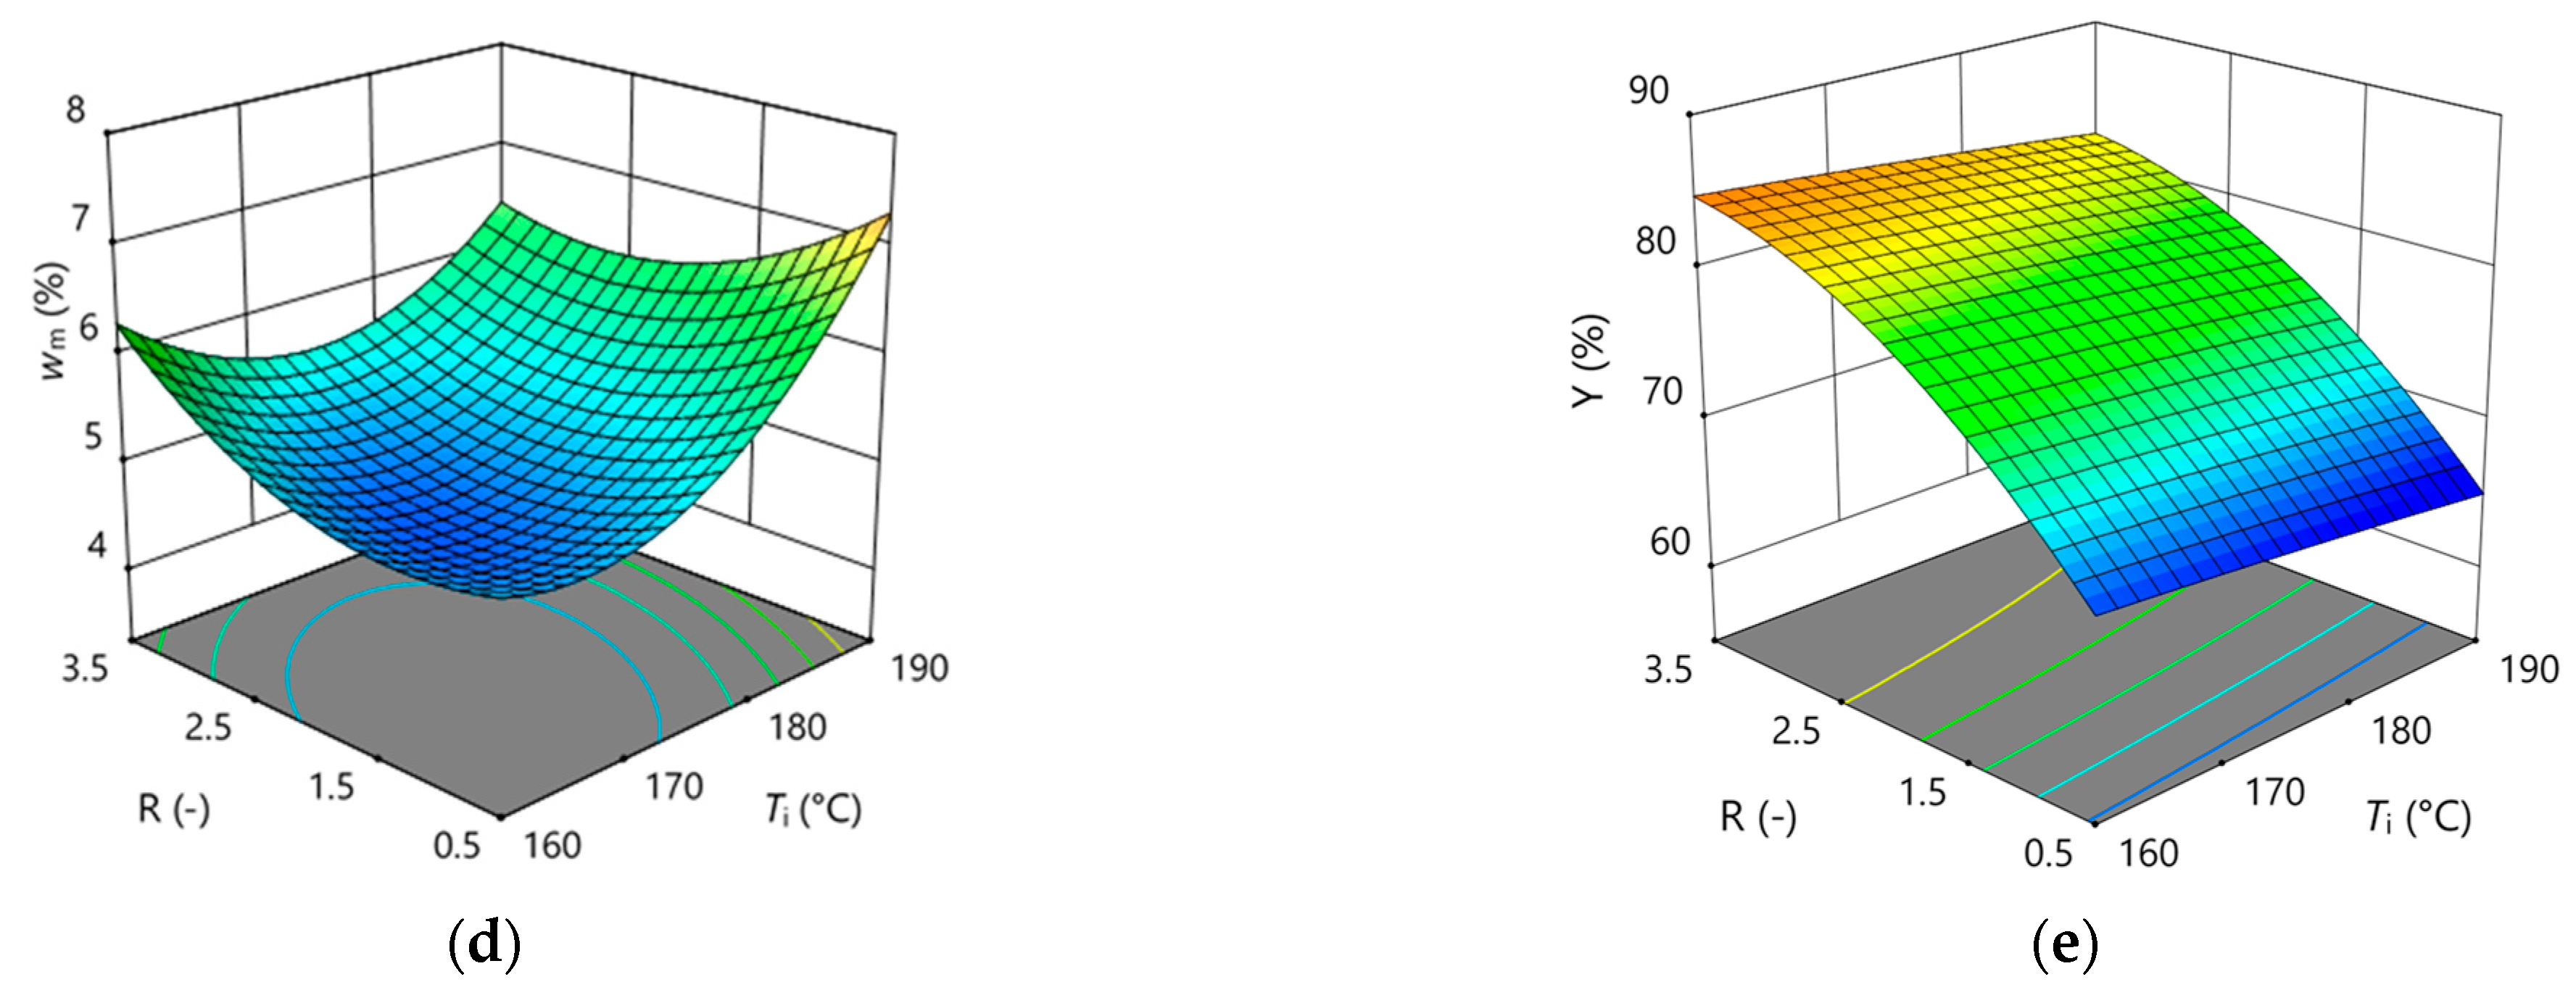
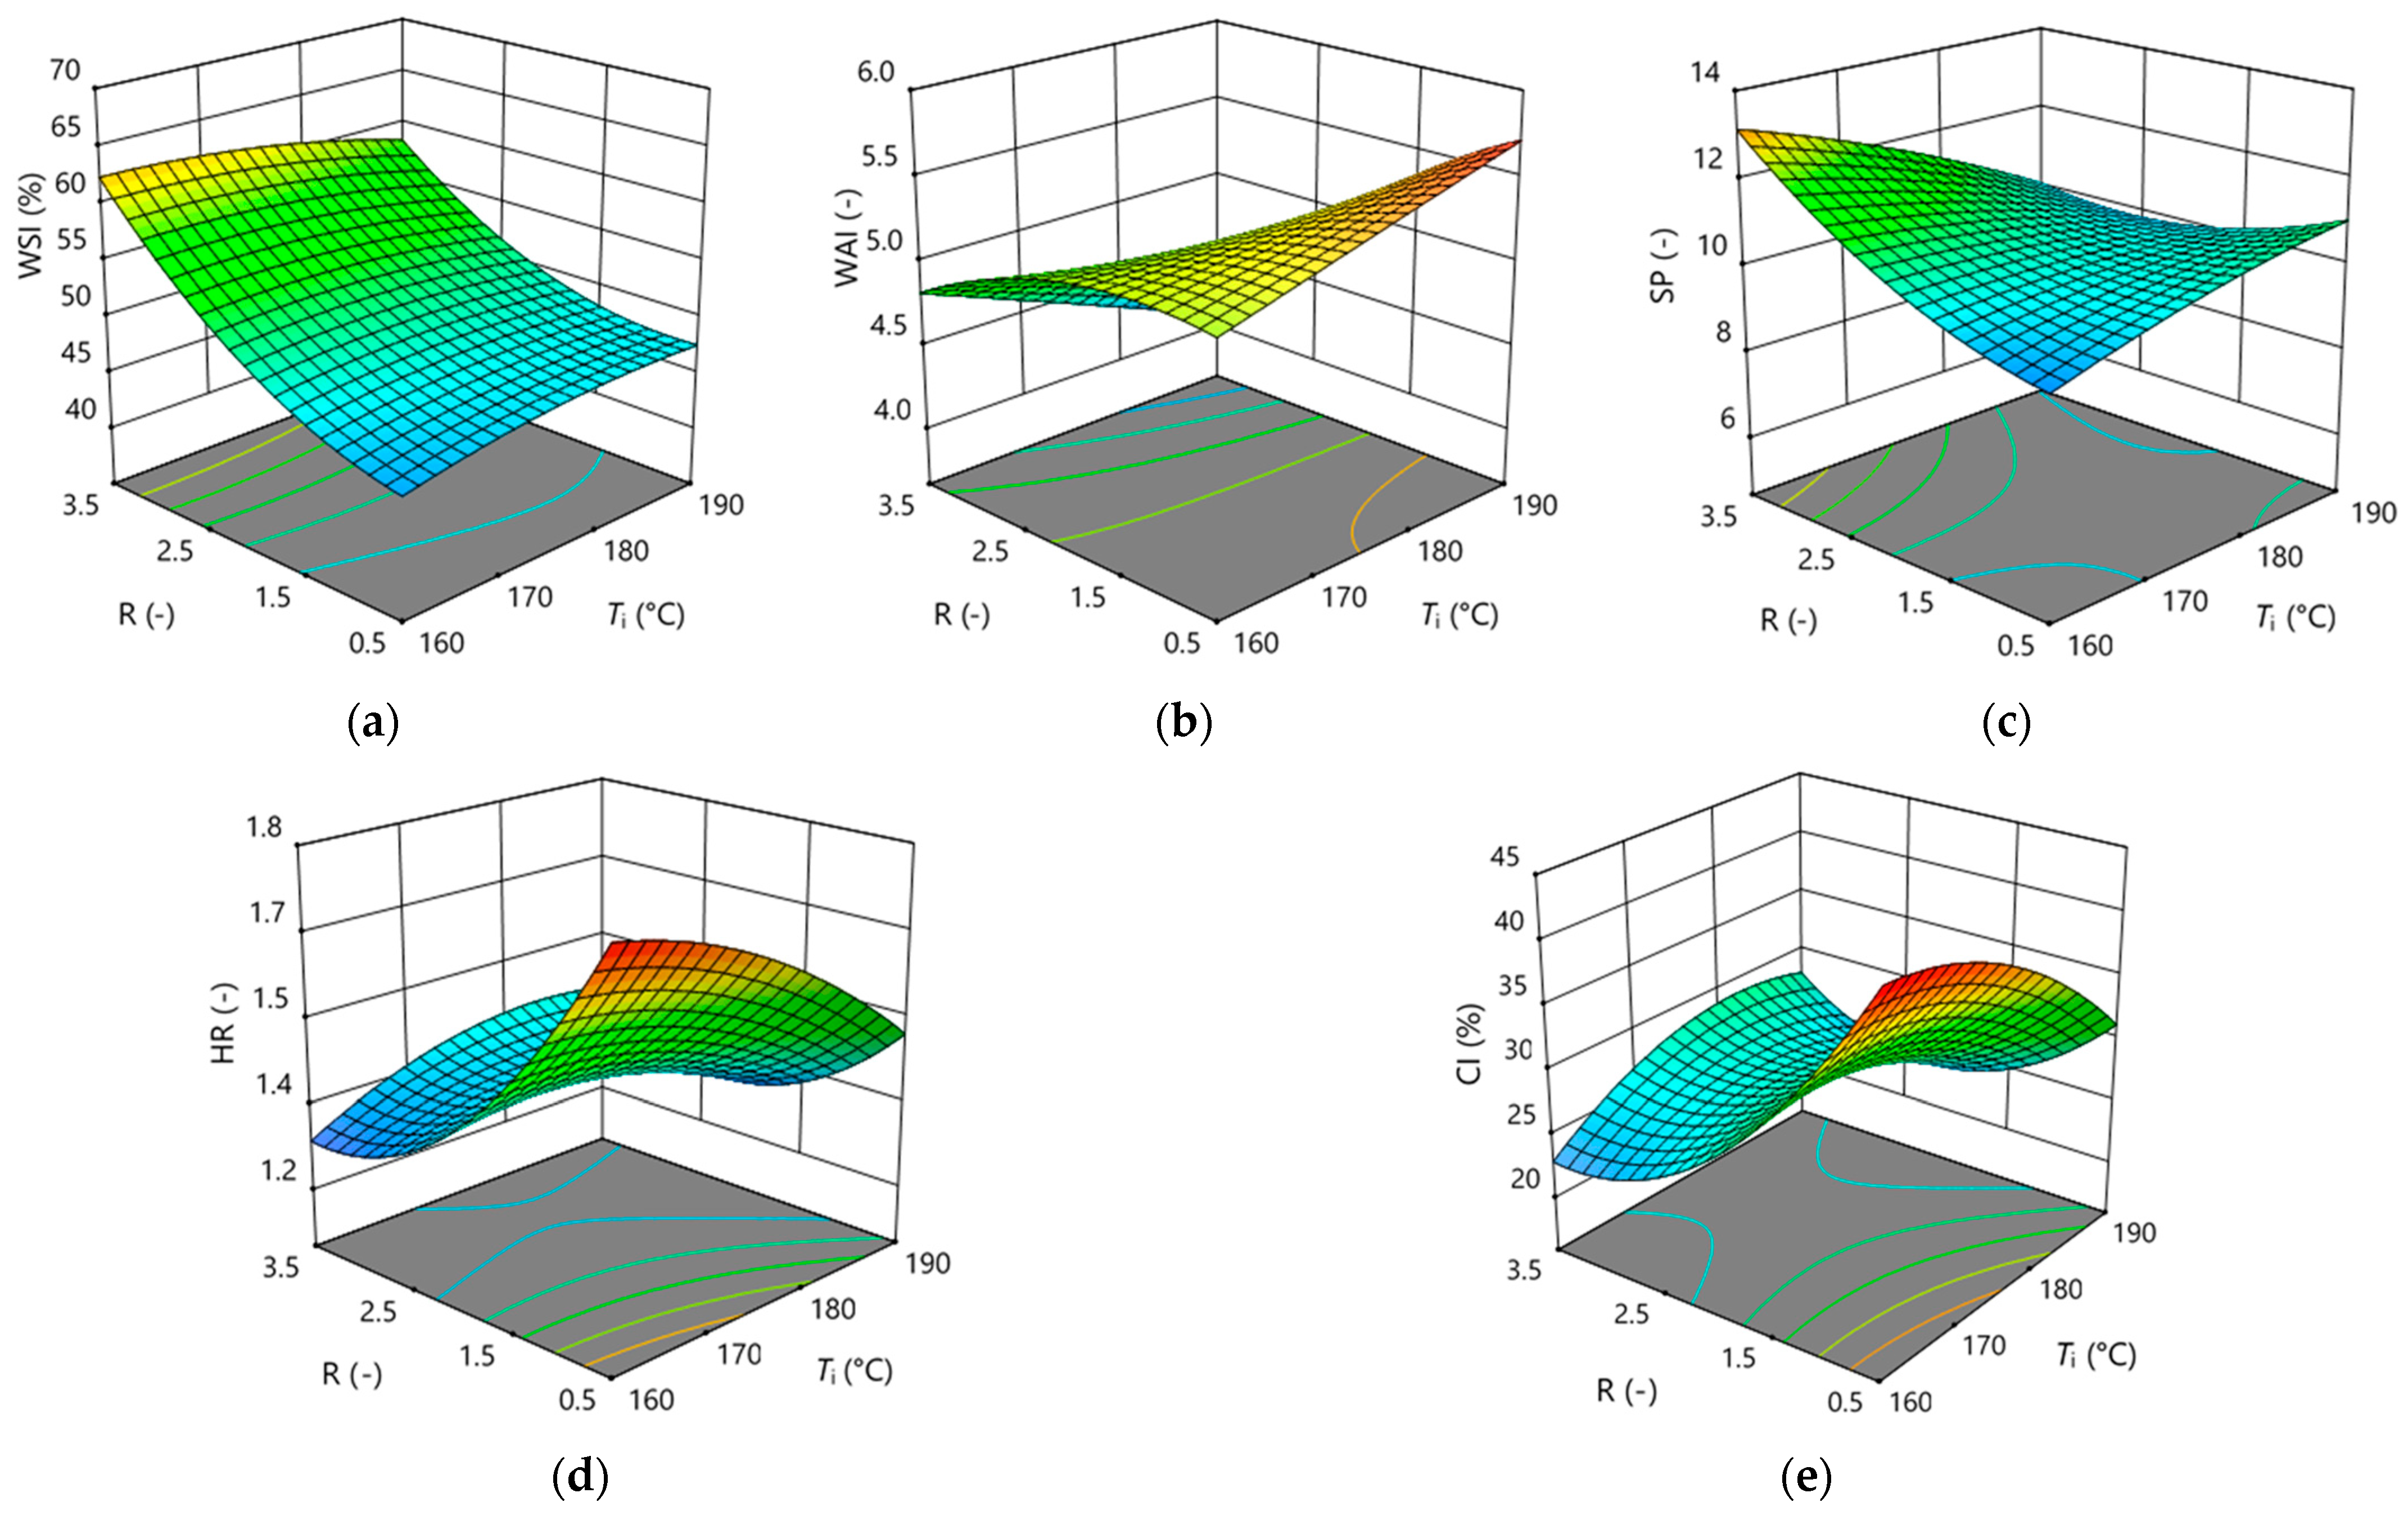
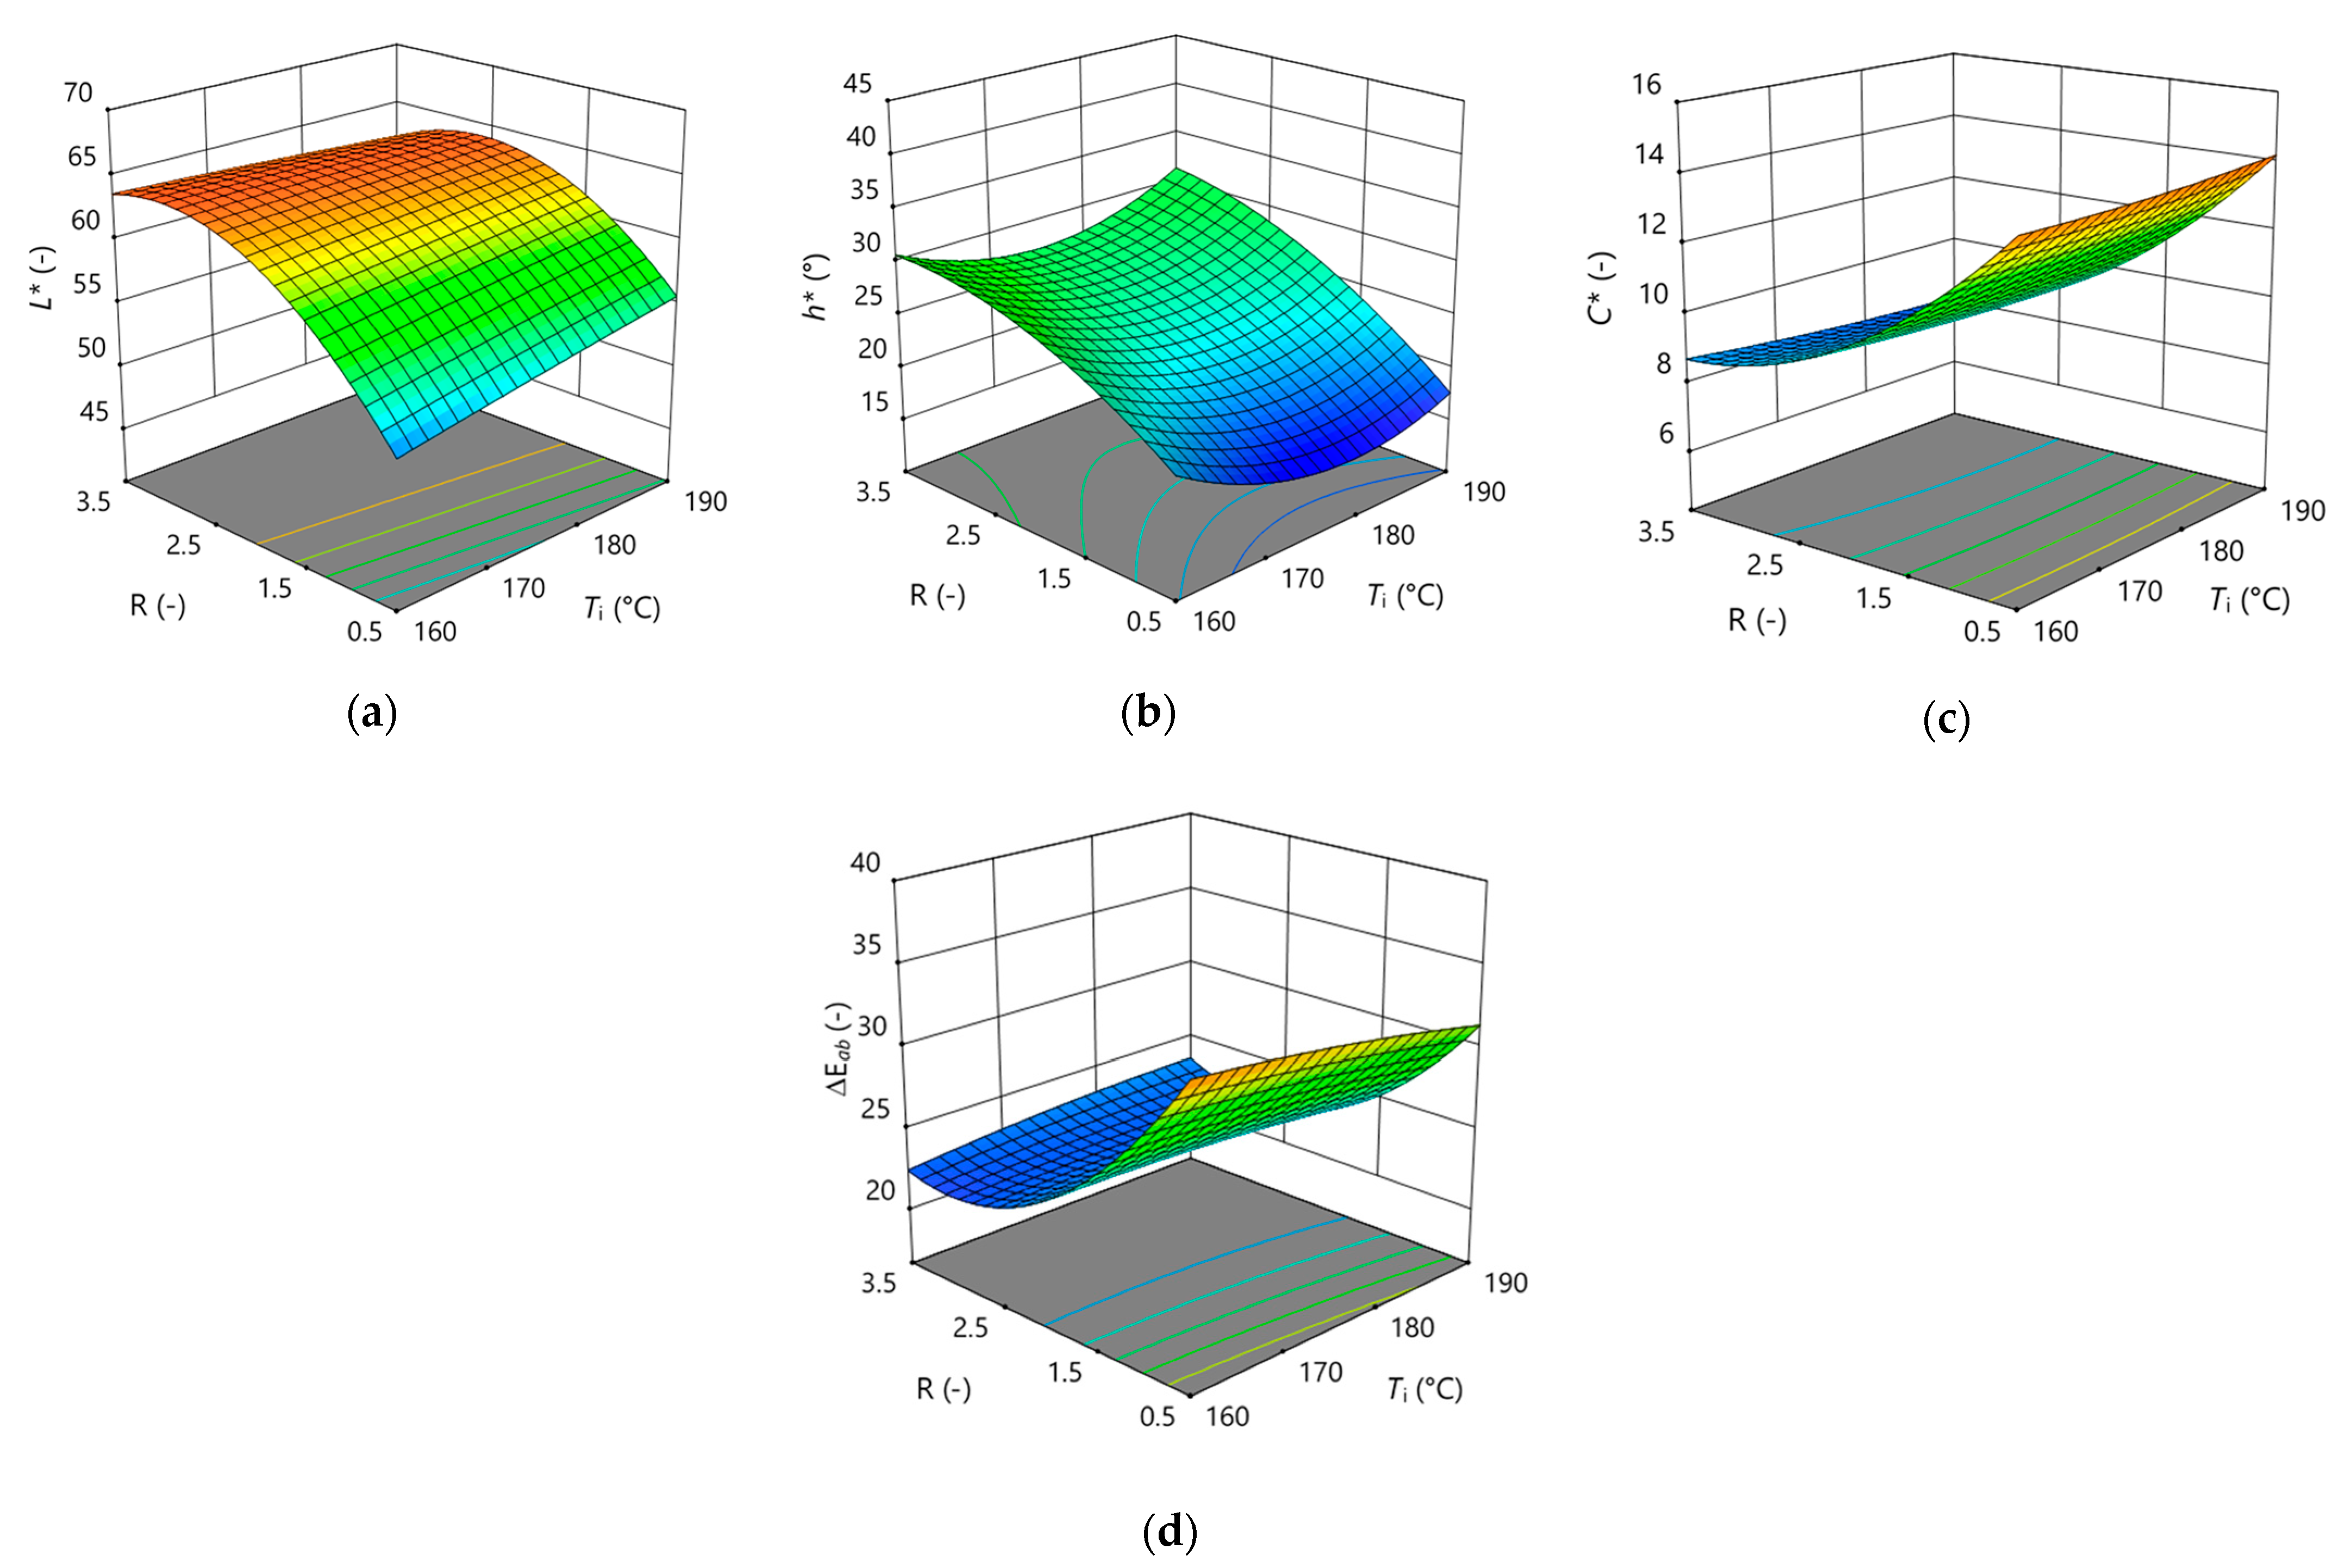
3.1. Optimisation of Encapsulation by Spray Drying

As already mentioned in the introductory part, the parameters of spray drying are extremely important for this type of microencapsulation in order to obtain MCs with satisfactory powder properties at a high efficiency and yield. Numerous other authors testify to this [52,53,54,55].
The optimisation of the spray drying process parameters was performed as described in Section 2.4. and Table 1, and their influence on the properties of the obtained MCs was investigated. The experimentally determined values of density (TD, BD) and colour parameters (L*, a*, b*) for all 15 encapsulations runs are listed in Table 2. The values of other responses (EE, wm, Y, WSI, WAI, SP, HR, CI and ΔEab) are available in the Supplementary Materials (Table S1).
The values listed in Table 1, as well as certain values for TPC, SPC and wm, were used to calculate other properties, which were then used for RSM optimisation and the creation of 3D response surfaces. The coefficients, in the form of coded factors, and the statistical significance of the influence of the spray drying parameters on various properties of the MCs are shown in Table 3, and the results of the ANOVA to the response surface quadratic model are shown in Table S2 (in the Supplementary Materials). From the values given, it can be generally concluded that among the three spray drying parameters tested, the greatest influence on the encapsulation and the properties of the MCs was the GW proportion (R).
More specifically, if one considers the response values for the dependent variables that are indicators of the success of the encapsulation process, i.e., TPC, SPC, EE and wm, the following is evident: the coded factor A (in linear and quadratic form) had a statistically significant influence on wm; the coded factor B (in linear and quadratic form) had a significant influence on TPC, SPC, EE and Y; while the factor C significantly influenced SPC, wm and Y. In addition, the interaction of the influence of factor BC on SPC was also recorded. Furthermore, factor B had a significant on the WSI and WSA with the presence of the interaction of factors AB and AC. The fluidity/compressibility properties of the MCs (HR and CI) were significantly influenced by factors A and B, as independent factors with linear and quadratic dependence, and the combined influence of these two factors was noted. MC colour parameters (L*, h*, C*) and the total colour difference compared to the pure GW were statistically dependent on B and B2. These influences are also clearly visible on the 3D response surfaces (Figure 1, Figure 2 and Figure 3).
In general, it is to be expected that with an increase in the proportion of the shell (R) in the encapsulation mixture, its proportion in the MC also increases, i.e., the proportion of the active ingredient, TPC, which in this case is incorporated into the MC in the form of GPE, decreases, which can be clearly seen in Figure 1a. This also affects the decrease in the amount of phenolic compounds adsorbed on the MC surface, which is even more pronounced when considering the additionally observed influence of Q and their interaction (Figure 1b). Consequently, an increase in TPC and a decrease in SPC led to an increase in EE (Figure 1c). The values of TPC, SPC and EE ranged from 60.58 to 189.38 mgGAE/gdb, 2.56 to 45.16 mgGAE/gdb and 74.68% to 97.38%, respectively.
The wm ranged from 4.59% to 7.74% (Figure 1d). The lower moisture content in the MCs was achieved at lower inlet air temperatures, which can be explained by the absence of a sudden crust formation on the surface of the MC in the initial drying phase, which can interfere with the difficult removal of moisture from the centre of the MC in the later stages of drying. Although there was no statistically significant influence of the factor R (Table 2), it can be seen in Figure 1d that as R increases in the encapsulation mixture, the moisture content in the final product also increases, which may be related to the fact that the moisture content in pure GW powder is 5.25%db and in this case the GW itself can be considered as a “moisture reservoir” in the MC. Similar to our results are those obtained by Moreno et al., who reported a moisture content between 4.4 and 11.7% [56] in the case of the microencapsulation of GPE using whey protein isolate, while it was slightly higher, between 11.1 and 14.8%, in the case of using a combination of maltodextrin, whey protein isolate and pea protein isolate as a coating [57].
Y-values above 50% were obtained for all spray drying conditions, i.e., in the range of 67.11%–86.30% (Table S1—Supplementary Materials), which can be considered a high yield under laboratory spray drying conditions. The mentioned yields are comparable to the results of similar microencapsulation studies using whey proteins as a coating (alone or in combination with other coatings). For example, Rafiq et al. [58] achieved yields in the range of 77.76%–82.87% when microencapsulating Kinnow bark extract using maltodextrin and whey protein concentrate. Catalkaya et al. [47] encapsulated an anthocyanin-rich extract of black chokeberry pomace using different coating materials and achieved a spray drying yield of up to 78.1%. They associate this high yield with the strong surfactant character of whey proteins, which form a thin, non-sticky protein barrier on the surface of the droplet in contact with hot air, causing the droplets to adhere poorly to the inner wall of the drying chamber, resulting in greater powder production. Similar to EE, R had the greatest influence on Y, as expected, i.e., with an increase in the proportion of GW, the yield of MCs also increased (Table 2, Figure 1e). In addition, a statistically significant positive influence of flow rate on Y was found, while drying temperature had no statistically significant influence in this case.
The parameters of solubility WSI, WAI and SP are crucial markers of the product’s functional qualities, as well as markers for the use and preservation of MCs. The ability of the MCs to dissolve in water is represented by the WSI. The intended use of the MC product determines whether a higher WSI value is desirable. A high WSI is particularly crucial if the MC is going to be used in the food or pharmaceutical industries, so that MCs can be easily incorporated and dispersed evenly throughout the final product. The likelihood of the microbiological instability of the MC products increases with higher WAI values [59]. The WSI, WAI and SP values of this optimisation set ranged from 41.56% to 67.23%, 4.06% to 5.76% and 9.00% to 13.87%, respectively (Figure 2a–c).
Based on the specific density of the powder before and after tapping (Table 2), the HR and the CI were calculated, and the response surfaces are present in Figure 2d, which clearly shows the independent and combined influence of R and Ti on these properties. The flow characteristics of most MCs are marked as “very poor” or “very, very poor”.
As previously confirmed statistically (Table 3), the significant dependence of the colour properties of MCs on R is also confirmed by the 3D response surfaces shown in Figure 3. The brightness of the MCs ranges from 49.36 to 65.25, where MCs are brighter in relation to GW, i.e., they have higher values for L* (Table 2, Figure 3a). The brightness of the GW powder used is 80.17. The h* values range from 16.11 to 42.35° (Figure 3b), which corresponds to the I. quadrant of the CIELab colour plot (0–90°), i.e., they are in the red colour range. At the same time, as the proportion of GW in the MCs increases, the value of h* increases, i.e., the hue moves towards the II. quadrant of the CIELab plot (90–100°; yellow colour), where the h* value for GW powder is located (97.07°). The hue saturation (Figure 3c) was in the range of 7.59–15.8, with lower values for MCs with a higher GW content, i.e., the colour was less vivid and closer to neutral grey. Given the above, it was expected that the values for ΔEab would be lower when a greater proportion of the MC is GW (Figure 3d). These instrumentally determined values ranged from 21.48 to 36.77 and were also subjectively visible, considering that the average human eye can perceive any total colour difference that is >6.
Comparing the colour parameters (Figure 3) with the content of phenolic substances in the MCs (Figure 1), a clear correlation between these values can be observed, which is also confirmed by the high correlation coefficients for TPC:h*, SPC:L* and SPC:C*, which are −0.8805, −0.8361 and 0.9347, respectively.
The numerical optimisation of the process parameters in the tested range was used again to determine the optimum drying parameters with predetermined limit values, i.e., minimum wm and maximum EE. In this way, the following values were determined as the optimum encapsulation parameters: Ti = 173.5 °C, R = 2.5 and Q = 7 mL/min.
When comparing the predicted and experimentally determined values of the powder properties under optimal conditions, it can be seen that most deviations are less than 10%. There are two exceptions where the deviation is greater than 10%, namely the SP of the powder and the WAI (Table 4).

3.2. Individual Phenolic Compounds and Anthocyanins, and Antioxidant Activity

The content of individual phenolic compounds and anthocyanins in GPE and MCs (produced under optimal spray drying conditions) after microencapsulation and after one year of storage at −18 °C (MC1y) is shown in Table 5. A total of 21 individual phenolic compounds and 6 anthocyanins were detected in GPE using the UHPLC method.
Within the group of phenolic compounds, catechin (5750.57 μg/gdb.GP), epicatechin (3678.50 μg/gdb.GP) and gallocatechin gallate (1579.11 μg/gdb.GP) were the most abundant in GPE, while p-coumaric acid and ferulic acid were present at the lowest concentrations of 7.25 μg/gdb.GP and 4.94 μg/gdb.GP, respectively.
After encapsulation, the MCs maintained an almost identical profile of phenolic compounds, confirming the high correlation coefficient of 0.9802 between the content of the same phenolic compounds in GPE and in MCs. Moreover, catechin, epicatechin and gallocatechin gallate were present in the highest concentrations in the MCs (4675.02 μg/gdb.MC, 3284.86 μg/gdb.MC and 1229.93 μg/gdb.MC, respectively), and procyanidin B1 (1121.04 μg/gdb.MC) and procyanidin B2 (1034.65 μg/gdb.MC) were also found in high concentrations, while p-coumaric acid and ferulic acid were again present in the lowest concentrations. After one year at −18 °C, the presence of caffeic acid and o-coumaric acid in the MCs was no longer detectable, while on the other hand an increase in the content of 3,4-dihydroxybenzoic acid, vanillic acid, gallic acid, quercetin and ferulic acid was recorded in a range of 246.93% to 103.74%. After one year at −18 °C, the MCs retained a high percentage (91.39%–60.08%) of kaempferol, procyanidin B2 and gallocatechin gallate, while the remaining phenolic compounds were degraded by more than 50%.
The most abundant anthocyanin in GPE is oenin chloride (899.94 μg/gdb.GP), followed by callistephin chloride (170.17 μg/gdb.GP) and myrtillin chloride (138.41 μg/gdb.GP), while kuromanin chloride, petunidin chloride and peonidin 3-O-glucoside chloride were present in GPE at concentrations of less than 15 μg/gdb.GP. As in the case of phenolic compounds, the profile of anthocyanins in the MCs matched the profile of anthocyanins in GPE with a very high correlation coefficient of 0.99997. Anthocyanin levels in the MCs ranged from 727.24 μg/gdb.MC (oenin chloride) to 2.78 μg/gdb.MC (peonidin 3-O-glucoside chloride). All the anthocyanins were also detected in the MCs after one year of storage at −80 °C, but with a high percentage of degradation, whereby this percentage was 88.79% for petunidin chloride, while the other anthocyanins were degraded by more than 90% of the initial value (Table 5). It is well known that anthocyanins are extremely unstable compounds that are sensitive to various external influences [60,61,62]. Similar to the results obtained in this study, numerous other authors have found that the anthocyanin content in various fruit powders decreases during storage, regardless of the storage temperature [63,64]. The degradation of anthocyanins and the decomposition of more complex phenolic compounds into simpler compounds during storage could be the reason for the increase in the concentration of phenolic acids. It is assumed that the increase in the content of gallic acid could be caused by the decomposition of oenin chloride and myrtiline chloride, while the reason for the increase in the content of 3,4-dihydroxybenzoic acid could be the decomposition of oenin and kuromanin chloride [43].
In accordance with the content of phenolic substances and anthocyanins, GPE and MCs showed a corresponding antioxidant activity (Table 6), which was demonstrated by three tests (DPPH, ABTS and FRAP).
A more detailed characterisation of the MCs produced under optimal conditions, which includes an analysis of the structure and properties of the MCs, as well as the release and bioaccessibility index of the phenolic compounds from the MCs, is available in the work of Perković et al. [65].

4. Conclusions

It can be concluded that GW is a suitable wall material to overcome stickiness problems in the spray drying of sugar-rich extracts and thus product losses, and that it is suitable to protect phenolic compounds in the spray drying process, resulting in high yields and a high encapsulation efficiency. The addition of GW to the grape pomace extract at a ratio 2.5 times greater than the dry mass of the extract, and spray drying at 173.5 °C and a feed flow rate of 7 mL/min, created microcapsules that maintained the original profile of phenolic substances and anthocyanins, as well as good antioxidant activity. GW as a coating provided greater stability to the phenolic substances than the anthocyanins during storage over a period of one year.
This study indicates a significant potential for the application of GW in the encapsulation processes of various bioactive compounds. The benefits of GW (bioactivity, antimicrobial activity and non-toxicity), in combination with the bioactive properties of the grape pomace extract, indicate a promising route for the development of highly functional ingredients or products by upcycling by-products from different segments of the food industry.
This area could also be of particular interest to the dairy industry, as it could utilise fresh liquid whey directly for the encapsulation and production of various powder products. This would eliminate the significant energy costs of producing whey powder, which would then need to be dissolved to be used as an encapsulation coating in a further spray-drying process. This future strategy requires further evaluation and optimisation in order to create stable products with high bioactivity during a longer storage period.

Supplementary Materials

The following supporting information can be downloaded at: https://www.mdpi.com/article/10.3390/coatings14091101/s1, Table S1: Responses of EE, wm, Y, WSI, WAI, SP, HR, CI and ΔEab to experimental runs used for RSM optimisation of spray drying parameters; Table S2: Spray drying—results of the ANOVA to the response surface quadratic model for EE, wm, Y, WSI, WAI, SP, HR, CI and ΔEab.

Author Contributions

Conceptualisation, G.P. and M.P. (Mirela Planinić); formal analysis, G.P., J.M., G.Š., R.N. and M.P. (Matej Puš); investigation, G.P., J.M. and G.Š.; resources, M.P. (Mirela Planinić) and A.B.-K.; data curation, G.P. and M.P. (Mirela Planinić); writing—original draft preparation, G.P.; writing—review and editing, M.P. (Mirela Planinić) and A.B.-K.; visualisation, M.P. (Mirela Planinić); supervision, M.P. (Mirela Planinić); funding acquisition, A.B.-K. All authors have read and agreed to the published version of the manuscript.

Funding

This research was funded by the CROATIAN SCIENCE FOUNDATION, grant number: IP-2018-01-1227 (“Development of a sustainable integrated process for the production of bioactive isolates from food industry residues”, POPI-WinCEco).

Data Availability Statement

The data presented in this study are openly available in article.

Conflicts of Interest

The authors declare no conflicts of interest. The funders had no role in the design of the study; in the collection, analyses, or interpretation of data; in the writing of the manuscript; or in the decision to publish the results.

References

  1. Maicas, S.; Mateo, J.J. Sustainability of Wine Production. Sustainability 2020, 12, 559. [Google Scholar] [CrossRef]
  2. López-Belchí, M.D.; Caamaño, E.F.; Pascual, G.; Noriega, F.; Fierro-Morales, P.; Romero-Román, M.E.; Jara, P.; Schoebitz, M.; Serra, I.; Moreno, D.A. Spray-Dried Formulations Rich in Malvidin from Tintorera Grape Wastes: Characterization, Stability, and Storage. Processes 2021, 9, 518. [Google Scholar] [CrossRef]
  3. Moro, K.I.B.; Bender, A.B.B.; da Silva, L.P.; Penna, N.G. Green Extraction Methods and Microencapsulation Technologies of Phenolic Compounds from Grape Pomace: A Review. Food Bioprocess Technol. 2021, 14, 1407–1431. [Google Scholar] [CrossRef]
  4. Shoukat, A.; Imran, M.; Khan, M.K.; Ahmad, M.H.; Ahmad, R.S.; Ramadan, M.F.; Nadeem, M.; Yasmin, A.; Rahim, M.A.; Khan, M.I. Impact of Spray Drying Operating Conditions on Yield, Secondary Metabolites, Antioxidant Potential and Storage Quality of Grape (Vitis vinifera L.) Pomace Powder. South Afr. J. Bot. 2024, 169, 383–395. [Google Scholar] [CrossRef]
  5. de Souza, V.B.; Fujita, A.; Thomazini, M.; da Silva, E.R.; Lucon, J.F.; Genovese, M.I.; Favaro-Trindade, C.S. Functional Properties and Stability of Spray-Dried Pigments from Bordo Grape (Vitis labrusca) Winemaking Pomace. Food Chem. 2014, 164, 380–386. [Google Scholar] [CrossRef] [PubMed]
  6. Chowdhary, P.; Gupta, A.; Gnansounou, E.; Pandey, A.; Chaturvedi, P. Current Trends and Possibilities for Exploitation of Grape Pomace as a Potential Source for Value Addition. Environ. Pollut. 2021, 278, 116796. [Google Scholar] [CrossRef]
  7. Gibbs, F.B.; Kermasha, S.; Alli, I.; Mulligan, C.N. Encapsulation in the Food Industry: A Review. Int. J. Food Sci. Nutr. 1999, 50, 213–224. [Google Scholar] [CrossRef]
  8. Martinović, J.; Lukinac, J.; Jukić, M.; Ambrus, R.; Planinić, M.; Šelo, G.; Klarić, A.-M.; Perković, G.; Bucić-Kojić, A. Physicochemical Characterization and Evaluation of Gastrointestinal In Vitro Behavior of Alginate-Based Microbeads with Encapsulated Grape Pomace Extracts. Pharmaceutics 2023, 15, 980. [Google Scholar] [CrossRef] [PubMed]
  9. Sosnik, A.; Seremeta, K.P. Advantages and Challenges of the Spray-Drying Technology for the Production of Pure Drug Particles and Drug-Loaded Polymeric Carriers. Adv. Colloid Interface Sci. 2015, 223, 40–54. [Google Scholar] [CrossRef]
  10. Ré, I.M. Microencapsulation by Spray Drying. Dry. Technol. 1998, 16, 1195–1236. [Google Scholar] [CrossRef]
  11. Pourashouri, P.; Shabanpour, B.; Razavi, S.H.; Jafari, S.M.; Shabani, A.; Aubourg, S.P. Impact of Wall Materials on Physicochemical Properties of Microencapsulated Fish Oil by Spray Drying. Food Bioprocess Technol. 2014, 7, 2354–2365. [Google Scholar] [CrossRef]
  12. Abd El-Kader, A.; Abu Hashish, H. Encapsulation Techniques of Food Bioproduct. Egypt. J. Chem. 2020, 63, 1881–1909. [Google Scholar] [CrossRef]
  13. Gaćina, N. Alternative Green Wall Materials: A New Trend in Spray Drying Encapsulation of Polyphenols. Croat. J. Food Sci. Technol. 2024, 16, 56–63. [Google Scholar] [CrossRef]
  14. Coimbra, P.P.S.; Cardoso, F.D.S.N.; Gonçalves, É.C.B.D.A. Spray-Drying Wall Materials: Relationship with Bioactive Compounds. Crit. Rev. Food Sci. Nutr. 2021, 61, 2809–2826. [Google Scholar] [CrossRef]
  15. Smithers, G.W. Whey and Whey Proteins—From ‘Gutter-to-Gold’. Int. Dairy J. 2008, 18, 695–704. [Google Scholar] [CrossRef]
  16. Božanić, R.; Barukčić Jurina, I.; Lisak Jakopović, K.; Tratnik, L. Possibilities of Whey Utilisation. Austin J. Nutr. Food Sci. 2014, 2, 1036–1043. [Google Scholar]
  17. Zou, Z.; Duley, J.A.; Cowley, D.M.; Reed, S.; Arachchige, B.J.; Bhandari, B.; Shaw, P.N.; Bansal, N. Physicochemical Properties and Whey Proteomes of Camel Milk Powders Produced by Different Concentration and Dehydration Processes. Foods 2022, 11, 727. [Google Scholar] [CrossRef]
  18. Medeiros, G.K.V.V.; Queiroga, R.C.R.E.; Costa, W.K.A.; Gadelha, C.A.A.; e Lacerda, R.R.; Lacerda, J.T.J.G.; Pinto, L.S.; Braganhol, E.; Teixeira, F.C.; Barbosa, P.P.D.S.; et al. Proteomic of Goat Milk Whey and Its Bacteriostatic and Antitumour Potential. Int. J. Biol. Macromol. 2018, 113, 116–123. [Google Scholar] [CrossRef]
  19. Kerasioti, E.; Stagos, D.; Georgatzi, V.; Bregou, E.; Priftis, A.; Kafantaris, I.; Kouretas, D. Antioxidant Effects of Sheep Whey Protein on Endothelial Cells. Oxidative Med. Cell. Longev. 2016, 2016, e6585737. [Google Scholar] [CrossRef]
  20. Garau, V.; Manis, C.; Scano, P.; Caboni, P. Compositional Characteristics of Mediterranean Buffalo Milk and Whey. Dairy 2021, 2, 469–488. [Google Scholar] [CrossRef]
  21. Di Renzo, G.C.; Altieri, G.; Genovese, F. Donkey Milk Powder Production and Properties Compared to Other Milk Powders. Dairy Sci. Technol. 2013, 93, 551–564. [Google Scholar] [CrossRef]
  22. Li, L.; Liu, X.; Guo, H. The Nutritional Ingredients and Antioxidant Activity of Donkey Milk and Donkey Milk Powder. Food Sci. Biotechnol. 2018, 27, 393–400. [Google Scholar] [CrossRef] [PubMed]
  23. Ricaurte, L.; Prieto, R.; Perea-Flores, M.J.; Quintanilla-Carvajal, M.X. Influence of Milk Whey on High-Oleic Palm Oil Nanoemulsions: Powder Production, Physical and Release Properties. Food Biophys. 2017, 12, 439–450. [Google Scholar] [CrossRef]
  24. Warncke, M.; Keienburg, S.; Kulozik, U. Cold-Renneted Milk Powders for Cheese Production: Impact of Casein/Whey Protein Ratio and Heat on the Gelling Behavior of Reconstituted Rennet Gels and on the Survival Rate of Integrated Lactic Acid Bacteria. Foods 2021, 10, 1606. [Google Scholar] [CrossRef]
  25. Macwan, S.; Dabhi, B.; Parmar, S.; Aparnathi, K. Whey and Its Utilization. Int. J. Curr. Microbiol. Appl. Sci. 2016, 5, 134–155. [Google Scholar] [CrossRef]
  26. Buchanan, D.; Martindale, W.; Romeih, E.; Hebishy, E. Recent Advances in Whey Processing and Valorisation: Technological and Environmental Perspectives. Int. J. Dairy Technol. 2023, 76, 291–312. [Google Scholar] [CrossRef]
  27. Prazeres, A.R.; Carvalho, F.; Rivas, J. Cheese Whey Management: A Review. J. Environ. Manag. 2012, 110, 48–68. [Google Scholar] [CrossRef] [PubMed]
  28. Yadav, J.S.S.; Yan, S.; Pilli, S.; Kumar, L.; Tyagi, R.D.; Surampalli, R.Y. Cheese Whey: A Potential Resource to Transform into Bioprotein, Functional/Nutritional Proteins and Bioactive Peptides. Biotechnol. Adv. 2015, 33, 756–774. [Google Scholar] [CrossRef] [PubMed]
  29. Jauregi, P.; Guo, Y.; Adeloye, J.B. Whey Proteins-Polyphenols Interactions Can Be Exploited to Reduce Astringency or Increase Solubility and Stability of Bioactives in Foods. Food Res. Int. 2021, 141, 110019. [Google Scholar] [CrossRef]
  30. Ming, Y.; Chen, L.; Khan, A.; Wang, H.; Wang, C. Effects of Tea Polyphenols on Physicochemical and Antioxidative Properties of Whey Protein Coating. Food Sci. Biotechnol. 2020, 29, 1655–1663. [Google Scholar] [CrossRef]
  31. Kasapoğlu, K.N.; Gültekin-Özgüven, M.; Kruger, J.; Frank, J.; Bayramoğlu, P.; Barla-Demirkoz, A.; Özçelik, B. Effect of Spray Drying on Physicochemical Stability and Antioxidant Capacity of Rosa Pimpinellifolia Fruit Extract-Loaded Liposomes Conjugated with Chitosan or Whey Protein during In Vitro Digestion. Food Bioprocess Technol. 2024. [Google Scholar] [CrossRef]
  32. Robert, P.; Gorena, T.; Romero, N.; Sepulveda, E.; Chavez, J.; Saenz, C. Encapsulation of Polyphenols and Anthocyanins from Pomegranate (Punica granatum) by Spray Drying. Int. J. Food Sci. Technol. 2010, 45, 1386–1394. [Google Scholar] [CrossRef]
  33. Calva-Estrada, S.J.; Lugo-Cervantes, E.; Jiménez-Fernández, M. Microencapsulation of Cocoa Liquor Nanoemulsion with Whey Protein Using Spray Drying to Protection of Volatile Compounds and Antioxidant Capacity. J. Microencapsul. 2019, 36, 447–458. [Google Scholar] [CrossRef]
  34. Damerau, A.; Ogrodowska, D.; Banaszczyk, P.; Dajnowiec, F.; Tańska, M.; Linderborg, K.M. Baltic Herring (Clupea harengus membras) Oil Encapsulation by Spray Drying Using a Rice and Whey Protein Blend as a Coating Material. J. Food Eng. 2022, 314, 110769. [Google Scholar] [CrossRef]
  35. Baba, W.N.; McClements, D.J.; Maqsood, S. Whey Protein–Polyphenol Conjugates and Complexes: Production, Characterization, and Applications. Food Chem. 2021, 365, 130455. [Google Scholar] [CrossRef]
  36. Quan, T.H.; Benjakul, S.; Sae-leaw, T.; Balange, A.K.; Maqsood, S. Protein–Polyphenol Conjugates: Antioxidant Property, Functionalities and Their Applications. Trends Food Sci. Technol. 2019, 91, 507–517. [Google Scholar] [CrossRef]
  37. FAOSTAT. Available online: https://www.fao.org/faostat/en/#data/QCL (accessed on 26 June 2024).
  38. Park, Y.W. Hypo-Allergenic and Therapeutic Significance of Goat Milk. Small Rumin. Res. 1994, 14, 151–159. [Google Scholar] [CrossRef]
  39. Park, Y.W.; Juárez, M.; Ramos, M.; Haenlein, G.F.W. Physico-Chemical Characteristics of Goat and Sheep Milk. Small Rumin. Res. 2007, 68, 88–113. [Google Scholar] [CrossRef]
  40. Alférez, M.J.M.; Barrionuevo, M.; Aliaga, I.L.; Sanz-Sampelayo, M.R.; Lisbona, F.; Robles, J.C.; Campos, M.S. Digestive Utilization of Goat and Cow Milk Fat in Malabsorption Syndrome. J. Dairy Res. 2001, 68, 451–461. [Google Scholar] [CrossRef]
  41. Campos, M.I.F.; Barbosa, P.P.D.S.; Camargo, L.J.; Pinto, L.D.S.; Mataribu, B.; Serrão, C.; Marques-Santos, L.F.; Lopes, J.H.; de Oliveira, J.M.C.; Gadelha, C.A.D.A.; et al. Characterization of Goat Whey Proteins and Their Bioactivity and Toxicity Assay. Food Biosci. 2022, 46, 101591. [Google Scholar] [CrossRef]
  42. Šelo, G.; Planinić, M.; Tišma, M.; Martinović, J.; Perković, G.; Bucić-Kojić, A. Bioconversion of Grape Pomace with Rhizopus Oryzae under Solid-State Conditions: Changes in the Chemical Composition and Profile of Phenolic Compounds. Microorganisms 2023, 11, 956. [Google Scholar] [CrossRef] [PubMed]
  43. Martinović, J.; Lukinac, J.; Jukić, M.; Ambrus, R.; Planinić, M.; Šelo, G.; Klarić, A.-M.; Perković, G.; Bucić-Kojić, A. In Vitro Bioaccessibility Assessment of Phenolic Compounds from Encapsulated Grape Pomace Extract by Ionic Gelation. Molecules 2023, 28, 5285. [Google Scholar] [CrossRef] [PubMed]
  44. Vu, H.T.; Scarlett, C.J.; Vuong, Q.V. Encapsulation of Phenolic-Rich Extract from Banana (Musa cavendish) Peel. J. Food Sci. Technol. 2020, 57, 2089–2098. [Google Scholar] [CrossRef]
  45. Tolun, A.; Altintas, Z.; Artik, N. Microencapsulation of Grape Polyphenols Using Maltodextrin and Gum Arabic as Two Alternative Coating Materials: Development and Characterization. J. Biotechnol. 2016, 239, 23–33. [Google Scholar] [CrossRef]
  46. Kelly, G.M.; O’Mahony, J.A.; Kelly, A.L.; O’Callaghan, D.J. Effect of Hydrolyzed Whey Protein on Surface Morphology, Water Sorption, and Glass Transition Temperature of a Model Infant Formula. J. Dairy Sci. 2016, 99, 6961–6972. [Google Scholar] [CrossRef] [PubMed]
  47. Catalkaya, G.; Guldiken, B.; Capanoglu, E. Encapsulation of Anthocyanin-Rich Extract from Black Chokeberry (Aronia melanocarpa) Pomace by Spray Drying Using Different Coating Materials. Food Funct. 2022, 13, 11579–11591. [Google Scholar] [CrossRef]
  48. Lee, C.-W.; Oh, H.-J.; Han, S.-H.; Lim, S. Effects of Hot Air and Freeze Drying Methods on Physicochemical Properties of Citrus “Hallabong” Powders. Food Sci. Biotechnol. 2012, 21, 1633–1639. [Google Scholar] [CrossRef]
  49. Boyano-Orozco, L.; Gallardo-Velázquez, T.; Meza-Márquez, O.G.; Osorio-Revilla, G. Microencapsulation of Rambutan Peel Extract by Spray Drying. Foods 2020, 9, 899. [Google Scholar] [CrossRef]
  50. Kalušević, A.M.; Lević, S.M.; Čalija, B.R.; Milić, J.R.; Pavlović, V.B.; Bugarski, B.M.; Nedović, V.A. Effects of Different Carrier Materials on Physicochemical Properties of Microencapsulated Grape Skin Extract. J Food Sci. Technol. 2017, 54, 3411–3420. [Google Scholar] [CrossRef]
  51. Šelo, G.; Planinić, M.; Tišma, M.; Klarić, A.-M.; Bucić-Kojić, A. Effects of Fungal Solid-State Fermentation on the Profile of Phenolic Compounds and on the Nutritional Properties of Grape Pomace. Microorganisms 2024, 12, 1310. [Google Scholar] [CrossRef]
  52. Koc, B.; Yilmazer, M.S.; Balkır, P.; Ertekin, F.K. Spray Drying of Yogurt: Optimization of Process Conditions for Improving Viability and Other Quality Attributes. Dry. Technol. 2010, 28, 495–507. [Google Scholar] [CrossRef]
  53. Roccia, P.; Martínez, M.L.; Llabot, J.M.; Ribotta, P.D. Influence of Spray-Drying Operating Conditions on Sunflower Oil Powder Qualities. Powder Technol. 2014, 254, 307–313. [Google Scholar] [CrossRef]
  54. Ziaee, A.; Albadarin, A.B.; Padrela, L.; Femmer, T.; O’Reilly, E.; Walker, G. Spray Drying of Pharmaceuticals and Biopharmaceuticals: Critical Parameters and Experimental Process Optimization Approaches. Eur. J. Pharm. Sci. 2019, 127, 300–318. [Google Scholar] [CrossRef]
  55. Pino, J.A.; Aragüez-Fortes, Y.; Bringas-Lantigua, M. Optimization of Spray-Drying Process for Concentrated Orange Juice. Acta Aliment. 2018, 47, 417–424. [Google Scholar] [CrossRef]
  56. Moreno, T.; de Paz, E.; Navarro, I.; Rodríguez-Rojo, S.; Matías, A.; Duarte, C.; Sanz-Buenhombre, M.; Cocero, M.J. Spray Drying Formulation of Polyphenols-Rich Grape Marc Extract: Evaluation of Operating Conditions and Different Natural Carriers. Food Bioprocess Technol. 2016, 9, 2046–2058. [Google Scholar] [CrossRef]
  57. Moreno, T.; Cocero, M.J.; Rodríguez-Rojo, S. Storage Stability and Simulated Gastrointestinal Release of Spray Dried Grape Marc Phenolics. Food Bioprod. Process. 2018, 112, 96–107. [Google Scholar] [CrossRef]
  58. Rafiq, S.; Nayik, G.A.; Kaul, R.; Kumar, H.; Rodriguez, A.R. Utilization of Maltodextrin and Whey Protein Concentrate for Micro-Encapsulation of Kinnow Peel Extract in Breadsticks. Curr. Nutr. Food Sci. 2023, 19, 188–196. [Google Scholar] [CrossRef]
  59. Siacor, F.D.C.; Lim, K.J.A.; Cabajar, A.A.; Lobarbio, C.F.Y.; Lacks, D.J.; Taboada, E.B. Physicochemical Properties of Spray-Dried Mango Phenolic Compounds Extracts. J. Agric. Food Res. 2020, 2, 100048. [Google Scholar] [CrossRef]
  60. Giacosa, S.; Ferrero, L.; Paissoni, M.A.; Río Segade, S.; Gerbi, V.; Rolle, L. Grape Skin Anthocyanin Extraction from Red Varieties during Simulated Maceration: Influence of Grape Seeds and Pigments Adsorption on Their Surface. Food Chem. 2023, 424, 136463. [Google Scholar] [CrossRef]
  61. Jackman, R.L.; Yada, R.Y.; Tung, M.A.; Speers, R.A. Anthocyanins as Food Colorants—A Review. J. Food Biochem. 1987, 11, 201–247. [Google Scholar] [CrossRef]
  62. Sinopoli, A.; Calogero, G.; Bartolotta, A. Computational Aspects of Anthocyanidins and Anthocyanins: A Review. Food Chem. 2019, 297, 124898. [Google Scholar] [CrossRef] [PubMed]
  63. Fracassetti, D.; Del Bo’, C.; Simonetti, P.; Gardana, C.; Klimis-Zacas, D.; Ciappellano, S. Effect of Time and Storage Temperature on Anthocyanin Decay and Antioxidant Activity in Wild Blueberry (Vaccinium angustifolium) Powder. J. Agric. Food Chem. 2013, 61, 2999–3005. [Google Scholar] [CrossRef]
  64. Teleszko, M.; Nowicka, P.; Wojdyło, A. Effect of Cultivar and Storage Temperature on Identification and Stability of Polyphenols in Strawberry Cloudy Juices. J. Food Compos. Anal. 2016, 54, 10–19. [Google Scholar] [CrossRef]
  65. Perković, G.; Martinović, J.; Šelo, G.; Bucić-Kojić, A.; Planinić, M.; Ambrus, R. Characterization of Grape Pomace Extract Microcapsules: The Influence of Carbohydrate Co-Coating on the Stabilization of Goat Whey Protein as a Primary Coating. Foods 2024, 13, 1346. [Google Scholar] [CrossRef] [PubMed]
Figure 1. Three-dimensional response surface plots of the simultaneous interaction of spray drying parameters—inlet air temperature (Ti) and proportion of GW (R) at 8 mL/min (feed flow (Q))—on MC properties: (a) total phenolic compounds (TPCs); (b) surface phenolic compound (SPCs); (c) encapsulation efficiency (EE); (d) moisture content (wm); (e) encapsulation yield (Y).
Coatings 14 01101 g001aCoatings 14 01101 g001b
Figure 2. Three-dimensional response surface plots of the simultaneous interaction of spray drying parameters—inlet air temperature (Ti) and proportion of GW (R) at 8 mL/min (feed flow (Q))—on MC properties: (a) water solubility index (WSI); (b) water adsorption index (WAI); (c) swelling power (SP); (d) Hausner ratio (HR); (e) Carr index (CI).
Coatings 14 01101 g002
Figure 3. Three-dimensional response surface plots of the simultaneous interaction of spray drying parameters—inlet air temperature (Ti) and proportion of GW (R) at 8 mL/min (feed flow (Q))—on MC properties: (a) lightness (L*); (b) hue (h*); (c) chroma (C*); (d) total colour difference (ΔEab).
Coatings 14 01101 g003
Table 1. Uncoded and coded levels of the independent variables for spray drying.
Independent VariableVariable Levels
−101
Inlet air temperature (Ti, °C)X1160175190
Proportion of GW (R, -)X20.523.5
Feed flow (Q, mL/min)X36810
Table 2. Independent variables of spray drying (Ti, R, Q) and corresponding responses: bulk density (BD), tapped density (TD) and colour parameters (L*—lightness, a*—redness, b*—yellowness).
RunTi
(°C)
R
(–)
Q
(mL/min)
BD
(g/cm3)
TD
(g/cm3)
L*
(–)
a*
(–)
b*
(–)
1170202.00.06 ± 0.000.08 ± 0.0062.75 ± 1.066.12 ± 0.054.49 ± 0.09
2180203.50.07 ± 0.000.08 ± 0.0061.56 ± 2.168.62 ± 0.154.84 ± 0.08
3170250.50.07 ± 0.000.10 ± 0.0063.63 ± 1.198.92 ± 0.133.61 ± 1.08
4180152.00.08 ± 0.000.10 ± 0.0065.28 ± 0.977.73 ± 0.174.34 ± 0.03
5170202.00.13 ± 0.000.20 ± 0.0058.04 ± 2.2113.54 ± 0.484.95 ± 0.11
6160152.00.06 ± 0.000.09 ± 0.0059.30 ± 1.498.16 ± 0.177.44 ± 0.26
7180200.50.15 ± 0.000.25 ± 0.0053.61 ± 2.0311.28 ± 0.274.69 ± 0.09
8170202.00.13 ± 0.000.22 ± 0.0049.36 ± 0.9214.32 ± 0.624.73 ± 0.06
9180252.00.08 ± 0.000.11 ± 0.0062.35 ± 2.078.08 ± 0.094.59 ± 0.16
10170153.50.08 ± 0.000.11 ± 0.0062.60 ± 1.657.11 ± 0.214.19 ± 0.11
11160200.50.08 ± 0.000.10 ± 0.0061.31 ± 2.517.48 ± 0.084.04 ± 0.16
12170253.50.07 ± 0.000.10 ± 0.0062.72 ± 1.159.19 ± 0.554.14 ± 0.10
13170150.50.08 ± 0.000.11 ± 0.0059.74 ± 3.189.39 ± 0.544.38 ± 0.22
14160252.00.07 ± 0.000.10 ± 0.0062.79 ± 1.648.96 ± 0.204.29 ± 0.10
15160203.50.11 ± 0.000.20 ± 0.0051.35 ± 0.7013.96 ± 0.114.03 ± 0.08
The response values are given as the mean ± standard deviation.
Table 3. Coefficients in terms of coded factors (A:Ti, B:R, C:Q) of the spray drying for the dependent variables.
ResponseEstimated Coefficients of Coded Factors ¥
InterceptABCABACBCA2B2C2
TPC120.378.1025−38.7138 **−13.20381.952512.37758.99−1.6821.3375−5.4325
SPC6.491.87−17.5113 **−2.59125 **−2.2650.333.3425 **0.8312514.2738 **−0.13625
EE94.61−0.75389.075 **0.621251.34750.625−0.8125−0.52−6.7125 **−0.695
wm4.92670.5588 **0.05750.40625 **−0.4925−2.49 × 10⁻¹⁷−0.19250.8442 **0.53670.17917
Y78.273−1.38138.505 **1.91375 **0.005−1.913750.225−0.132917−3.20542 **1.67208
WSI51.23−0.413757.01 **−0.35625−1.5925−2.32−2.2825−0.933.12254.71
WAI5.1333−0.0575−0.5025 **−0.07−0.315 **0.42 **−0.045−0.00167−0.1767 **−0.10167
SP10.537−0.38250.66875−0.33875−1.14250.3425−0.87−0.190830.6016670.831667
HR1.4−0.0488 **−0.1413 **0.01750.105 **0.00750.0225−0.0525 **0.1375 **−0.005
CI28.57−1.9363 **−6.1063 **1.094.515 **0.62751.0775−2.975 **6 **−0.2625
L*63.04670.606254.58125 **−0.4125−1.31251.04−1−0.09708−4.58708 **−1.47958
h*23.91−0.6755.95875 **1.748750.99−4.33−0.84253.78625−2.481253.81875
C*9.89−0.0875−2.825 **−0.155−0.2−0.4250.4550.10251.26750.0525
ΔEab23.847−0.4175−4.91 **0.01750.975−0.361.115−0.28334.35167 **0.70167
¥ The estimated coefficient represents the expected change in response per unit change in factor value when all other factors are held constant. The intercept in an orthogonal design is the average total response of all runs. The coefficients are adjustments around this average based on the factor settings. ** Statistically significant coefficient for the model (p < 0.05).
Table 4. Display of values predicted by models and experimentally obtained values for properties of MCs produced by spray drying at optimal conditions (Ti = 173.5 °C, R = 2.5 and Q = 7 mL/min).
Dependent VariablePredicted ValueExperimentally
Determined Value
Deviation (%)
EE (%)96.9595.471.53
wm (%db)4.894.981.81
Y (%)80.2285.176.17
WSI (%)57.9457.470.81
WAI (–)4.984.3712.25
SP (–)11.9310.2813.83
HR (–)1.351.360.74
CI (%)26260
ΔEab (–)24.4823.733.06
Table 5. Individual phenolic compounds and anthocyanins in GPE, MC and MC after one year of storage (MC1y).
CompoundGPE a
(μg/gdb.gp)
MC b
(μg/gdb.mc)
MC1y b
(μg/gdb.mc)
MC1y/MC
(%)
Phenolic compound
Gallic acid741.98 ± 1.10732.71 ± 0.41939.35 ± 10.08128.20
3,4-Dihidroxybenzoic acid73.78 ± 1.1060.22 ± 0.21148.65 ± 2.80246.93
p-Hidroxybenzoic acid23.49 ± 0.4018.39 ± 1.230.90 ± 0.004.89
Procyanidin B1234.14 ± 2.361121.04 ± 48.47275.75 ± 2.0124.60
Catechin5750.57 ± 46.574675.02 ± 99.35735.62 ± 10.0215.74
Vanillic acid42.22 ± 0.4341.55 ± 0.5486.22 ± 1.51207.75
Caffeic acid42.46 ± 0.6423.97 ± 0.28n.d.-
Chlorogenic acid85.52 ± 0.8081.32 ± 1.7324.53 ± 2.9530.17
Syringic acid199.68 ± 14.85122.55 ± 1.838.33 ± 1.626.80
Procyanindin B2687.42 ± 44.271034.65 ± 105.81916.02 ± 4.5988.54
Epicatechin3678.50 ± 7.103284.86 ± 10.781386.56 ± 29.1642.21
p-Coumaric acid7.25 ± 0.5811.55 ± 0.082.16 ± 0.0018.81
Galocatechin gallate1579.11 ± 51.351229.93 ± 25.65738.89 ± 23.1760.08
Ferulic acid4.94 ± 0.183.47 ± 0.063.63 ± 0.18103.74
Epicatechin gallate311.15 ± 9.49168.75 ± 3.2429.48 ± 0.1217.46
o-Coumaric acid26.63 ± 3.9213.49 ± 0.17n.d.-
Ellagic acid131.48 ± 5.6084.07 ± 0.862.36 ± 0.122.81
Rutin267.61 ± 1.38159.54 ± 2.1129.76 ± 2.3618.66
Resveratrol45.85 ± 3.1219.93 ± 0.032.97 ± 0.3114.91
Kaempferol38.60 ± 1.5021.13 ± 0.5519.28 ± 0.5791.39
Quercetin571.57 ± 4.62317.88 ± 2.76337.42 ± 3.26106.14
Anthocyanins
Myrtillin chloride138.41 ± 0.03115.71 ± 3.210.80 ± 0.031.04
Kuromanin chloride11.65 ± 0.317.86 ± 0.600.75 ± 0.069.26
Callistephin chloride170.17 ± 6.43140.75 ± 16.884.82 ± 0.281.65
Peonidin 3-O-glucoside chloride4.26 ± 0.642.78 ± 0.310.47 ± 0.013.57
Oenin chloride899.94 ± 16.26727.24 ± 46.8494.34 ± 3.667.82
Petunidin chloride6.04 ± 0.096.31 ± 2.495.94 ± 0.2811.21
n.d.—not detected. a values of individual phenolics and anthocyanins expressed per dry mass of grape pomace. b values of individual phenolics and anthocyanins expressed per dry mass of MC. The values in the columns are not compared to each other.
Table 6. Antioxidant activity of GPE and MCs.
Antioxidant TestGPE a
(mgTE/gdb.GP)
MC b
(mgTE/gdb.MC)
DPPH62.40 ± 1.5340.91 ± 0.40
ABTS431.89 ± 22.44258.78 ± 22.36
FRAP102.37 ± 2.03164.43 ± 3.30
a antioxidant activity of grape pomace extract expressed as mass of Trolox equivalent per dry mass of grape pomace; b antioxidant activity of microcapsules expressed as mass of Trolox equivalent per dry mass of microcapsules.
Disclaimer/Publisher’s Note: The statements, opinions and data contained in all publications are solely those of the individual author(s) and contributor(s) and not of MDPI and/or the editor(s). MDPI and/or the editor(s) disclaim responsibility for any injury to people or property resulting from any ideas, methods, instructions or products referred to in the content.

