
Study on the Stability of Fe/Al2O3 Interface in Metal-Based Cermets Using Thermodynamic Modeling

Abstract
1. Introduction
2. Calculation Method and Model
2.1. Calculation Method
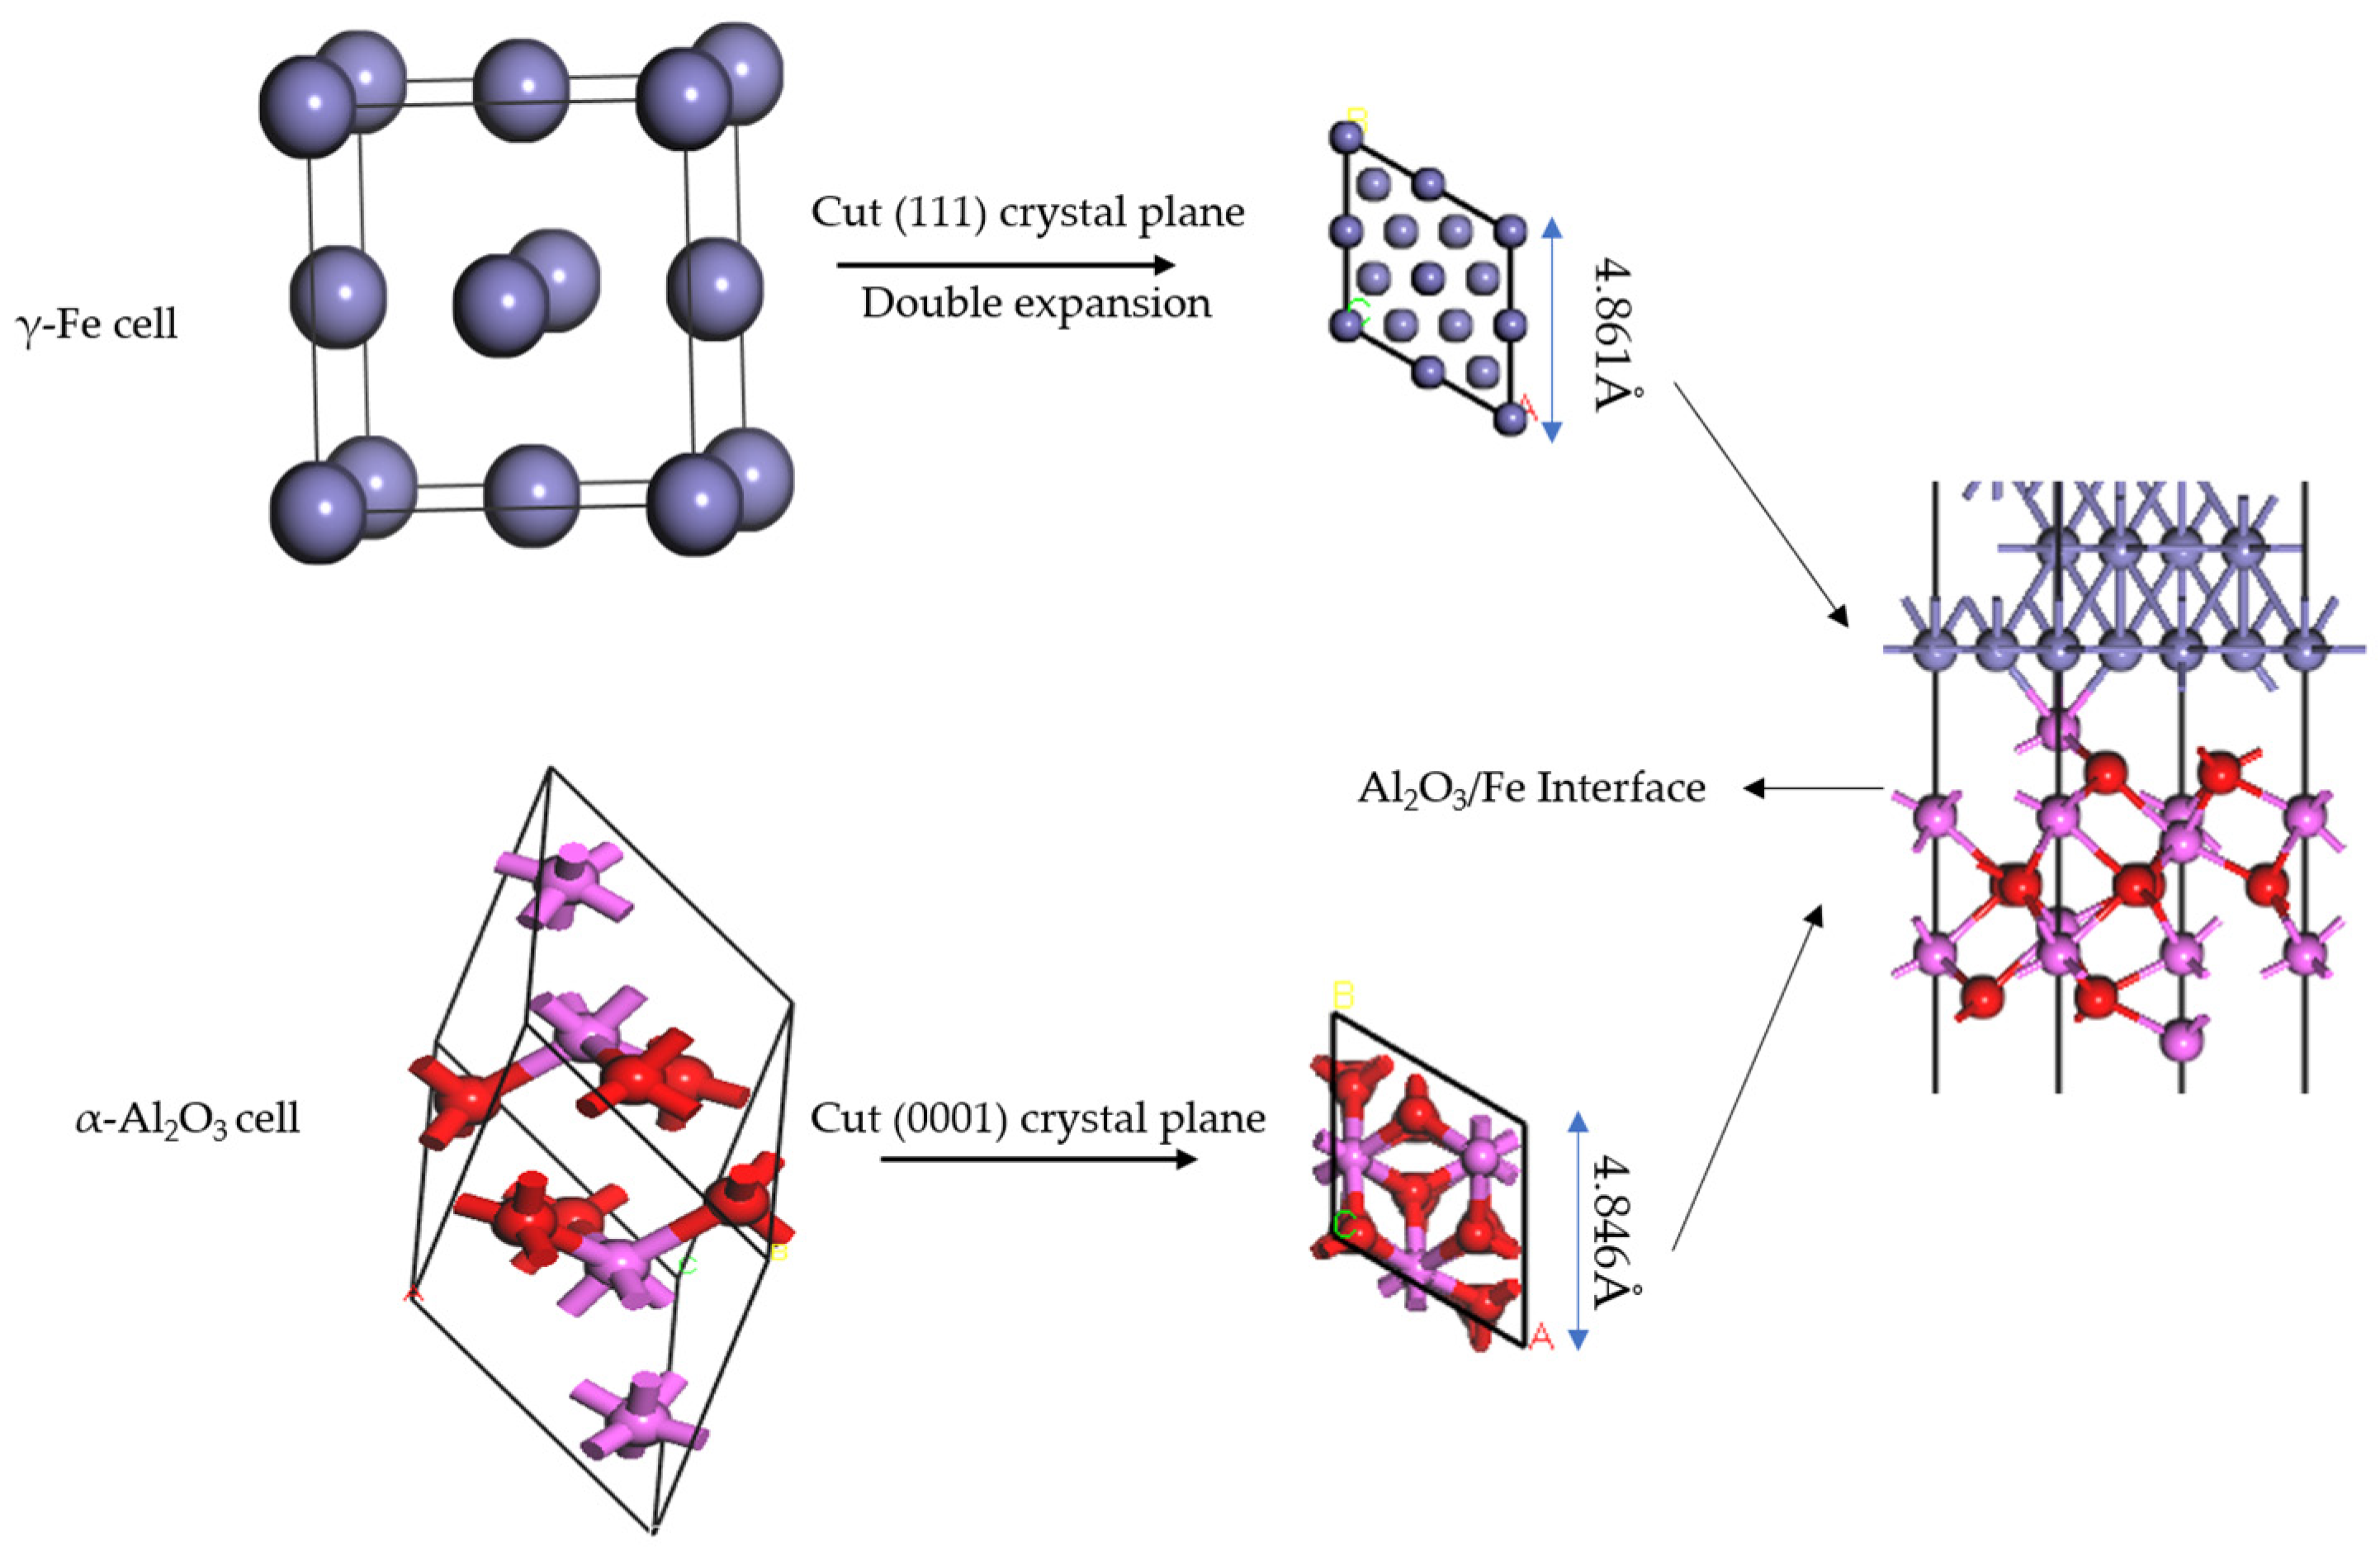
2.2. Model Building
- (I)
- Lattice mismatch rate
- (II)
- Surface atomic terminal category
- (III)
- Number of surface atomic layers
- (IV)
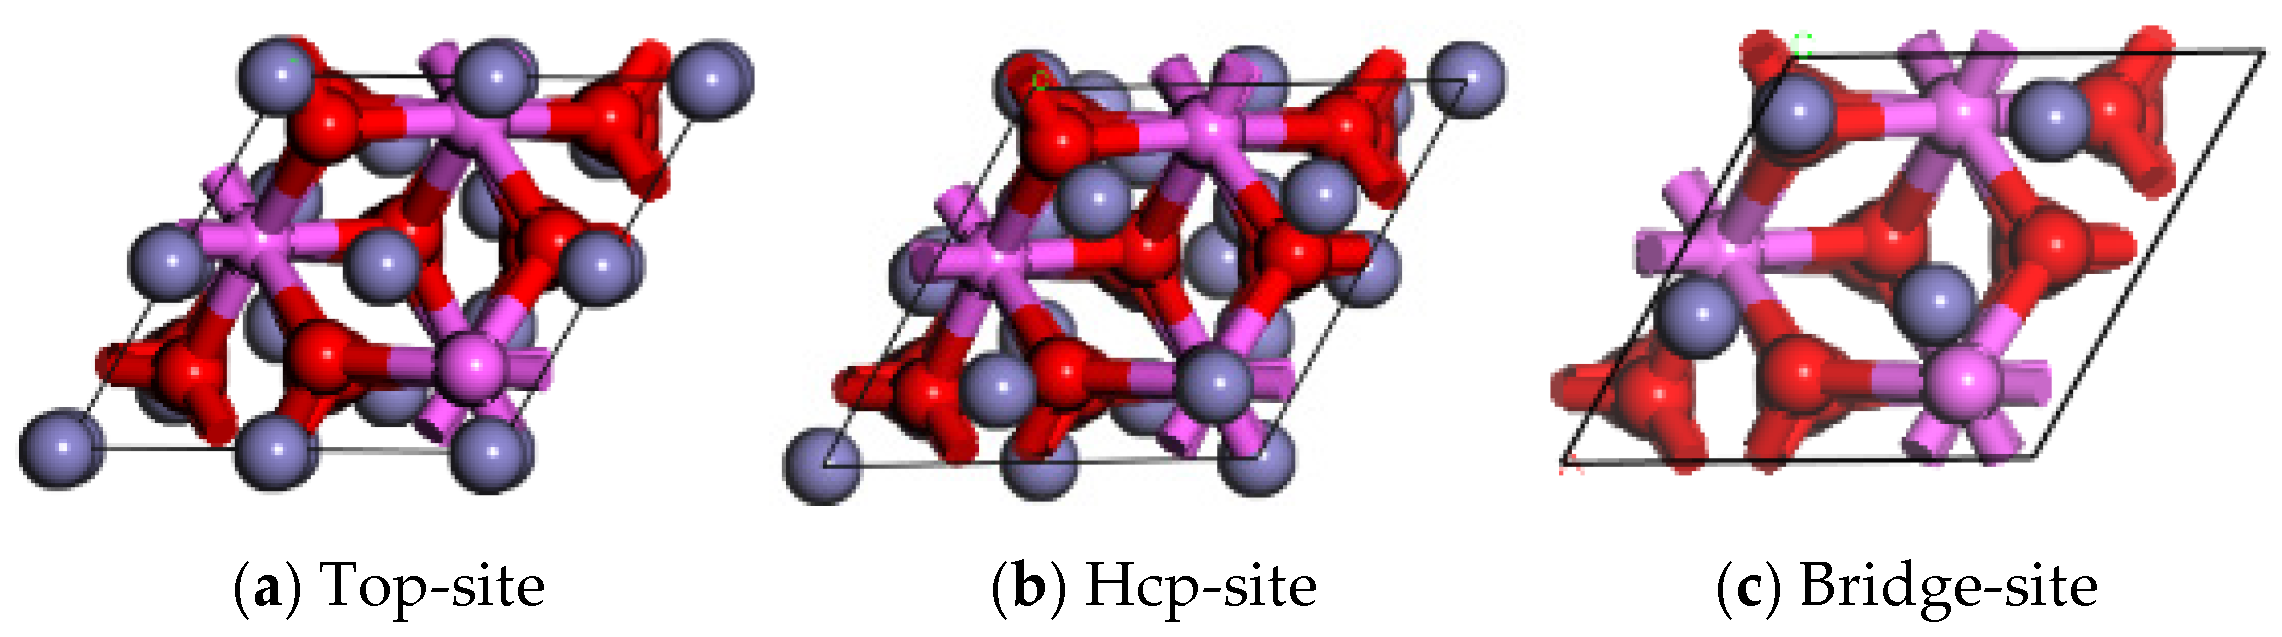
- Stacking sequence of interfacial atoms
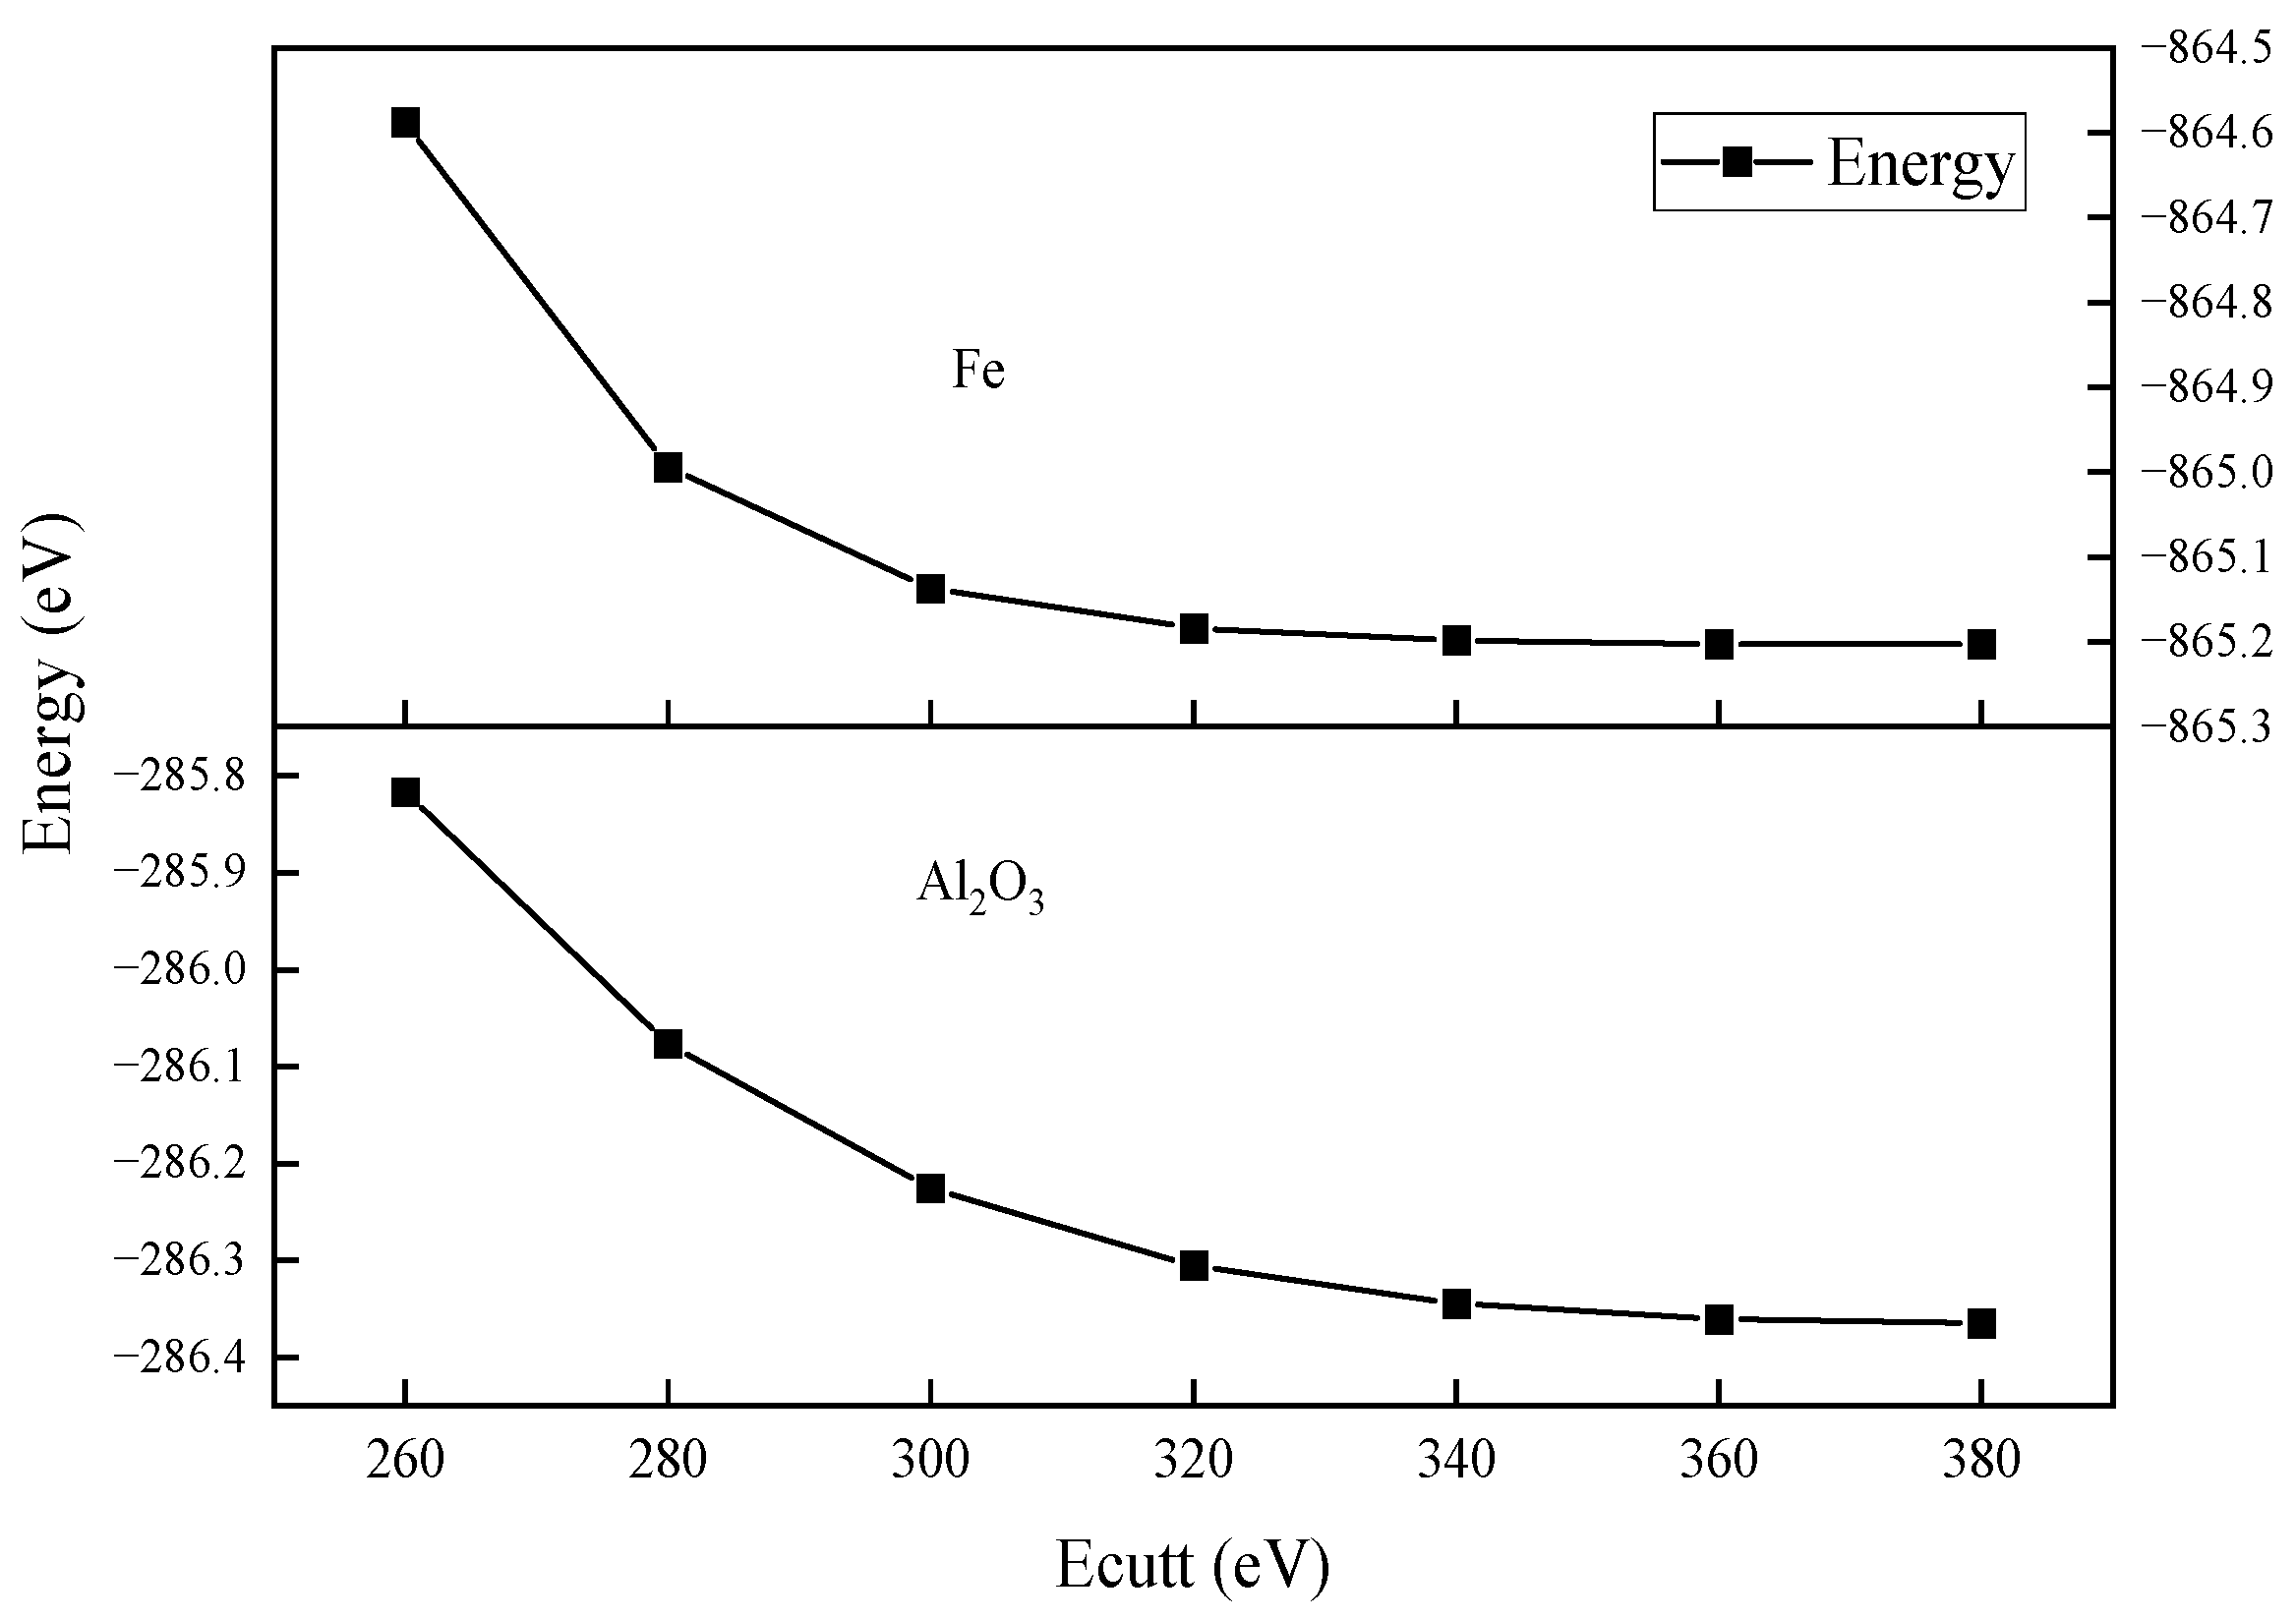
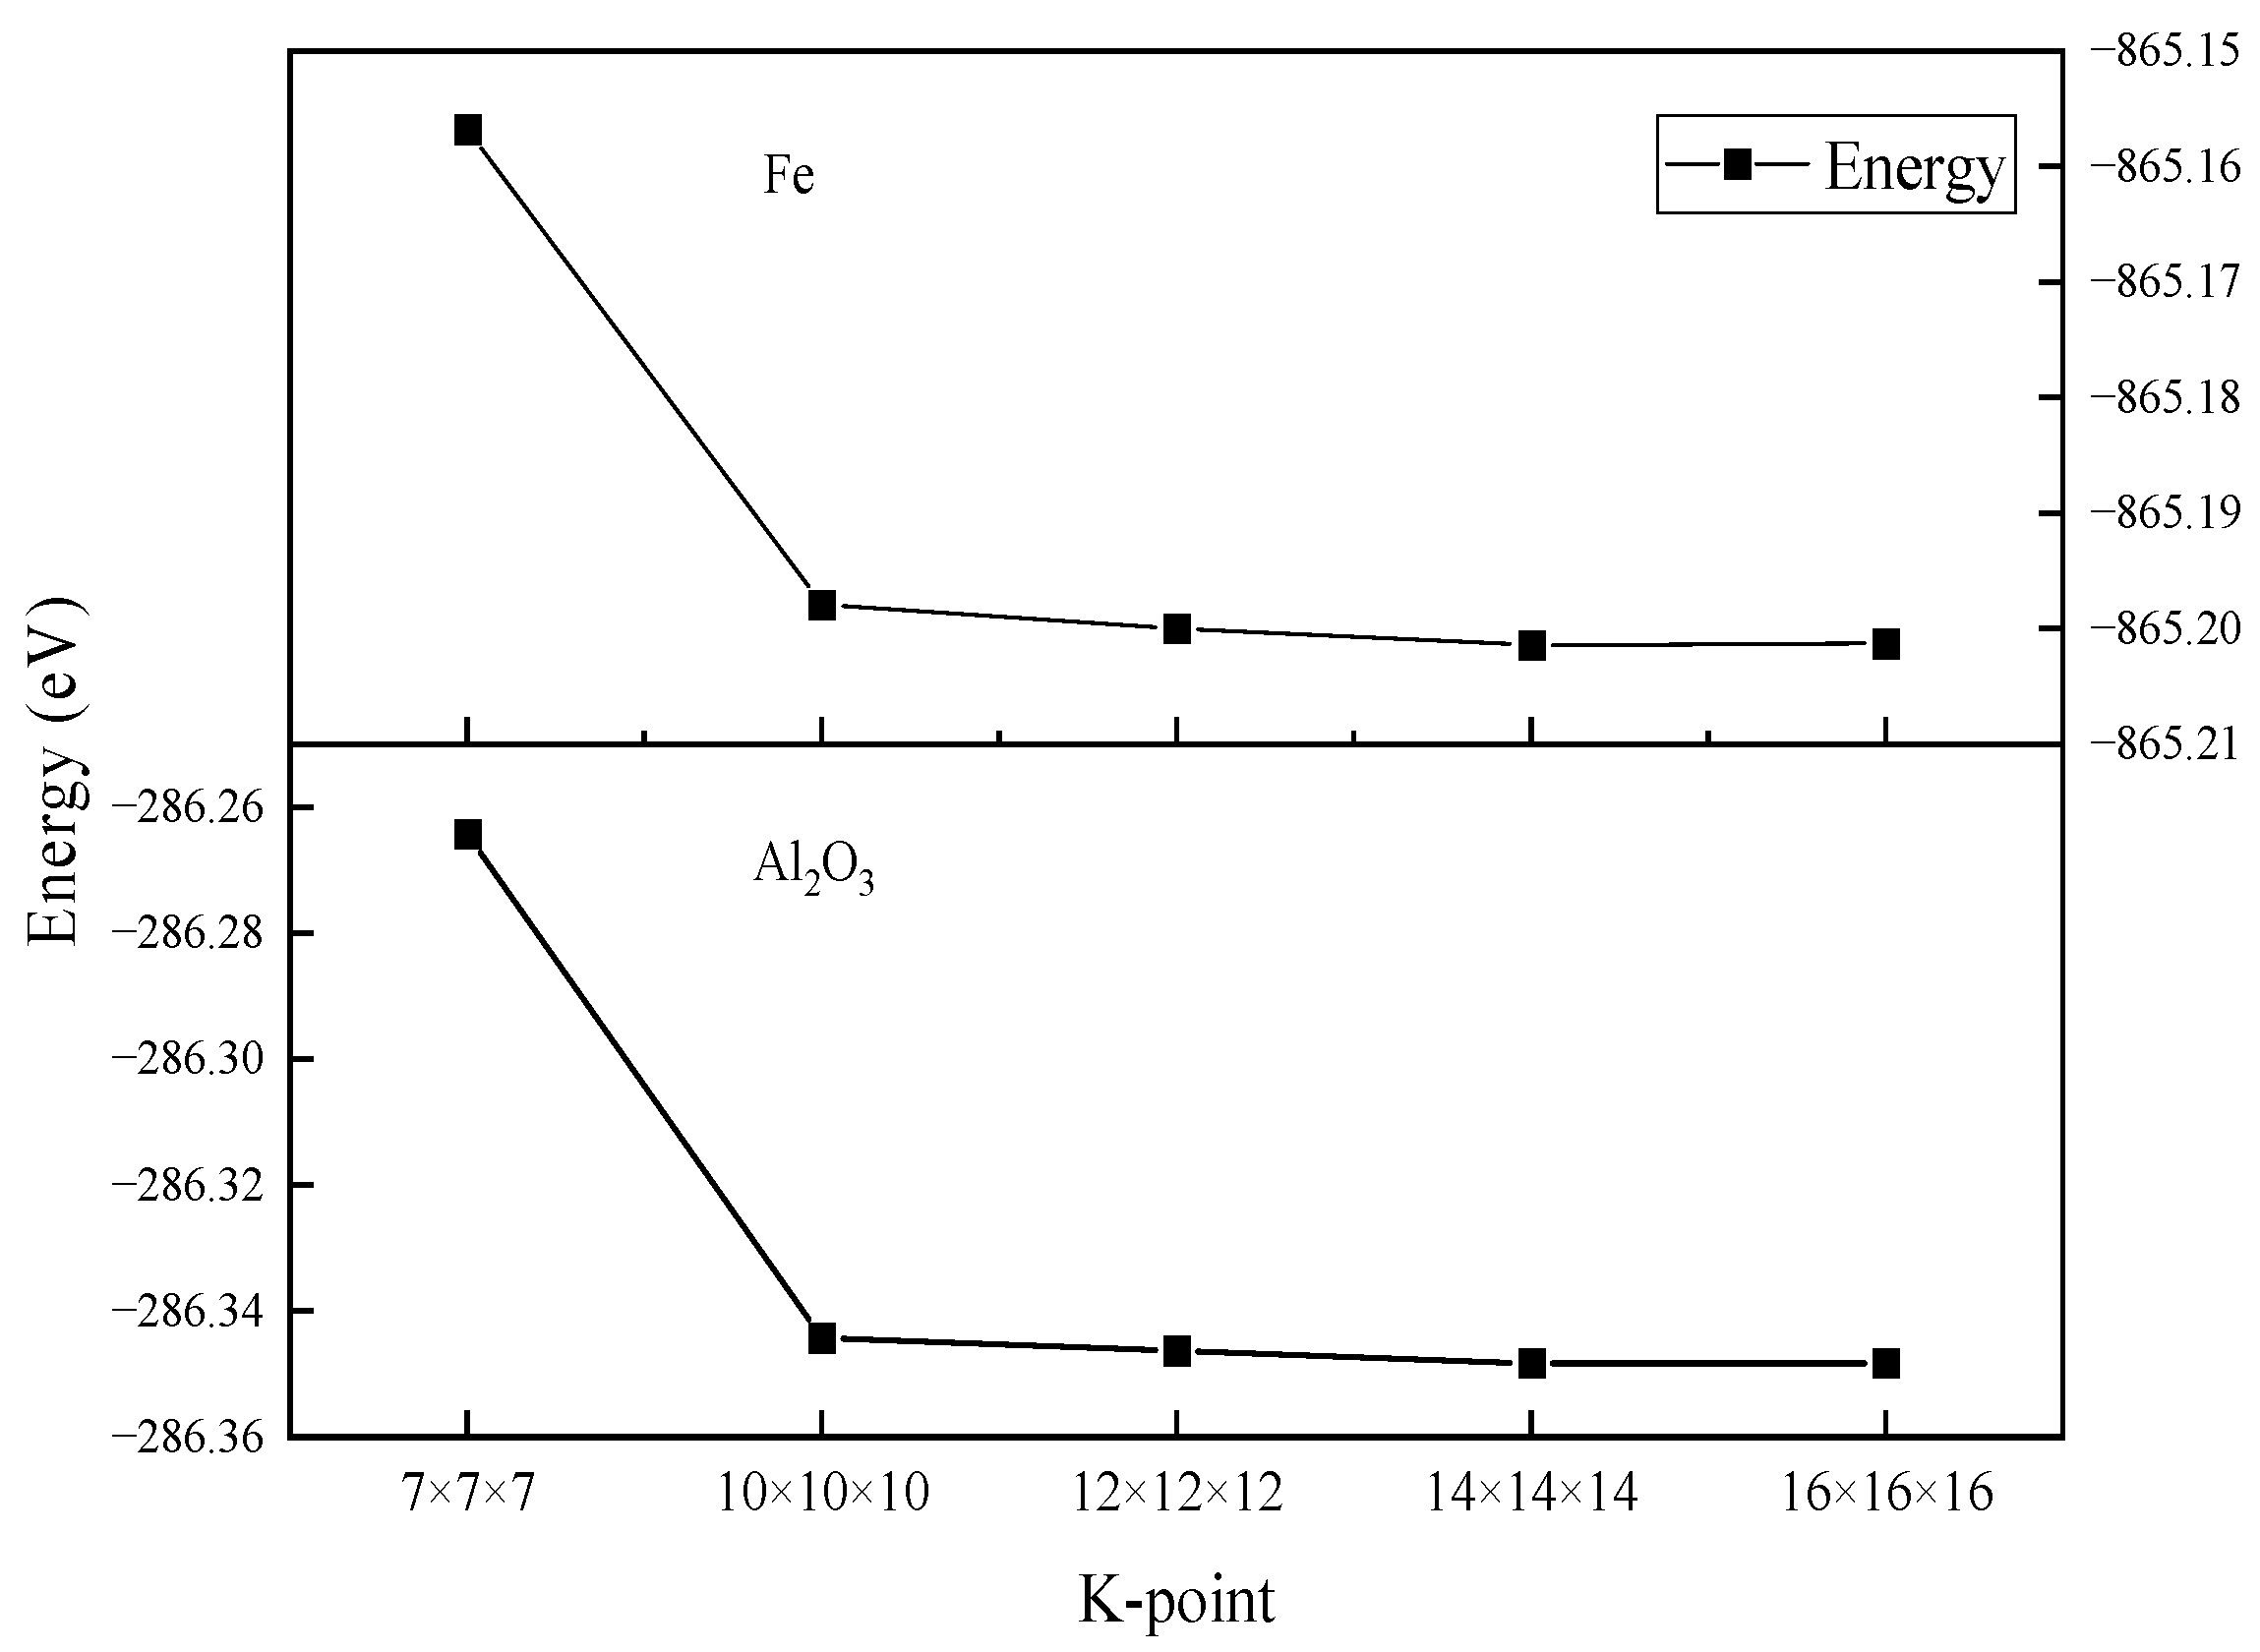
2.3. Parameter Setting
3. Results
3.1. Effect of Thermodynamic Parameters on Interfacial Stability
- (1)
- Interfacial adhesion work
- (2)
- Interfacial energy
3.2. The Influence of Electron Arrangement on the Properties of Interface
4. Discussion
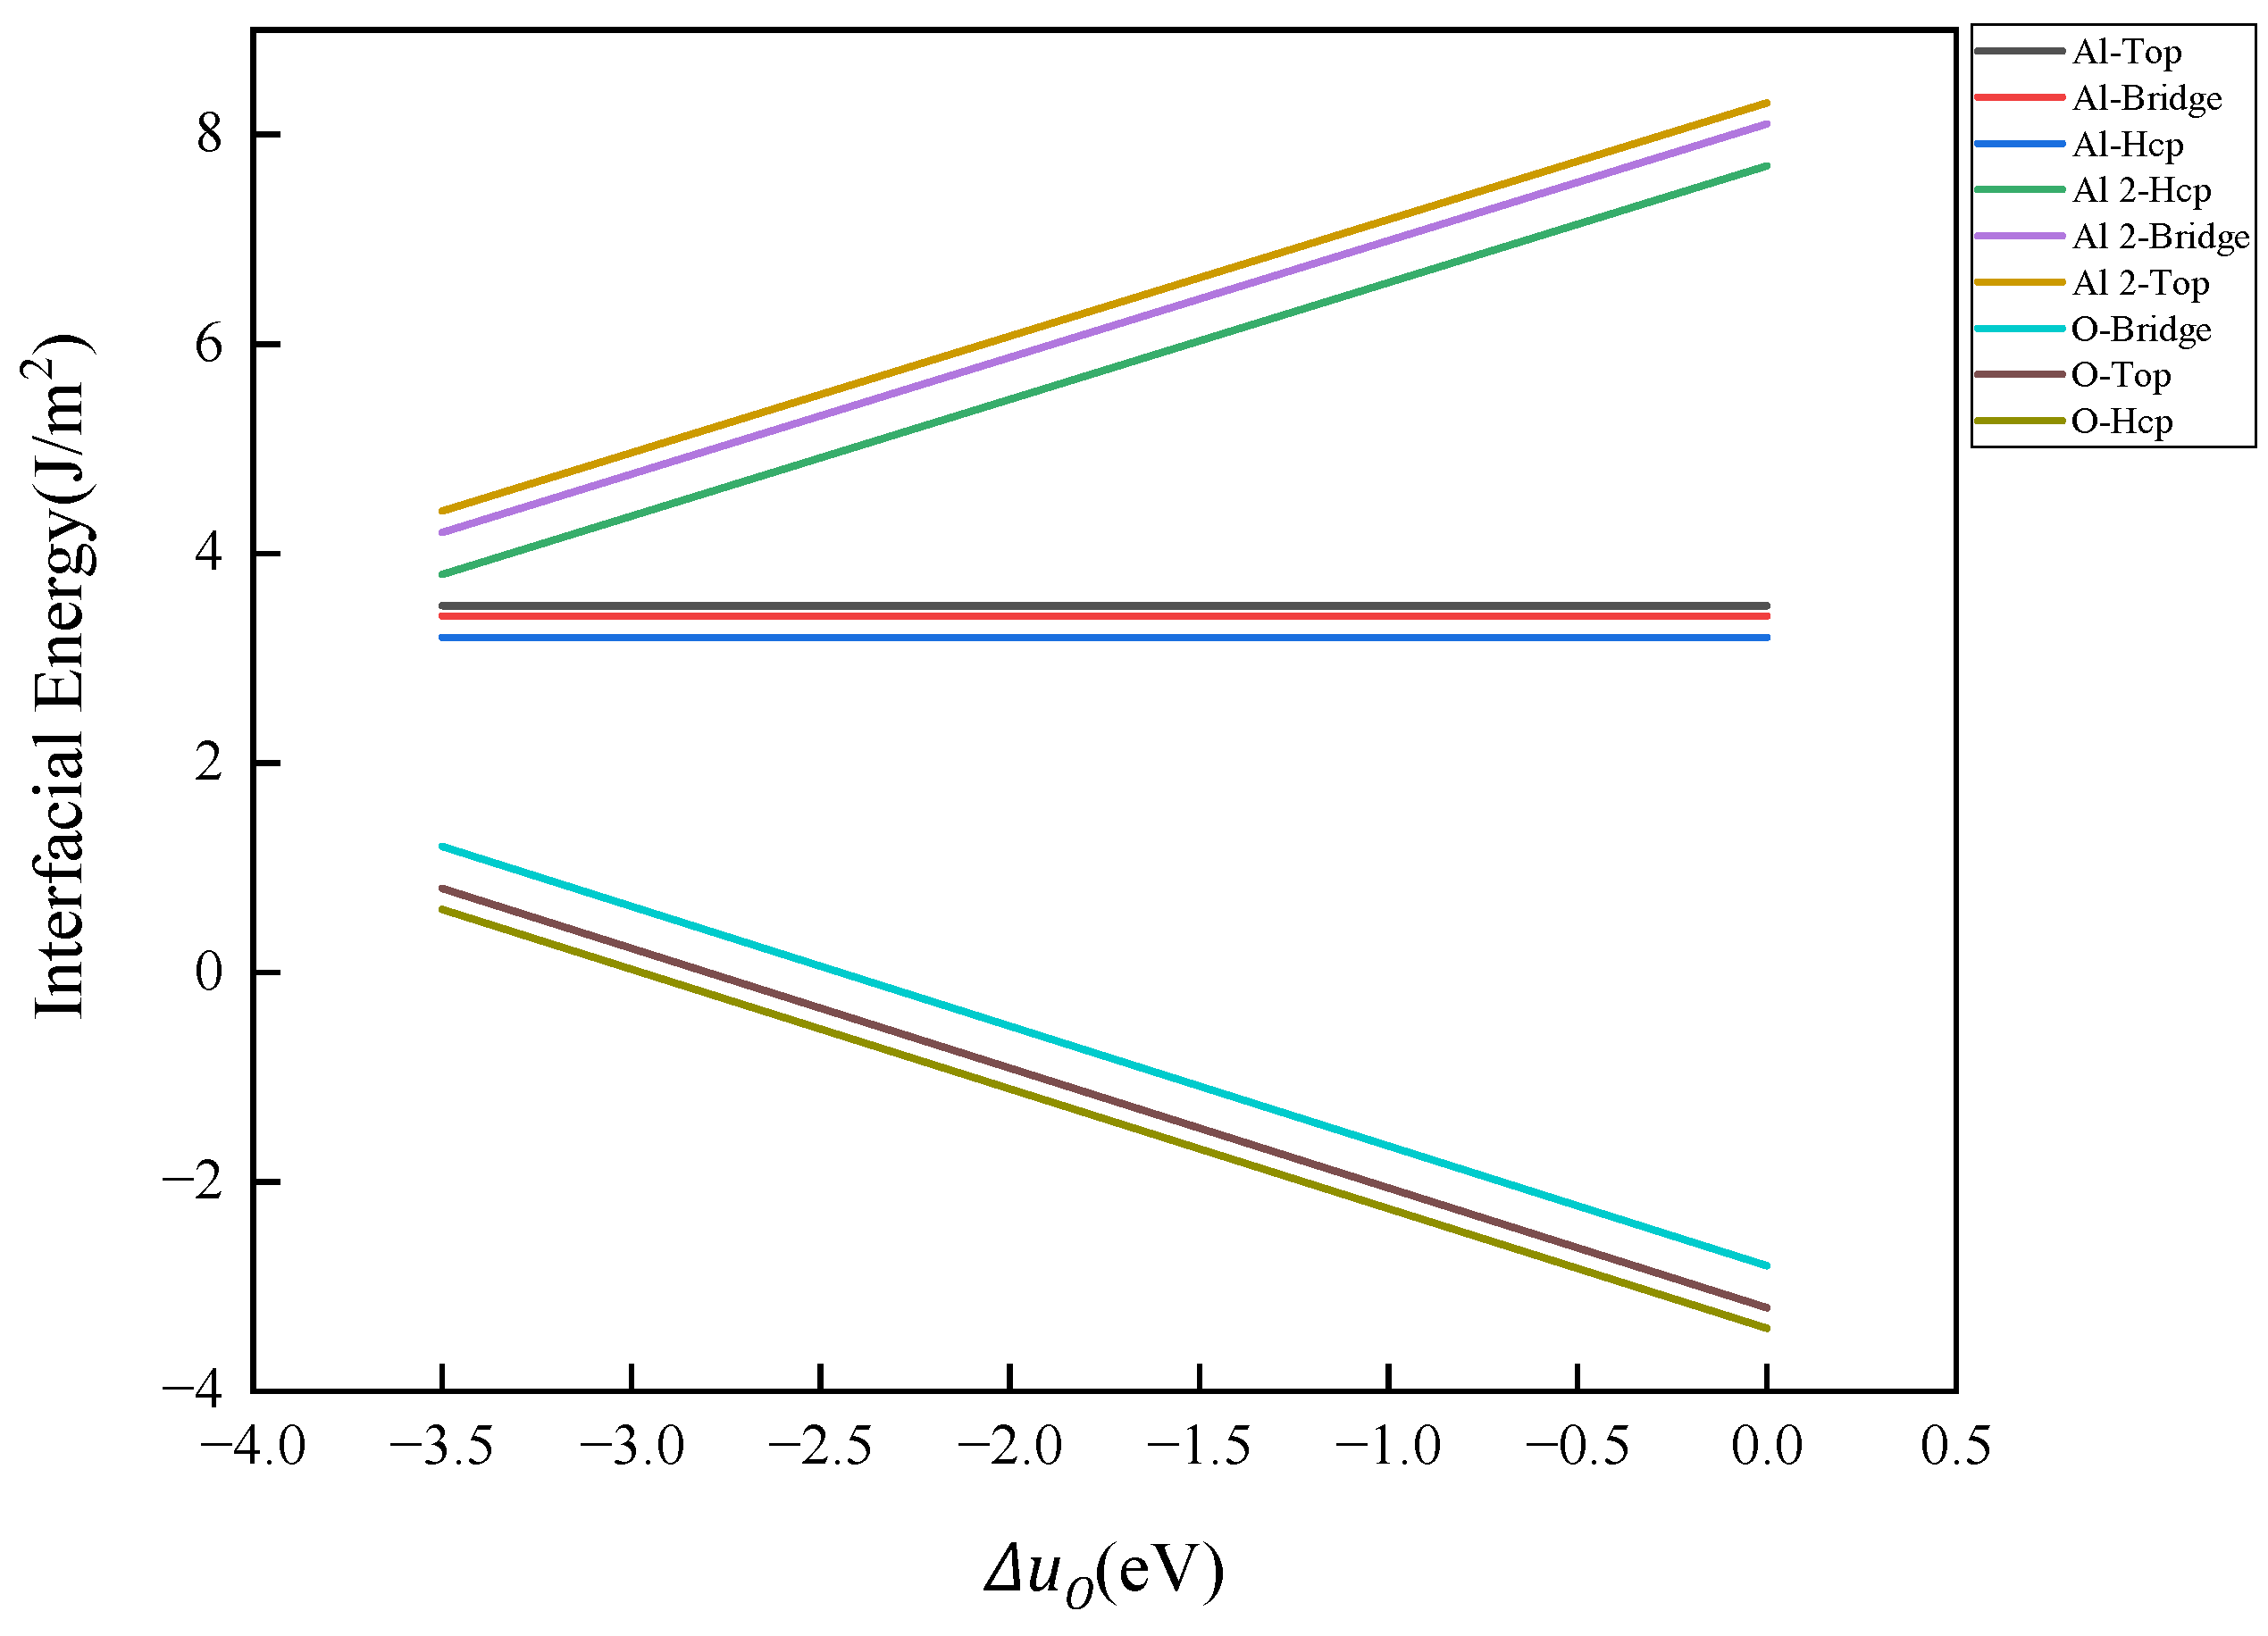
- When the number of atomic layers in Fe reaches 5 or more, the surface energy stabilizes and converges to 2.63 J/m2. The surface energy of Al2O3 is dependent on the type of surface atomic termination. The surface energy of monolayer Al-terminal Al2O3, which maintains a complete stoichiometric ratio, remains unaffected by the chemical potential of elements, yielding a constant value of 1.4 J/m2. In contrast, the surface energies of bilayer Al-terminal and O-terminal Al2O3, which lack a complete stoichiometric ratio, vary linearly with the chemical potential of the oxygen element. As the concentration of oxygen increases, the surface energy of bilayer Al-terminal Al2O3 increases linearly, while the surface energy of O-terminal Al2O3 decreases.
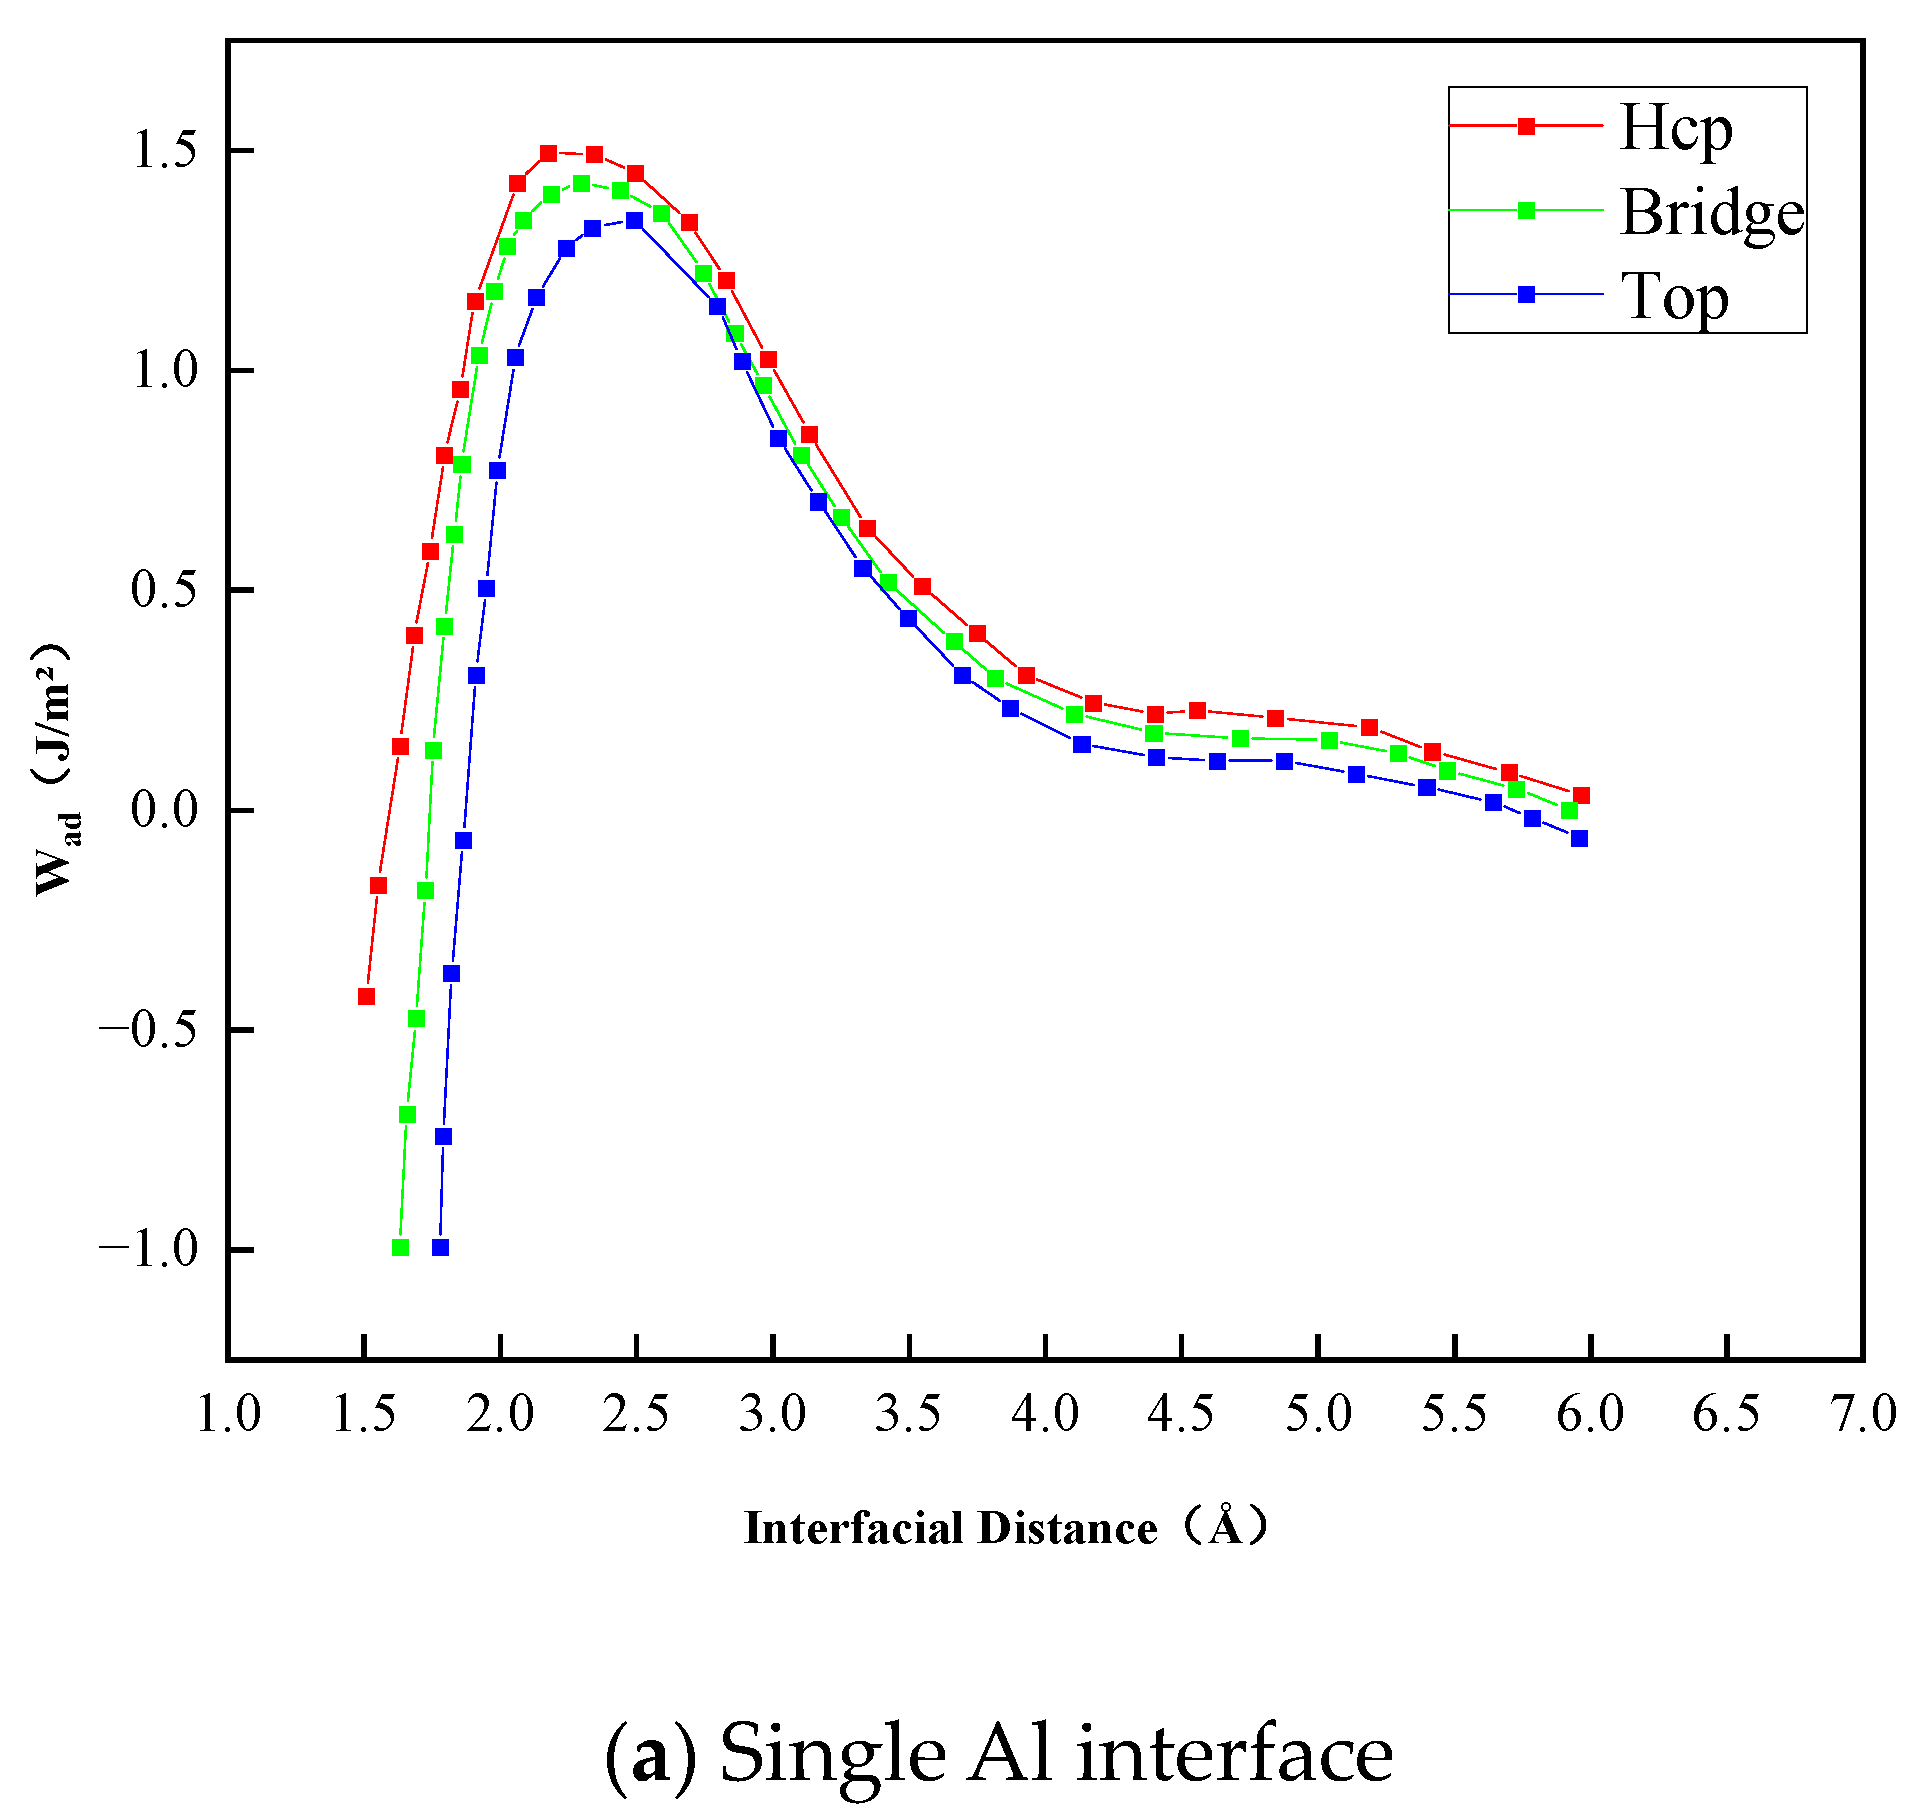
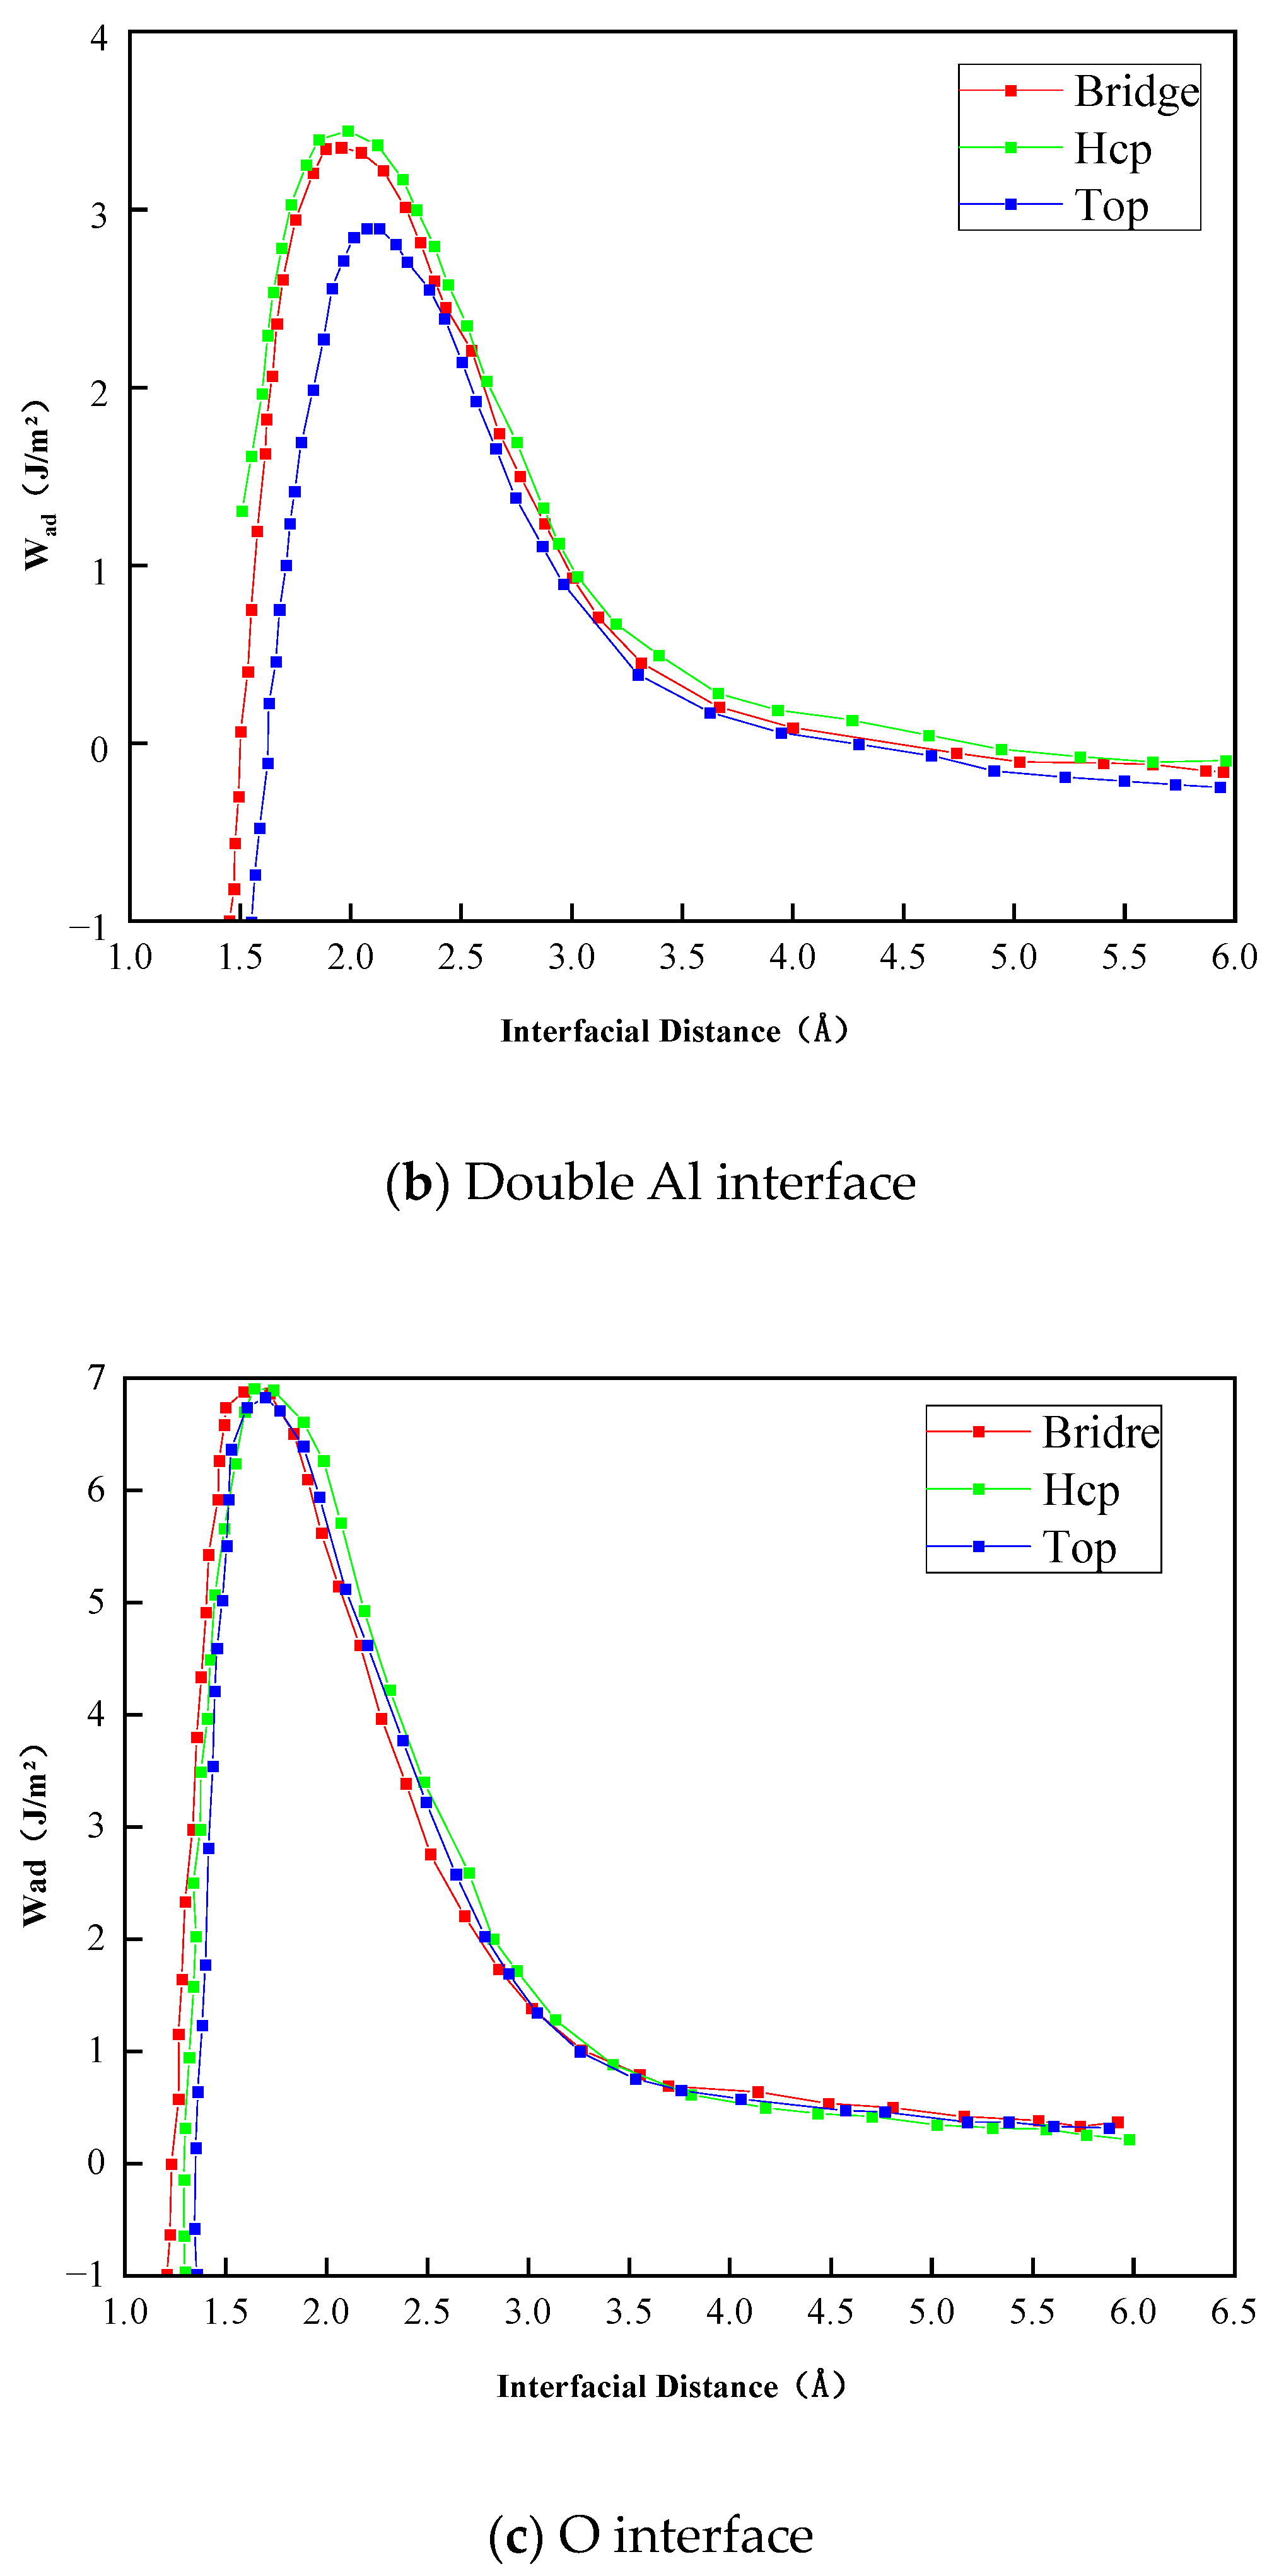
- The Al2O3/Fe interface can be categorized into three types based on bonding configurations: single-Al, double-Al, and O-terminal. Prior to structural optimization, the maximum adhesion work is observed for single-Al (Hcp 1.35 J/m2), double-Al (Hcp 3.62 J/m2), and O-terminal (Hcp 7.23 J/m2). Following structural optimization, the maximum bonding energies are observed as single-Al (Hcp 0.56 J/m2), double-Al (Hcp 3.82 J/m2), and O-terminal (Top 9.35 J/m2). Thus, the order of interface bonding strength is O > double-layer Al > single-layer Al. Notably, the maximum adhesion work of the O-terminal interface structure, both before and after optimization, is significantly greater than that of the Al-terminal interfaces. This indicates that the bonding mode at the Al2O3/Fe interface substantially influences interface stability.
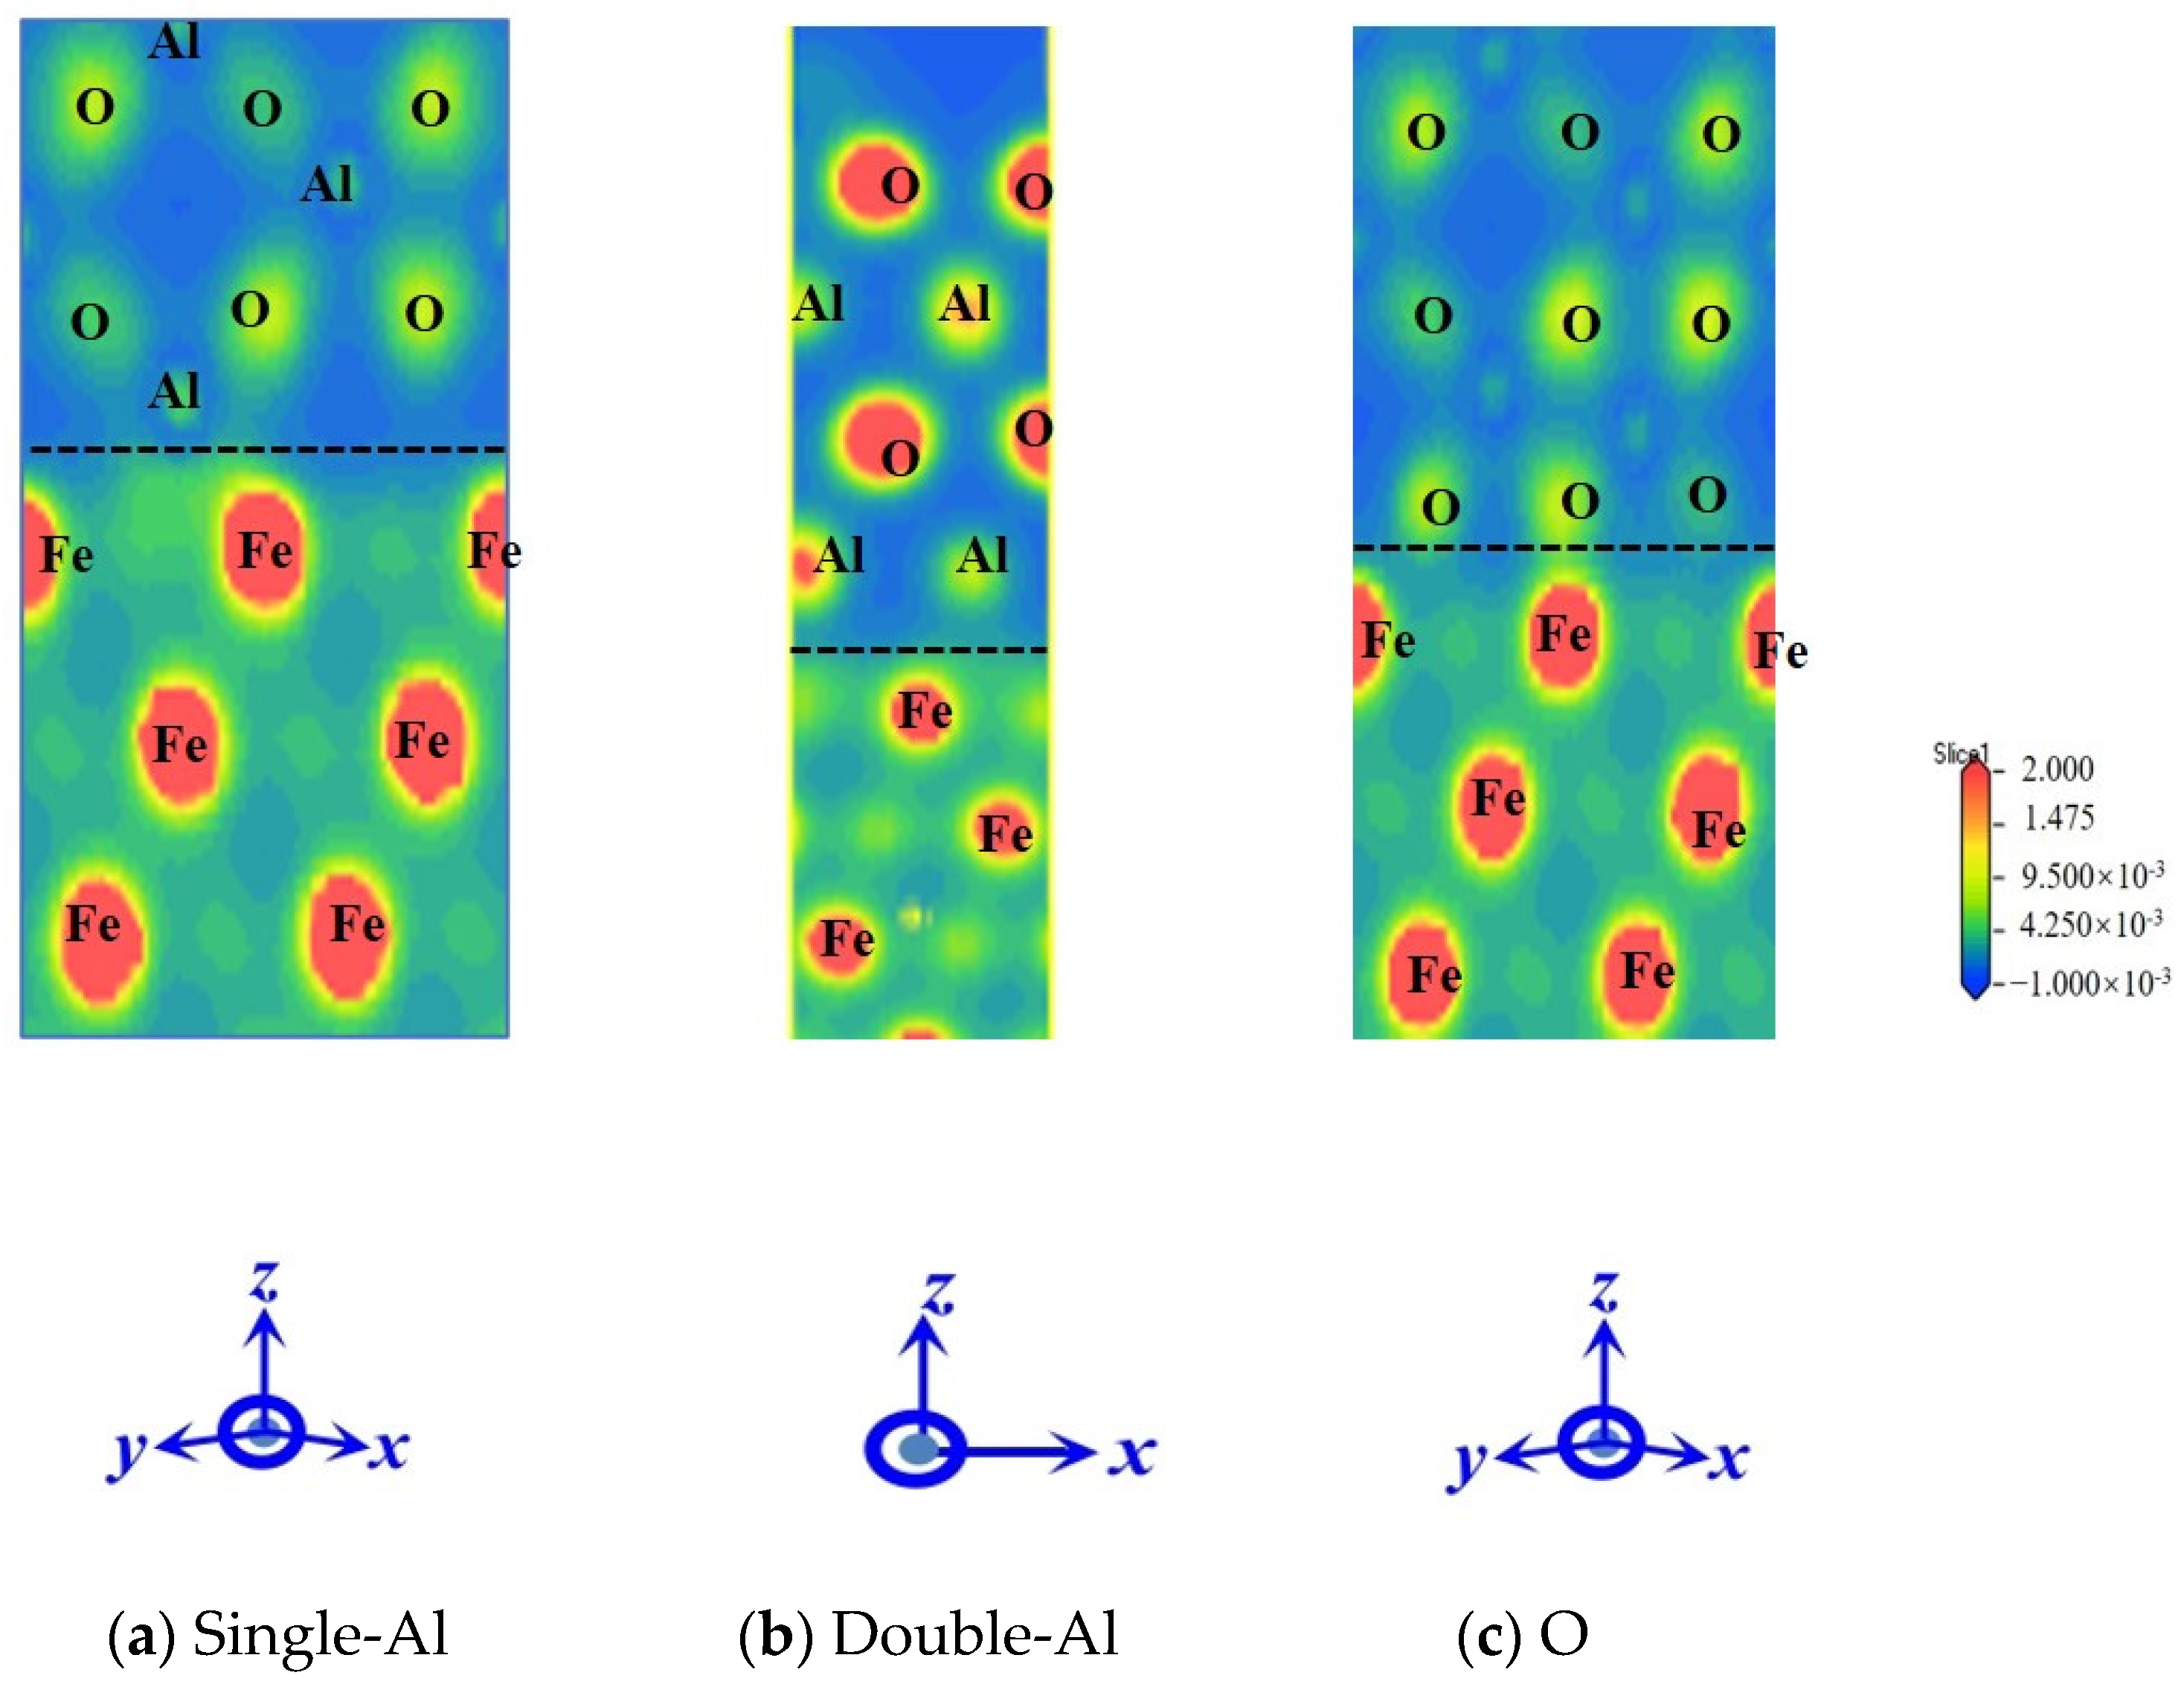
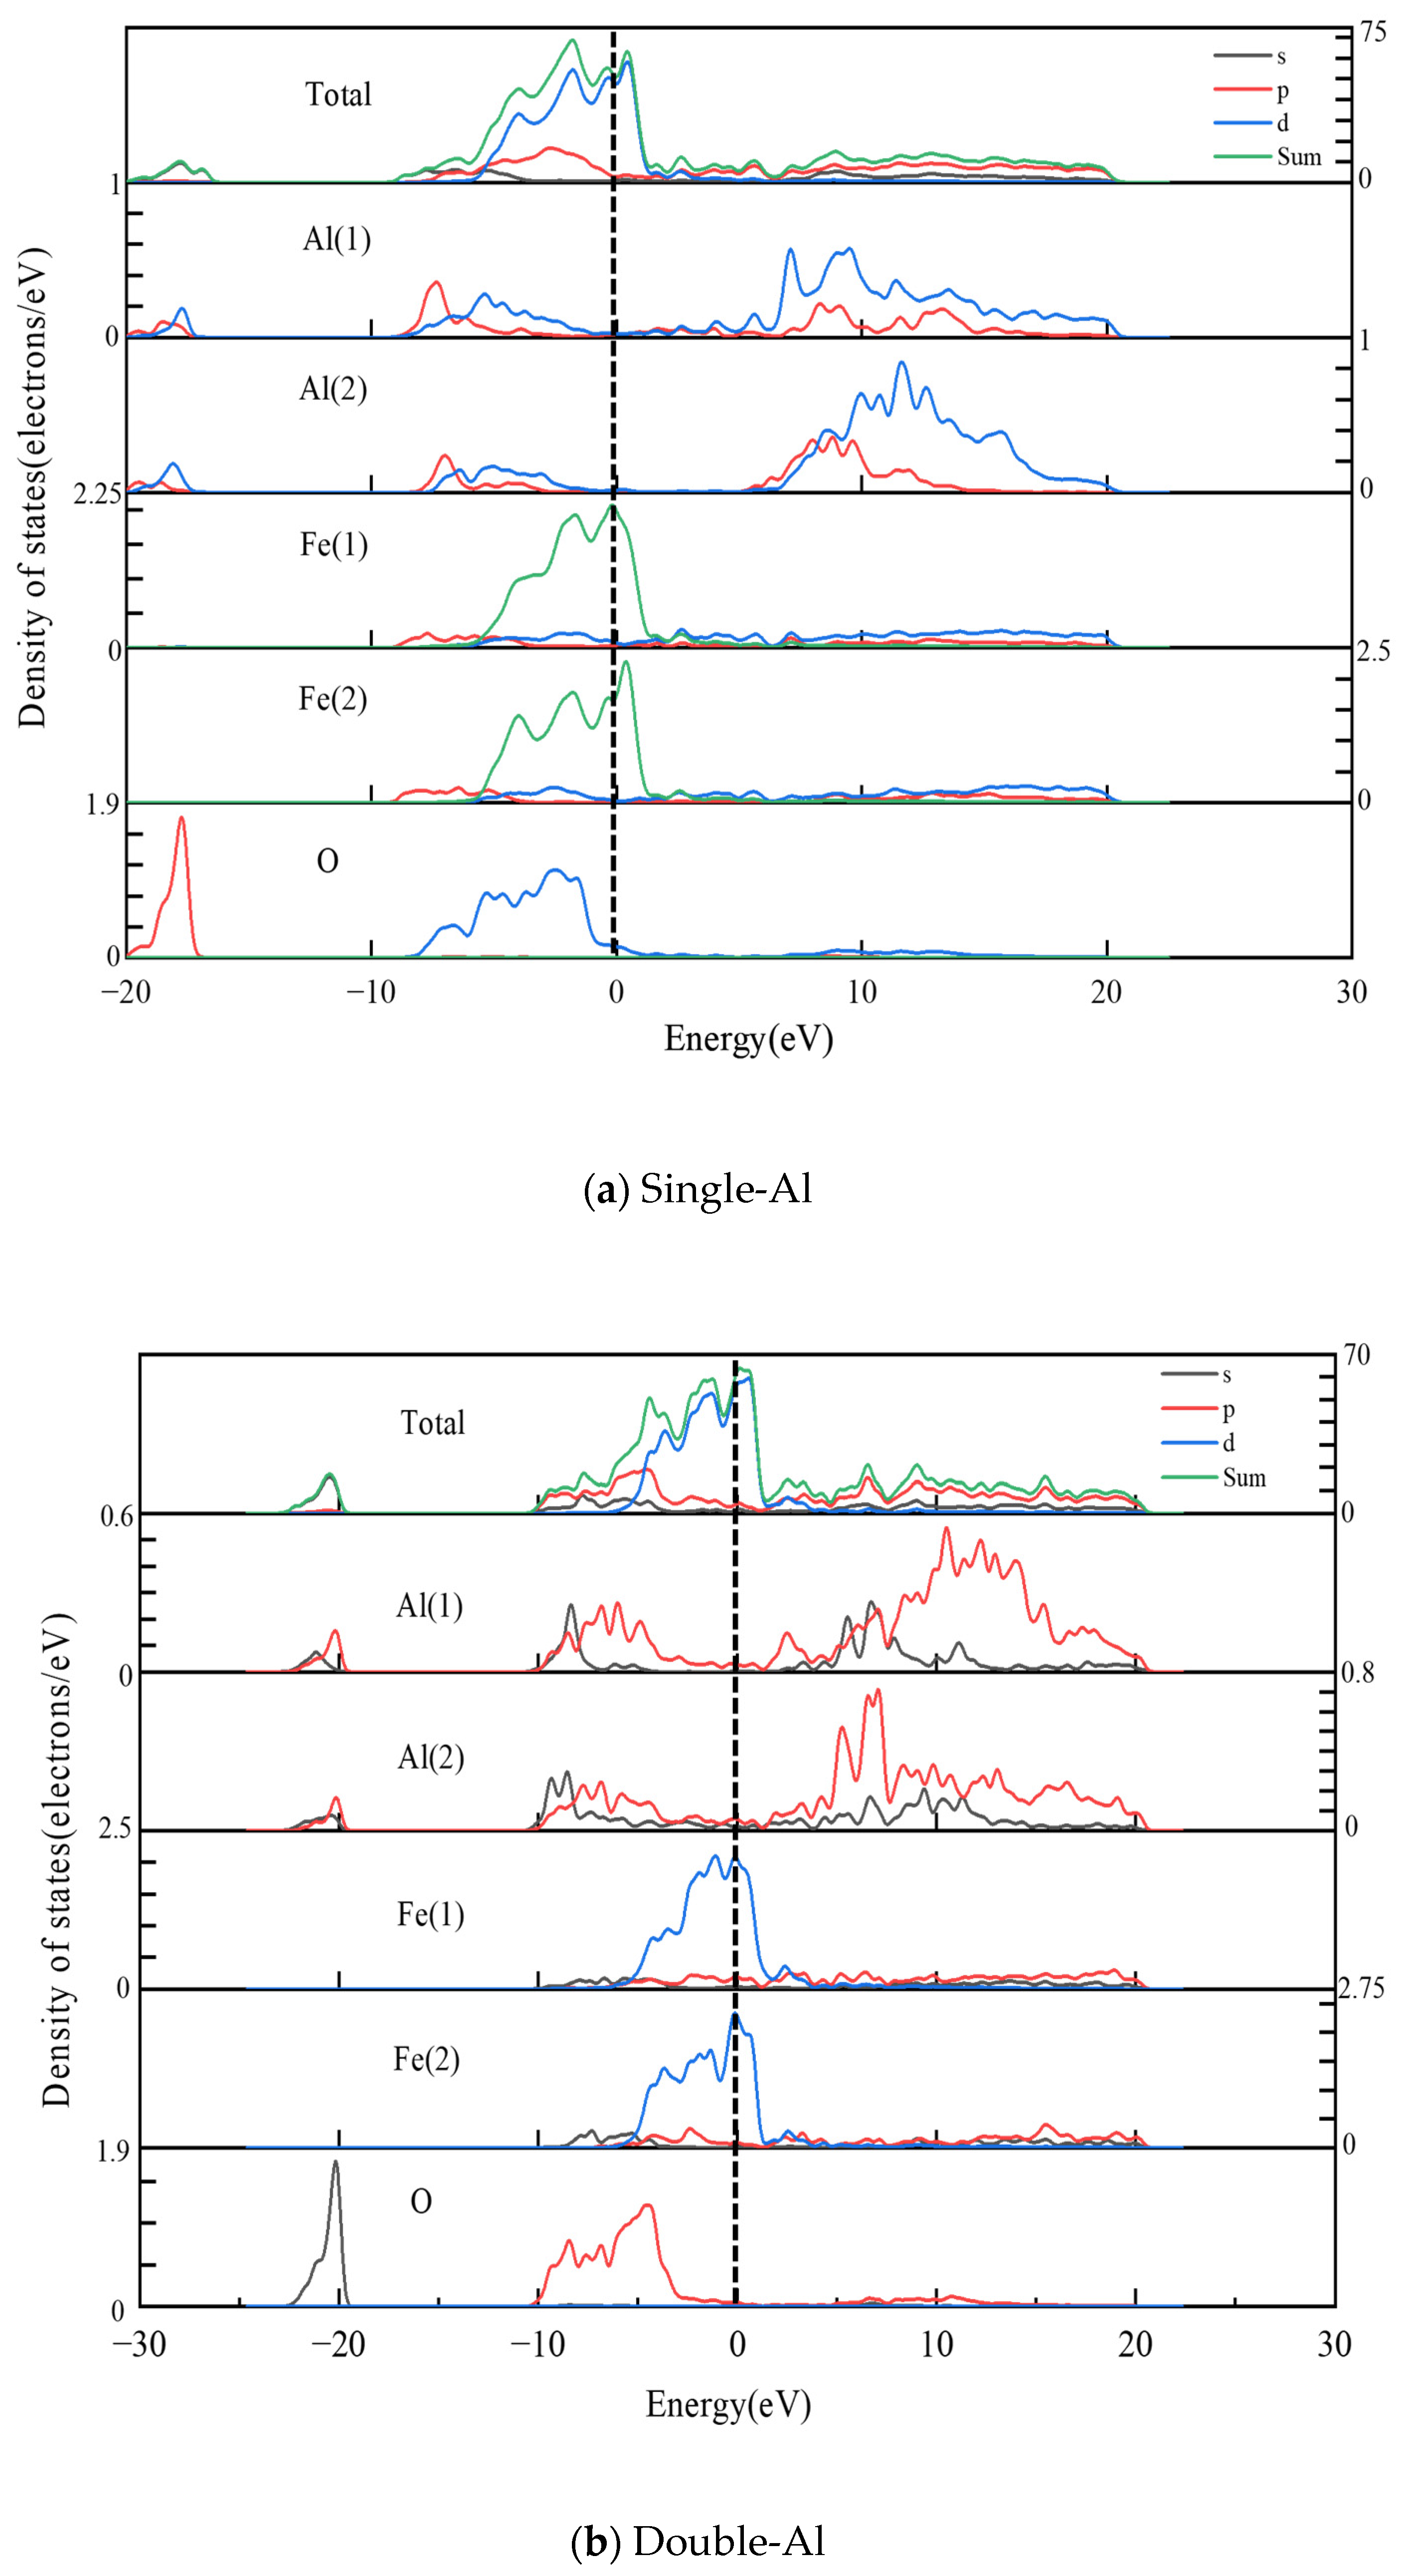
- The electronic structure analysis reveals that electron-sharing regions are present in all three Al2O3/Fe interface types. However, the charge concentration at the O-terminal interface is notably higher compared to the monolayer Al and bilayer Al interfaces. This indicates that the interaction at the O-terminal interface is stronger, which elucidates the variations in bonding strength across different binding modes from an electronic perspective. Differential charge density and partial density of states calculations reveal that Fe-Al covalent metal bonds predominantly characterize the interfaces of single-Al and double-Al. Conversely, both Fe-Al covalent metal bonds and Fe-O ionic bonds are present at the O-terminal interface. Additionally, the hybridization of interatomic electron orbitals at the O-terminal interface is markedly pronounced with a higher number of electron orbital hybrids compared to the monolayer Al and bilayer Al interfaces. This indicates that both the hybridization of electron orbitals and the type of chemical bonds significantly influence the interface bonding properties.
5. Conclusions
Author Contributions
Funding
Institutional Review Board Statement
Informed Consent Statement
Data Availability Statement
Conflicts of Interest
References
- Chanbi, D.; Adnane Amara, L.; Ogam, E.; Amara, S.E.; Fellah, Z.E.A. Microstructural and Mechanical Properties of Binary Ti-Rich Fe–Ti, Al-Rich Fe–Al, and Ti–Al Alloys. Materials 2019, 12, 433. [Google Scholar] [CrossRef] [PubMed]
- Li, Y.G.; Zhang, K.; Li, S. Fe/Al2O3 cermet composite Research progress. Min. Metall. Eng. 2023, 43, 129–132. [Google Scholar]
- Iqbal, M.M.A.; Toemen, S.; Razak, F.I.A.; Rosid, S.J.M.; Azelee, N.I.W. Catalytic methanation over nanoparticle heterostructure of Ru/Fe/Ce/γ-Al2O3 catalyst: Performance and characterisation. Renew Energy 2020, 16, 513–524. [Google Scholar] [CrossRef]
- Xu, X.; Song, L.L.; Zhao, H. Application progress of first-principles calculation in the study of copper alloys. Trans. Mater. Heat Treat. 2019, 40, 1–11. [Google Scholar]
- Liu, X.N.; Mao, H.K.; Wang, Y.; Xu, H. Research Progress in First-principle Calculation of Metal/Oxide Interface. Hot Work. Technol. 2019, 48, 28–31, 35. [Google Scholar]
- Zhang, S.S.; Jin, W.C.; Yang, H.S. Comparative study of Ti and Cr adhesion to the AlN ceramic: Experiments and calculations. Appl. Surf. Sci. 2018, 457, 856–862. [Google Scholar] [CrossRef]
- Xiao, J.B.; Yao, J.P.; Sun, Z. First-principles calculation of Interfacial Stability of TiC/Mg Composites. J. Mater. Heat Treat. 2020, 41, 28–33. [Google Scholar]
- Zhang, W.; Smith, J.R. Nonstoichiometric Interfaces and Al2O3 Adhesion with Al and Ag. Phys. Rev. Lett. 2000, 85, 3225–3228. [Google Scholar] [CrossRef] [PubMed]
- Pilania, G.; Thijsse, B.J.; Hoagland, R.G.; Lazić, I.; Valone, S.M.; Liu, X.Y. Revisiting the Al/Al2O3 interface: Coherent interfaces and misfit accommodation. Sci. Rep. 2018, 4, 4485. [Google Scholar] [CrossRef] [PubMed]
- Shen, Y.F. First-Principles Study on Interfacial Bonding of TiC-Based Cermets. Ph.D. Thesis, Guangxi University, Nanning, China, 2012. [Google Scholar]
- Zhao, Y.; Cheng, C.Q.; Cao, Z.Y. Effect of native oxide film on interaction between stainless steels and liquid Sn. Mater. Sci. Technol. 2013, 29, 689–696. [Google Scholar] [CrossRef]
- Li, R.W.; Chen, Q.C.; Ouyang, L.; Ding, Y. Adhesion strength and bonding mechanism of γ-Fe (111)/α-Al2O3 (0001) interfaces with different terminations. J. Alloys Compd. 2021, 870, 159529. [Google Scholar] [CrossRef]
- Yu, J.; Lin, X.; Wang, J.; Huang, W. First-principles study of the relaxation and energy of bcc-Fe, fcc-Fe and AISI-304 stainless steel surfaces. Appl. Surf. Sci. 2009, 255, 9032–9039. [Google Scholar] [CrossRef]
- Shi, Z.; Liu, S.; Zhou, Y.; Yang, Q. First-principles calculation on the relationships of h-WC/γ-Fe interface. J. Phys. Chem. Solids 2018, 123, 11–18. [Google Scholar] [CrossRef]
- Chen, L.; Li, Y.; Xiao, B.; Zheng, Q.; Gao, Y.; Zhao, S.; Wang, Z. First-principles calculation on the adhesion strength, fracture mechanism, interfacial bonding of the NiTi(111)//α-Al2O3(0001) interfaces. Mater. Des. 2019, 183, 108119. [Google Scholar] [CrossRef]
- Huang, H.; Zhang, C.; Liu, J.; Li, Y.; Fang, X.; Li, J.; Han, P. First-principles study on the structural stability and segregation behavior of γ-Fe/Cr2N interface with alloying additives M (M = Mn, V, Ti, Mo, and Ni). Metals 2016, 6, 156. [Google Scholar] [CrossRef]
- Acet, M.; Zähres, H.; Wassermann, E.F.; Pepperhoff, W. High-temperature moment-volume instability and anti-Invar of γ-Fe. Phys. Rev. B 2014, 49, 6012. [Google Scholar] [CrossRef]
- Yang, R.; Tanaka, S.; Kohyama, M. First-principles study on the tensile strength and fracture of the Al-terminated stoichiometric α-Al2O3 (0001)/Cu (111) interface. Philos. Mag. 2005, 85, 2961–2976. [Google Scholar] [CrossRef]
- Ruppi, S. Deposition, microstructure and properties of texture-controlled CVD α-Al2O3 coatings. Int. J. Refract. Met. Hard Mater. 2005, 23, 306–316. [Google Scholar] [CrossRef]
- Liu, Z.; Zheng, S.; Lu, Z.; Pu, J.; Zhang, G. Adhesive transfer at copper/diamond interface and adhesion reduction mechanism with fluorine passivation: A first-principles study. Carbon 2018, 127, 548–556. [Google Scholar] [CrossRef]
- Li, X.; Hui, Q.; Shao, D.; Chen, J.; Wang, P.; Jia, Z.; Cheng, N. First-principles study on the stability and electronic structure of Mg/ZrB2 interfaces. Sci. China Mater. 2016, 1, 28–37. [Google Scholar] [CrossRef]
- Li, J. First-Principles Study on the Interface of SiCf/Ti Matrix Composites. Master’s Thesis, Northwestern Polytechnical University, Xian, China, 2014. [Google Scholar]
- Yang, J.; Wang, Y.; Huang, J.; Ye, Z.; Sun, X.; Chen, S.; Zhao, Y. First-principles calculations on Ni/W interfaces in Steel/Ni/W hot isostatic pressure diffusion bonding layer. Appl. Surf. Sci. 2019, 475, 906–916. [Google Scholar] [CrossRef]
- Perras, F.A.; Bryce, D.L. Direct characterization of metal–metal bonds between nuclei with strong quadrupolar interactions via NMR spectroscopy. J. Phys. Chem. Lett. 2014, 5, 4049–4054. [Google Scholar] [CrossRef] [PubMed]


| Atom Layers, n | 3 | 5 | 7 | 9 |
|---|---|---|---|---|
| Surface energy (σ) (J/m2) | 2.51 | 2.63 | 2.65 | 2.64 |
| Surface Terminal | Rate of Change in Interlayer Spacing | Number of Surface Atomic Layers (N) | |||
|---|---|---|---|---|---|
| (%) | 9 | 12 | 15 | 18 | |
| Singl-Al | Δd12 | −98.11 | −90.30 | −86.37 | −89.03 |
| Δd23 | +0.84 | +0.72 | +4.01 | +6.62 | |
| Δd34 | −54.02 | −39.34 | −46.09 | +7.56 | |
| Δd45 | +24.98 | −13.32 | +22.34 | +23.23 | |
| Δd56 | +1.98 | +3.02 | +2.79 | ||
| Δd67 | −2.89 | −3.65 | |||
| Δd78 | +2.47 | ||||
| Surface Terminal | Rate of Change in Interlayer Spacing | Number of Surface Atomic Layers (N) | |||
|---|---|---|---|---|---|
| (%) | 11 | 14 | 17 | 20 | |
| Double-Al | Δd12 | +18.09 | +21.20 | +18.96 | +21.05 |
| Δd23 | −0.99 | −0.92 | −3.08 | −4.09 | |
| Δd34 | +0.39 | +0.95 | +3.05 | +3.57 | |
| Δd45 | −3.97 | −6.06 | −4.69 | −4.98 | |
| Δd56 | +3.79 | +1.87 | +1.64 | +0.33 | |
| Δd67 | −0.71 | +0.60 | +1.65 | ||
| Δd78 | −0.33 | +0.70 | |||
| Δd89 | −0.43 | ||||
| Surface Terminal | Rate of Change in Interlayer Spacing | Number of Surface Atomic Layers (N) | |||
|---|---|---|---|---|---|
| (%) | 7 | 10 | 13 | 16 | |
| O | Δd12 | +29.5 | +16.98 | +12.01 | +26.23 |
| Δd23 | −13.97 | −21.12 | −19.02 | −23.21 | |
| Δd34 | +7.97 | +3.01 | +4.97 | −0.41 | |
| Δd45 | −1.32 | +1.55 | −1.83 | ||
| Δd56 | +0.89 | +1.85 | |||
| Δd67 | −1.23 | ||||
| Cell Type | Method | a (Å) | c (Å) | B (GPa) | |
|---|---|---|---|---|---|
| γ-Fe | This paper studies | GGA-PBE | 3.437 | 255 | |
| Other studies | GGA-PBE [15] | 3.474 | 232 | ||
| GGA-PW91 [15] | 3.472 | 240 | |||
| LDA-CAPZ [17] | 3.428 | ||||
| Experimental study | 3.645 [18] | ||||
| α-Al2O3 | This paper studies | GGA-PBE | 4.846 | 13.265 | 220 |
| Other studies | GGA-PBE [16] | 4.759 | 12.991 | ||
| GGA-PBE [19] | 4.812 | 13.133 | |||
| Experimental study | 4.759 [14] | 12.993 | 253 |
| Interface | Interfacial Stacking Sequence | Without Structural Optimization | After Structural Optimization | ||
|---|---|---|---|---|---|
| d0 (Å) | Wad (J/m2) | d0 (Å) | Wad (J/m2) | ||
| Single-Al | Top | 2.40 | 1.28 | 2.52 | 0.43 |
| Hcp | 2.20 | 1.35 | 2.38 | 0.58 | |
| Bridge | 2.25 | 1.33 | 2.43 | 0.56 | |
| Double-Al | Top | 2.00 | 3.02 | 1.98 | 3.54 |
| Hcp | 1.90 | 3.62 | 1.92 | 3.82 | |
| Bridge | 1.90 | 3.53 | 1.96 | 3.62 | |
| O | Top | 1.75 | 7.13 | 1.31 | 9.30 |
| Hcp | 1.75 | 7.23 | 1.37 | 9.35 | |
| Bridge | 1.60 | 7.12 | 1.35 | 9.03 | |
Disclaimer/Publisher’s Note: The statements, opinions and data contained in all publications are solely those of the individual author(s) and contributor(s) and not of MDPI and/or the editor(s). MDPI and/or the editor(s) disclaim responsibility for any injury to people or property resulting from any ideas, methods, instructions or products referred to in the content. |
© 2024 by the authors. Licensee MDPI, Basel, Switzerland. This article is an open access article distributed under the terms and conditions of the Creative Commons Attribution (CC BY) license (https://creativecommons.org/licenses/by/4.0/).
Share and Cite
Wei, X.; Sun, T.; Zhang, K.; Li, Y. Study on the Stability of Fe/Al2O3 Interface in Metal-Based Cermets Using Thermodynamic Modeling. Coatings 2024, 14, 1132. https://doi.org/10.3390/coatings14091132
Wei X, Sun T, Zhang K, Li Y. Study on the Stability of Fe/Al2O3 Interface in Metal-Based Cermets Using Thermodynamic Modeling. Coatings. 2024; 14(9):1132. https://doi.org/10.3390/coatings14091132
Chicago/Turabian StyleWei, Xiangyu, Tengfei Sun, Kuai Zhang, and Yungang Li. 2024. "Study on the Stability of Fe/Al2O3 Interface in Metal-Based Cermets Using Thermodynamic Modeling" Coatings 14, no. 9: 1132. https://doi.org/10.3390/coatings14091132
APA StyleWei, X., Sun, T., Zhang, K., & Li, Y. (2024). Study on the Stability of Fe/Al2O3 Interface in Metal-Based Cermets Using Thermodynamic Modeling. Coatings, 14(9), 1132. https://doi.org/10.3390/coatings14091132