Article

Wear Behavior of TiN/TiAlSiN Nanocomposite Multilayer Coatings from Ambient Temperature to Medium Temperature

1
College of Material Science and Technology, Nanjing University of Aeronautics and Astronautics, Nanjing 211106, China
2
Wuxi Research Institute, Nanjing University of Aeronautics and Astronautics, Nanjing 211106, China
3
National Key Laboratory of Advanced Composites, AECC Beijing Institute of Aeronautical Materials, Beijing 100095, China
*
Author to whom correspondence should be addressed.
Coatings 2024, 14(9), 1139; https://doi.org/10.3390/coatings14091139
Submission received: 29 July 2024 / Revised: 26 August 2024 / Accepted: 28 August 2024 / Published: 4 September 2024

Abstract

:
TiN/TiAlSiN nanocomposite multilayer coatings were deposited on a titanium alloy by multi-arc ion plating. The investigation of the wear behavior of TiN/TiAlSiN multilayer coatings against Si3N4 was conducted at temperatures of 25 °C, 300 °C, and 500 °C using a ball-on-disk tribometer. Additionally, to gain a deeper understanding of medium-temperature oxidation products, an oxidation test was performed at 500 °C for 10 h. The microstructure and chemical composition of the coatings were evaluated by X-ray diffraction and scanning electron microscopy. The primary peak in the XRD pattern of the multilayer coating changed from TiN (111) to Ti3AlN (111) after the oxidation test. The hardness of the TiN/TiAlSiN multilayer coating was 1540 HV0.1, representing a notable five times improvement compared to the substrate. The critical load in the scratch test was 52.3 N, indicating robust adhesion performance. The wear rate exhibited a sharp increase from 25 °C to 300 °C, compared to the rise from 300 °C to 500 °C. Furthermore, the friction coefficient of the coated sample was more stable than the substrate, with different scratch track morphologies between the samples before and after the oxidation test.

1. Introduction

Titanium alloys are widely used in the automotive, aerospace, defense, marine, and medical equipment fields due to their light weight, low Young’s modulus, high strength, high stiffness, strong corrosion resistance, and biocompatibility [1,2,3,4,5,6]. One notable titanium alloy is TA15, which falls into the near-α-type titanium alloy category, boasting a nominal composition of Ti-6.5Al-1Mo-1V-2Zr in wt.% [7]. This alloy derives its strength primarily from solid solution via the α-stable element Al, while the inclusion of the neutral element Zr and the β-stable elements Mo and V enhances its overall processing capabilities [8]. Consequently, TA15 exhibits not only impressive thermal strength and weldability for an α titanium alloy, but also possesses process plasticity closely resembling that of α+β titanium alloys [9,10]. Nevertheless, the challenge of poor wear resistance has limited the scope of its applications [5].
Enhancing wear resistance primarily hinges on surface treatments, as failures typically initiate from surface imperfections. Numerous researchers have dedicated attention to improving the tribological performance of titanium alloys through surface treatment, including surface texturing [11], surface heat treatment [12], and surface coatings [13,14]. Transition metal nitride coatings have been extensively applied in industry due to their high hardness, corrosion resistance, oxidation stability, and wear resistance [15,16]. Among these coatings, TiAlN stands out as a widely preferred choice owing to its good hardness and phase stability [17]. However, it faces a drawback in its susceptibility to oxidation at high temperature because of the phase change from cubic (B1) to hexagonal (B4), which significantly deteriorates its mechanical properties [18,19,20]. An effective strategy to enhance oxidation resistance involves alloying TiAlN with Cr [21], Si [22], and rare-earth elements [23]. That is why films like TiAlSiN and TiAlCrN have garnered attention for protecting surfaces from high temperatures. TiAlSiN is notable for its unique cubic TiAlN embedded in the amorphous matrix of Si3N4, which can inhibit the growth of columnar grains, increase grain boundaries, and prevent dislocation sliding, consequently enhancing hardness [24,25,26,27,28,29]. However, monolithic TiAlSiN exhibits insufficient adhesion and cutting performance [30].
Multilayering is often cited as a potential way to improve the general performance of coatings. During the wear process, a tribo-layer typically forms at the interface, exerting a significant influence on the friction coefficient [31]. Tribo-layers are formed by mechanical mixing, tribo-oxidation with the atmosphere, and the sintering of wear debris, lubricants, and possible contaminants [32]. It is worth noting that some of these tribo-layers are brittle and fail to adhere to the substrate, thus offering no protective function [33,34,35]. On the other hand, some tribo-layers can effectively reduce wear volume and wear rate. For instance, Cui et al. [36] discovered that, as temperature increased to 200 °C, the wear rate of the alloy Ti-6Al-4V also increased. However, beyond 200 °C, the wear rate decreased due to the formation of protective tribo-layers, resulting in milder wear conditions. Nairu [37] observed that SiO2·nH2O tribo-layers formed at ambient temperature contribute to reducing wear rate and friction coefficients, while Al2O3 and SiO2 generated at 600 °C can decrease the wear rate of TiAlSiN coatings. Wang et al. found a change in the wear mechanism from predominantly abrasive to oxidative wear as the temperature changed from 300 °C to 400 °C, leading to a significant reduction in wear rate. Chen et al. [38] reported that, at temperatures below 300 °C, Ti alloys experience severe abrasive wear due to tribo-oxides’ inability to form protective tribo-layers. In contrast, beyond 300 °C, a tribo-layer does form, potentially enhancing wear resistance.
As mentioned above, a multilayer structure integrates the advantages of two sublayers [39,40] and simultaneously exhibits improved overall properties resulting from the Hall–Petch strengthening effect [41], dislocation blocking effect [42], and strain effect [43] associated with an increasing number of interfaces. TiN/TiAlSiN multilayer coatings demonstrate significantly superior wear performance compared to the monolithic TiAlSiN coating at ambient temperature, as established in our previous work [44]. But in the real wear application of landing gear, it is inevitable to experience an increase in temperature. So, exploring the wear performance of multilayer coatings at medium temperature is of importance. In this work, TiN/TiAlSiN multilayered coatings were synthesized by multi-ion plating on a titanium alloy to explore the effect of wear temperature on microstructure, mechanical properties, and tribological performance from ambient temperature to 500 °C. To gain a deeper understanding of the oxidation products at 500 °C, samples underwent oxidation testing for 10 h.

2. Experimental Details

2.1. Coating Synthesis

TiN/TiAlSiN multilayer coatings were deposited on the titanium alloy TA15 using the multi-arc ion plating equipment GP-800 (Beijing Taikono Technology Co., Ltd., Beijing, China). The TiAlSi (55:35:10) alloy target and Ti metal target with a diameter of 150 mm were sputtered alternatively to form multilayers by applying currents and voltages of 75 A, 70 A, 225 V, and 225 V, respectively. The targets (Yuteng Ceramic Products Co., Ltd., Zhangzhou, China) were polished with sandpaper to eliminate the oxidative layers. The TA15 substrate was produced by the Beijing Institute of Aviation Materials, and its corresponding chemical composition is detailed in Table 1. The substrates, with dimensions of 15 mm × 15 mm × 4 mm, were ground using SiC abrasive paper ranging from 150 grit to 7000 grit, and subsequently polished with chromic oxide. The polished samples were ultrasonically cleaned in alcohol for 10 min to eliminate surface contamination. To further remove contaminants from the surface, the samples were cleaned by glow discharge with a bias voltage of −600 V in an Ar atmosphere of 2 Pa for 10 min. A Ti layer was then deposited onto the sample surface as a buffer layer to enhance adhesive strength. Elaborate details regarding the deposition process parameters are listed in Table 2.

2.2. Characterization

The morphology and the chemical composition of the coating surface and the cross-section of the as-deposited TiAlSiN were determining using Field-Emission Scanning Electron Microscopy (FE-SEM, Carl Zeiss AG, Oberkochen, Germany) with a 20 kV JEOL 840A SEM equipped with energy-dispersive X-ray spectroscopy (EDS) capabilities. This configuration allowed for point microanalysis, linear microanalysis, and chemical mapping of the designated surface.
The phase structure analysis of the TiN/TiAlSiN multilayer coatings was conducted using a D8 Advance X-ray diffractometer (Bruker Corp, Stuttgart, Germany). The measurements were performed under conditions of 40 kV and 30 mA with Cu K radiation (λ = 0.154 nm). The scanning angle covered the range of 20–90° with a 0.02° step size. The chemical states after the wear test at 500 °C were analyzed using X-ray photoelectron spectroscopy (XPS, QUANTUM2000, Physical Electronics, Inc., Minneapolis, Minnesota, USA). The spectra were calibrated against the C1s peak at 284.8 eV to ensure accuracy in the measurements.
For the analysis of adhesion strength between the TiN/TiAlSiN multilayer coating and the substrate, a scratch-testing technique was employed using a WS−2005 coating adhesion scratch tester under constant load mode. The load gradually increased with the movement of the diamond penetrator along the surface of the examined specimen. The test parameters were as follows: load range of 0–150 N, load increase rate (dL/dt) of 100 N/min, and penetrator travel speed (dx/dt) of 10 mm/min. The critical load Lc, signifying the point of coating adhesion failure, was determined by monitoring acoustic emission (AE) for a sudden change and verifying the coating’s exfoliation through an optical microscope and SEM.
The microhardness of the TiN/TiAlSiN coating was investigated by a digital micro Vickers hardness tester (HXS-1000A, Laizhou YuTong test instrument Co. Ltd., Laizhou, China) with a 100 g load and a 15 s holding time. To enhance the measurement accuracy, 5–6 random positions were chosen for measurement, and their average value was considered as the coating’s microhardness.

2.3. Wear Test

Drying sliding wear tests were conducted at ambient temperature (25 °C), 300 °C, and 500 °C, respectively, using a pin-on-disk tribometer (HT500, Lanzhou Institute of Physics and Chemistry, Chinese Academy of Sciences, Lanzhou, China) with 5 mm diameter Si3N4 balls as counterparts. The tribometer was equipped with a heating stage, temperature controller, and thermocouple. The tests were carried out at a rotational speed of 560 r/min with a rotation diameter of 2 mm. Furthermore, wear profiles were obtained using an optical 3D white light profiling system (VHX-700FC, Keyence, Osaka, Japan).
For an in-depth analysis of high-temperature wear products, samples were heat-treated prior to friction for comparative purposes. The samples underwent thermal treatment in a muffle furnace under an air atmosphere, where they were heated to 500 °C at a heating rate of 10 K/min, and maintained at this temperature for 10 h. This was followed by a cooling process at a rate of 50 K/min, conducted without preservation.
Wear rate was calculated by the following equation [45]:
W = V L F
where W is wear rate (mm3N−1m−1), V is wear volume (mm3), L is sliding distance (m), and F is applied load (N).
In addition, to correlate wear with mechanical properties, the wear rate was further estimated using the Evans–Charles formula [46]:
W r   t h e o = α E H P 1 / 8 K I C 1 / 2 H 5 / 8
where α is the material independent constant, E is elastic modulus (GPa), H is Vickers hardness (GPa), P is normal load (N), and KIC is fracture toughness (MPa·m1/2).

3. Results and Discussion

3.1. Microstructure

Figure 1 depicts the cross-sectional morphology of the as-prepared multilayer coating. In the image, the dark layers correspond to TiAlSiN, while the lighter layers represent TiN. The significant contrast between the layers can be attributed to differences in the electron scattering factor between TiN and TiAlSiN. The layer interfaces display a distinct dense microstructure, devoid of any observed holes and cracks. The total thickness of the coating was 11 μm, including the Ti buffer layer (identified as the yellow marked zone Ⅰ). Chemical compositions of the coating, as determined by EDS, are shown in Figure 1b–e. The EDS line scan (with the scan direction indicated in Figure 1a) of TiN/TiAlSiN coating shows a composition modulation characterized by alternating TiN and TiAlSiN layers. Across the 0–11 μm range, the Ti, Al, and N elements exhibit a general decreasing–increasing trend, whereas Si is not detectable because of its low concentration. Si content is lower than that in TiAlSi target because of its lower ionization rate compared to Ti and Al. Figure 1c–e corresponds to the energy spectra of region Ⅰ, Ⅱ, and Ⅲ. Region Ⅰ is predominately composed of Ti (95 at%), enhancing the bonding strength between the coating and substrate. Figure 1d shows proportions of Ti (51 at%), Al (6 at%,), Si (1 at%), and N (42 at%), implying that region Ⅱ primarily comprises Ti nitrides, corresponding to the TiN layer. In Figure 1e, Ti (42 at%), Al (20 at%), Si (2 at%), and N (36 at%) proportions are observed, similar to the composition of the TiAlSi target, disregarding N. This denotes that the red-marked zone signifies the TiAlSiN layer.

3.2. Phase Analysis

To comprehensively investigate medium-temperature wear behavior, the samples underwent heat treatment at 500 °C for 10 h. The XRD analysis of the phase structure of the TiN/TiAlSiN multilayer coating before and after oxidation test is presented in Figure 2. The XRD peaks revealed that the structures of the TiN/TiAlSiN multilayer coatings before oxidation are composed of cubic Ti(Al)N, where Al substitutes for Ti in the TiN structure, alongside small amounts of Ti, TiO2, and Al peaks.
The existence of Ti and Al phases may be attributed to the formation of unreacted droplets during sputtering. Subsequent to heat treatment, pronounced decomposition and oxidation led to the formation of titanium oxide. Meanwhile, the main peak of the coatings changed from TiN (111) to Ti3AlN (111) after an oxidation test. Additionally, the orientation of Ti3AlN shifted from (111) to (200), as evidenced by the texture coefficient calculations presented in Table 3. This change in orientation results from the competition between strain and surface energy. As Pelleg et al. [47] elucidate, cubic nitrides exhibit a (200) texture growth when surface energy dominates, while a (111) texture develops when strain energy prevails. The XRD pattern does not show any Si-containing phases due to the formation of amorphous silicide and its low concentration. Notably, the XRD pattern after oxidation test displays a reduction in the original TiN peaks alongside the emergence of TiO2, indicating the phase transformation.
The texture coefficient TC(γ) can be utilized to calculate the orientation parameter for thin film samples using the following equation [48]:
T C γ = I h k l I 0 h k l [ 1 N I h k l I 0 h k l ]
where Ihkl represents the intensity measured from XRD pattern, Iohkl is standard intensity obtained from ICDD PDF card for specific (hkl) planes, and N refers to the number of diffraction peaks.
The texture coefficients calculated for the (111), (200), (220), and (311) planes are shown in Table 3. The higher value of TC (111) before oxidation and TC (200) after oxidation indicates the preferred orientation of the films along those diffraction planes.

3.3. Hardness Analysis

The micro-hardness test was performed on the TiN/TiAlSiN multilayer coating and the TA15 substrate. To ensure accuracy and stability, five random points were selected. The experimental results are presented in Table 4.
As shown in Table 4, the average micro Vickers hardness of the TA15 titanium alloy substrate is 350 HV0.1, while the average hardness of the TiN/TiAlSiN multilayer coating is 1540 HV0.1, which is five times higher than that of the substrate.

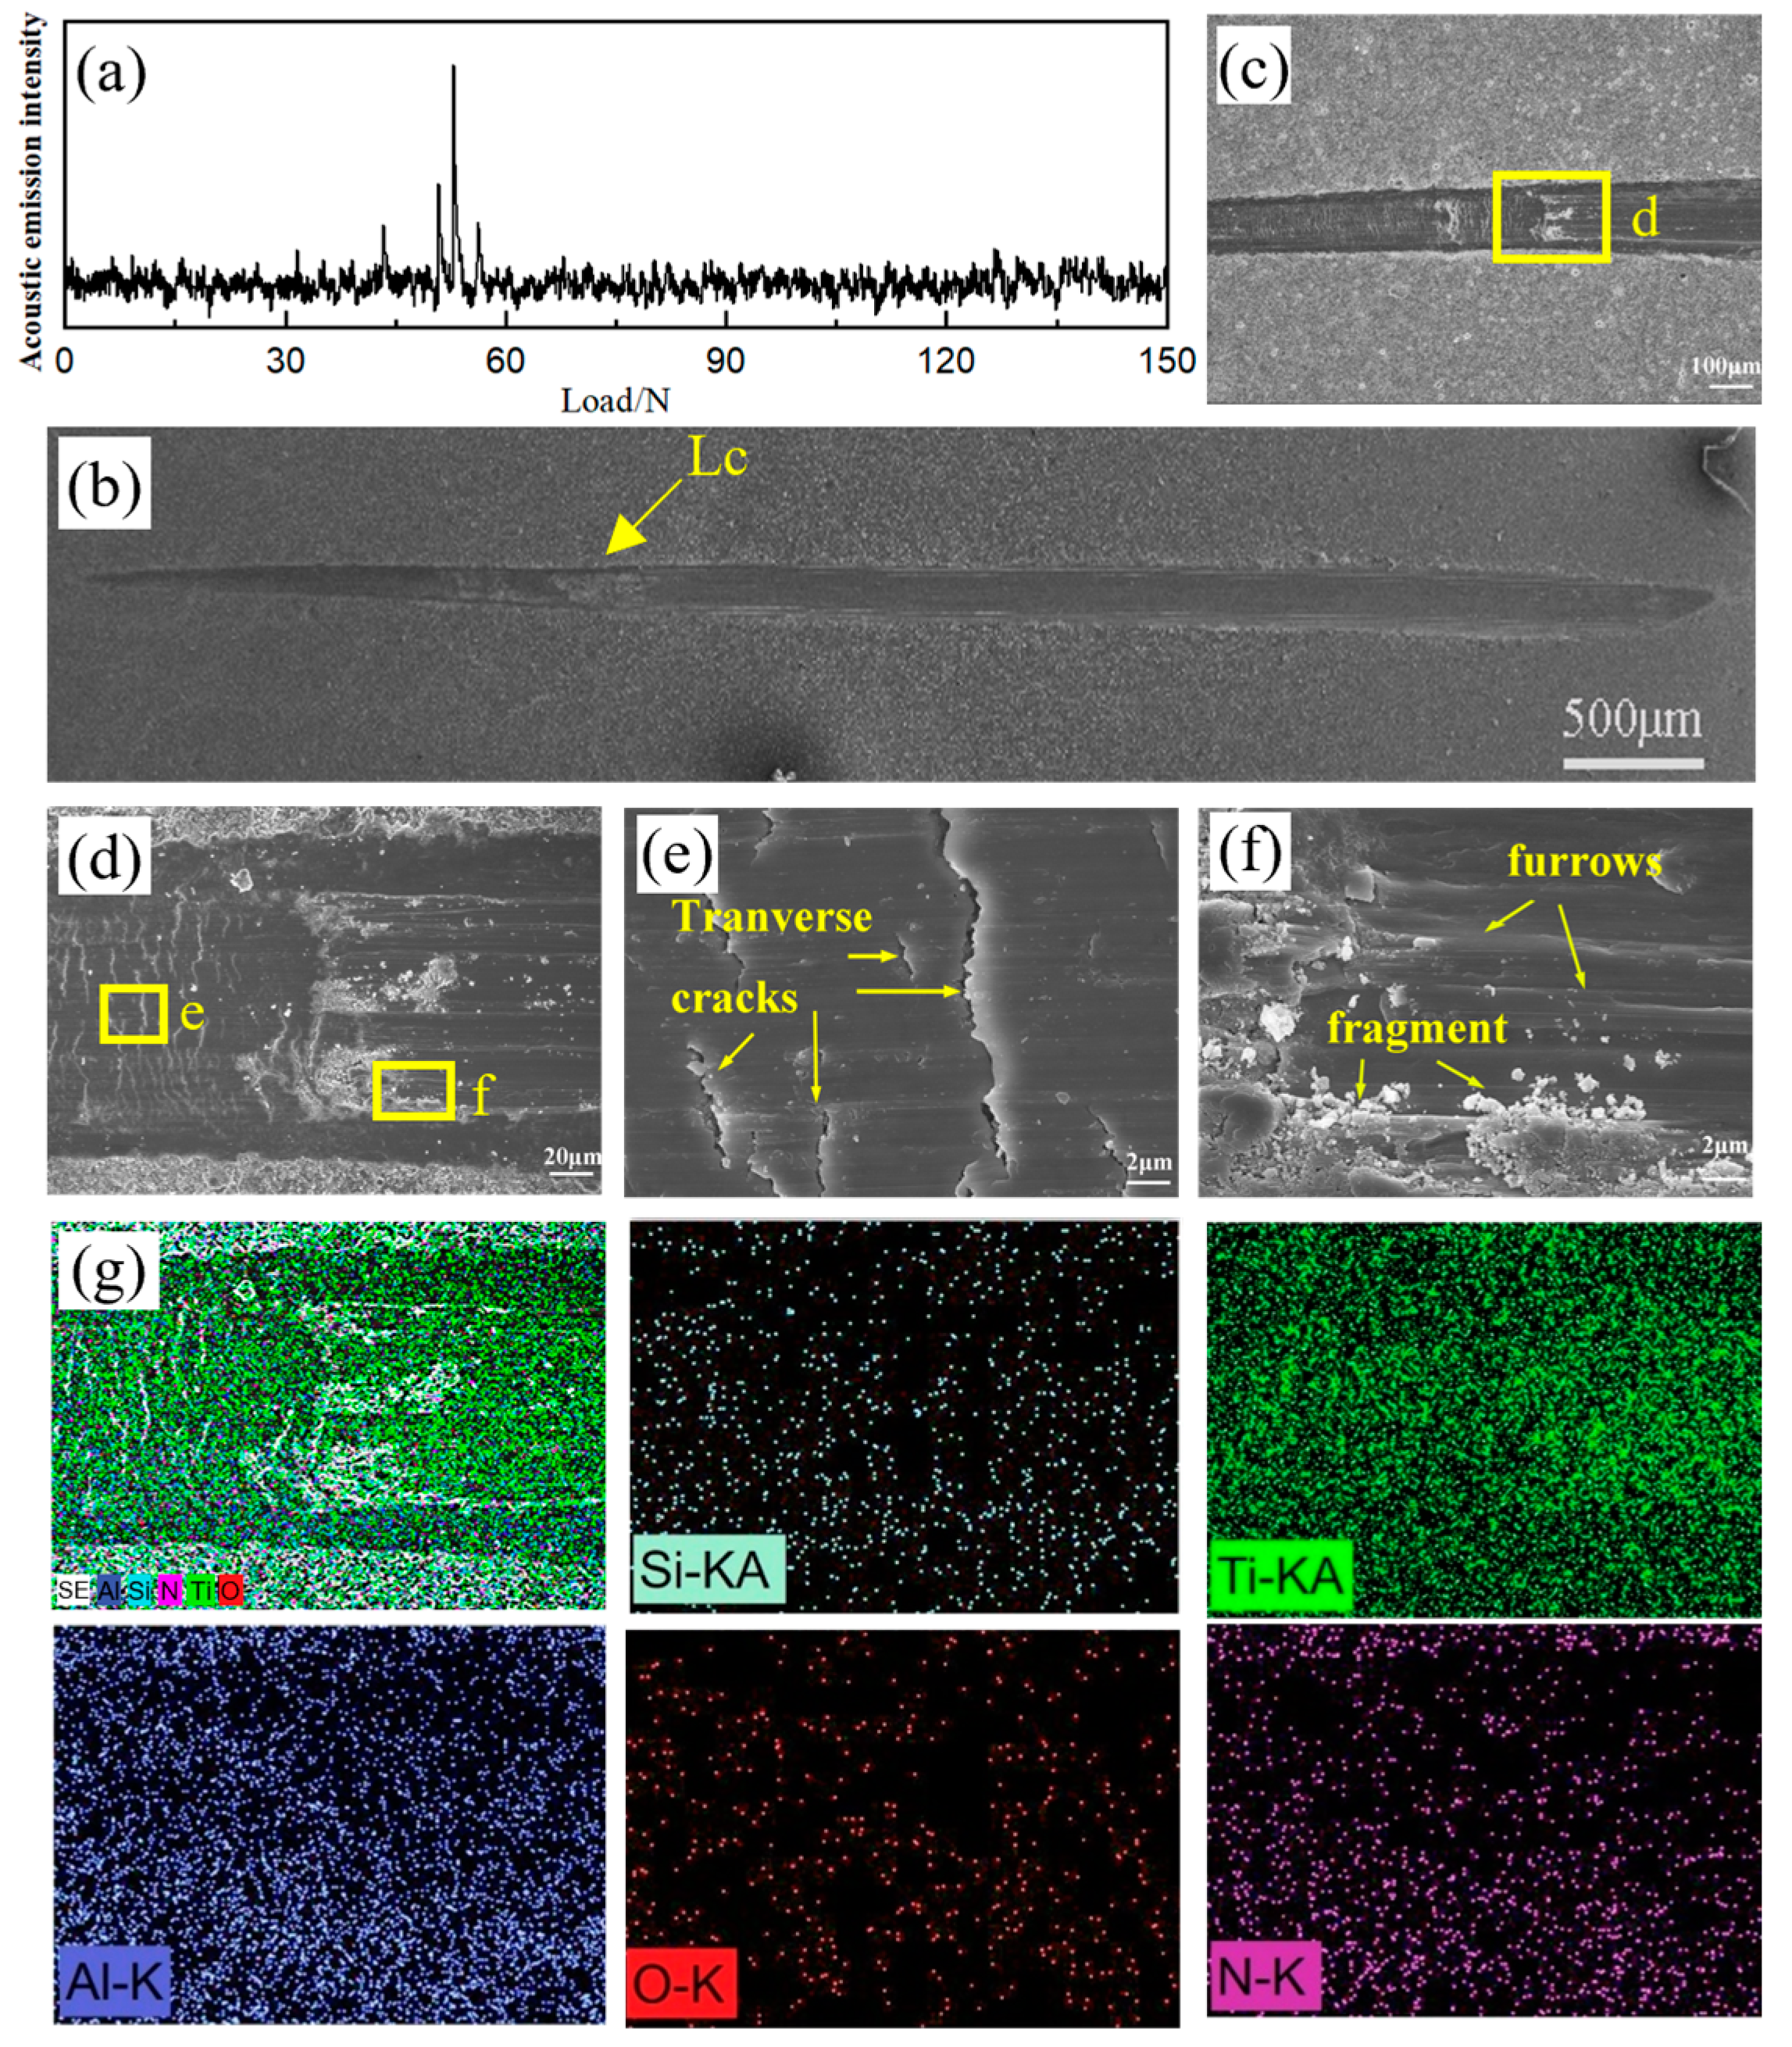
3.4. Adhesion Analysis

The scratch resistance of a coating serves as an indicator not only of the adhesion strength between the substrate and the coating, but also of its load-bearing capacity and fracture toughness [49,50,51]. Figure 3 shows the acoustic emission signal and the scratch track of the TiN/TiAlSiN coating. The acoustic emission curve, correlated to normal load (Figure 3a), exhibits a sudden increase at a critical load of 52.3 N, indicating the peeling and cracking of the coating, is shown in Figure 3b. Generally, critical loads exceeding 30 N, as measured using a Rockwell C diamond tip in scratch tests, are considered sufficient for sliding contact applications [52]. Therefore, these coatings are suitable for high-load wear applications. The scratch morphology of the TiN/TiAlSiN coating (Figure 3b–f) reveals the locations of failure. The initial part of the scratch track (Figure 3c) exhibits uniform edges without cracks or chipping. However, as the load reaches Lc, tensile macro-cracks and chipping emerge in the middle part and towards the back of the scratch track. Figure 3d provides an enlarged image of the exact rupture position, where accumulated transverse cracks (Figure 3e) are observed in the front of the failure area, while furrows and debris are present at the rear part of the rupture zone (Figure 3f). The EDS mapping in Figure 3g displays the distribution of oxygen (O) and nitrogen (N) elements, indicating that the debris primarily consists of oxides. The areas where oxygen appears correspond to the tribo-layer and debris shown in Figure 3d. From the titanium mapping, it is evident that the central region of the wear track exhibits a slightly higher concentration of titanium compared to the peripheral areas. When considered alongside the nitrogen mapping, this observation indicates that the substrate is exposed in areas where nitrogen is deficient and titanium accumulated.

3.5. Wear Analysis

Friction and wear tests were conducted using a ball-on-disk setup for both the TiN/TiAlSiN multilayer coating and the TA15 substrates. These tests were carried out under load conditions of 330 g for 15 min at ambient temperatures of 300 °C and 500 °C. The purpose of these tests was to assess the wear resistance of the coated samples at different temperatures. The subsequent analysis focused on three aspects: the friction coefficient, wear track morphologies, and wear mechanism analysis of the TiN/TiAlSiN multilayer coatings and the TA15 substrates.

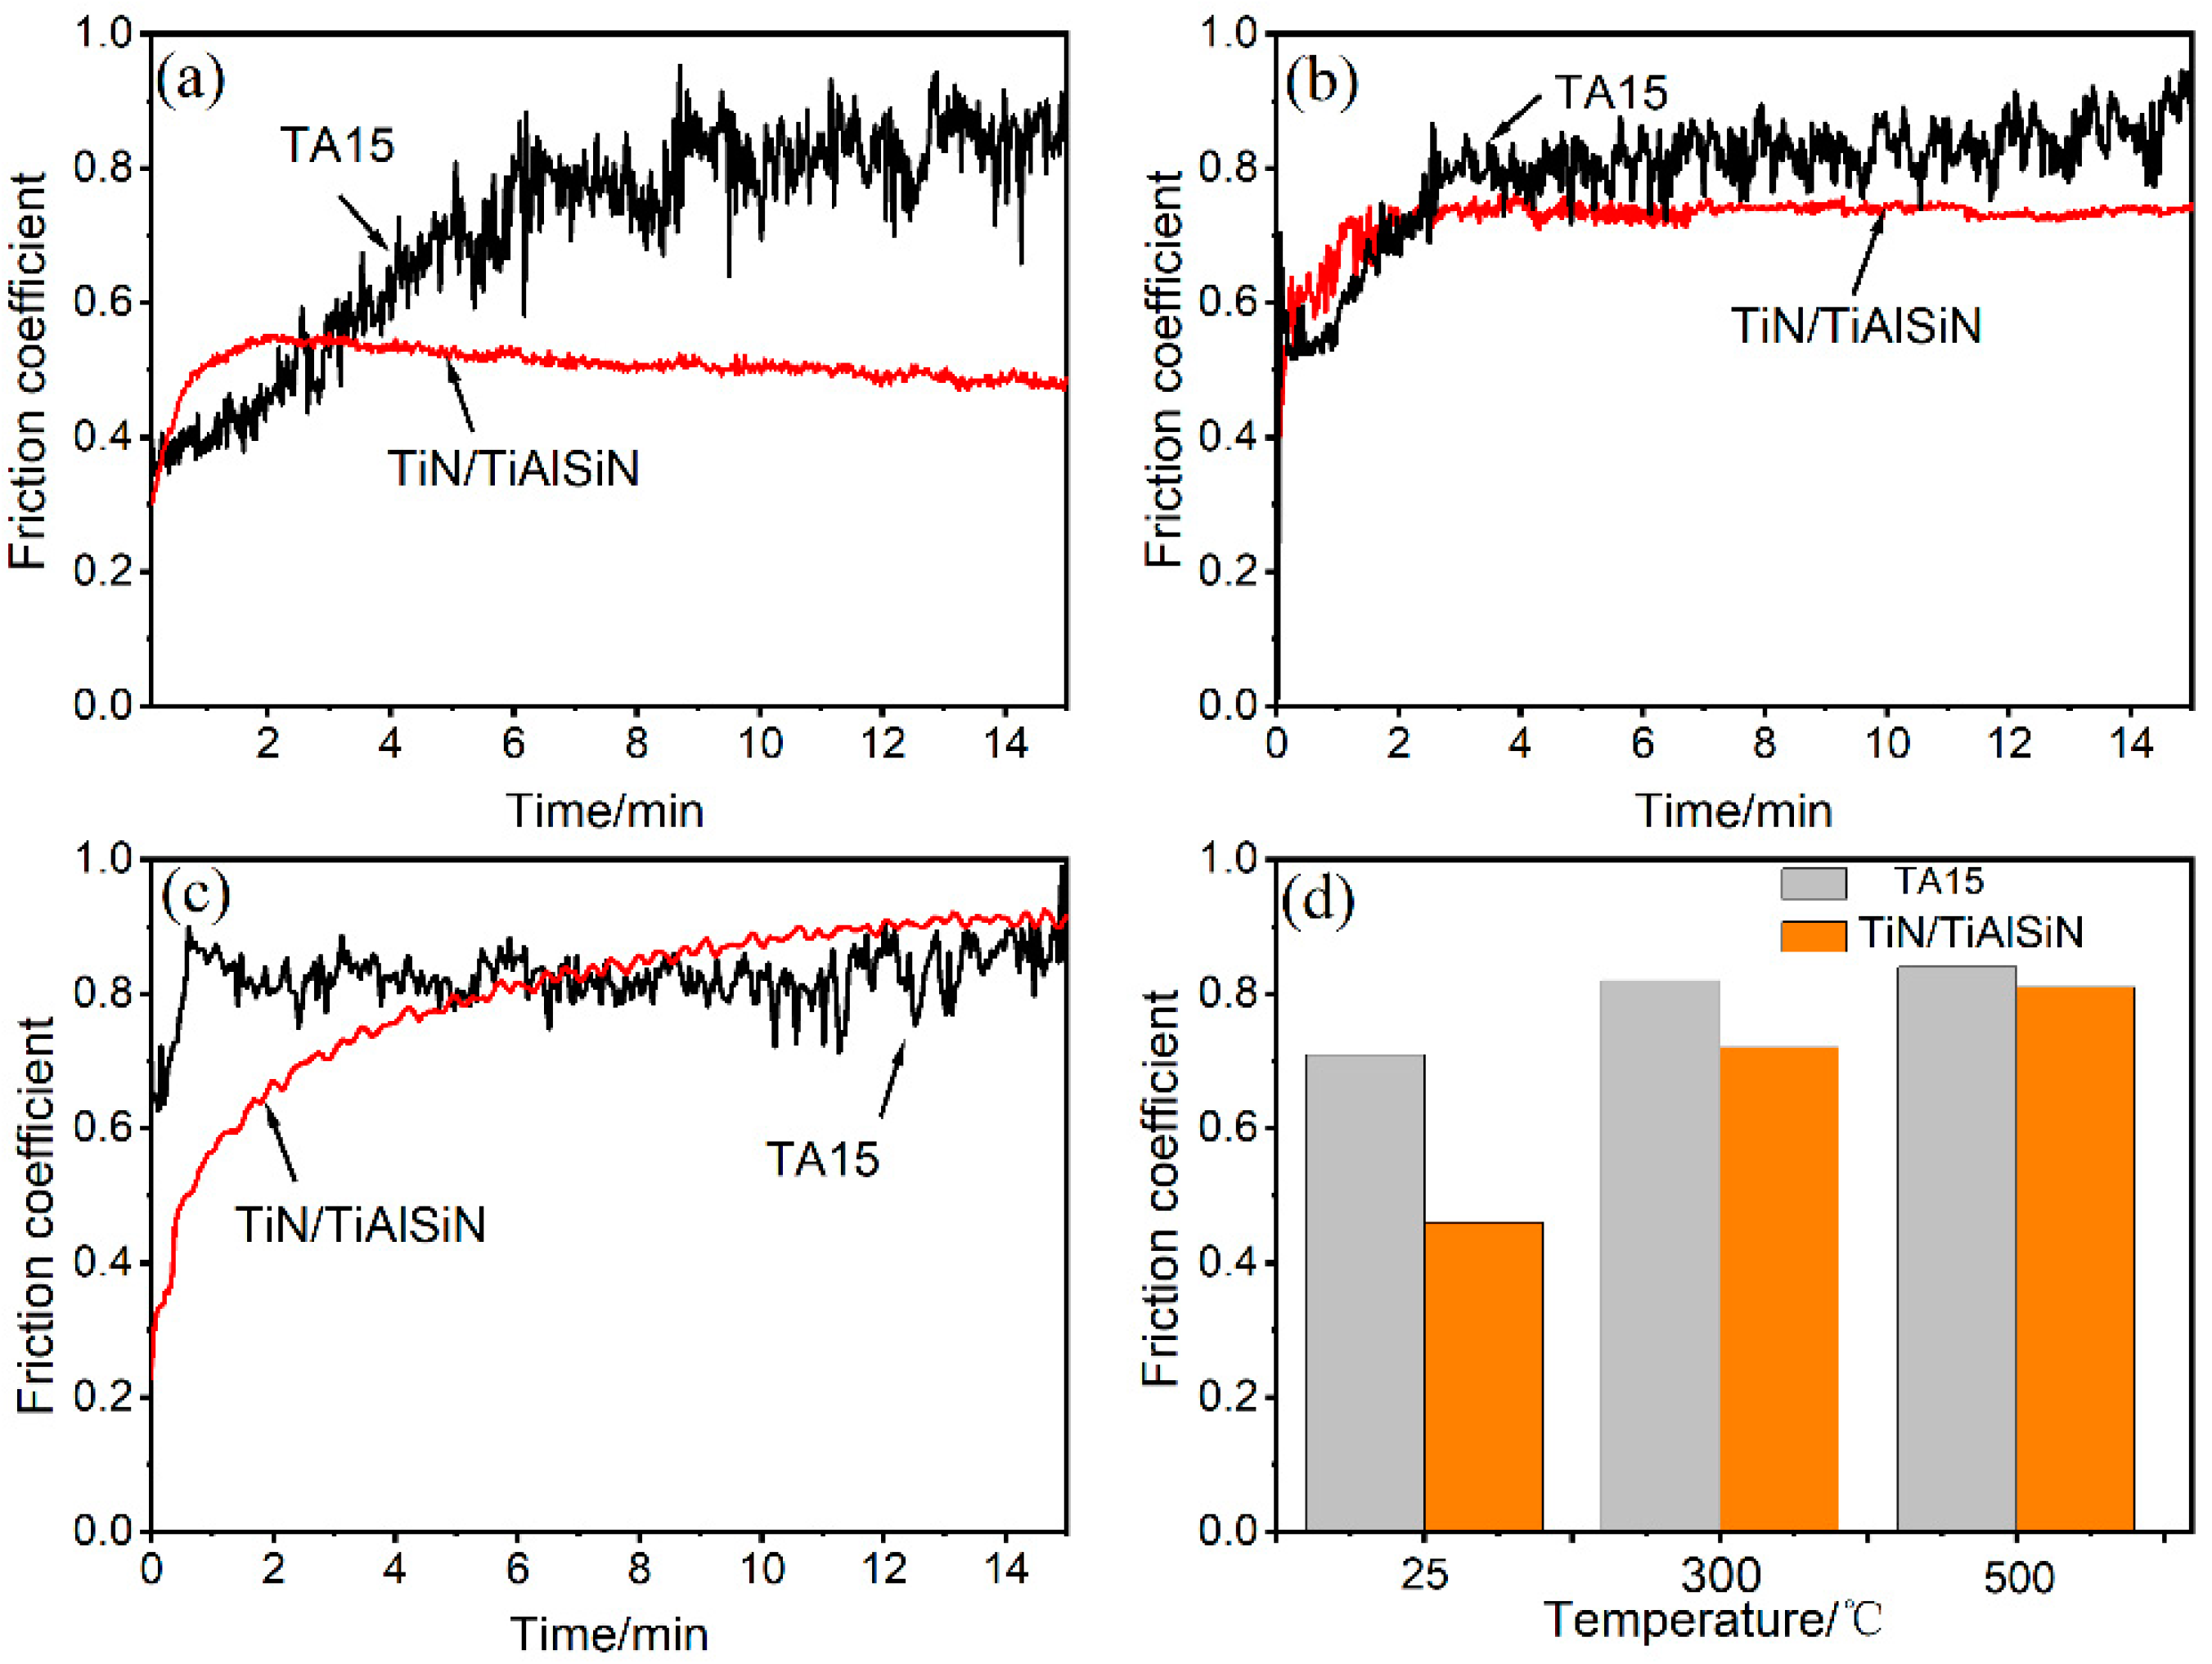
3.5.1. Friction Coefficient

The coefficient of friction (CoF) curves for the TiN/TiAlSiN multilayer-coated samples and the substrates are depicted in Figure 4, showing their relationship with sliding time at various temperatures. The steady CoF of the substrate is higher than that of the coated sample at both 25 °C and 300 °C; however, at 500 °C, the coated sample exhibited a slightly higher CoF (Figure 4a). The substrate exhibited a fluctuating feature at all temperatures, indicating a severe adhesion tendency between the slider and the substrate. This phenomenon can be attributed to the inherent adhesive properties of the titanium alloy. At room temperature, the friction coefficient of the coated sample rapidly stabilized at approximately 0.5, exhibiting a smooth profile. In contrast, the substrate demonstrated oscillations in the friction coefficient, with an average steady-state value of around 0.8. The CoF for the multilayered sample increased from 0.5 to 0.7 as the temperature rose from RT to 300 °C (Figure 4b), whereas the CoF for the substrate remained relatively stable at around 0.8, with a reduction in oscillations. As the temperature reaches 500 °C, the CoF for the multilayered sample initially fell below that of the substrate before subsequently rising above it and stabilizing around 0.85 (Figure 4c).

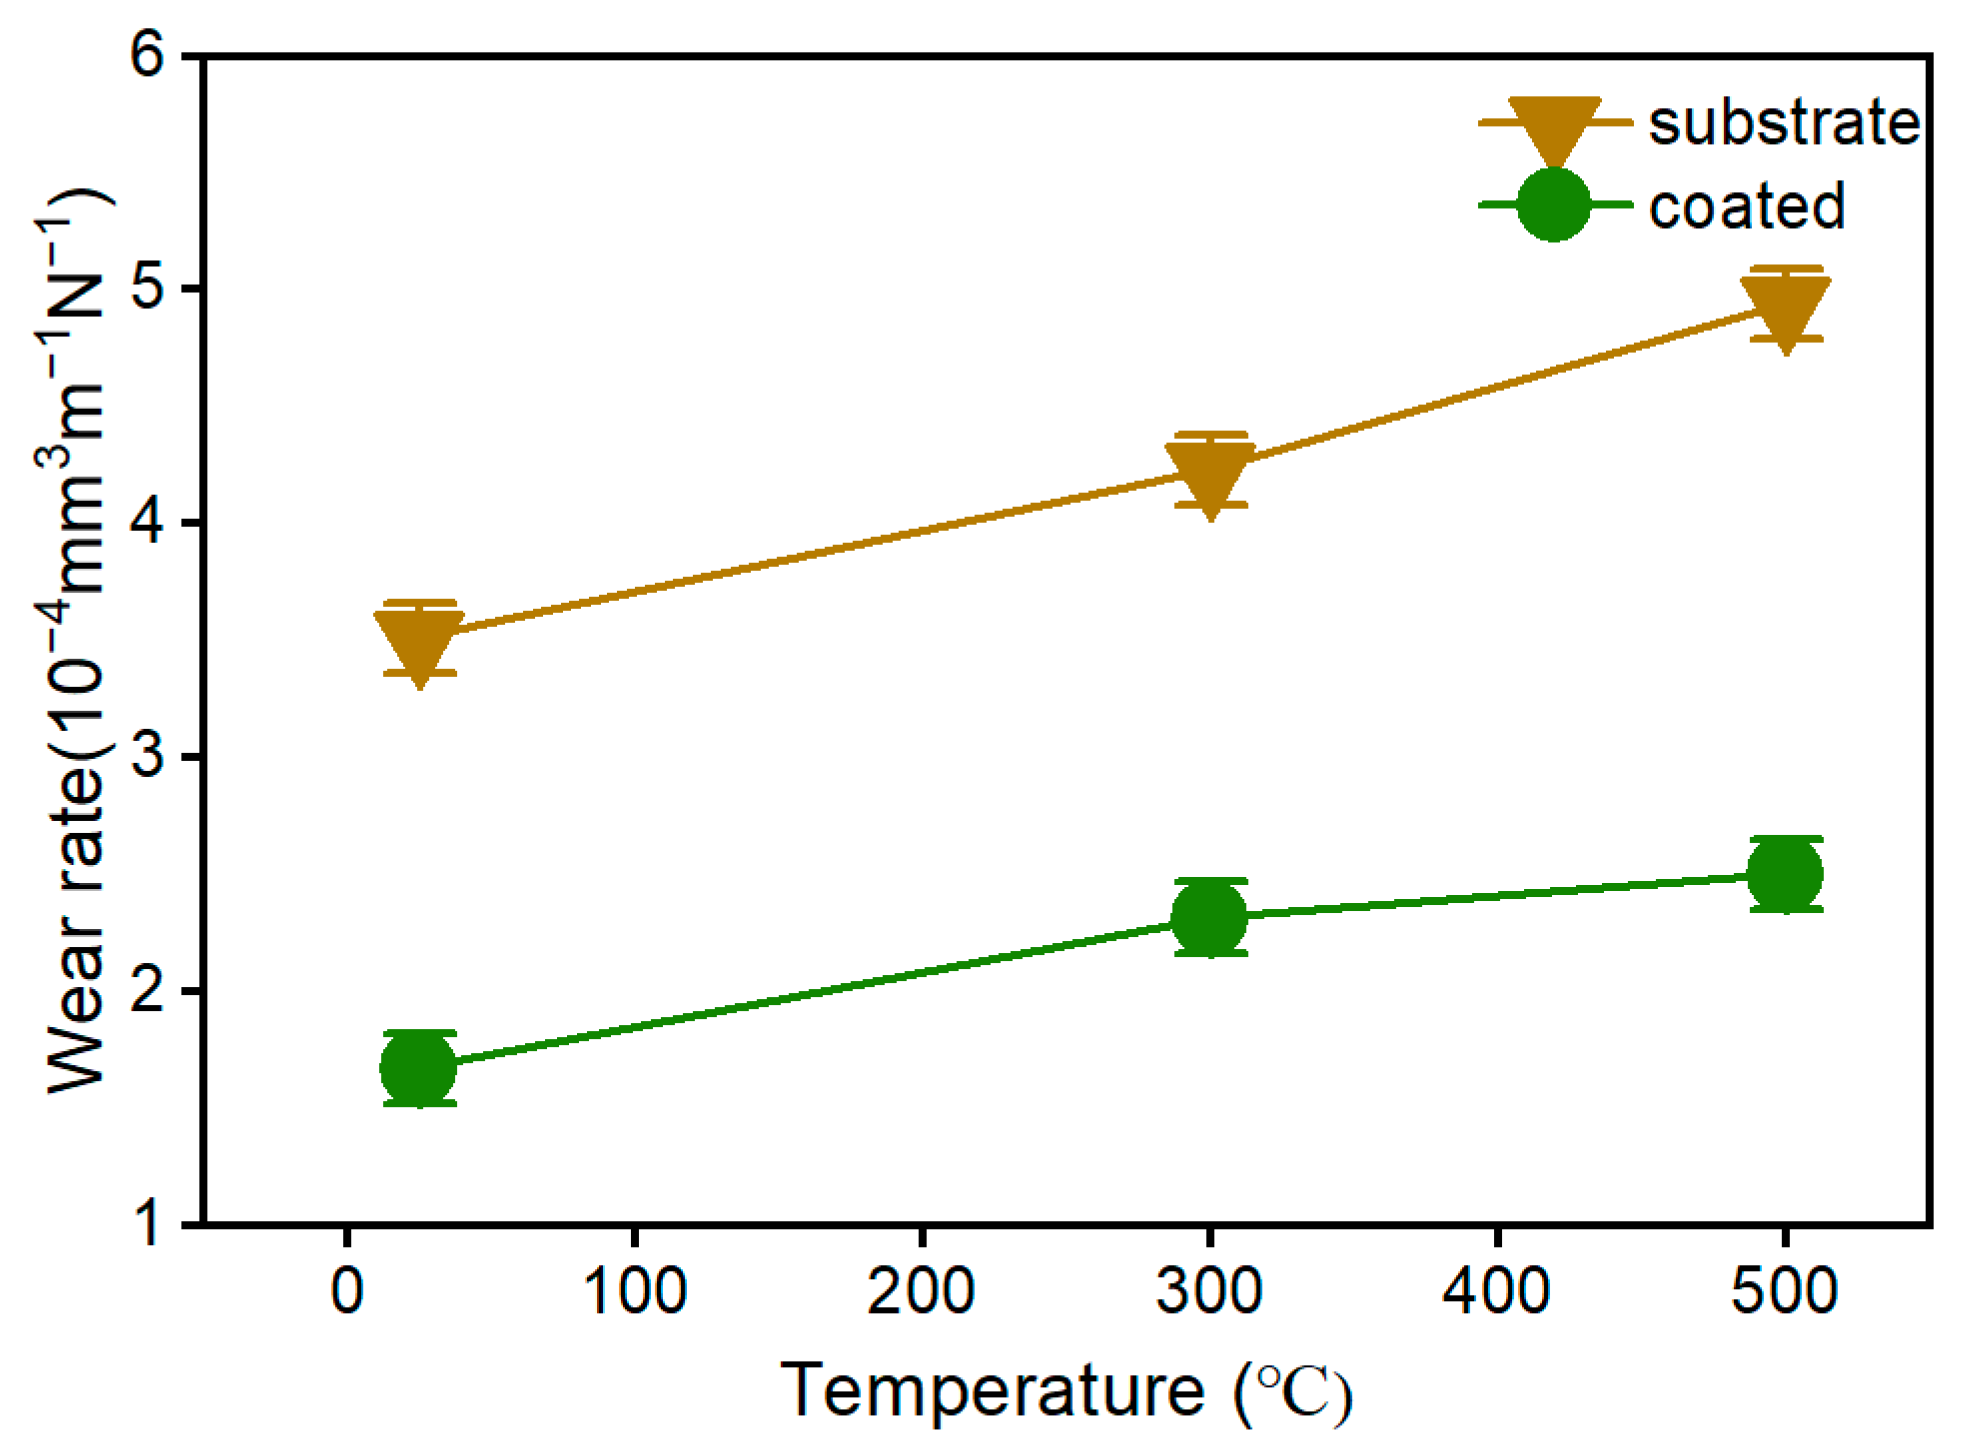
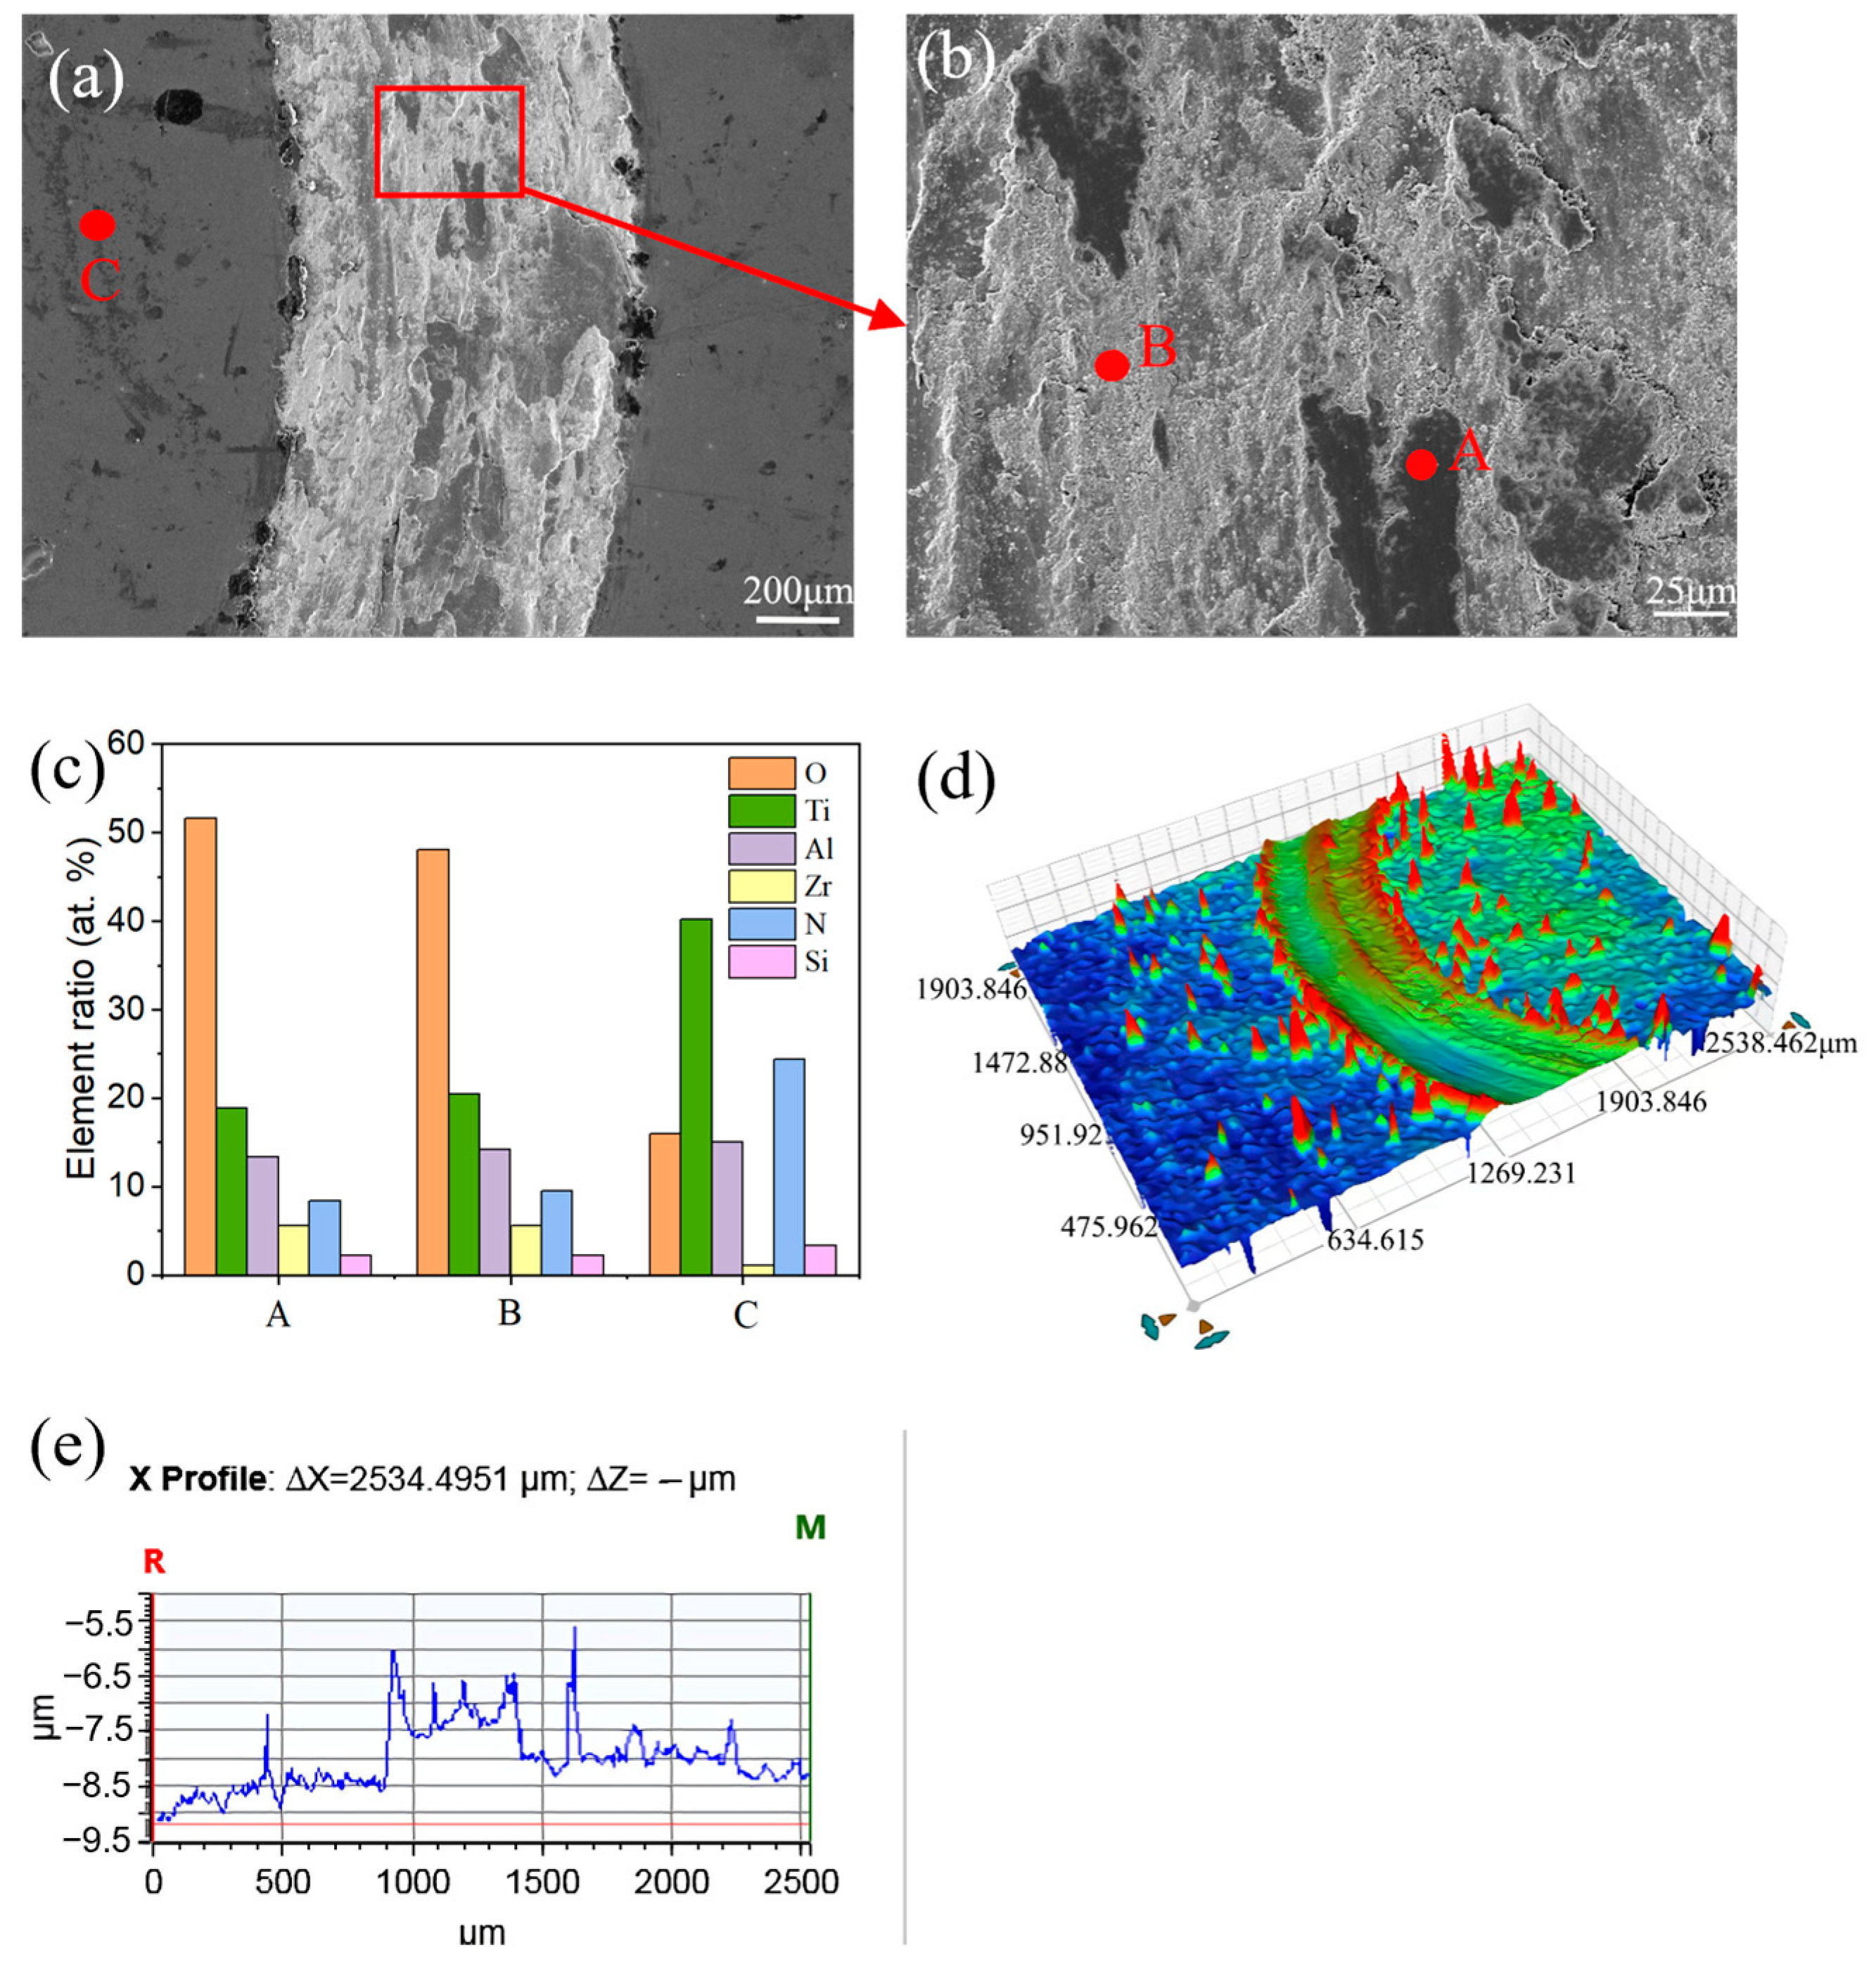
3.5.2. Wear Track Morphologies

Figure 5 displays the 3D morphological analysis of the worn surface on the sample. Table 5 provides the corresponding details and quantifications of wear volume and wear rate, with the wear rates calculated using Equations (1) and (2). In Figure 5a–c, the worn surface of the untreated substrates exhibits a notable presence of deep furrows (20–24 μm in depth and 0.8–1.1 mm in width) along the sliding direction, which can be attributed to the surface deformation caused by the hard surface asperities of the Si3N4 ball. These observations strongly suggest that the dominant wear mechanisms responsible for the uncoated substrate involve both severe abrasive and adhesive wear. In contrast, the coated samples display a wear track depth of 11–15 μm, approximately half that of the substrate, while the width of the wear track (0.7–1.0 mm) remains slightly narrower compared to that of the substrate.
Figure 5d illustrates the formation of a tribo-layer on the surface of the coating, which is formed through the compaction and sintering of wear debris. Notably, the width of the wear track in Figure 5e is wider than that observed at ambient temperature in Figure 5d, albeit without the distinct tribo-layer formation.
To gain a more comprehensive understanding of the wear rate trends in relation to temperature, we have depicted these trends in Figure 6. It is evident that all the coated samples consistently exhibit lower wear rates in comparison to the substrate, regardless of the temperature. Specifically, the slopes representing the wear rate changes between ambient temperature and 300 °C appear nearly identical for both the substrate and the coated samples. However, the wear rate slope for the substrate between 300 °C and 500 °C is notably steeper than that observed for the coated sample. This discrepancy implies that the protective capabilities of the coatings become more pronounced in the temperature range of 300 °C to 500 °C.

3.6. Oxidation Analysis

High-temperature friction can lead to the oxidation of the sample surface and induce plastic deformation, thereby altering the surface structure and characteristics. Consequently, high-temperature stability is a crucial parameter for evaluating high-temperature friction performance. However, the high-temperature oxidation duration was only 15 min; therefore, to gain a better understanding of the oxidation products, the samples were subjected to oxidation for 10 h before conducting the wear test at room temperature.

3.6.1. XPS after Oxidation

Figure 7 presents the high resolution XPS spectrum of Ti2p, Al2p, Si1s, and N1s of the TiN/TiAlSiN-coated sample after 10 h oxidation at 500 °C. Figure 7a shows the spectrum of Ti 2p, where the binding states were derived through deconvolution of the spectrum using the Gaussian–Lorentzian mixed function fitting method. The spectrum is resolved into four peaks located at 455.3 eV, 458.4 eV, 461.5 eV, and 464.4 eV, with one set of conjugated peaks corresponding to TiN and another set corresponding to Ti-O. The N 1s spectrum exhibits three components, with peaks at 396.2 eV, 399.7 eV, and 403.4 eV, corresponding to the characteristic features of Ti(Al)N, Si3N4 and N-H. Based on the analysis of Figure 2, it can be concluded that the oxidation process results in an increased formation of TiO2. Additionally, Si3N4 remains present, while the predominant phase of Ti(Al)N undergoes a transition from the TiN (111) phase to the Ti3AlN (111) phase, both of which maintain a cubic structure.

3.6.2. Wear Behavior at Room Temperature Subsequent to Oxidation

Figure 8 shows the wear track after the oxidation experiment. Notably, the width of the wear track in Figure 8a appears narrower than that observed in Figure 5f. After oxidation at 500 °C, the surface exhibits a discernibly darker hue compared to the original coating color, while the wear track itself appears white. Figure 8b provides an enlarged view of the region enclosed by the red frame in Figure 8a. Within this region, two predominant morphological features are discernible: one is characterized by a white, powdery substance, while the other exhibits a black, sintered-layered structure. To further elucidate the composition of the coating after oxidation, we conducted EDS analysis at three distinct locations within the wear track and on the coating. The results indicate that the post-oxidation composition of the coating is predominantly Ti0.40Al0.15O0.16Si0.03N0.25 (as shown in Figure 8c), with a trace presence of 1% Zr detected from the substrate.
The chemical composition of positions A and B within the wear track shows an oxygen content nearly three times higher than that observed in position C. This substantial disparity suggests that the predominant wear mechanism at medium temperatures is oxidative wear. In Figure 8d–e, it is evident that sintered debris adheres to the wear track and, in certain areas, reaches a higher height than the coating itself. The presence of oxides within the debris contributes to an overall increase in debris volume, rendering it challenging to accurately quantify the wear loss.

3.6.3. Scratch after Oxidation

Scratch experiments are typically employed to elucidate wear and deformation mechanisms in both metallic and ceramic materials. However, when conducted at elevated temperatures, an intricate interplay of chemical interactions and adhesion phenomena often manifests between the indenter and the coated surfaces [53]. Consequently, the deformation mechanisms at medium to elevated temperatures tend to exhibit greater complexity compared to those observed at room temperature. Figure 9 presents an analysis of acoustic emission intensity and the characteristics of the scratch track for the sample after oxidation test. In Figure 9a, a notable spike in acoustic emission intensity is observed at approximately 26 N, which is lower than the 52.3 N recorded in the one without oxidation test, as illustrated in Figure 3a. It is noteworthy that the post-oxidation sample exhibits a considerably higher number of signal peaks compared to the non-oxidized sample. In Figure 3, the surface maintains consistent smoothness along the entire scratch track, except for the rupture position where these peaks appeared. Conversely, in the post-oxidation scenario, SEM imaging does not reveal a pronounced rupture position, but instead, in the latter half of the scratch track, flaking phenomena occur on both sides of the track.
Figure 9c–e provides magnified images at various segments along the scratch track: the initial segment (Figure 9c), the midsection (Figure 9d), and the terminal segment (Figure 9e). In the initial segment, the debris undergoes compression and removal of some coating materials, but remnants of droplets are still discernible beneath the wear track. At the midsection, peel-offs become evident on both sides of the track, corresponding to the acoustic signals subsequent to the initial occurrence of the first peel-off event. This observation implies that the sample experiences heightened brittleness after the oxidation test, leading to the compression of the coating debris into the softer substrate. This, in turn, results in substrate removal and lateral peel-offs of the coating. The end of the scratch track does not show much difference before and after the oxidation test. In Figure 9f, as observed in the latter half segment of the wear track through EDS mapping, the substrate becomes exposed.

4. Conclusions

The TiN/TiAlSiN multilayer coatings were deposited on titanium alloy by multi-arc ion plating. The cross-sectional morphology shows clear layered structure, devoid of any observed holes and cracks.
The XRD results revealed that the TiN/TiAlSiN multilayer coatings are composed of cubic Ti (Al) N, where Al substitutes for Ti in the TiN structure, alongside small amounts of Ti, TiO2 and Al peaks.
The coating shows good adhesion with the substrate with a critical load of 52.3 N. Wear tests were performed at temperatures of 25 °C, 300 °C, and 500 °C using a ball-on-disk tribometer. The wear rate has a sharp increase from 25 °C to 300 °C compared to from 300 °C to 500 °C, which shows the coating has better protection especially at the medium temperature. From the scratch test, it shows different scratch track morphology between the sample before and after the oxidation test.
After the oxidation test, the predominant phase of Ti(Al)N undergoes a transition from the TiN (111) phase to the Ti3AlN (111) phase, which maintains a cubic structure. Additionally, oxidation process results in an increased formation of TiO2, with the composition of Ti0.40Al0.15O0.16Si0.03N0.25. The scratch test indicated that the critical load decreased to 26 N, yet the adhesive properties remained relatively good.

Author Contributions

Conceptualization, H.M. and Q.M.; methodology, H.M.; software, H.M.; validation, H.M., W.L. and S.S; formal analysis, H.M., W.L., S.S., Y.Q., F.J. and X.C., Investigation, H.M., W.L., S.S., Y.Q., F.J. and X.C., data curation, Q.M., writing—original draft preparation, H.M., writing—review and editing, H.M., Q.M., Y.Q., visualization, F.J.; supervision, W.L.; project administration, Q.M.; funding acquisition, Q.M. All authors have read and agreed to the published version of the manuscript.

Funding

This work was supported financially by the National Major Science and Technology Projects of China (Y2022-III-0004-0013), the National Natural Science Foundation of China (Grant No. 52272065), the Fundamental Research Fund for the Central Universities (No. NP2022424).

Institutional Review Board Statement

Not applicable.

Informed Consent Statement

Not applicable.

Data Availability Statement

Data are contained within the article.

Acknowledgments

The authors acknowledge the facilities in the center for Microscopy and Analysis at Nanjing University of Aeronautics and Astronautics.

Conflicts of Interest

The authors declare no competing interests.

References

  1. Li, G.; Ma, F.; Liu, P.; Qi, S.; Li, W.; Zhang, K.; Chen, X. Review of micro-arc oxidation of titanium alloys: Mechanism, properties and applications. J. Alloys Compd. 2023, 948, 169773. [Google Scholar] [CrossRef]
  2. Singh, G. Hot deformation behavior of a novel alpha + beta titanium alloy TIMETAL®407. J. Alloys Compd. 2023, 935, 167970. [Google Scholar] [CrossRef]
  3. Uwanyuze, R.S.; Kanyo, J.E.; Myrick, S.F.; Schafföner, S. A review on alpha case formation and modeling of mass transfer during investment casting of titanium alloys. J. Alloys Compd. 2021, 865, 158558. [Google Scholar] [CrossRef]
  4. Lu, J.; Zhuo, L. Additive manufacturing of titanium alloys via selective laser melting: Fabrication, microstructure, post-processing, performance and prospect. Int. J. Refract. Met. Hard Mater. 2023, 111, 106110. [Google Scholar] [CrossRef]
  5. Han, X.; Ma, J.; Tian, A.; Wang, Y.; Li, Y.; Dong, B.; Tong, X.; Ma, X. Surface modification techniques of titanium and titanium alloys for biomedical orthopaedics applications: A review. Colloids Surf. 2023, 227, 113339. [Google Scholar] [CrossRef]
  6. Al-Mukhtar, A.; Könke, C. Crack simulation in human teeth. Mater. Des. Process. Commun. 2021, 3, e200. [Google Scholar] [CrossRef]
  7. Wang, K.; Liu, G.; Tao, W.; Zhao, J.; Huang, K. Study on the mixed dynamic recrystallization mechanism during the globularization process of laser-welded TA15 Ti-alloy joint under hot tensile deformation. Mater. Charact. 2017, 126, 57–63. [Google Scholar] [CrossRef]
  8. Chen, Y.; Li, S.; Li, Y.; Wang, Y.; Li, Z.; Lin, Z. Constitutive modeling of TA15 alloy sheet coupling phase transformation in non-isothermal hot stamping process. J. Mater. Res. Technol. 2021, 12, 629–642. [Google Scholar] [CrossRef]
  9. Xu, X.; Liu, Q.; Wang, J.; Ren, X.; Hou, H. The heat treatment improving the mechanical and fatigue property of TA15 alloy joint by friction stir welding. Mater. Charact. 2021, 180, 111399. [Google Scholar] [CrossRef]
  10. Wang, C.; Guo, Q.; Shao, M.; Zhang, H.; Wang, F.; Song, B.; Ji, Y.; Li, H. Microstructure and corrosion behavior of linear friction welded TA15 and TC17 dissimilar joint. Mater. Charact. 2022, 187, 111871. [Google Scholar] [CrossRef]
  11. Ananth, M.P.; Ramesh, R. Sliding wear characteristics of solid lubricant coating on titanium alloy surface modified by laser texturing and ternary hard coatings. Trans. Nonferrous Met. Soc. China Engl. Ed. 2017, 27, 839–847. [Google Scholar] [CrossRef]
  12. Dong, H.; Bell, T. Enhanced wear resistance of titanium surfaces by a new thermal oxidation treatment. Wear 2000, 238, 131–137. [Google Scholar] [CrossRef]
  13. Lee, C.; Sanders, A.; Tikekar, N.; Chandran, K.S.R. Tribology of titanium boride-coated titanium balls against alumina ceramic: Wear, friction, and micromechanisms. Wear 2008, 265, 375–386. [Google Scholar] [CrossRef]
  14. Wu, L.; Holloway, B.C.; Prasad Beesabathina, D.; Kalil, C.; Manos, D.M. Analysis of diamond-like carbon and TirMoS coatings on 2 Ti6Al4V substrates for applicability to turbine engine applications. Surf. Coat. Technol. 2000, 130, 207–217. [Google Scholar] [CrossRef]
  15. Mayrhofer, P.H.; Mitterer, C.; Hultman, L.; Clemens, H. Microstructural design of hard coatings. Prog. Mater. Sci. 2006, 51, 1032–1114. [Google Scholar] [CrossRef]
  16. Veprek, S.; Veprek-Heijman, M.J.G. Industrial applications of superhard nanocomposite coatings. Surf. Coat. Technol. 2008, 202, 5063–5073. [Google Scholar] [CrossRef]
  17. Hovsepian, P.E.; Lewis, D.B.; Luo, Q.; Münz, W.D.; Mayrhofer, P.H.; Mitterer, C.; Zhou, Z.; Rainforth, W.M. TiAlN based nanoscale multilayer coatings designed to adapt their tribological properties at elevated temperatures. Thin Solid Films 2005, 485, 160–168. [Google Scholar] [CrossRef]
  18. Alling, B.; Ruban, A.V.; Karimi, A.; Peil, O.E.; Simak, S.I.; Hultman, L.; Abrikosov, I.A. Mixing and decomposition thermodynamics of c- Ti1-x Alx N from first-principles calculations. Phys. Rev. B-Condens. Matter Mater. Phys. 2007, 75, 045123. [Google Scholar] [CrossRef]
  19. Chen, Q.; Sundman, B. Thermodynamic Assessment of the Ti-AI-N System. J. Phase Equilibria 1998, 19, 146–160. [Google Scholar] [CrossRef]
  20. Saha, B.; Lawrence, S.K.; Schroeder, J.L.; Birch, J.; Bahr, D.F.; Sands, T.D. Enhanced hardness in epitaxial TiAlScN alloy thin films and rocksalt TiN/(Al,Sc)N superlattices. Appl. Phys. Lett. 2014, 105, 151904. [Google Scholar] [CrossRef]
  21. Gui, B.; Zhou, H.; Zheng, J.; Liu, X.; Feng, X.; Zhang, Y.; Yang, L. Microstructure and properties of TiAlCrN ceramic coatings deposited by hybrid HiPIMS/DC magnetron co-sputtering. Ceram. Int. 2021, 47, 8175–8183. [Google Scholar] [CrossRef]
  22. Zhu, L.; Song, C.; Ni, W.; Liu, Y. Effect of 10% Si addition on cathodic arc evaporated TiAlSiN coatings. Trans. Nonferrous Met. Soc. China Engl. Ed. 2016, 26, 1638–1646. [Google Scholar] [CrossRef]
  23. Ju, H.; Yu, L.; He, S.; Asempah, I.; Xu, J.; Hou, Y. The enhancement of fracture toughness and tribological properties of the titanium nitride films by doping yttrium. Surf. Coat. Technol. 2017, 321, 57–63. [Google Scholar] [CrossRef]
  24. Zhu, L.; Hu, M.; Ni, W.; Liu, Y. High temperature oxidation behavior of Ti 0.5Al 0.5N coating and Ti 0.5Al 0.4Si 0.1N coating. Vacuum 2012, 86, 1795–1799. [Google Scholar] [CrossRef]
  25. Veprek, S.; Männling, H.D.; Jilek, M.; Holubar, P. Avoiding the high-temperature decomposition and softening of (Al1-xTix)N coatings by the formation of stable superhard nc-(Al1-xTix)N/a-Si3 N4 nanocomposite. Mater. Sci. Eng. A 2004, 366, 202–205. [Google Scholar] [CrossRef]
  26. Gao, F.; Li, G.; Xia, Y. Influence of hysteresis effect on properties of reactively sputtered TiAlSiN films. Appl. Surf. Sci. 2018, 431, 160–164. [Google Scholar] [CrossRef]
  27. Cao, F.; Munroe, P.; Zhou, Z.; Xie, Z. Influence of substrate bias on microstructural evolution and mechanical properties of TiAlSiN thin films deposited by pulsed-DC magnetron sputtering. Thin Solid Films 2017, 639, 137–144. [Google Scholar] [CrossRef]
  28. Li, G.; Sun, J.; Xu, Y.; Xu, Y.; Gu, J.; Wang, L.; Huang, K.; Liu, K.; Li, L. Microstructure, mechanical properties, and cutting performance of TiAlSiN multilayer coatings prepared by HiPIMS. Surf. Coat. Technol. 2018, 353, 274–281. [Google Scholar] [CrossRef]
  29. Carvalho, S.; Ribeiro, E.; Rebouta, L.; Tavares, C.; Mendonça, J.P.; Caetano Monteiro, A.; Carvalho, N.J.M.; De Hosson, J.T.M.; Cavaleiro, A. Microstructure, mechanical properties and cutting performance of superhard (Ti,Si,Al)N nanocomposite films grown by d.c. reactive magnetron sputtering. Surf. Coat. Technol. 2004, 177–178, 459–468. [Google Scholar] [CrossRef]
  30. Lü, W.; Li, G.; Zhou, Y.; Liu, S.; Wang, K.; Wang, Q. Effect of high hardness and adhesion of gradient TiAlSiN coating on cutting performance of titanium alloy. J. Alloys Compd. 2020, 820, 153137. [Google Scholar] [CrossRef]
  31. De Mello, J.D.B.; Binder, R.; Demas, N.G.; Polycarpou, A.A. Effect of the actual environment present in hermetic compressors on the tribological behaviour of a Si-rich multifunctional DLC coating. Wear 2009, 267, 907–915. [Google Scholar] [CrossRef]
  32. Salvaro, D.B.; Silvério, M.; Binder, C.; Giacomelli, R.O.; Klein, A.N.; De Mello, J.D.B. Genesis and stability of tribolayers in solid lubrication: Case of pair DLC-stainless steel. J. Mater. Res. Technol. 2016, 5, 136–143. [Google Scholar] [CrossRef]
  33. Straffelini, G.; Molinari, A. Dry sliding wear of Ti-6Al-4V alloy as influenced by the counterface and sliding conditions. Wear 1999, 236, 328–338. [Google Scholar] [CrossRef]
  34. Dutt Sharma, M.; Sehgal, R. Dry Sliding Friction and Wear Behaviour of Titanium Alloy (Ti-6Al-4V). Tribol. Online 2012, 7, 87–95. [Google Scholar] [CrossRef]
  35. Molinari, A.; Straffelini, G.; Tesi, B.; Bacci, T. Dry sliding wear mechanisms of the Ti6Al4V alloy. Wear 1997, 208, 105–112. [Google Scholar] [CrossRef]
  36. Cui, X.H.; Mao, Y.S.; Wei, M.X.; Wang, S.Q. Wear Characteristics of Ti-6Al-4V Alloy at 20–400 °C. Tribol. Trans. 2012, 55, 185–190. [Google Scholar] [CrossRef]
  37. He, N.; Li, H.; Ji, L.; Liu, X.; Zhou, H.; Chen, J. High temperature tribological properties of TiAlSiN coatings produced by hybrid PVD technology. Tribol. Int. 2016, 98, 133–143. [Google Scholar] [CrossRef]
  38. Chen, K.M.; Zhang, Q.Y.; Li, X.X.; Wang, L.; Cui, X.H.; Wang, S.Q. Comparative Study of Wear Behaviors of a Selected Titanium Alloy and AISI H13 Steel as a Function of Temperature and Load. Tribol. Trans. 2014, 57, 838–845. [Google Scholar] [CrossRef]
  39. Tse, Y.Y.; Babonneau, D.; Michel, A.; Abadias, G. Nanometer-scale multilayer coatings combining a soft metallic phase and a hard nitride phase: Study of the interface structure and morphology. Surf. Coat. Technol. 2004, 180–181, 470–477. [Google Scholar] [CrossRef]
  40. Clemens, B.M.; Kung, H.; Barnett, S.A. Structure and strength of multilayers. MRS Bull. 1999, 24, 20–26. [Google Scholar] [CrossRef]
  41. Anderson, P.M.; Li, C. Hall-Petch relations for multilayered materials. Namshurmrcd Mataiak 1995, 5, 349–362. [Google Scholar] [CrossRef]
  42. Koehler, J.S. Attempt to Design a Strong Solid. Phys. Rev. B 1970, 2, 547–551. [Google Scholar] [CrossRef]
  43. Geyang, L.; Zenghu, H.; Jiawan, T.; Junhua, X.; Mingyuan, G. Alternating stress field and superhardness effect in TiN/NbN superlattice films. J. Vac. Sci. Technol. A Vac. Surf. Film. 2002, 20, 674–677. [Google Scholar] [CrossRef]
  44. Ma, H.; Miao, Q.; Zhang, G.; Liang, W.; Wang, Y.; Sun, Z.; Lin, H. The influence of multilayer structure on mechanical behavior of TiN/TiAlSiN multilayer coating. Ceram. Int. 2021, 47, 12583–12591. [Google Scholar] [CrossRef]
  45. Kato, K. 3—Friction and wear of passive metals and coatings. Tribocorrosion Passive Metals Coatings 2011, 82. [Google Scholar] [CrossRef]
  46. Bhushan, B. Principles and applications of tribology. Ind. Lubr. Tribol. 1999, 51, 313. [Google Scholar] [CrossRef]
  47. Pelleg, J.; Zevin, L.Z.; Lungo, S.; Croitoru, N. Reactive-sputter-deposited TiN films on glass substrates. Thin Solid Films 1991, 197, 117–128. [Google Scholar] [CrossRef]
  48. Harris, G.B.X. Quantitative measurement of preferred orientation in rolled uranium bars. Lond. Edinb. Dublin Philos. Mag. J. Sci. 1952, 43, 113–123. [Google Scholar] [CrossRef]
  49. Ma, X.; Matthews, A. Investigation of abradable seal coating performance using scratch testing. Surf. Coat. Technol. 2007, 202, 1214–1220. [Google Scholar] [CrossRef]
  50. Zhang, Z.X.; Dong, H.; Bell, T. The load bearing capacity of hydrogen-free Cr-DLC coatings on deep-case oxygen hardened Ti6Al4V. Surf. Coat. Technol. 2006, 200, 5237–5244. [Google Scholar] [CrossRef]
  51. Chen, Z.; Wu, L.Y.L.; Chwa, E.; Tham, O. Scratch resistance of brittle thin films on compliant substrates. Mater. Sci. Eng. A 2008, 493, 292–298. [Google Scholar] [CrossRef]
  52. Hogmark, S.; Jacobson, S.; Larsson, M. Design and evaluation of tribological coatings. Wear 2000, 246, 20–33. [Google Scholar] [CrossRef]
  53. Kong, X.; Wang, B.; Wang, M.; Zheng, Y.; Ma, S.; Yang, L. Microscratch characteristic and deformation mechanism of SiC particle-reinforced composites at elevated temperatures. Adv. Compos. Lett. 2020, 29. [Google Scholar] [CrossRef]
Figure 1. Cross-sectional morphology of TiN/TiAlSiN multilayer coating: (a) SEM morphology, (b) cross-section line scan, (c) layer Ⅰ-the Ti buffer layer point scan, (d) layer Ⅱ: the TiN layer point scan, (e) layer Ⅲ: the TiAlSiN layer point scan.
Coatings 14 01139 g001
Figure 2. θ-2θ X-ray diffractograms of TiN/TiAlSiN multilayer coating before and after oxidation test. ICDD data: TiN 00-038-1420 in green color, Ti3AlN 00-038-1140 in purple color.
Coatings 14 01139 g002
Figure 3. The scratch of the multilayer coated sample. (a) Acoustic emission intensity and (b) SEM morphology of scratch track; (c) the rupture position of the coating; (df) the enlarged detail image; (g) EDS mapping of the figure in (d).
Coatings 14 01139 g003
Figure 4. Friction coefficient of substrate and coated sample at different temperature. (a) Ambient temperature, (b) 300 °C, (c) 500 °C, (d) the average CoF.
Coatings 14 01139 g004
Figure 5. SEM images and 3D profiles of the wear tracks of the substrates and the coated samples at different temperatures: substrate at (a) room temperature (RT), (b) 300 °C, and (c) 500 °C; coated sample at (d) RT, (e) 300 °C, and (f) 500 °C.
Coatings 14 01139 g005
Figure 6. Specific wear rate of the coated sample at different temperature.
Coatings 14 01139 g006
Figure 7. XPS results of the multilayered coated sample surface after oxidation. (a) Ti 2p, (b) Al 2p, (c) Si 2p, (d) N 1s.
Coatings 14 01139 g007
Figure 8. SEM, EDS result and 3D profile of the wear track of the coated sample oxide in 500 °C for 10 h. (a) SEM of wear track morphology, (b) enlarged image of the red box in Figure 8a; A and B represent the positions of the EDS points for compacted and powdery debris, respectively. (c) The composition of two types of debris and the coating surface after oxidation, (d) 3D morphology, (e) the depth profile of the wear track.
Coatings 14 01139 g008
Figure 9. Details of scratch track after oxidation test. (a) Acoustic emission intensity and, (b) SEM morphology, (ce) the enlarged detail image of the initial part, middle part and bottom part of the scratch track, (f) EDS mapping of the substrate exposed position.
Coatings 14 01139 g009
Table 1. Chemical composition of TA15.
ElementAlVZrMoFeSiCTi
Wt.%6.232.031.751.050.060.050.02Bal.
Table 2. Deposition parameter of TiN/TiAlSiN multilayer.
TypeVoltage/VDuty RatioCurrent/AAr Flow/SccmN2 Flow/SccmTime/minTemp/°C
Ti buffer layer22572.7%708303200
TiN layer22572.7%7050703/layer200
TiAlSiN layer22572.7%7550703/layer200
Table 3. The texture coefficient of TiN/TiAlSiN multilayer coating before and after oxidation.
Peak PositionPlanes (hkl)TC (before Oxidation)TC (after Oxidation)
38.07(111)2.670.43
43.7(200)0.531.84
63.7(220)0.431.03
76.83(311)0.370.7
Table 4. Micro Vickers hardness of TA 15 and TiN/TiAlSiN multilayer coating.
Position1/HV0.12/HV0.13/HV0.14/HV0.15/HV0.1Average/HV0.1
TA15386 ± 0.9342 ± 0.6326 ± 0.5356 ± 0.5341 ± 0.4350.2 ± 0.5
TiN/TiAlSiN1533 ± 1.81717 ± 2.41485 ± 2.71426 ± 1.51541 ± 2.81540 ± 2.2
Table 5. The depth and width of the wear tracks.
Tem/°CSampleDepth/μmWidth/mmWear Volume V/mm3Wear Rate K/10−4mm3m−1N−1
20TA1520.360.860.14673.5107
TiN/TiAlSiN11.290.740.07001.6747
300TA1522.680.930.17674.2292
TiN/TiAlSiN12.570.920.09682.3180
500TA1523.921.030.20644.9398
TiN/TiAlSiN14.030.890.10462.5030
Disclaimer/Publisher’s Note: The statements, opinions and data contained in all publications are solely those of the individual author(s) and contributor(s) and not of MDPI and/or the editor(s). MDPI and/or the editor(s) disclaim responsibility for any injury to people or property resulting from any ideas, methods, instructions or products referred to in the content.

