Article

ULPING-Based Titanium Oxide as a New Cathode Material for Zn-Ion Batteries

by
Suben Sri Shiam
1,2,
Jyotisman Rath
1,3,*,
Eduardo Gutiérrez Vera
1,4 and
Amirkianoosh Kiani
1,2,*
1
Silicon Hall: Micro/Nano Manufacturing Facility, Ontario Tech University, Oshawa, ON L1G 0C5, Canada
2
Department of Mechanical and Manufacturing Engineering, Ontario Tech University, Oshawa, ON L1G 0C5, Canada
3
Department of Chemical Engineering, Institute of Chemical Technology Mumbai, IndianOil Odisha Campus, Bhubaneswar 751013, India
4
Tonala University Center, University of Guadalajara, Tonalá 45425, Mexico
*
Authors to whom correspondence should be addressed.
Coatings 2024, 14(9), 1163; https://doi.org/10.3390/coatings14091163
Submission received: 20 July 2024 / Revised: 23 August 2024 / Accepted: 29 August 2024 / Published: 9 September 2024

Abstract

:
The need for alternative energy storage options beyond lithium-ion batteries is critical due to their high costs, resource scarcity, and environmental concerns. Zinc-ion batteries offer a promising solution, given zinc’s abundance, cost effectiveness, and safety, particularly its compatibility with non-flammable aqueous electrolytes. In this study, the potential of laser-ablation-based titanium oxide as a novel cathode material for zinc-ion batteries was investigated. The ultra-short laser pulses for in situ nanostructure generation (ULPING) technique was employed to generate nanostructured titanium oxide. This laser ablation process produced highly porous nanostructures, enhancing the electrochemical performance of the electrodes. Zinc and titanium oxide samples were evaluated using two-electrode and three-electrode setups, with cyclic voltammetry (CV), electrochemical impedance spectroscopy (EIS), and galvanostatic charge–discharge (GCD) techniques. Optimal cathode materials were identified in the Ti-5W (laser ablated twice) and Ti-10W (laser ablated ten times) samples, which demonstrated excellent charge capacity and energy density. The Ti-10W sample exhibited superior long-term performance due to its highly porous nanostructures, improving ion diffusion and electron transport. The potential of laser-ablated titanium oxide as a high-performance cathode material for zinc-ion batteries was highlighted, emphasizing the importance of further research to optimize laser parameters and enhance the stability and scalability of these electrodes.

1. Introduction

The global imperative to mitigate climate change has accelerated a significant shift towards renewable energy sources that do not emit greenhouse gases during their generation [1,2]. However, the intermittent nature of renewable energy sources such as solar and wind necessitates effective energy storage solutions to ensure a stable and reliable power supply. This challenge has led to substantial advancements in energy storage technologies, which are critical for the broader adoption of renewable energy. Various battery chemistries have been developed to meet the diverse needs of energy storage applications. Among these, lithium-ion (Li-ion) batteries are the most widely used due to their high energy density, long cycle life, and efficiency. However, the high cost, safety concerns, and limited availability of lithium resources pose significant challenges. Lead-acid batteries, while being cost effective and reliable, suffer from low energy density and short cycle life. Other battery chemistries, such as sodium-ion batteries, are emerging, but are still under development to improve their performance and commercial viability.
Zinc-based batteries have gained attention as a promising alternative due to the abundance, low cost, and non-toxic nature of zinc. Zinc batteries, which use zinc as the anode material, combine the best features of both chemical and electrical energy storage devices [3,4]. Various types of zinc batteries exist, including zinc-ion and zinc–air batteries [5,6,7,8]. Zinc-ion batteries (ZIBs) are known for their fast electron kinetics, high mass energy density, and long lifespan [9,10]; however, the downside is that they lack structural stability for long cycling. Zinc–air batteries (ZABs), on the other hand, have a zinc anode, porous air cathode, membrane separator, and electrolytes, and they have high theoretical energy density but have low practical energy density. However, the development of suitable cathode materials remains a critical challenge that impedes practical application, be it for ZIBs or ZABs. The ideal cathode material for aqueous ZIBs must exhibit high capacity, excellent cycling stability, and good rate performance. Unfortunately, many of the currently available cathode materials suffer from issues such as limited capacity, poor cycling stability, and inadequate conductivity, which hinder the overall performance of ZIBs. Here, our major focus is on optimizing and designing a suitable cathode material specifically for aqueous ZIBs.
Transition metal oxides like nickel, copper, cobalt, iron, vanadium, magnesium, and titanium oxides can be used as cathode materials for zinc batteries. However, their practical capacity is lower than the theoretical one due to low electrical conductivity and compromised cycling stability [11]; thus, effective laser processing methods should be used to improve oxygen nanostructuring in these metals, which, in turn, can enhance their electrochemical properties. Copper oxide, first used in 1870, is a valuable material for battery cathodes due to its affordability and consistent operating voltages [12]. Iron oxide materials like Fe2O3 and Fe3O4 are widely used in zinc-ion batteries due to their affordability, non-toxicity, and environmental benefits [13]. Cobalt oxides have remarkable electrical, thermal, and optical qualities, and have demonstrated exceptional performance as electrocatalysts for zinc air batteries [14]. Manganese oxide, a common element in many fields, is the most researched material for zinc ion batteries due to its low cost, abundance, non-toxicity, and high theoretical capacity [15]. Vanadium oxides, with their diverse oxidation states and large crystal structures, are popular for their ability to insert and remove metal ions [16,17]. One of the transition metal oxides which remains underexplored is TiO2. TiO2 is abundant, cost effective, and environmentally benign, aligning with the sustainability goals of modern energy storage technologies. With its unique crystal structure, affordability, and biocompatibility, it has been increasingly used in electrochemical energy storage due to its capacity, safety, affordability, and superior performance in various battery chemistries including lithium-ion batteries [18,19]. However, not much work has been carried out in the case of TiO2-based cathodes for Zn batteries. The major working mechanism is the oxide nanoparticles, which are responsible for contributing to the overall current flow in the battery and the charging/discharging cycle.
In this paper, we explore the effectiveness of incorporating zinc and titanium oxide materials as electrodes in zinc-ion batteries. The novelty here is that we try to produce a battery electrode using our ULPING method, which is relatively new, unlike previous manufacturing methods. With this, we investigate how modern laser processing techniques can impact the electrochemical behavior of these electrodes, and whether it is an improvement compared to conventional techniques [20,21,22].

2. Materials and Methodology

2.1. Materials

The materials used include titanium foil (99% purity), Zn foil (98% purity), potassium hydroxide (KOH, pellets), distilled water, Whatman 40 Filter papers, Cu foil as connecting tape, Pt wire (counter electrode), Hg/HgO electrode (reference).

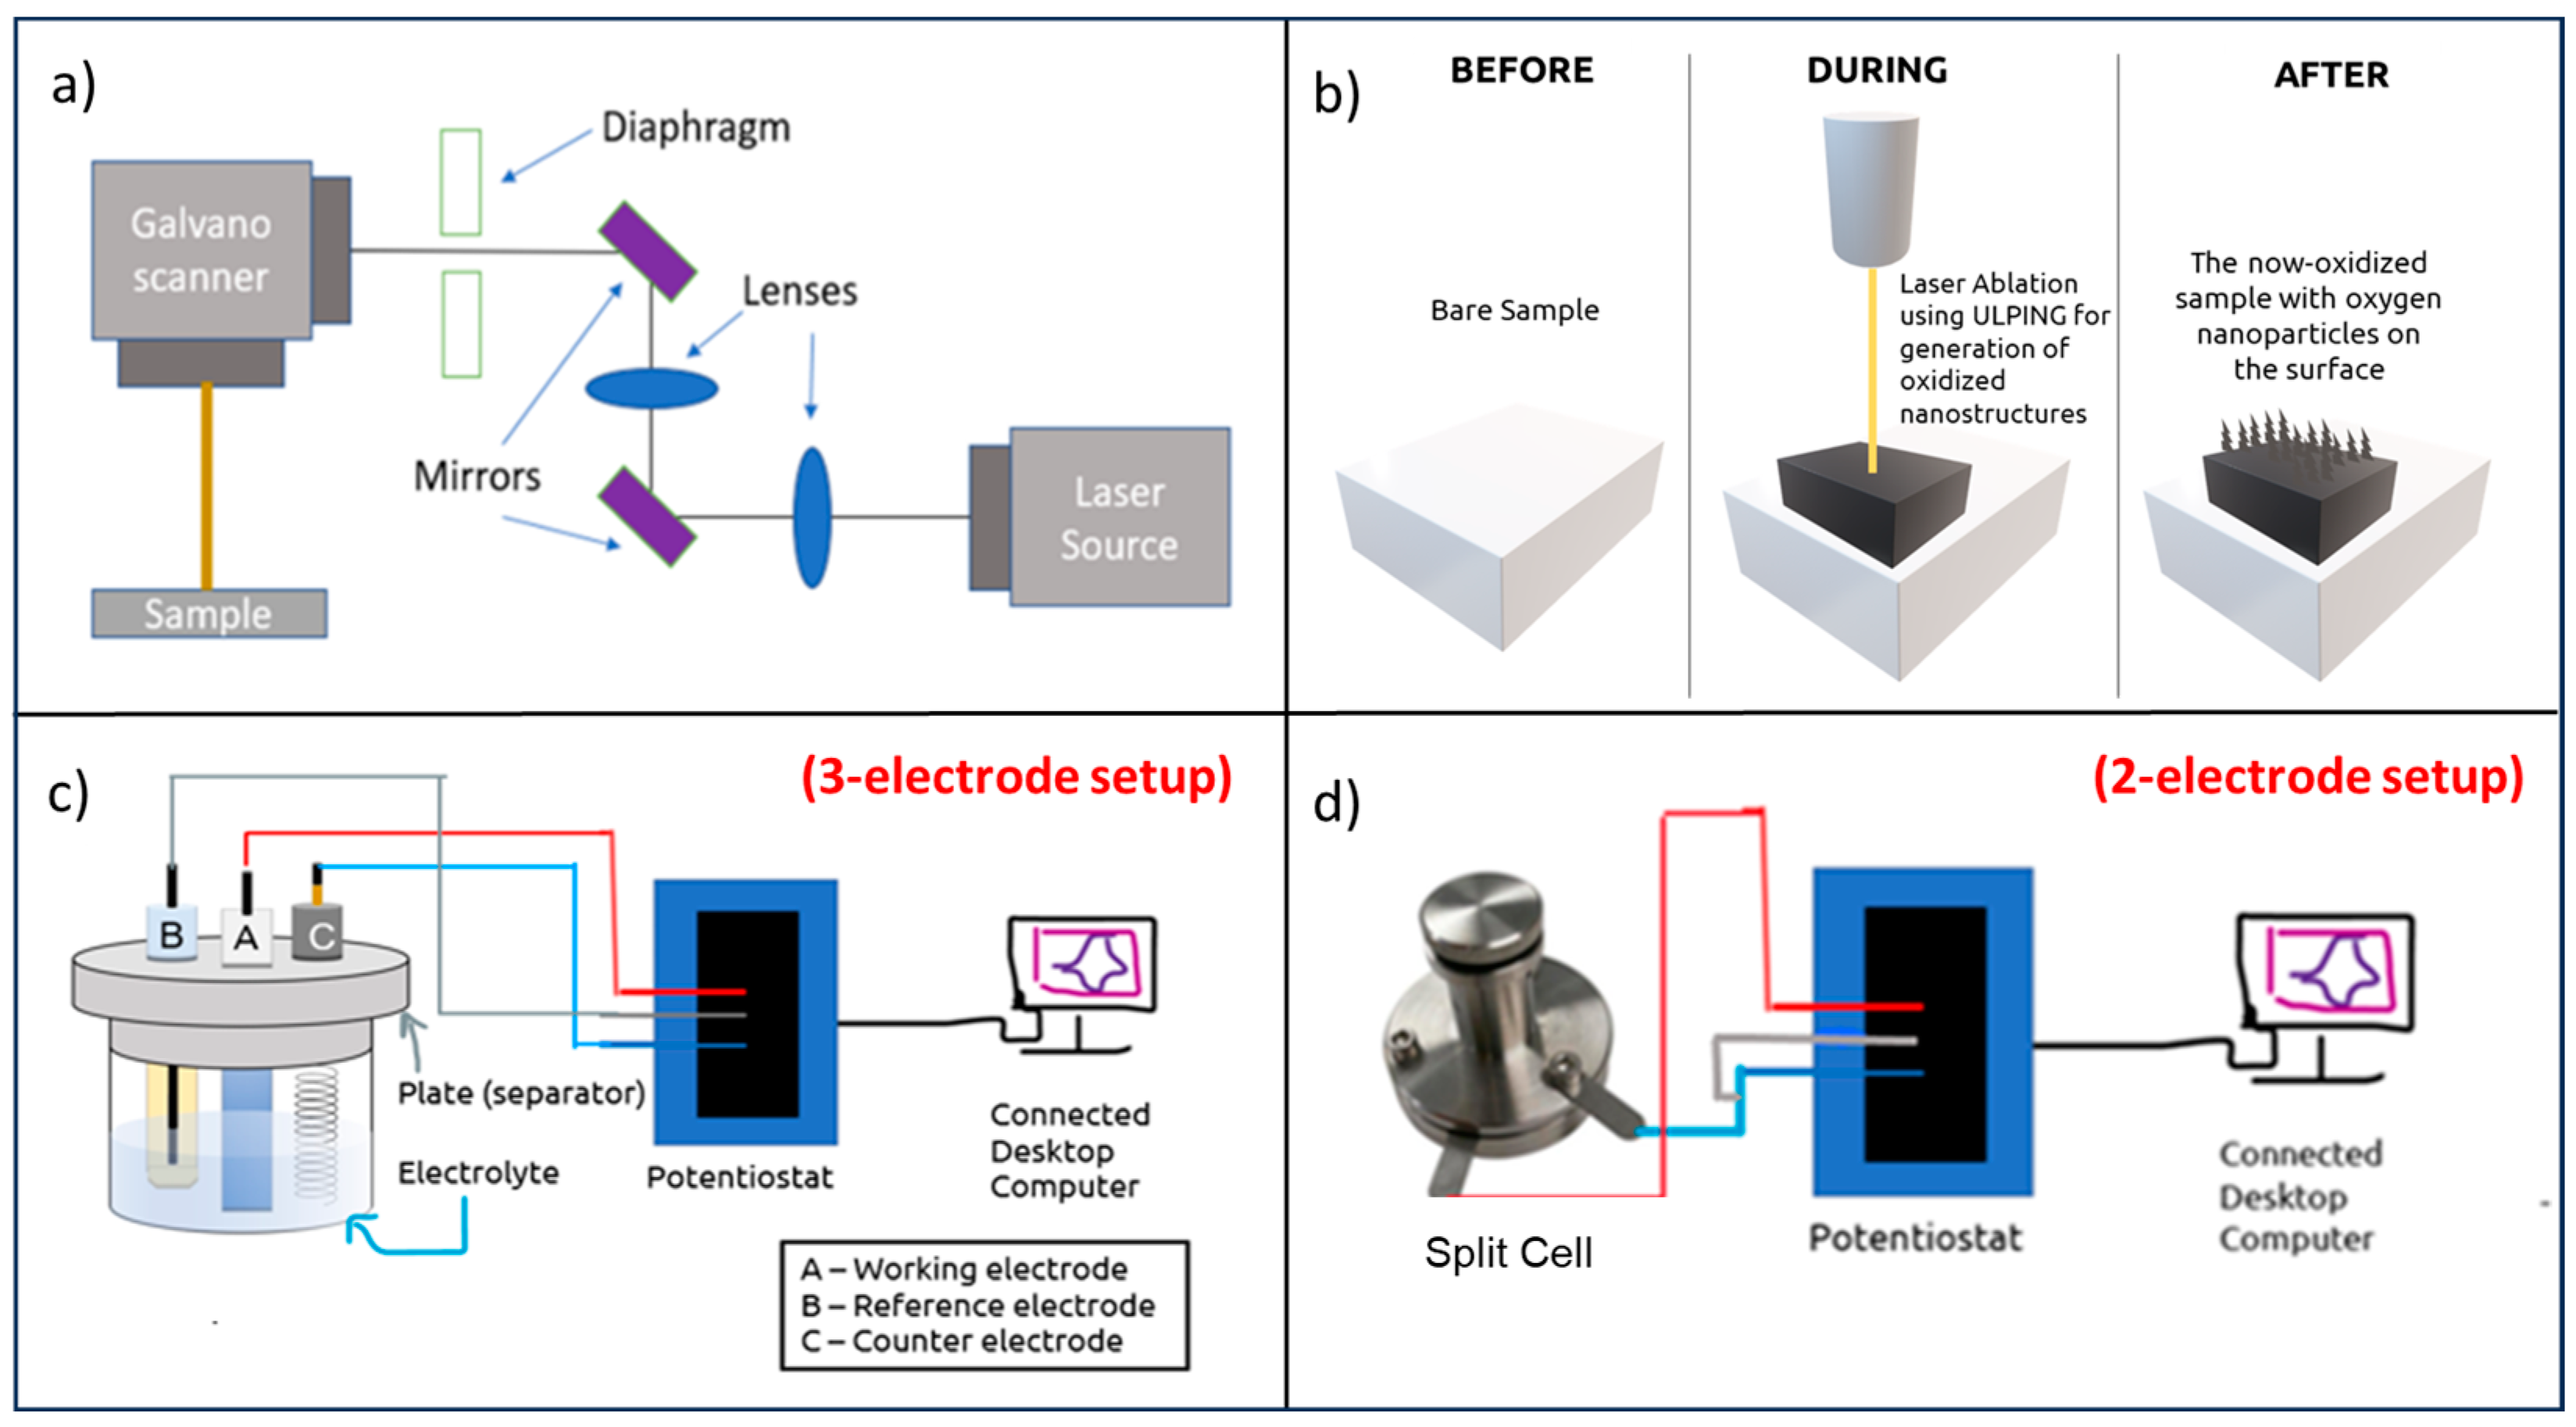
2.2. Sample Preparation Using ULPING

The ULPING (ultra-short laser pulses for in situ nanostructure generation) technique was employed to grow nanostructured metal oxide particles onto the surface of the samples, comprising zinc and titanium materials, as also reported earlier [23,24]. The setup, as depicted in Figure 1a, comprises a Galvano scanner, a set of lenses and mirrors, and a secure workpiece clamp to ensure optimal stability during the process. With the use of the MarkingMate (v 2.7) software, a pattern was generated to dictate the precise locations where the laser would oxidize the sample for nanostructure generation. Subsequently, the laser was activated to emit a focused beam of light, which traversed through a calibrated set of lenses and mirrors before passing through a diaphragm to ensure optimal beam quality. The light energy was then channeled into the Galvano scanner, which converted this energy into precisely controlled oxidized nanoparticles to be imposed onto the samples [11,25,26], as shown in Figure 1b. The conventional methods of sample fabrication have been compared with ULPING in Table 1.
The laser experiments were carried out with a fixed frequency of 1200 kHz, a pulse duration of 150 ps, and a scan speed of 100 mm/s for zinc samples and 50 mm/s for the titanium samples. The specific parameters used for all samples, along with their names, are shown in Table 2, and ensuring the uniformity and comparability of the results obtained from the laser-based investigations is important.

2.3. Electrochemical Characterizations

Electrochemical tests were carried out by a combination of 3-electrode (half-cell) and 2-electrode setups (full-cell) to provide a comprehensive evaluation of the materials under study. For this, SP-150 Bio-Logic potentiostat was used, which enabled the acquisition and in-depth analysis of the data obtained from the experiments. The experiments primarily focused on three key electroanalytical techniques, namely, cyclic voltammetry (CV), electrochemical impedance spectroscopy (EIS), and galvanostatic charge–discharge (GCD), to uncover valuable insights into the electrochemical properties of both the Zn and Ti samples. Both the 3-electrode setup and the 2-electrode setup were used. As depicted in Figure 1c, the half-cell (3-electrode) setup used Hg/HgO as the reference electrode, platinum as the counter electrode, and the aforementioned Zn or Ti samples were used as the working electrode. The primary evaluation of feasibility in using the electrodes was carried out using the 3-electrode setup. Similarly, the two-electrode setup consisted of a split cell with Ti samples being the cathode and Zn the anode, and it was used to evaluate the battery cyclability. Unless specified, 6 M potassium hydroxide (KOH) was used as the electrolyte for the 3-electrode setup and 2 M for the 2-electrode setup (for less corrosion of the battery on the longer run). The potential window and scan rate for CV scans was mentioned as required. Electrochemical impedance spectroscopy (EIS) was conducted, and through the implementation of EIS, Nyquist (and Bode) plots were obtained for each sample, providing a comprehensive and thorough analysis of their electrochemical properties, including the impedances of the samples and their respective phase angles. The frequency range of EIS was 0.1 Hz to 100 KHz at 10 mV amplitude and 0.5 V bias voltage (unless mentioned otherwise). Galvanostatic charge–discharge (GCD) was also conducted, and the purpose of this test was to determine the charge–discharge behavior of the electrodes and the battery itself. From the GCD curves, quantities such as energy density, power density, charging time and discharging time were found to determine the charging behavior and performance of the electrodes and the battery, respectively. For the 2-electrode setup, 3 takes were carried out for each titanium sample, all carried out with a charging current density of 1.2 mA/cm2. The difference between the takes is that for take 1, 10 scans were carried out, with a discharging current density of 1.2 mA/cm2. For the other two takes, both were carried out at 50 scans, but the second take used a discharging current density of 0.16 mA/cm2, while the last one used 0.315 mA/cm2. These methodical processes ensured that a complete understanding of the samples’ behavior under various conditions was attained, contributing significantly to the overall evaluation and characterization of the specimens under study.

2.4. Material Characterization Tests

Scanning electron microscopy (SEM) was employed to evaluate the structure of the nanoparticles on the samples, providing detailed insights into the surface morphology and size distribution of the nanoparticles. Energy dispersive X-ray spectrometry (EDX) analysis was utilized to identify additional components or materials present in the nanostructures. This technique is invaluable for elemental analysis and detecting any impurities or foreign substances within the material. Profilometer tests were conducted to evaluate the surface roughness and 3D profile for the oxidized zinc and titanium samples. These material characterization procedures are essential for gaining a comprehensive understanding of the composition, structure, and properties of the nanostructured materials under investigation.

3. Results and Discussion

3.1. Zinc

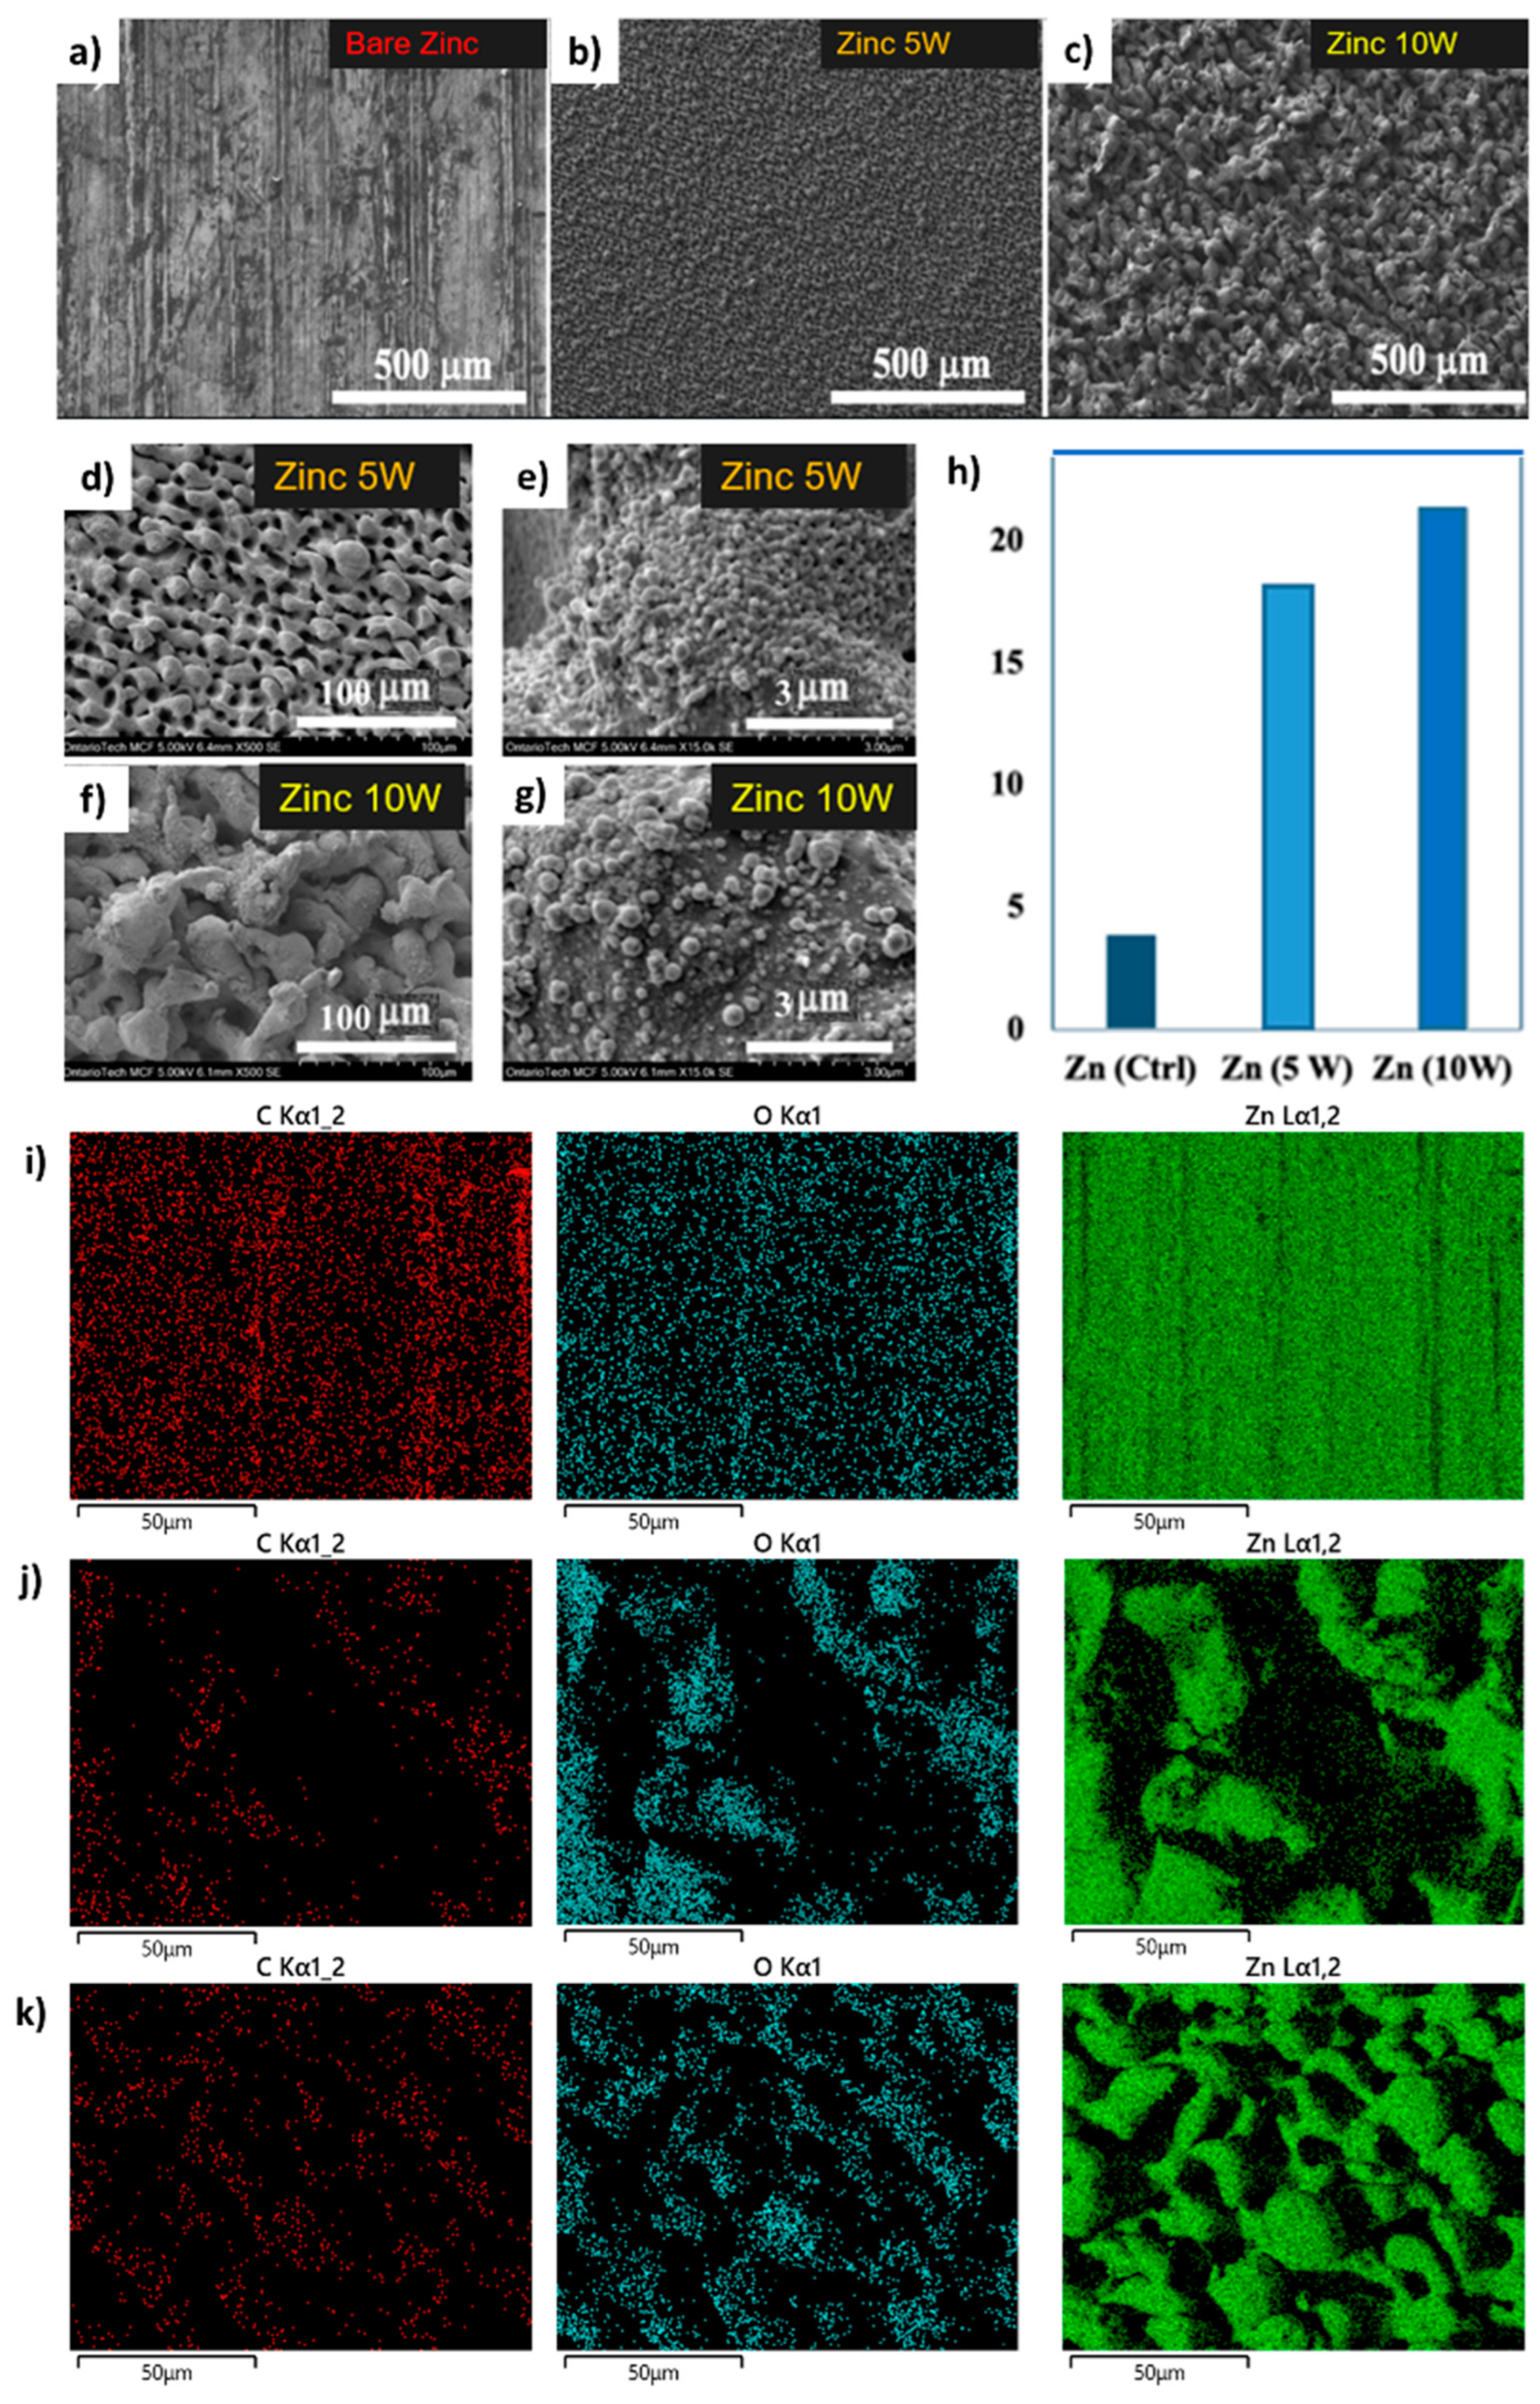
3.1.1. Results from Material Characterization

Figure 2a illustrates a surface that is characterized by its rough texture and porosity, accentuated by the presence of fibers typical of an untreated zinc surface. From this observation, it can be said that the air pockets and intricate spaces between the fibers are distinctly discernible due to their dark appearance, indicating the intricate nature of the surface topography. Moving to Figure 2b, which corresponds to the Zinc 5W sample, a noticeable refinement in surface texture is observed, showing a smoother surface interspersed with minor scratches and imperfections. Finally, when considering Figure 2c, representing the Zinc 10W sample, the surface exemplifies a further enhanced smoothness, shown by shallow pits and subtle indications of potential cracking. This progression across the different samples allows for a comparative analysis of surface quality and characteristics, offering insights into the material’s structural integrity.
In Figure 2d, the Zinc 5W sample, observed at 500× magnification, reveals a small, smooth region of zinc with only a few surface scratches. Upon closer examination in Figure 2e, which depicts the same sample at a higher magnification, more cavities and defects become apparent. Moving on to Figure 2f, which showcases the Zinc 10W sample at 500× magnification, we once again note the presence of a few surface scratches, albeit enlarged porous structures due to the application of a higher laser ablation power. Further magnification to 15k in Figure 2g highlights a similar outcome to the 5W sample, featuring significant porous structures. The comparison across these figures underscores the impact of magnification on our ability to discern varying levels of surface details and the structural integrity of the zinc samples under investigation.
We see that the Zinc 10W sample has a higher oxidation range. Referencing Figure 2k, we notice a higher concentration of porous structures in the zinc micrograph, compared to that of Figure 2i,j. This can also be said for the concentration of oxygen content. It can also be noticed from Figure 2h that the oxygen–zinc weight percentage of the Zinc 10W sample is relatively higher than that of bare zinc due to the imposition of the oxygen nanoparticles on the surface. This percentage is also larger than that of the 5W sample since a higher power is being used.
When considering the porosity of the samples, as shown in Figure 3a, it is evident that Zinc 5W exhibits a higher level of porosity in contrast to bare zinc because of the incorporation of oxygen nanoparticles. This increase in porosity can be attributed to the presence of the nanoparticles within the Zinc 5W sample, which create more passageways throughout the material. Conversely, in the case of Zinc 10W, the porosity is reduced in comparison to Zinc 5W due to the nanoparticles being more tightly compacted within the structure of the 10W sample. The denser packing of nanoparticles in the Zinc 10W sample results in fewer voids and spaces within the material, leading to a lower overall porosity level when compared to the Zinc 5W sample.
Looking at the profilometer images for zinc, the bare sample (shown in Figure 3B,C) appears to have scratches on the surface, while the image for Zinc 5W (Figure 3G,I) shows more green area and the 10W (Figure 3D,F) shows more red area, indicating a lower surface depth in the 10W sample due to the buildup of oxygen nanoparticles, especially when using a higher laser power. Additionally, looking at the surface roughness profiles for Zinc 10W and 5W (Figure 3E,H, respectively), the 10W sample features several small nanostructures at various heights, especially as high as 90 μm. This can be denoted by the peaks and troughs in the surface profile for 10W. Contrastingly, the 5W sample also includes thin structures, but the heights do not vary as much.

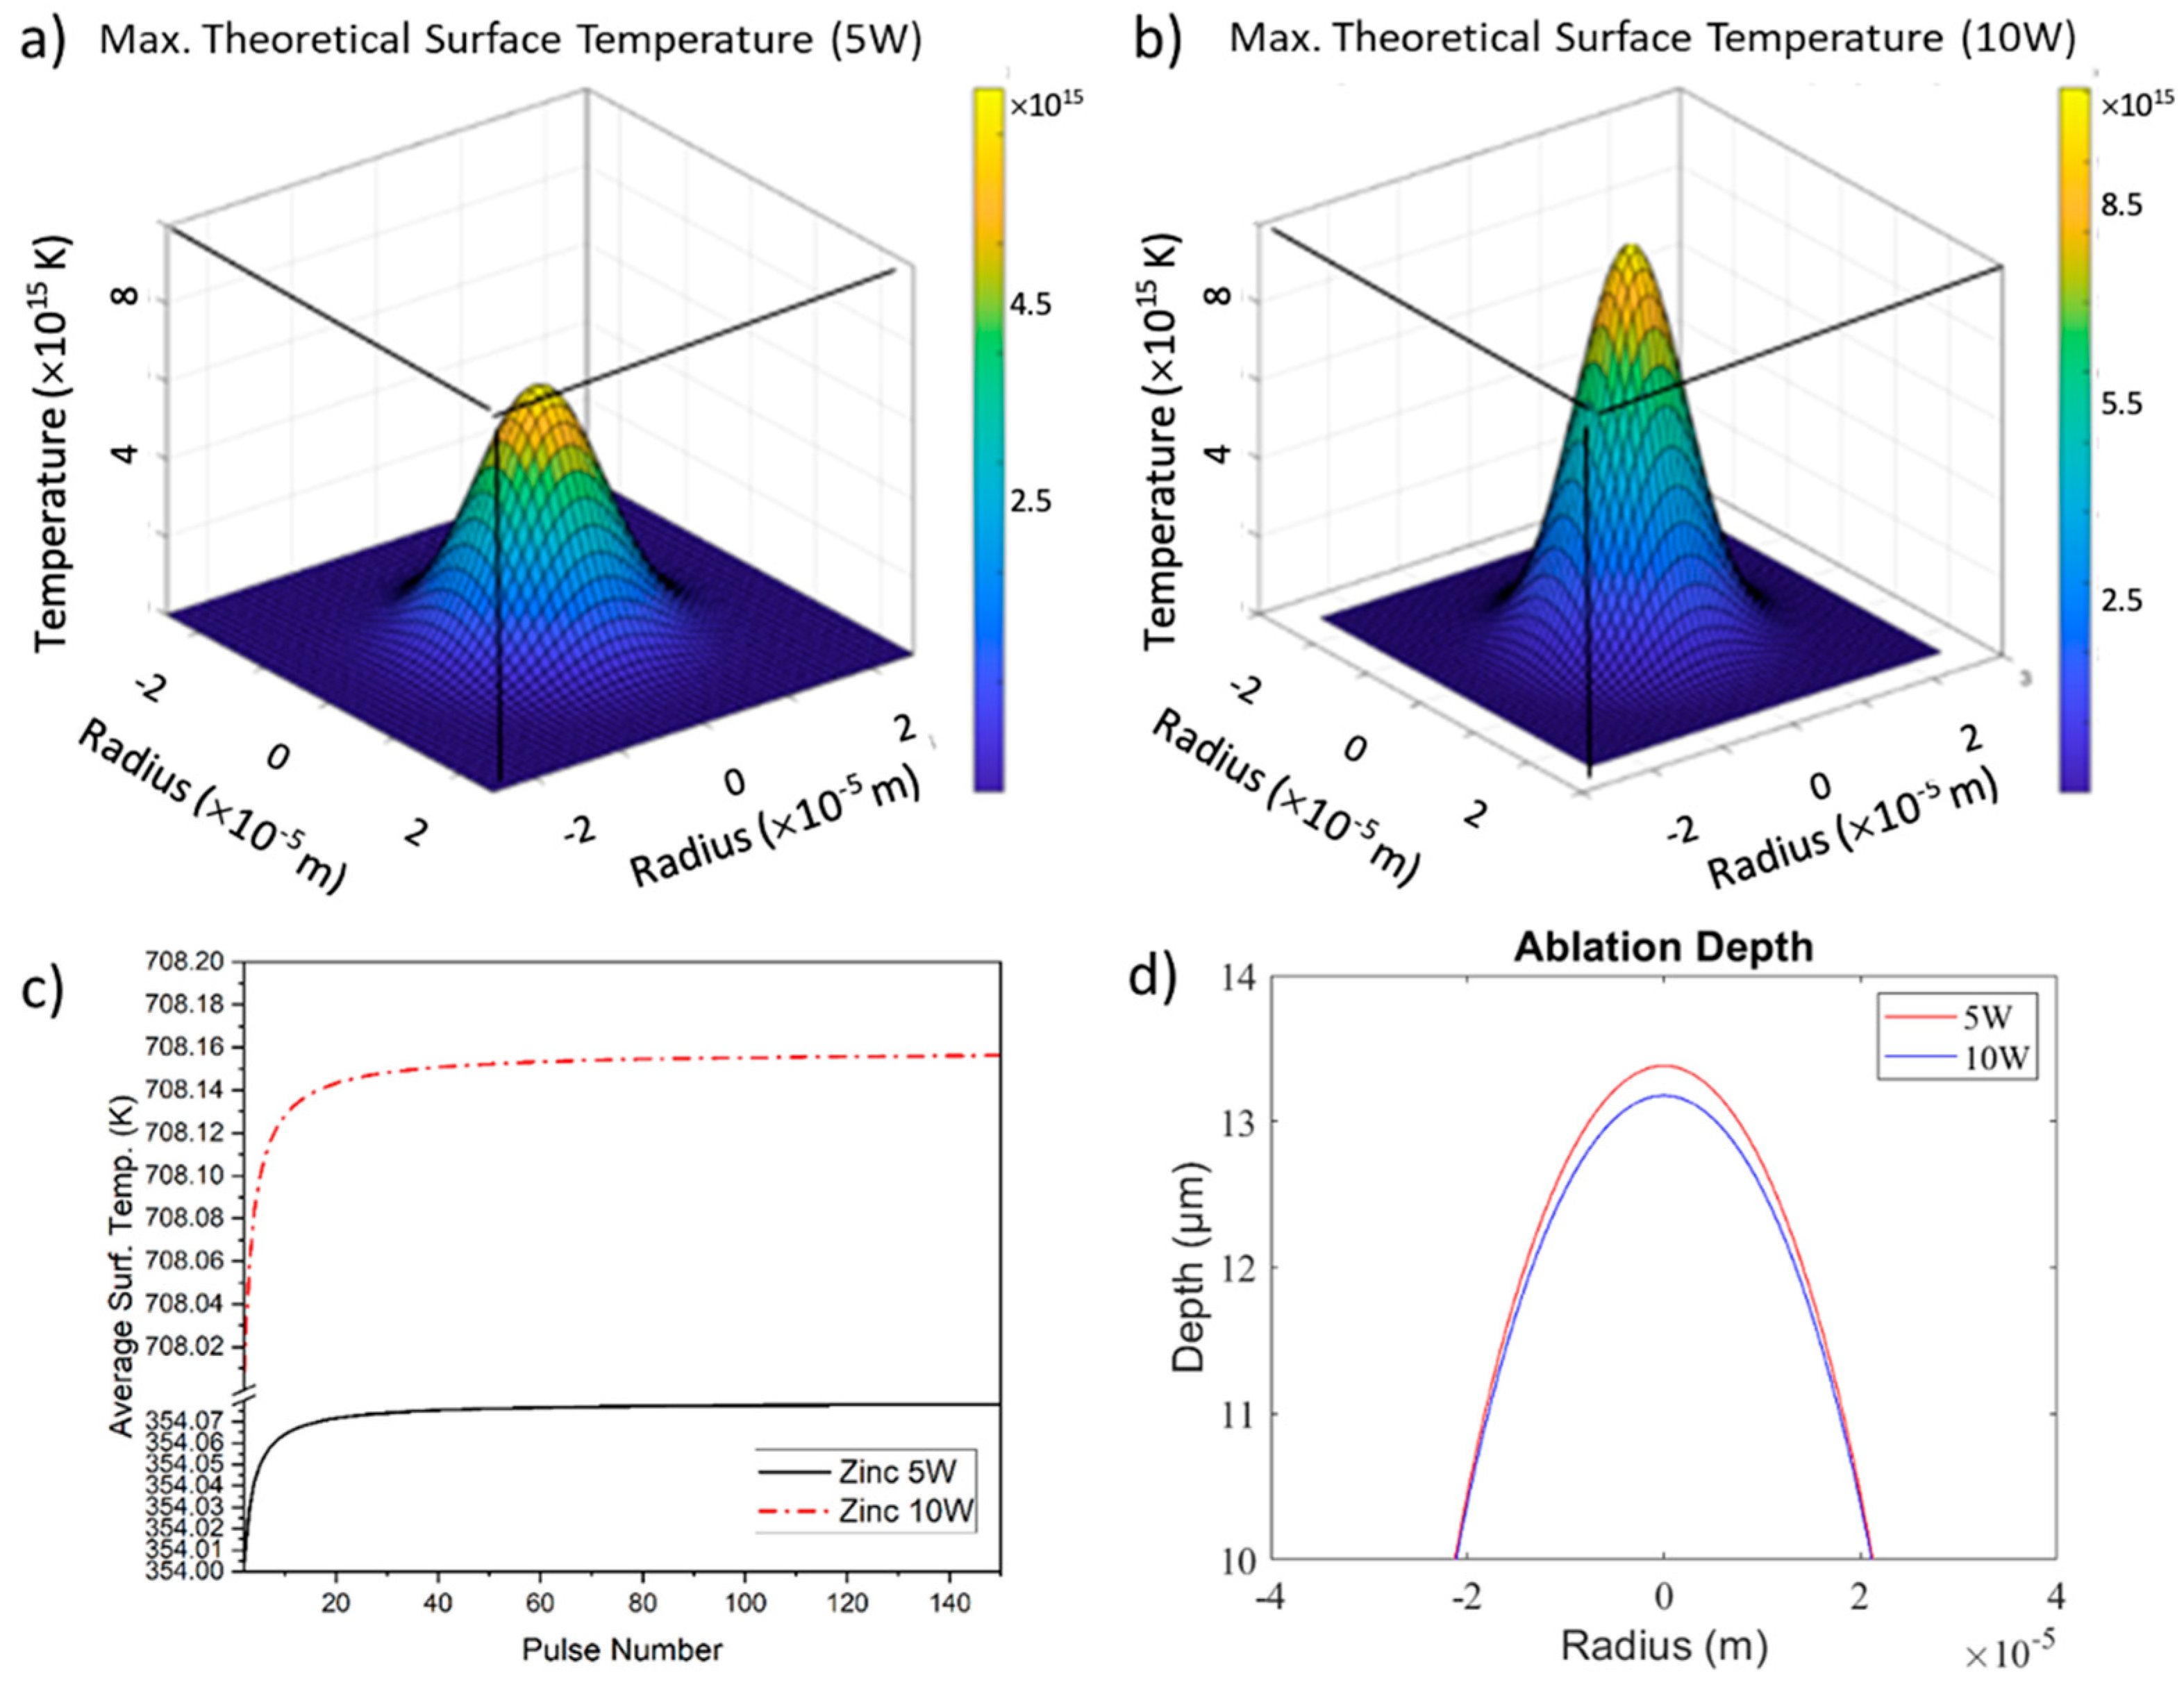
3.1.2. Thermal Modeling and Theoretical Results

We introduce some equations related to the laser ablation process and the temperatures of the samples:
Here, we include the equation for the surface temperature at the end of the pulse of the lasers used to fabricate the nanoparticles on the samples. This is for the center of the spot area, and the equation is as follows:
T 0 , t = T 0 , t p t p t 1 / 2 = 2 π I a ( a t p ) 1 / 2 k t p t 1 / 2
where tp represents the pulse duration, a is the coefficient of thermal diffusion, k is the coefficient of heat conduction. The residual energy coefficient, denoted by K, and the coefficient of reflection, denoted by R, are both used to estimate the absorbed light intensity, denoted by Ia [25]. The equation for the light intensity is as follows:
I a = K ( 1 R ) 4 P π d 2 t p f
where P denotes laser power, f is the pulse frequency, and d is the laser spot diameter [25]. Substituting the above expression into the T(0, t) equation, we obtain the following expression:
T 0 , t p = 2 a π 3 t p 4 K 1 R P k f d 2
The reflection coefficient for silicon at a wavelength of 1030 nm is found to be 0.325, and the K value is 0.8 when the fluence is below the ablation threshold, but these values can vary depending on the wavelengths and material used [25].
The maximum surface temperature is the temperature that occurs at the end of the laser pulse, which is Tmax or Tm = T(0, tp) while the minimum temperature, which is the one at the beginning of the following laser pulse, is given as Tmin = αTmax. the constant ratio for the previous maximum and following minimum temperatures is given as α = (tp/tpp)1/2, where tpp represents the pulse interval and is represented by tpp = 1/f, where f represents pulse repetition rate, and tp represents pulse duration. From these equations, we can obtain the maximum and minimum surface temperature of the irradiated areas, which can be found as in [26]:
First pulse: (Tmax)1 = Tm and (Tmin)1 = αTm
Second pulse: (Tmax)2 = (1 + α) Tm and (Tmin)2 = α(1 + α) Tm
nth pulse: (Tmax)n = (1 + α+ α2 + … + αn−1) Tm = [(1 − n)/(1 − α)] Tm and (Tmin)n = α(Tmax)n
The surface temperature average over any ith laser pulse and the time gap between the ith and (i + 1) th can be found using the following equation:
T ¯ i = 1 t p + t p p 0 t p + t p p T m , i 0 , t d t = 2 α T m , i ( 1 2 3 α ) ( 1 + α 2 )
The average surface temperature is given as follows:
T ¯ n = 2 α [ 1 2 3 α ] ( 1 + α 2 ) · T m 1 α [ 1 + ( α n α ) n 1 α ]
When n is much greater than 1, and α is much less than 1:
T ¯ n 2 α T m = 2 T m ( t p t p p ) 1 / 2
During the laser fabrication process, the laser ablation will create what is known as a groove, and its shape needs to be considered. This can be shown by the following equation:
h ( r ) = 4 κ τ ln β K Δ T B γ I m a x π κ β τ 1 + 8 β κ τ W 2 r 2 1 + w 2 8 β κ τ h 0
where β is a correction factor, which equals 0.5, and ∆TB is the boiling temperature, which depends on the material to be laser-processed. Solving the above equation at the surface (i.e., h(r) = 0), the ablation pit radius can be found as follows:
r 0 = 4 κ τ + 0.5 W 2 l n β K Δ T B γ I m a x π κ τ 1 + 8 β κ τ W 2
Using both equations, the ablated groove can be approximated after one pulse. The depth can also be approximated by formulating the ablation profile after a set of pulses, and each pulse adds to the penetration of the previous pulse at a certain distance, resulting in a deeper groove. The following equations best describe this behavior:
h s c a n r = h r + h S r
S = v s c a n f
where S is the distance between each consecutive pulse, vscan is the scanning speed, and f denotes the pulse frequency [25].
Determining the temperature during laser irradiation helps to know how temperature affects the inside and the surroundings of the laser-ablated area. Assuming a laser pulse with a temporal and Gaussian beam profile and materials with high-absorption coefficients, the change in temperature due to a single laser pulse can be found by the following equation:
T r , z , t = I m a x γ κ π K 0 τ p ( τ t ) t [ 1 + 8 κ t W 2 ] e [ z 2 4 κ t + r 2 4 κ t + W 2 2 ]
where Imax represents peak intensity, γ is equal to the Fresnel energy reflectivity (R) subtracted from (1 − R), κ is the material diffusivity, K represents material conductivity, τ represents laser pulse duration, W is the filed radius of the beam, z represents the depth and r is radius. Using this equation if p(t) is a square-shaped pulse, the temperature can be found at the ablation center (r = 0) and at the ablation surface (z = 0) [25,26].
The ULPING parameter optimized is the laser power because it is the key factor in determining how many nanoparticles will be imposed onto the sample. The equation for laser pulse energy is as follows:
E p u l s e = P a v g f
where P a v g represents average power (W), and E p u l s e denotes pulse energy (J). Frequency (denoted f, measured in Hz) has also been optimized to control the speed of the nanoparticle interaction. Many nanoparticles with a high interaction speed would be beneficial for the sample to be a suitable battery electrode, especially for effective charge transfer.
An analysis of the temperature gradients observed in the samples, as depicted in Figure 4a,b, undeniably reveals a marked contrast between them. The recorded maximum temperatures in each sample stand as compelling indicators of the distinct differences in their ablated powers. These findings strongly imply a direct and evident relationship between the level of ablated power applied and the resultant surface temperature of the samples. Through careful examination and comparison of these temperature gradients, a clear correlation emerges, highlighting the crucial impact of ablated power on the thermal properties of the materials under study.
The initial test findings clearly indicate a substantial variance in surface temperature between the 10W sample (sample 1) and the 5W sample (sample 2). Referencing Figure 4c, it is evident that the surface temperature of sample 1 is nearly twice that of sample 2. This significant disparity can be directly attributed to the ablated power level, with sample 1 operating at double the power of sample 2. Consequently, the heightened ablated power of sample 1 precipitates a more pronounced effect on its surface temperature, illustrating a nearly direct correlation between power input and thermal impact.
Another observation that can be made is that at 5 W, the temperature surpasses the critical oxidation threshold for zinc, which is around 300 °C. As we increase the power to 10 W, the rate of oxidation experiences a marked surge, particularly as it nears the metal’s melting point of approximately 420 °C (788 °F). This increase in oxidation intensity at the higher power level can be attributed to the heightened energy input causing more rapid chemical reactions on the zinc surface. The acceleration in oxidation kinetics at this power setting showcases the sensitivity of zinc to temperature variations and underscores the importance of closely monitoring the thermal conditions to prevent excessive oxidation. Additionally, understanding the specific temperature thresholds and corresponding oxidation behaviors is crucial for optimizing the performance and longevity of zinc-based materials in various applications where thermal optimization plays a critical role. With this nuanced insight into the relationship between power levels and oxidation rates, we can fine-tune processes and parameters to maintain the desired material properties and functionality, even under challenging thermal conditions. Ultimately, this comprehensive understanding of how power levels impact oxidation kinetics enables more informed decision-making and enhanced control over the material’s performance in various environments.
Furthermore, despite the significant variance in surface temperatures between the two samples under study, the comparison of their maximum ablation depths reveals a surprising similarity. This finding, as depicted in Figure 4d, provides valuable insights into the nature of the ablation process. The data demonstrate that while the initial surface temperature may differ substantially between the samples, this divergence does not directly correlate with the resultant ablation depth observed. This phenomenon emphasizes the complex and multifaceted factors at play during the ablation process, suggesting that other variables beyond surface temperature may play a crucial role in determining the depth of material removal.

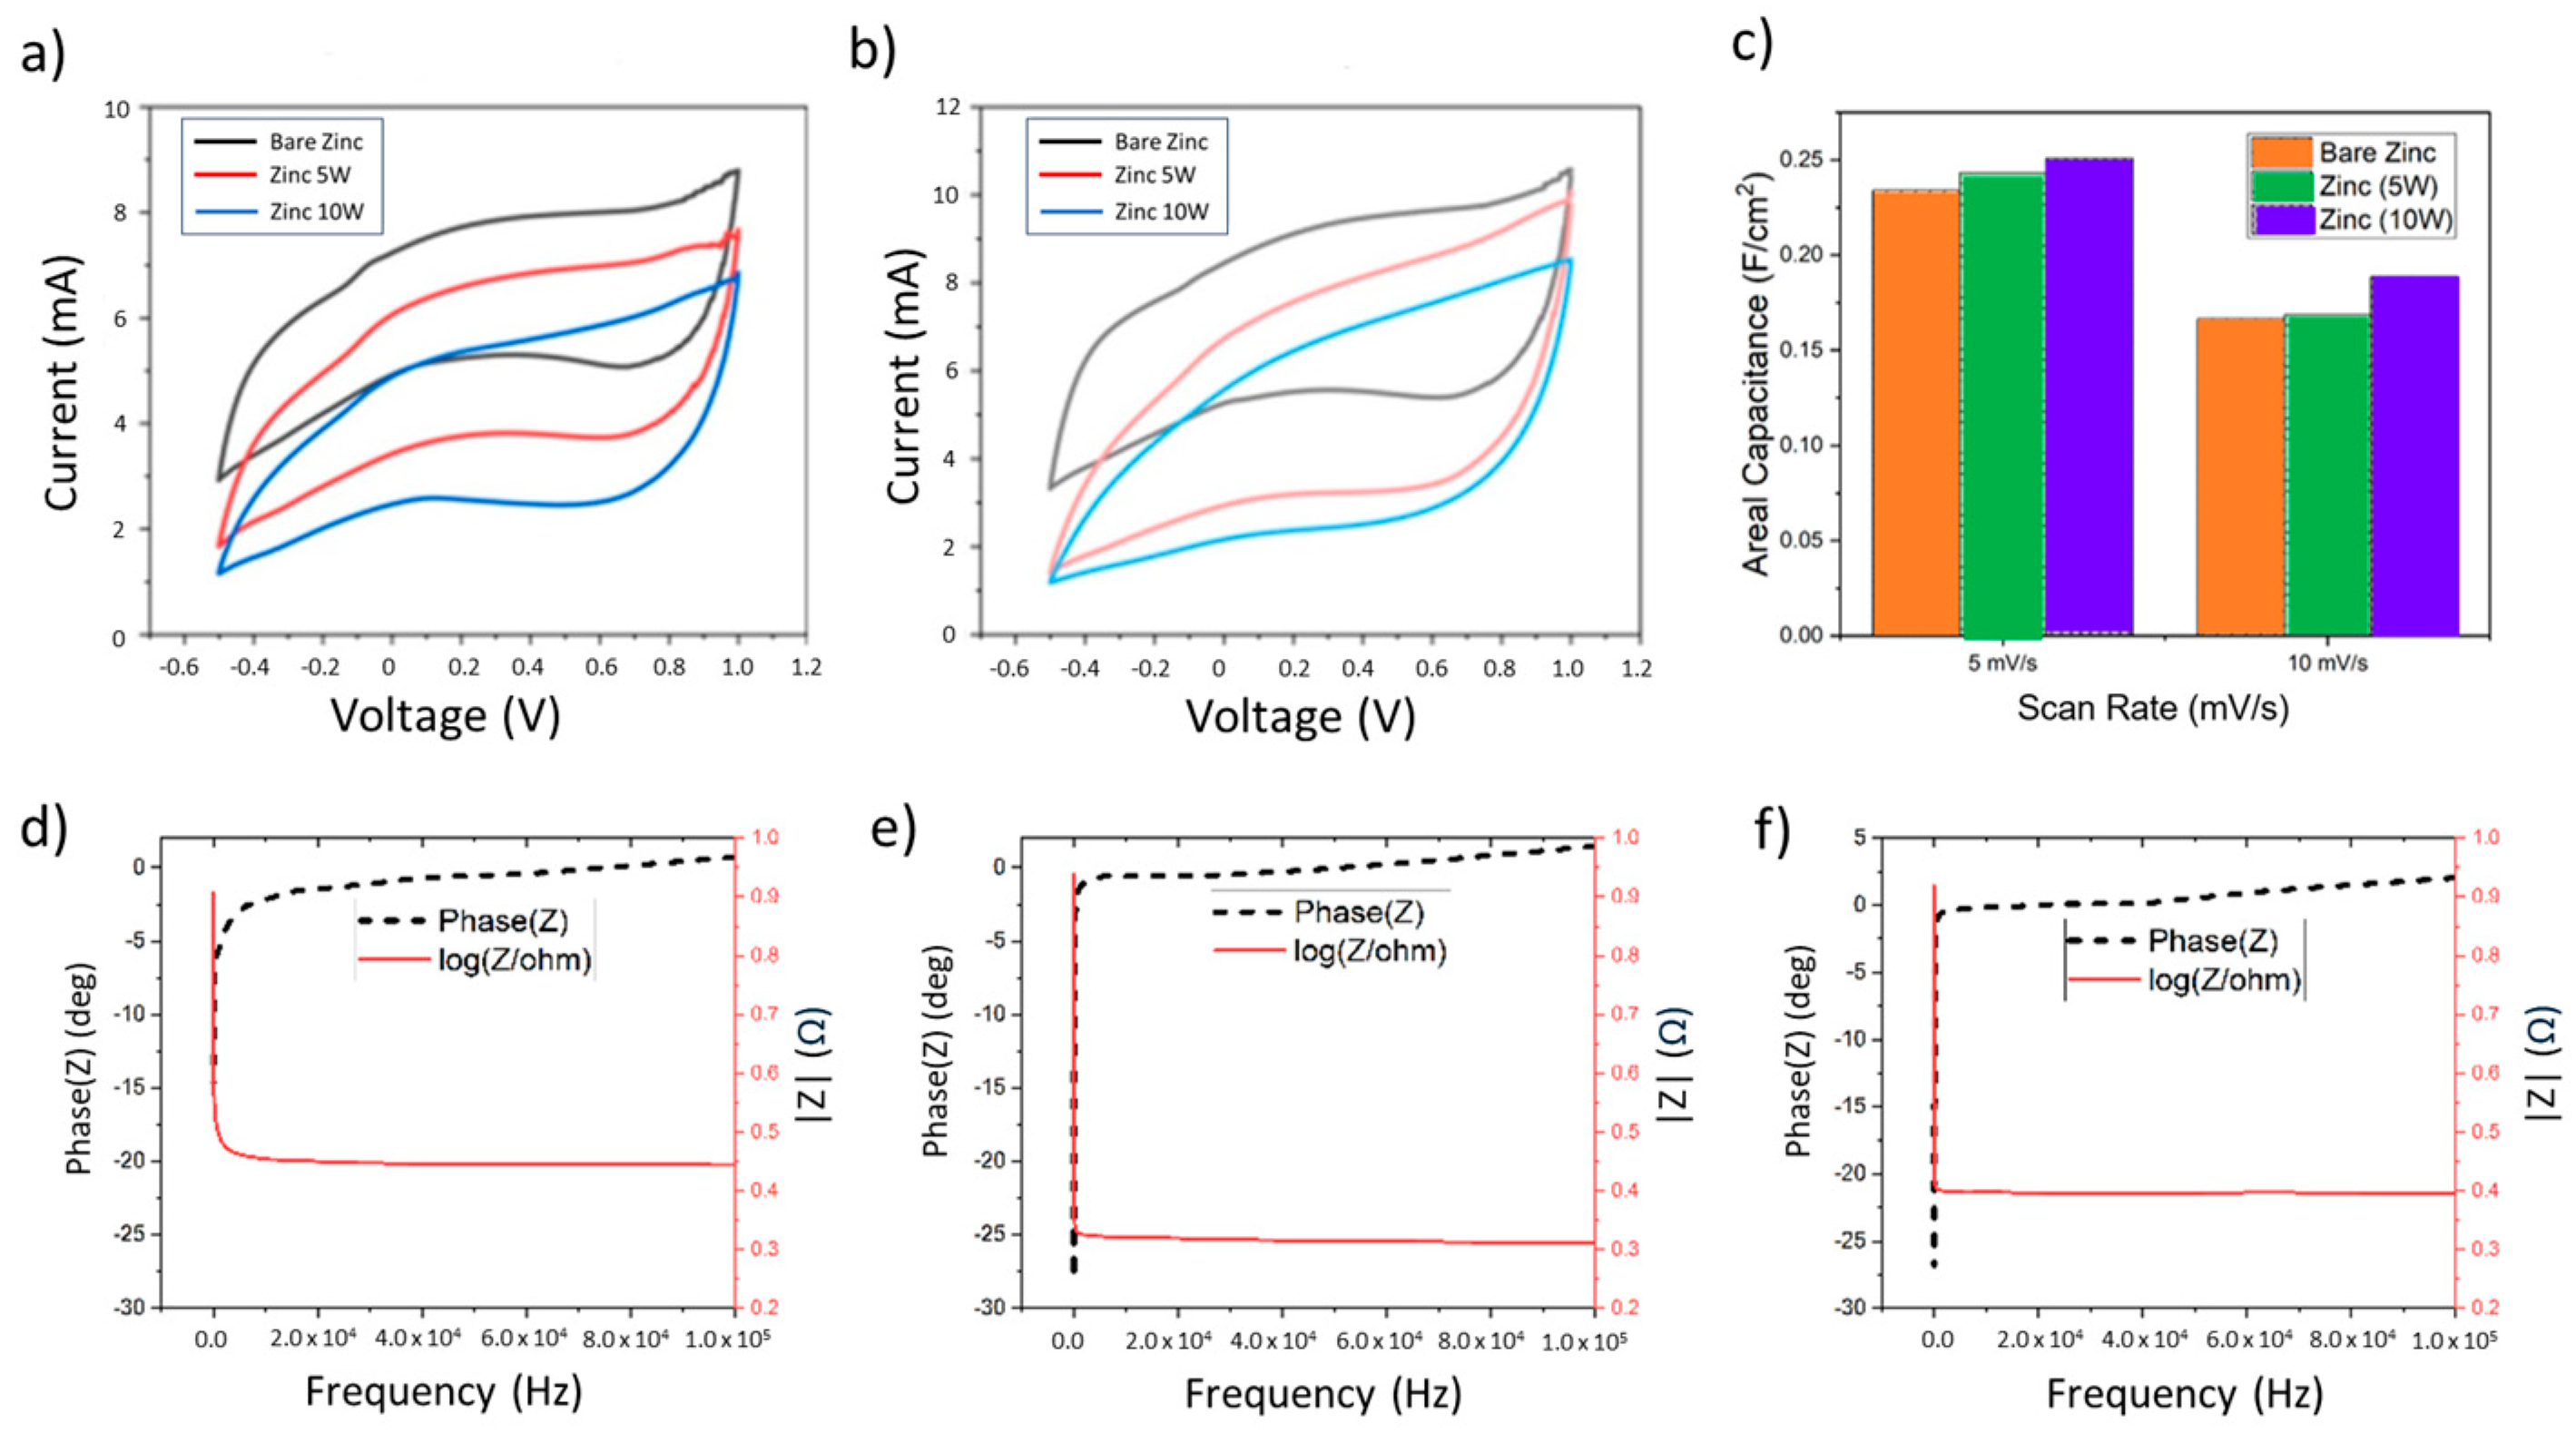
3.1.3. Electrochemical Tests

The results obtained from the aerial capacitance measurements do not indicate a substantial enhancement in performance. This is noteworthy because it sheds light on the intricate details concerning the adverse effects of laser processing on the integrity of the zinc material. Furthermore, the findings highlight the extent of corrosion and damage experienced by the zinc samples during the rigorous testing procedures. This information provides valuable insights into the behavior of zinc under varying conditions, offering a comprehensive understanding of its durability and resilience. Overall, these results underscore the importance of considering the impact of different factors on the structural integrity and quality of zinc materials.
Figure 5c shows the bar chart for the areal capacitances of all the zinc samples at scan rates of 5 and 10 mV/s. The equation for areal capacitance is as follows:
C a = Λ 2 U 2 U 1 A k
where Λ represents the area under the curve measured in mA*V, U2U1 is the difference in voltage range measured in volts (V) and k is the scan rate in mV/s, and A represents the surface area of the sample measured in cm2. The voltage range and scan rate are the input variables for the cyclic voltammetry tests, while the area under the CV curves is found using the OriginPro (v10.1, 2024) software. These data are inputted into the above equation to determine the capacitance of each sample measured in F/cm2, assuming they have an area of 1 cm2. Thus, Equation (16) simplifies to:
C a = Λ 2 U 2 U 1 k
Looking at the results for Figure 5c, it can be noticed that the samples carried out at 5 mV/s have higher areal capacitance than at 10 mV/s because, at lower scan rates, more current flowing through the samples can be detected easily. Looking at each individual sample, the Zinc 10W sample has a slightly higher capacitance than the other samples; the addition of oxygen nanoparticles greatly contributes to the amount of current flowing through the sample. Although this difference is noticeable, it is also not a major one due to the damage of the zinc surface, thus not showing enough improvement in terms of current flow in the samples.
Figure 5d–f shows the Bode plots for all the zinc samples, and these plots are also evidence that there is not much improvement in the laser processing, overall structure, or electrochemical behavior for zinc. We also notice an uneven trend in terms of the decrease in the magnitude of impedance as well as in the increase in phase angle between the samples.
From these electrochemical tests, it can be said that zinc is very reactive, especially in KOH electrolyte, and it would thus work better as an anode material. Bare zinc is the most preferrable material for zinc-ion batteries because if an oxidized zinc anode is used, then the electronegativity of it will be decreased. In the next section, we discuss titanium and its suitability as an electrode for zinc-ion batteries.

3.2. Titanium

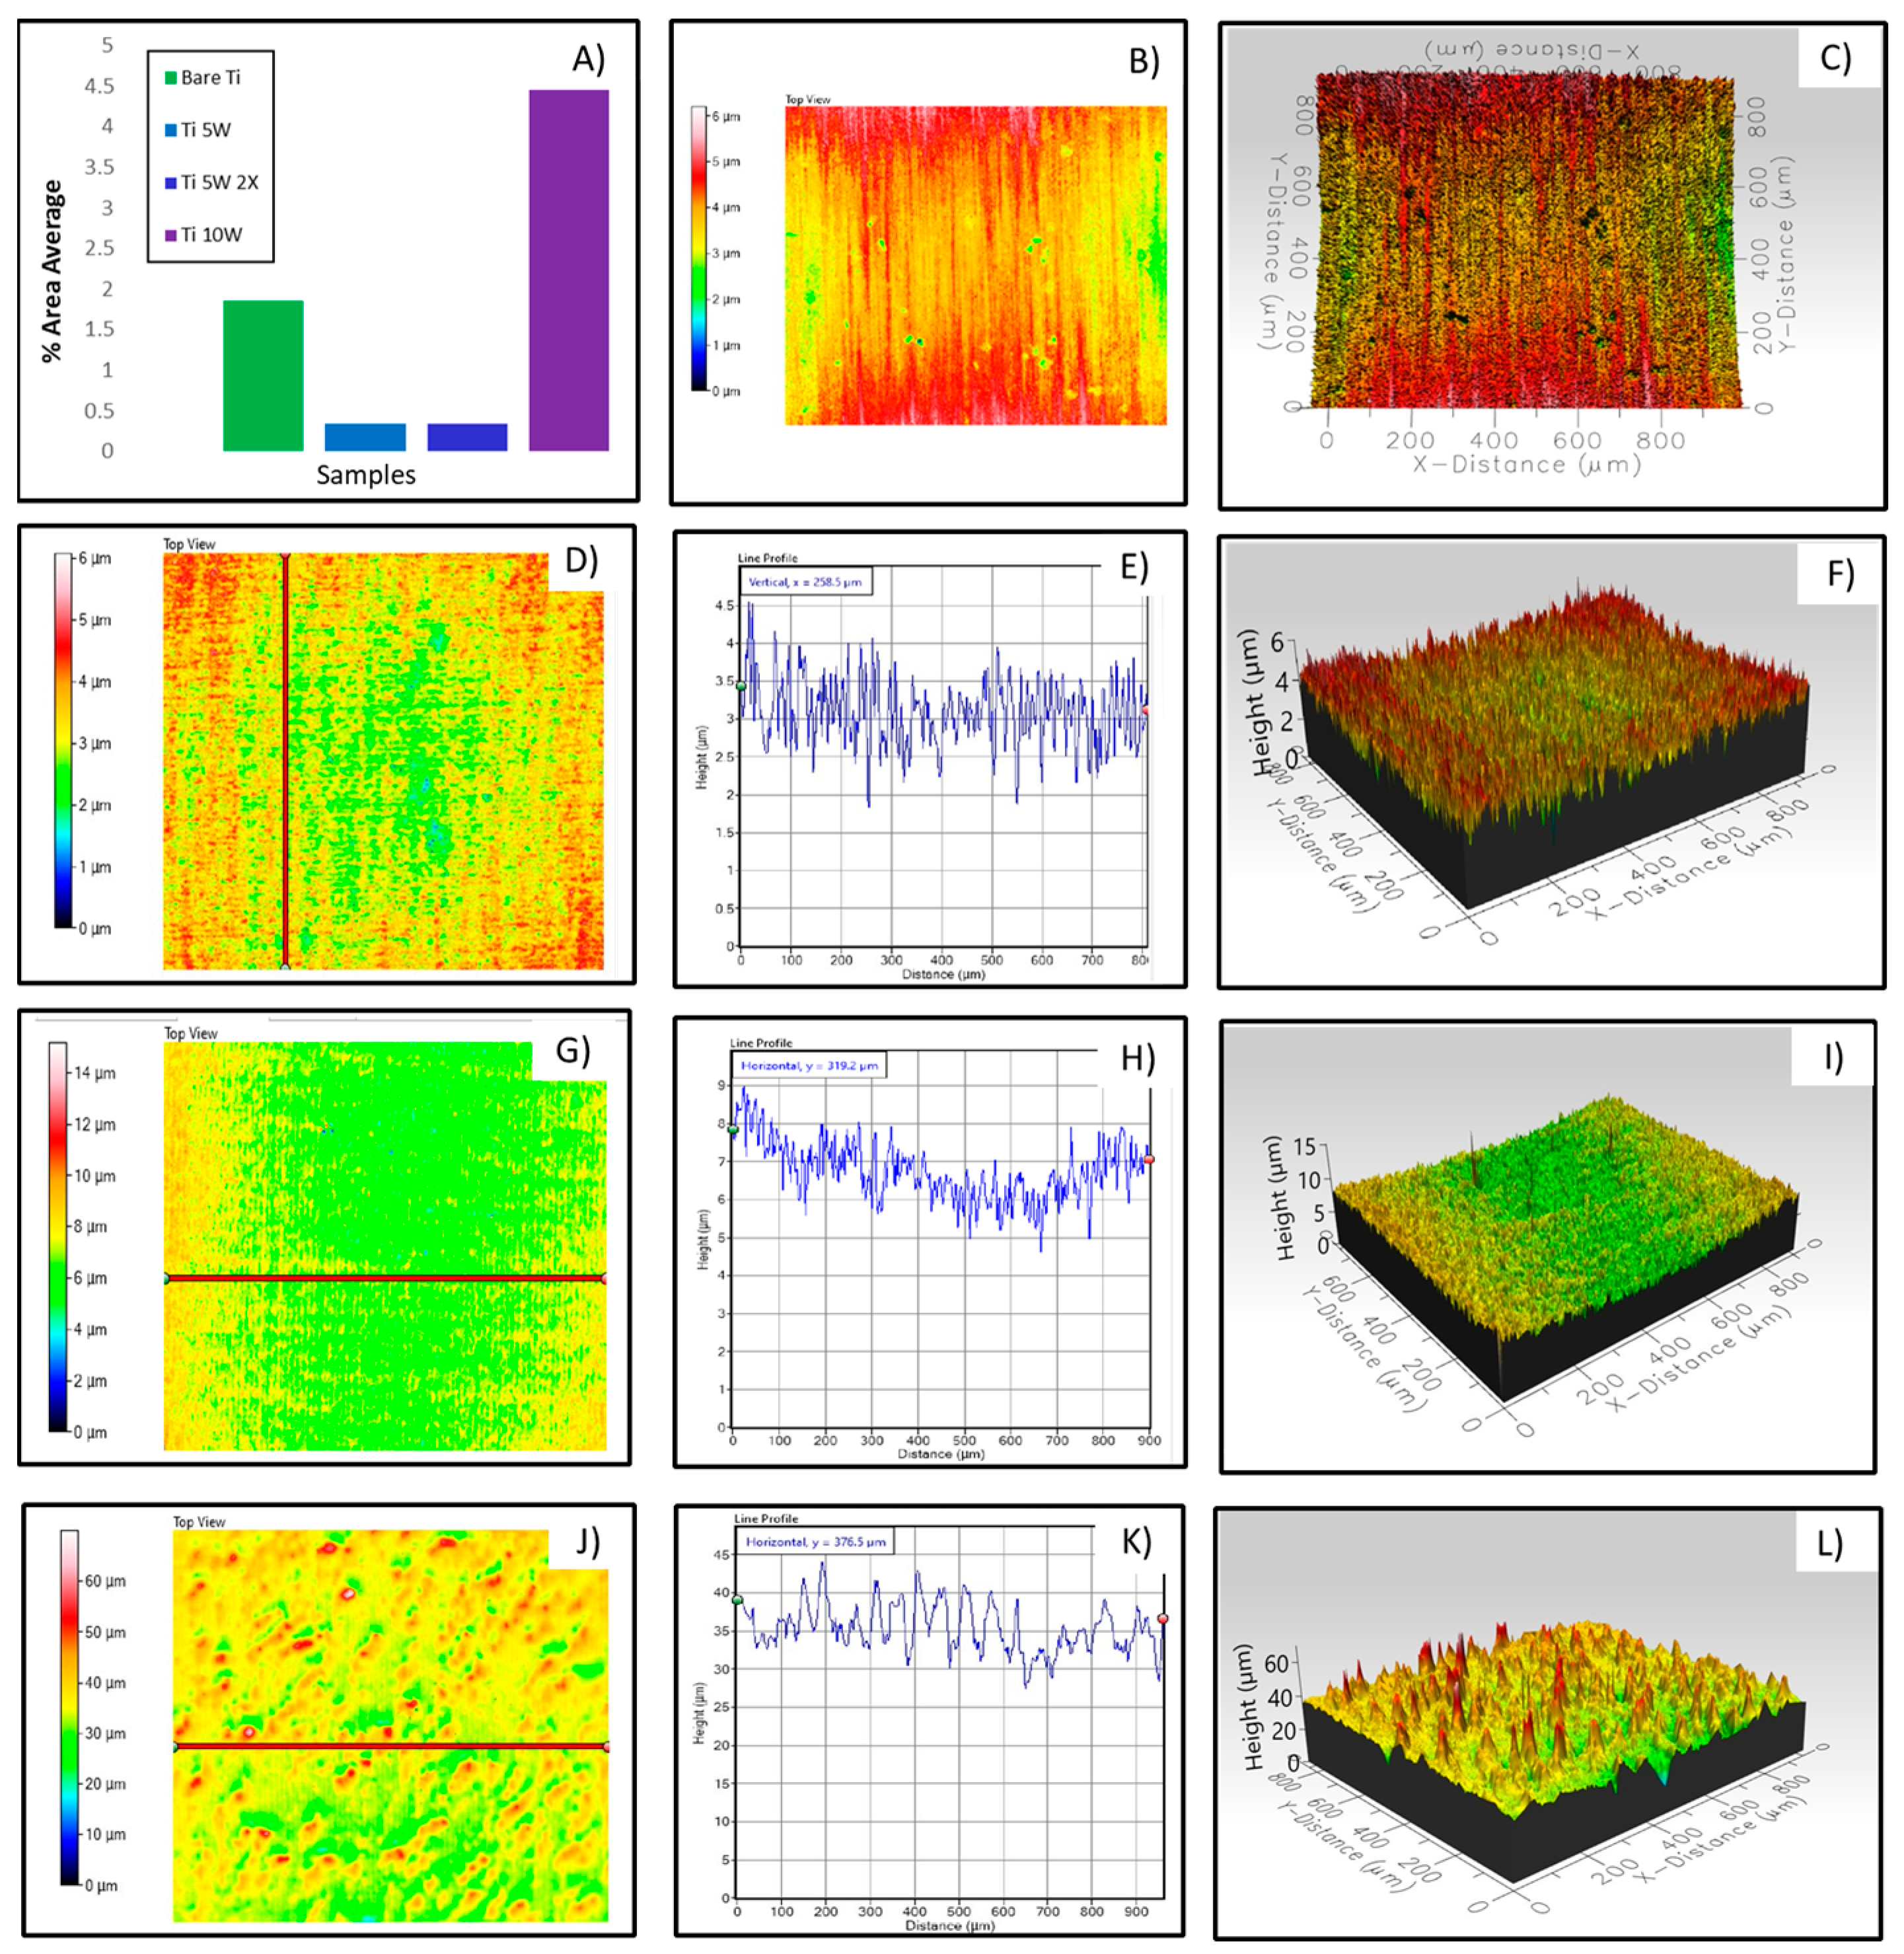
3.2.1. Results from Material Characterization

Conducting different material characterization tests will help determine the structure of the nanoparticle arrangement in the sample. For instance, using an XRD test, one structure phase might exhibit a narrow band, which makes it suitable for energy conversion applications, while another could have a higher density and thermal stability, making it durable and a good choice for higher power applications. Porosity is definitely an important factor as it will help determine if there are any voids in the structure. If there are fewer voids, then the material would exhibit better electron transfer. Interaction of nanoparticles is also important because if their interaction with each other is slow, then the current flow in the battery is also slow. Here, we present SEM, EDX and profilometer results for titanium, both bare and oxidized:
Figure 6a–c shows a smoother, flatter titanium surface with some small defects or imperfections. For the first case, this is due to no oxygen nanoparticles imposed, while for Figure 6b, a laser power of 5W was used. For Figure 6c, we still use the same amount of laser power, despite the laser test being carried out twice. Figure 6d, however, shows a significant change in the titanium surface due to a higher laser power of 10W being used, thus adding more dense, small porous nanostructures.
Looking into Figure 6e–j, which shows Titanium 5W, 5W-2× and 10W SEM images at higher magnifications, we can see that for the first two samples, they appear to have a set of ruptured lines as per the 500× magnification images. However, with the 15,000× magnified images, we notice that there are many thin, densely packed nanostructures in the 5W-2× sample as compared to the 5W sample. For the Titanium 10W sample, we see thicker, porous nanostructures looking from the 500× magnified image. Inside these structures, we can see even smaller, closely packed ones when looking at the 15,000× image.
In Figure 6k–o, we can see that for bare Ti, Ti 5W and Ti 5W 2×, the titanium micrographs are solid orange, meaning there is still a fair amount of titanium in the sample. However, looking at the 10W sample, some defects occur due to the addition of oxide nanoparticles and a higher laser power being used. Examining the oxygen micrographs, a higher concentration of oxygen can be seen for the Ti 5W 2× sample compared to the previous two samples due to the repetition of the laser test on the 5W 2× sample. We can even see oxygen porous nanostructures for the 10W sample, and this is due to the relatively high oxygen–titanium weight percentage of this sample compared to other samples.
In the context of surface area analysis, as shown in Figure 7A, it is observed that the bare Ti sample exhibits a greater percentage area in comparison to both Ti 5W and 5W 2× samples. This disparity can be attributed to the absence of oxide nanoparticles that typically adhere to the surface of the bare Ti material, thereby not impeding the calculated surface area measurement. Conversely, the Ti 10W sample demonstrates a significantly larger percentage area. This outcome is directly linked to the utilization of a higher laser power during the analysis process. By employing a more potent laser intensity, the Ti 10W sample undergoes alterations that result in an increased percentage area in the surface area analysis.
In the profilometer images for titanium, the 10W sample appears to have more dense porous nanostructures, which are thick and relatively tall compared to the other samples.

3.2.2. MATLAB Results

Referencing Figure 8, in the experimental comparisons conducted, it was evident that the maximum theoretical surface temperature achieved was noticeably higher in the 5W 2× sample when compared with the 5W sample. For the 5W sample, the experimental configuration involved the controlled application of oxide nanoparticles at a specific laser power output. In contrast, the approach taken for the 5W 2× sample entailed the repetition of the laser testing procedure, essentially doubling all laser parameters, which consequently led to the attainment of a significantly higher maximum temperature. The underlying factors contributing to this discrepancy in surface temperatures are explained by the interaction between the nanoparticles both during and after the laser irradiation process. This phenomenon indicates the dynamic role played by nanoparticle interactions in influencing thermal outcomes during laser-assisted experiments, thereby exemplifying the multifaceted nature of material-processing methodologies that rely on such mechanisms for enhanced performance and efficacy.
When the temperature exceeds 800 degrees Celsius, the rate at which oxidation occurs experiences a significant surge. At such elevated temperatures, the oxide layer undergoes a rapid growth spurt and might even start to flake away. This action exposes titanium surfaces to the surrounding elements, thereby potentially affecting the ongoing oxidation process. This sequence of events is crucial as it triggers a chain reaction, where the exposed fresh titanium initiates a cascading effect that accelerates the oxidation process even further. Consequently, it becomes paramount to closely monitor and control the temperature conditions to mitigate the rapid oxidation progression and uphold the integrity of the titanium material.
Comparing the ablation depths between the 5W and 5W 2× samples, it is observed that there is a slightly higher depth attained in the case of using a power setting of the 5W-2× sample. This increase in depth can be attributed to various factors, such as the intensity of the laser energy and the specific properties of the material being ablated. Additionally, this setting also results in the formation of more fibrous titanium oxide structures, which play a crucial role in the process of ablation. These structures, characterized by their fibrous nature, contribute to the overall efficiency and effectiveness of the ablation procedure. The presence of such structures indicates a more controlled and precise ablation process, which can have significant implications in various applications, including material processing technologies. Therefore, the combination of higher ablation depth and the formation of fibrous titanium oxide structures in the 5W-2× setting highlights the importance of selecting the appropriate parameters for achieving desired outcomes in ablation processes.
When analyzing the maximum surface temperature observed in both the 5W and 10W samples, it becomes evident that a parallel conclusion can be drawn compared to the findings for the 5W and 5W 2× samples. It is crucial to note the shift in laser power within this comparison—one where there is a noticeable escalation in the power output. This rise in laser power is a significant factor to consider, especially when all other variables and parameters remain constant and unaffected. The experimental adjustment in laser power introduces a new layer of complexity in the analysis, opening avenues for deeper exploration into the thermal behavior of the samples under varied power conditions. This change in the experimental setting broadens the spectrum of insights that can be derived from the study, warranting a comprehensive examination of the thermal responses exhibited by the samples. The increased laser power prompts a reevaluation of the thermal dynamics governing these samples, potentially unraveling nuanced correlations between power input and resulting temperature profiles. This alteration in the power setting allows for a nuanced investigation into the threshold at which temperature changes become discernible, highlighting the interaction between laser power and thermal effects on the samples. By exploring the implications of enhanced laser power on surface temperatures, a more detailed understanding of the thermal characteristics governing sample behavior can be attained, possibly shedding light on subtle nuances that might have gone unnoticed under lower power regimes. Expanding on the implications of this power increment on temperature outcomes can lead to a more thorough comprehension of the underlying mechanisms at play, offering valuable insights into how variations in laser power can influence the overall thermal response of the samples.
In our experimental findings using scanning electron microscopy (SEM) and energy dispersive X-ray spectroscopy (EDX), we observed that the surface temperatures for the 10W setting exhibited the highest values for both maximum and average temperatures. This alignment further corroborates our results and reinforces the consistency observed within our analysis. The data gathered suggest a strong correlation between the settings and the thermal behavior of the surface, indicating that the 10W setting has a significant impact on the temperatures reached. This finding underscores the importance of accurately controlling the power output to influence the surface temperature, a factor that can greatly impact the overall performance and behavior of the system. Further investigations and experiments could offer additional insights into the underlying mechanisms driving these temperature variations and could potentially lead to refined control strategies for optimizing performance based on surface temperature considerations.
The ablation depth, which indicates the penetration distance of the laser beam into the material, is notably increasing in the 10W setting. This higher level of ablation at 10W results in the generation of a maximal amount of exposed surface area along with the development of intricate nanofibrous structures within the material. The intensified ablation process at this power level plays a crucial role in accurately shaping and modifying the properties of the material. The enhanced ablation depth observed at 10W showcases the effectiveness of this setting in achieving optimal material transformation. The interaction between the laser beam and the material is set at this power level to promote the formation of the desired surface features and nanostructures, highlighting the importance of selecting the appropriate laser parameters for achieving specific material outcomes.

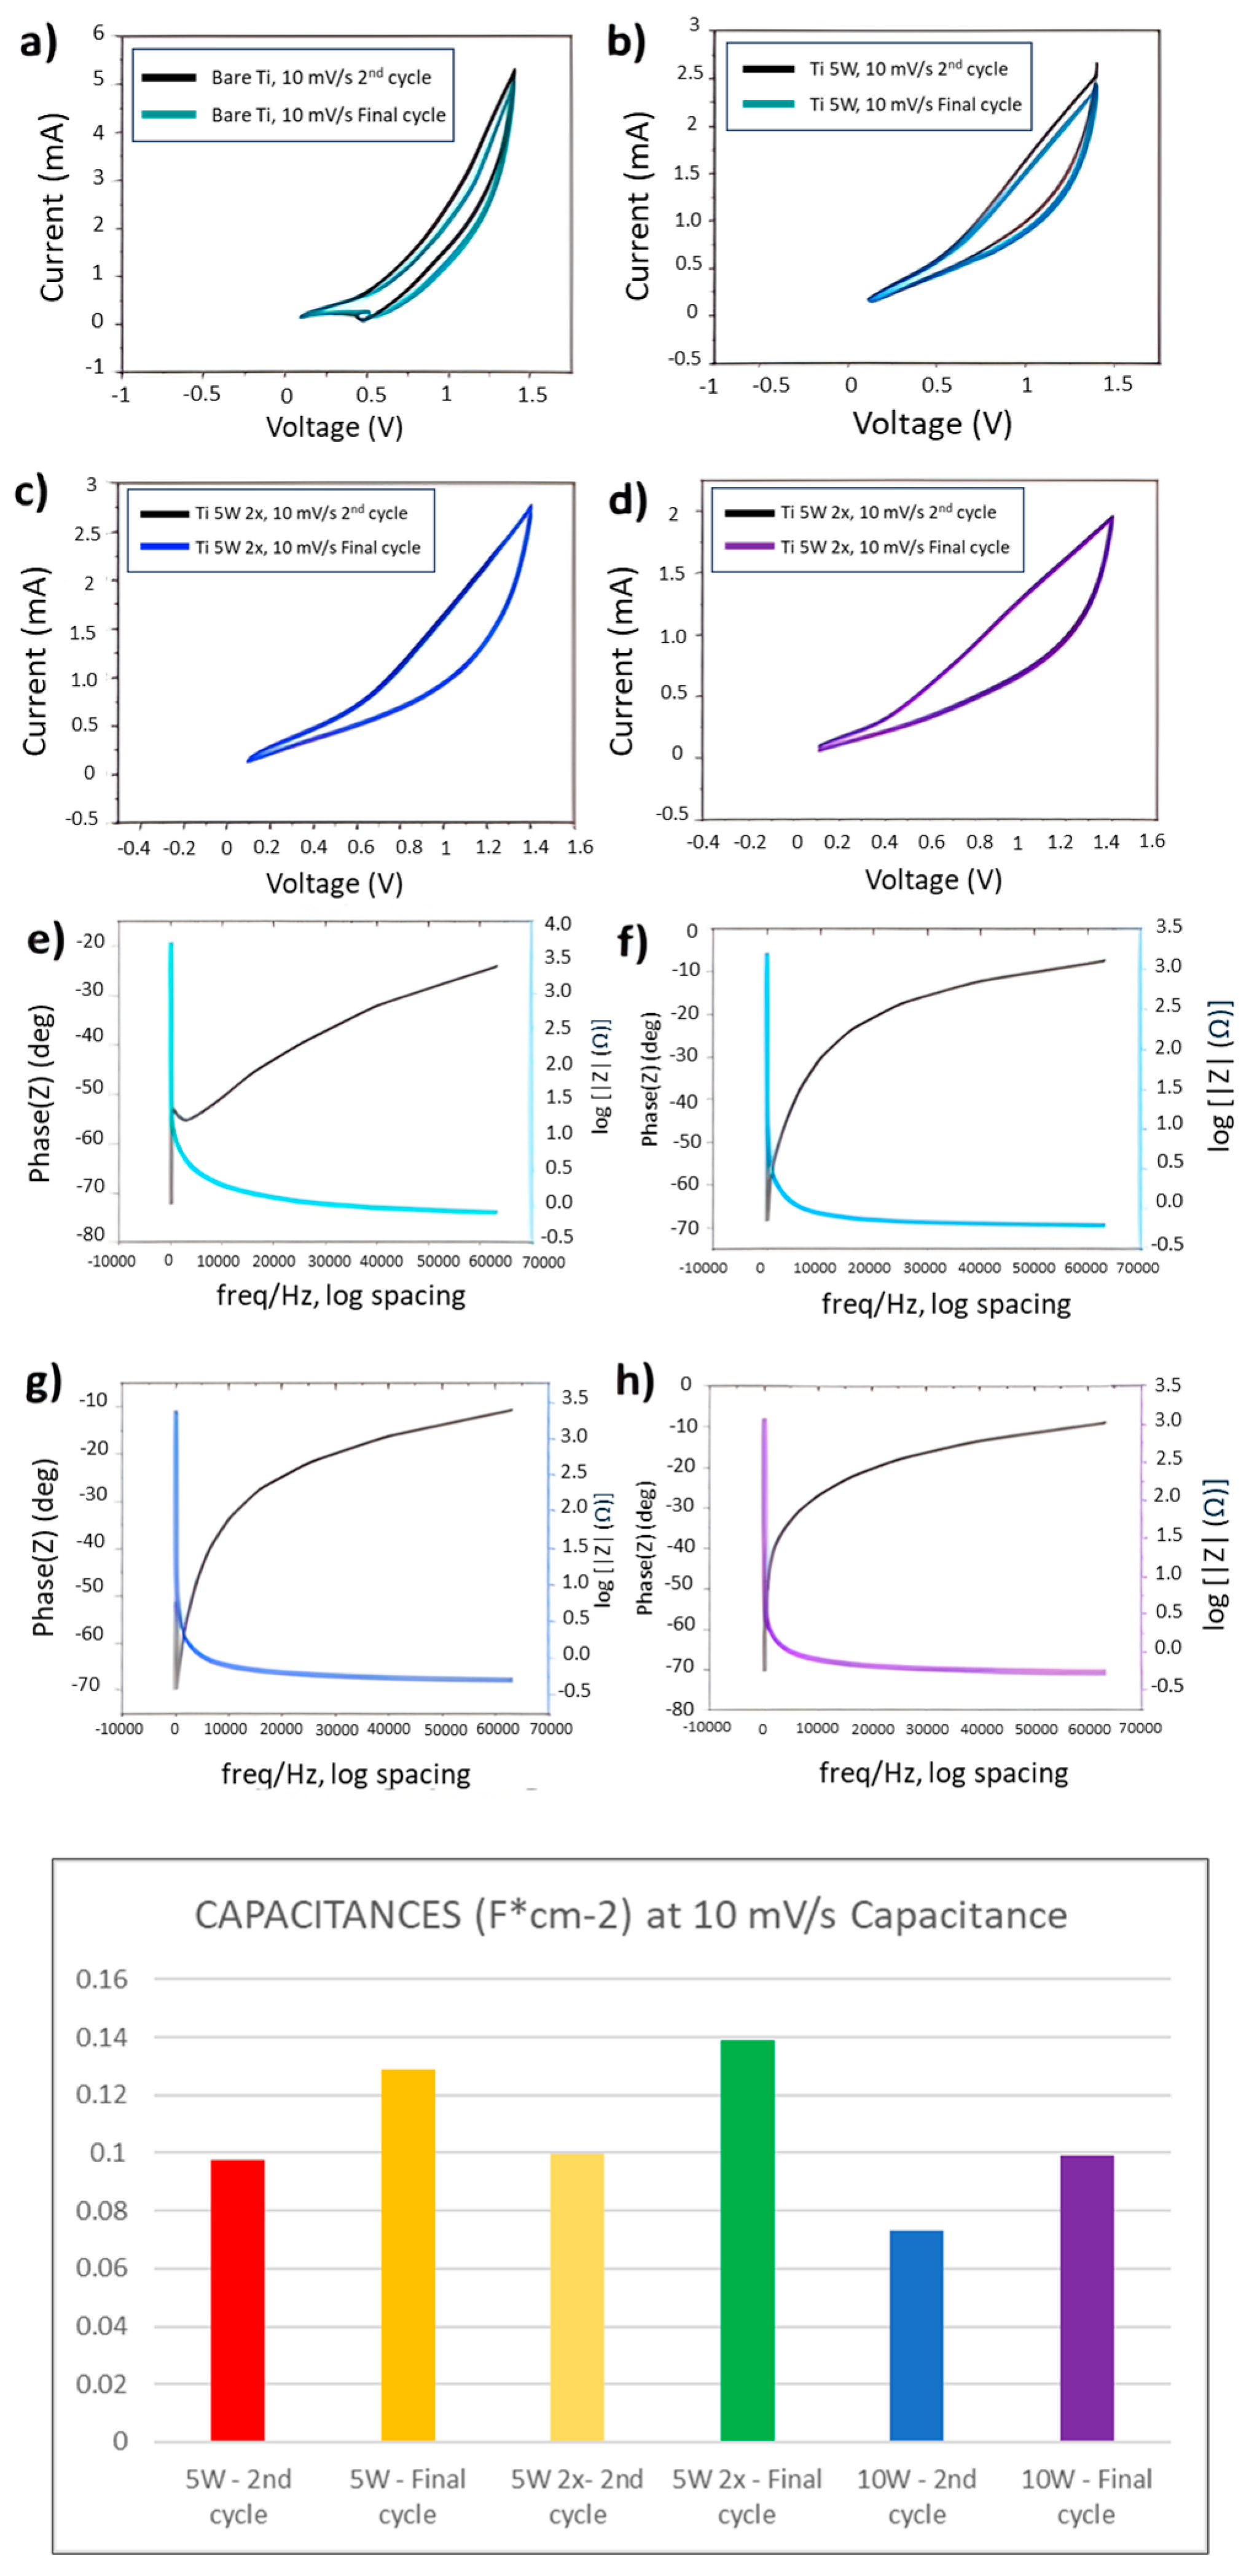
3.2.3. Electrochemical Tests (Three-Electrode)

For the cyclic voltammetry results, as presented in Figure 9a,b, Titanium 10W has a thicker curve compared to the other samples for a scan rate of 5 mV/s; at lower scan rates, the current flowing through the sample can be easily detected. Looking at the results for the 20 mV/s scan rate, we notice that the 5W 2× sample and the 10W sample have similar thickness for the CV curve due to repetition of the laser test, and doubling the laser power, respectively. Despite this similarity, it can still be concluded that the 10W sample has the best performance, and this can be explained by the trend in the capacitance of the samples at each scan rate, as seen in Figure 9c.
Looking at the EIS plots for all the titanium samples, a higher change in phase angle and impedance magnitude can be observed for the Titanium 10W sample compared to the other samples. The 10W sample has the lowest minimum impedance magnitude, thus indicating an easier flow of current through the sample. Another thing to note is that this sample has the lowest phase angle at the lowest frequency, and the highest phase angle at the highest frequency, and this could indicate a capacitive process occurring at the sample surface at lower frequencies. For these reasons, it can be said that the trend in phase angle decrease and impedance magnitude increase among the titanium samples is relatively more reasonable compared to that with the zinc samples.
In contrast to zinc, we see more successful and reasonable results with CV and EIS for titanium since a proper trend in capacitance and other electrochemical properties is observed in these tests. Thus, it can be said that titanium works better as a cathode; however, other important quantities such as energy and power density need to be figured out. These quantities can be determined using the galvanostatic charge–discharge test, and they are the key factors in determining the performance of the cathode in the zinc-ion battery.
The equations for energy and power densities, in terms of the sample surface area, are given as follows:
E a = C a ( Δ U ) 2 7.2
P a = E a 3600 Δ t
Substituting Equation (17) into (18), we obtain the following expression:
P a = 500 C a ( Δ U ) 2 t
where ΔU represents the potential window, and Δt is the discharging time, both measured from the GCD curves. Here, we assume that each sample has a surface area of 1 cm2.

3.2.4. Electrochemical Tests (Two-Electrode)

Looking at the CV curves for titanium, the 10W curve has a wider area due to a higher laser power being ablated, thus indicating a higher electrical power output exhibited by the sample. However, in the capacitance charts, the 5W 2× sample, especially at the final cycle, has the highest capacitance due to the doubling of not only the laser power but also of other parameters during the ablation process. Moreover, the capacitance values are highest at the final cycle of the CV because, at that point, the battery has undergone several cycles of current flow and will thus be able to produce a great amount of current. Some of the electrochemical tests have been outlined in Figure 10. Upon analysis of the EIS plots, it is evident that bare titanium exhibits a notably higher maximum impedance in comparison to the other samples. This signifies that the other samples have the capacity to generate current more effectively within specific voltage ranges. However, it is important to note that bare titanium demonstrates greater corrosion resistance. The minimum phase angle for each sample is slightly above −90 degrees, indicating that the samples display nearly but not entirely capacitive behavior. This suggests the potential formation of a protective oxide layer. However, due to the non-capacitive nature of the samples, the likelihood of this occurrence is diminished.

4. Conclusions

In conclusion, this study explores the potential of laser-ablation-based titanium oxide as a novel cathode material for zinc-ion batteries, highlighting the urgent need for alternative battery chemistries beyond lithium-ion systems. Lithium-ion batteries face challenges such as high costs, resource scarcity, and environmental concerns. Zinc-ion batteries, however, offer a promising alternative due to zinc’s abundance, low cost, and safety benefits, including compatibility with non-flammable aqueous electrolytes, making them suitable for large-scale energy storage. Using the ultra-short laser pulses for in situ nanostructure generation (ULPING) technique, this research successfully generated nanostructured titanium oxide. The laser ablation process created highly porous nanostructures, which are crucial for enhancing the electrochemical performance of electrodes. ULPING-based titanium oxide has a strong oxide layer, thus keeping the oxide nanoparticles in place so that they are available when the titanium sample is inserted into the battery ready for charging and discharging processes. Conventional manufacturing methods are relatively inefficient, time-consuming, and require multiple steps, and for this reason, battery electrodes produced with these methods will have a weakened oxide layer and thus they will not be an effective choice. ULPING is known to be a green, single-step, and efficient method for producing nanostructures; however, it can be enhanced by, for example, implementing machine learning to speed up the process further or re-design the equipment so that it can implement nanostructures onto multiple samples at one time.
Zinc and titanium oxide samples were evaluated using two-electrode and three-electrode setups employing cyclic voltammetry (CV), electrochemical impedance spectroscopy (EIS), and galvanostatic charge–discharge (GCD, see Supplementary Materials). Among the tested samples, Ti-5W (laser ablated twice) and Ti-10W emerged as the most promising cathodes for zinc-ion batteries. These samples demonstrated excellent charge capacity and energy density, with Ti-10W showing superior long-term performance due to its highly porous nanostructures, which facilitate better ion diffusion and electron transport. These results suggest that laser-ablated titanium oxide has significant potential as a high-performance cathode material for zinc-ion batteries. While this study marks a significant advancement, further research is necessary to fully exploit the benefits of laser ablation techniques in battery technology. Future investigations should aim to optimize laser parameters for better control over nanostructure morphology and explore the long-term stability and scalability of these electrodes. Additionally, combining titanium oxide with other materials could further enhance zinc-ion battery performance.
In summary, this research demonstrates the viability of laser-ablation-based titanium oxide as a cathode material, emphasizing the importance of continued exploration of alternative battery chemistries to overcome the limitations of lithium-ion systems and promote sustainable energy solutions.

Supplementary Materials

The following supporting information can be downloaded at: https://www.mdpi.com/article/10.3390/coatings14091163/s1.

Author Contributions

The manuscript was written through contributions of all authors. S.S.S. and J.R. did the conceptualization, with S.S.S. doing the experiments, initial collection of data and draft writing, followed by J.R. doing re-organization of the writing along with new additions; hence, both S.S.S. and J.R. share equal authorship. E.G.V. helped in data processing and writing, further adding to the final manuscript. A.K. supervised the conceptualization and overall writing of the manuscript, and provided expert suggestions. All authors have read and agreed to the published version of the manuscript.

Funding

This work was supported by Natural Sciences and Engineering Research Council of Canada (NSERC, #RGPIN-2022-03992) and MITACS.

Institutional Review Board Statement

Not applicable.

Informed Consent Statement

Not applicable.

Data Availability Statement

The original contributions presented in the study are included in the article/Supplementary Material, further inquiries can be directed to the corresponding authors.

Acknowledgments

The authors thanks and acknowledge the partial support provided by NSERC.

Conflicts of Interest

The authors declare no conflicts of interest.

References

  1. Dominković, D.F.; Bačeković, I.; Pedersen, A.S.; Krajačić, G. The Future of Transportation in Sustainable Energy Systems: Opportunities and barriers in a clean energy transition. Renew. Sustain. Energy Rev. 2018, 82, 1823–1838. [Google Scholar] [CrossRef]
  2. Lund, P.D. Clean Energy Systems as mainstream energy options. Int. J. Energy Res. 2015, 40, 4–12. [Google Scholar] [CrossRef]
  3. Chalk, S.G.; Miller, J.F. Key challenges and recent progress in batteries, fuel cells, and hydrogen storage for Clean Energy Systems. J. Power Sources 2006, 159, 73–80. [Google Scholar] [CrossRef]
  4. Dincer, I.; Acar, C. A review on Clean Energy Solutions for better sustainability. Int. J. Energy Res. 2015, 39, 585–606. [Google Scholar] [CrossRef]
  5. Desideri, U.; Yan, J. Clean Energy Technologies and Systems for a Sustainable World. Appl. Energy 2012, 97, 1–4. [Google Scholar] [CrossRef]
  6. Garcia-Diaz, B.L.; Olson, L.; Martinez-Rodriguez, M.; Fuentes, R.; Colon-Mercado, H.; Gray, J. High temperature electrochemical engineering and clean energy systems. J. South Carol. Acad. Sci. 2016, 14, 4. [Google Scholar]
  7. Mangla, S.K.; Luthra, S.; Jakhar, S.; Gandhi, S.; Muduli, K.; Kumar, A. A step to clean energy-sustainability in energy system management in an emerging economy context. J. Clean. Prod. 2020, 242, 118462. [Google Scholar] [CrossRef]
  8. Gui, E.M.; MacGill, I. Typology of future Clean Energy Communities: An exploratory structure, opportunities, and challenges. Energy Res. Amp. Soc. Sci. 2018, 35, 94–107. [Google Scholar] [CrossRef]
  9. Dunn, B.; Kamath, H.; Tarascon, J.-M. Electrical Energy Storage for the grid: A battery of choices. Science 2011, 334, 928–935. [Google Scholar] [CrossRef]
  10. Thackeray, M.M.; Wolverton, C.; Isaacs, E.D. Electrical Energy Storage for transportation—Approaching the limits of, and going beyond, lithium-ion batteries. Energy Amp. Environ. Sci. 2012, 5, 7854. [Google Scholar] [CrossRef]
  11. Zhang, Q.; Luan, J.; Tang, Y.; Ji, X.; Wang, H. Interfacial design of dendrite-Free Zinc Anodes for aqueous zinc-ion batteries. Angew. Chem. Int. Ed. 2020, 59, 13280–13291. [Google Scholar] [CrossRef]
  12. Gür, T.M. Review of Electrical Energy Storage Technologies, materials and systems: Challenges and prospects for large-scale grid storage. Energy Amp. Environ. Sci. 2018, 11, 2696–2767. [Google Scholar] [CrossRef]
  13. Zeng, X.; Hao, J.; Wang, Z.; Mao, J.; Guo, Z. Recent progress and perspectives on aqueous zn-based rechargeable batteries with mild aqueous electrolytes. Energy Storage Mater. 2019, 20, 410–437. [Google Scholar] [CrossRef]
  14. Schon, T.B.; McAllister, B.T.; Li, P.-F.; Seferos, D.S. The rise of organic electrode materials for Energy Storage. Chem. Soc. Rev. 2016, 45, 6345–6404. [Google Scholar] [CrossRef] [PubMed]
  15. Cano, Z.P.; Banham, D.; Ye, S.; Hintennach, A.; Lu, J.; Fowler, M.; Chen, Z. Batteries and fuel cells for emerging electric vehicle markets. Nat. Energy 2018, 3, 279–289. [Google Scholar] [CrossRef]
  16. Ao, H.; Zhao, Y.; Zhou, J.; Cai, W.; Zhang, X.; Zhu, Y.; Qian, Y. Rechargeable aqueous hybrid ion batteries: Developments and prospects. J. Mater. Chem. A 2019, 7, 18708–18734. [Google Scholar] [CrossRef]
  17. Liu, J.; Zhao, Y.; Zhou, J.; Cai, W.; Zhang, X.; Zhu, Y.; Qian, Y. Advanced Energy Storage Devices: Basic principles, analytical methods, and Rational Materials Design. Adv. Sci. 2017, 5, 1700322. [Google Scholar] [CrossRef]
  18. Mitali, J.; Dhinakaran, S.; Mohamad, A.A. Energy Storage Systems: A Review. Energy Storage Sav. 2022, 1, 166–216. [Google Scholar] [CrossRef]
  19. Riaz, A.; Sarker, M.R.; Saad, M.H.M.; Mohamed, R. Review on Comparison of Different Energy Storage Technologies Used in Micro-Energy Harvesting, WSNs, Low-Cost Microelectronic Devices: Challenges and Recommendations. Sensors 2021, 21, 5041. [Google Scholar] [CrossRef]
  20. Shin, J.; Lee, J.; Park, Y.; Choi, J.W. Aqueous zinc ion batteries: Focus on zinc metal anodes. Chem. Sci. 2020, 11, 2028–2044. [Google Scholar] [CrossRef]
  21. Al-Amin, M.; Islam, S.; Shibly, S.U.A.; Iffat, S. Comparative review on the aqueous zinc-ion batteries (AZIBs) and flexible zinc-ion batteries (FZIBs). Nanomaterials 2022, 12, 3997. [Google Scholar] [CrossRef] [PubMed]
  22. De Cachinho Cordeiro, I.M.; Li, A.; Lin, B.; Ma, D.X.; Xu, L.; Eh, A.L.S.; Wang, W. Solid Polymer Electrolytes for Zinc-Ion Batteries. Batteries 2023, 9, 343. [Google Scholar] [CrossRef]
  23. Jin, T.; Singer, G.; Liang, K.; Yang, Y. Structural batteries: Advances, challenges and perspectives. Mater. Today 2023, 62, 151–167. [Google Scholar] [CrossRef]
  24. Khot, M.; Kiani, A. Effects of surface morphology with pulse duration variation for supercapacitor electrode fabrication using ULPING technique. Lasers Manuf. Mater. Process. 2023, 10, 548–562. [Google Scholar] [CrossRef]
  25. Kiani, A.; Venkatakrishnan, K.; Tan, B. Direct laser writing of amorphous silicon on si-substrate induced by high repetition femtosecond pulses. J. Appl. Phys. 2010, 108, 074907. [Google Scholar] [CrossRef]
  26. Colpitts, C.; Ektesabi, A.M.; Wyatt, R.A.; Crawford, B.D.; Kiani, A. Mammalian fibroblast cells avoid residual stress zone caused by nanosecond laser pulses. J. Mech. Behav. Biomed. Mater. 2017, 74, 214–220. [Google Scholar] [CrossRef]
  27. Khosravinia, K.; Kiani, A. Protocol for fabricating pseudocapacitor electrodes using ultra short laser pulses for in situ nanostructure generation. STAR Protoc. 2023, 4, 102469. [Google Scholar] [CrossRef]
Figure 1. (a) ULPING (ultra-short laser pulses for in situ nanostructure generation) laser ablation setup; (b) process of oxidizing nanoparticles onto samples using ULPING; (c) 3-electrode setup with working, counter and reference electrode; (d) 2-electrode coin cell setup, which is relatively simple compared to the 3-electrode setup [23].
Coatings 14 01163 g001
Figure 2. SEM images for (a) bare zinc; (b) Zinc 5W; and (c) Zinc 10W. It is evident that the bare zinc surface has major dents and scratches, while the oxidized zinc surfaces have various porous structures; (dg) SEM images for all zinc samples; (h) oxygen–zinc weight percentage of each zinc sample; (ik) EDX images for all zinc samples. For the EDX images, carbon is denoted in red, oxygen in blue and zinc in green.
Coatings 14 01163 g002
Figure 3. (A) ImageJ software (v1.54a) was used to determine the % area for each sample at three takes. These area values are averaged out to obtain the mean value. % area is the amount of area of the sample that is porous; Top view profilometer images showing the depth of the surface for (B) bare zinc, (D) Zinc 10W and (G) Zinc 5W; profilometer images showing x- and y-distances for (C) bare zinc, (F) Zinc 10W and (I) Zinc 5W. Surface roughness profiles for (E) Zinc 10W and (H) Zinc 5W.
Coatings 14 01163 g003
Figure 4. (a,b) Temperature gradients; (c) average surface temperature graphs; and (d) ablation depth curves for oxidized zinc samples.
Coatings 14 01163 g004
Figure 5. Cyclic voltammetry curves for bare zinc, Zinc 5W and Zinc 10W samples performed at scan rates of (a) 5 mV/s and (b) 10 mV/s and a voltage range of −0.5 to 1 V. (c) Bar chart for areal capacitances for all zinc samples at scan rates of 5 and 10 mV/s; Bode Plots for (d) bare zinc; (e) Zinc 5W and (f) Zinc 10W showing the comparison between phase angle and the logarithm of impedance for each sample.
Coatings 14 01163 g005
Figure 6. SEM images for (a) bare titanium; (b) Titanium 5W; (c) Titanium 5W 2×; and (d) Titanium 10W; SEM images for (e) Titanium 5W, 500×; (f) Titanium 5W, 15,000×; (g) Titanium 5W 2×, 500×; (h) Titanium 5W 2× 15,000×; (i) Titanium 10W, 500×; (j) Titanium 10W, 15,000×; EDX images for (k) bare titanium; (l) Titanium 5W; (m) Titanium 5W 2× and (n) Titanium 10W. For each set of images, the color coding for each element is the same as with the zinc samples, but here, we have titanium in orange (o) oxygen–titanium weight percentage for each titanium sample, which was found by dividing the oxygen weight % by the titanium weight % for each sample.
Coatings 14 01163 g006
Figure 7. (A) Percentage area average for each sample; 2D micrographs showing the surface depths for (B) bare Ti, (D) Ti 5W, (G) Ti 5W 2×, and (J) Ti 10W; surface roughness profiles for (E) Ti 5W, (H) Ti 5W 2×, (K) Ti 10W; 3D profilometer images showing height, x- and y-distances for (C) Bare Ti (F) Ti 5W, (I) Ti 5W 2×, (L) Ti 10W.
Coatings 14 01163 g007
Figure 8. (a,b) Maximum surface temperature gradients; (c) average surface temperature and (d) ablation depth curves for Titanium 5W and 5W-2×; (eh) same as (ad), but this time with Titanium 5W and 10W.
Coatings 14 01163 g008
Figure 9. CV curves for all titanium samples carried out at scan rates of (a) 5 mV/s and (b) 20 mV/s. For Figure 9b, the current drop for the oxidized titanium indicates a cathodic peak, which indicates that the oxide nanoparticles are at their starting point, which is the titanium sample at which these particles were ablated on; (c) capacitance for all samples at both scan rates; EIS Bode plots for (d) bare Ti; (e) Ti 5W; (f) Ti 5W 2× and (g) Ti 10W.
Coatings 14 01163 g009
Figure 10. Graphs from cyclic voltammetry test. Comparison between second and final cycle at 10 mV/s for (a) bare Ti, (b) Ti 5W, (c) Ti 5W 2× and (d) Ti 10W; graphs from electrochemical impedance spectroscopy test for two-electrode setups for (e) bare Ti, (f) Ti 5W, (g) Ti 5W 2× and (h) Ti 10W. (i) Capacitance chart for oxidized titanium samples at 10 mV/s scan rate.
Coatings 14 01163 g010
Table 1. ULPING vs. conventional manufacturing methods in terms of various conditions [27].
ConditionsConventional MethodsULPING
Complexity of experimental setupComplicated/many stepsSingle, one step in ambient condition
Technological routeMostly separate products from substrateAdd modification directly on substrate material
Electrode pattern?NoYes
Target materialAll materialsAll solid materials and polymers, particularly transition metals
Collection after procedurePost-processing, bindingN/A
Environmentally friendly?NoYes
Experimental costHighLow
Time to conduct experimentsSlow and time-consumingQuick
Table 2. Laser parameters for all samples (note that all samples except Zn-1 and Ti-7 were ablated using ULPING).
SampleScan Speed (mm/s)Frequency (kHz)Power (W)Pulse Width (ps)Number of Times Laser Test Was Repeated
Zn-1 (Bare Zn)N/AN/AN/AN/AN/A
Zn-2 (Zn-10W)1001200101501
Zn-3 (Zn-5W)100120051501
Ti-4 (Ti-5W)50120051501
Ti-5 (Ti-5W 2×)50120051502
Ti-6 (Ti-10W)501200101501
Ti-7 (Bare Ti)501200N/AN/AN/A
Disclaimer/Publisher’s Note: The statements, opinions and data contained in all publications are solely those of the individual author(s) and contributor(s) and not of MDPI and/or the editor(s). MDPI and/or the editor(s) disclaim responsibility for any injury to people or property resulting from any ideas, methods, instructions or products referred to in the content.

