Abstract
In order to improve the mechanical properties of the wear-resistant layer of the hob cutter ring in shield construction, the influence of different composite matrix powders on the comprehensive performance of the cladding layer was investigated. In this study, TiC-reinforced Fe-Ni-based cladding layers with different matrix compositions were prepared on a modified H13 steel base material using plasma cladding (PC) technology. The matrix powders included Ni-based alloy powder, iron powder Y, and iron powder R. The two iron powders were mixed in different proportions, and then an equal amount of Ni-based alloy powder and TiC ceramic particles were added to form five kinds of composite cladding layer alloy powders. The cladding layers of five different matrices were obtained by cladding. The microstructure and mechanical properties of the composite cladding layer were studied using a metallographic microscope (OM), an X-ray diffractometer (XRD), a scanning electron microscope (SEM), an energy dispersive spectrometer (EDS), an electronic universal testing machine, an image processing microhardness tester, and an abrasive belt friction and wear testing machine. The results showed that the cladding layers of different samples had good metallurgical bonding with the base material. And the microstructure gradually refined from the bottom of the cladding layer to the top of the cladding layer. The cladding layer phases were mainly composed of Fe, FeO, TiC, FeNi, and CrNi. With the increase in the iron powder R ratio, the aggregation of alloy elements gradually alleviated. The ratio of iron powder R was increased from 1/10 to 2/5, the longitudinal shear strength between the cladding layer and the matrix was increased from 318 Mpa to 333 Mpa, and the transverse shear strength was increased from 303 Mpa to 342 Mpa. The hardness of the modified wear-resistant layer was better than that of the cladding layer without iron powder R, but the hardness of the cladding layer gradually decreased. After the modification of iron powder R, the wear resistance of the cladding layer was improved to varying degrees. When Y:R was 9:1, its wear resistance was the best, and the change trend of the wear resistance was consistent with that of hardness. The wear forms of different samples were adhesive wear and abrasive wear. And the height difference of the wear surface gradually increased with the improvement in wear resistance.
1. Introduction
With the rapid development of underground space utilization, shield tunnel boring machines have become indispensable engineering construction equipment. The cutter ring, as the “sharp teeth” of the shield machine, plays a decisive role in the project progress and construction cost. Especially when facing complex rock geology, it can fail easily due to excessive wear. Frequent replacement of the cutter ring will lead to excessive downtime and reduce construction efficiency. Therefore, it is of great significance to study the preparation process of the cutter ring and improve its mechanical properties, as well as to achieve the remanufacturing of high-value parts [1,2].
Surface modification is an effective method to improve the performance of material surfaces and enhance wear resistance, and is crucial to improving the mechanical properties of a material surface. In the field of shield tool surface cladding, thermal spraying, arc cladding, laser cladding, and plasma cladding are widely used. However, the bonding strength of a thermal spray cladding layer is insufficient. Arc cladding has problems of uneven penetration depth and dilution rate. Laser cladding is limited in application due to equipment cost and cladding quality control [3,4,5]. In contrast, plasma cladding technology uses a high-temperature plasma arc to melt alloy powder/pre-cladding layer powder and base material to form a cladding layer with superior performance. It has the advantages of a low dilution rate, a concentrated heat input, a small heat-affected zone, good metallurgical bonding, high efficiency, low cost, and good controllability [6,7,8,9,10,11,12,13]. Plasma cladding is an ideal choice for surface strengthening and the repair of shield tools and wear-resistant tools.
Metal matrix composite materials are often used to strengthen the base material in the field of shield tools [7]. Nickel-based self-fluxing cladding layers are popular due to their high strength, good toughness, and corrosion resistance, especially Ni-Cr-B-Si alloy powder, which has moderate hardness and low brittleness. The presence of chromium improves wear resistance while increasing high-temperature corrosion resistance and oxidation resistance, while the addition of boron and silicon lowers the melting point, making it an excellent choice among nickel-based alloys [14,15]. Iron-based alloy powder is a common wear-resistant cladding material with low cost and high bonding strength with a steel structure [12]. It is regarded as a potential substitute for metals such as nickel and cobalt [13]. Iron-based alloy powder is widely used to repair steel components and has a good bonding interface. It is widely used in the industrial field [16,17,18,19]. Iron-based alloy powder is easily used to prepare cladding layers and has an obvious price advantage. It is abundant in resources in China and is cost-effective. It is also compatible with common steel components. Plasma cladding technology can be used to enhance the performance of iron-based cladding layers through dispersed ceramic particles to meet the requirements of high strength, impact resistance, and wear resistance.
In recent years, ceramic phase reinforced metal-based cladding technology has become an important research direction. Adding ceramic reinforcement phases (such as TiC, TiB2, Al2O3, WC, etc.) to iron-based cladding can further improve its wear resistance. In particular, TiC-reinforced Fe-based composite cladding layers have attracted much attention because the thermal expansion coefficient of TiC is similar to that of the carbon steel base material and has good bonding strength with the base material. TiC has a low solubility in Fe, and both TiC and γ-Fe belong to a face-centered cubic structure. Ti atoms are often associated with Fe atoms. At high temperatures, there is good wettability between the two and no chemical reaction occurs at the interface. Therefore, TiC is often used as a reinforcing phase of iron-based cladding, which can make iron-based composite materials have excellent properties such as high strength, high temperature resistance, and high wear resistance [20,21,22]. TiC-reinforced iron-based composite materials combine the hardness and wear resistance of ceramics with the toughness and plasticity of metal. They have better wear resistance and processing performance than tool steel. At the same time, the price of Ti/Fe powder is low, which brings broad commercial application prospects for TiC-reinforced Fe-based composite cladding.
Zaiqiang Feng et al. [23] used the method of in situ synthesis of TiC and TiN to study the effect of different Ti and B4C contents on plasma cladding iron-based cladding layers. The study showed that with the increases in Ti and B4C content, the number of strengthening phases such as TiC and TiN in the cladding layer gradually increased, and the hardness, wear resistance, and corrosion resistance gradually increased, proving the feasibility of this method. Mingqi Tang [24] and others compared the effects of in situ and non-in situ synthesis methods of TiC on iron-based cladding. The experiments showed that two strengthening phases, TiC and Ti (CN), were formed in the cladding layer prepared by the two methods, and both of them were dispersed. Compared with a pure iron-based cladding layer, the existence of TiC improved the self-corrosion potential of the cladding layer and formed a stable and dense passive film, which further enhanced the corrosion resistance of the cladding layer. M Sharifitabar [25] and others prepared an Fe-TiC-Al2O3 cladding layer through the tungsten arc cladding process and precursor in situ synthesis technology. The research showed that the strengthening phases such as TiC and Al2O3 were formed in the cladding layer, and the incompletely melted TiC and Al2O3 formed clusters, which improved the hardness and wear resistance of the 1045 steel. Deqiang Chen [26] and others successfully prepared a γ-(Fe, Ni)/TiC wear-resistant composite cladding layer on carbon steel using the plasma cladding process, using Ni, Ti, and graphite alloy powder as raw materials. The results showed that TiC was evenly distributed in the γ-(Fe, Ni) matrix, and the hardness of the cladding layer was improved and evenly distributed along the direction of the cladding layer. Because of the high hardness, high volume fraction, and rapid solidification of the TiC strengthening phase, the relative wear resistance of the composite cladding layer was about 20 times higher than that of 0.37% C ordinary carbon steel. Junbo Liu [27] and others successfully prepared a high chromium iron-based composite cladding layer on Q235 steel base material via in situ synthesis. The experiment showed that the cladding layer was composed of TiC, (Cr, Fe)7 C3, and austenite, and its hardness was 3.4 times that of the Q235 steel base material. In the friction and wear test, TiC and (Cr, Fe)7 C3 had high hardness and good wear resistance, which greatly improved the wear resistance of the cladding layer at room temperature and high temperature. F.I. Pantelenko et al. [28] used a stim2/30 SHS electrode to form titanium carbide composite nickel alloy coatings on different steel base materials through EAS. The research showed that there was no crack in the coating once formed, and there were larger titanium carbide grains in the middle of the coating. The grain size decreased to 100 nm near the transition zone, and the higher the alloying degree, the smaller the depth of the coating.
To sum up, many scholars have conducted studies on titanium carbide ceramic phase reinforced single-base metal, but fewer on the composition of a composite matrix, especially in the research field of Fe-based powder modification. Therefore, based on the different mechanical properties of Fe-based alloy powder and Ni-based alloy powder, Ni50 alloy powder was added to Fe-based alloy powder in a specific proportion in this study to coordinate their properties, so as to obtain a cladding layer with both toughness and wear resistance. At the same time, from the point of view of the influence of changing the matrix composition on the properties of the cladding layer, the modification of single Fe-based alloy powder was studied, and two Fe-based alloy powders with different mechanical properties were mixed in different proportions to explore the influence of Fe-based powder modification on the microstructure and mechanical properties of the TiC-reinforced Fe-Ni-based cladding layer. In this paper, the mechanism of different Fe-based powder ratios on the shear strength, microhardness, and wear resistance of a TiC-reinforced metal matrix wear-resistant layer was analyzed in order to provide some experimental and theoretical basis for the research and application of a ceramic phase reinforced composite metal matrix.
2. Experimental Process
2.1. Preparation of Materials and Plasma Cladding Layer
The elemental composition of the H13 steel base material and the wear-resistant layer alloy powder used in the experiment is shown in Table 1, and the data in the table were tested by the manufacturer and accurate values are provided. The sample size of the base material was 19.5 mm × 8 mm × 3.5 mm. Before cladding, a grinding wheel was used to polish the cladding surface to remove the oxide layer, and anhydrous ethanol was used to remove the residual oil. The particle size of wear-resistant layer matrix alloy powder was 53~165 μm, the microhardness of iron powder Y was about 60 HRC, that of iron powder R was about 48 HRC, and that of Ni50 alloy powder was about 50 HRC. The particle size of hard phase TiC ceramics was 74 μm and the hardness was 85 HRC. The hardness and particle size data of the materials used in this study were tested and provided by the manufacturer.

Table 1.
Chemical composition of each component (wt%).
Fe-based alloy powder, Ni50 alloy powder, and TiC particles were fully mechanically mixed according to the mass percentages of 50%, 20%, and 30%. Iron powder Y and iron powder R were mixed in the ratio of 10:0, 9:1, 8:2, 7:3, 6:4, respectively, as shown in Table 2.
Table 2.
Specific gravity of components of different samples (wt%).
In this study, the LU-400TX-BW500RV-ROBPT20 robot-operated(Wuhan Gaoli Thermal Spray Engineering Co., Ltd., Wuhan, China) shield tool wear-resistant surface plasma cladding machine was used for cladding experiments. The schematic diagram of cladding principle is shown in Figure 1. During the experiment, argon gas was used as shielding gas, ion gas, and powder feeding gas. And the cladding layer was prepared by coaxial synchronous powder feeding and single-layer multi-channel cladding structure. As can be seen from Figure 1, the cladding trajectory was “Z”-shaped. Before the experiment, the fully mixed composite powder was added to the powder feeder of the equipment. When cladding, the optimized process parameters were used, as shown in Table 3. Under specified process parameters, the composite powder was moved to the powder delivery tube by the action of the powder delivery gas. Then it was ejected at a specific angle into the plasma arc, where it melted and formed a molten pool with the molten H13 steel. Finally, after cooling and solidification, a cladding layer that was metallurgically bonded with the base material was formed. After cladding, the overall length of cladding layer was 65 mm, the average width was 36 mm, and the height was about 2.8 mm.
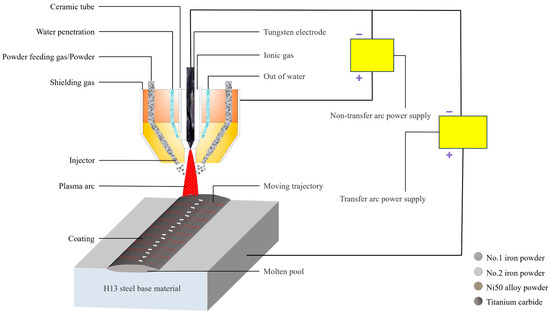
Figure 1.
Schematic diagram of plasma cladding process.
Table 3.
Optimum parameters of plasma cladding process.
2.2. Microstructure Characterization
After cladding of different samples, the electric spark wire cutting equipment was used to perform through cutting in the direction perpendicular to the surface of the cladding layer. The cutting size was 15.5 mm × 15.5 mm × (cladding layer + total thickness of the base material) mm, which was used for metallographic microscopic observation and scanning electron microscope testing. For the cut specimens, the surface perpendicular to the moving direction of the plasma arc single-pass cladding was selected as the grinding and polishing surface. The surface was polished with 180, 400, 600, and 800 mesh sandpaper, respectively. And then the cross-section was polished with diamond polishing paste in pre-polisher and fine polisher, respectively. The polished specimens were etched with 4% nitric acid alcohol solution for 10 s, then cleaned with sufficient anhydrous ethanol and dried with sterile cotton and a hot air blower, and placed aside for later use. The microstructure and organization of the prepared samples were observed using a Zeiss intelligent upright material microscope. And the fine organization and elemental composition were analyzed using a Thermo Fisher Scientific dual-beam FIB scanning electron microscope and its matching energy dispersive spectrometer with an acceleration voltage of 10 kV. The polished samples were analyzed using a Bruker D8 Advance X-ray powder diffractometer (Cu Kα) with a scanning angle of 10° to 80°, a step size of 0.02°, and a scanning speed of 6°/min.
2.3. Mechanical Properties Test
Electric spark cutting equipment was used to cut the wear-resistant layer into standard shear specimens of 10 mm × 10 mm × (cladding layer + total thickness of base material) mm. Six shear samples (three transverse shear samples and three longitudinal shear samples, as shown in Figure 2) were cut for each cladding layer, and the transverse shear and longitudinal shear tests were carried out, respectively. The shear strength values were taken as the above average. The shear test used a WDW-300C microcomputer-controlled electronic universal testing machine. The schematic diagram of the test principle is shown in Figure 2. The hardness test used an HVT-1000Z image processing microhardness tester, which was determined by measuring the diagonal length of the indentation and the size of the load. In order to obtain more accurate microhardness analysis, the diamond indenter of microhardness tester was always pressed in the matrix phase of cladding layer. The measuring range was from the top of the cladding layer to the fusion zone with an interval of 0.4 mm. And three points at each depth level were randomly selected as hardness testing points; then the average value was taken as hardness evaluation standard. Friction and wear experiments were carried out on BD4603 wear testing machine. The wear surface diameter of the sample was d = 15.5 mm. And the Korean DEERFSO YA531+ abrasive belt was used, with a size of 100 mm × 912 mm and a mesh number of 80. The experimental temperature was room temperature, the loading mass was 255 g, the rotation speed was 2980 r/min, and the wear time was 140 min. The friction loss was recorded every 7 min using a PR precision balance (accuracy of 0.001 g), and each record was measured three times, and the average value was taken as the final value. The surface morphology of the worn samples was observed by metallographic microscope, and the wear mechanism of different samples was analyzed in depth by combining with optical 3D surface profiler.
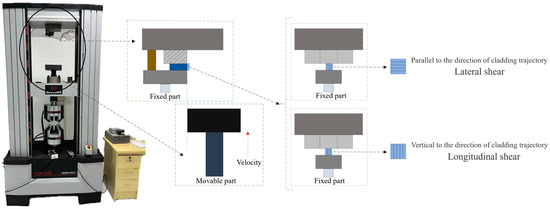
Figure 2.
Schematic diagram of shear experiment.
3. Results and Analysis
3.1. Microstructure Analysis
3.1.1. Phase Analysis
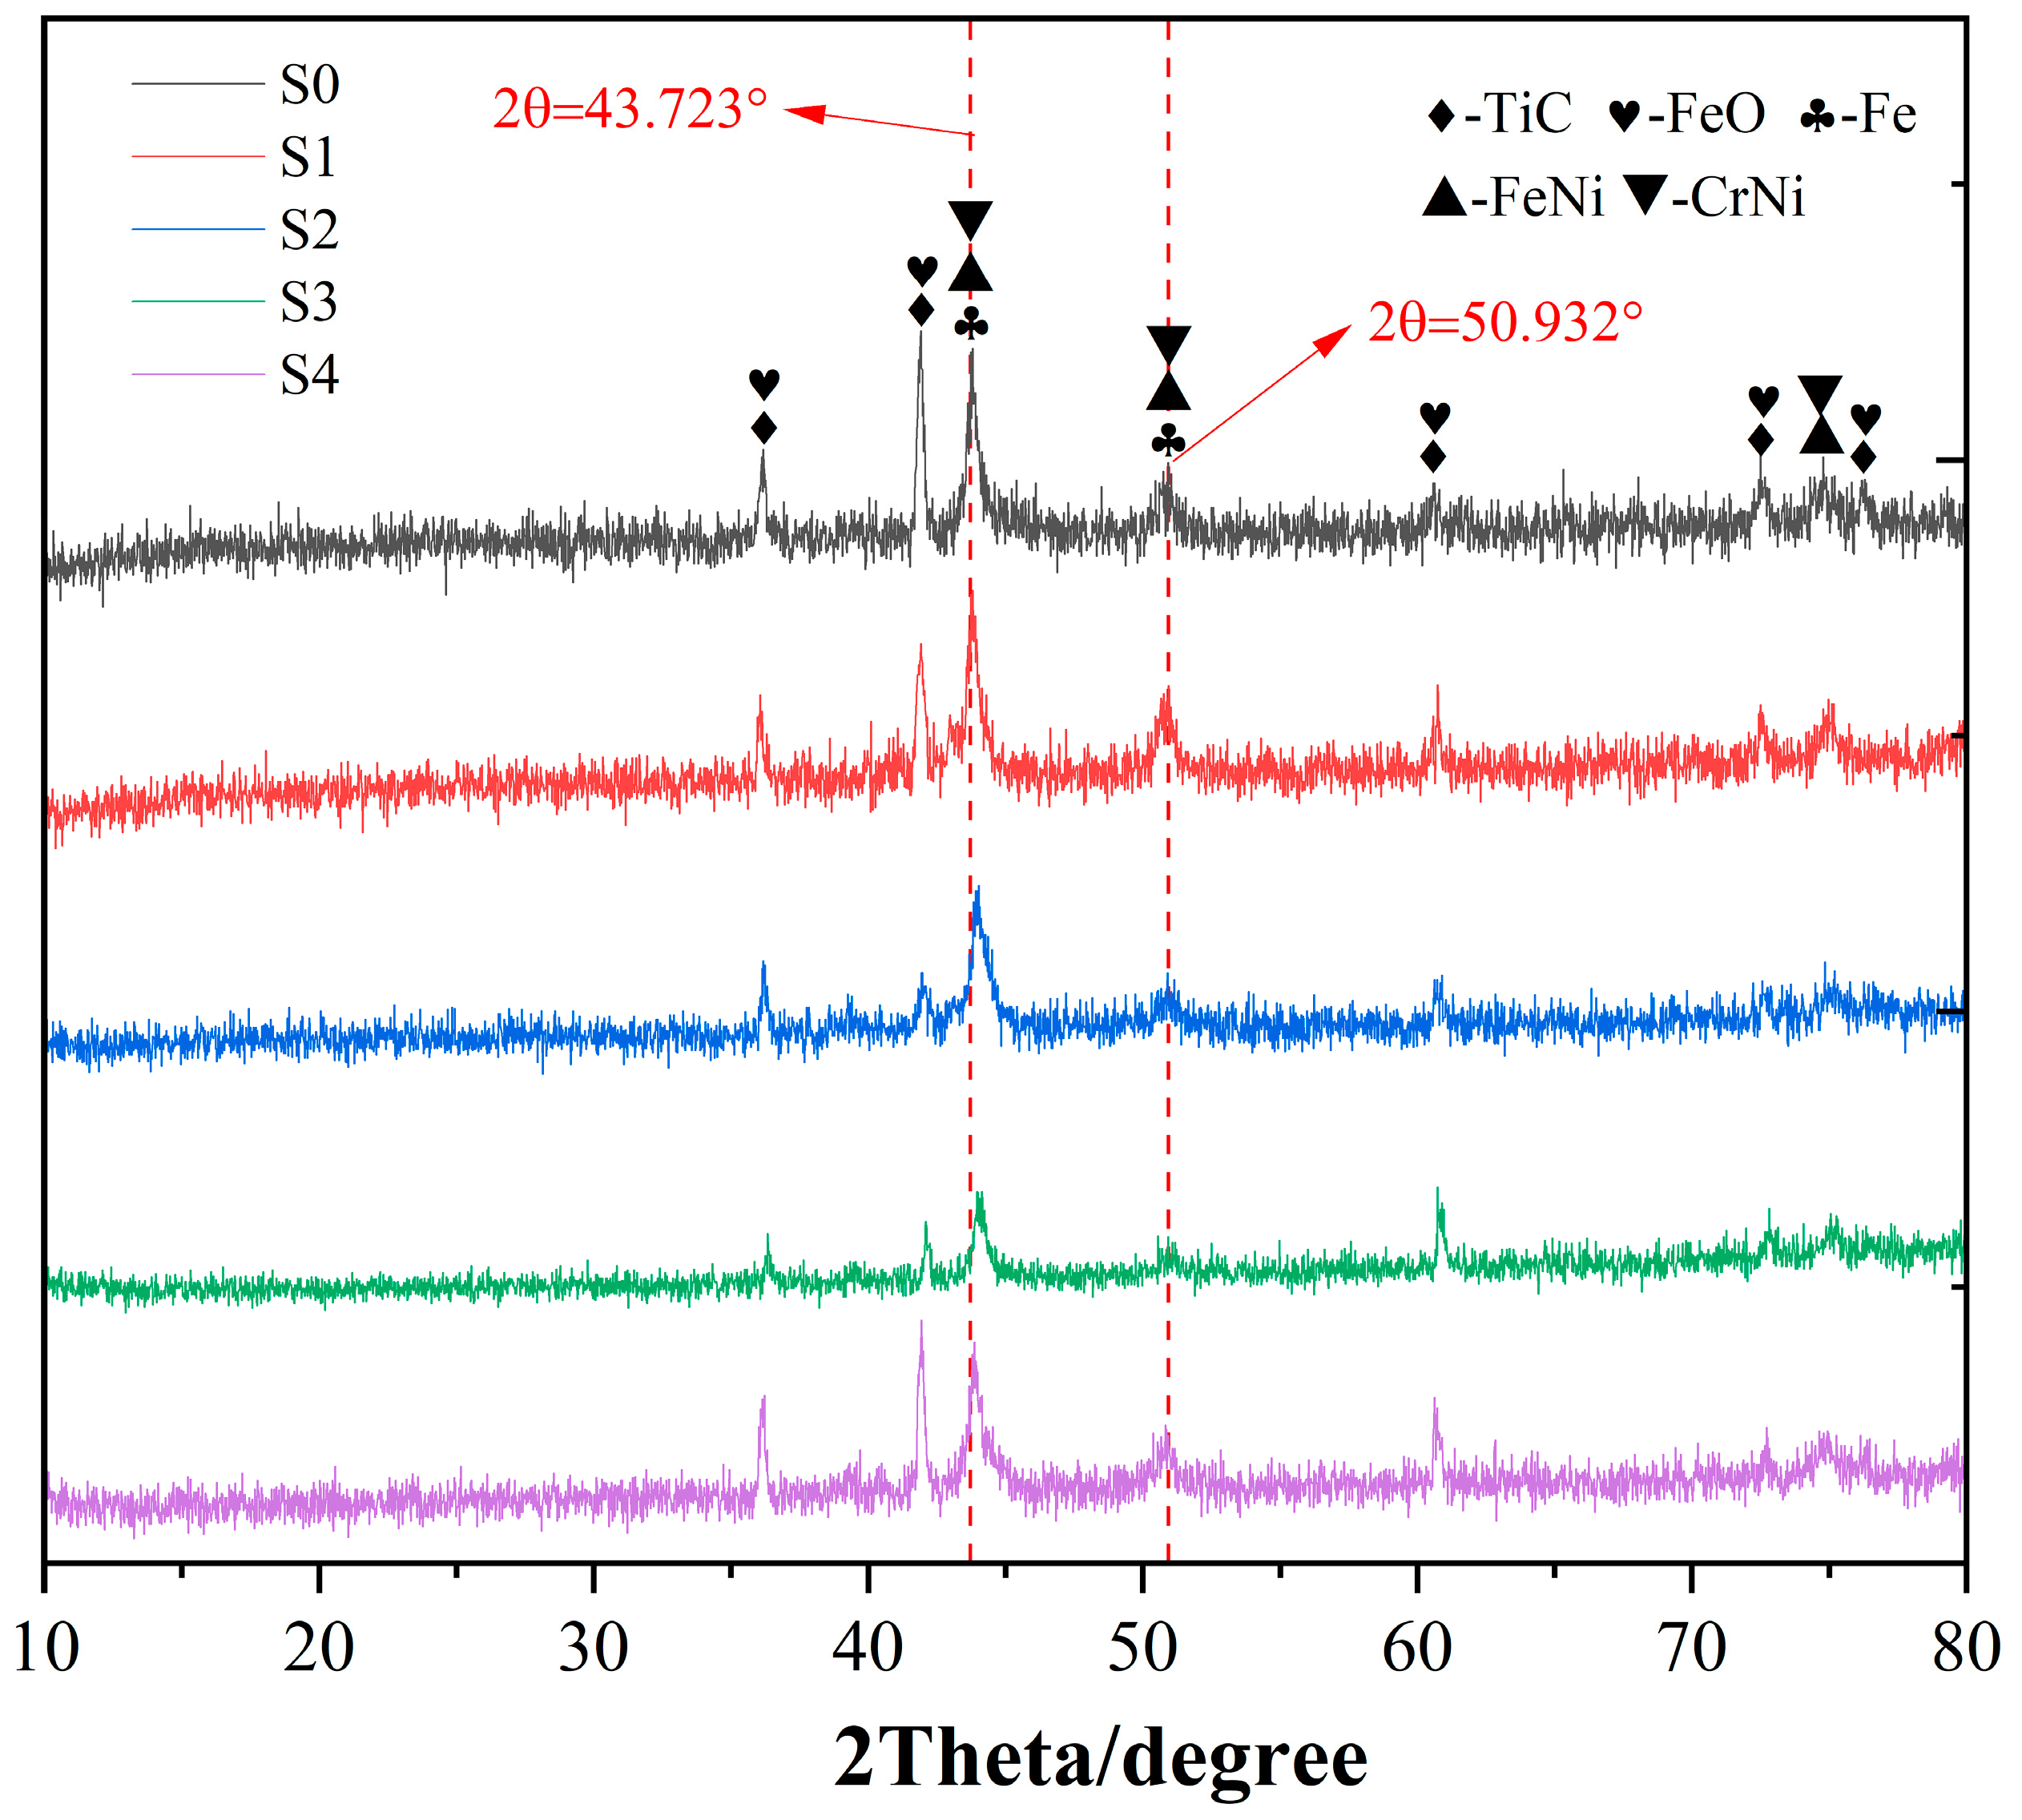
Figure 3 is the 10°–80° X-ray diffraction patterns of different samples. It can be seen from Figure 3 that the cladding layer was mainly composed of TiC, FeO, Fe, FeNi, and CrNi, and the phase composition of the different samples remained unchanged. According to the PDF card, the characteristic peak position of the diffraction peaks of the Fe phase (PDF#97-018-5721) was 2θ = 43.723. From the figure, it can be seen that the diffraction peaks of the iron phases of different samples have different degrees of right deviation. According to the Prague formula [29]:
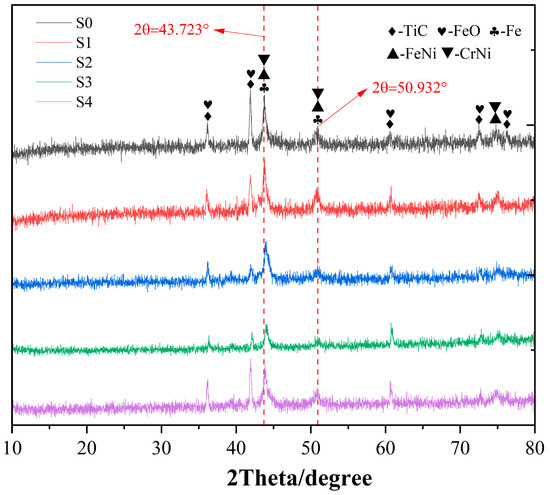
Figure 3.
XRD diffraction patterns of different samples.
In the formula: d—crystal plane spacing, θ—half diffraction angle, n—integer, λ—wavelength of incident X-ray.
Pure iron phase lattices experience contraction, resulting in reduced interplanar spacing. This was attributed to the formation of a FeNi solid solution phase within the cladding layer. The smaller radius of Ni atoms relative to Fe atoms contributed to the lattice contraction.
3.1.2. EDS Element Analysis
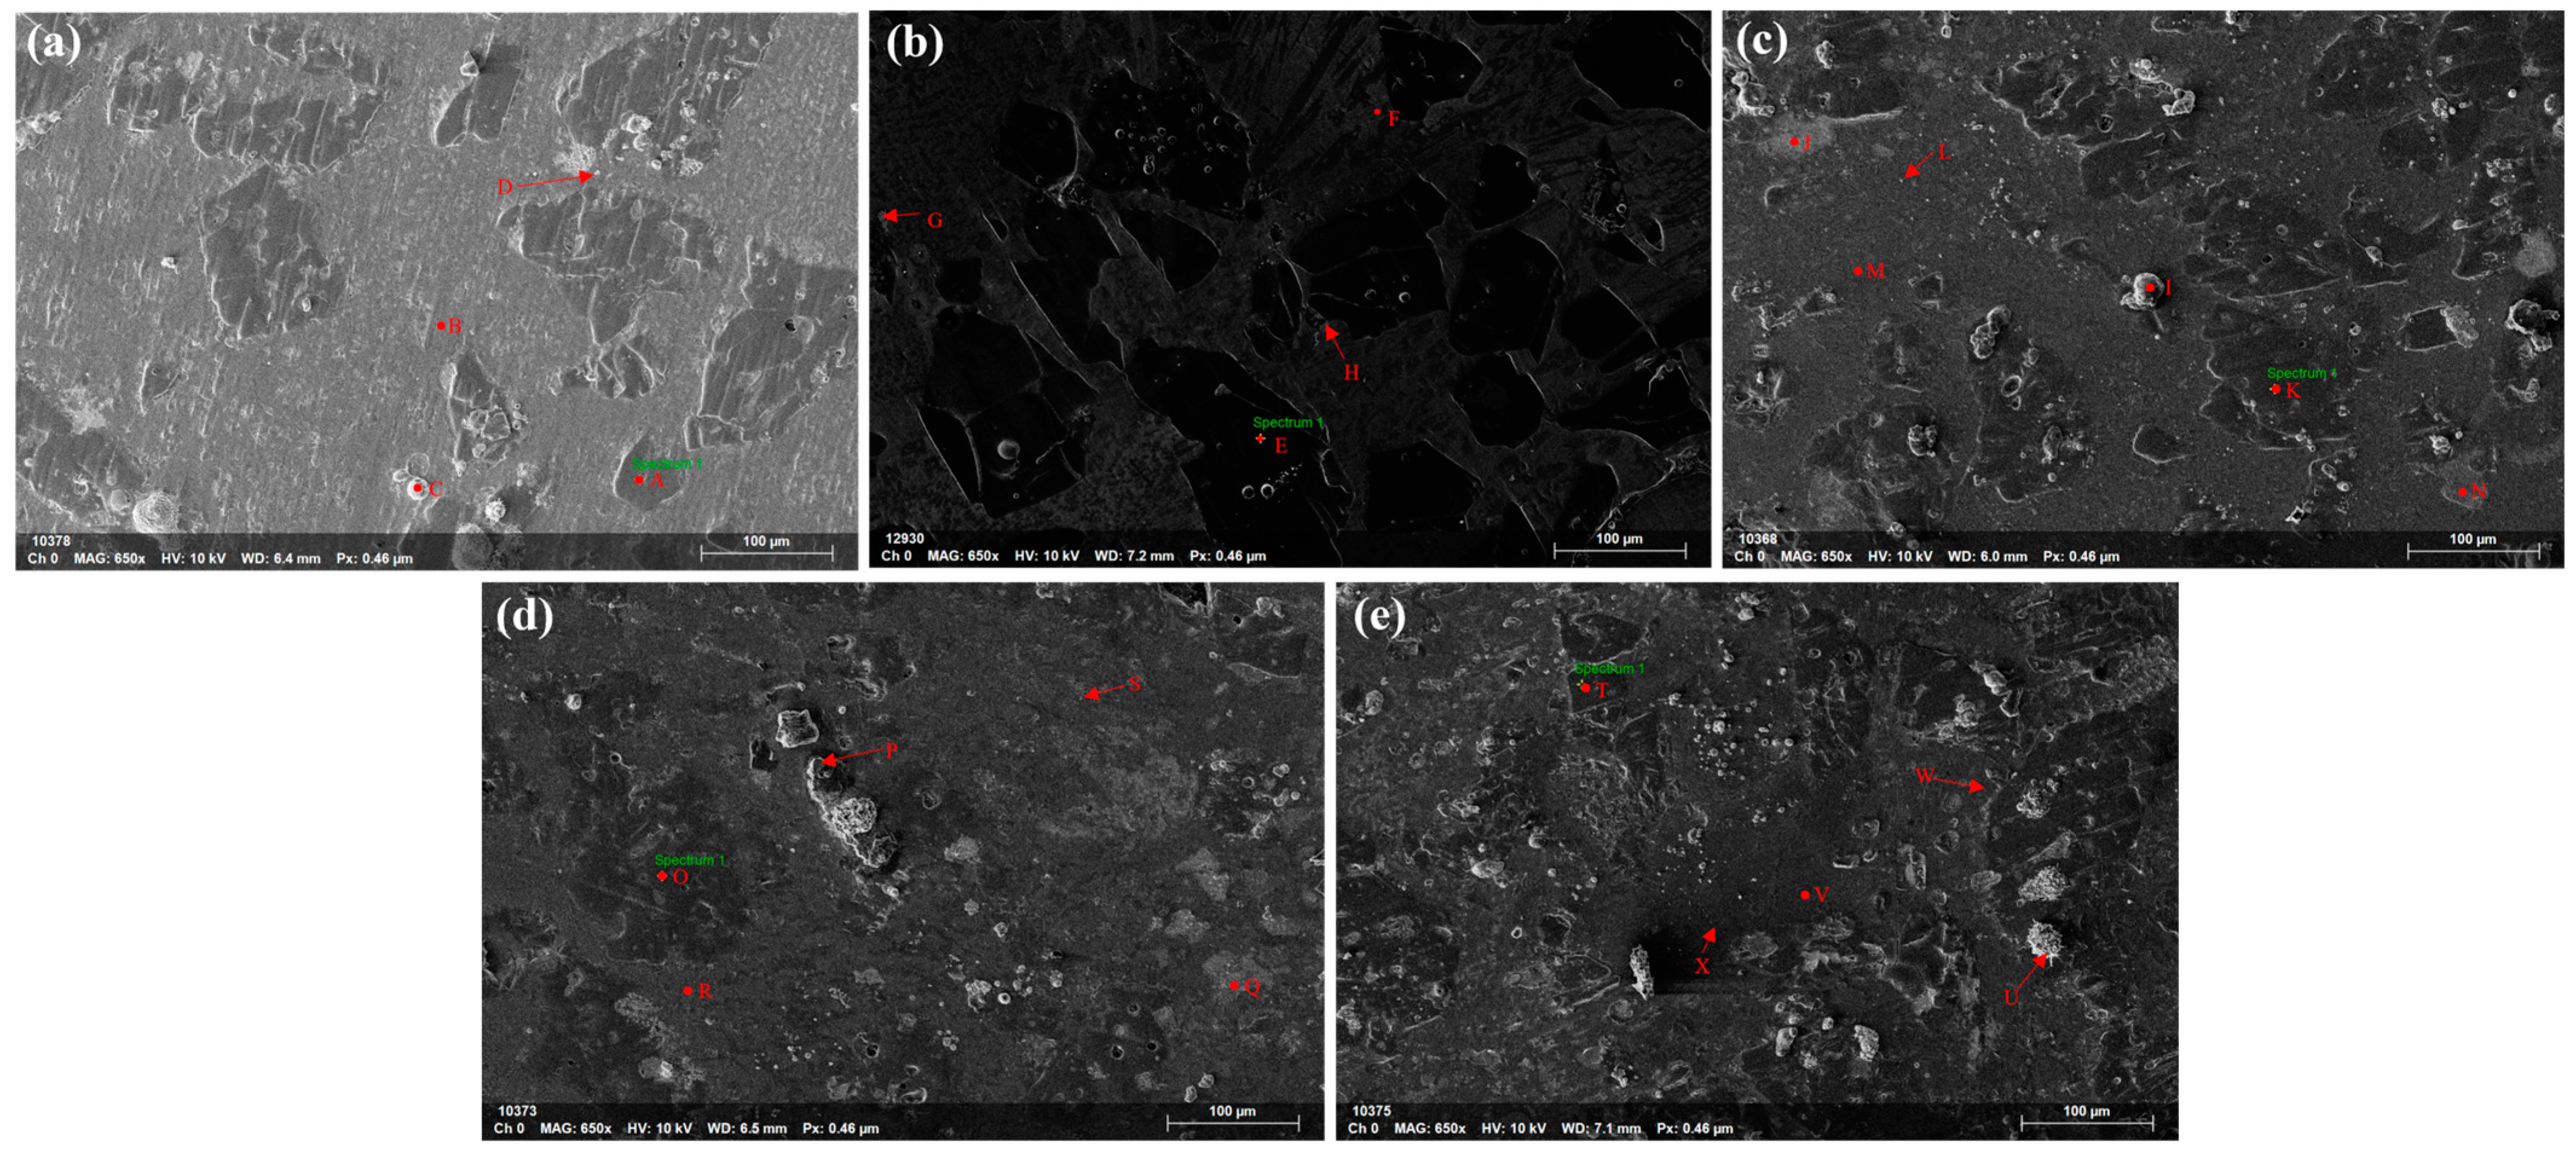
Figure 4 shows the scanning electron microscope images and EDS point scanning images of different samples. It can be seen from the figure that there are different amounts of irregular black block substances distributed on the matrix surfaces of the different samples. Combined with the XRD diffraction results, it could be determined that the composition was TiC. EDS point scanning revealed local element segregation in all samples. This might be due to the nucleation role of TiC particles, which caused a redistribution of alloy elements and intensified elemental heterogeneity. Table 4 shows the EDS point scanning test data. In Figure 4a–d, points A, E, K, O, and T are black irregular blocky substances. The EDS point scanning results showed that they had high Ti and C contents, which could be further confirmed to be TiC particles. Points B, F, M, R, and V are dark gray matrix parts. The test results showed that Fe, Ni, and Cr were rich. Combined with the elemental composition of the composite powder and X-ray diffraction results, the substance might be a mixture of Fe, FeNi solid solution, and CrNi solid solution. Points C, G, I, P, and U are the nearly spherical white substance on the matrix surface, which was recognised as FeO by the EDS element analysis. Points D, H, L, S, and X appear as dispersed fine white dot-like substances. Elemental analysis showed that the substance was rich in Fe and O and contained a small amount of Ni. It might be a mixture of FeO and FeNi solid solution. In Figure 4, points J and N near the TiC particles are irregular gray substances. From the elemental scan, it could be seen that there were more Fe, O, Ti, and C elements, which was a mixture of FeO and TiC. The light grey substance Q and W points could be confirmed as a mixture of FeO and CrNi solid solution by elemental analysis. Combined with the overall microscopic morphology of the different samples, it could be seen (see Figure 5) that due to the presence of pore defects in the middle and upper part of the cladding layer, these pores might form channels with the argon protective environment on the surface of the cladding layer, allowing oxygen in the environment to enter the molten pool. At the same time, due to the high temperature of the plasma arc, the oxygen concentration in the molten pool might decrease due to the high-temperature environment, leading to a decrease in local oxygen content. This promoted the combination of iron with oxygen in the molten pool to form FeO. Cr and Ni are both transition metal elements in the fourth period. They have similar crystal structures, electronic configurations, and similar atomic radii, and have strong affinity. During rapid heating and cooling, the molten pool produced a large temperature gradient, which strengthened the Marangoni convection [30]. This caused the liquid flow inside the molten pool to form a circulation, promoting the redistribution of solutes and forming a CrNi solid solution [31]. Similarly, a significant number of Fe and Ni elements combined to form FeNi substitutional solid solution.
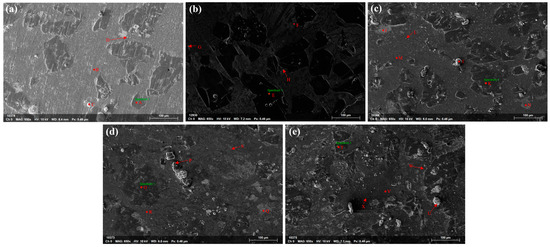
Figure 4.
Point scanning electron microscope images of different samples (a) S0, (b) S1, (c) S2, (d) S3, (e) S4.
Table 4.
Point scanning data of different sample elements (at%).
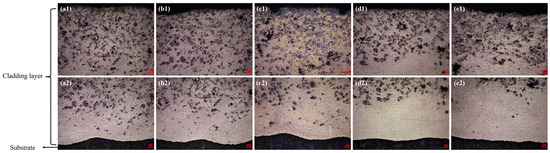
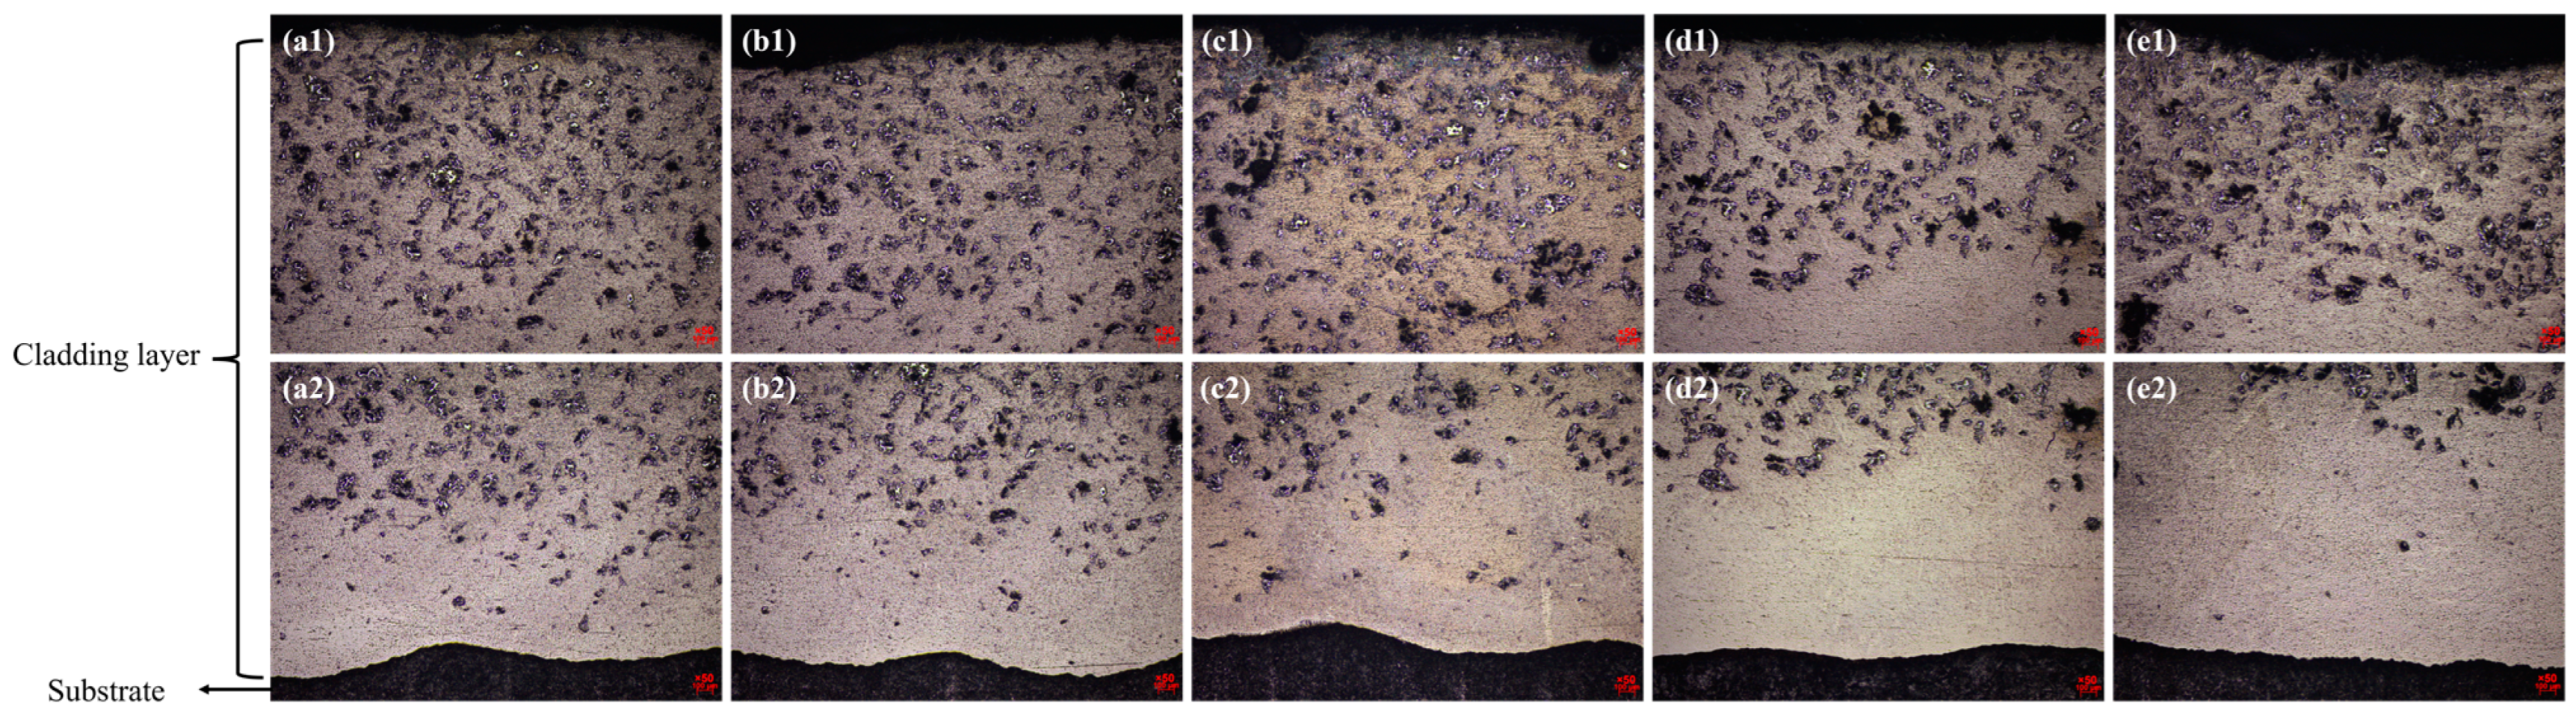
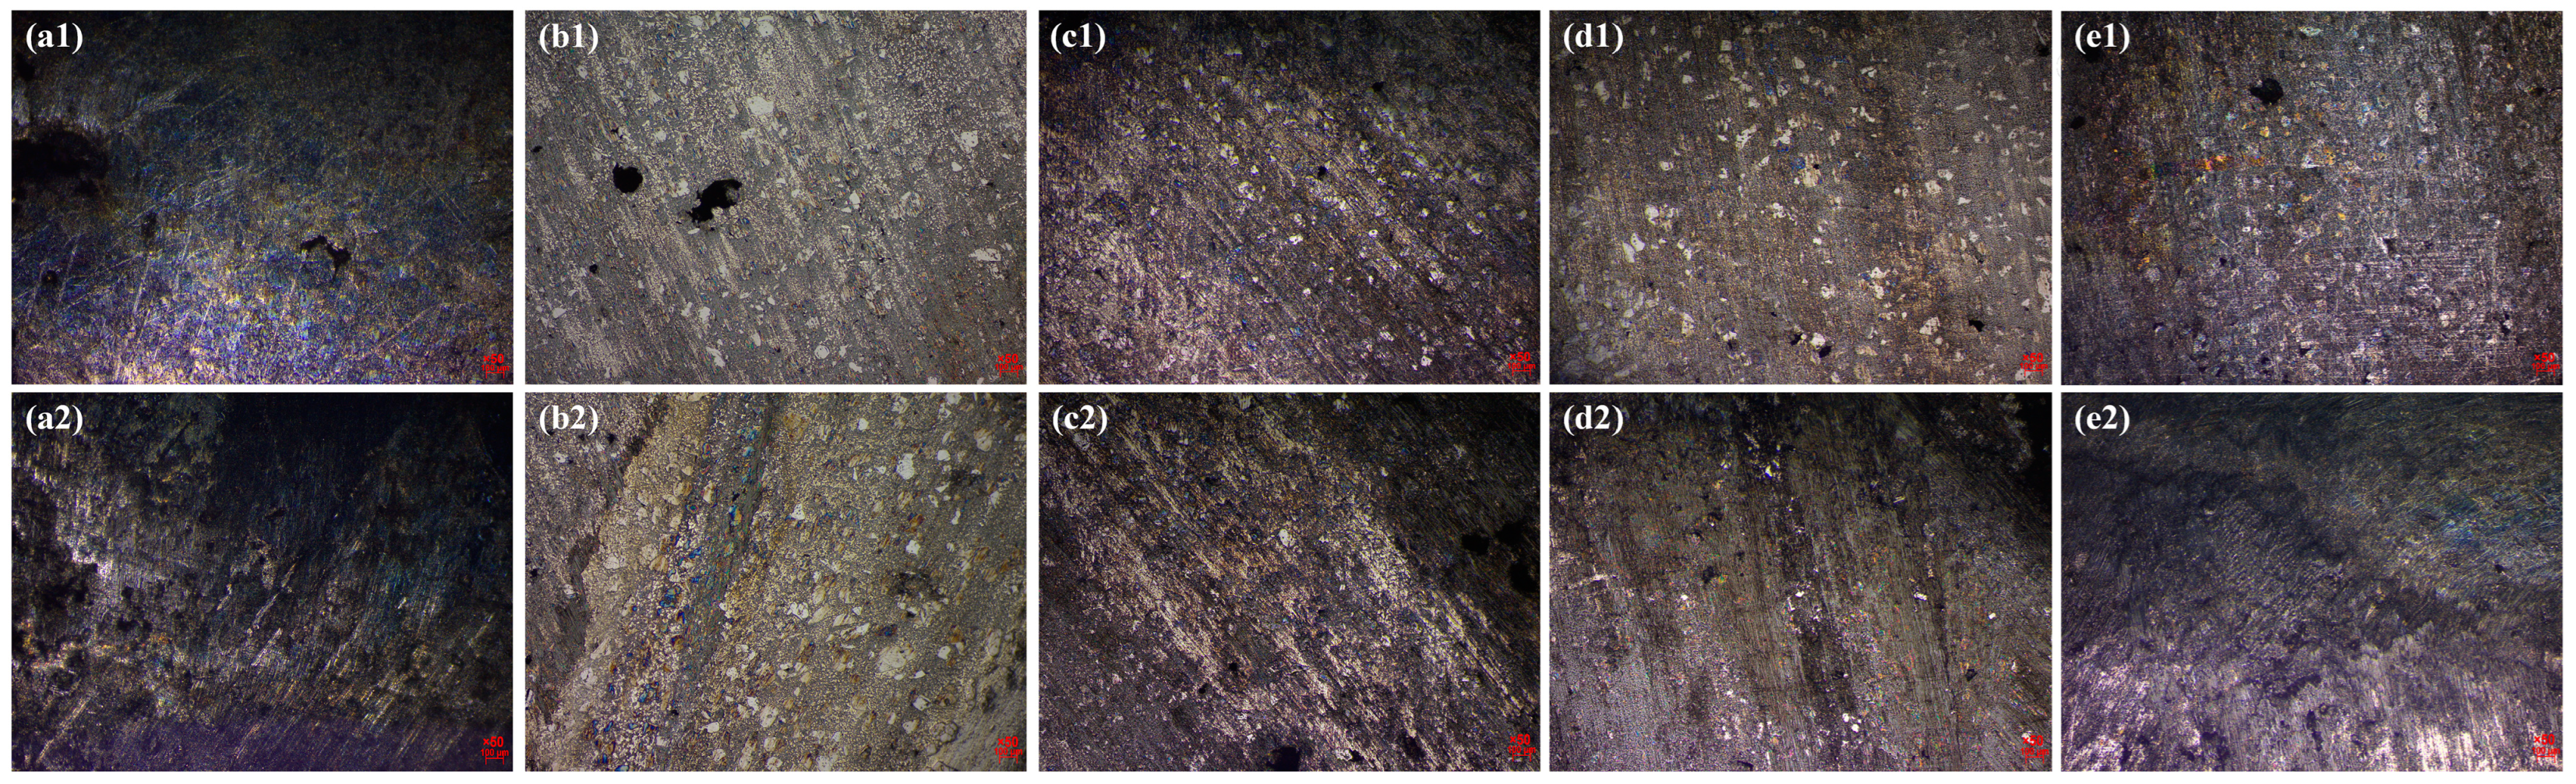
Figure 5.
50× metallographic photos of different samples (a1,a2): S0, (b1,b2): S1, (c1,c2): S2, (d1,d2): S3, (e1,e2): S4.
3.1.3. Micromorphology Analysis
Table 5 shows the theoretical element compositions of the matrix composite powder in different samples. The data in Table 5 were all based on the elemental composition data provided by the manufacturer. Taking the theoretical calculation of Fe element proportion as an example, the composite alloy powder with the same mass was taken from each sample, and the mass of each alloy powder was calculated according to the proportion of each alloy powder in different samples. Then the mass of Fe in each alloy powder was calculated according to the percentage of Fe element in each alloy powder provided by the manufacturer, and finally the calculated mass of the Fe element in each alloy powder was summed to finally obtain the percentage of Fe element in the composite powder.
Table 5.
Element composition of composite matrix powder of different samples (wt%).
Figure 5 is a metallographic image of the TiC-reinforced Fe-Ni-based cladding layer prepared with different proportions of Fe-based powder. Figure 5a1,a2 are metallographic diagrams of the S0 sample, and the S1–S4 samples are numbered in alphabetical order (bx), (cx), (dx), and (ex), and the numbering method is the same as the S0 sample. The scale and magnification of the metallographic photos of each sample are placed in the lower right corner of each picture (red font subscript). All the cladding layers can be divided into three areas: the top of the cladding layer (0–1.0 mm), the middle of the cladding layer (1.0–2.0 mm), and the fusion zone of the cladding layer (2.0–3.0 mm). It can be seen from Figure 5 that the TiC particles in all the cladding layers were concentrated in the middle and upper parts of the cladding layers, which might be due to the high density of iron and nickel (7.85 g/cm3 and 8.91 g/cm3) and the low density of TiC (4.93 g/cm3). The density difference caused the TiC particles to float in the molten pool. In addition, the jet flow formed by metal vapor and the plasma arc at the nozzle produced strong convection and stirring in the molten pool, which further led to the aggregation of TiC particles to the middle and upper part of the molten pool. As can be seen from Figure 5, with the increase in the iron powder R ratio, the number of TiC hard particles in the cladding layer gradually decreased, and the floating phenomenon was more obvious. Combined with Table 1, it can be seen that the composition of iron powder Y contained more high melting point elements, which is helpful to increase the melting point of the alloy powder system. As the iron powder R ratio increased, the alloy element content gradually decreased, and the iron element content gradually increased (see Table 5), resulting in a decrease in the overall melting point of the composite matrix powder. Under the condition of an identical heat input, the matrix powder system of sample S0 absorbed more heat, resulting in a reduction in the energy absorbed by the TiC particles and a lower melting amount of TiC. Consequently, the number of TiC particles retained within the cladding layer increased. The heat absorbed by the matrix powder system of samples S1–S4 decreased gradually, while the heat absorbed by the TiC particles progressively increased. Therefore, in samples S1–S4, the content of TiC particles decreased gradually. A bright white transition zone could be observed at the overlapping position between the bottom of the five cladding samples and the base metal, indicating that the cladding layer formed by the five powder ratios had formed a good metallurgical bond with the H13 steel base material [32,33,34]. It can also be seen from Figure 5 that the fusion line between the cladding layer and the base metal was not smooth and straight, and some parts overlapped, which might be caused by too fast heating and cooling speeds and an uneven local composition in the base metal during plasma cladding. At the same time, different degrees of pores could be observed in the cladding layers of different samples. This was because plasma cladding was rapidly heated and cooled. Gas was generated inside the molten pool due to the plasma gas flow, the generation of metal vapor, and the decomposition of internal TiC particles. The above-mentioned gas did not have time to be discharged from the molten pool under the condition of rapid cooling and solidification and was retained in the cladding layer, which eventually led to the generation of pore defects.
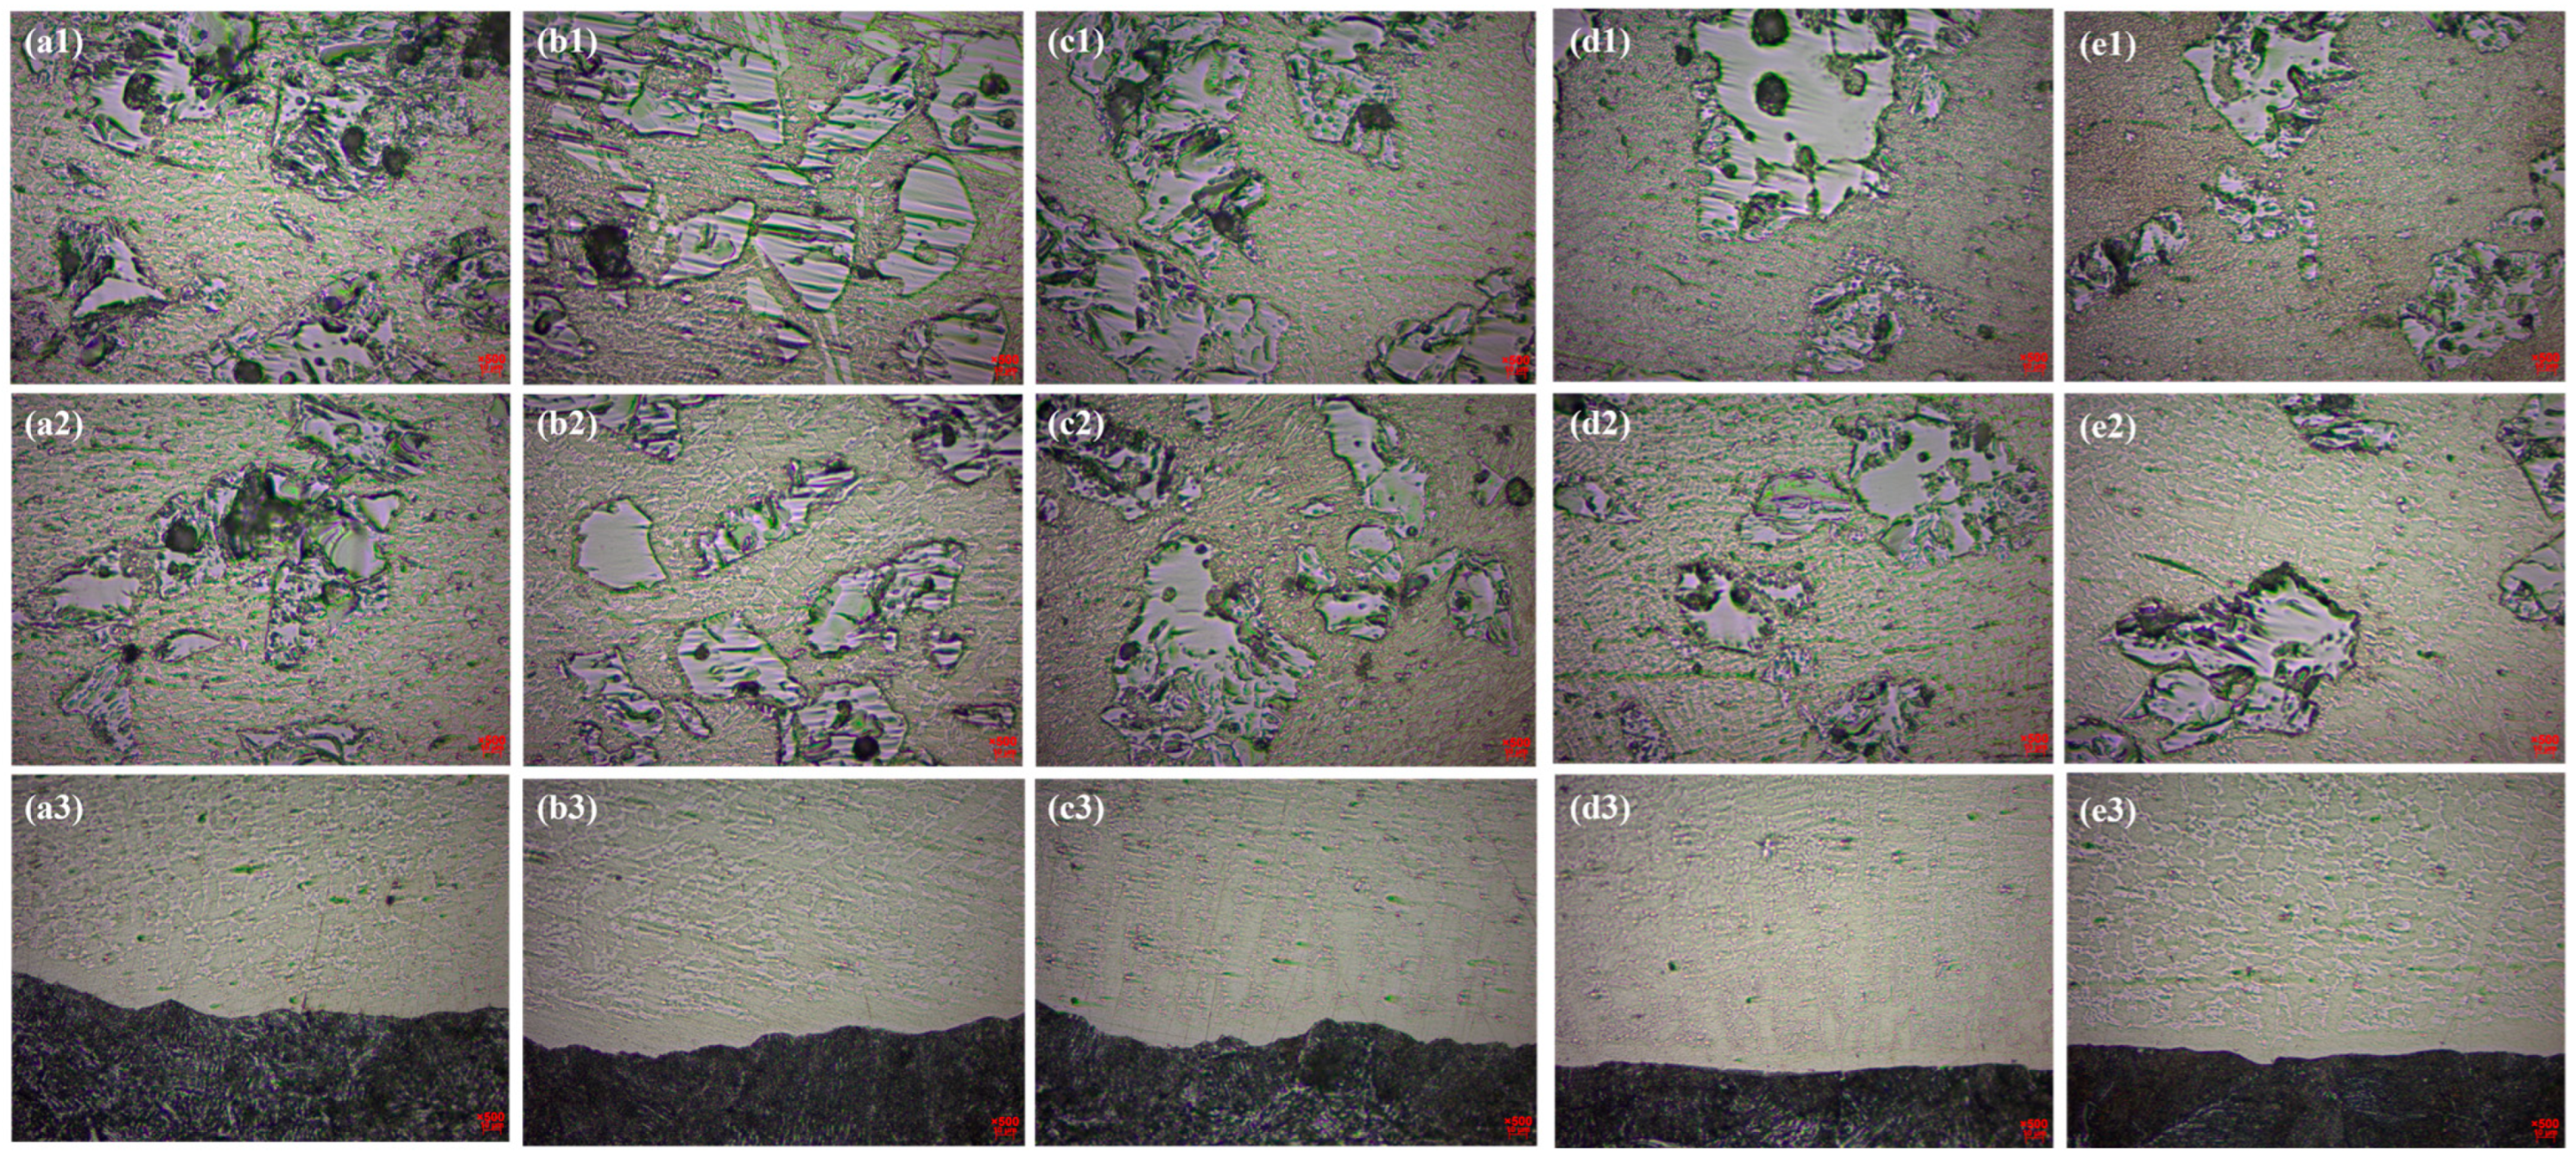
Figure 6a1–e1 show the microstructures at the top of the cladding layers of S0–S4, Figure 6a2–e2 show the microstructures at the middle of the cladding layers of S0–S4, and Figure 6a3–e3 show the microstructures at the fusion zone of the cladding layers of S0–S4, respectively. The scale and magnification of each metallographic photo are located in the lower right corner of each photo (red font subscript). It can be seen from the figure that the matrix of the cladding layer was dense, and a small amount of TiC particles were melted and mixed with the matrix, which showed that the TiC particles were well combined with the matrix. In the same sample, the microstructure of the different parts was quite different, and the microstructure was gradually refined from the bottom to the top of the cladding layer, which was consistent with the research results of Xie et al. [35]. A refined microstructure could reduce micro-defects, improve the fatigue life of materials, and maintain good mechanical properties and thermal stability at high temperatures. The complex metallurgical process of plasma cladding wear-resistant layers with rapid melting and rapid cooling led to different morphologies of its microstructure [31,36,37]. As shown in Figure 6a3–e3, the microstructure at the bottom of the fusion zone of the cladding layer was coarse and interwoven into a network structure, showing a certain growth direction. This was due to a poor heat dissipation condition at the bottom of the molten pool, resulting in low efficiency and the formation of intense cooling between the liquid metal and the large area of cold metal base material. There was a large liquid temperature gradient, which slowed down the rate of solidification and resulted in a large amount of heat absorption after the nucleation of the crystal, leading to coarse microstructure. It can be seen from Figure 6a2–e2 that with the increase in the distance from the fusion line, the heat dissipation in the middle of the cladding layer was improved. The temperature gradient was reduced, the solidification rate was increased, the nucleation rate was increased, and the grains were gradually refined. The production of interlaced microstructure morphology might be due to the convection of liquid in the middle of the cladding layer during solidification, which led to the dispersion and pulling of the solidified microstructure, resulting in the poor directionality of the solidified microstructure [38,39]. Around TiC particles, the solidified structure showed a trend of refinement and density. This was because the existence of TiC hard particles hindered the flow of the liquid phase in the molten pool, thus forming a liquid phase retention area. At the same time, TiC particles played the role of a heterogeneous nucleating agent in the solidification process, controlling the distribution of grains and the refinement of the microstructure. As can be seen from Figure 6a1–e1, the microstructure at the top of the cladding layer was finer, which was due to the existence of convection, heat conduction, and radiation. And the crystal growth rate was lower than the nucleation rate. At the same time, because TiC was mostly distributed on the top of the cladding layer, the top structure was further refined.
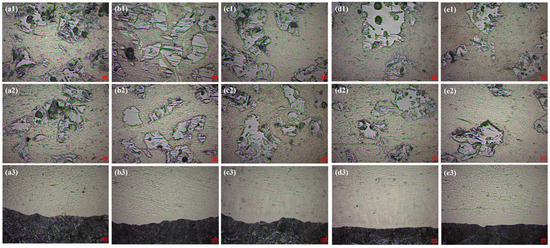
Figure 6.
500× metallographic photos of different samples (a1–a3): S0, (b1–b3): S1, (c1–c3): S2, (d1–d3): S3, (e1–e3): S4.
3.2. Mechanical Properties Analysis
3.2.1. Shear Properties Analysis
Figure 7 and Table 6 are the shear strength error bar graphs and corresponding test data of different samples. It can be seen that the shear strength of the sample S0 was the lowest, and the shear strength of S1–S4 gradually increased. This showed that the addition of iron powder R helped to improve the bonding strength between the cladding layer and the H13 steel base material. Among them, the shear strength value fluctuation of S2 was the smallest, indicating that its shear strength stability was the best and the adhesion was more reliable. S4 had the highest shear strength and relatively good adhesion stability.
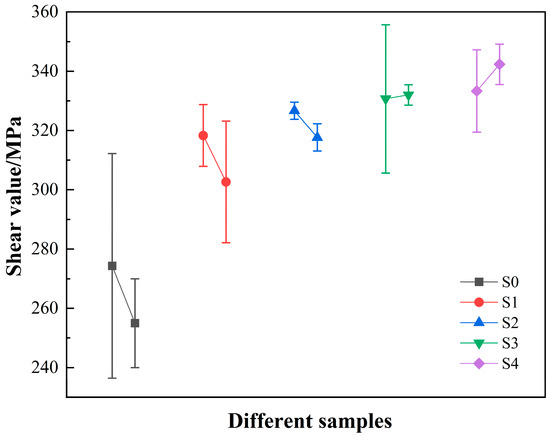
Figure 7.
Shear strength of different samples.
Table 6.
Shear strength test values of different samples (MPa).
As can be seen from Table 5, from S0 to S4, the Cr element content dropped most significantly, by 3.32%. The C and Mo element contents dropped by 0.98% and 0.87% respectively. The B and Ni element contents dropped by 0.33% and 0.17%, respectively. The Si element content dropped by 0.50%. And the O element content only dropped by 0.005%. It can be seen that changes in the percentage content of the alloy elements had a significant impact on the mechanical properties of the cladding layer. On one hand, the decrease in the contents of the alloying elements in the cladding layer and the increase in iron content enhanced the affinity between the cladding layer and the base material, leading to a better metallurgical bonding between them. The sample S0 had a higher alloy element content and a relatively lower iron content. Since the base material was H13 modified steel, when the iron content in the cladding layer was low, the compatibility between the cladding layer and the base material was poor. This resulted in a decrease in the bonding strength between the cladding layer and the base material, as well as poor adhesion. Compared with the sample S0, the alloy element content of S1–S4 decreased, and the iron content increased. Therefore, the compatibility between the cladding layer and the base material was improved. The higher the iron content, the easier it was for the cladding layer to combine with the base material, and the better the bonding effect of the cladding layer. Therefore, the shear strength of S1–S4 was better than that of S0, and the shear strength gradually increased. On the other hand, the addition of alloying elements could change the melting point of the composite matrix powder system. Under the same heat input, due to the higher content of the alloying elements in sample S0, the melting point of the matrix powder system rose. And less heat was transferred to the fusion zone, resulting in poor metallurgical bonding between the cladding layer and the base material and low shear strength. Compared with sample S0, samples S1–S4 were more compatible with the base material, and there was more heat available for the fusion zone to absorb, the melting was more complete, and it was easier to achieve the effect of metallurgical bonding.
3.2.2. Hardness Analysis
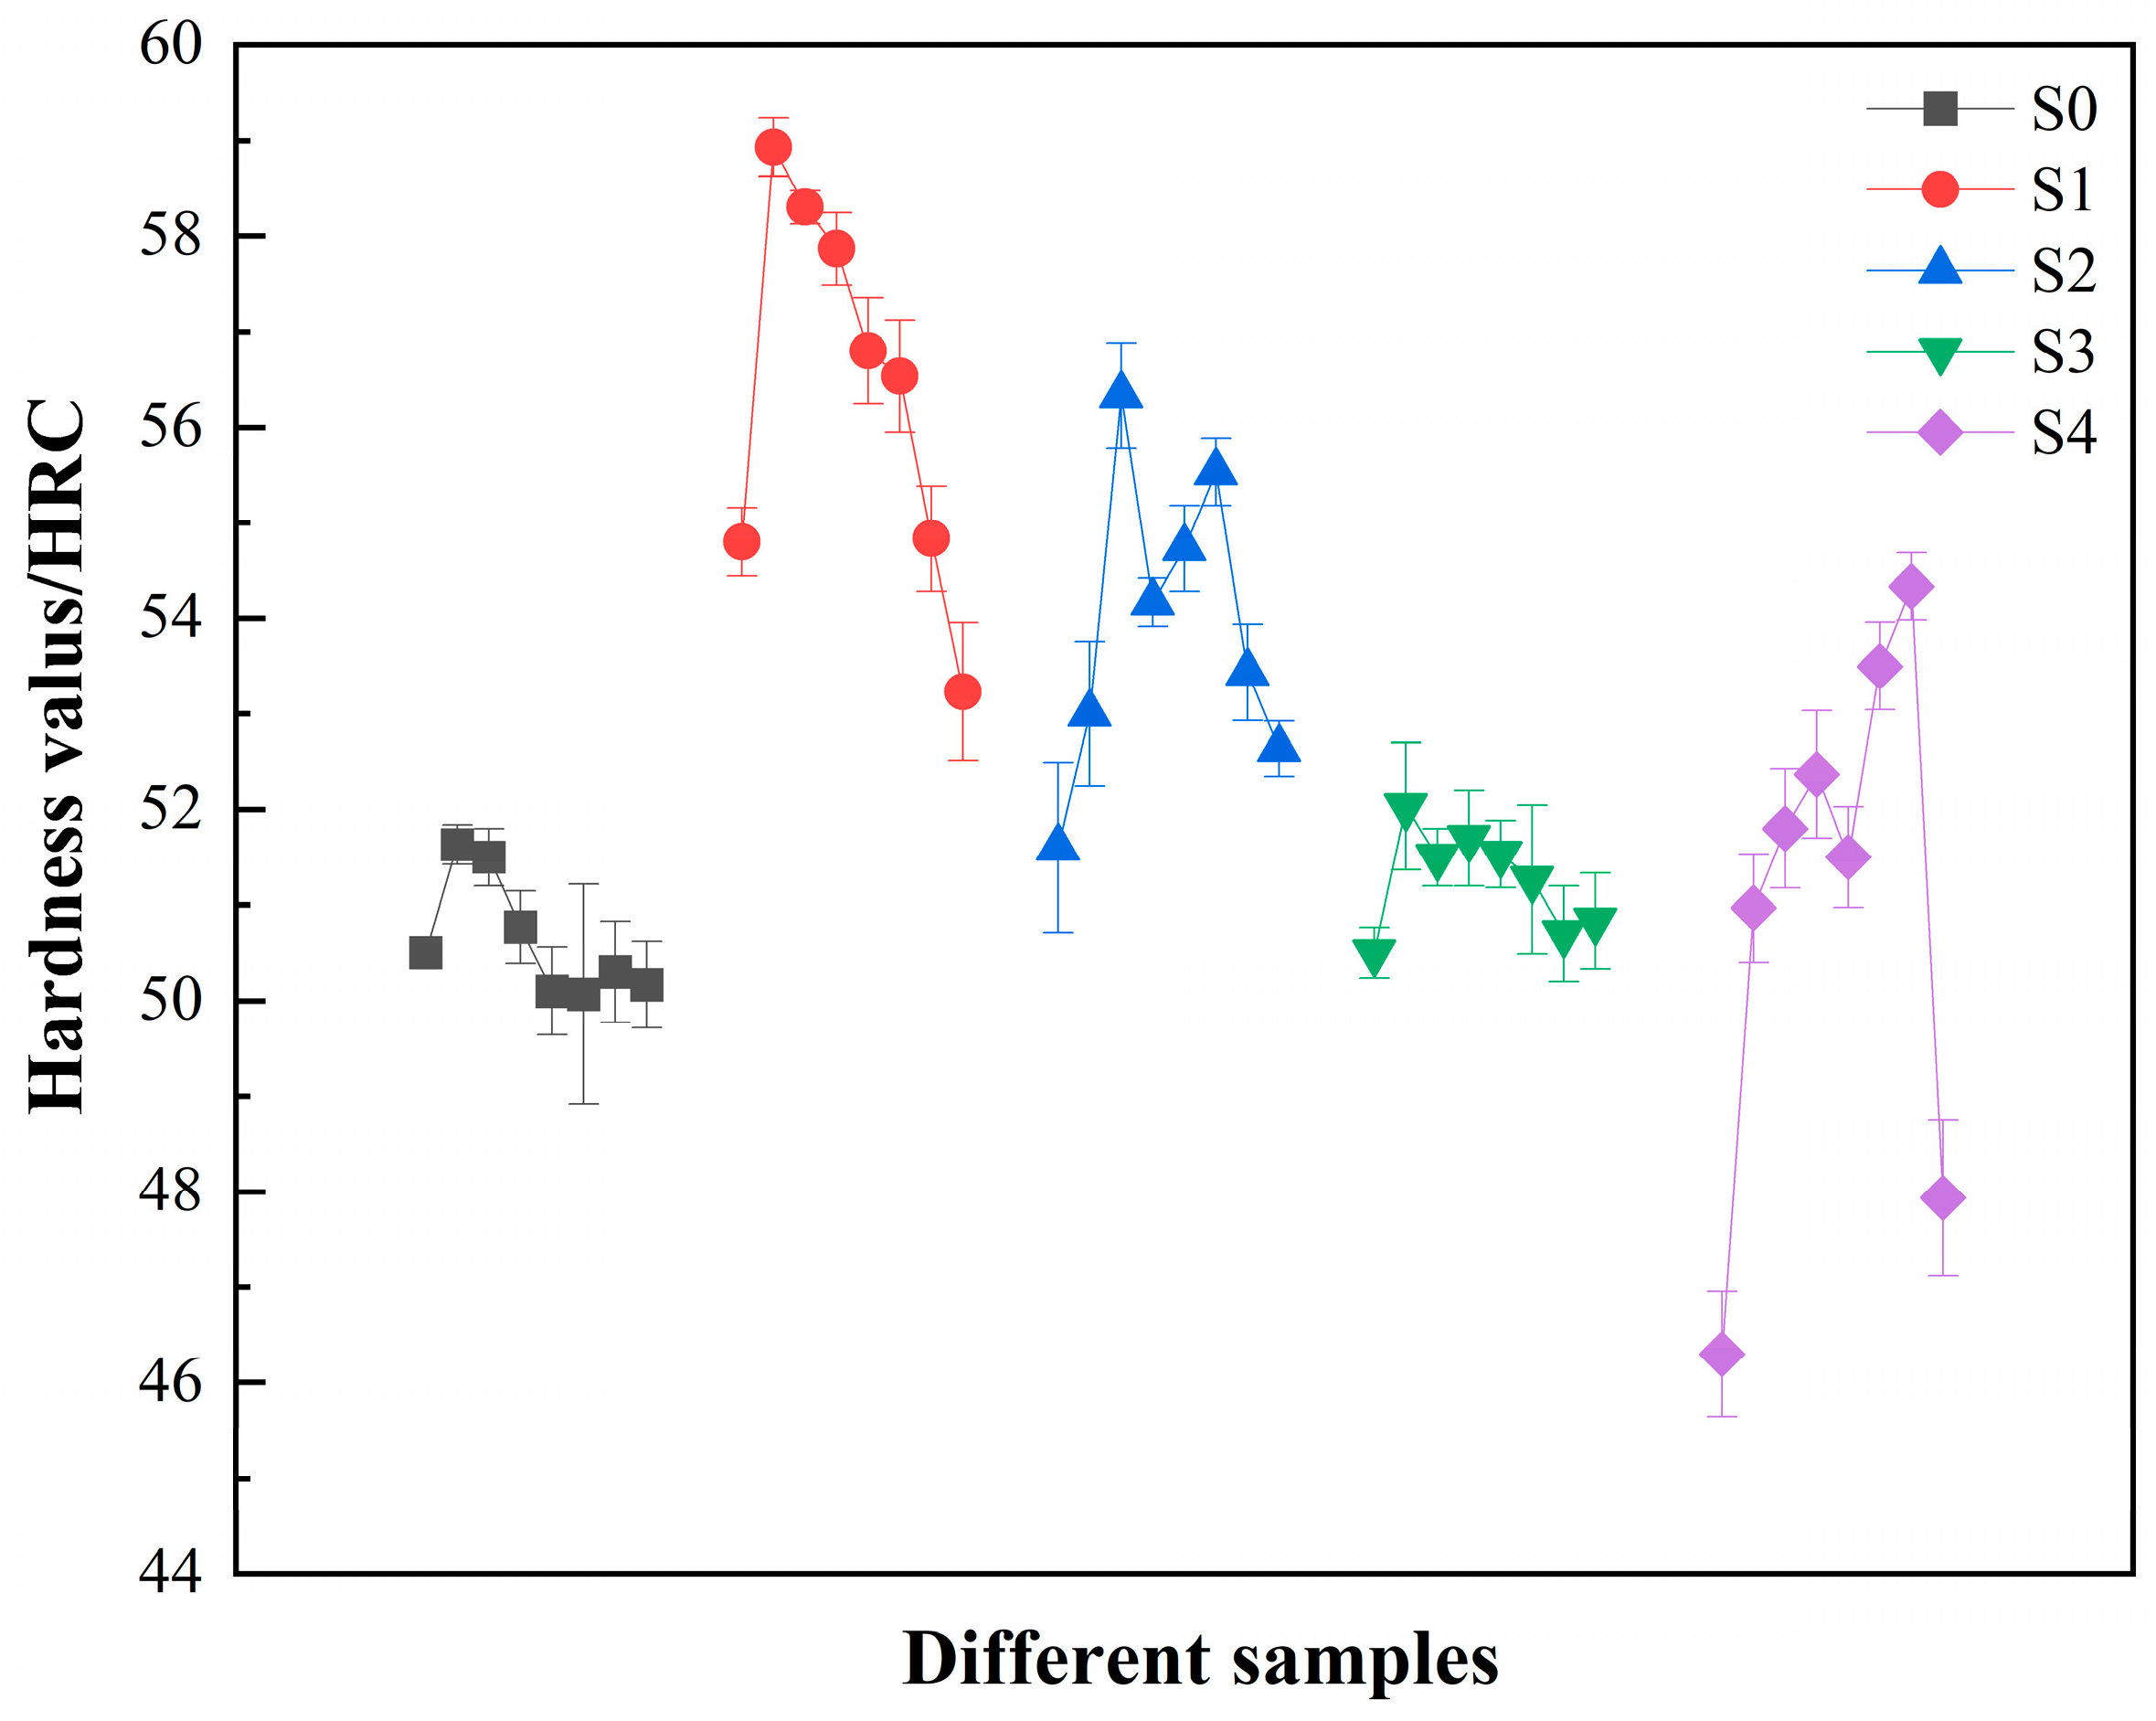
Figure 8 shows the hardness distribution trend of different samples, and Table 7 shows the corresponding test data. The microhardness of different samples showed non-monotonic changes along the depth direction, which was mainly caused by the uneven structure of the cladding layer [34]. The hardness of sample S0 ranged from 49.7 to 51.8 HRC, with an average of 50.6 HRC. With the increase in the proportion of iron powder R, the hardness ranges of samples S1 to S4 were 52.4 to 59 HRC, 50.9 to 56.9 HRC, 50.2 to 52.8 HRC, and 45.7 to 54.7 HRC, respectively, with average values of 56.4 HRC, 53.9 HRC, 51.3 HRC, and 51.1 HRC, respectively. From the hardness distribution of each sample, it could be seen that sample S0 had the lowest average hardness. And the average hardness of samples S1–S4 gradually decreased but was always higher than that of sample S0. It could be seen that the addition of iron powder R could improve the hardness of the cladding layer. The hardness of the surface and bottom of each sample was lower than that of the rest of each sample. The main reasons were as follows: ① Under the direct action of the high-temperature plasma arc, the surface structure of the cladding layer was seriously burned. Combined with Figure 5, it could be seen that there were discontinuous pore defects in the surface structure of the cladding layer, resulting in the relatively poor denseness of this part. Therefore, the hardness of the surface layer of each sample was relatively low. ② Elemental diffusion occurred between the bottom of the cladding layer and the base material. The softer base material diluted the bottom of the cladding layer, resulting in relatively lower hardness at the bottom of cladding layer. Combined with Figure 5, based on the reason that the amount of TiC particles decreased with the increase in the iron powder R ratio. The more TiC particles were retained in the microstructure, the less TiC was dissolved, the fewer alloy elements were dissolved in the matrix, and the more the solid solution strengthening was weakened. When iron powder R was added, the contents of samples’ S1–S4 iron element increased. The melting point of the matrix powder decreased, the amount of TiC particles melted increased, and the solid solution strengthening effect of the alloying elements was significant. Therefore, sample S0 had the lowest hardness, and the hardness of samples S1–S4 was improved to varying degrees. It can be seen from Table 5 that in the matrix powder of sample S0, alloy elements account for the highest proportion. And the alloy element content of sample S1 was relatively low. Under the convection of the molten pool, the aggregation of alloy elements was not obvious, but its low melting point characteristic led to the better dispersion of alloy elements, which played a better dispersion strengthening role. As the proportion of iron powder R increased, the alloying element content of samples S2–S4 continued to decrease. And the solid solution strengthening and dispersion strengthening effects weakened. Therefore, the hardness of samples S2–S4 gradually decreased, but they were all higher than sample S0. In the hardness distribution data of each sample, it could be seen that the hardness values of some points were higher. This might be because when measuring the hardness, the unmelted TiC hard particles or the surrounding areas were hit, resulting in an increase in the hardness of some points [7].
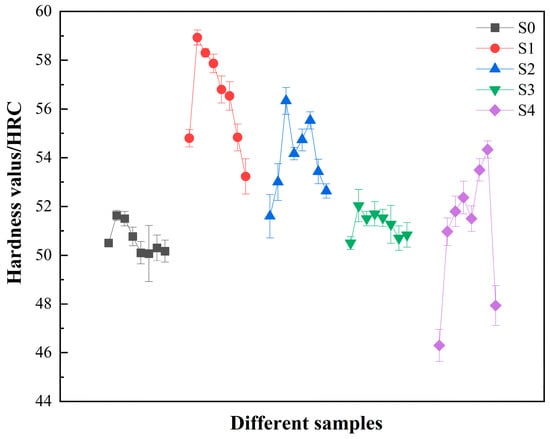
Figure 8.
Hardness values and corresponding standard deviations of different samples.
Table 7.
Hardness test data of different samples (HRC).
3.2.3. Friction and Wear Performance Analysis
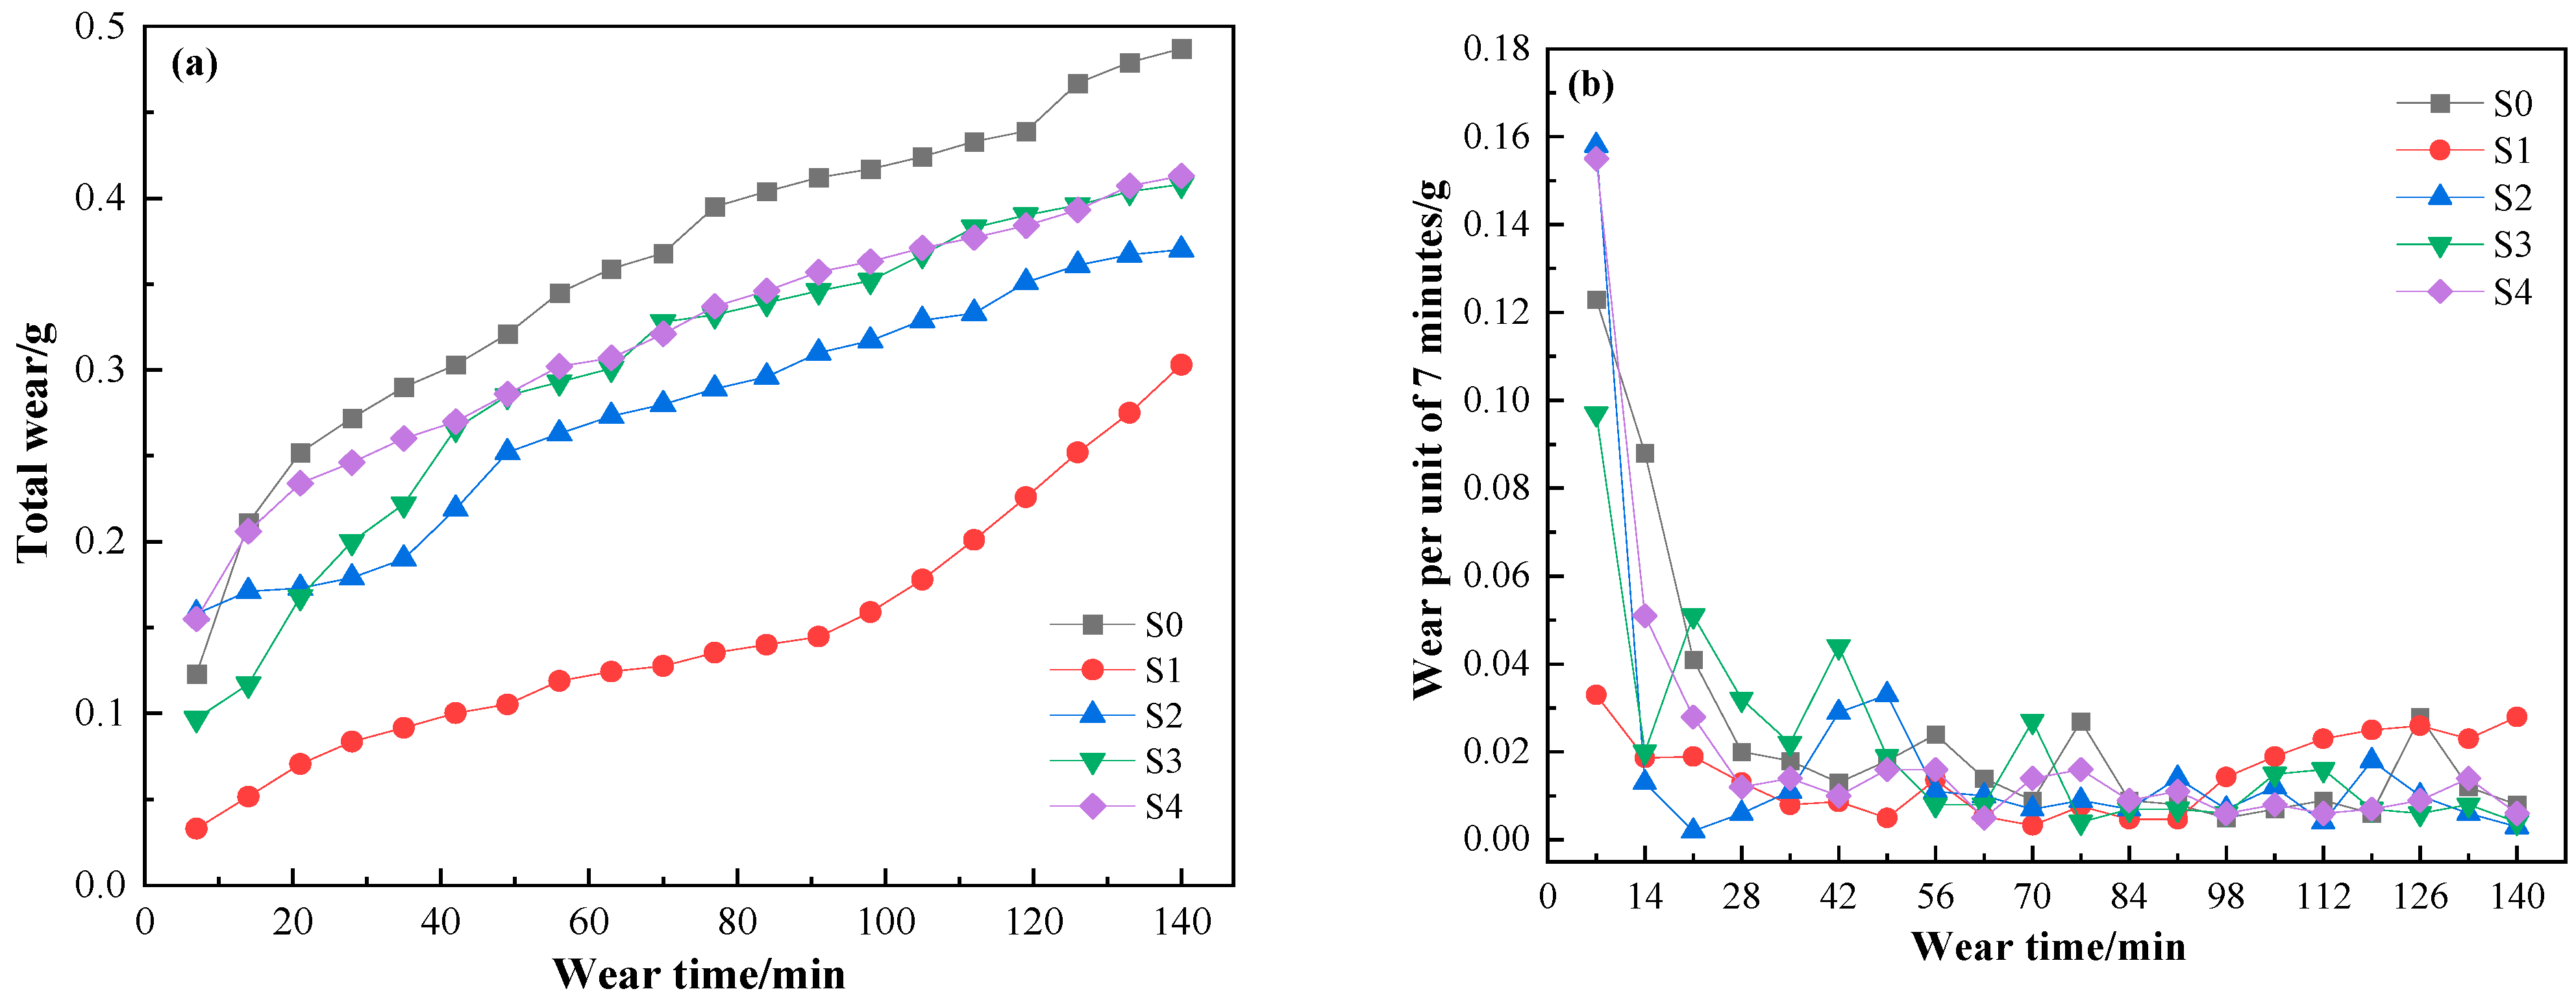
Figure 9a shows the cumulative wear of different samples under the 140 min abrasive belt cycle dry friction wear test condition. As shown in Figure 9a, sample S0 had the largest cumulative wear and sample S1 had the smallest cumulative wear. With the increase in the iron powder R ratio, the cumulative wear of the cladding layer gradually increased but was lower than sample S0. The order of cumulative wear was S0 > S4 > S3 > S2 > S1. Combined with Figure 6 and the hardness analysis, it can be seen that the crushing phenomenon of the TiC particles in the sample S0 matrix was more obvious, resulting in poor stability during friction and wear. At the same time, the average hardness of sample S0 was the lowest. During the friction and wear process, the matrix had a poor support and fixation effect on the TiC particles. The role of TiC particles as a wear-resistant skeleton was weakened, and the wear resistance of the cladding layer was reduced [18]. At the same time, the broken and detached TiC hard particles participate in the friction and wear process as a new friction pair, forming three-body wear, which aggravated the wear of the cladding layer. On the other hand, due to the high content of alloy elements and the existence of element segregation, although the hardness of the formed alloy reinforcement phase was high, it was brittle. When the cladding layer was subjected to wear impact, the hard particles would break and fall off due to the insufficient support and fixation effect of the matrix on the reinforcement phase, further aggravating the wear of the cladding layer [40]. Therefore, sample S0 had the largest cumulative wear and poor wear resistance. Compared with sample S0, the hardness of samples S1–S4 were improved to varying degrees, and sample S1 had the largest hardness improvement, the lowest cumulative wear, and the best wear resistance. This was because the hardness of the matrix of the sample S1 was high, which determined its superior strength to a certain extent. At the same time, the TiC particles were more complete and had better stability, and the matrix fixed the TiC better. When the cladding layer was subjected to external forces and impacts, the TiC particles remained securely embedded within the cladding layer matrix, demonstrating exceptional adhesion. This ensured the integrity of the structure, allowing the wear-resistant skeleton to function optimally. Therefore, the cumulative wear of sample S1 was reduced, and the wear resistance was greatly improved. The wear resistance of samples S2–S4 gradually decreased due to the gradual deterioration of the integrity of TiC particles and the decrease in the number of particles
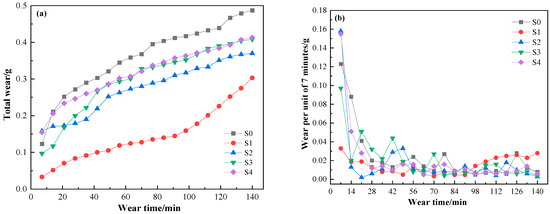
Figure 9.
Cumulative wear and unit wear of different samples (a) Cumulative wear and (b) Unit wear.
Figure 9b is a trend chart of the wear loss per unit time of the different samples. The wear loss per unit time of the different samples was large in the early stage of wear. This was because the surface structure of the cladding layer was burned under the direct action of the plasma arc, and the TiC particles would leave pore defects after ablation (see Figure 5). At the same time, the gas that could not be exhausted in time during the cooling process of the molten pool would increase the number of pores, resulting in poor wear resistance of the cladding layer surface and large unit wear. As the friction and wear proceeded, the sand belt gradually contacted the middle and upper part of the cladding layer containing more TiC. Under the wear-resistant skeleton of the TiC particles and the support of the softer matrix to the TiC particles, the unit wear loss decreased. In the later stages of the friction and wear tests, the unit wear of different samples showed a sharp increase. This might be because some TiC particles fell off the matrix to form debris, which was added to the wear process as new abrasive particles. The harder debris slid back and forth between the cladding layer and the abrasive belt, scratching the cladding layer, forming three-body abrasive wear, and aggravating the wear of the cladding layer. At the same time, when the TiC hard particles fell off the matrix, the relatively soft matrix was exposed to the friction environment, which further caused the increase in unit wear.
Figure 10 shows the wear morphology of the different samples. The letter numbers (ax)–(ex) are the wear morphology of samples S0–S4, respectively, and the scale and magnification of each photo are located in the lower right corner (red font subscript). It can be clearly seen from Figure 10a1,a2 that there were serious peeling and delamination phenomena on the worn surface of sample S0. Grooves and scratches of different depths and widths were distributed on the matrix surface. And the plastic deformation was serious, indicating that the cladding layer had been subjected to severe adhesive wear and abrasive wear. Figure 10b1,b2 show the wear surface morphology of sample S1. It can be seen that there were slight furrows and scratches in the cladding layer, as well as some small peeling and abrasive debris. This indicated that sample S1, like sample S0, had also experienced adhesive and abrasive wear, with a relatively low degree of wear, indicating better wear resistance than sample S0. The results were the same as the cumulative wear analysis. From Figure 10c1–e1,c2–e2, it can be seen that samples S2, S3, and S4 also underwent adhesive wear and abrasive wear, with different degrees of wear. The overall wear morphology showed a trend consistent with the wear resistance. In summary, the wear forms of samples S0–S4 were adhesive wear and abrasive wear. It can be seen from Figure 10a1–e1 that the wear scratches were relatively shallow in the area with more TiC particles. This was because the TiC particles fully played the role of a wear-resistant skeleton under the support of the softer matrix, stopping the soft matrix from being exposed to the wear environment and improving the wear resistance. In addition, when the cladding layer produced a plowing effect due to wear, the addition of TiC particles improved the hardness and wear resistance of the overall cladding layer, thereby reducing the degree of wear and hindering the development of scratches. Therefore, the presence of TiC particles slowed down the formation of scratches and the expansion of cracks. In summary, the wear morphology of different samples further verified the advantages and disadvantages of wear resistance, which was consistent with the results of cumulative wear analysis.
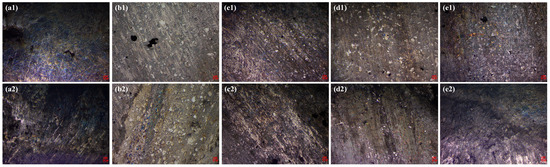
Figure 10.
Metallographic photos of worn surfaces of different samples: (a1,a2)—S0, (b1,b2)—S1, (c1,c2)—S2, (d1,d2)—S3, (e1,e2)—S4.
Figure 11 shows the 3D wear profile scans of different samples. Figure 11a–e are 3D profiles of the wear surface obtained by the standard filtering method. Combining the friction and wear analysis of different samples, it can be seen that sample S0 had the worst wear resistance. Due to the poor stability of TiC particles in sample S0, during the friction wear process, a large number of TiC particles detached from the matrix. After the friction wear ended, the wear surface was relatively smooth with a smaller height difference. Sample S1 had the best wear resistance. After experiencing the friction and wear process, there were still many TiC hard particles on the wear surface, which played the role of a wear-resistant skeleton. Combined with the adhesive wear and abrasive wear mechanism of sample S1, the height difference of the wear surface of sample S1 was the largest. The TiC content in the cladding layer of samples S2–S4 gradually decreased, and the wear resistance gradually decreased. After the friction and wear process, as the wear resistance of the cladding layer gradually decreased, the height difference of the worn surface gradually decreased but it was higher than that of the sample S0. In summary, combined with the height difference scale on the right side of the 3D wear profile diagram of each sample in Figure 11 and the analysis of the above wear resistance, it can be seen that sample S1 had the best wear resistance and sample S0 had the worst wear resistance.
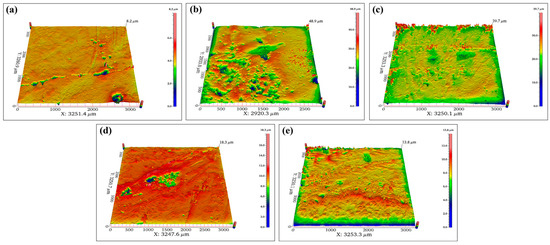
Figure 11.
Three-dimensional profiles of worn surfaces of different samples (a) S0, (b) S1, (c) S2, (d) S3, and (e) S4.
Table 8 shows the gain percentage of the average values of mechanical properties of samples S1–S4 relative to sample S0. The average values of the mechanical properties of sample S0 were a longitudinal shear strength of 274 Mpa, a transverse shear strength of 255 Mpa, an average hardness of 50.6 HRC, and a cumulative wear loss of 0.487 g, respectively. The data in the table were the percentage gain obtained by taking the average mechanical properties of each sample minus the difference of the corresponding values of sample S0 as the numerator and the average mechanical properties of sample S0 as the denominator.
Table 8.
Average gain percentage of comprehensive performance of each sample (%, relative to S0 sample).
From the calculation results and microscopic analysis in Table 8, it can be seen that sample S2 had a large amount of TiC particles, while ensuring high hardness and shear strength, good adhesion between the cladding layer and the base material, and good strength and toughness. Friction and wear analysis also showed that its wear resistance was greatly improved compared with unmodified samples. Therefore, the sample S2 composite matrix powder system had a better gain effect on TiC-reinforced Fe-Ni coating, and its composite powder composition was the best modification ratio in this study, which provided a certain reliability reference for the research of plasma cladding ceramic phase-reinforced composite metal matrix.
4. Conclusions
This work mainly discusses the influence of different composite matrix powder compositions on plasma cladding TiC-reinforced Fe-Ni-based cladding layers. The main conclusions are as follows:
- (1)
- The samples prepared with different proportions of iron powder Y and iron powder R are mainly composed of TiC, FeO, Fe, FeNi, and CrNi, and the phase composition does not change. The microstructure shows a gradual refinement from the bottom to the top of the cladding layer, and TiC particles are distributed in the middle and upper parts of the cladding layer. There is a phenomenon of local element aggregation in different samples. EDS point scanning shows that FeNi and CrNi solid solutions are formed in the cladding layer. At the same time, due to the presence of pore defects on the surface of the cladding layer, some oxygen in the environment will enter the molten pool. The low local oxygen concentration in the high-temperature molten pool will promote the formation of FeO.
- (2)
- The shear strength and hardness of the modified samples are better than those of the sample without iron powder R added. With the increase in the ratio of iron powder R, the bonding strength between the cladding layer and the base metal increases, and the hardness of the wear-resistant layer shows an opposite trend, but it is better than that of the unmodified samples. Sample S2 has both high shear strength and high hardness. Compared with the unmodified samples, the longitudinal shear strength is increased by about 19.34%, the transverse shear strength is increased by 24.71%, and the hardness is increased by 2.41%~9.85%, which achieves the best strength–toughness matching in this study. The wear resistance of the different samples is positively correlated with hardness, and the wear of the matrix increases after TiC particles fall off.
- (3)
- The wear forms of all the samples are abrasive wear and adhesive wear. The wear-resistant skeleton function of TiC in sample S0 is insufficient, and the relative height difference of the wear surface is the smallest, and the wear resistance is the worst. Sample S1 has the best adhesion with TiC. After wear, there are more TiC particles, and the relative height difference of the worn surface is the largest, showing excellent wear resistance. Compared with sample S0, the wear resistance is greatly improved by about 37.78%. Compared with the S0 sample, the wear resistance of sample S2 is improved by about 24.02%, which ensures better wear resistance. Combined with its strength and toughness, sample S2 is the best test sample in this study.
Author Contributions
Conceptualization, K.D., L.X. and X.L. (Xiantao Li); methodology, K.D. and P.W.; software, K.D., P.W. and X.L. (Xiantao Li); validation, L.X. and X.L. (Xuexian Li); formal analysis, K.D. and P.W.; investigation, P.W. and W.F.; resources, L.X. and Z.W.; data curation, K.D. and L.X.; writing—original draft preparation, K.D.; writing—review and editing, X.L. (Xiantao Li); visualization, K.D. and P.W.; supervision, L.X., Z.W. and W.F.; project administration, L.X. and X.L. (Xuexian Li); funding acquisition, Z.W. and X.L. (Xuexian Li). All authors have read and agreed to the published version of the manuscript.
Funding
This research was funded by the Liaocheng University Latitudinal Projects under Grant No. K23LD60 and No. K21LD33.
Institutional Review Board Statement
Not applicable.
Informed Consent Statement
Not applicable.
Data Availability Statement
Data are contained within the article.
Conflicts of Interest
Author Lipeng Xu was employed by the company Shandong EAST Engineering Tools Limited Liability Company. The remaining authors declare that the research was conducted in the absence of any commercial or financial relationships that could be construed as a potential conflict of interest.
References
- Wang, H.; Sun, R.; Zhang, M.; Gou, B.; Mo, J. Impact-sliding behavior of Ni-based coating prepared on tunnel boring machine disc cutter material produced using a plasma transferred arc welding process. Surf. Coat. Technol. 2022, 442, 128186. [Google Scholar] [CrossRef]
- Qi, X.; Li, Y.; Li, F.; Du, J.; Li, C.; Wang, K.; Lu, H.; Yang, B. Improving the properties of remanufactured wear parts of shield tunneling machines by novel Fe-based composite coatings. Ceram. Int. 2022, 48, 6722–6733. [Google Scholar] [CrossRef]
- Zhang, M.; Qu, K.L.; Luo, S.X.; Liu, S.S. Effect of Cr on the microstructure and properties of TiC-TiB2 particles reinforced Fe-based composite coatings. Surf. Coat. Technol. 2017, 316, 131–137. [Google Scholar] [CrossRef]
- Zhang, Z.; Wang, X.; Zhang, Q.; Liang, Y.; Ren, L.; Li, X. Fabrication of Fe-based composite coatings reinforced by TiC particles and its microstructure and wear resistance of 40Cr gear steel by low energy pulsed laser cladding. Opt. Laser Technol. 2019, 119, 105622. [Google Scholar] [CrossRef]
- Lv, J.; Gong, J.; Liang, C.; Zhang, Z.; Zhang, R.; Liu, J. Microstructure and Hardness of Fe-Based Alloy Coating Reinforced with WC on Q235 Steel Surface by Plasma Cladding. Mater. Mech. Eng. 2010, 34, 31–33. [Google Scholar]
- Xu, F.; Lv, Y.; Liu, Y.; Shu, F.; He, P.; Xu, B. Microstructural Evolution and Mechanical Properties of Inconel 625 Alloy during Pulsed Plasma Arc Deposition Process. J. Mater. Sci. Technol. 2013, 29, 480–488. [Google Scholar] [CrossRef]
- Liu, T.; Chang, M.; Cheng, X.; Zeng, X.; Shao, H.; Liu, F. Characteristics of WC reinforced Ni-based alloy coatings prepared by PTA + PMI method. Surf. Coat. Technol. 2020, 383, 125232. [Google Scholar] [CrossRef]
- Zhou, Y.; Zhang, J.; Xing, Z.; Wang, H.; Lv, Z. Microstructure and properties of NiCrBSi coating by plasma cladding on gray cast iron. Surf. Coat. Technol. 2019, 361, 270–279. [Google Scholar] [CrossRef]
- Arias-González, F.; Del Val, J.; Comesaña, R.; Penide, J.; Lusquiños, F.; Quintero, F.; Riveiro, A.; Boutinguiza, M.; Pou, J. Fiber laser cladding of nickel-based alloy on cast iron. Appl. Surf. Sci. 2015, 374, 197–205. [Google Scholar] [CrossRef]
- Wang, S.; Li, H.; Chen, X.; Chi, J.; Li, M.; Chai, L.; Xu, H. Improving microstructure and wear resistance of plasma clad Fe-based alloy coating by a mechanical vibration technique during cladding. Mater. Sci. Eng. A 2010, 528, 397–401. [Google Scholar] [CrossRef]
- Yue, J.; Liu, X.; Sui, Y.; Liu, C.; Sun, X.; Chen, W. Combined effect of Y2O3 nanoparticles and Si second-phase oxide on microstructure and wear resistance of plasma-clad steel coating. Surf. Coat. Technol. 2020, 403, 126348. [Google Scholar] [CrossRef]
- Lyu, Y.; Sun, Y.; Jing, F. On the microstructure and wear resistance of Fe- based composite Coatings Processed by plasma cladding with B4C injection. Ceram. Int. 2015, 41, 10934–10939. [Google Scholar] [CrossRef]
- Xia, J.; Feng, Y.; Ling, Z.; Wang, K. Influence of WC particle content of Fe-based powder-cored wire on microstructure and properties of plasma cladding reinforced layers. J. Alloys Compd. 2022, 922, 166148. [Google Scholar] [CrossRef]
- Xu, J.S.; Zhang, X.C.; Xuan, F.Z.; Wang, Z.; Tu, S. Rolling contact fatigue behavior of laser cladded WC/Ni composite coating. Surf. Coat. Technol. 2014, 239, 7–15. [Google Scholar] [CrossRef]
- Xie, Z. Preparation and Properties of Plasma Cladding WC Strengthening Co-Based Alloy on Copper Surface. Master’s thesis, Shanghai University, Shanghai, China, 2021. [Google Scholar]
- Zhang, H.; Zou, Y.; Zou, Z.; Wu, D. Microstructure and properties of Fe-based composite coating by laser cladding Fe–Ti–V–Cr–C–CeO2 powder. Opt. Laser Technol. 2015, 65, 119–125. [Google Scholar] [CrossRef]
- Yang, L.; Yu, T.; Li, M.; Zhao, Y.; Sun, J. Microstructure and Wear Resistance of In-situ synthesized Ti(C, N) Ceramic Reinforced Fe-based Coating by Laser Cladding. Ceram. Int. 2018, 44, 22538–22548. [Google Scholar] [CrossRef]
- Chen, L.; Yu, T.; Guan, C.; Zhao, Y. Microstructure and properties of metal parts remanufactured by laser cladding TiC and TiB2 reinforced Fe-based coatings. Ceram. Int. 2022, 48, 14127–14140. [Google Scholar] [CrossRef]
- Li, X.; Lai, Y.; Yang, B.; Wang, D.; Sun, M.; Wu, H.; Fan, R.; Sun, S.; Yu, J. Process Optimization and Properties of Fe-Cr-C Alloy Coating Prepared by Plasma Cladding. Surf. Technol. 2020, 49, 177–184. [Google Scholar]
- Zeng, X.; Wang, Q.; Chen, C.; Lian, G.; Huang, X. Effects of WC addition on the morphology, microstructure and mechanical roperties of Fe50/TiC/WC laser claddings on AISI 1045 steel. Surf. Coat. Technol. 2021, 427, 127781. [Google Scholar] [CrossRef]
- Shan, M.; Zhang, C.; Wang, N.; Zhang, L.; Li, W.; Yin, X. Improvement in wear resistance of laser-clad Fe–Cr–Mo–B–C-(TiC) amorphous-nanocrystalline coating. Vacuum 2023, 207, 111676. [Google Scholar] [CrossRef]
- Emamian, A.; Corbin, S.F.; Khajepour, A. Effect of laser cladding process parameters on clad quality and in-situ formed microstructure of Fe–TiC composite coatings. Surf. Coat. Technol. 2010, 205, 2007–2015. [Google Scholar] [CrossRef]
- Feng, Z.; Tang, M.; Liu, Y.; Yan, Z.; Li, G.; Zhang, R. In situ synthesis of TiC-TiN-reinforced Fe-base plasma cladding coatings. Surf. Eng. 2018, 34, 309–315. [Google Scholar] [CrossRef]
- Tang, M.; Wang, W.; Li, G.; Feng, Z.; Yan, Z.; Zhang, N.; Zhang, R. Electrochemical Corrosion Behaviors of TiC Particles Reinforced Fe-based Composite Plasma Cladding Layers. Int. J. Electrochem. Sci. 2019, 14, 1591–1600. [Google Scholar] [CrossRef]
- Sharifitabar, M.; Khaki, J.V.; Sabzevar, M.H. Microstructure and wear resistance of in-situ TiC–Al2O3 particles reinforced Fe-based coatings produced by gas tungsten arc cladding. Surf. Coat. Technol. 2016, 285, 47–56. [Google Scholar] [CrossRef]
- Chen, D.; Liu, D.; Liu, Y.; Wang, H.; Huang, Z. Microstructure and fretting wear resistance of γ/TiC composite coating in situ fabricated by plasma transferred arc cladding. Surf. Coat. Technol. 2014, 239, 28–33. [Google Scholar] [CrossRef]
- Liu, J.; Wang, L. Wear Resistance of Fe-Cr-C-TiFe Fe-based Composite Coating Prepared by Precursor Carbonization-composition Process and Plasma Cladding. Mater. Sci. Forum 2012, 704–705, 1237–1243. [Google Scholar] [CrossRef]
- Panteleenko, F.I.; Sarantsev, V.V.; Stolin, A.M.; Bazhin, P.M.; Azarenko, E.L. Formation of Composite Coatings Based on Titanium Carbide via Electrospark Alloying. Surf. Eng. Appl. Electrochem. 2011, 47, 328–337. [Google Scholar] [CrossRef]
- Hui, Z.; Yong, Z.; Zou, Z.; Shi, C. Effects of CeO2 on microstructure and corrosion resistance of TiC-VC reinforced Fe-based laser cladding layers. J. Rare Earths 2014, 32, 1095. [Google Scholar]
- Zhang, H.; Chong, K.; Zhao, W.; Sun, Z. Effects of pulse parameters on in-situ Ti-V carbides size and properties of Fe-based laser cladding layers. Surf. Coat. Technol. 2018, 344, 163–169. [Google Scholar] [CrossRef]
- Zhu, Z.; Li, J.; Peng, Y.; Shen, G. In-situ synthesized novel eyeball-like Al2O3/TiC composite ceramics reinforced Fe-based alloy coating produced by laser cladding. Surf. Coat. Technol. 2020, 391, 125671. [Google Scholar] [CrossRef]
- Wang, X.; Pan, X.; Du, B.; Li, S. Production of in situ TiB2 +TiC/Fe composite coating from precursor containing B4C-TiO2-Al powders by laser cladding. Trans. Nonferrous Met. Soc. China 2013, 23, 1689–1693. [Google Scholar] [CrossRef]
- Zhang, H.; Zou, Y.; Zou, Z.; Shi, C. Effects of chromium addition on microstructure and properties of TiC–VC reinforced Fe-based laser cladding coatings. J. Alloys Compd. 2014, 614, 107–112. [Google Scholar] [CrossRef]
- Jiang, S.; Wang, G.; Ren, Q.; Yang, C.; Wang, Z.; Zhou, Z. In situ synthesis of Fe-based alloy clad coatings containing TiB2 –TiN–(h-BN). International Journal of Minerals. Metall. Mater. 2015, 22, 613. [Google Scholar]
- Xie, F.; He, Y.; Yuan, Z.; Kang, X. Microstructure and high-temperature sliding wear performance of Fe-Co-Mo alloy coating fabricated by plasma cladding. Surf. Coat. Technol. 2022, 444, 128667. [Google Scholar] [CrossRef]
- Liu, C.; Xu, P.; Zha, G.; Ouyang, Z. Microstructure and properties of a Ti doped Fe-based SMA coating produced by laser cladding. JMRT 2021, 14, 2441–2450. [Google Scholar] [CrossRef]
- Cheng, J.; Xu, B.; Liang, X.; Wu, Y.; Liu, Z. Effect of electromagnetic stirring on the microstructure and wear behavior of iron-based composite coatings. Materials 2008, 15, 451–456. [Google Scholar] [CrossRef]
- Zhang, L.; Sun, D.; Yu, H. Effect of niobium on the microstructure and wear resistance of iron-based alloy coating produced by plasma cladding. Mater. Sci. Eng. A 2008, 490, 57–61. [Google Scholar] [CrossRef]
- Lu, F.; Li, H.; Ji, Q.; Zeng, R.; Wang, S.; Chi, J.; Li, M.; Chai, L.; Xu, H. Characteristics of the functionally graded coating fabricated by plasma transferred arc centrifugal cladding. Surf. Coat. Technol. 2011, 205, 4441–4446. [Google Scholar] [CrossRef]
- Chen, B.; Gao, P.; Zhang, B.; Zhao, D.; Wang, W.; Jin, C.; Yang, Z.; Guo, Y.; Liang, M.; Li, J.; et al. Wear Properties of Iron-Based Alloy Coatings Prepared by Plasma Transfer Arc Cladding. Coatings 2022, 12, 243. [Google Scholar] [CrossRef]


Disclaimer/Publisher’s Note: The statements, opinions and data contained in all publications are solely those of the individual author(s) and contributor(s) and not of MDPI and/or the editor(s). MDPI and/or the editor(s) disclaim responsibility for any injury to people or property resulting from any ideas, methods, instructions or products referred to in the content. |
© 2024 by the authors. Licensee MDPI, Basel, Switzerland. This article is an open access article distributed under the terms and conditions of the Creative Commons Attribution (CC BY) license (https://creativecommons.org/licenses/by/4.0/).