Article

A New Method for Evaluating Liquefaction by Energy-Based Pore Water Pressure Models

1
School of Engineering, China University of Petroleum (Beijing) at Karamay, Karamay 834000, China
2
Xinjiang Key Laboratory of Multi-Medium Pipeline Safety Transportation, Urumqi 830011, China
3
Department of Geological Engineering, Southwest Jiaotong University, Chengdu 611756, China
4
Key Laboratory of High-Speed Railway Engineering, Ministry of Education, Chengdu 611756, China
5
Chengdu Surveying Geotechnical Research Institute Co., Ltd. of MCC, Chengdu 610023, China
6
Shock and Vibration of Engineering Materials and Structures Key Laboratory of Sichuan Province, Southwest University of Science and Technology, Mianyang 621010, China
*
Authors to whom correspondence should be addressed.
Coatings 2025, 15(1), 7; https://doi.org/10.3390/coatings15010007
Submission received: 18 November 2024 / Revised: 23 December 2024 / Accepted: 23 December 2024 / Published: 24 December 2024
(This article belongs to the Special Issue Advances in Pavement Materials and Civil Engineering)

Abstract

:
Liquefaction-induced damage can be mitigated through remediation methods, contingent upon a thorough evaluation of liquefaction, which necessitates comprehensive investigation. This paper presents a novel energy-based pore pressure model for the assessment of liquefaction potential, utilizing cyclic triaxial numerical tests. In this model, the energy of the earthquake is quantified using the Arias intensity. The validity of the energy-based pore pressure model was corroborated by the results of cyclic triaxial tests. Based on the validated model, a new methodology that incorporates permeability and the shear stress reduction coefficient was proposed for the evaluation of liquefaction potential. This new approach was further validated through centrifuge tests and numerical simulations. The findings indicate that the proposed method can accurately predict the generation and accumulation of excess pore pressure, thereby demonstrating its efficacy in evaluating ground liquefaction potential.

1. Introduction

Soil liquefaction is a significant contributor to the destruction of superstructures, primarily due to the lateral spreading and softening of the ground that occurs as a result of liquefaction during earthquake events [1]. Consequently, it is imperative to assess the liquefaction potential of the ground prior to the construction of foundations, which can effectively mitigate the damage associated with soil liquefaction. However, the assessment of liquefaction potential presents a complex engineering challenge, influenced by various factors, including the characteristics of saturated sand, the initial stress state, and the magnitude, duration, and frequency of earthquake ground motion [2]. Currently, the conventional methods for assessing the liquefaction potential of saturated sand are categorized into three primary approaches: the first is the stress method, which is based on the shear stress that can be generated in the ground [3]; the second is the strain method, which focuses on the shear strain induced by earthquake events in the ground [4]; and the third is the energy method, which is predicated on the energy dissipated at the site [5]. Among these methodologies, the simplified evaluation method developed by Seed and Idriss [3], which is grounded in the stress method, is the most widely utilized.
The energy method employs simplified procedures that are predicated on standard penetration values and ground motion, offering several advantages [6,7]. Experimental results have demonstrated a strong correlation between the cumulative dissipated energy per unit volume of soil (referred to as unit dissipated energy) and the excess pore water pressure generated under undrained cyclic loading [6]. This relationship emerges from the fact that the energy dissipated per unit is dependent on the area of the shear stress-strain hysteresis loop, whereas the excess pore water pressure is closely related to the shear strain induced by cyclic shear [6]. Consequently, it is justifiable to utilize unit dissipated energy as a means to evaluate the excess pore water pressure that contributes to soil liquefaction. As the earthquake ground motion propagates toward the surface, both amplification and attenuation of amplitude occur, which are contingent upon the frequency range. The stress method assesses liquefaction potential based on the maximum horizontal acceleration at the surface; however, it fails to account for the acceleration amplification and attenuation resulting from the propagation of ground motion. Furthermore, this method selectively interprets certain aspects of the amplitude while disregarding others. In contrast, the energy method employs dissipated energy to evaluate soil liquefaction potential, defined as the difference between total energy and emitted energy. Both total energy and emitted energy are influenced by the amplitude, frequency, and duration of earthquake ground motion. Thus, the energy method effectively incorporates considerations of amplitude amplification and attenuation. In summary, the energy method provides a more effective and accurate assessment of soil liquefaction potential induced by earthquakes.
Based on the energy method, researchers have developed a range of pore water pressure models over the past few decades [5,6,7,8,9]. Initially, several pore water pressure models were established through cyclic undrained tests conducted under regular loading conditions. However, these models differ significantly from the irregular periods and asymmetric amplitudes characteristic of earthquake ground motions. Consequently, the pore water pressure models formulated under regular loading are not appropriate for calculating the generation and accumulation of pore water pressure during earthquake ground motions [10,11]. Seed and Idriss [3] proposed a method for assessing liquefaction potential subjected to earthquake ground motion, utilizing results from cyclic undrained tests performed under constant stress dynamic loading. In this approach, the constant stress is set at 0.65 times the peak value of the dynamic stress, and the number of cycles in the test is determined by the magnitude of the earthquake. This equivalent method demonstrates a degree of rationality in strength estimation and is user-friendly, leading to its continued application. However, Xie and Wu [10] identified that the ground motion pattern and the stress history resulting from irregular and asymmetric dynamic loading significantly affect the liquefaction potential of saturated sand. The equivalent method proposed by Seed and Ishihara [3] does not adequately consider the influence of ground motion patterns and neglects the impact of stress history on pore water pressure. Therefore, it is deemed unsuitable for evaluating soil liquefaction potential [10]. In response to these limitations, some researchers have proposed pore water pressure models specifically designed for irregular loading conditions to enhance the evaluation of liquefaction potential. Meng et al. [11] developed a pore water pressure model for irregular loading conditions based on the existing model designed for constant amplitude loading, which necessitated a limited number of parameters. Fu et al. [12] introduced an incremental model of pore water pressure under irregular loading derived from in-situ liquefaction tests that utilized acceleration, burial depth, and sand type as fundamental indices. Wang et al. [13] proposed a revised incremental pore water pressure model that effectively predicts pore water pressure generation under dynamic loading, as corroborated by the results of shaking tests. The aforementioned pore water pressure models facilitate the prediction of pore water pressure generation under irregular loading conditions. However, these models do not adequately account for the effects of ground motion type and the influence of stress history on pore water pressure.
In this study, a novel energy pore water pressure model is developed based on the relationship between pore water pressure and the Arias intensity (Ia) [14] of ground motion using cyclic triaxial numerical tests. A total of 1000 numerical tests were performed utilizing 100 different ground waves, each with 10 varying peak ground accelerations. Furthermore, the mean period was incorporated into the model to account for the frequency effects on pore water pressure. Consequently, the model is capable of capturing the influence of ground motion patterns as well as the effects of stress history. Based on this model, a liquefaction evaluation method incorporating the influence of permeability and stress reduction coefficients has been proposed specifically for Fujian standard sand by theoretical analysis. Finally, centrifuge shaking table tests and numerical simulations are conducted to validate the reliability and precision of the proposed evaluation method.

2. Pore Water Pressure Modelling

2.1. Proposal of Pore Water Pressure Model

During the course of the study, the authors observed that the shape of the pore water pressure curve obtained from both physical and numerical cyclic triaxial tests under dynamic loading closely resembles the shape of the Ia curve of ground motion, as illustrated in Figure 1. In the cyclic triaxial tests, sand samples with varying relative densities were consolidated using different levels of consolidation pressure (σ0) and consolidation pressure ratios (k0). For specific sand parameters and test results, please refer to reference [15].
Consequently, this paper proposes a pore water pressure model that is based on the Ia curve of ground motion. In this model, the shape of pore water pressure time history is determined by the shape of the Ia curve. The peak value of pore water pressure is determined by the Ia input into the soil unit. The model incorporates the stress history induced by dynamic loading as well as the effects of the ground motion pattern. A product form is utilized to represent the primary parameters that affect the generation of pore water pressure in saturated sand, including earthquake energy, mean period, and the material properties of saturated sand. It is important to note that the interactions between these parameters are not considered in this model. The specific formulation of the model is presented in Equation (1):
U d ( t ) = α F ( I a , σ 0 , k 0 ) I a ( t ) / I a , 1.0 g
I a = π 2 g 0 T d [ a ( t ) ] 2 d t
where α is a parameter related to sand, Ia,1.0g is the Arias intensity of ground motion when the amplitude is 1.0 g, g is the acceleration of gravity, Td is the duration of the ground motion, and a is the acceleration of the ground motion.

2.2. Numerical Model of Cyclic Triaxial Test

The stress state of the soil unit prior to and during the earthquake is illustrated in Figure 2. Before the earthquake, the soil unit exists in a state of consolidation, influenced by both vertical and horizontal stresses, which represent the initial stress conditions. During the earthquake, the soil unit experiences additional horizontal shear stresses alongside the existing consolidation pressures.
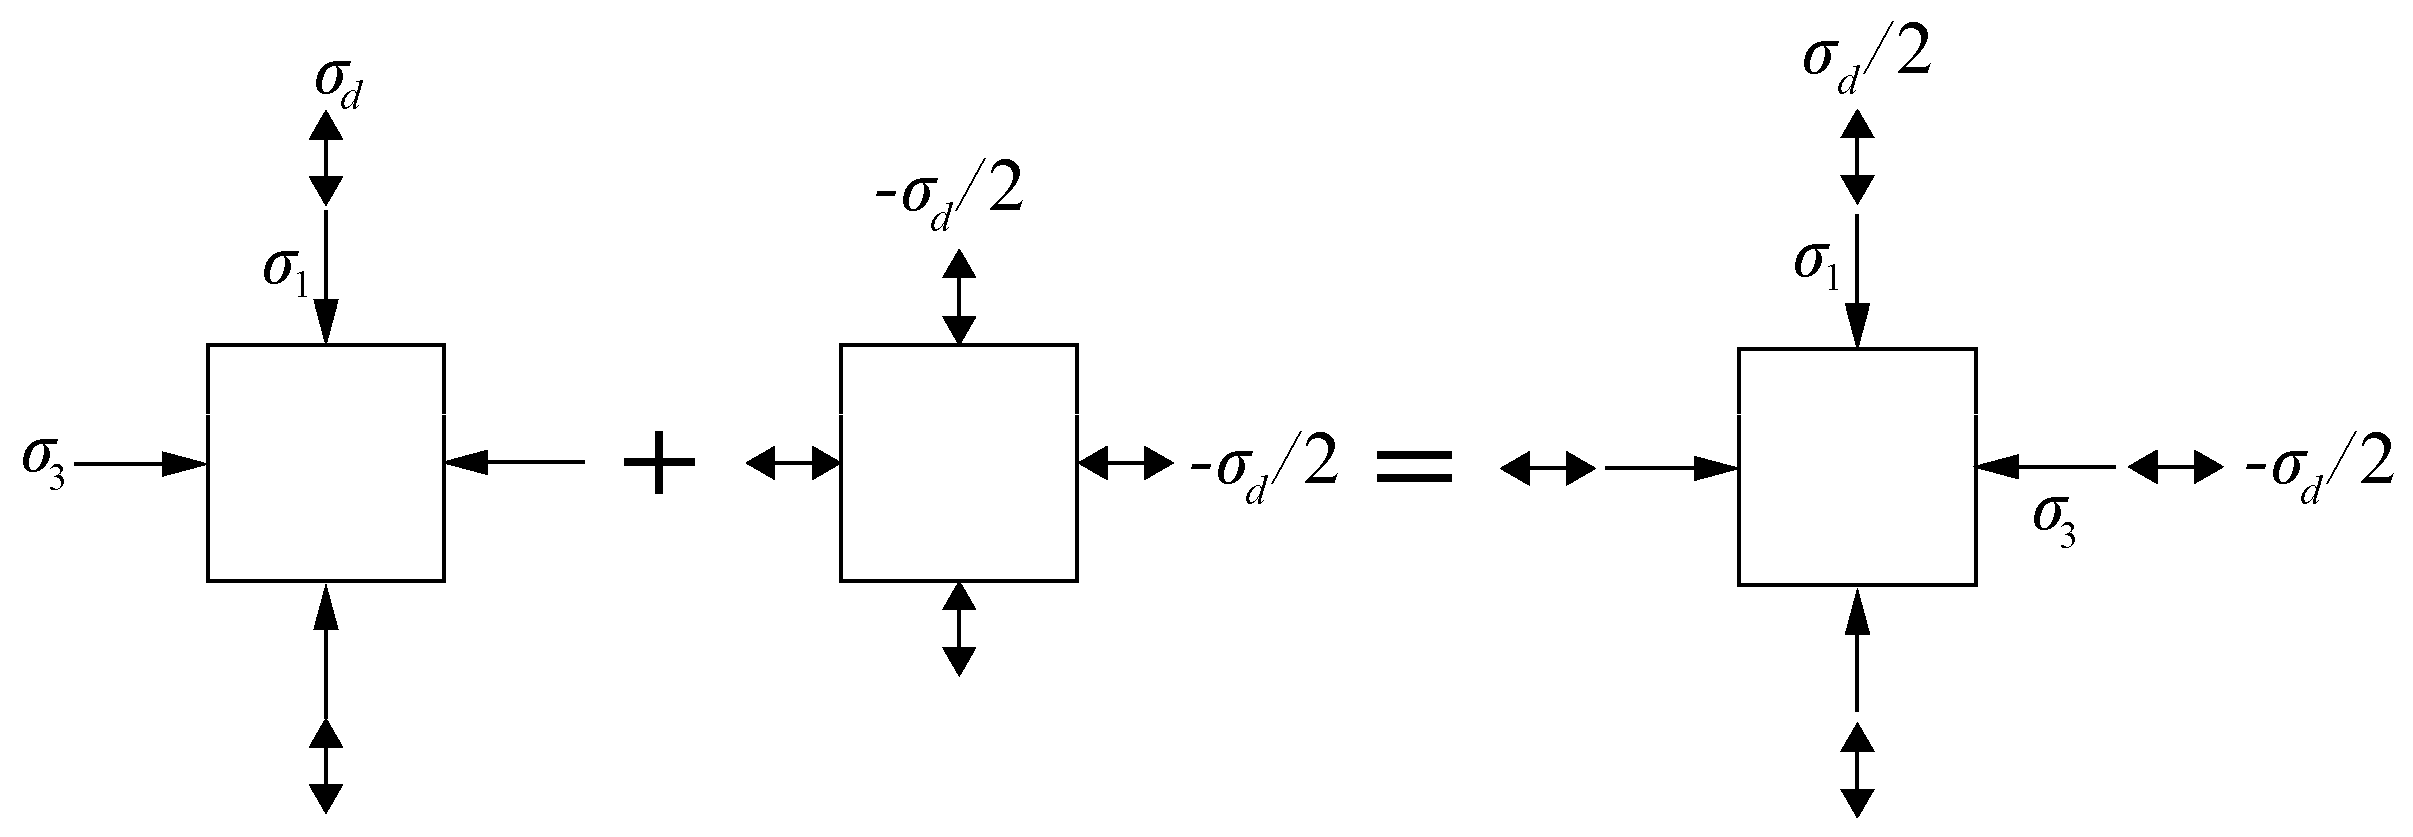
To date, the predominant method for investigating the stress state of soil units subjected to dynamic loading is the soil unit test, for example, the unidirectional and bidirectional undrained cyclic triaxial tests. These tests utilize the shear stress on the 45° surface of the soil unit to replicate the dynamic shear stress experienced during an earthquake (Figure 3). The shear stress states for both the unidirectional and bidirectional dynamic triaxial tests are illustrated in Figure 3. Following the completion of soil unit consolidation, a dynamic load of σd/2 is applied in both the x and y directions, resulting in the generation of shear stress of σd/2 on the 45° surface of the soil unit (Figure 3). In the unidirectional cyclic triaxial test, the dynamic load σd/2 is applied solely in the y direction, leading to the generation of both shear stress and spherical stress of σd/2 on the 45° surface of the soil unit, as depicted in Figure 3. It is important to note that the pore water pressure within the soil unit is influenced only by the consolidation pressure and dynamic shear stress; the spherical stress does not contribute to the generation of pore water pressure. However, it does impact the fluctuations of pore water pressure under dynamic loading conditions. Consequently, the bidirectional dynamic triaxial test is more effective in capturing the stress state of the soil unit under dynamic loading (Figure 4). This paper applied the bidirectional cyclic triaxial numerical test to investigate the stress state of the soil unit and established a pore water pressure model based on numerical simulations.
In this paper, the saturated Fujian standard sand with relative densities (Dr) of 60% (medium density) and 90% (dense) was utilized to create soil samples for bidirectional cyclic triaxial testing. The soil unit tests were simulated using the open-source software OpenSees 2.5.0, which was developed by UC Berkeley. The software is a state-of-the-art open-source finite element software specifically designed for modeling geotechnical systems and computational simulation in earthquake engineering [16]. In the numerical model, the SSPquadUP element [17] was employed to represent the soil unit. This element is based on the porous media theory, fluid–solid coupling principles, and Darcy’s law. The soil element functions as a fully coupled fluid–solid element. The fluid–solid coupling methodology for the solid and liquid phases is based on the u-p formulation established by Zienkiewicz and Shiomi [18], which is derived from Biot’s porous media theory [19], as illustrated in Equations (3) and (4). This soil element effectively simulates the dynamic interactions between the liquid and solid phases under dynamic loading conditions.
Ω B T σ d Ω + M u ¨ + Q p = f s
Q T u ˙ + S p ˙ + H p ˙ = f p
where B is the strain-displacement matrix, σ’ is the effective stress tensor, M is the mass matrix, u is the displacement vector, Q is the discrete gradient operator of soil–water coupling, p is the pore water pressure vector, S is the compression matrix, H is the permeability coefficient matrix, and fs and fp represent the given boundary of volume force in the water–soil mixture and liquid phase, respectively.
The multi-yield surface plastic constitutive model, referred to as the PDMY02 material, was employed to simulate the soil material. This model was originally proposed by Elgamal et al. [20,21] for liquefaction-induced large deformation and cyclic flow. The yield function associated with the soil constitutive model is presented in Equation (5). Distinct material parameters have been selected for Fujian standard sand, corresponding to relative densities of 60% and 90%, in accordance with the references provided [22,23], as presented in Table 1.
f = 3 2 [ s ( p + p 0 ) α ] : [ s ( p + p 0 ) α ] M 2 ( p + p 0 ) 2 = 0
where s = σ′p′δ is the deviatoric stress tensor, δ is the second-order identity tensor, p′ is the mean effective shear stress, po′ is a small normal number, α is the second-order deviatoric tensor, which can define the center of the yield surface in the deviatoric stress space. M is the size of the yield surface, and “:” is the product of double compression tensors.
The bidirectional cyclic triaxial numerical test model is illustrated in Figure 5. The numerical testing procedure was conducted in three steps:
Step 1: Soil element consolidation. The boundary conditions for the numerical model were established in accordance with the physical test. The degrees of freedom for nodes 1 and 4 in the x-direction, as well as for nodes 1 and 2 in the y-direction, are constrained. Additionally, the degrees of freedom for nodes 2 and 3 in the x-direction have been coupled using a penalty function, ensuring that the displacements of nodes 2 and 3 in the x-direction are equivalent. A similar approach was applied to the degrees of freedom for nodes 3 and 4 in the y-direction. In this way, the concentrated load exerted on the soil nodes will be transmitted to the soil element as a uniform load. The degree of freedom concerning pore water pressure at all nodes remains unconstrained, and consolidation stress is applied to the model to simulate the drained consolidation of the soil unit. The consolidation pressure, denoted as −3/2, is applied to nodes 2 and 3 in the x-direction. Concurrently, the consolidation pressure, −1/2, is applied to nodes 3 and 4 in the y-direction. A static analysis is conducted to complete the consolidation process.
Step 2: Apply dynamic pressure. Prior to the application of the pressure, the degrees of freedom for pore water pressure at all fixed nodes are constrained to simulate an undrained condition. A dynamic pressure with an amplitude of −d/2 is applied to nodes 2 and 3 in the x-direction. Concurrently, a dynamic pressure with an amplitude of d/2 is applied to nodes 3 and 4 in the y-direction. A dynamic analysis is subsequently conducted. During this analysis, the amplitude of the dynamic pressure is incrementally increased until the saturated sand approaches a state of soil liquefaction.
Step 3: Input of different dynamic pressures. The seismic waves undergo an initial baseline correction utilizing the EQSignal v1.2.0 software, followed by a filtering process aimed at enhancing both processing efficiency and accuracy. Nodal pressure was applied in the form of ground waves with varying amplitudes to node 2 and node 3 in the x-direction, as well as to node 3 and node 4 in the y-direction, in order to simulate the application of pressure. The subsequent step was reiterated until the cyclic triaxial test was completed for all 100 ground waves.

2.3. The Relationship Between Pore Water Pressure and Arias Intensity

This study involved the selection of 100 distinct ground motion records derived from 10 seismic events, which include the Tabas Earthquake in 1978, the San Fernando Earthquake in 1971, the Coalinga Earthquake in 1983, Northridge Earthquake in 1994, Loma Prieta Earthquake in 1989, Kobe Earthquake in 1995, Kern County Earthquake in 1952, Imperial Valley Earthquake in 1979, El Centro Earthquake in 1940, and the Chi-Chi Earthquake in 1999. The selected 100 ground motions were utilized to conduct a bidirectional cyclic triaxial numerical test aimed at elucidating the relationship between pore water pressure and Arias intensity. The consolidation pressure was set at 100 kPa, and the consolidation ratio was maintained at 1.0 during the numerical testing. The duration of the ground motions ranged from 18 s to 100 s. The predominant frequencies varied from 0.06 Hz to 1.24 Hz, while the mean period ranged from 0.2 s to 1.3 s. The Arias intensity of the ground motions ranged from 4 m/s to 117 m/s, with an amplitude of 1.0 g.
Figure 6 shows the relationship between the cyclic stress ratio (CSR) and pore water pressure in saturated Fujian standard soil subjected to earthquake ground motions. The relationship between the cyclic stress ratio (CSR) and pore water pressure was analyzed using data fitting software called CurveFitter, which possesses the capability to determine the optimal curve for a specified function along with its associated parameters. In this study, five potential functions—linear, quadratic, cubic, parabolic, and power functions—were evaluated for curve fitting. The function exhibiting the highest correlation coefficient (R2) was chosen to accurately represent the relationship between the CSR and pore water pressure. The curves presented in the subsequent text have all been generated utilizing this methodology; therefore, further elaboration is unnecessary. A power function relationship exists between the cyclic stress ratio and pore water pressure in saturated sand. The R2 for medium-dense sand (Dr = 60%) is 0.627, accompanied by a root mean square error of 16.7. In contrast, the R2 for medium-dense sand (Dr = 90%) is 0.641, with a root mean square error of 20.4. While a power function relationship between cyclic stress ratio and pore water pressure in saturated sand is observed, it is important to note that this relationship is not particularly strong.
The Arias intensity and mean period of ground motions significantly influence the generation and accumulation of pore water pressure in saturated sand during soil unit tests. An increase in Arias intensity correlates with a higher energy level of ground motion, which subsequently reduces the cyclic stress ratio necessary for soil liquefaction. Conversely, a shorter mean period results in a greater number of shear cycles during the shaking duration, thereby also decreasing the cyclic stress ratio required for soil liquefaction. Consequently, it is essential to consider both the Arias intensity and mean period of ground motions when modifying the relationship between the cyclic stress ratio (CSR) and pore water pressure in saturated sand. This paper introduces a new parameter, termed the modified cyclic stress ratio (Mcsr), to account for the effects of Arias intensity (Ia,1.0g) and mean period (Tm) on the cyclic stress ratio (CSR). The proposed relationship is expressed as (Mcsr). Mcsr = (CSR)a × (Ia,1.0g)b/(Tm)c, where a, b, and c are parameters that relate to the material properties of the saturated sand.
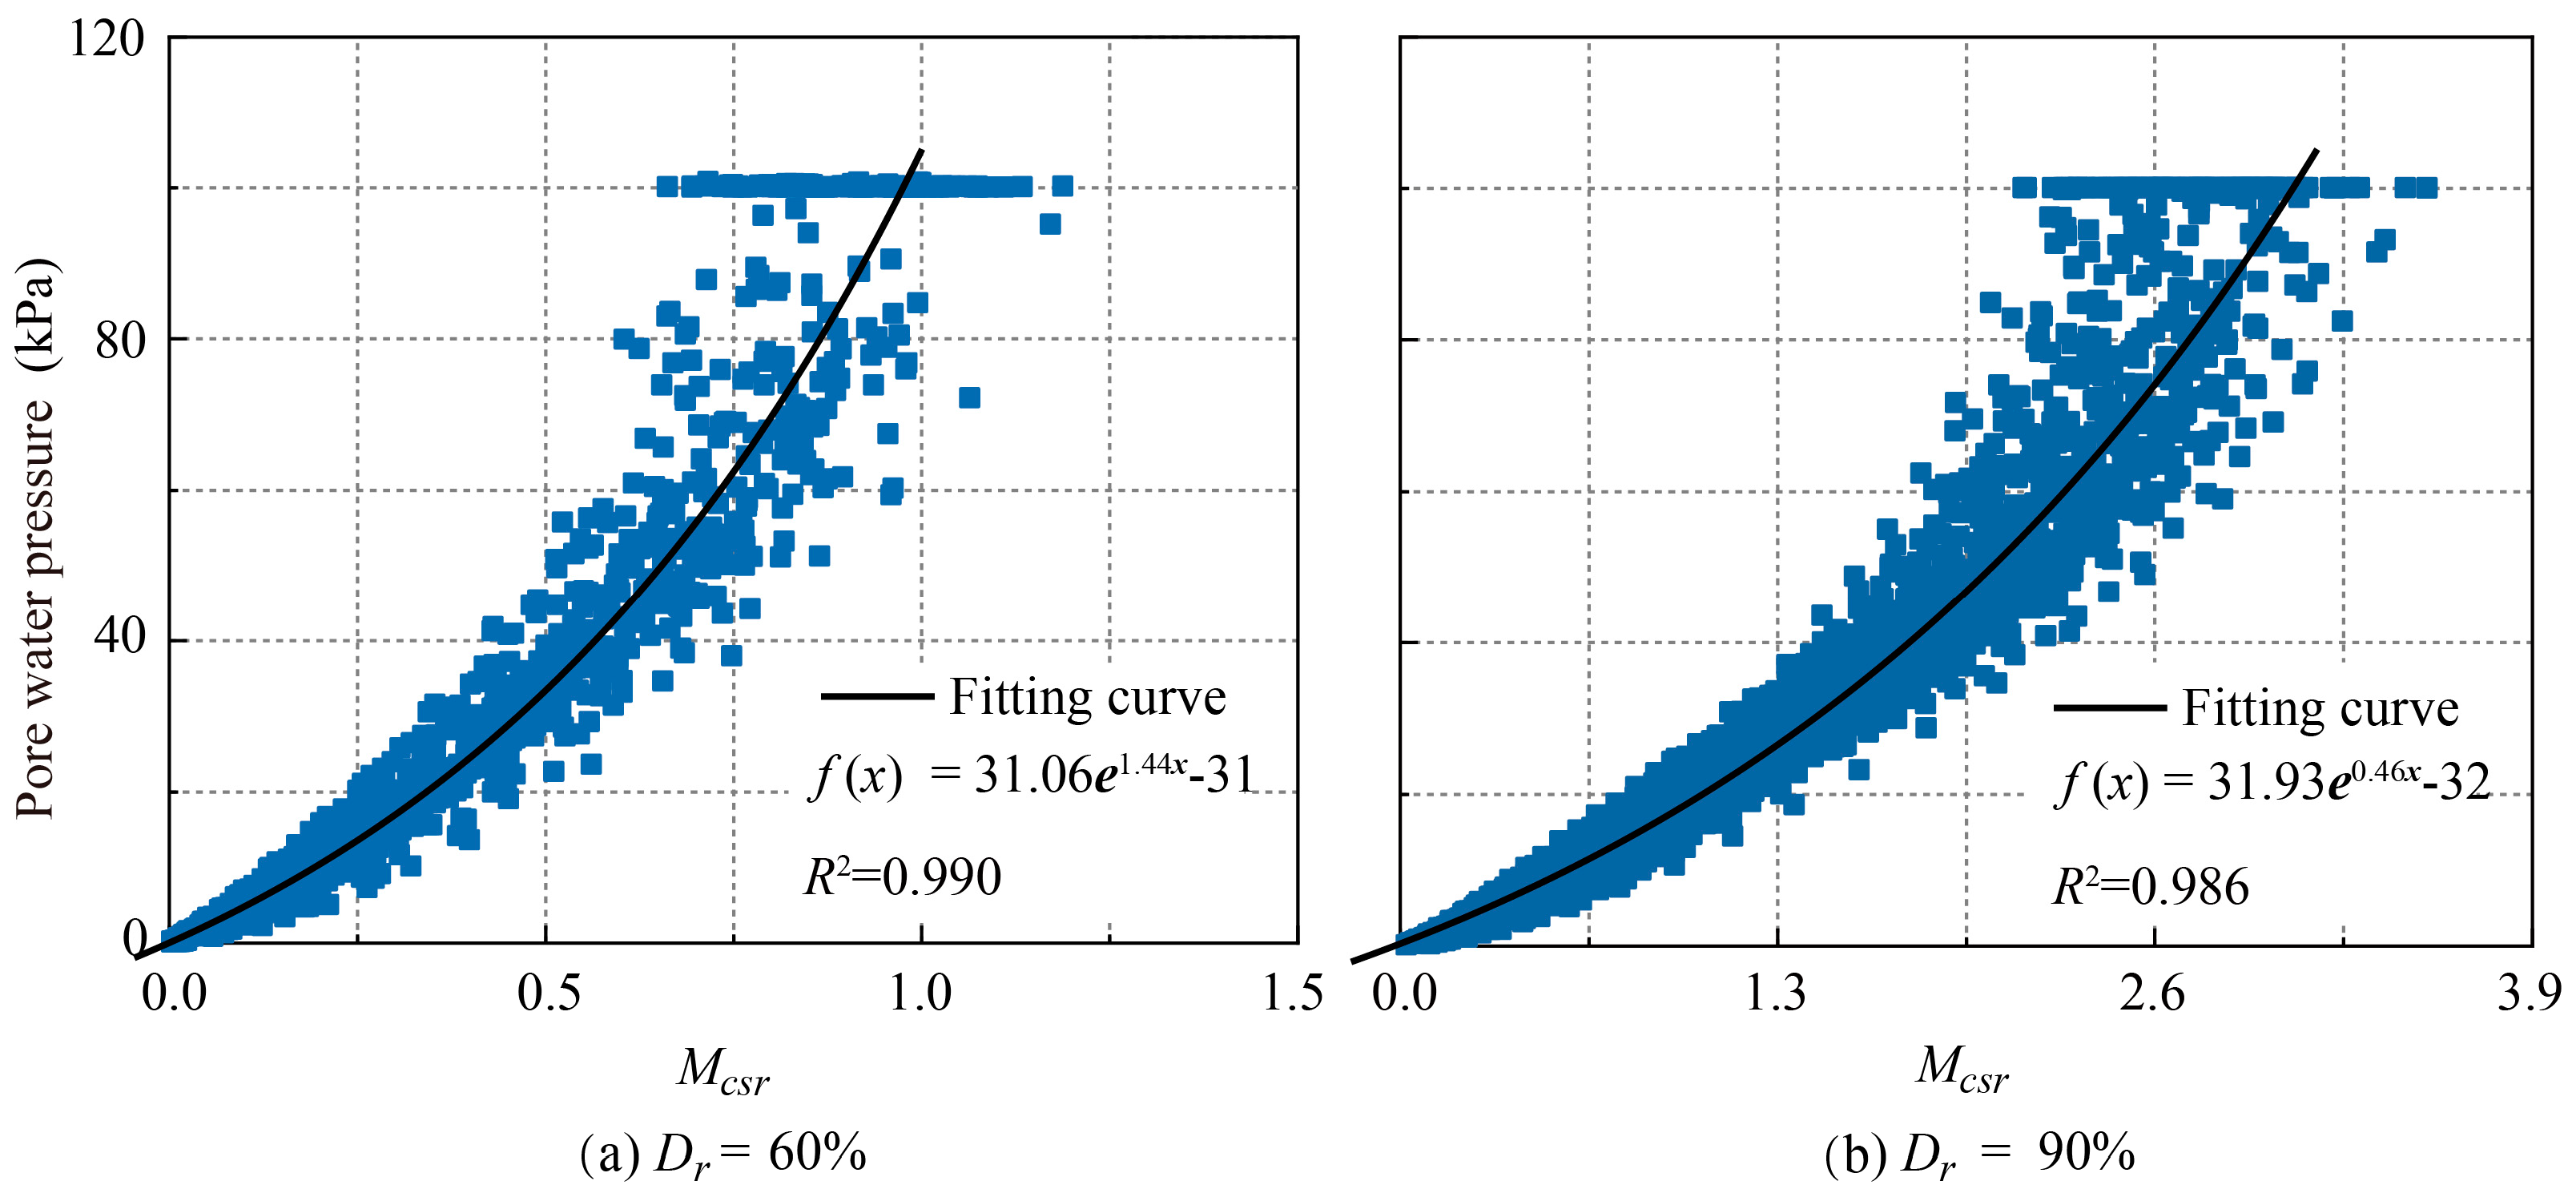
A power function relationship has been established between the Mcsr and the pore water pressure of saturated Fujian standard sand with different relative densities. For medium-dense Fujian standard sand (Dr = 60%), when a = 1.866, b = 0.78, and c = 0.63, yield a significant power function relationship, with the highest correlation coefficient of 0.990. Similarly, for medium-dense Fujian standard sand, a strong power function relationship is observed between the Mcsr and the pore water pressure, characterized by a = 1.440, b = 0.64, and c = 0.51, resulting in a correlation coefficient of 0.986, which indicates a very strong correlation, as illustrated in Figure 7. A comparable power function relationship has also been identified in dense Fujian standard sand (Dr = 90%). The equations representing these relationships are as follows:
(1)
For the Dr = 60%:
T m = 0 T d [ a f ( t ) ] 2 × 1 / f ( t ) d t
M c s r = C S R 1.866 × I a , 1.0 g 0.78 T m 0.63
U d ( t ) = 31.06 e 1.44 × Mcsr 31
(2)
For the Dr = 90%:
M c s r = C S R 1.440 × I a , 1.0 g 0.64 T m 0.51
U d ( t ) = 31.93 e 0.46 × Mcsr 32
where af is the amplitude with a frequency of f, f is the frequency corresponding to the acceleration af, and e is the Euler number.

2.4. Criteria for Liquefaction

Figure 7 shows the relationship between the Mcsr and pore water pressure when the pore water pressure ratio ranges from 0.8 to 1.0. This finding suggests that Equations (8) and (10) are inadequate for accurately calculating pore water pressure as the sand approaches a liquefaction state. Consequently, it is essential to develop a new equation to ascertain whether the saturated sand has reached a liquefaction state.
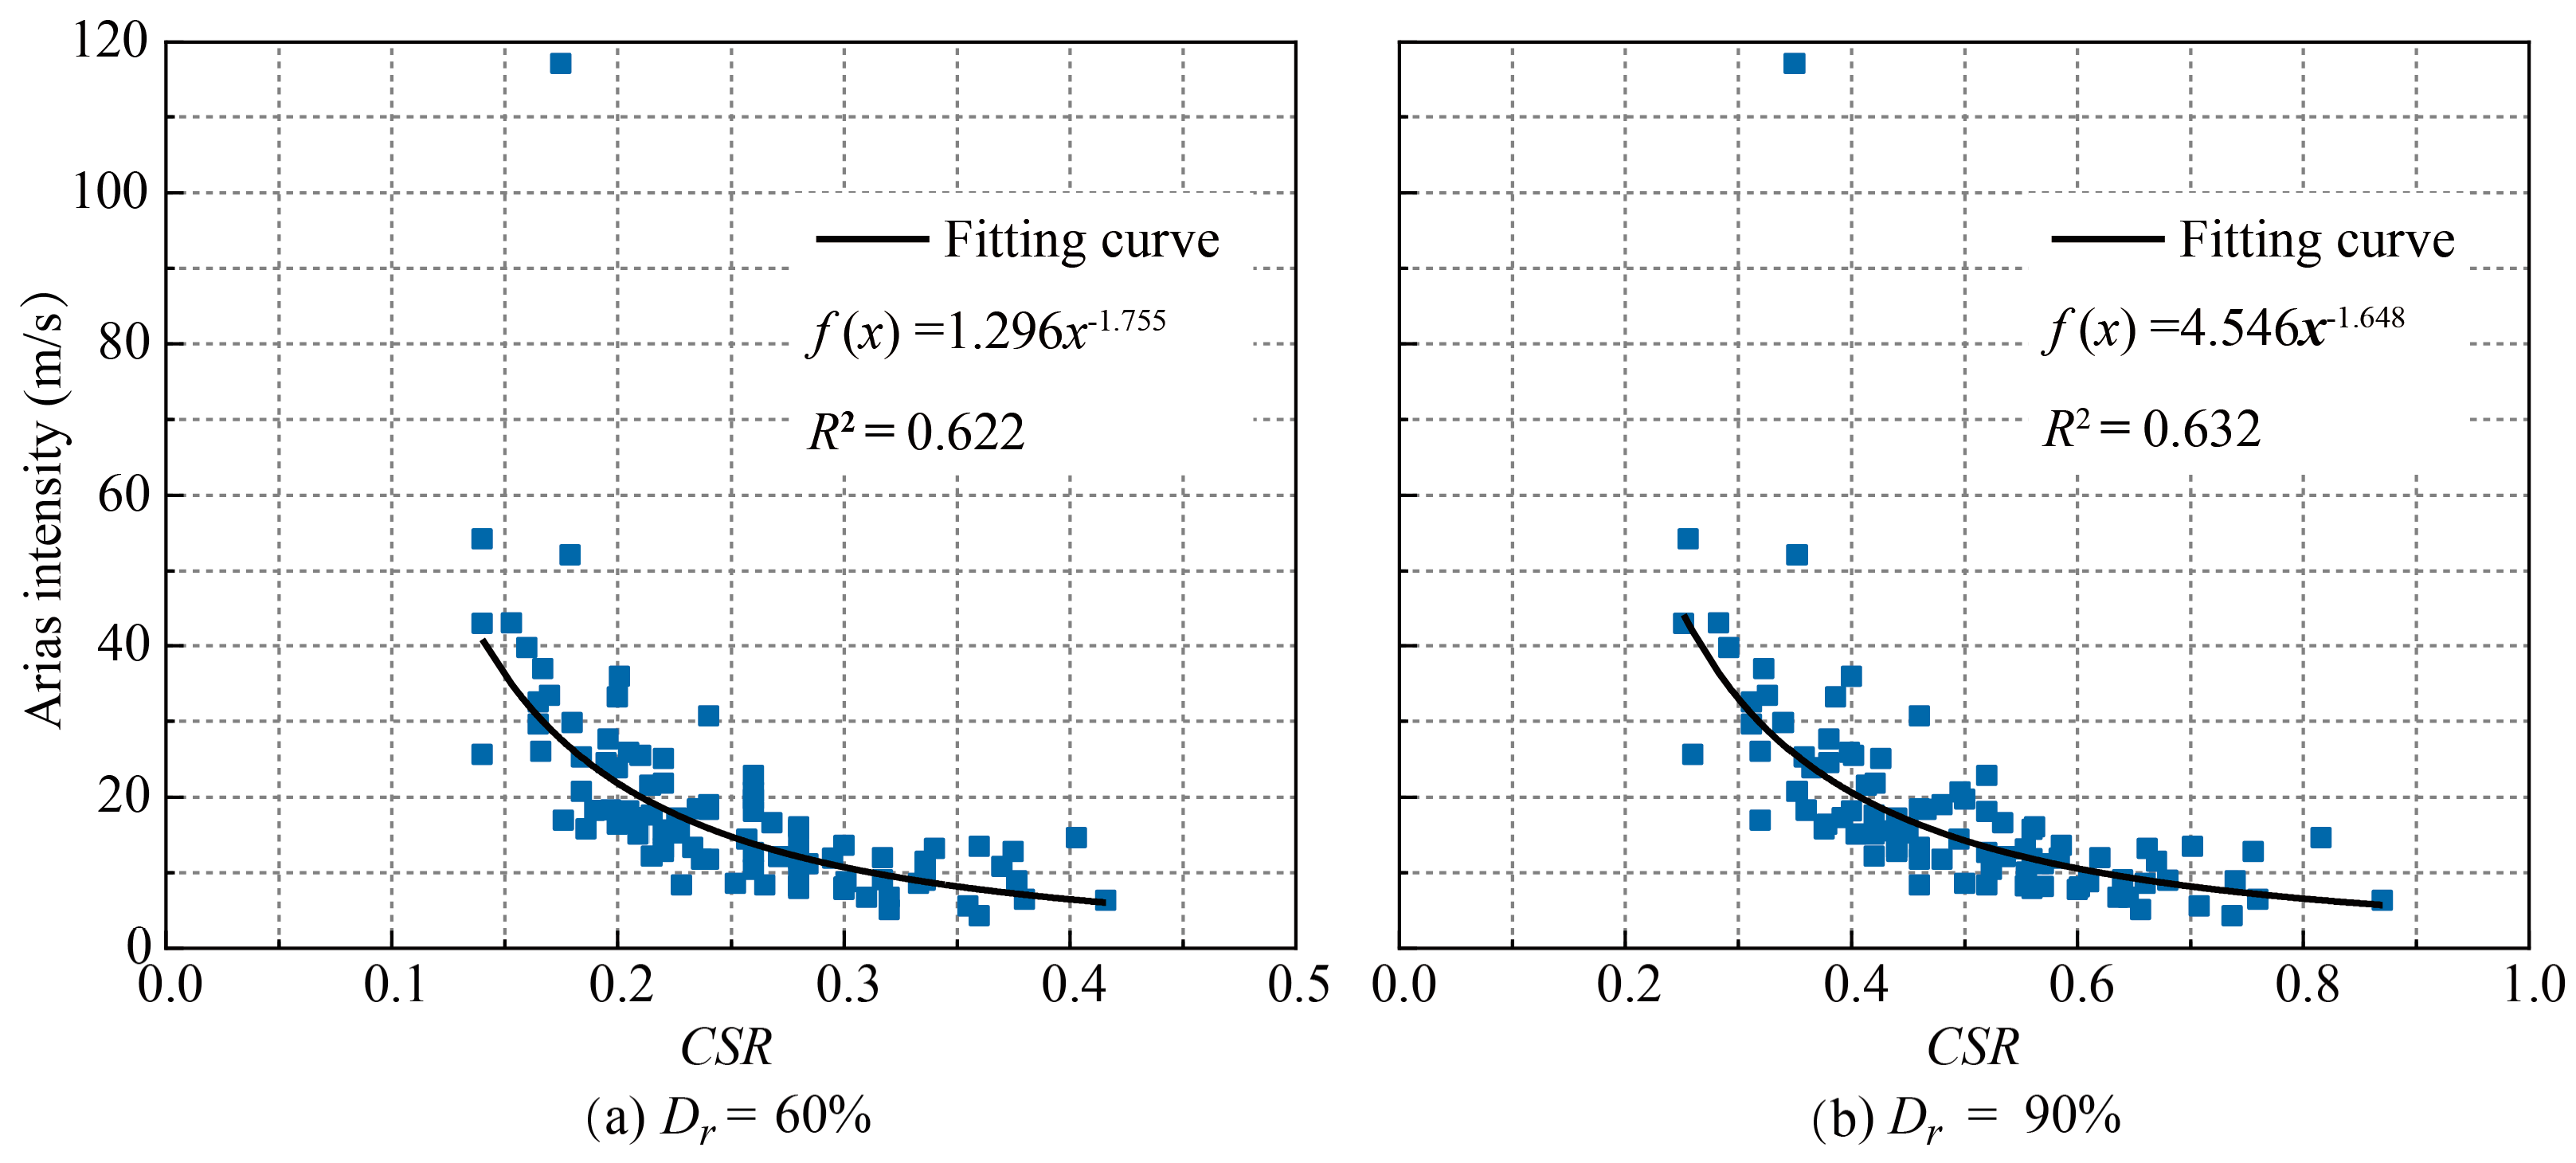
The relationship between the CSR required for liquefaction and the Arias intensity (with an amplitude of 1.0 g) is illustrated in Figure 8 for saturated Fujian standard sand with different relative densities. It is observed that the CSR required for the liquefaction of saturated Fujian standard sand decreases as the Arias intensity increases, indicating an inverse relationship between these two parameters. Although a correlation exists between the CSR and the Arias intensity—evidenced by R2 values of 0.622 for a Dr of 60% and 0.632 for a Dr of 90%—there remains a significant margin of error, suggesting considerable variability in the data. Furthermore, the cyclic shear stress induces cyclic shear strain in the saturated sand, which in turn generates pore water pressure. The number of cyclic shears per time unit is influenced by the mean period, which also significantly affects the liquefaction behavior of saturated sand. Consequently, the mean period should be considered when studying the liquefaction criteria for saturated sands.
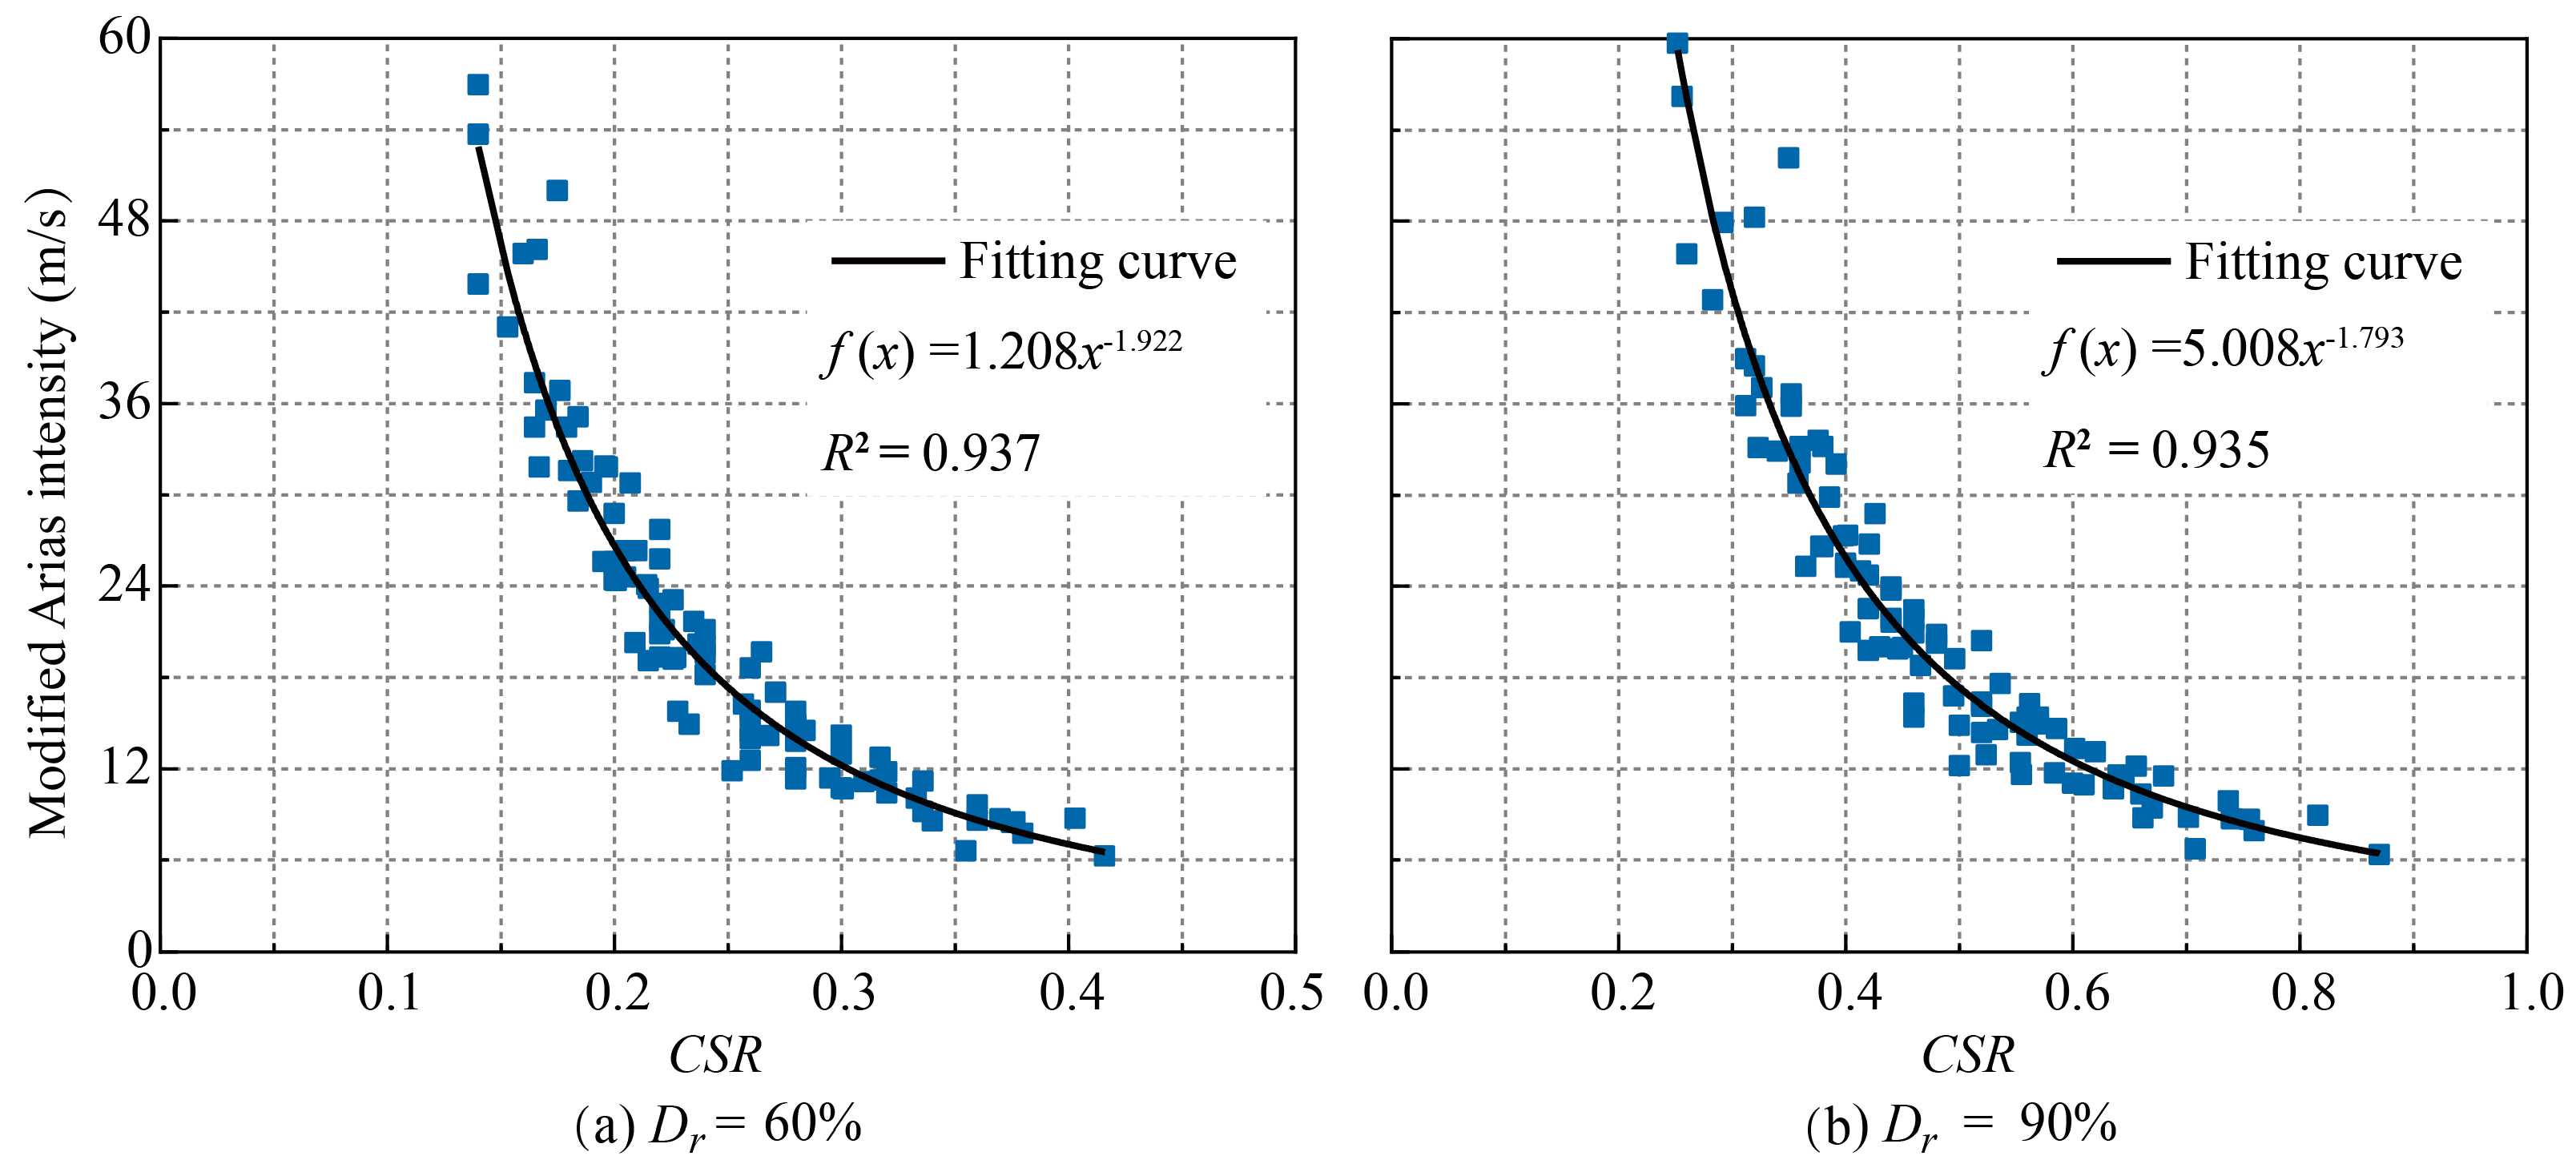
To establish more accurate liquefaction criteria, the mean period of ground motion is used to modify the Arias intensity. The modified Arias intensity, denoted as MIa, is defined by the equation MIa = (Ia,1.0g)d/(Tm)e, where d and e are parameters associated with the material properties of saturated sand. The relationships between MIa and the CSR required for liquefaction are shown in Figure 9 for saturated Fujian standard sand with different relative densities. The relationship between CSR and MIa was analyzed and fitted using MATLAB as the saturated sand approached the liquefaction threshold. For medium-dense Fujian standard sand (Dr = 60%), the correlation coefficient is the largest (R2 = 0.937), with d = 0.90 and e = 0.70. For dense Fujian standard sand (Dr = 90%), the correlation coefficient between the two variables is maximized at R2 = 0.935, with d = 0.91 and e = 0.71, as illustrated in Figure 9. The relationships between the MIa and the CSR required for liquefaction are represented by the following equations:
(1)
For the Dr = 60%:
M I a = I a , 1.0 g 0.9 T m 0.7
y = M I a = 1.208 x 1.922 = 1.208 × C S R 1.922
According to Equation (12), the criterion of soil liquefaction is Liqu:
L i q u = 1 / 1.208 × ( C S R 1.922 ) M I a = 1
(2)
For the Dr = 90%:
M I a = I a , 1.0 g 0.91 T m 0.71
y = M I a = 5.008 x 1.793 = 5.008 × C S R 1.793
According to Equation (15), the criterion of soil liquefaction is Liqu:
L i q u = 1 / 5.008 × ( C S R 1.793 ) M I a = 1
In Equations (13) and (16), the expressions (Ia,1.0g)0.9 × (CSR)1.922 and (Ia,1.0g)0.91 × (CSR)1.793 represent the Arias intensity of the ground motion when the amplitude of the input ground motion corresponds to the value of the CSR. The theoretical value is expected to be (Ia,1.0g)0.9 × (CSR)2.0. A discrepancy exists between the numerical results and the theoretical value, with the error being less than 10.04%. Consequently, the parameter Liqu in Equations (13) and (16) aligns with the principles of Arias intensity theory, suggesting that the application of these equations for evaluating soil liquefaction is both reasonable and accurate. When the values of MIa and CSR conform to Equations (13) and (16), it indicates that the saturated Fujian standard sand has attained a liquefaction state. Therefore, Equations (13) and (16) serve as the liquefaction criteria for saturated Fujian standard sand with relative densities of 60% and 90%, respectively.
The pore water pressure of saturated sand, along with the Arias intensity, mean period, and the CSR of the ground motion, adheres to Equations (8) and (10) when the pore water pressure ratio is less than 0.8, as shown in Figure 9. Conversely, when the pore water pressure ratio exceeds 0.8, employing Equations (8) and (10) to calculate the pore water pressure value results in significant errors. Consequently, the pore water pressure model has been divided into two equations, utilizing a pore water pressure ratio of 0.8 as the demarcation point.
(1)
For the Dr = 60%:
U d ( t ) = { ( 31 e 1.44 × M c s r 31 ) × I a ( t ) / I a , max , ( U d 0.8 ) L i q u × I a ( t ) / I a , max , ( U d > 0.8 )
(2)
For the Dr = 90%:
U d ( t ) = { ( 32 e 0.46 × M c s r 32 ) × I a ( t ) / I a , max , ( U d 0.8 ) L i q u × I a ( t ) / I a , max , ( U d > 0.8 )

2.5. Effect of Consolidation Pressure and Consolidation Ratio

The consolidation pressure and the consolidation ratio significantly affect the pore water pressure during the cyclic triaxial test of saturated sand. Consequently, it is essential to account for both the consolidation pressure and the consolidation ratio when developing a model for pore water pressure in the context of the cyclic triaxial test.
This study conducted two series of cyclic triaxial tests to investigate the effects of consolidation pressure and consolidation pressure ratio. In the first series of tests, the consolidation ratio (k0) was maintained at 1.0 while the consolidation pressure (σ0) was incrementally increased from 50 kPa to 200 kPa, with an interval of 10 kPa. In the second series, the horizontal consolidation pressure (σ3) was fixed at 100 kPa, and the consolidation ratio was varied from 1.0 to 2.0, with an increment of 0.1. Consequently, the vertical consolidation pressure (σ1) was raised from 100 kPa to 200 kPa, also with an interval of 10 kPa.

2.5.1. Effect of Consolidation Pressure on the Pore Water Pressure Model

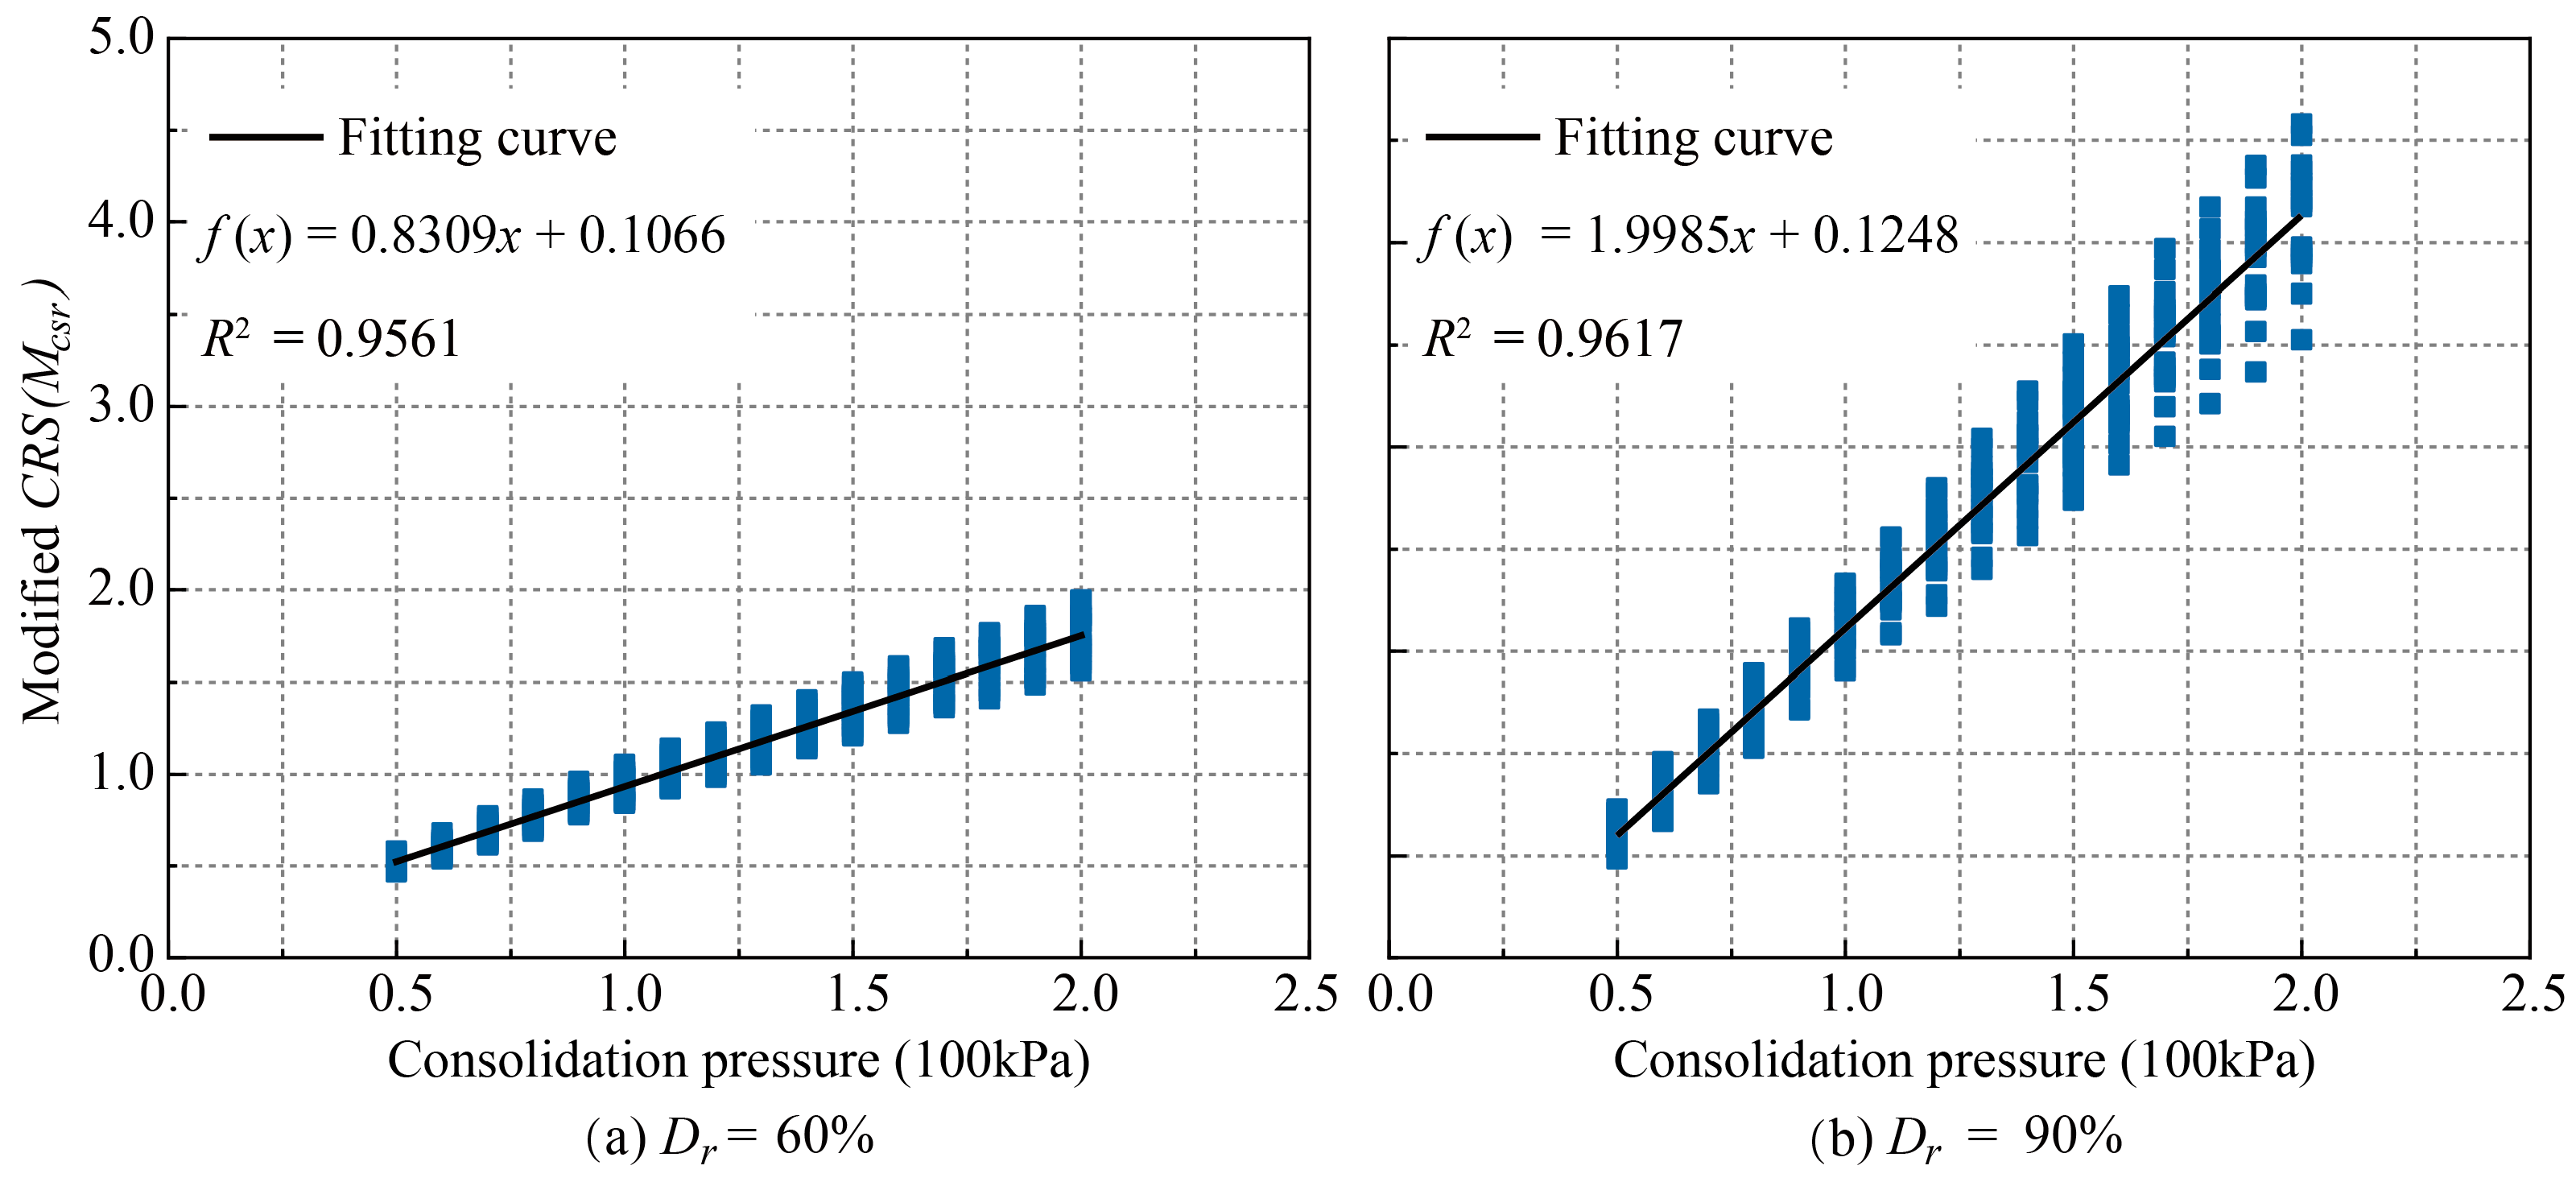
The relationship between the minimum modified CRS (Mcsr)and the consolidation pressure necessary for sand liquefaction under various ground motions are presented in Figure 10 for saturated sand with differing densities. The modified CRS denoted as Mcsr, is defined by the equation Mcsr = CRS × (Ia,1.0g)f/(Tm)g, where f and g are parameters associated with the material properties of saturated sand. It is observed that the Mcsr required for the liquefaction of saturated sand increases linearly with the consolidation pressure, indicating a strong linear correlation between these two variables. The correlation coefficients are 0.956 and 0.962 for sand with relative densities of 60% and 90%, respectively. The relationships are expressed by the following equations:
(1)
For the Dr = 60%:
C S R × I a , 1.0 g 0.41 / T m 0.35 = 0.831 × σ 0 / 100 + 0.107
The ratio of CSR at 100 kPa to the initial effective stress (σ0) serves as a parameter representing the influence of consolidation pressure on the pore water pressure model, denoted as kσo.
The value of kσo can be derived from Equation (19).
k σ 0 = C S R 100 / C S R σ 0 = 0.831 × σ 100 / 100 + 0.107 0.831 × σ 0 / 100 + 0.107
(2)
For the Dr = 90%:
C S R × I a , 1.0 g 0.47 / T m 0.32 = 1.999 × σ 0 / 100 + 1.248
The kσo can be derived from Equation (21):
k σ 0 = C S R 100 / C S R σ 0 = 1.999 × σ 100 / 100 + 0.125 1.999 × σ 0 / 100 + 0.125

2.5.2. Effect of Consolidation Ratio on Pore Water Pressure Model

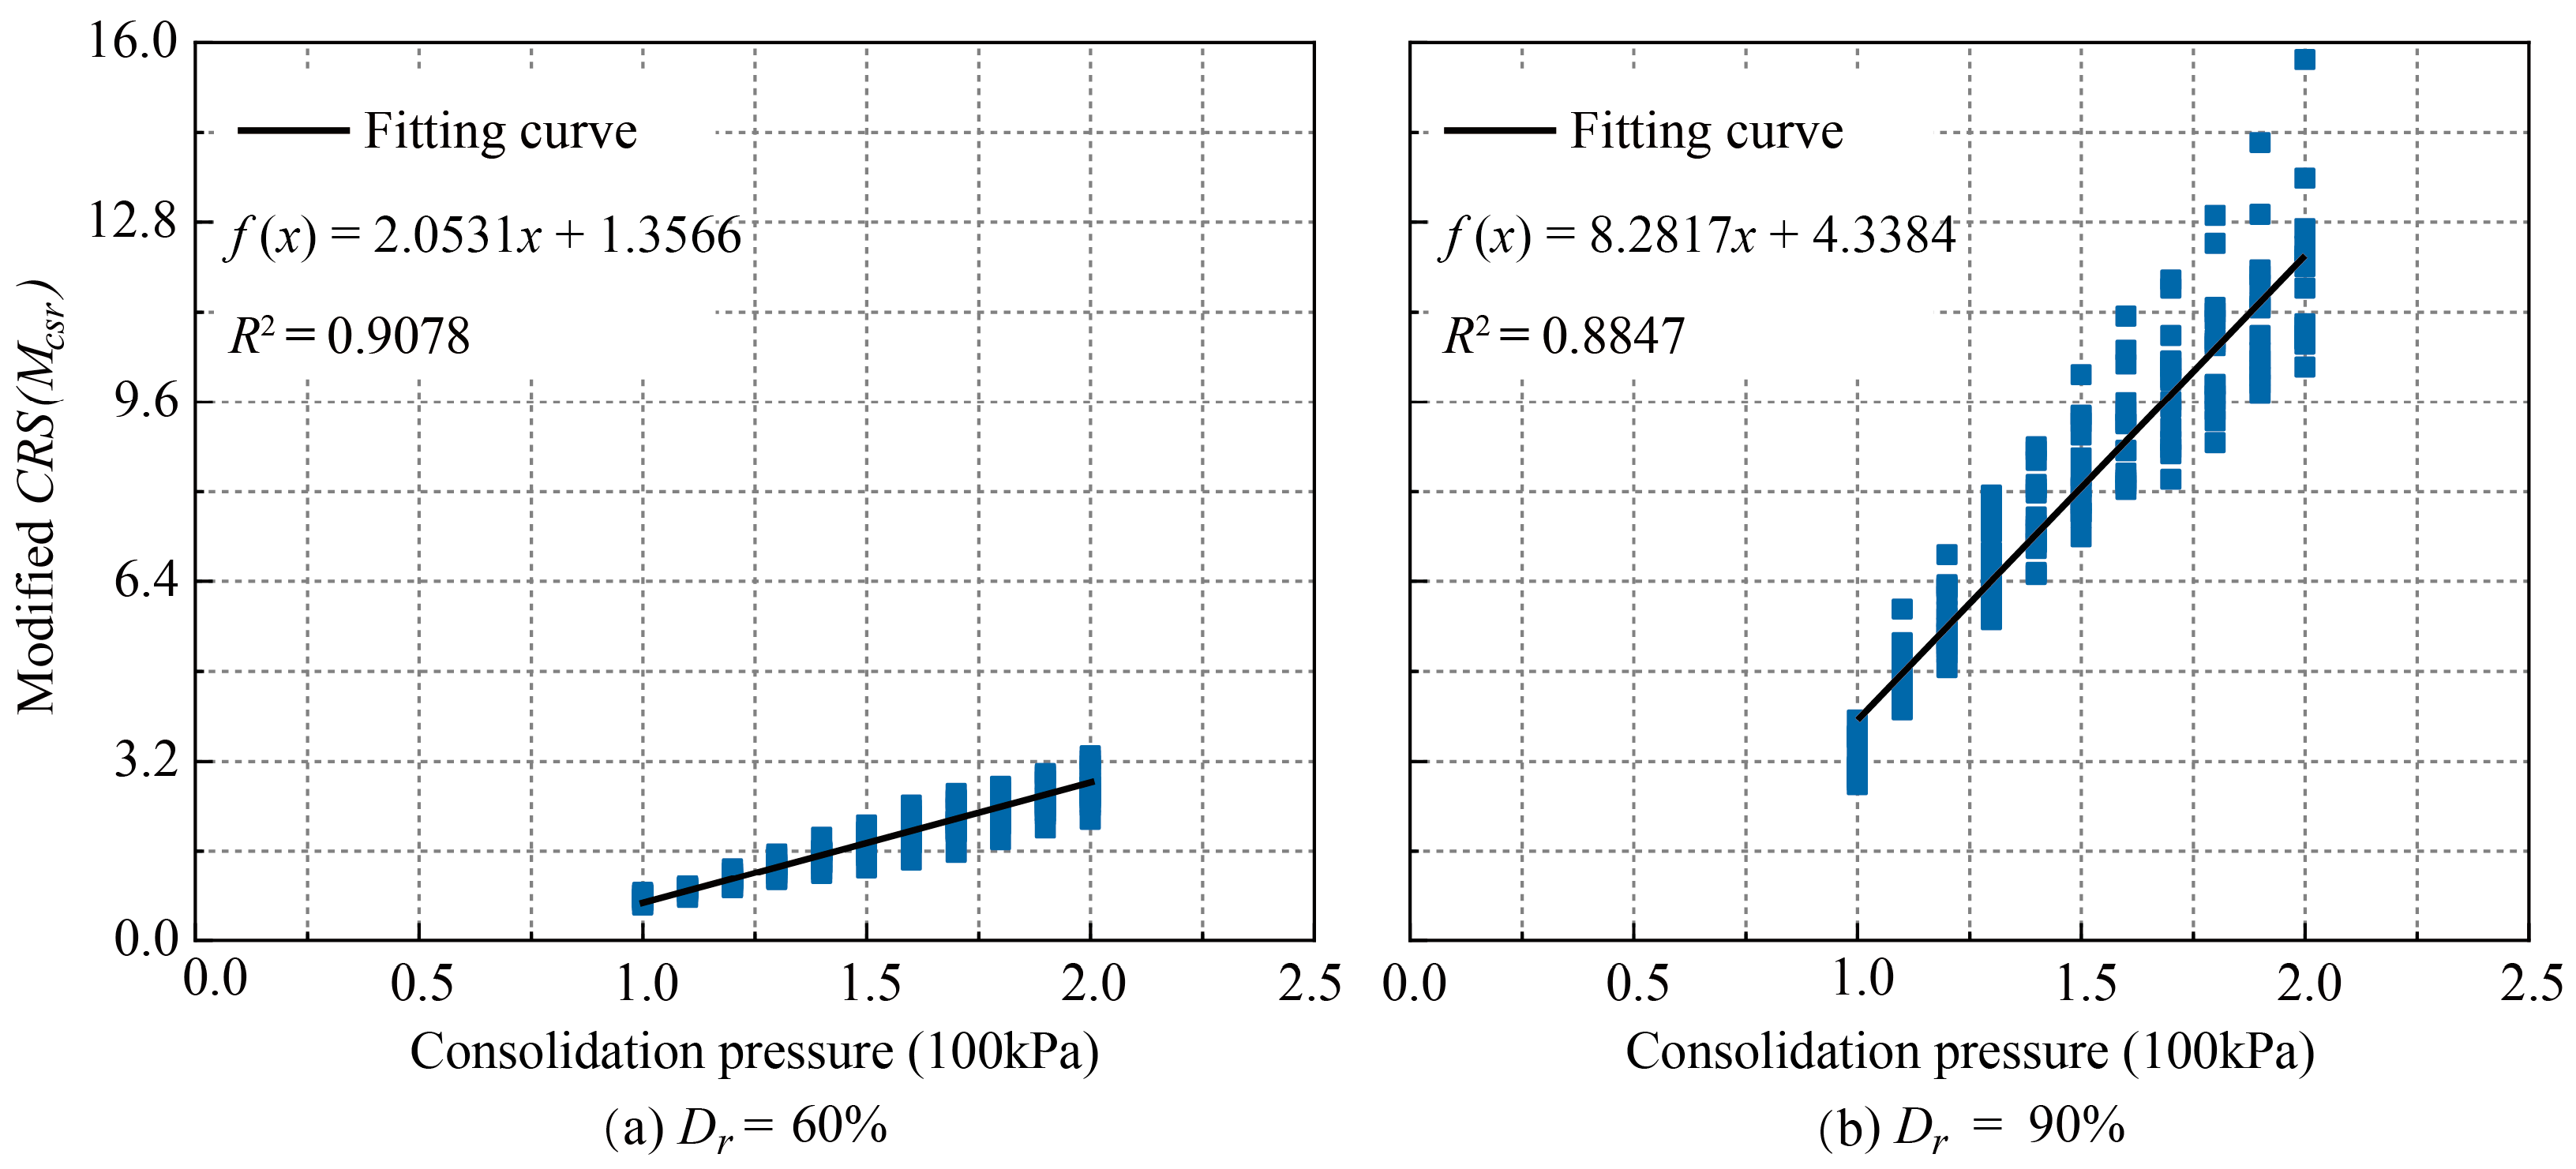
The relationship between the minimum Mcsr and the consolidation pressure ratio under different ground motions is presented in Figure 11 for saturated sand with differing densities. It is observed that the Mcsr required for the liquefaction of saturated sand increases linearly with the consolidation pressure ratio, indicating a strong linear correlation between these two variables, as depicted in Figure 11. In comparison to sand with a relative density of 60%, the Mcsr exhibited greater variability with increasing consolidation pressure ratio for sand with a relative density of 90%. The correlation coefficients for the sands with relative densities of 60% and 90% are 0.908 and 0.885, respectively. The relationships are expressed by the following equations:
(1)
For the Dr = 60%:
C S R × I a , 1.0 g 0.37 / T m 0.15 = 2.053 × k 0 1.357
The ratio of CSR at 1.0 to k0 serves as a parameter for assessing the impact of consolidation pressure on the pore water pressure model (kk0). The value of kk0 can be derived from Equation (23).
k σ 0 = C S R 100 / C S R k 0 = 8.282 × k 1.0 4.338 8.282 × k 0 4.338
(2)
For the Dr = 90%:
C S R × I a , 1.0 g 0.63 / T m 0.32 = 8.282 × k 0 4.338
The kk0 can be derived from Equation (25):
k k 0 = C S R 1.0 / C S R k 0 = 8.282 × k 1.0 4.338 8.282 × k 0 4.338
The CSR can be determined using Equation (27), which is derived from Equations (17), (19), (21), and (23) at different consolidation pressures and consolidation ratios for medium-dense sand. Similarly, the CSR can be calculated using the same methodology.
C S R 100 , 1.0 = C S R × k σ 0 × k k 0
Substituting Equation (27) into Equations (7), (9), (13), and (16) yields Equation (28), which incorporates the effects of consolidation pressure and consolidation ratio on the pore water pressure model, as well as the liquefaction criterion under different ground motions. Similarly, the pore water pressure model can be calculated using the same methodology.
(1)
For the Dr = 60%:
U d ( t ) = { [ 31.93 e 0.46 × C S R 1.793 × I a , 1.0 g 0.64 T m 0.51 31.93 ] I a ( t ) I a , max ( L i q u 0.8 ) L i q u I a ( t ) I a , max ( 0.8 < L i q u 1.0 ) I a ( t ) I a , max ( L i q u > 1.0 )
(2)
For the Dr = 90%:
U d ( t ) = { [ 31 e 1.44 × C S R 1.866 × I a , 1.0 g 0.78 T m 0.63 31 ] I a ( t ) I a , max ( L i q u 0.8 ) L i q u I a ( t ) I a , max ( 0.8 < L i q u 1.0 ) I a ( t ) I a , max ( L i q u > 1.0 )

2.5.3. Validation of the Pore Water Pressure Model

Figure 12 presents a comparison between the values obtained from the pore water pressure model introduced in this paper and those derived from the pore water pressure model proposed by Sun et al. [15], which is based on cyclic triaxial tests conducted on saturated Fujian standard sand. Additionally, it includes values calculated using the pore water pressure model developed by Sun et al. [15].
The pore water pressure model proposed in this study demonstrates a high degree of accuracy in predicting the pore water pressure of saturated dense and medium-dense Fujian standard sand. For saturated dense Fujian standard sand, the values generated by the proposed model are slightly lower than the experimental results; however, there is a strong overall correlation between the model’s predictions and the experimental data. Additionally, the model’s predictions regarding the initial liquefaction time align closely with the results obtained from physical testing. In the case of medium-dense Fujian standard sand, the values produced by the proposed model exhibit a commendable agreement with the experimental findings reported by Sun Rui, as well as with the model developed by Sun Rui [23]. Consequently, the pore water pressure model proposed in this paper is capable of accurately calculating the pore water pressure of saturated Fujian standard sand and is applicable for predicting pore water pressure under earthquake ground motions.

3. Liquefaction Potential Assessment Methodology

The soil units subjected to earthquake ground motions in both the free field and the undrained cyclic triaxial test are in a state of stress that is essentially identical. It is important to acknowledge that the soil in the free field is also influenced by its permeability, and the CSR remains undetermined at this stage. Consequently, it is essential to evaluate the impact of soil permeability on pore water pressure to accurately assess the potential for soil liquefaction and to derive the CSR.

3.1. Cyclic Stress Ratio

The cyclic stress ratio (CSR) is defined as CSR = τ/σv0, where τ is the dynamic shear stress and σv0 is the vertical effective stress in the soil. The vertical effective stress at varying depths within the free field can be determined by utilizing the effective bulk weight of the soil in conjunction with the depth. Consequently, it is only necessary to ascertain the dynamic shear stress within the soil to calculate the CSR.
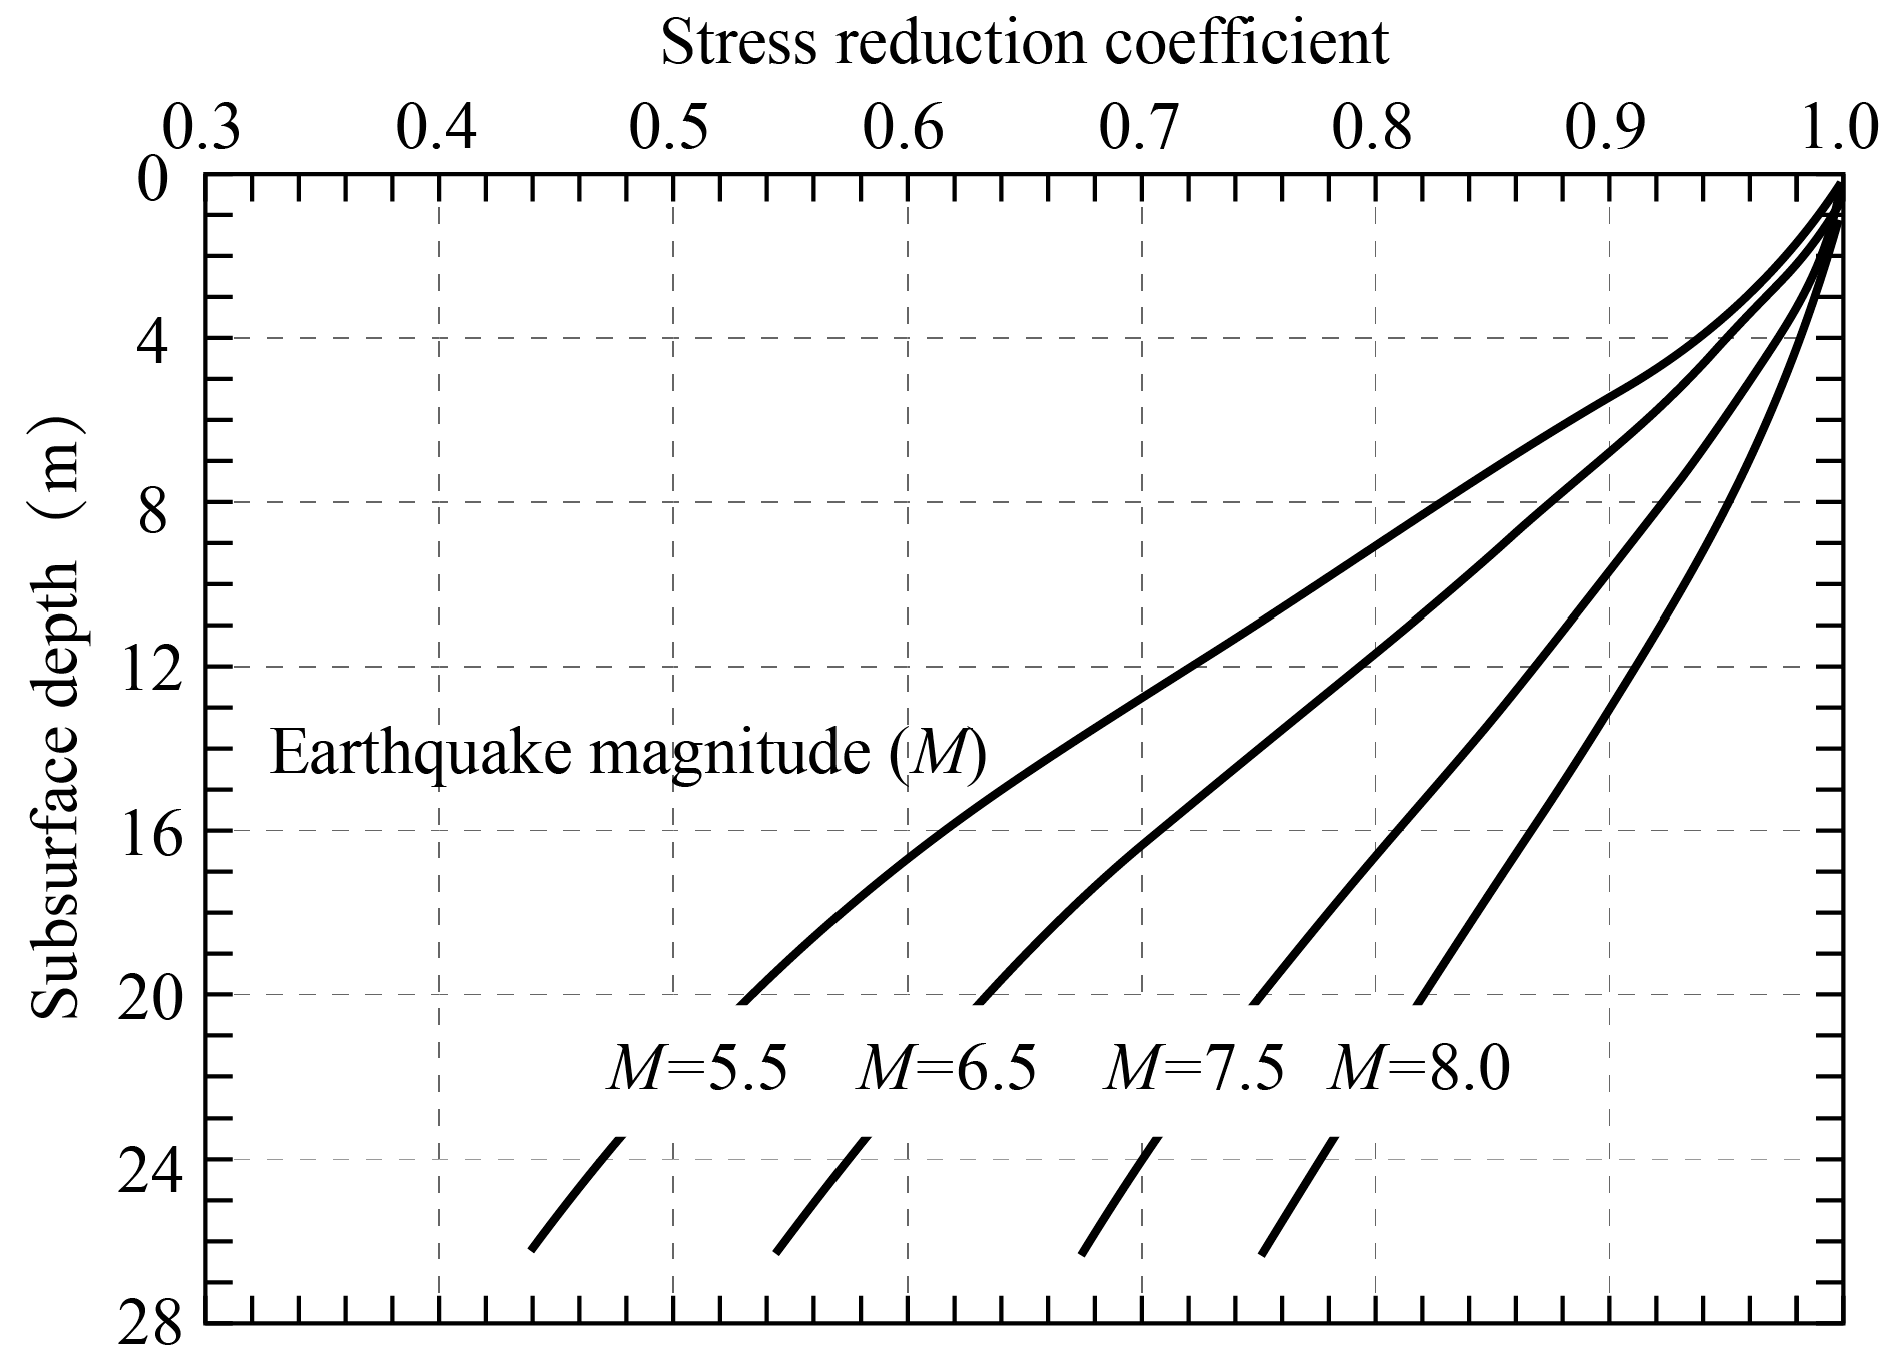
In this paper, the dynamic shear stress [24] at varying depths is calculated utilizing the shear stress reduction function in conjunction with the peak ground acceleration of the site (Equations (28) and (29)). To date, numerous models of the shear stress reduction function [25,26,27,28] have been proposed for different soil types. However, a limited number of shear stress reduction functions specifically designed for liquefaction sites exist. Based on the shear stress reduction function proposed by Golesorkhi et al. [24], Idriss et al. [25] developed a shear stress reduction function that is tailored to the unique characteristics of liquefied soil (Figure 13). In their study, Idriss et al. [25] emphasized that the shear stress reduction function is also influenced by both the depth of the soil and the magnitude of the earthquake. The relationship between the earthquake magnitude, depth, and the shear stress reduction function is articulated through Equations (30) and (31). The shear stress reduction function effectively accounts for the impacts of soil liquefaction, burial depth, and earthquake magnitude, thereby yielding more accurate predictive results.
τ = τ max , r × r d
τ max , r = ( γ 0 z g ) × a max = ( a max g ) × σ v 0
where τmax,r is the maximum acceleration at the surface of the rigid body, rd is the shear stress reduction function, z is the depth of the soil layer, γ0 is the effective bulk weight of the soil, and amax is the maximum acceleration at the surface.
r d = e α ( z ) + β ( z ) × M
α ( z ) = 1.012 1.126 sin ( z 11.73 + 5.133 )
β ( z ) = 0.106 + 0.118 sin ( z 11.28 + 5.142 )
In the equation, M is the magnitude of the earthquake, and the parameter within the sine term is expressed in radians. The maximum depth of the soil layer to which Equation (32) is applicable is 34 m. It is important to note that the uncertainty associated with the shear stress reduction function increases with depth; therefore, the maximum recommended depth for the shear stress reduction function proposed by Idriss et al. [25] is 20 m. The assessment of liquefaction in deep soils entails specific conditions, necessitating further detailed studies to appropriately adapt the shear stress reduction function [26].
The dynamic shear stress at the site is determined based on the maximum acceleration amplitude observed at the surface (Equation (32)). However, it is important to note that, due to the phenomenon of soil liquefaction, the peak ground acceleration at the surface of a liquefiable site is significantly lower than that at the surface of a non-liquefiable site when subjected to dynamic loading. Consequently, the peak ground acceleration at the surface is not an appropriate metric for evaluating the liquefaction potential of a liquefiable site. If the site conditions are known, this paper selects the total stress method (without considering the effect of pore water pressure [2]) for site response analysis to determine the peak ground acceleration at the surface of the liquefied site. If the site conditions are unknown, this paper selects the empirical relationship proposed by Idriss [25], which is applicable to certain soft soils, to calculate the peak ground acceleration at the surface of the liquefied site. The amplitude of the ground motion input in the model is adjusted by applying the stress reduction coefficient to account for its effects.

3.2. Effect of Free-Field Permeability Coefficients

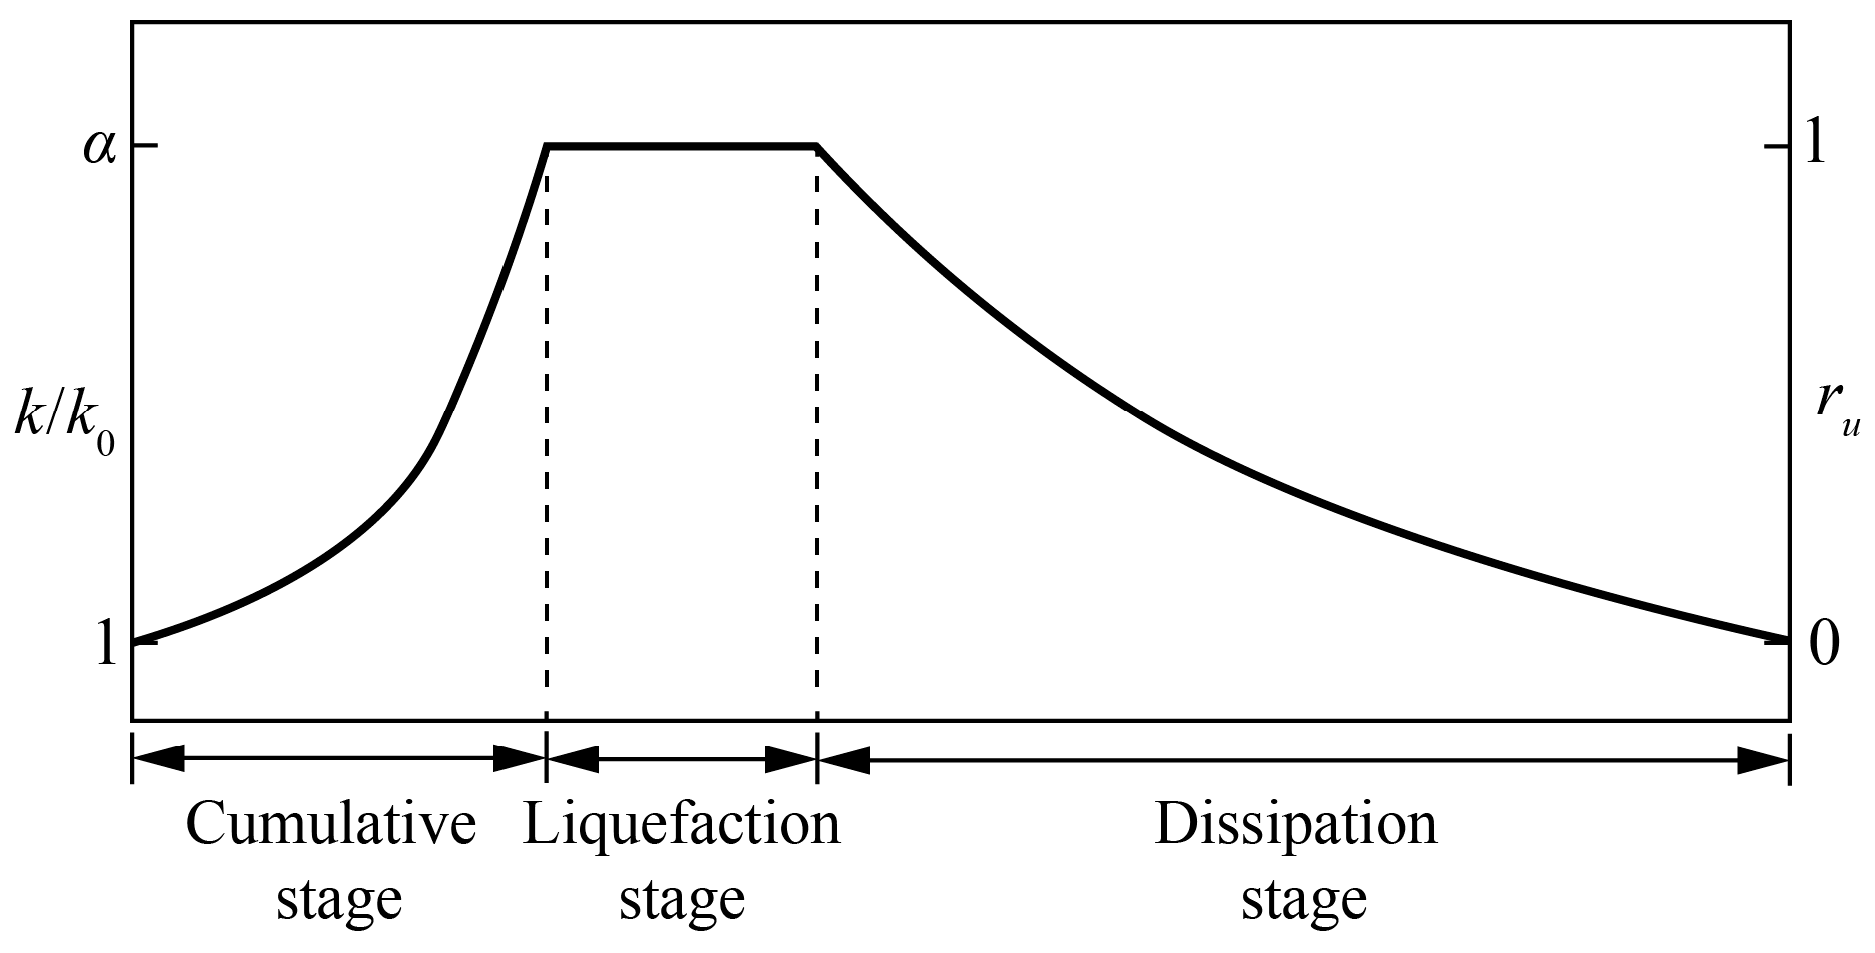
In the undrained triaxial test, the soil unit was in an undrained state; therefore, the influence of the permeability coefficient on the pore water pressure did not need to be considered. At the actual site, however, the soil unit is in a drained state, and the influence of the permeability coefficient must be considered when calculating the pore water pressure. Many researchers have found that the variable permeability coefficient can effectively improve the accuracy of numerical simulation compared to the fixed permeability coefficient [29,30,31]. For example, Shahir et al. [29] established the relationship between the permeability coefficient (k) and the excess pore water pressure ratio (ru) as shown in (Equation (35)). The accuracy of the numerical simulation for soil liquefaction was effectively improved by considering Equation (33). Therefore, the relationship between k and ru is widely used [32,33] in numerical simulations of soil liquefaction.
Therefore, in this study, the variable permeability coefficient model proposed by Shahir et al. [29] is employed to consider the influence of the permeability coefficient on the pore water pressure model (Figure 14). Furthermore, the dissipation stage of pore water pressure is not included in the assessment of liquefaction potential. This omission is justified by the observation that the liquefaction of soil or the pore water pressure reaches its maximum value prior to the dissipation stage, which does not impact the peak value of the pore water pressure. In the cumulation stage, the pore water pressure model is integrated into the permeability coefficient equation to formulate a revised pore water pressure model that incorporates the effects of the permeability coefficient. Subsequently, during the liquefaction stage, the reduction in pore water pressure resulting from the permeability coefficient is directly deducted from the established pore water pressure model. Consequently, this paper establishes a method for assessing liquefaction potential based on the energy pore water pressure model, focusing solely on the cumulative stage of pore water pressure and the liquefaction stage. The model parameters were selected in accordance with reference [31], with values of α = 20 and β1 = 2. Additionally, the initial permeability coefficients for saturated Fujian standard sand were set at 0.001 and 0.0001 for relative densities of 60% and 90%, respectively.
k k 0 = { 1 + ( α 1 ) r u β 1 ,   r u < 1.0 ,   cumulation   phase α ,   r u < 1.0 ,   liquefaction   phase 1 + ( α 1 ) r u β 2 ,   r u < 1.0 ,   dissipation   phase
where k0 is the initial permeability coefficient, and α, β1, β2 are the model parameters.

3.3. Validation and Application of Liquefaction Risk Assessment Methodology

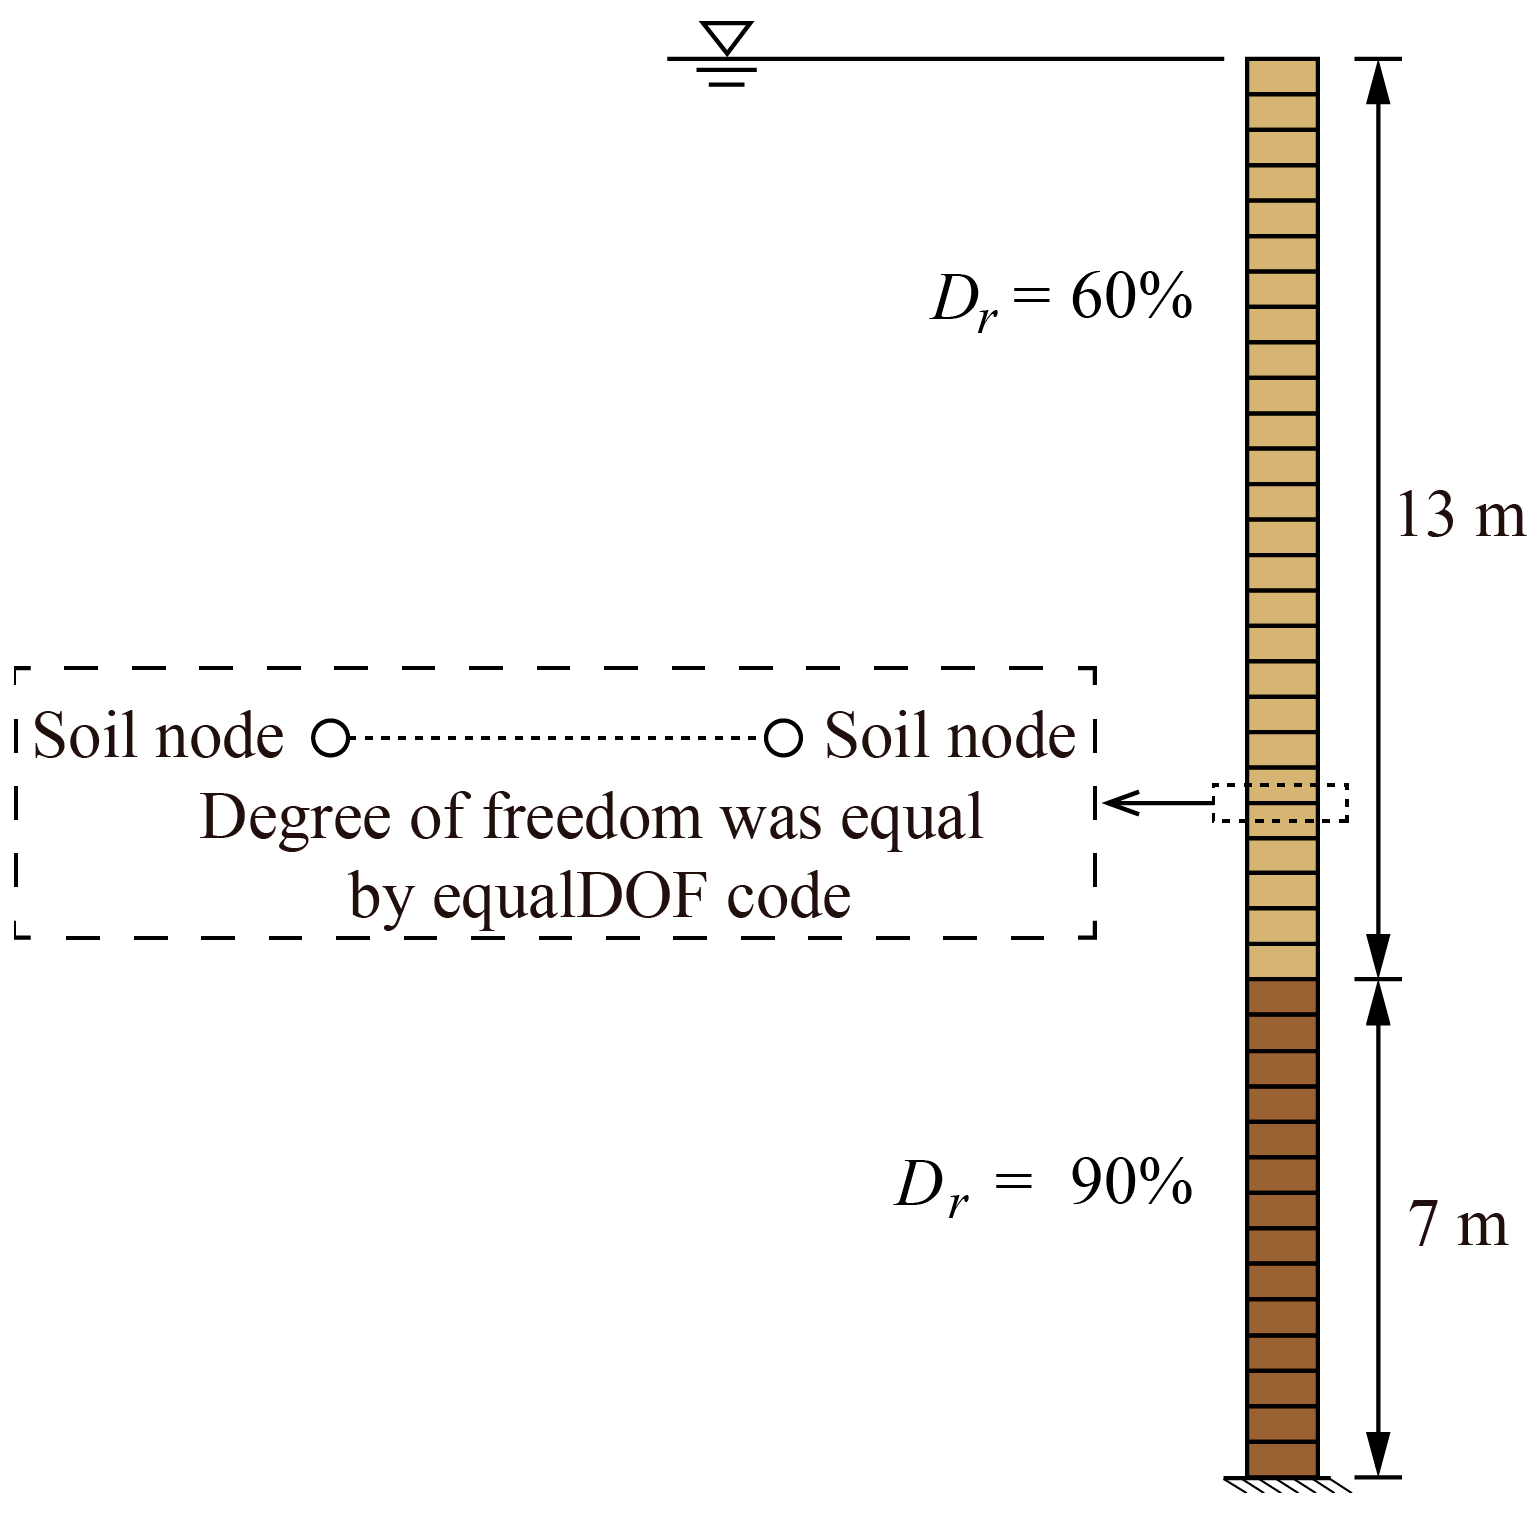
The centrifuge shaking table test, along with numerical simulations, are employed to validate the liquefaction potential assessment method developed based on the energy pore water pressure model. The far-field distance from structures was applied to validate the method in the centrifuge shaking test [34]. In the centrifuge shaking table test, the upper soil layer consists of saturated Fujian standard sand with a relative density of 60% and a thickness of 13 m, while the lower soil layer comprises saturated Fujian standard sand with a relative density of 90% and a thickness of 7 m. For more detailed information, please refer to reference [34]. The OpenSees software was utilized to construct a free-field model of the soil layer corresponding to the centrifuge shaking table test prototype, as illustrated in Figure 15. The soil unit and parameters used in the numerical simulation are consistent with those employed in the two-way dynamic triaxial numerical tests.
The bottom of the free-field model is fixed to facilitate the application of dynamic loads. Nodes of soil units that share the same horizontal elevation are constrained using a penalty function to establish periodic boundaries, thereby simulating an effectively infinite free field [21,22]. The top surface of the model is designed to be permeable, while the remaining boundaries are characterized as impermeable.
Figure 16 presents a comparison between the calculated values derived from the energy pore water pressure model and the results obtained from the centrifuge shaking table test as well as numerical simulations. The energy pore water pressure model demonstrates the capability to effectively calculate the excess pore water pressure ratio of saturated Fujian standard sand at varying depths subjected to Taft wave with acceleration of 0.13 g. The model exhibits a higher accuracy in predicting the variation of the excess pore water pressure ratio when the burial depth of the soil is relatively shallow. However, as the burial depth increases, the model tends to predict the initial liquefaction time to occur later than that observed in the centrifuge tests and numerical simulations.
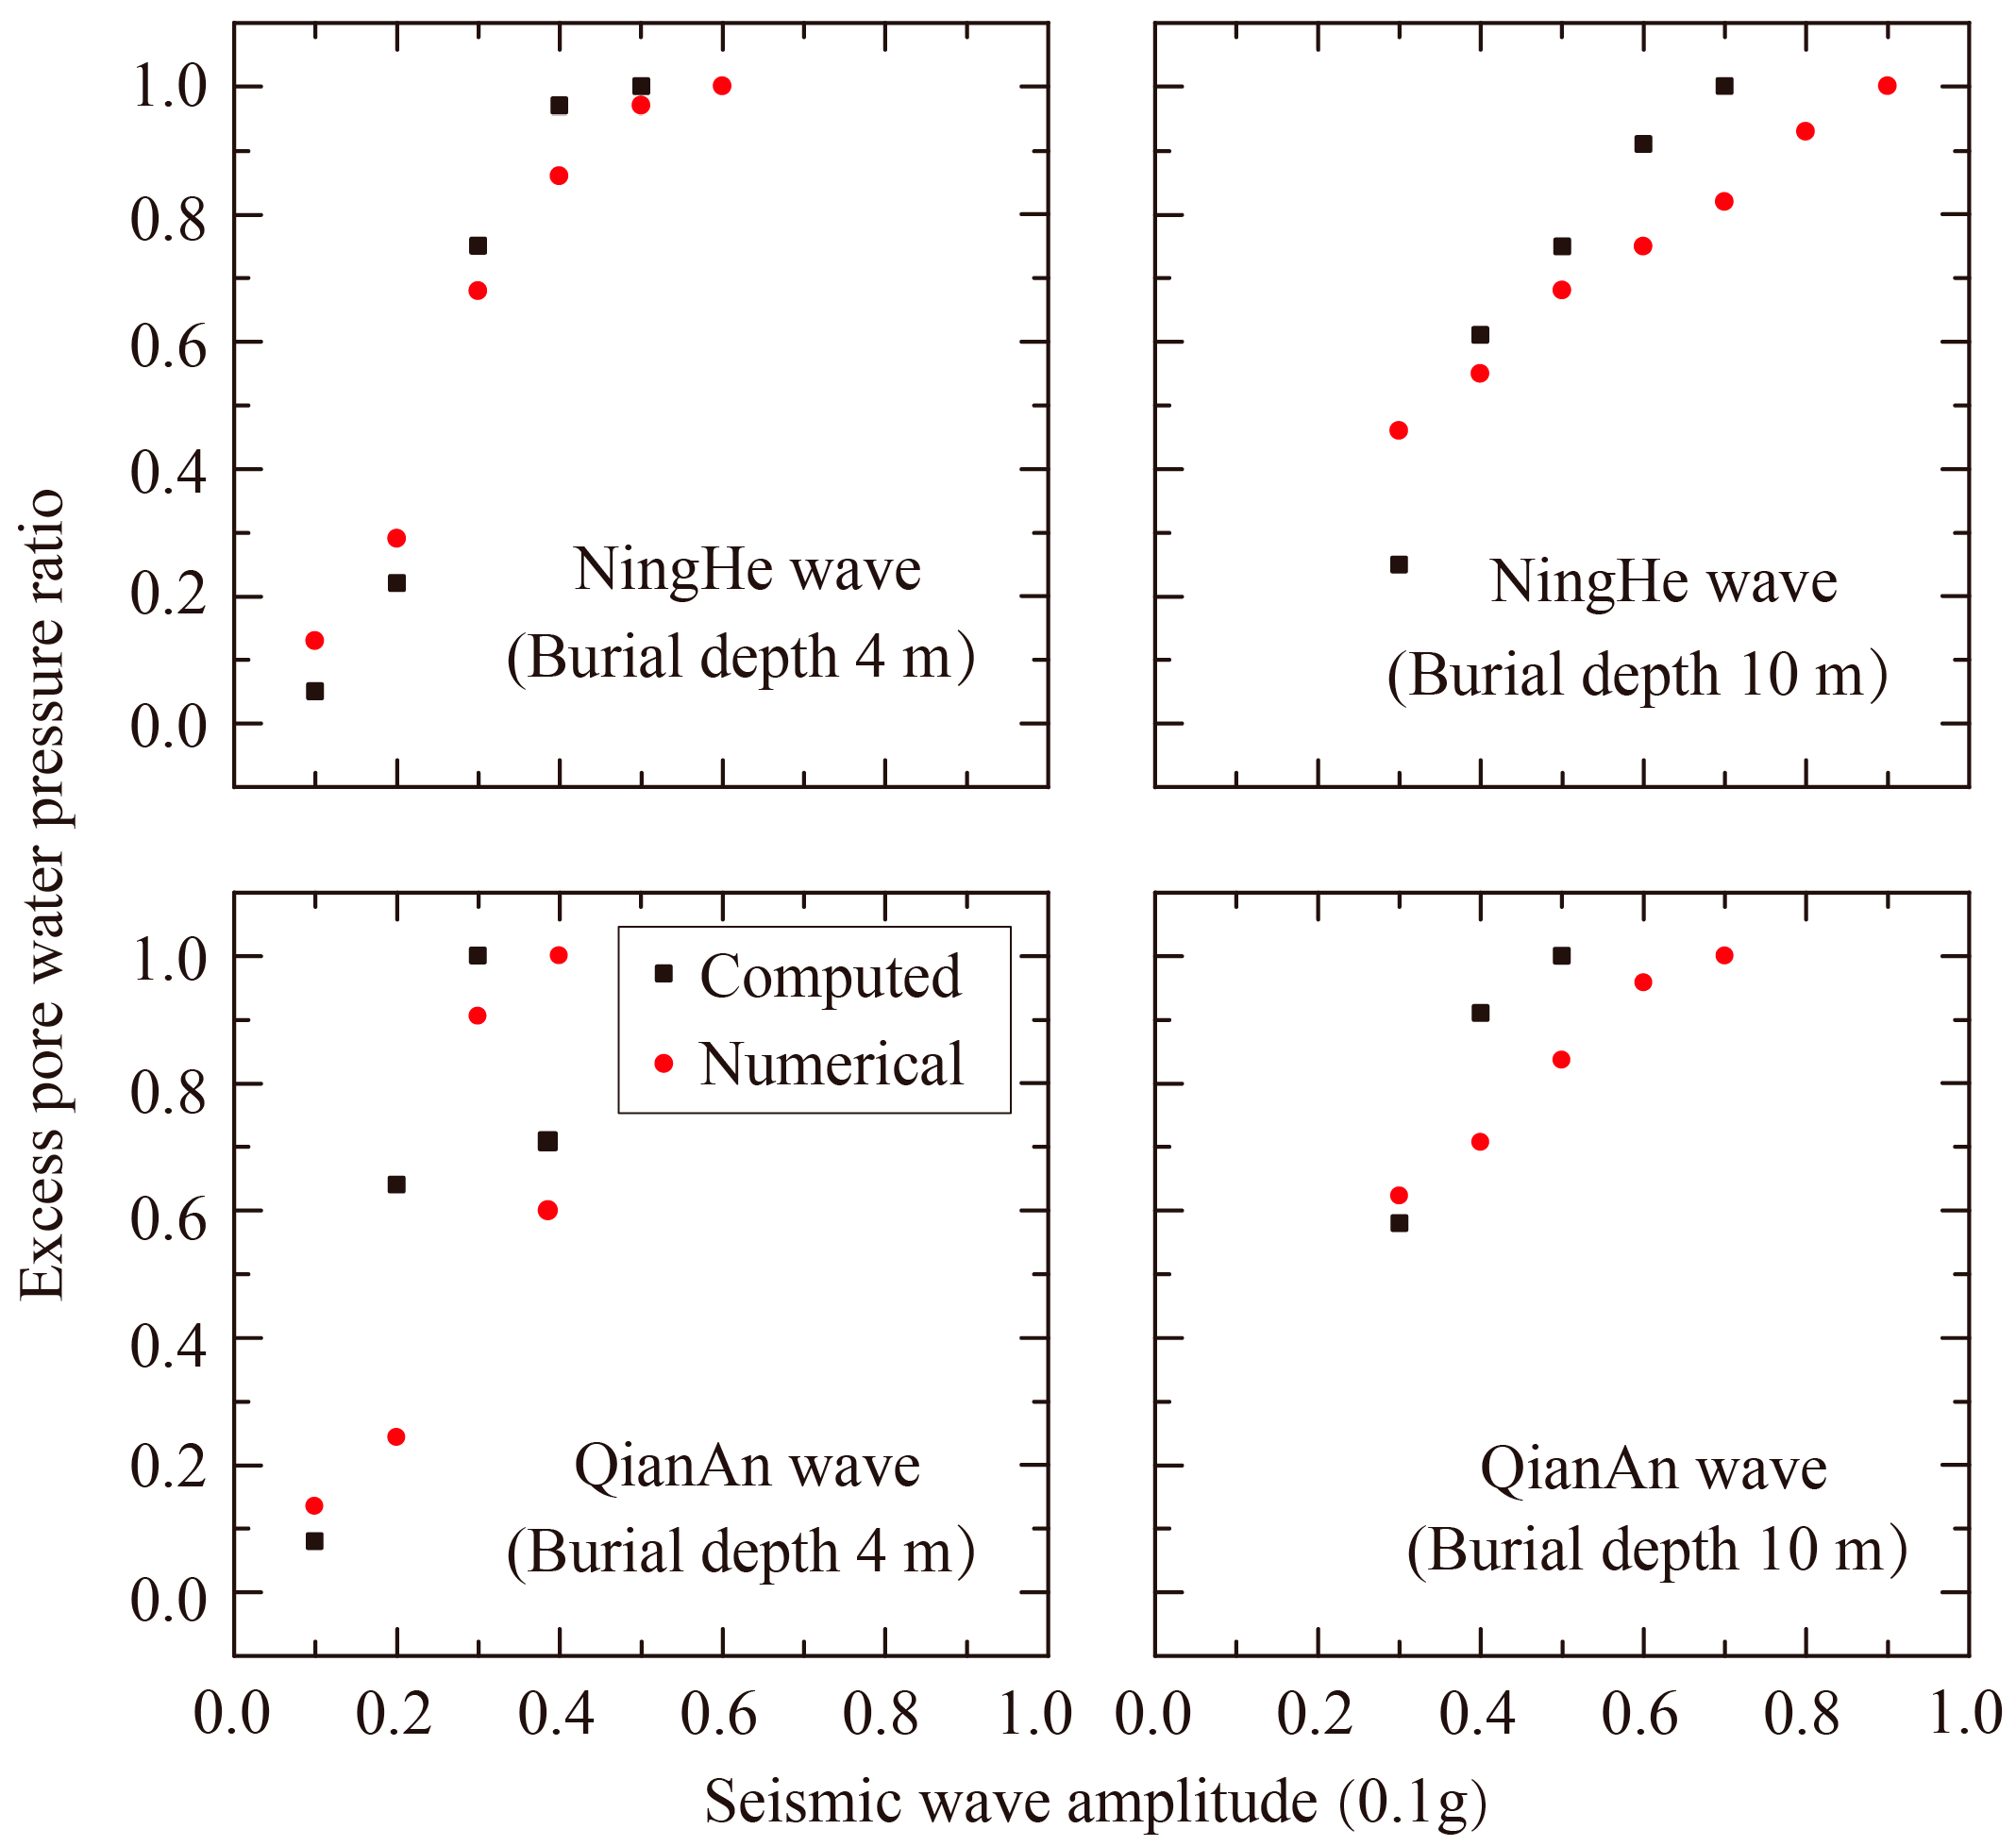
Figure 17 shows the comparison between the calculated and numerically simulated maximum excess pore water pressure ratios at burial depths of 4 m and 10 m, subjected to varying amplitudes of the Ninghe and Qian’an ground motions.
At a burial depth of 4 m, the calculated values derived from the pore water pressure model developed in this study align closely with the numerical simulation results. This congruence suggests that the model is capable of accurately predicting excess pore water pressure in soil at shallower depths, thereby facilitating the assessment of liquefaction potential in such contexts. Conversely, at a burial depth of 10 m, the calculated values from the energy pore water pressure model, influenced by ground motions, exceed the numerical simulation values. This discrepancy indicates that the energy pore water pressure model proposed in this research adopts a more conservative approach in predicting excess pore water pressure at greater depths, which aligns with the requirements for engineering assessments.

4. Conclusions

In this paper, OpenSees software is employed to simulate bi-directional dynamic triaxial tests aimed at investigating the relationship between the pore water pressure of saturated Fujian standard sand and the Arias intensity of ground motion. Additionally, a novel energy-based pore water pressure model is developed, incorporating the influences of the permeability coefficient, reduction coefficient, waveform, and various other factors to improve and enhance its precision. A methodology for assessing the liquefaction potential of saturated Fujian standard sand is proposed based on the model. The principal conclusions drawn from this research are as follows:
(1)
The results of bi-directional dynamic triaxial tests showed that there was a significant correlation between the accumulation of pore water pressure and the Arias intensity of ground motion in the saturated sand. Additionally, the mean period of the ground motion and the cyclic stress ratio also influence this relationship.
(2)
The consolidation pressure and the consolidation ratio of the test significantly influence the modeling of pore water pressure. As both the consolidation pressure and the consolidation ratio increase, the liquefaction resistance of the soil mass exhibits a linear increase.
(3)
A novel energy pore water pressure model has been developed based on the results of bi-directional dynamic triaxial tests. The model is capable of accurately predicting the accumulation characteristics of pore water pressure observed during cyclic triaxial tests conducted on dense and medium-dense saturated Fujian standard sand. As the relative density increases, the sand liquefaction potential decreases, making the sand less likely to approach liquefaction.
(4)
A methodology for assessing the liquefaction potential has been developed based on the energy pore water pressure model. This method demonstrates enhanced accuracy in predicting the maximum excess pore water pressure ratio of the soil with a shallow burial depth of 4 m. Conversely, the assessment method tends to be conservative when applied to soil bodies with a greater burial depth of 10 m.
To gain a comprehensive understanding of the sand liquefaction potential, upcoming scientific studies will concentrate on clarifying how particle gradation and different types of sand influence sand liquefaction potential. The discrete element method could be an appropriate approach for future research topics.

Author Contributions

Conceptualization, Q.C.; methodology, J.Z.; software, J.Z.; validation, J.Z. and Y.L.; data curation, H.F. and M.D.; writing—original draft preparation, J.Z.; writing—review and editing, J.Z., J.W., Y.W. and Q.C.; supervision, Q.C. All authors have read and agreed to the published version of the manuscript.

Funding

This research was funded by several funding sources, including the Natural Science Foundation of Xinjiang Uygur Autonomous Region (grant number 2022D01F38), the Research Foundation of China University of Petroleum-Beijing at Karamay (grant number XQZX20220007), the “Tianchi Talent” Introduction Plan (grant number 2021592120), the Xinjiang Tianshan Innovation Team for Research and Application of High-Efficiency Oil and Gas Pipeline Transportation Technology (grant number 2022TSYCTD0002), and the National Natural Science Foundation of China (grant numbers 41530639, 42007247, and 41761144080).

Institutional Review Board Statement

Not applicable.

Informed Consent Statement

Not applicable.

Data Availability Statement

Data is available upon reasonable request.

Acknowledgments

The authors extend their sincere appreciation to Elgamal from the Department of Structural Engineering, University of California, San Diego, for his valuable guidance in developing numerical models.

Conflicts of Interest

Author Yan Li was employed by Chengdu Surveying Geotechnical Research Institute Co., Ltd. of MCC. The remaining authors declare that the research was conducted in the absence of any commercial or financial relationships that could be construed as a potential conflict of interest.

References

  1. Hamada, M. Large Ground Deformations and Their Effects on Lifelines: 1964 Niigata Earthquake. In Case Studies of Liquefaction and Lifelines Performance During Past Earthquake; Technical Report NCEER-92-0001; National Centre for Earthquake Engineering Research: Buffalo, NY, USA, 1992. [Google Scholar]
  2. Youd, T.L.; Driss, I.M. Liquefaction Resistance of Soils: Summary Report from the 1996 NCEER and 1998 NCEER/NSF Workshops on Evaluation of Liquefaction Resistance of Soils. J. Geotech. Geoenviron. Eng. 2001, 127, 297–313. [Google Scholar] [CrossRef]
  3. Seed, H.B.; Idriss, I.M. Simplified procedure for evaluating soil liquefaction potential. J. Soil Mech. Found. 1971, 97, 1249–1274. [Google Scholar] [CrossRef]
  4. Dobry, R.; Ladd, R.S.; Yokel, F.Y.; Chung, R.M.; Powell, D. Prediction of Pore Water Pressure Buildup and Liquefaction of Sands During Earthquakes by the Cyclic Strain Method; National Bureau of Standards Building Science Series; US Department of Commerce: Washington, DC, USA, 1982; Volume 138.
  5. Davis, R.O.; Berrill, J.B. Pore pressure and dissipated energy in earthquakes-field verification. J. Geotech. Geoenviron. Eng. 2001, 127, 269–274. [Google Scholar] [CrossRef]
  6. Fardad, A.P.; Noorzad, R. Energy-based evaluation of liquefaction of fiber-reinforced sand using cyclic triaxial testing. Soil Dyn. Earthq. Eng. 2018, 104, 45–53. [Google Scholar] [CrossRef]
  7. Nemat-Nasser, S.; Shokooh, A. A unified approach to densification and liquefaction of cohesionless sand in cyclic shearing. Can. Geotech. J. 1979, 16, 659–678. [Google Scholar] [CrossRef]
  8. Towhata, I.; Ishihara, K. Shear work and pore water pressure in untrained shear. Soils Found. 1985, 25, 73–84. [Google Scholar] [CrossRef] [PubMed]
  9. Law, K.T.; Cao, Y.L.; He, G.N. An energy approach for assessing seismic liquefaction potential. Can. Geotech. J. 1990, 27, 320–329. [Google Scholar] [CrossRef]
  10. Xie, D.Y.; Wu, Z.H. Effect of irregular dynamic impulse history on liquefaction characteristics of saturated sand. Chin. J. Rock Mech. Eng. 1987, 9, 1–12. [Google Scholar]
  11. Meng, S.J.; Liu, T.H. Study of pore-pressure model of saturated sands under irregular load. Chin. J. Rock Mech. Eng. 2014, 33, 3050–3055. [Google Scholar]
  12. Wang, T.S.; Lin, Y.; Tong, J.; Qin, X. Generation and dissipation of pore pressure in saturated sand layer due to earthquake loading. Chin. J. Geotech. Eng. 1983, 5, 87–102. [Google Scholar]
  13. Fu, H.Q. An Approach of Dynamic In-Situ Liquefaction Test and Characteristics of Liquefaction Soil. Ph.D. Thesis, Institute of Engineering Mechanics, Harbin, China, 2016. [Google Scholar]
  14. Sun, R. Study on Seismic Ground Motion on Liquefiable Soil Layer and Site Liquefaction Detection. Ph.D. Thesis, Institute of Engineering Mechanics, Harbin, China, 2006. [Google Scholar]
  15. Arias, A. A measure of earthquake intensity. In Seismic Design for Nuclear Power Plants; Hansen, R.J., Ed.; MIT Press: Cambridge, MA, USA, 1970. [Google Scholar]
  16. Mazzoni, S.; McKenne, F.; Scott, M.; Fenves, G. Open System for Earthquake Engineering Simulation User Manual Version 2.1.0; University of California, Pacific Earthquake Engineering Center: Berkeley, CA, USA, 2009. [Google Scholar]
  17. McGann, C.R.; Arduino, P.; Mackenzie-Helnwein, P. Stabilized single-point 4-node quadrilateral element for dynamic analysis of fluid saturated porous media. Acta Geotech. 2012, 7, 297–311. [Google Scholar] [CrossRef]
  18. Zienkiewicz, O.C.; Shiomi, T. Dynamic behavior of saturated porous media: The generalized Biot formulation and its numerical solution. Int. J. Numer. Anal. Met. 1984, 8, 71–96. [Google Scholar] [CrossRef]
  19. Biot, M.A. Theory of elasticity and consolidation for a porous anisotropic solid. J. Appl. Phys. 1955, 26, 182–185. [Google Scholar] [CrossRef]
  20. Elgamal, A.; Yang, Z.H.; Parra, E. Computational modeling of cyclic mobility and post-liquefaction site response. Soil Dyn. Earthq. Eng. 2002, 22, 259–271. [Google Scholar] [CrossRef]
  21. Yang, Z.H.; Elgamal, A.; Parra, E. Computational model for cyclic mobility and associated shear deformation. J. Geotech. Geoenviron. Eng. 2003, 129, 1119–1127. [Google Scholar] [CrossRef]
  22. Zhang, J.L.; Cheng, Q.G.; Li, Y.; Qiu, Y.; Wang, Y.; Wu, J. Performance of rectangular closed diaphragm walls in gently sloping liquefiable deposits subjected to different earthquake ground motions. Earthq. Eng. Eng. Vib. 2021, 20, 905–923. [Google Scholar] [CrossRef]
  23. Zhang, J.L.; Cheng, Q.G.; Li, Y.; Zhang, E.M.; Wang, Y.F.; Wu, J.J.; Xie, S.Y. Mechanism of liquefaction mitigation by rectangular closed diaphragm walls in sloping liquefiable deposits. Soil Dyn. Earthq. Eng. 2021, 142, 106582. [Google Scholar] [CrossRef]
  24. Golesorkhi, R. Factors Influencing the Computational Determination of Earthquake-Induced Shear Stresses in Sandy Soils. Ph.D. Thesis, University of California, Berkeley, CA, USA, 1989. [Google Scholar]
  25. Idriss, I.M.; Boulanger, R.W. Semi-empirical procedures for evaluating liquefaction potential during earthquakes. Soil Dyn. Earthq. Eng. 2006, 26, 115–130. [Google Scholar] [CrossRef]
  26. Wang, K.; Sun, R.; Yuan, X.M. Influence factors and formula for dynamic stress reduction coefficient. Chin. J. Rock Mech. Eng. 2018, 37, 177–189. [Google Scholar]
  27. Idriss, I.M. Earthquake ground motions at soft soil sites. In Proceedings of the Second International Conference on Recent Advances in Geotechnical Earthquake Engineering & Soil Dynamics, St. Louis, MO, USA, 11–15 March 1991; Volume 3, pp. 2265–2271. [Google Scholar]
  28. Seed, R.B.; Dickenson, S.E.; Mok, C. Site effects on strong shaking and seismic risk: Recent developments and their impact on seismic design codes and practice. In Structures Congress XII 1994; ASCE: New York, NY, USA, 1994; Volume 1, pp. 573–578. [Google Scholar]
  29. Shahir, H.; Mohammadi-Haji, B.; Ghassemi, A. Employing a variable permeability model in numerical simulation of saturated sand behavior under earthquake loading. Comput. Geotech. 2014, 55, 211–223. [Google Scholar] [CrossRef]
  30. Arulanandan, K.; Sybico, J.; Schofield, A.N. Post-liquefaction settlement of sands. In Proceedings of the Wroth Memorial Symposium, Oxford, UK, 27–29 July 1992. [Google Scholar]
  31. Taiebat, M.; Shahir, H.; Pak, A. Study of pore pressure variation during liquefaction using two constitutive models for sand. Soil Dyn. Earthq. Eng. 2007, 27, 60–72. [Google Scholar] [CrossRef]
  32. Wang, Y.; Gao, G.Y.; Gu, X.Q.; Song, J. A numerical study of the influence of permeability coefficient on the liquefaction-induced settlement of sands. Rock Soil Mech. 2017, 38, 1813–1818. [Google Scholar]
  33. Rahmani, A.; Ghasemi, F.O.; Pak, A. Investigation of the influence of permeability coefficient on the numerical modeling of the liquefaction phenomenon. Sci. Iran. 2012, 19, 179–187. [Google Scholar] [CrossRef]
  34. Li, Y.; Cheng, Q.G.; Zhang, J.L.; Lyu, B.; Wang, Y.F.; Wu, J.J. Seismic behavior of rectangular closed diaphragm walls serving as bridge foundations in gently sloping liquefiable deposit: Dynamic centrifuge tests. J. Geotech. Geoenviron. Eng. 2019, 145, 04019105. [Google Scholar] [CrossRef]
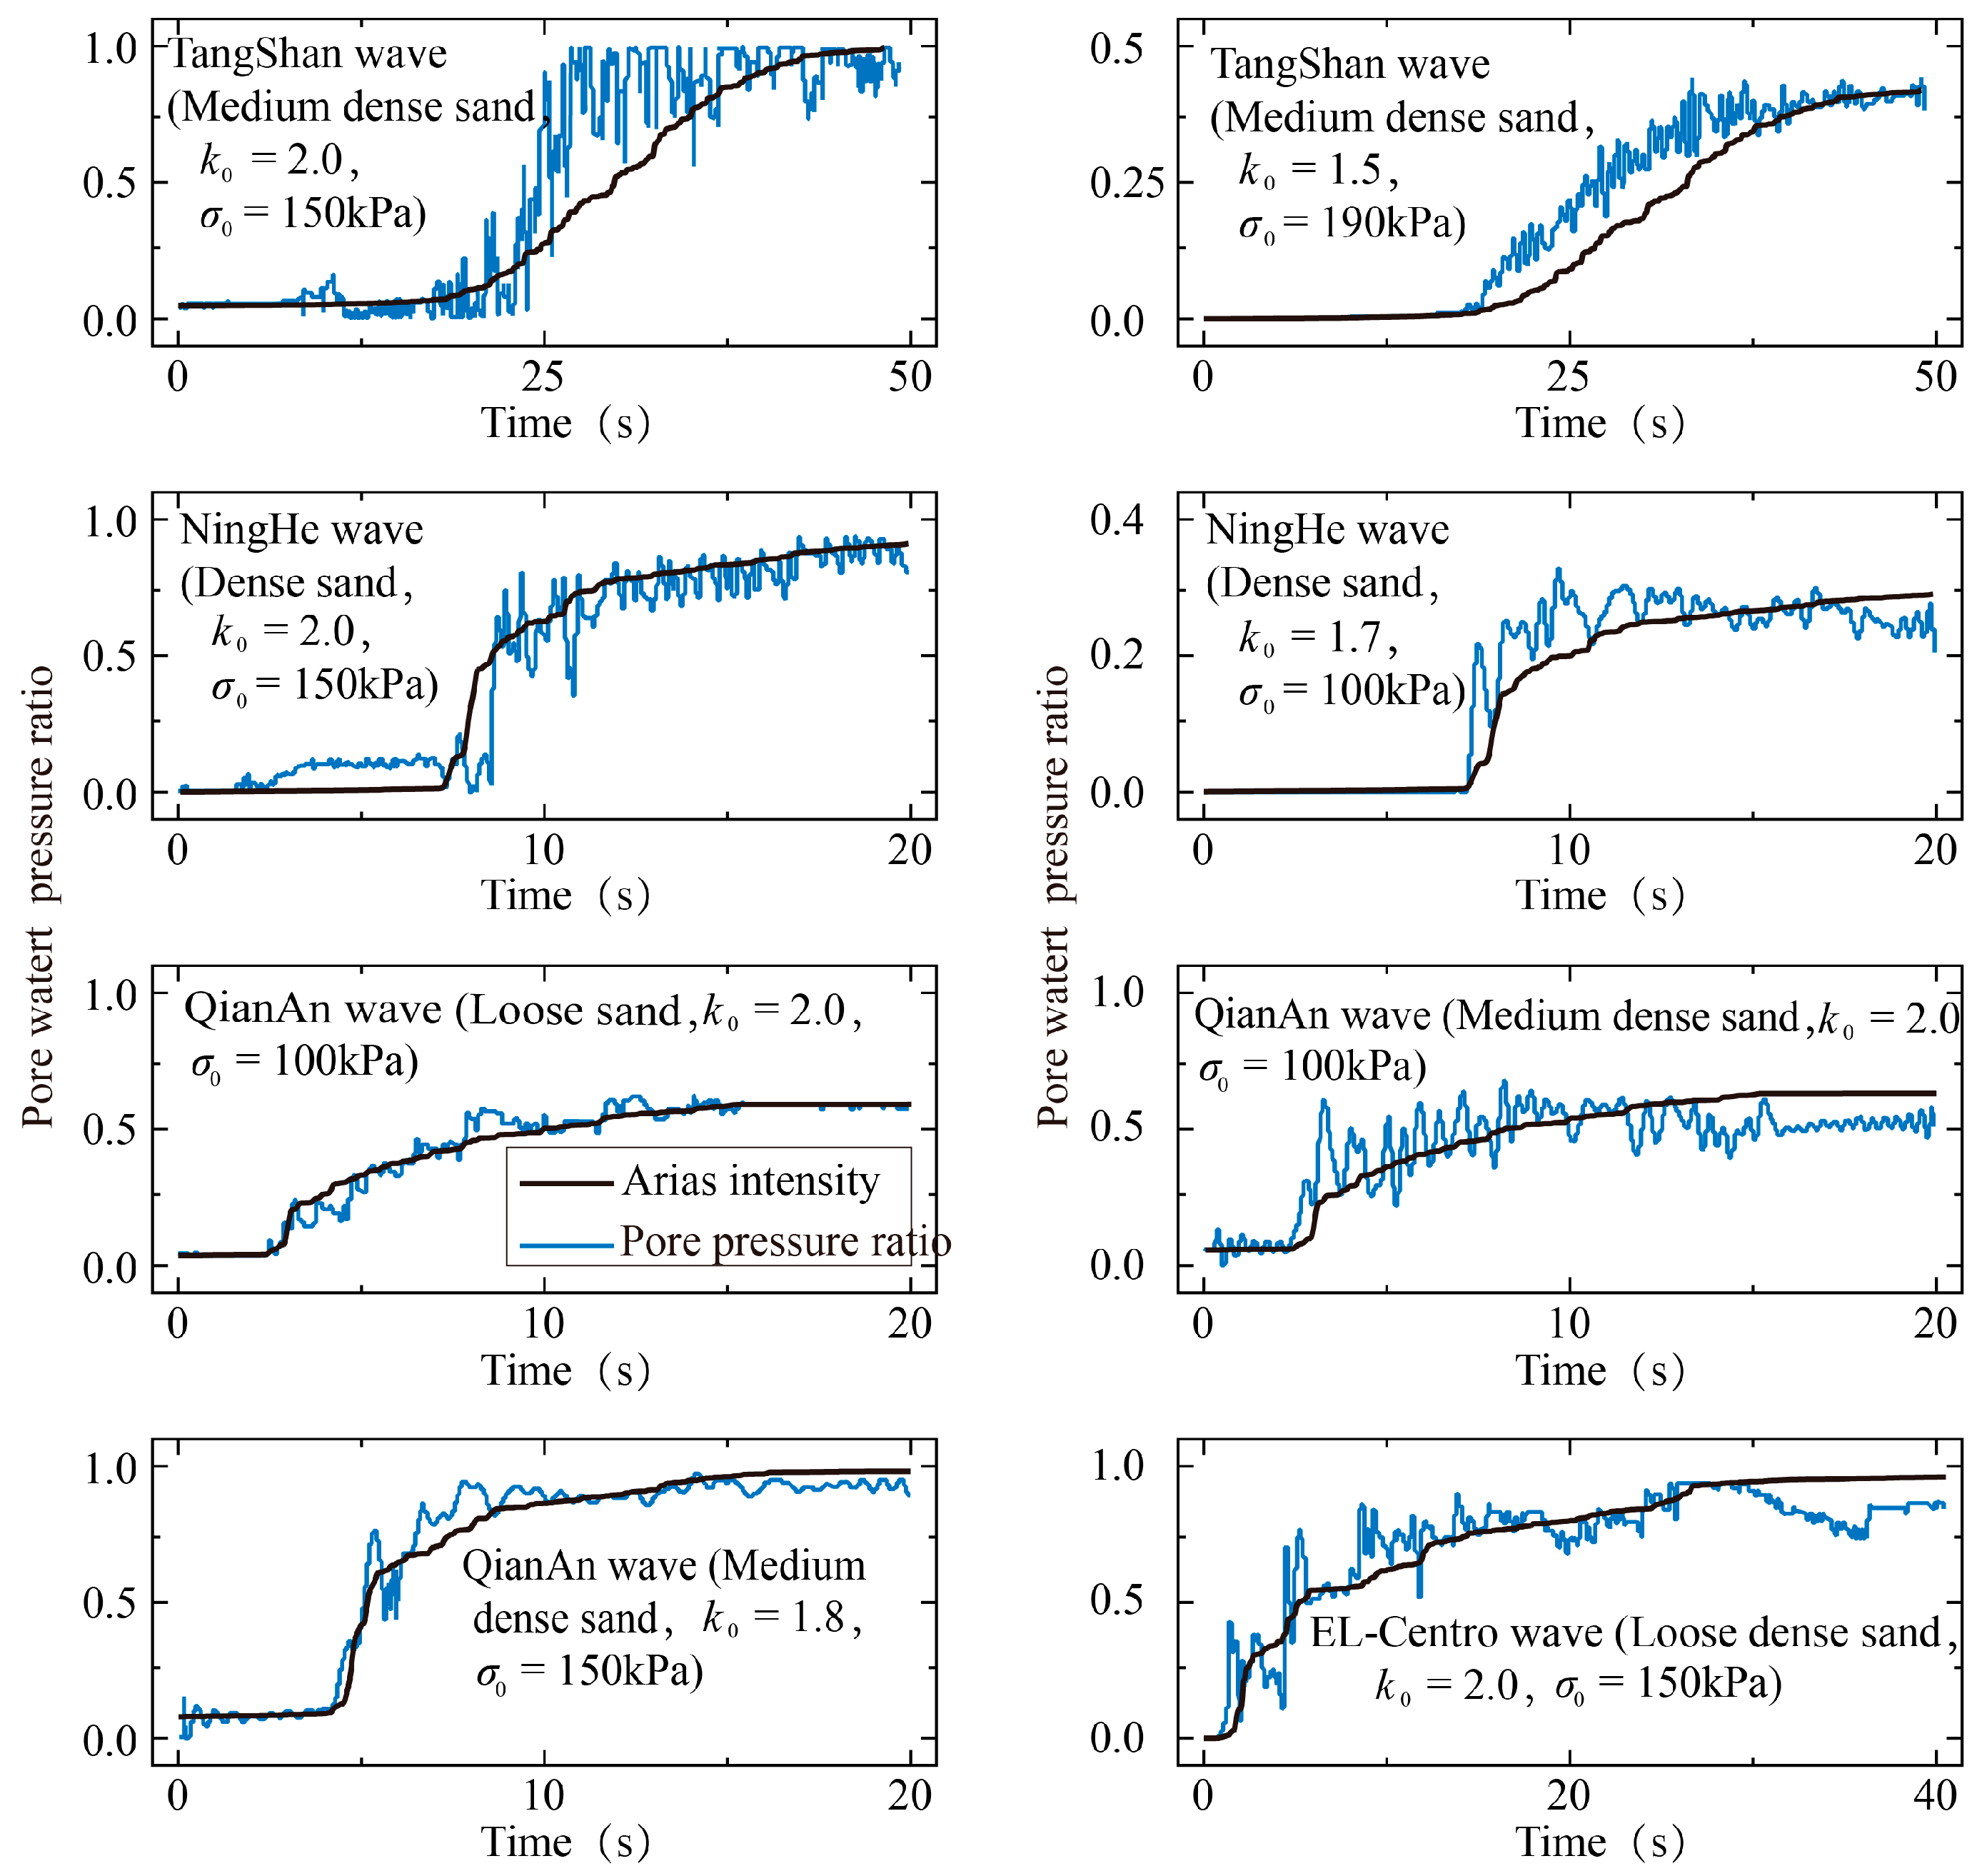
Figure 1. Relationship between excess pore pressure ratio and Arias intensity (Ia).
Coatings 15 00007 g001
Figure 2. Stress conditions of soil element under earthquake.
Coatings 15 00007 g002
Figure 3. Stress conditions of soil element in two-directional cyclic triaxial test and unidirectional cyclic triaxial test.
Coatings 15 00007 g003
Figure 4. Relationship of soil element stress conditions in uni-directional and two-directional cyclic triaxial test.
Coatings 15 00007 g004
Figure 5. Numerical model of two-directional cyclic triaxial test.
Coatings 15 00007 g005
Figure 6. Relationship between pore water pressure and cyclic stress ratio (CSR) in the two-directional cyclic triaxial numerical test for (a) Dr = 60% and (b) Dr = 90%.
Coatings 15 00007 g006
Figure 7. Relationship between pore water pressure and the modified cyclic stress ratio (Mcsr) in the two-directional cyclic triaxial numerical test for (a) Dr = 60% and (b) Dr = 90%.
Coatings 15 00007 g007
Figure 8. Relationship between Ia and CSR in soil element when initial liquefaction triggered in saturated soil for (a) Dr = 60% and (b) Dr = 90%.
Coatings 15 00007 g008
Figure 9. Relationship between MIa and CSR in soil element when initial liquefaction triggered in saturated soil for (a) Dr = 60% and (b) Dr = 90%.
Coatings 15 00007 g009
Figure 10. Relationship between the modified CRS (Mcsr) and consolidation pressure for (a) Dr = 60% and (b) Dr = 90%.
Coatings 15 00007 g010
Figure 11. Relationship between the modified CRS (Mcsr) and consolidation pressure ratio for (a) Dr = 60% and (b) Dr = 90%.
Coatings 15 00007 g011
Figure 12. Comparison of computed and experimental pore pressure time histories for (a) NingHe wave and (b) TangShan wave [15].
Coatings 15 00007 g012
Figure 13. Curve of shear stress reduction function [23].
Coatings 15 00007 g013
Figure 14. Schematic of permeability coefficient function.
Coatings 15 00007 g014
Figure 15. Numerical model of free field.
Coatings 15 00007 g015
Figure 16. Comparison of experimental, numerical, and computed pore pressure.
Coatings 15 00007 g016
Figure 17. Comparison of numerical and computed maximum excess pore water pressure ratio.
Coatings 15 00007 g017
Table 1. Parameters of Fujian standard sand.
DrDensity (kg·m−3)Reference
Pressure (kPa)
Shear
Modulus at Pr (MPa)
Bulk
Modulus at Pr (MPa)
Friction Angle (°)Phase
Transformation Angle (°)
c1c3d1d3
60%19.38806.5 × 1041.6 × 10531310.0870.180.00.0
90%19.98800.0871.1 × 1052.4 × 10533260.280.050.10.05
Disclaimer/Publisher’s Note: The statements, opinions and data contained in all publications are solely those of the individual author(s) and contributor(s) and not of MDPI and/or the editor(s). MDPI and/or the editor(s) disclaim responsibility for any injury to people or property resulting from any ideas, methods, instructions or products referred to in the content.