
Numerical Simulation of Gas–Liquid–Solid Erosive Wear in Gas Storage Columns

Abstract
:1. Introduction
2. Numerical Method
2.1. Continuous Phase Control Equations
2.2. Turbulence Modeling
2.3. Mathematical Modeling of Particle Motion
2.4. Particle Erosion Modeling
2.5. Model Validation
3. CFD Simulation Modeling and Validation
3.1. Geometric Modeling and Meshing of Gas Storage Columns
3.2. Boundary Conditions and Calculation Methods for Gas Storage Columns
3.3. Grid-Independent Verification
4. Study on the Erosion Law of Gas Storage Pipe Columns
4.1. Analysis of the Influence of Water Volume Fraction and Gas Recovery Rate on the Erosion Pattern of Pipe Columns
4.2. Analysis of the Influence of Particle Mass Flow Rate on the Erosion Pattern of Pipe Columns
4.2.1. Effect of Sand Mass Flow Rate on Column Erosion
4.2.2. Effect of Salt Mass Flow on Column Erosion
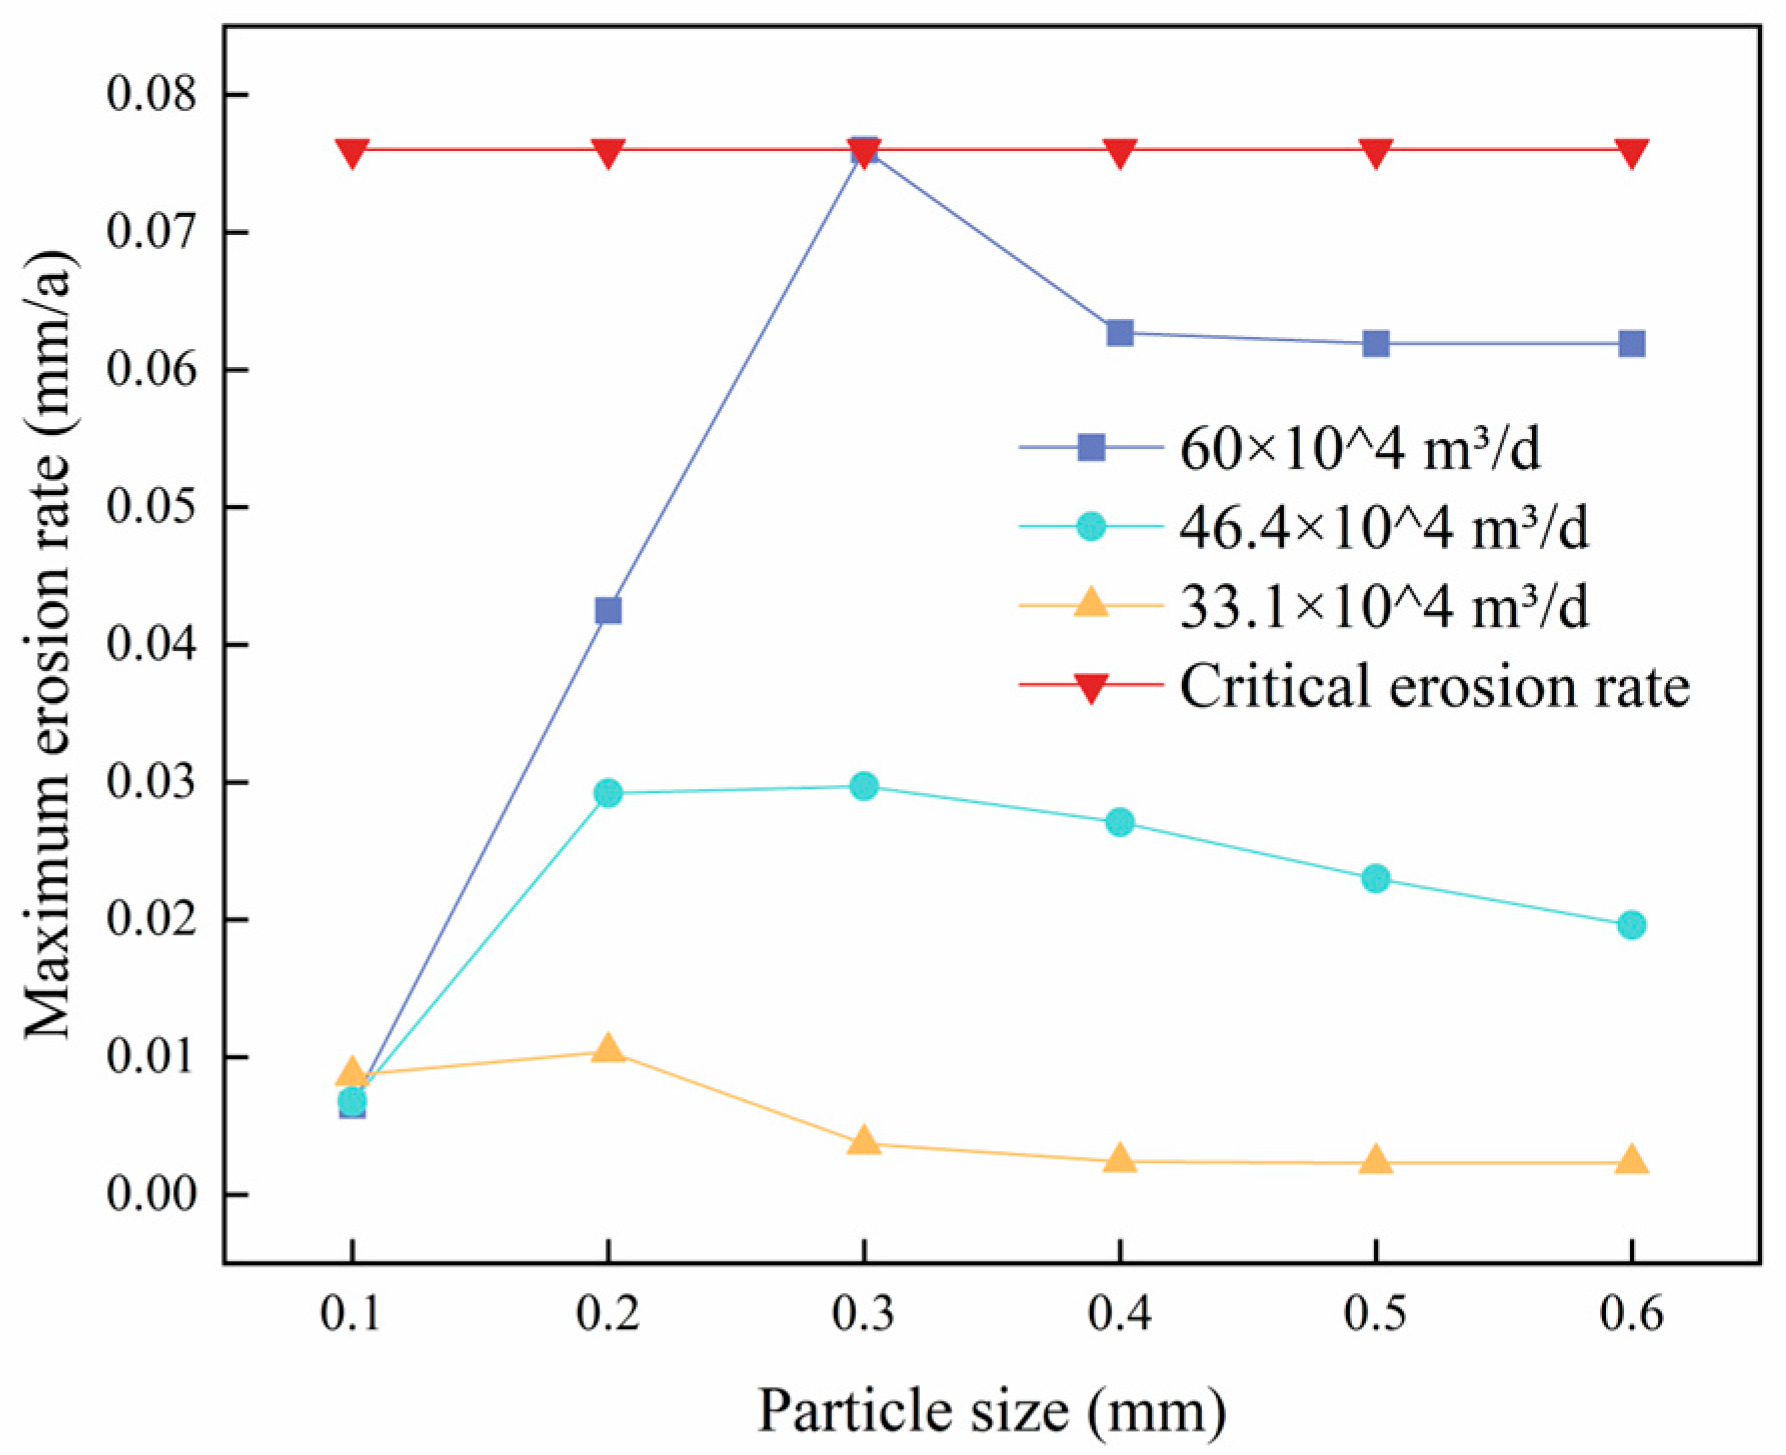
4.3. Effect of Particle Size on Column Erosion
4.3.1. Effect of Sand Particle Size on Column Erosion
4.3.2. Effect of Salt Particle Size on Column Erosion
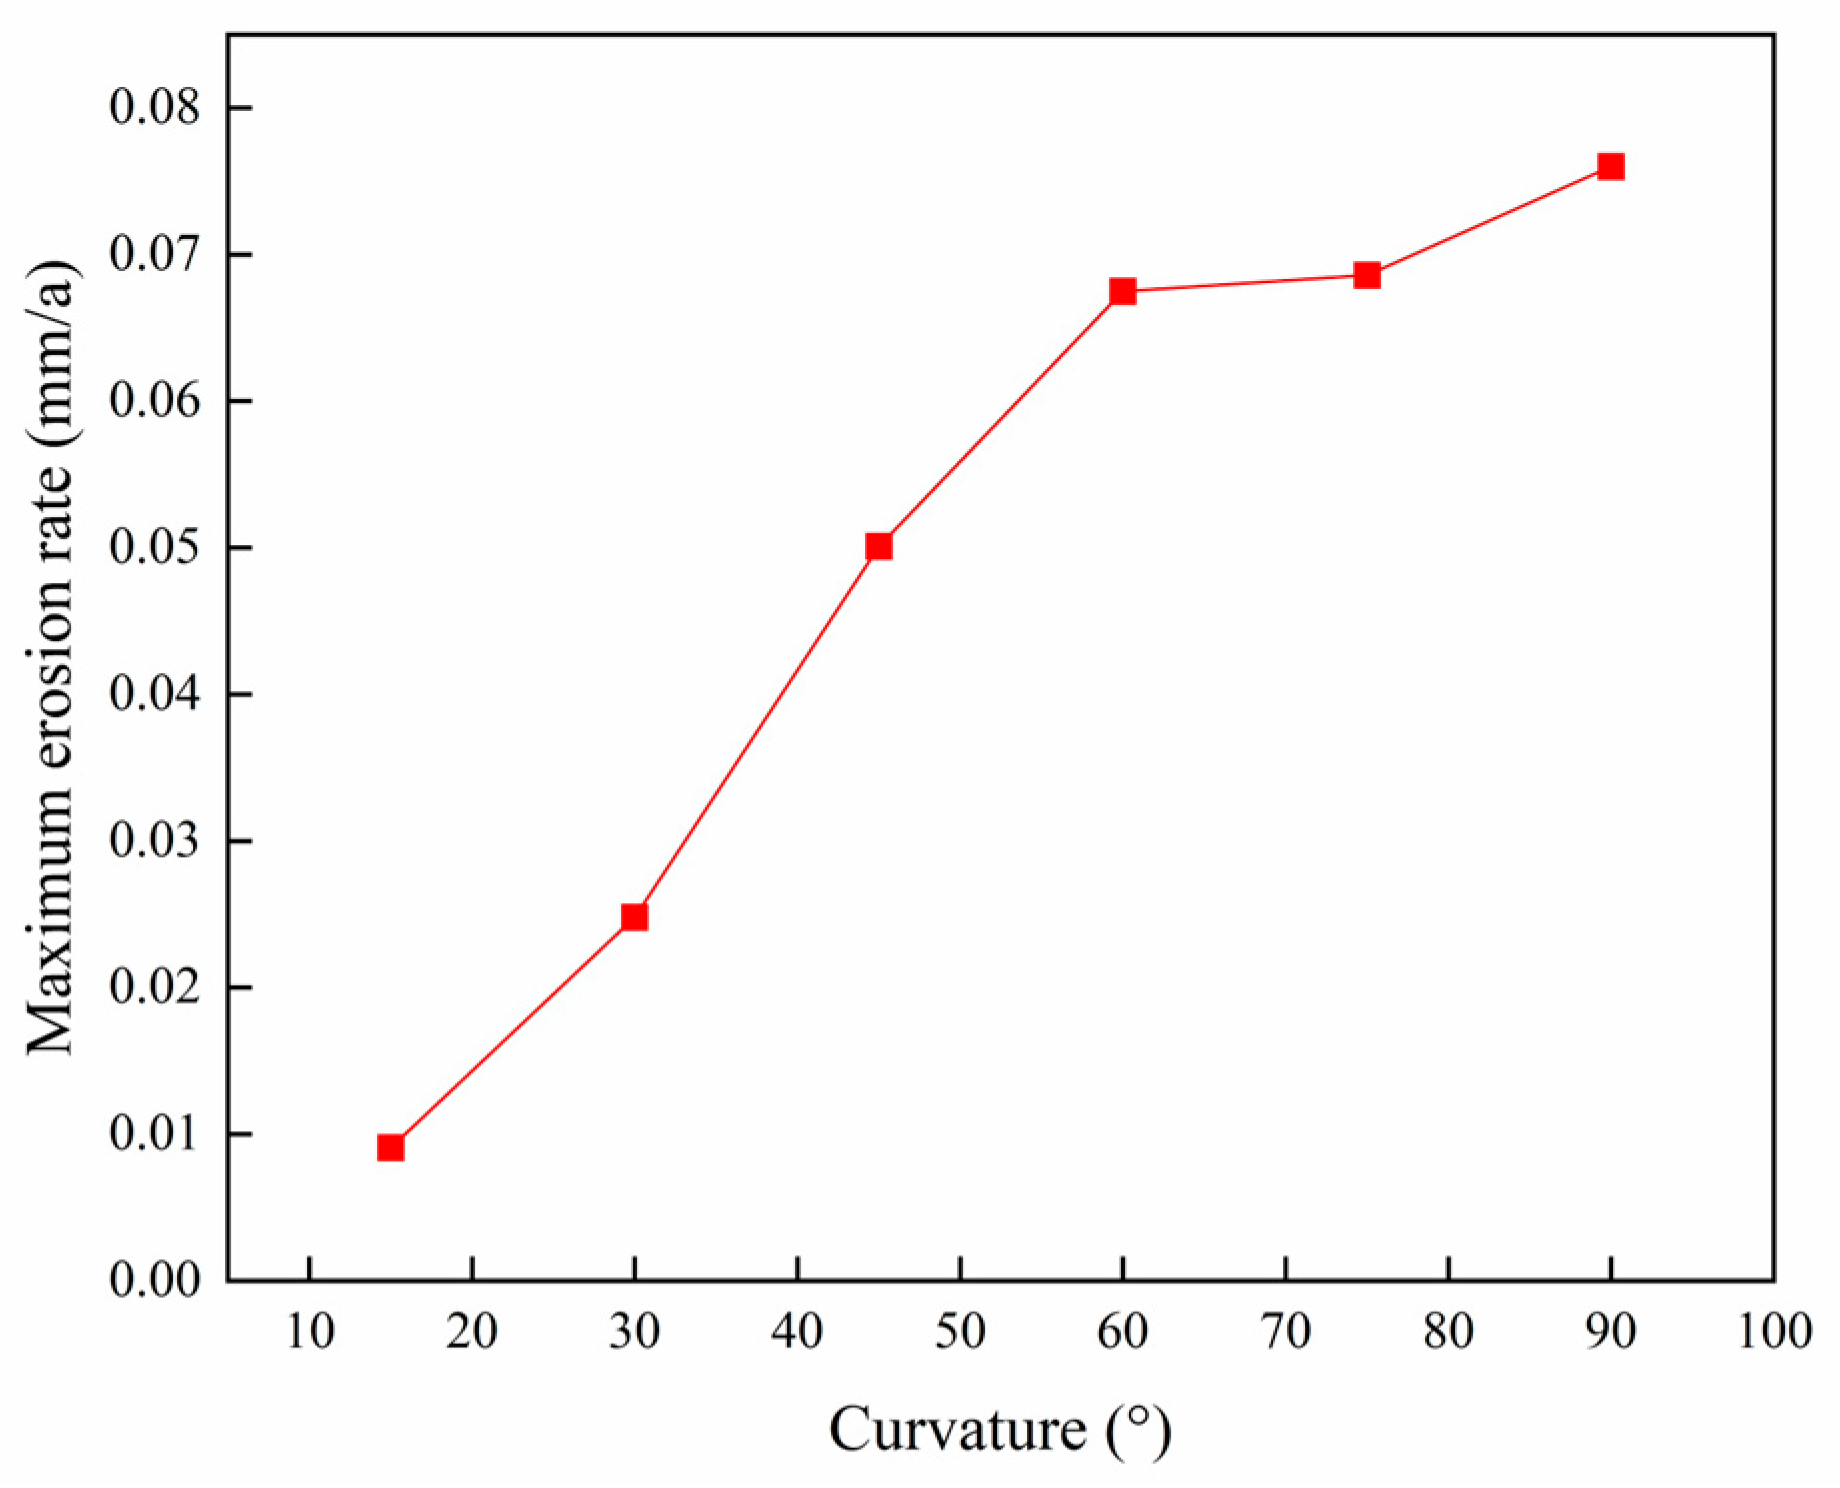
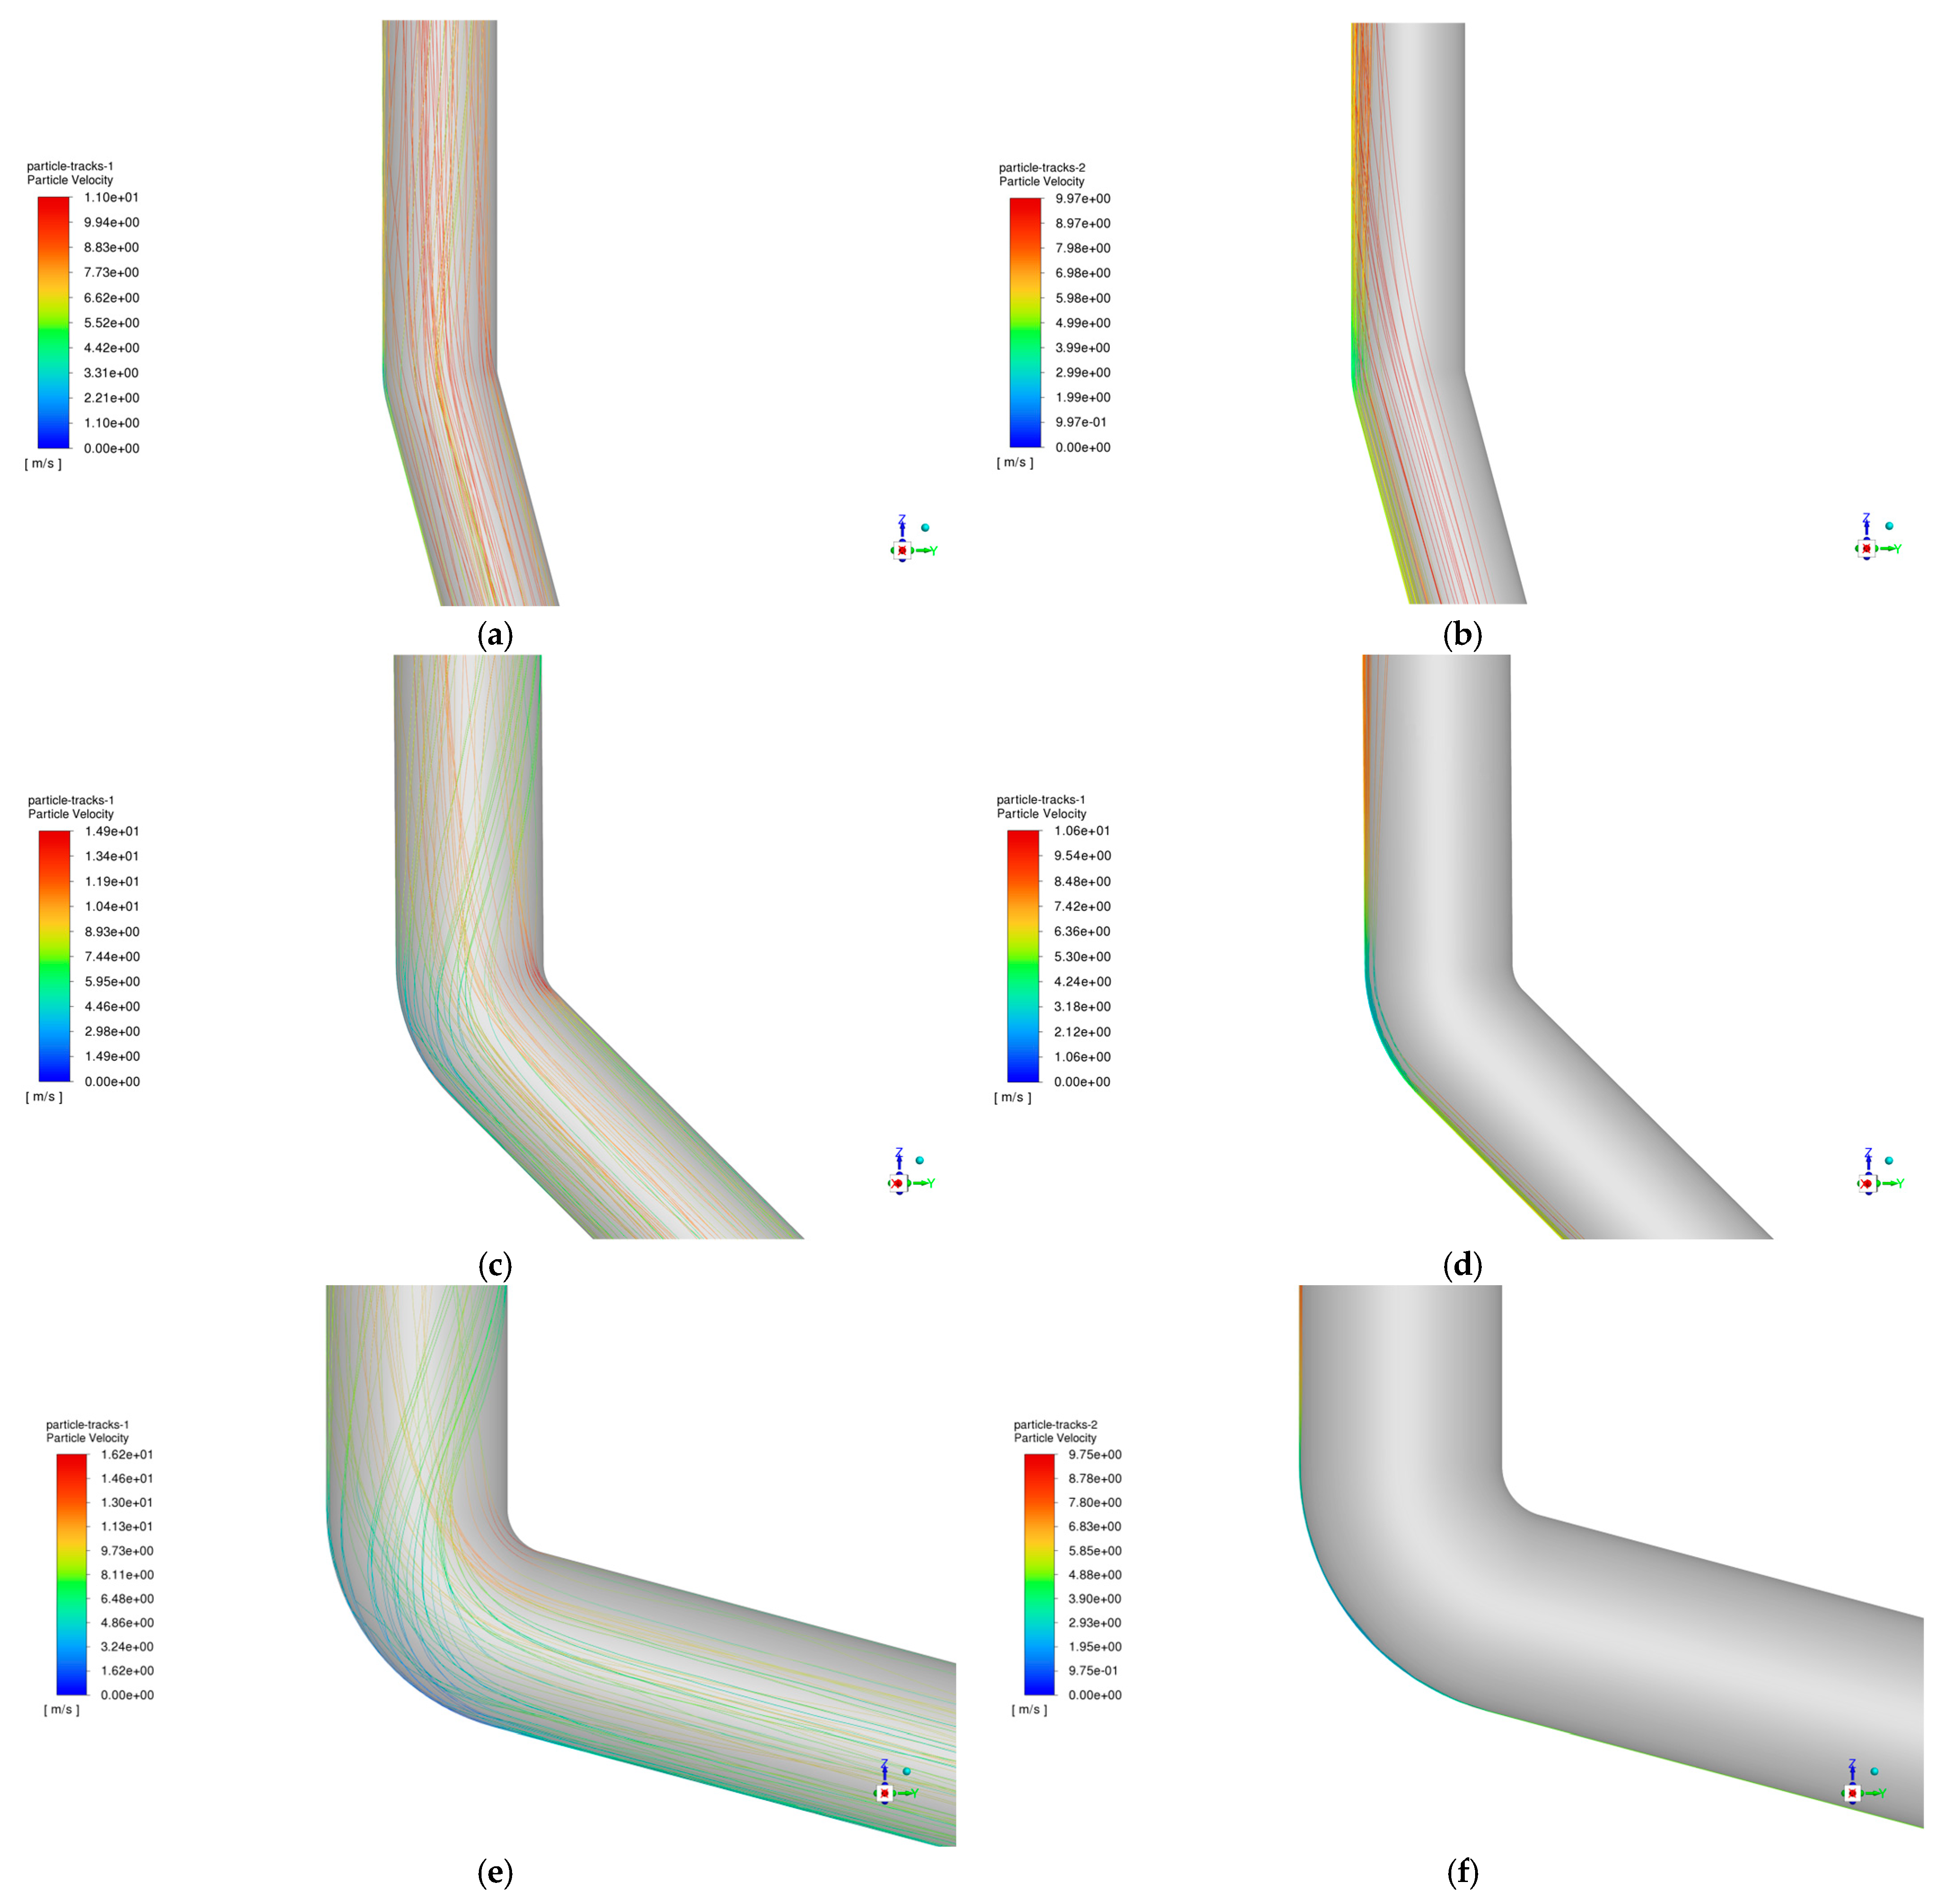
4.4. Effect of Bending Angle on Column Erosion
5. Conclusions
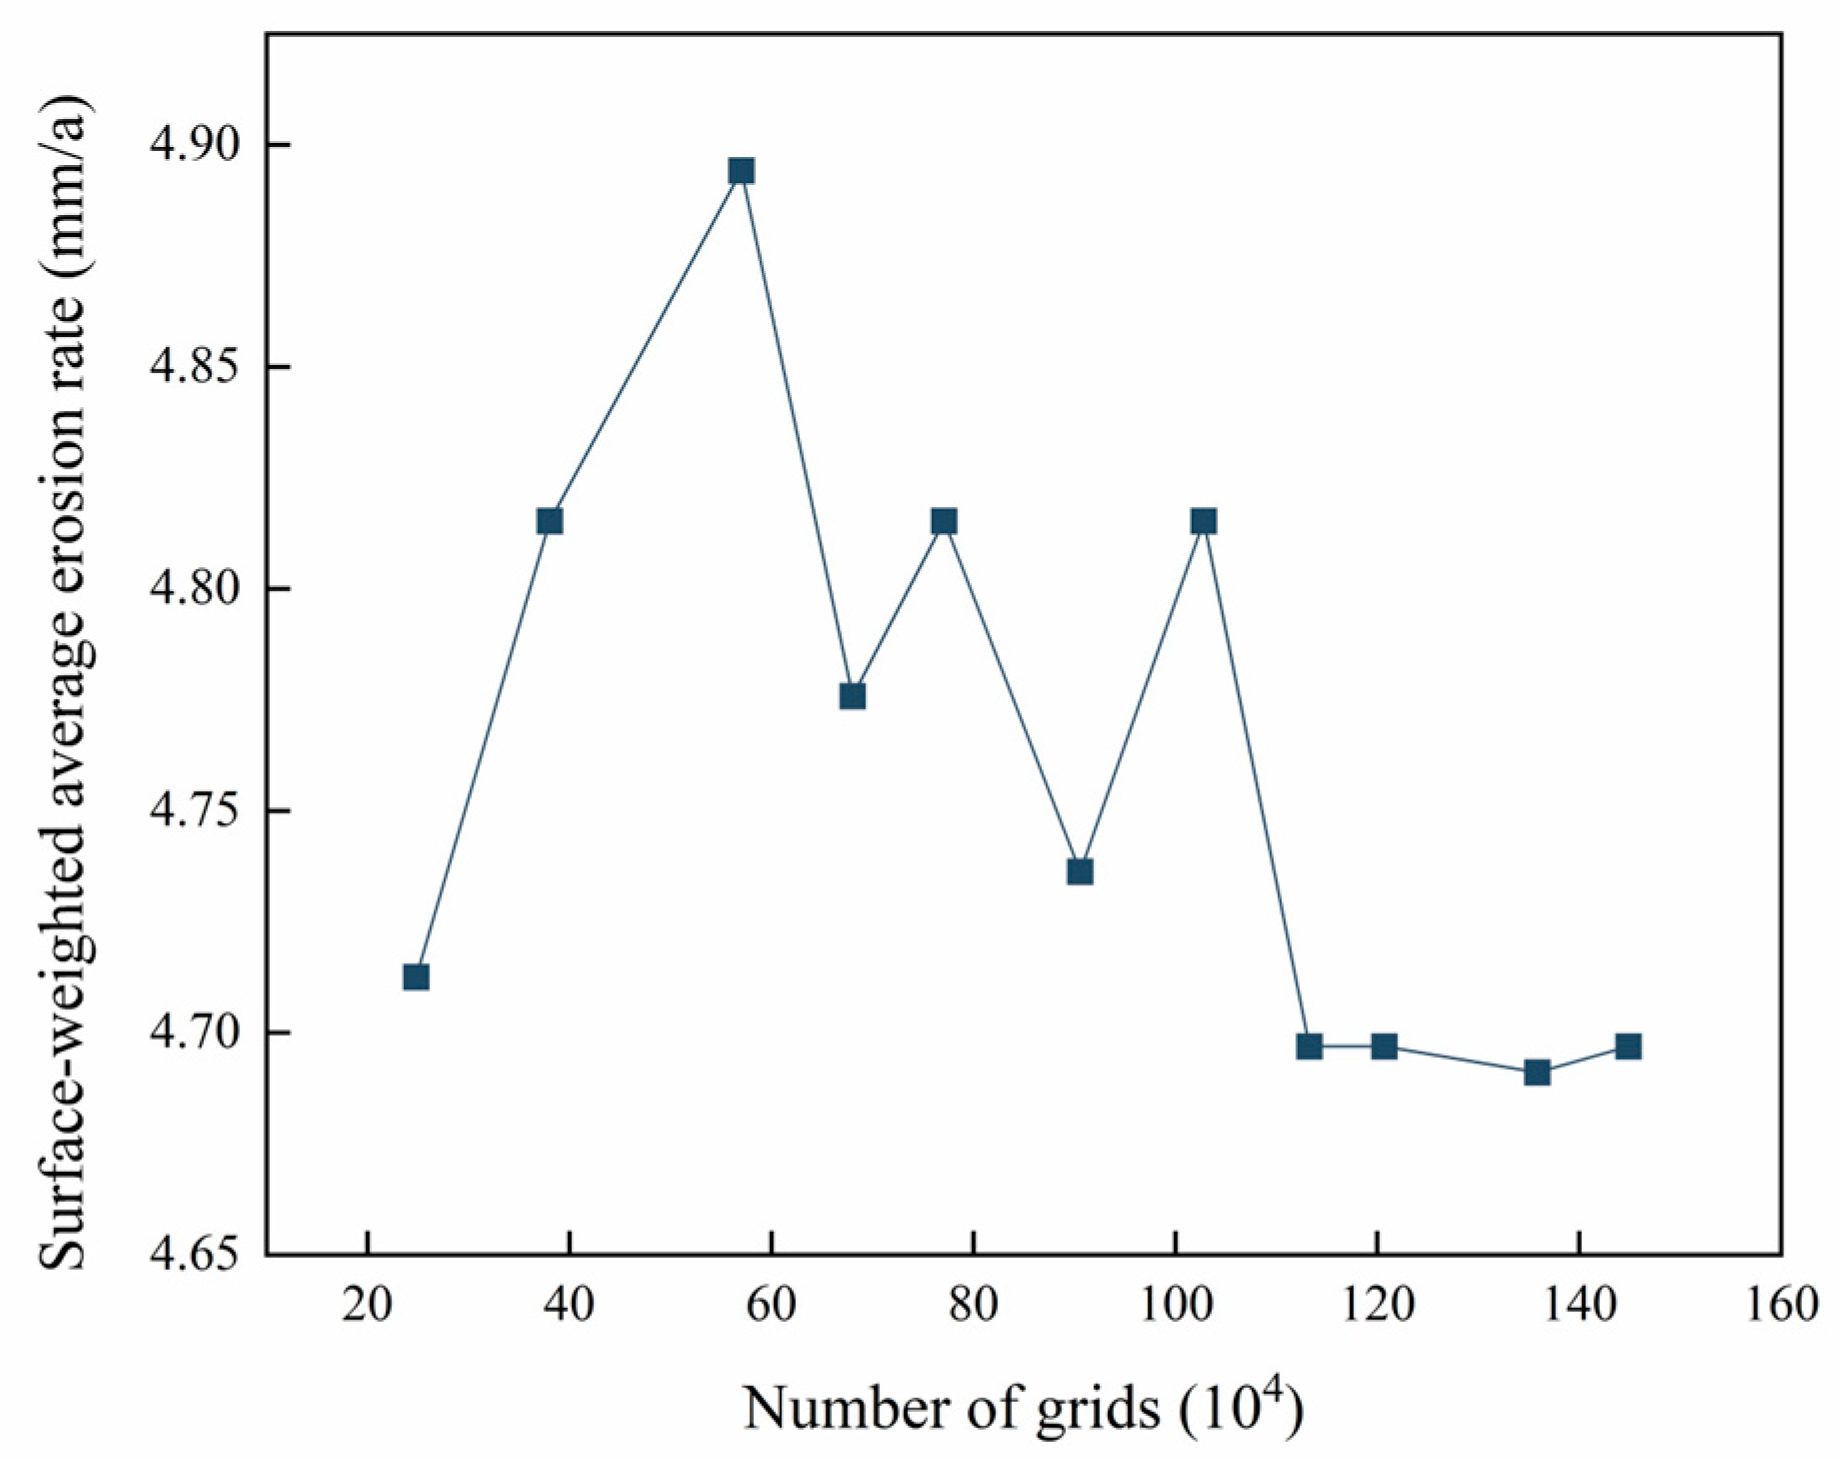
- (1)
- Grid-independence verification of the pipe column erosion model: when the number of grids is greater than 1,207,040, the face-weighted average erosion rate does not change significantly; considering the savings in computational costs, choose the number of grids for 1,207,040 grids for calculation.
- (2)
- In scenarios with low liquid volumes, the maximum erosion rate remains largely unaffected by increases in water volume fraction. Within identical liquid volumes, the maximum erosion rate rises alongside higher gas extraction rates, exhibiting a power function relationship with the volume of gas extracted. When the gas extraction volume exceeds 60 × 104 m3/d, the maximum erosion rate surpasses the critical erosion rate of 0.076 mm/a. This study emphasizes that the gas extraction rate is the most influential factor affecting erosion rates in this context.
- (3)
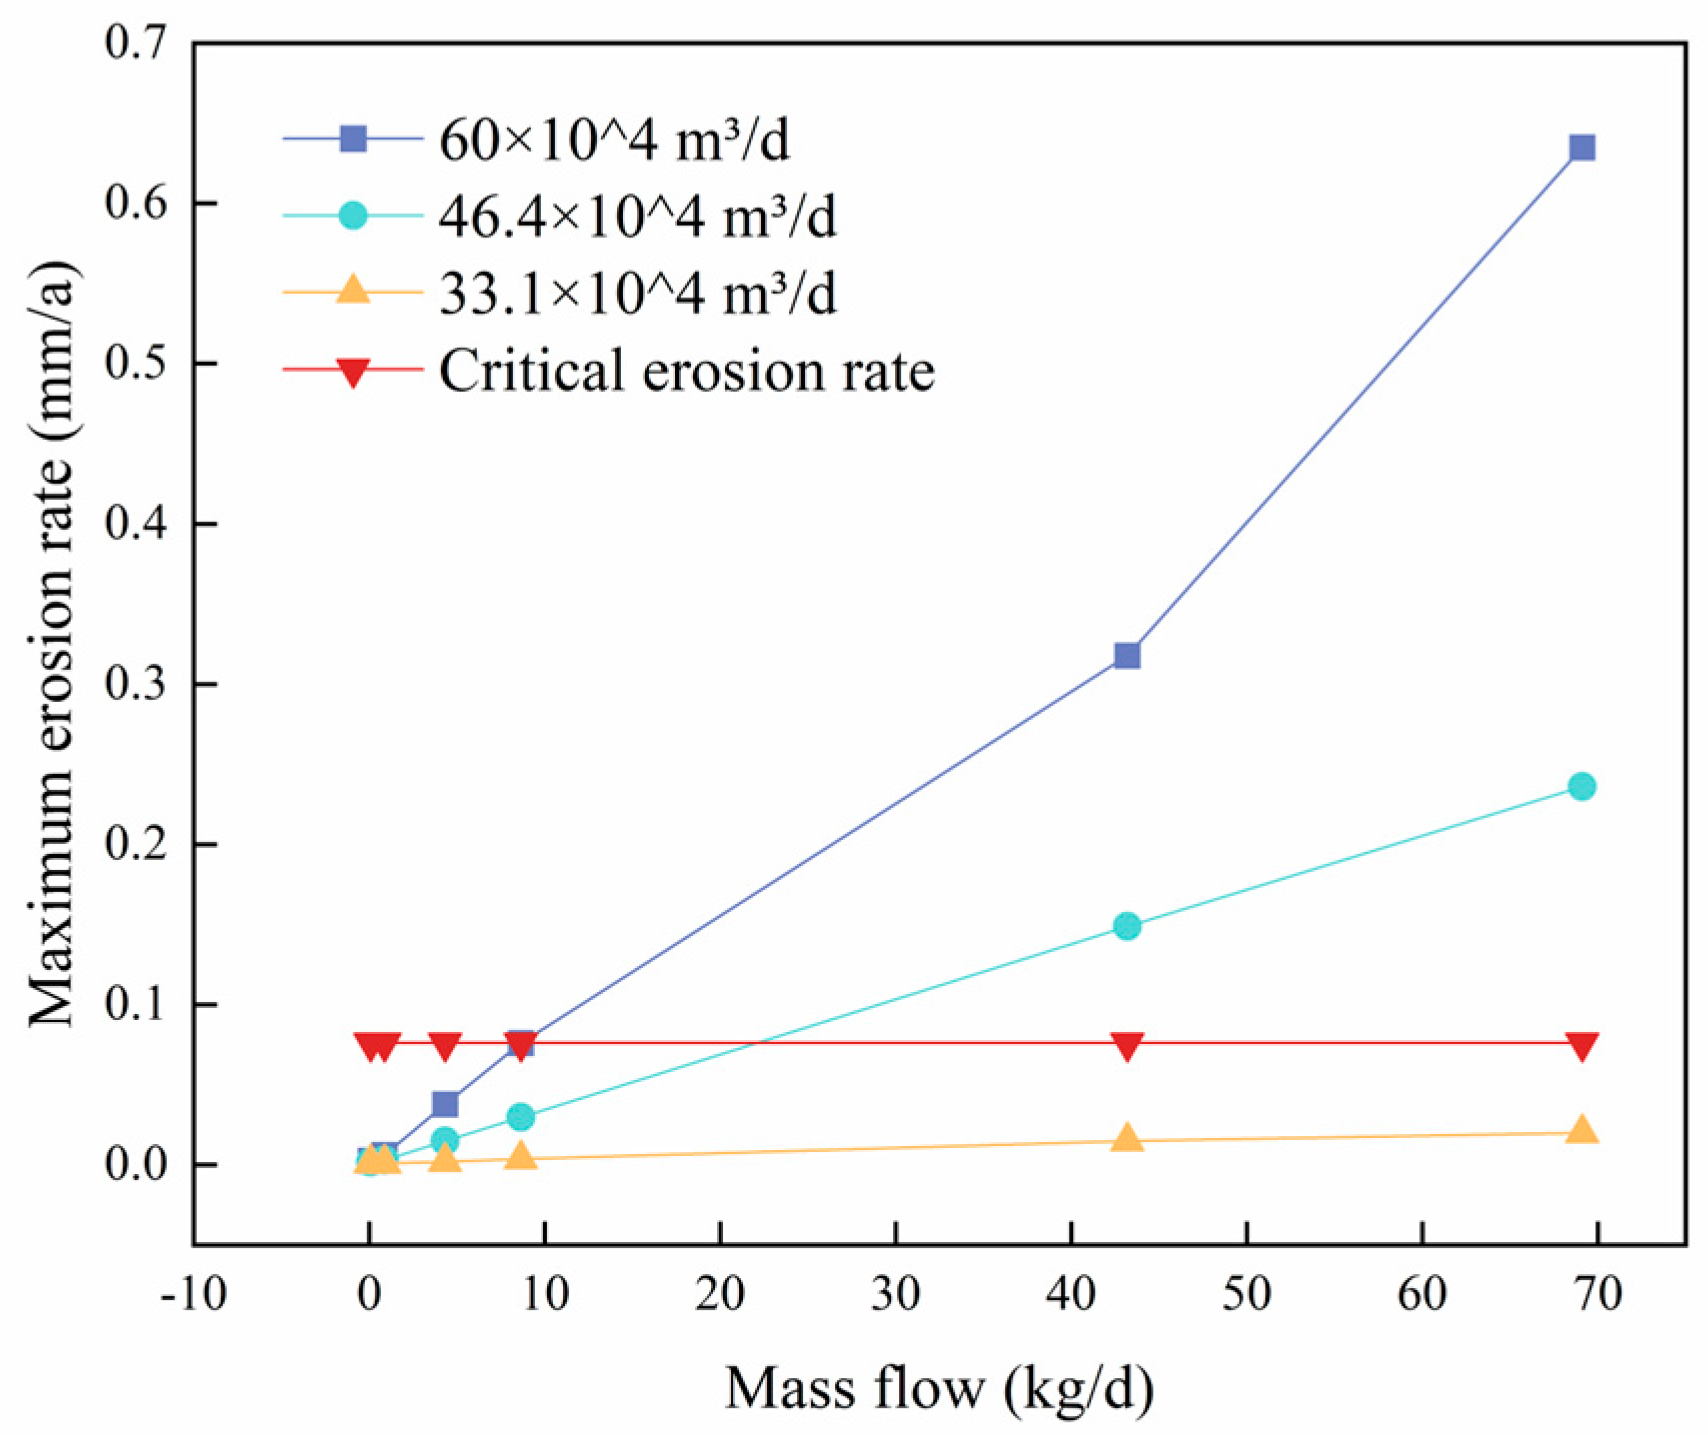
- Under low gas extraction rates, the salt mass flow rate has minimal influence on the maximum erosion rate of the pipe column. However, at high gas extraction rates, there is a linear correlation between the maximum erosion rate and the salt mass flow rate. Specifically, when the gas extraction rate exceeds 46.4 × 10⁴ m3/d and the salt mass flow rate exceeds 22 kg/d, the maximum erosion rate surpasses the critical erosion rate of 0.076 mm/a. This poses a serious threat to the safety of the pipe column during these conditions.
- (4)
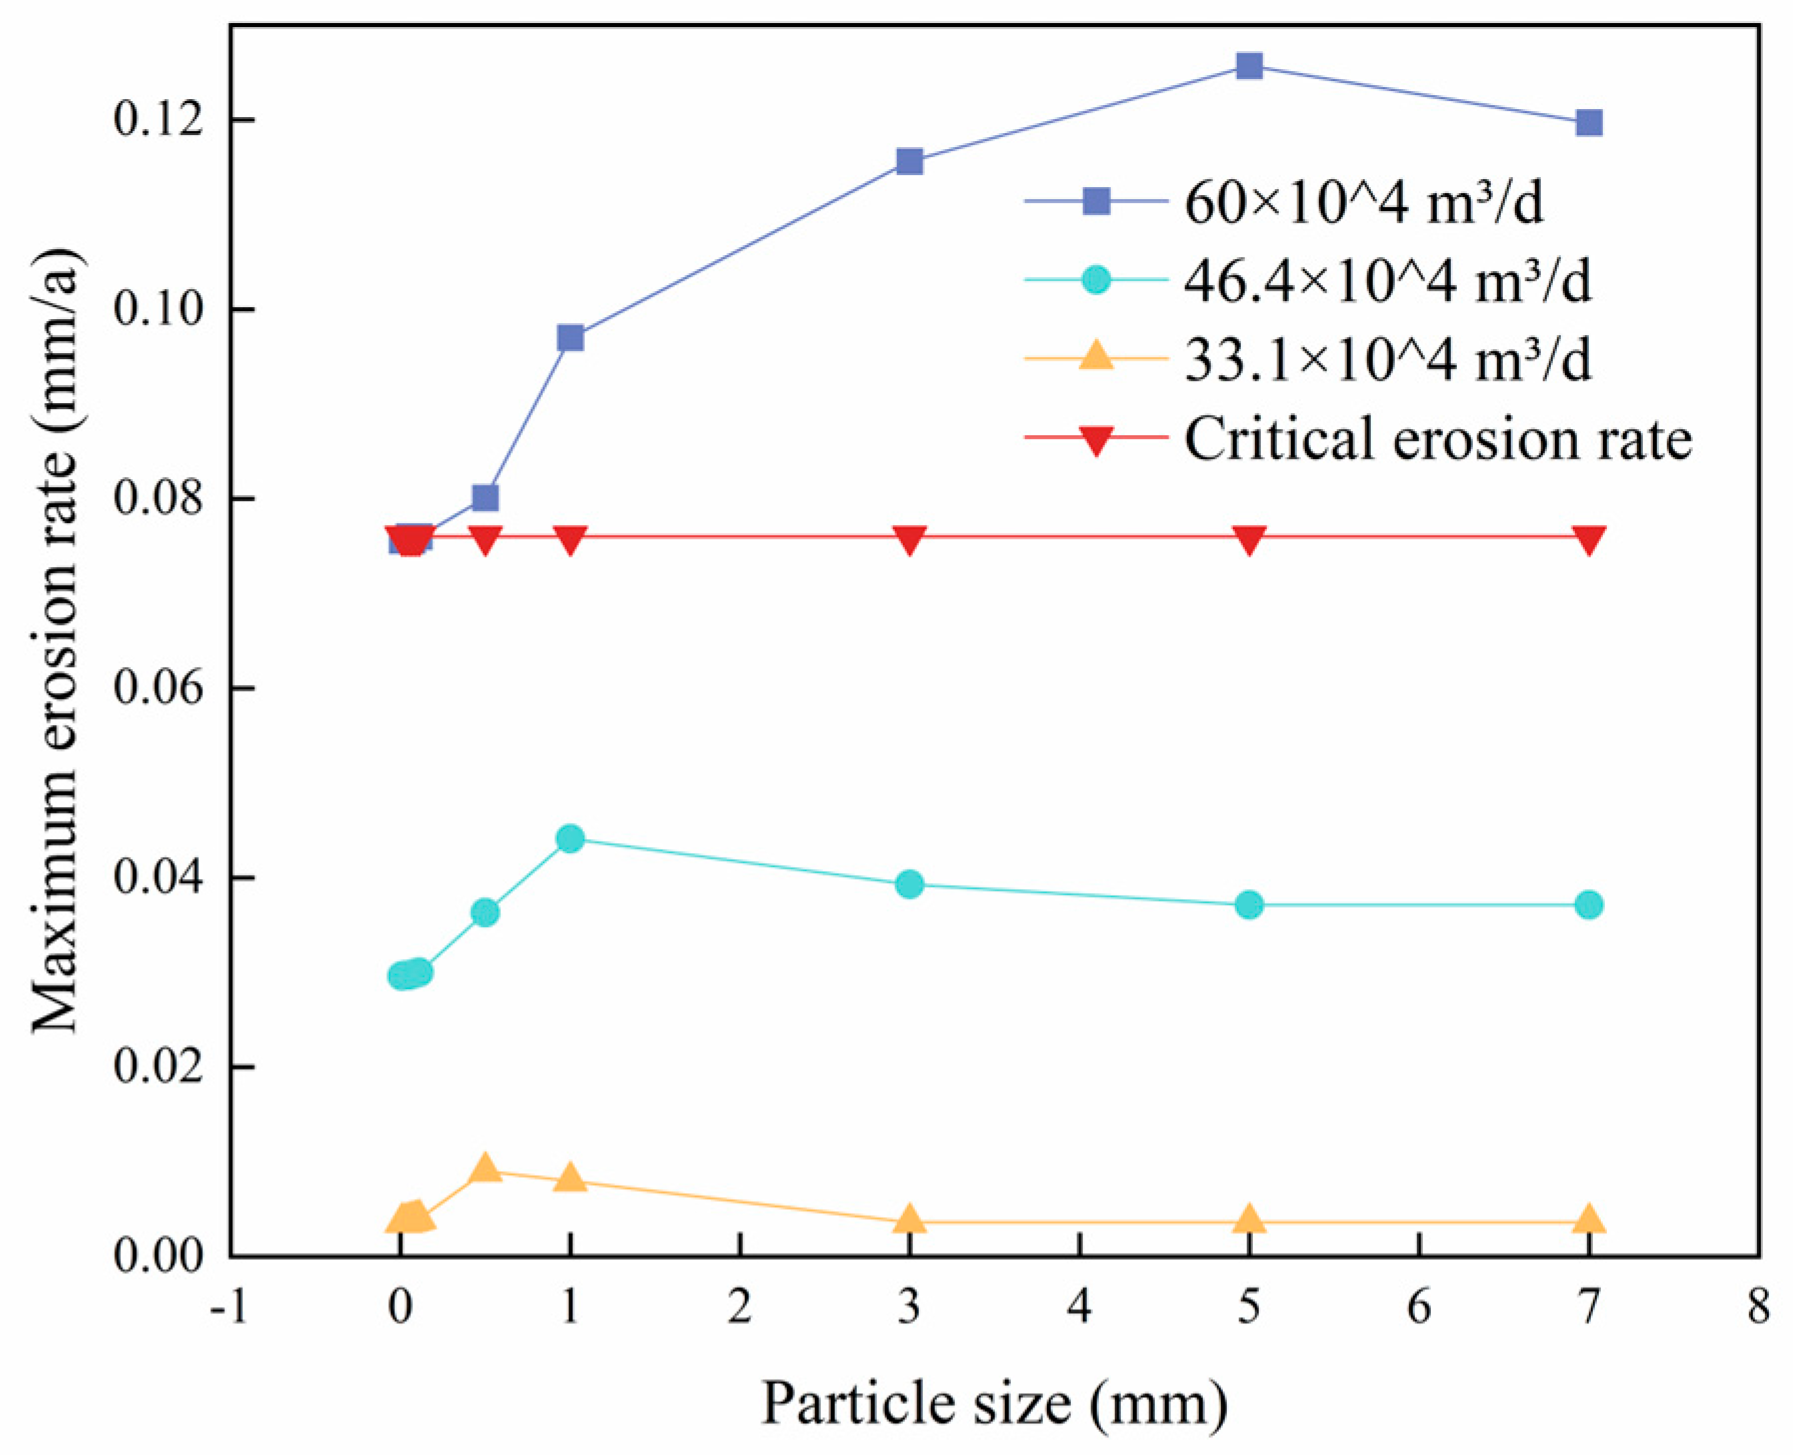
- As the sand and salt particle sizes increase, the maximum erosion rate of the column exhibits a trend where it initially increases, then decreases, and eventually stabilizes. Similarly, as the bending angle increases, the maximum erosion rate of the column shows an increasing trend.
Author Contributions
Funding
Institutional Review Board Statement
Informed Consent Statement
Data Availability Statement
Conflicts of Interest
References
- Wang, Z.; Yang, H.; Zhang, Y.; Liu, X. Progress in the theory and prediction of gas storage column erosion research. Surf. Technol. 2023, 52, 91–110. [Google Scholar]
- Finnie, I. Erosion of Surfaces by Solid Particles. Wear 1960, 3, 87–103. [Google Scholar] [CrossRef]
- Bitter, J.G.A. A Study of Erosion Phenomena. Wear 1963, 6, 169–190. [Google Scholar] [CrossRef]
- Cui, L.; Li, X.; Li, J.; Li, M.; Chang, W.; Cheng, J. Liquid-solid two-phase flow erosion resistance of QT1100 continuous oil pipeline steel. Mater. Mech. Eng. 2024, 48, 55–60. [Google Scholar]
- Lin, Y.; Huang, G.; Deng, K. Gas-solid erosion simulation of 90° bends based on full-scale physical tests. J. Saf. Environ. 2023, 23, 4325–4334. [Google Scholar]
- Zahedi, P.; Parsi, M.; Asgharpour, A.; McLaury, B.S.; Shirazi, S.A. Experimental investigation of sand particle erosion in a 90 elbow in annular two-phase flows. Wear 2019, 438, 203048. [Google Scholar] [CrossRef]
- Bilal, F.S.; Sedrez, T.A.; Shirazi, S.A. Experimental and CFD investigations of 45 and 90 degrees bends and various elbow curvature radii effects on solid particle erosion. Wear 2021, 476, 203646. [Google Scholar] [CrossRef]
- Banakermani, M.R.; Naderan, H.; Saffar-Avval, M. An investigation of erosion prediction for 15 to 90 elbows by numerical simulation of gas-solid flow. Powder Technol. 2018, 334, 9–26. [Google Scholar] [CrossRef]
- Vieira, R.E.; Mansouri, A.; McLaury, B.S.; Shirazi, S.A. Experimental and computational study of erosion in elbows due to sand particles in air flow. Powder Technol. 2016, 288, 339–353. [Google Scholar] [CrossRef]
- Peng, T.; Zhang, F.; Fang, H. Effect of gravel shape on wellbore erosion in gas storage reservoirs. Sci. Technol. Eng. 2020, 20, 14908–14913. [Google Scholar]
- Li, M.; Zhou, Z.; Yu, X.; Lv, J.; Deng, L.; Liu, W. Gas-liquid two-phase erosion modelling and resultant simulation of gas storage reservoir injection wells. Mater. Prot. 2022, 55, 1–8. [Google Scholar]
- He, Z.; Yi, W.; Li, J.; Sun, P.; Liu, P.; Jiang, J. Wen23 Analysis of the erosion pattern of gas storage reservoir injection columns and the limiting gas injection and extraction volumes. Pet. Tubul. Goods Instrum. 2022, 55, 1–8. [Google Scholar]
- Duan, Y.; Wang, S.; Xue, H.; Kou, S. Study on the mechanism of wellbore salt formation in gas storage reservoirs with high mineralisation reservoirs. Petrochem. Ind. Appl. 2021, 40, 62–64+79. [Google Scholar]
- Shen, C.; Wang, D.; Ren, Z.; Su, H.; Yang, Y. Theoretical model and practice of wellbore salting in gas wells based on formation water evaporation--A case study of Wen23 gas storage reservoir. Nat. Gas Ind. 2022, 42, 65–74. [Google Scholar]
- Ren, Z.; Wang, D.; Jiang, P.; Li, Y. A method for evaluating the production capacity of gas storage reservoir injection and extraction wells considering the effect of salt formation. Fault-Block Oil Gas Field 2023, 30, 552–558. [Google Scholar]
- Yao, S.; Xiong, W.; Lei, J. Wen96 Salt formation mechanism and preventive measures in underground gas storage reservoirs. Nat. Gas Technol. Econ. 2021, 15, 32–37+67. [Google Scholar]
- Parsi, M.; Agrawal, M.; Srinivasan, V.; Vieira, R.E.; Torres, C.F.; McLaury, B.S.; Shirazi, S.A. CFD simulation of sand particle erosion in gas-dominant multiphase flow. J. Nat. Gas Sci. Eng. 2015, 27, 706–718. [Google Scholar] [CrossRef]
- Liu, E.; Li, D.; Zhao, W.; Peng, S.; Chen, Q. Correlation analysis of pipeline corrosion and liquid accumulation in gas gathering station based on computational fluid dynamics. J. Nat. Gas Sci. Eng. 2022, 102, 104564. [Google Scholar] [CrossRef]
- Shih, T.H.; Liou, W.W.; Shabbir, A.; Yang, Z.; Zhu, J. A new k-ϵ eddy viscosity model for high reynolds number turbulent flows. Comput. Fluids 1995, 24, 227–238. [Google Scholar] [CrossRef]
- Wen, Q.; Liu, Y.; Chen, Z.; Wang, W. Numerical simulation and experimental validation of flow characteristics for a butterfly check valve in small modular reactor. Nucl. Eng. Des. 2022, 391, 111732. [Google Scholar] [CrossRef]
- Liu, E.; Li, D.; Li, W.; Liao, Y.; Qiao, W.; Liu, W.; Azimi, M. Erosion simulation and improvement scheme of separator blowdown system—A case study of Changning national shale gas demonstration area. J. Nat. Gas Sci. Eng. 2021, 88, 103856. [Google Scholar] [CrossRef]
- Solnordal, C.B.; Wong, C.Y.; Boulanger, J. An experimental and numerical analysis of erosion caused by sand pneumatically conveyed through a standard pipe elbow. Wear 2015, 336, 43–57. [Google Scholar] [CrossRef]
- Morsi, S.A.J.; Alexander, A.J. An investigation of particle trajectories in two-phase flow systems. J. Fluid Mech. 1972, 55, 193–208. [Google Scholar] [CrossRef]
- Haider, A.; Levenspiel, O. Drag coefficient and terminal velocity of spherical and nonspherical particles. Powder Technol. 1989, 58, 63–70. [Google Scholar] [CrossRef]
- Edwards, J.K.; McLaury, B.S.; Shirazi, S.A. Evaluation of alternative pipe bend fittings in erosive service. ASME 2000, 253, 959–966. [Google Scholar]
- Bourgoyne, A.T., Jr. Experimental study of erosion in diverter systems due to sand production. In Proceedings of the 1989 SPE/IADC Drilling Conference and Exhibition, New Orleans, LA, USA, 29 February–3 March 1989. [Google Scholar]
- SY5329-2022; Recommended Indicators and Analytical Methods for Water Quality of Water Injection in Clastic Reservoirs. China National Petroleum Corporation: Beijing, China, 2022.
- Wang, Y.; Zhang, J. Optimised calculation of critical erosion flow rate for injection and extraction wells in underground gas storage reservoirs. Nat. Gas Ind. 2019, 39, 74–80. [Google Scholar]


| Serial Number | Impact Angle (°) | Impact Angle Coefficient |
|---|---|---|
| 1 | 0 | 0 |
| 2 | 20 | 0.8 |
| 3 | 30 | 1 |
| 4 | 45 | 0.5 |
| 5 | 90 | 0.4 |
| Pipe Diameter/mm | Aspect Ratio | Sand Density/(kg·m−3) | Pipe Density/(kg·m−3) | Fluid Velocity/(m·s−1) | Sand Particle Size/mm | Sand Mass Flow Rate/(kg·s−1) |
|---|---|---|---|---|---|---|
| 52.5 | 1.5 | 2650 | 7800 | 47 | 0.35 | 0.06758 |
| Parameters | Worth |
|---|---|
| Gas velocity | 23 m/s |
| Particle diameter | 300 μm |
| Particle density | 2650 kg/m3 |
| Particle mass flow rate | 0.3 kg/s |
| Tube density | 7800 kg/m3 |
| Parameters | Worth |
|---|---|
| Quantity of gas recovered | 60 × 104 m3/d |
| Sand particle size | 0.05 mm |
| Grain density | 2650 kg/m3 |
| Salt particle size | 0.3 mm |
| Salt particle size | 2150 kg/m3 |
| Grit mass flow rate | 4.32 kg/d |
| Salt particle mass flow rate | 8.64 kg/d |
| Water content by volume | 0.002% |
| Length of entrance section | 50 D |
| Stresses | 20 MPa |
| Inlet temperature | 374 K |
Disclaimer/Publisher’s Note: The statements, opinions and data contained in all publications are solely those of the individual author(s) and contributor(s) and not of MDPI and/or the editor(s). MDPI and/or the editor(s) disclaim responsibility for any injury to people or property resulting from any ideas, methods, instructions or products referred to in the content. |
© 2025 by the authors. Licensee MDPI, Basel, Switzerland. This article is an open access article distributed under the terms and conditions of the Creative Commons Attribution (CC BY) license (https://creativecommons.org/licenses/by/4.0/).
Share and Cite
Ren, Z.; Zhang, C.; Jin, W.; Han, B.; Fan, Z. Numerical Simulation of Gas–Liquid–Solid Erosive Wear in Gas Storage Columns. Coatings 2025, 15, 82. https://doi.org/10.3390/coatings15010082
Ren Z, Zhang C, Jin W, Han B, Fan Z. Numerical Simulation of Gas–Liquid–Solid Erosive Wear in Gas Storage Columns. Coatings. 2025; 15(1):82. https://doi.org/10.3390/coatings15010082
Chicago/Turabian StyleRen, Zongxiao, Chenyu Zhang, Wenbo Jin, Bingyue Han, and Zhaoyang Fan. 2025. "Numerical Simulation of Gas–Liquid–Solid Erosive Wear in Gas Storage Columns" Coatings 15, no. 1: 82. https://doi.org/10.3390/coatings15010082
APA StyleRen, Z., Zhang, C., Jin, W., Han, B., & Fan, Z. (2025). Numerical Simulation of Gas–Liquid–Solid Erosive Wear in Gas Storage Columns. Coatings, 15(1), 82. https://doi.org/10.3390/coatings15010082