Article

Study on the Properties of Plastic Fillers in Carbon Dioxide Capture System Under High Temperature and High Pressure

1
China Petroleum Engineering & Construction Corp. Beijing Company, Beijing 100085, China
2
School of Materials Science and Engineering, China University of Petroleum (East China), Qingdao 266580, China
3
School of New Energy and Materials, China University of Petroleum–Beijing, Beijing 102249, China
*
Author to whom correspondence should be addressed.
Coatings 2025, 15(3), 360; https://doi.org/10.3390/coatings15030360
Submission received: 15 January 2025 / Revised: 18 February 2025 / Accepted: 20 February 2025 / Published: 20 March 2025

Abstract

:
In the CO2-amine solution system, metal packings in purification devices face corrosion risks, while plastic packings have garnered attention due to their lightweight nature, ease of processing, and excellent corrosion resistance. Since different plastic packings have varying applicable temperature ranges, exceeding their tolerance limits can significantly reduce their corrosion resistance. Therefore, selecting suitable plastic packings at different temperatures is crucial for ensuring safety. This study selected four plastic materials–PVC-C, PP, FEP, and PEEK–and systematically tested their performance indicators, such as volume, mass, strength, elongation, and thermal stability, in a CO2-amine solution system at experimental temperatures ranging from 60 to 130 °C. The experimental results show that PEEK outperformed the other three materials within the 60–130 °C range, making it suitable as a packing material for purification devices in high-temperature environments. Although FEP demonstrated good performance under the same conditions, its tendency to deform may limit its applicability. PP and PVC-C exhibited poor performance at high temperatures, with PVC-C particularly failing above 100 °C, rendering it unsuitable for high-temperature applications. This research provides important insights for the future selection of packing materials in CO2-amine solution systems for purification devices.

1. Introduction

In both industrial production and daily life, the demand for fossil fuels continues to grow. However, the combustion of fossil fuels generates a large amount of greenhouse gases, disrupting the Earth’s original carbon balance and directly leading to the increasingly severe issue of global warming [1,2]. To address this challenge, Carbon Capture, Utilization, and Storage (CCUS) technology has become an important pathway for achieving decarbonization goals while maintaining economic development. It is also a key pillar for rapidly reducing greenhouse gas emissions and achieving global carbon neutrality [3,4]. In the global development of CCUS technology, the United States and China are leading the way. The United States ranks first globally with investments in seven CCUS projects, while China follows closely with five projects [5]. Among these, carbon capture technology is the core component of CCUS. For example, the Petra Nova project in Texas, USA, is the world’s largest carbon capture project, capable of capturing 1.4 million tons of CO2 annually, with low capture costs and significant carbon reduction benefits [6]. Additionally, in 2024, the Dallman Unit 4 coal-fired power plant in Springfield, Illinois, planned to utilize carbon capture technology to achieve a daily CO2 capture target of 200 tons [7]. As the world’s largest carbon emitter, China is also widely deploying CCUS projects. For instance, the 3 million tons/year carbon capture demonstration project in Ningxia, China, has commenced full-scale construction, while the Qilu Petrochemical-Shengli Oilfield CCUS project is China’s first million-ton-level carbon capture project [6]. Carbon capture technology is mainly divided into three methods: pre-combustion capture, oxy-fuel combustion capture, and post-combustion capture [8]. Due to the high investment costs of pre-combustion and oxy-fuel combustion capture, post-combustion capture technology is currently the most widely used in industry. Among the various post-combustion flue gas CO2 capture technologies, the carbon capture process using organic amines as absorbents is the most mature and widely applied. However, when capturing CO2 from flue gas, the purification equipment faces severe corrosion issues, posing challenges for the further promotion and application of this technology [9,10]. Therefore, effectively controlling corrosion problems has become one of the key research directions for the future development of carbon capture technology.
In purification devices, metal packings are widely adopted due to their excellent machinability, high strength, and superior wettability, which contribute to outstanding mass transfer efficiency and adaptability [11]. However, metal packings face significant corrosion risks in high-temperature and corrosive environments. For instance, Zhao et al. found that the corrosion rate of 2535 Nb alloy increases significantly with temperature, with the corrosion rate at 1273.5 K being nearly 13 times higher than that at 1073.15 K [12]. Similarly, Li et al. observed that in molten salt environments, elevated salt temperatures accelerate the diffusion of alloy elements, thereby exacerbating the corrosion rate of 316SS [13]. To address this issue, researchers have attempted to enhance the corrosion resistance of metal packings through surface treatments and alloy improvements. For example, Niedermeier et al. improved the anti-corrosion performance of high-temperature nickel-chromium alloy (Alloy 800H, 1.4958) pipes and components in high-temperature environments by aluminizing and pre-oxidation treatments [14]. Rivolta et al. enhanced the mechanical and corrosion resistance properties of alloy 625 through specific aging treatments [15]. Despite these efforts, metal packings still exhibit high corrosion risks in CO2-amine systems, making it crucial to further study the corrosion resistance of packing devices. Plastic packings, with their excellent corrosion resistance, have emerged as a key solution to the corrosion issues of metal packings [16]. However, plastic packings exhibit varying mechanical properties at different temperatures [17]. Gong et al. found that under high-temperature and high-pressure conditions, corrosive media such as CO2 can cause physical and chemical reactions with plastic materials, altering their molecular structure and degrading their performance [17]. Represented by polypropylene (PP), plastic packings offer advantages such as lightweight, ease of processing, and excellent corrosion resistance, providing significant convenience in manufacturing, transportation, and maintenance [18]. However, PP packings have lower strength and require reinforcement for long-term use. Additionally, their thicker single plates are prone to deformation at high temperatures, making them generally suitable for low- to medium-temperature environments (below 120 °C). Furthermore, the non-polar surface characteristics of plastic packings result in poor hydrophilicity, making it difficult to achieve sufficient wettability, which in turn affects mass transfer efficiency [19]. In contrast, chlorinated polyvinyl chloride (PVC-C) demonstrates excellent resistance to alkali corrosion and mechanical stability, maintaining performance even in high-temperature environments, and is thus widely used in packing towers in the chlor-alkali industry [20]. Fluorinated ethylene propylene (FEP), a random crystalline polymer formed by the polymerization of tetrafluoroethylene and hexafluoropropylene, exhibits exceptional chemical corrosion resistance and high-temperature stability, making it a potential candidate for organic amine capture packings [21]. Additionally, polyether ether ketone (PEEK), known for its outstanding chemical stability and wear resistance, is widely used in aerospace and large marine equipment [22], and also shows significant advantages in high-temperature and corrosive environments. In summary, although metal packings excel in mass transfer efficiency and adaptability, their corrosion risks in high-temperature and corrosive environments limit their application. Plastic materials, such as PP, PVC-C, FEP, and PEEK, with their superior corrosion resistance, have become important alternatives to metal packings. However, different plastic packings vary in mechanical properties, temperature resistance, and wettability, necessitating careful selection based on specific operating conditions to optimize the long-term stability and mass transfer efficiency of purification devices.
Although extensive research has been conducted on plastic fillers both domestically and internationally, relatively few studies have focused on their performance in CO2-amine environments under high temperature and pressure. This paper selects four polymer materials–chlorinated polyvinyl chloride (PVC-C), polypropylene (PP), fluorinated ethylene propylene copolymer (FEP), and polyether ether ketone (PEEK)–to investigate their performance changes at 60 °C, 100 °C, and 130 °C. Key indicators such as volume, mass, strength, elongation, and thermal stability are the primary focus of the study. Through experimental methods including morphological characterization, thermogravimetric analysis, and vicat softening temperature testing, the performance changes of these materials in a CO2-amine environment are systematically validated. The research aims to evaluate the suitability of these materials in CO2-amine systems and provide a theoretical foundation for related applications.

2. Experiment Section

2.1. Raw Materials

The raw materials and reagents used in this paper are shown in Table 1.

2.2. Sample Preparation and Experimental Methods

2.2.1. Sample Preparation

The experimental samples were taken from purchased manufacturer pipes and cut into standard dumbbell-shaped strips using a dumbbell-shaped cutter. This sampling method maximizes the restoration of the material’s performance in practical applications, as secondary processing during sample preparation can introduce processing history that may affect the material’s properties to some extent. The dimensions of the dumbbell-shaped strips are 75 mm × 5 mm × 3 mm.

2.2.2. Experimental Method

The aging simulation test of plastic materials in the highly corrosive CO2-O2 environment of a CO2 capture system was conducted in a high-temperature and high-pressure FCZ magnetically driven reaction vessel. The autoclave has a designed volume of 5 L, with a pressure capacity of 70 MPa and a temperature limit of 250 °C. The test medium was a freshly prepared 35 wt% amine solution, obtained by uniformly mixing 3.5 kg of raw amine liquid with 6.5 kg of deionized water. The samples were first mounted using a cylindrical fixture with a diameter of Φ72 mm and CO2 gas was continuously introduced for 8 h. Subsequently, specified ratios of CO2 + SO2 and CO2 + NO2 were introduced for 2 h each. Finally, a specified ratio of O2 was introduced and the temperature was raised to the set value. Table 2 lists the experimental conditions and parameters.

2.3. Performance Testing and Characterization

2.3.1. Quality Rate of Change Testing

Quickly clean corroded sample surfaces and the corroded mass M of the sample is measured by JA3003J electronic balance. The formula for mass change rate is as follows:
m = M M 0 M 0 × 100 %
Mass volume change rate test sample size is 50 mm × 10 mm × 3 mm, where M0 is the original mass of the sample.

2.3.2. Volume Rate of Change Test

Quickly clean corroded sample surfaces and measure the corroded volume V of the sample with the JA3003J solid density balance. The formula for the volume change rate is as follows:
v = V V 0 V 0 × 100 %
where V0 is the original volume of the sample.

2.3.3. Stretch Test

On the universal electronic tensile test machine, the tensile property of the tensile sample is tested according to GB/T1040 standard [23], the standard distance is 25 mm, and the test speed is 1 mm/min. The experimental data were measured at least three times and the test results showed tensile strength and elongation.

2.3.4. Fourier Infrared Spectroscopy (FTIR) Testing

At room temperature, the samples were measured using a Nicolet IS5 Fourier Transform Infrared (FTIR) Spectrometer, with a wavelength range of 400–4000 cm−1. The FTIR spectrometer can identify the functional groups present in PVC-C, PP, FEP, and PEEK [24].

2.3.5. Scanning Electron Microscope (SEM) Test

Quanta 200 F field emission environmental scanning electron microscope was used to observe the morphology of the samples before and after the reaction. An appropriate amount of samples was placed on the sample tray and then the samples were sprayed with gold for testing.

2.3.6. Thermogravimetric Analysis (TGA) Test

The samples were tested using a thermogravimetric analyzer (TGA) in a nitrogen atmosphere at a heating rate of 10 °C/min, with a measurement range of 30–800 °C. The detailed measurements of weight changes over time and temperature (TGA data) were continuously recorded and analyzed, allowing the study of the thermal stability and thermal decomposition behavior of the samples through their weight changes [25].

2.3.7. Vica Softening Temperature Test

The vicat softening temperature (VST) of the material was tested using the vicat softening temperature tester model XHW-300E. The test condition was B50, the load was 50 N, and the heating rate was 50 °C/h. The initial test temperature was 20 °C, the sample size was 10 mm × 10 mm × 3 mm, and the VST of the material was recorded when the needle was inserted into the sample at a depth of 1 mm.

2.3.8. Differential Scanning Calorimetry

The thermodynamic properties of the sample are studied by differential scanning calorimeter (DSC). The sample with a mass of about 8 mg was clipped, put into a crucible, and placed in a nitrogen atmosphere of 50 mL/min and the sample was heated from room temperature to 350 °C at a rate of 10 °C/min and then cooled to room temperature.

2.4. Experimental Equipment

The experimental instruments used in this paper are shown in Table 3.

3. Results and Discussion

3.1. Chlorinated Polyvinyl Chloride (PVC-C) Corrosion Resistance at High Temperature and Pressure

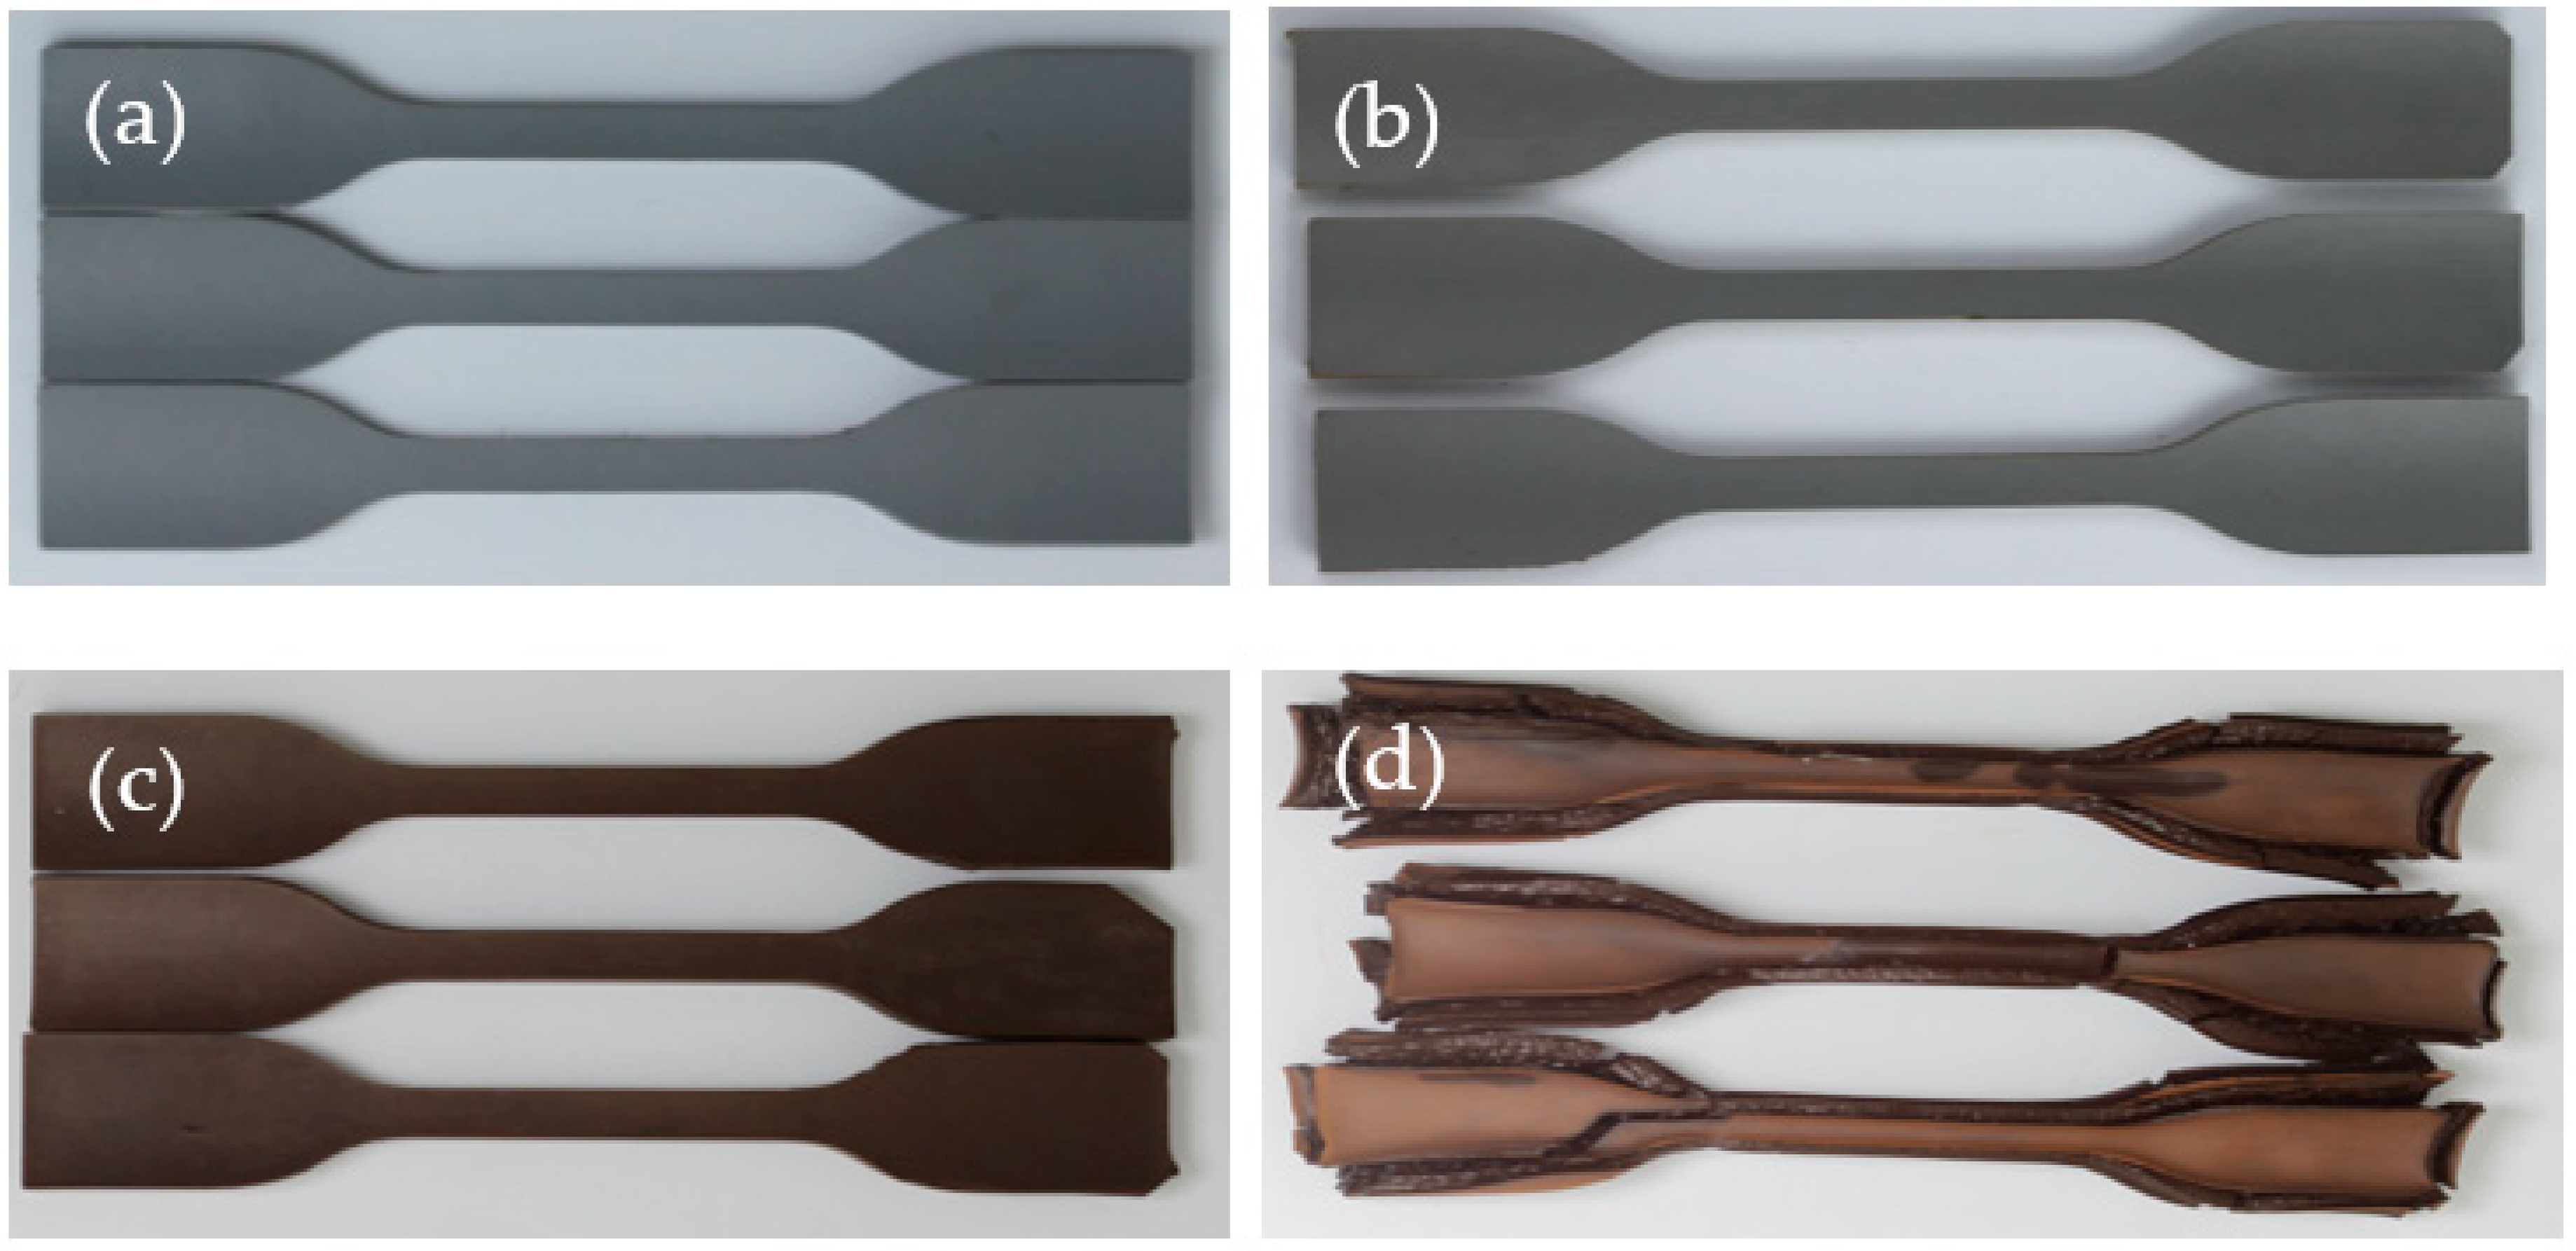
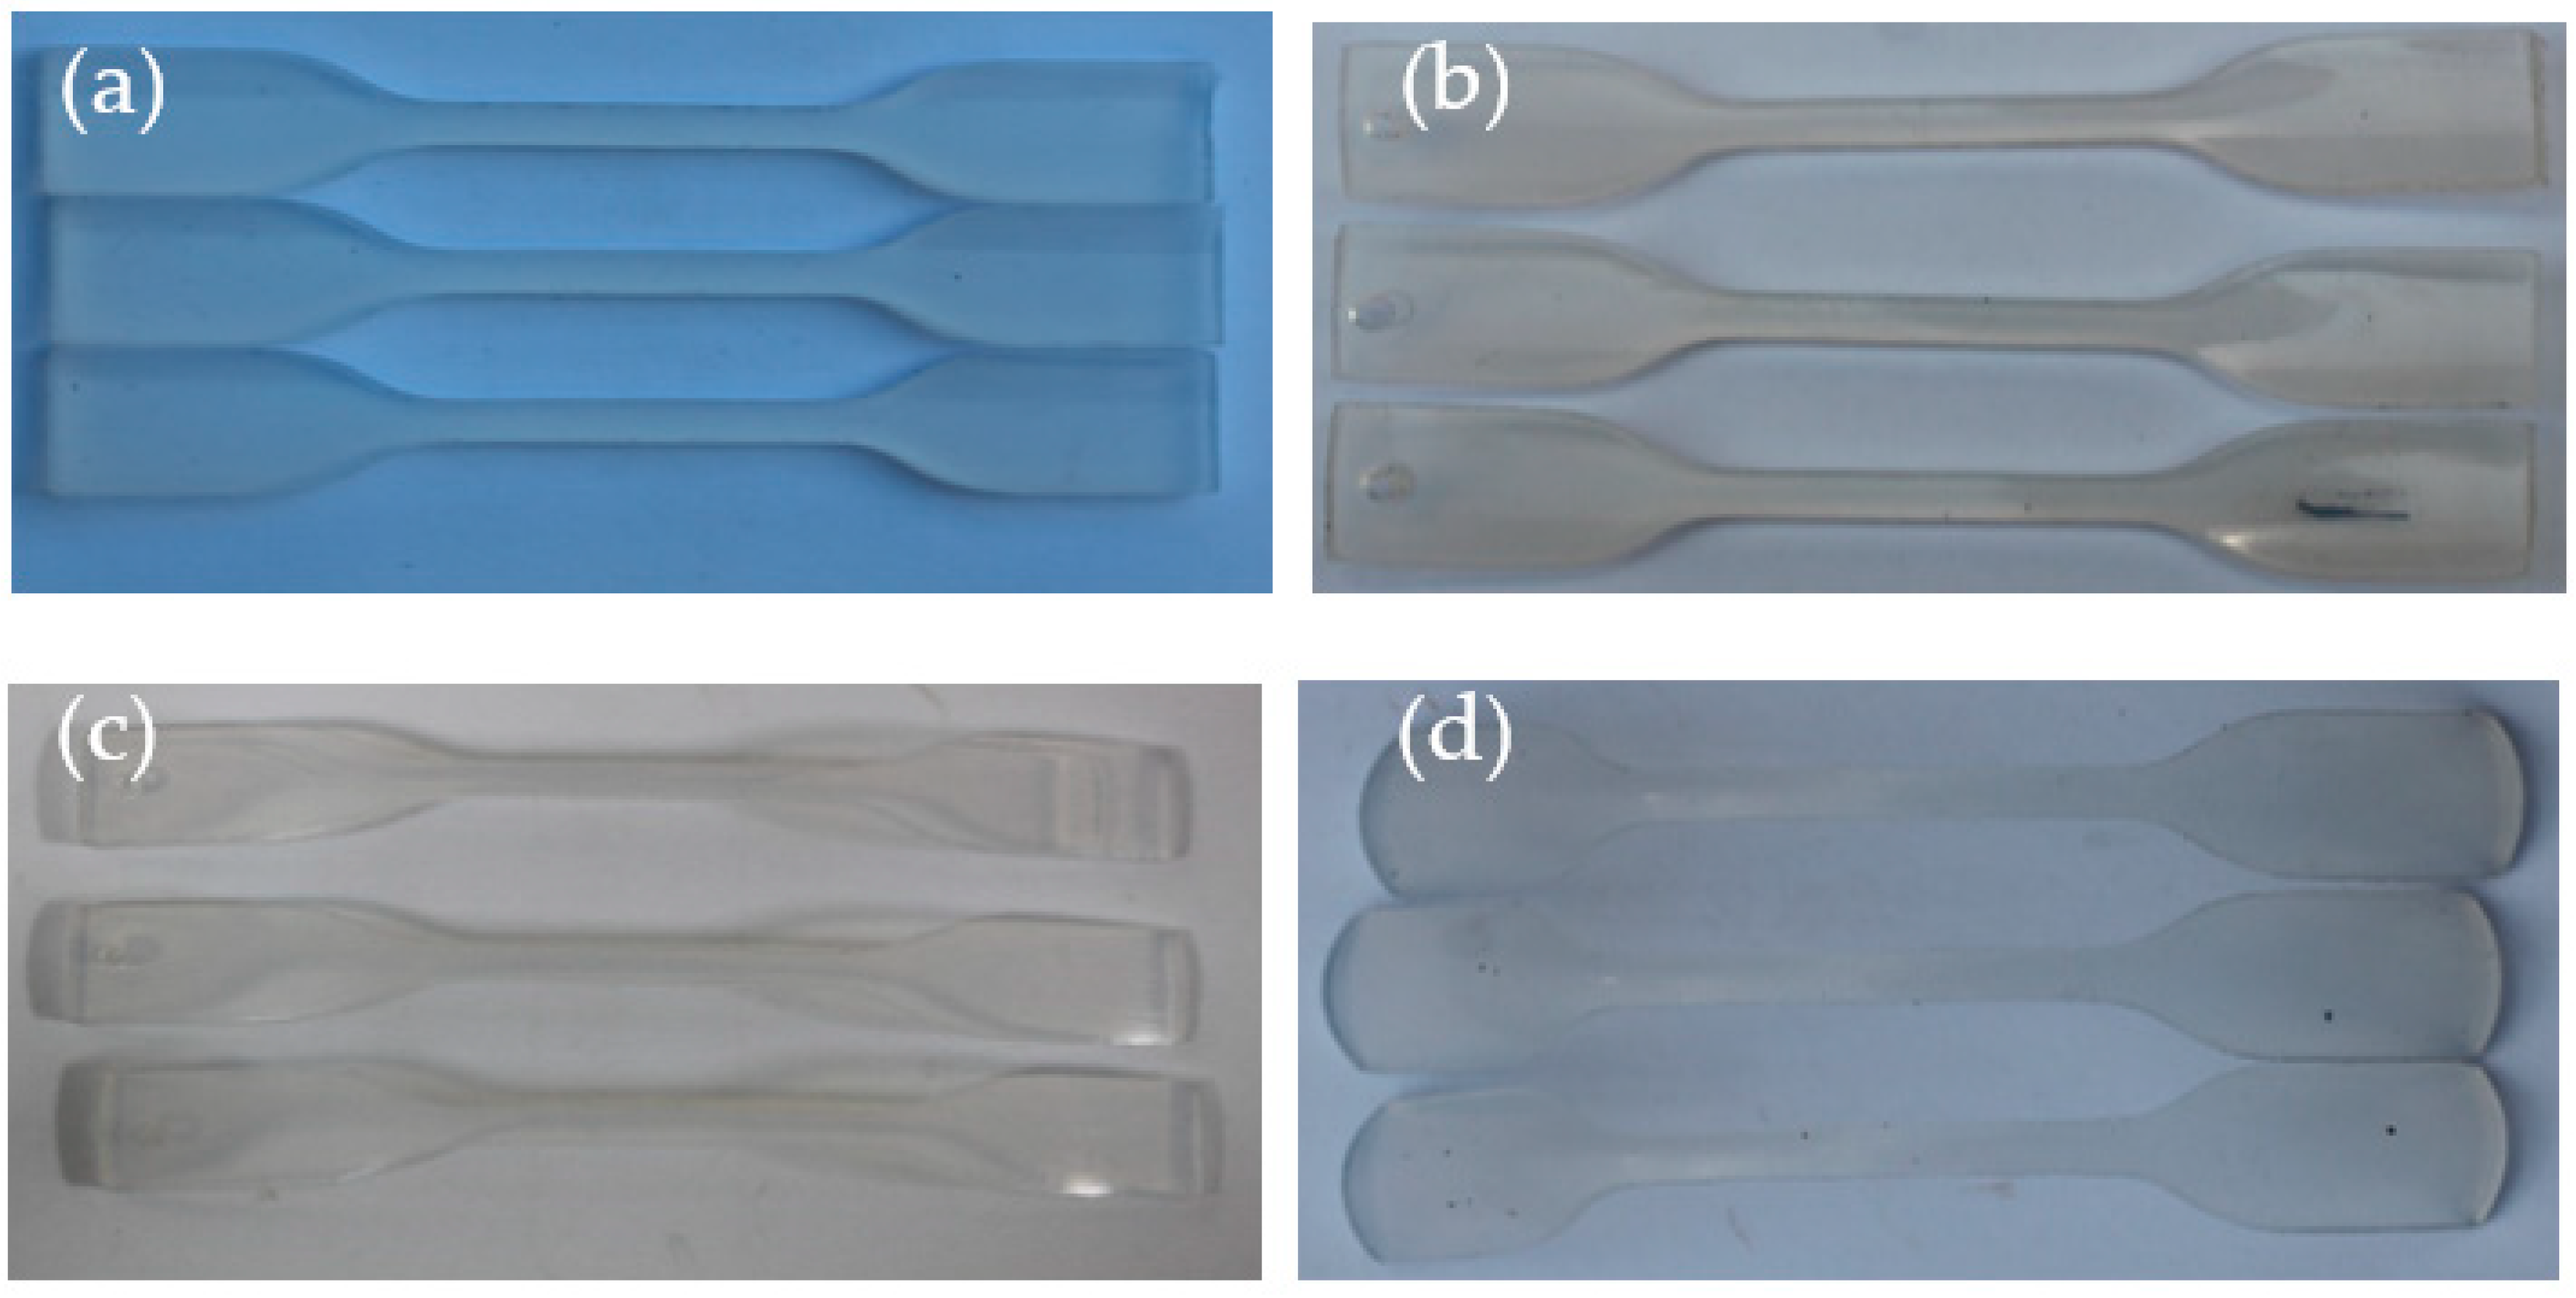
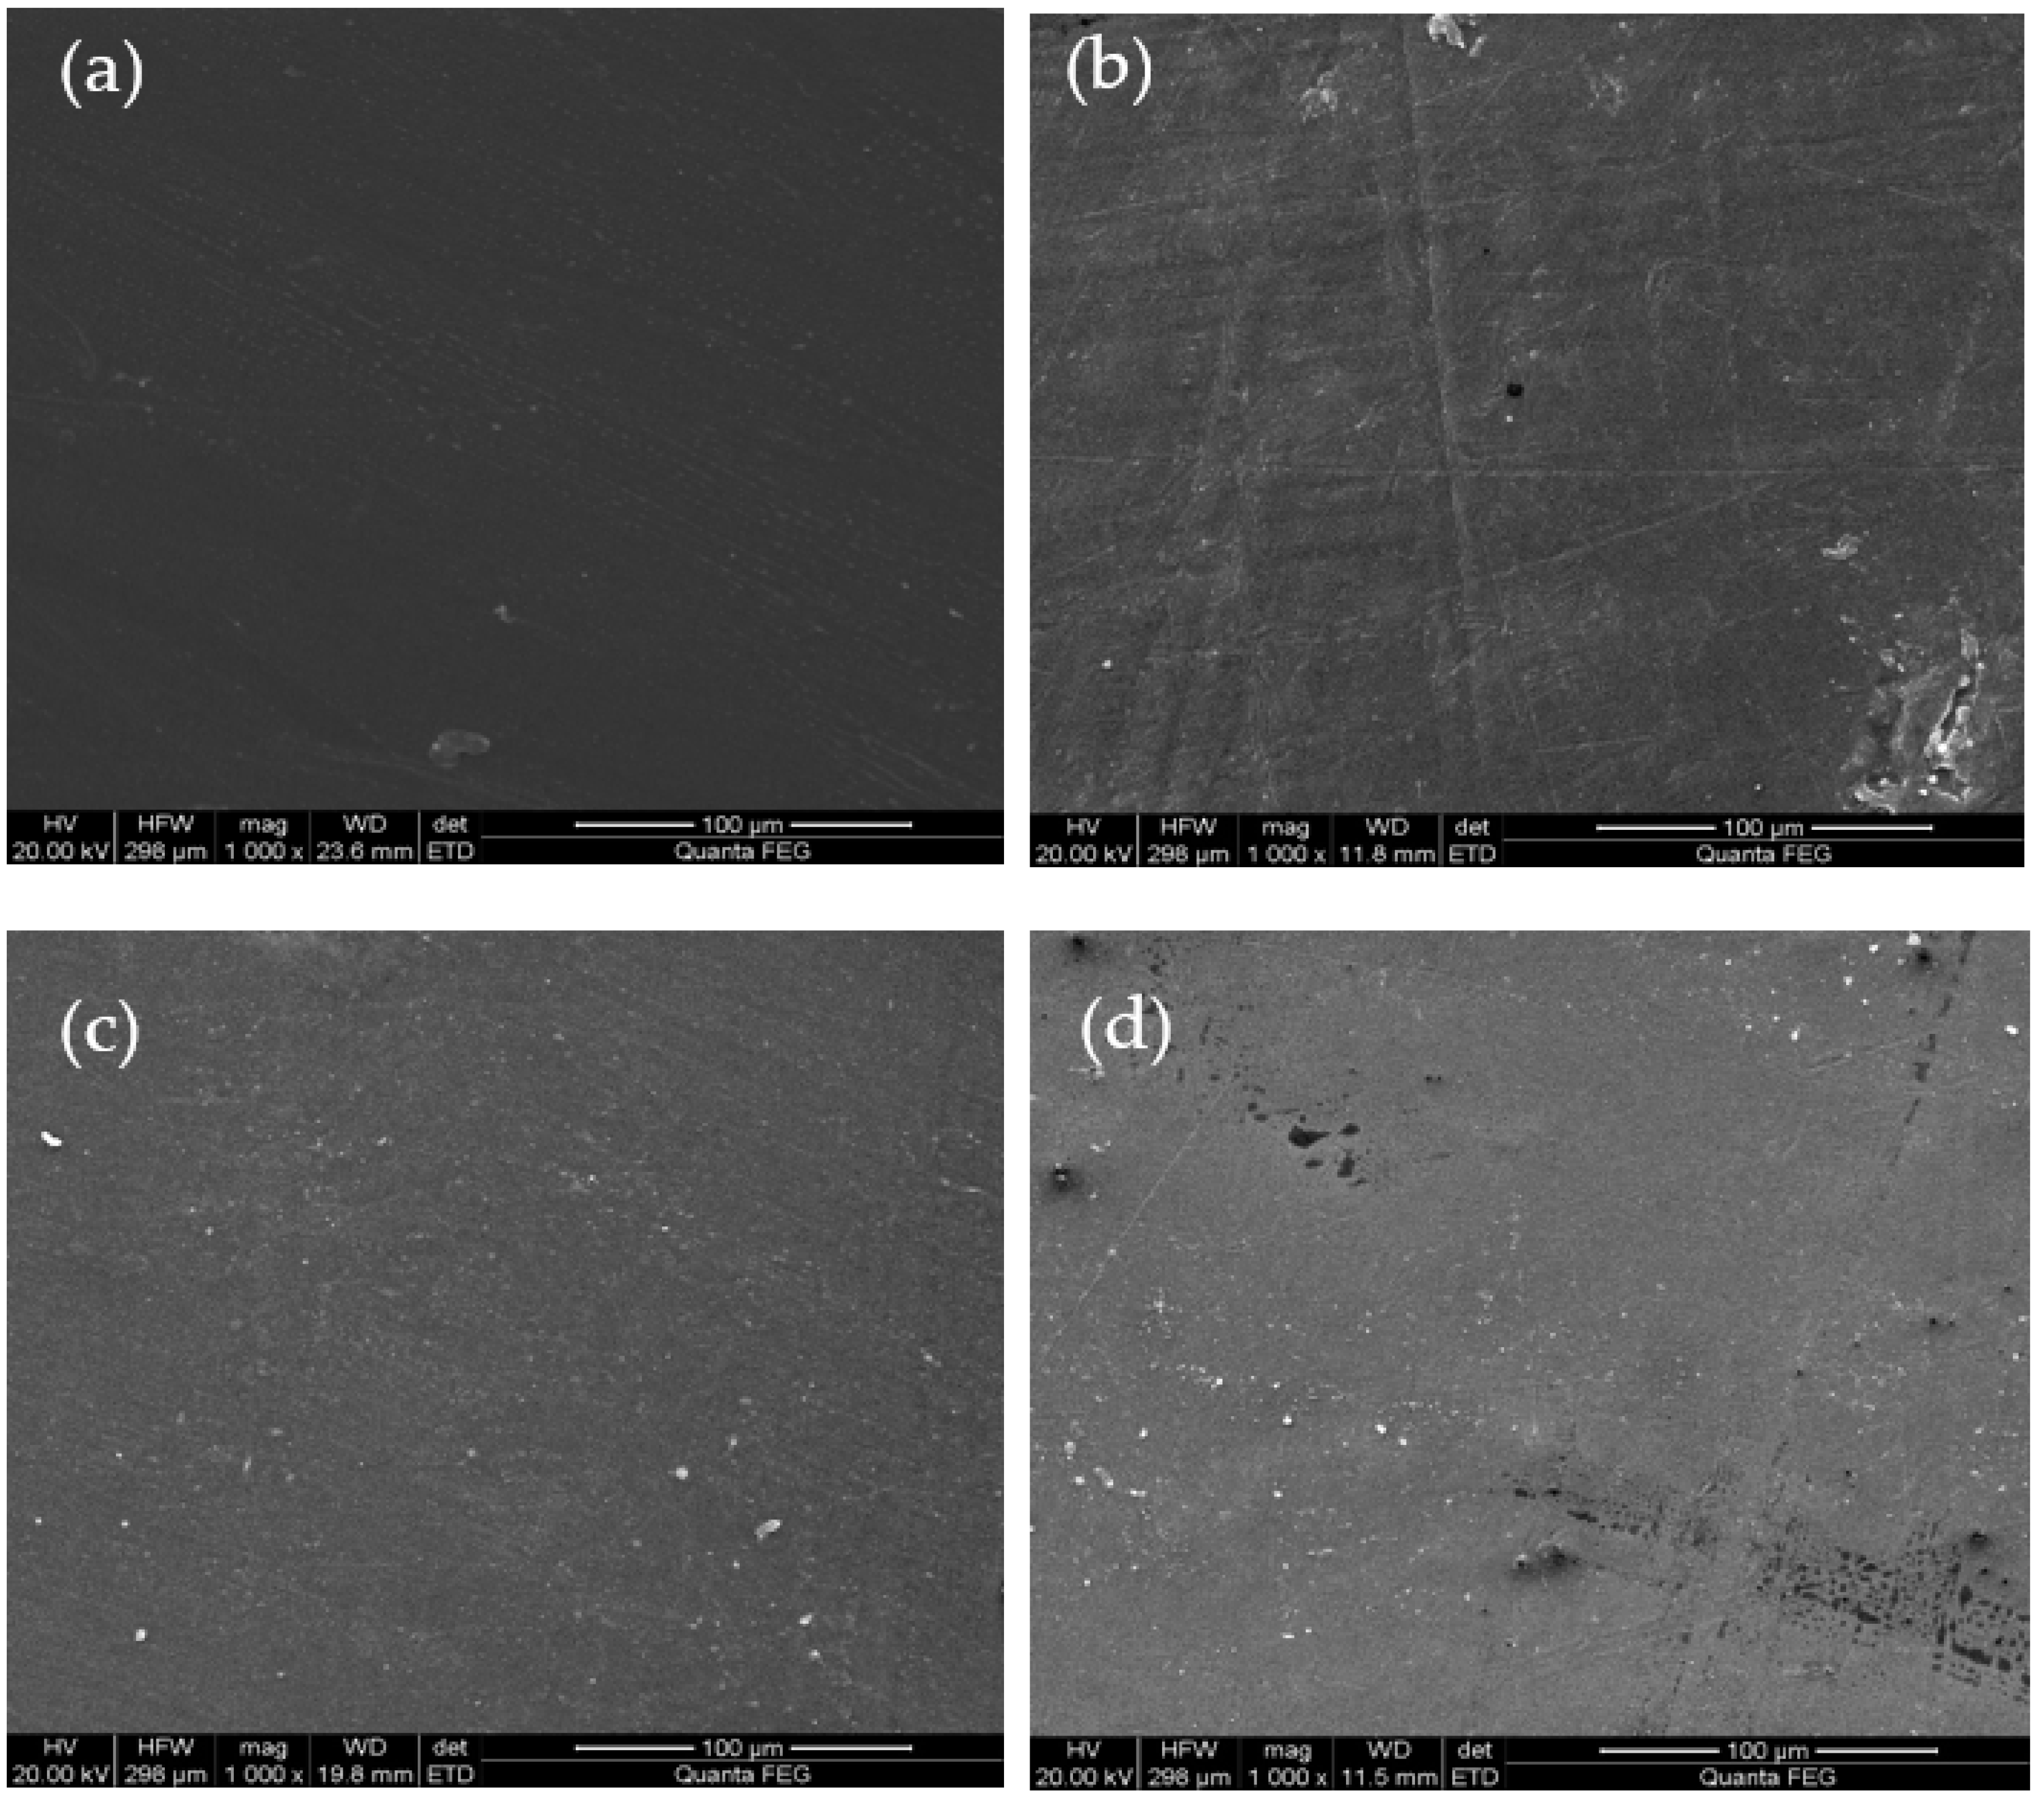
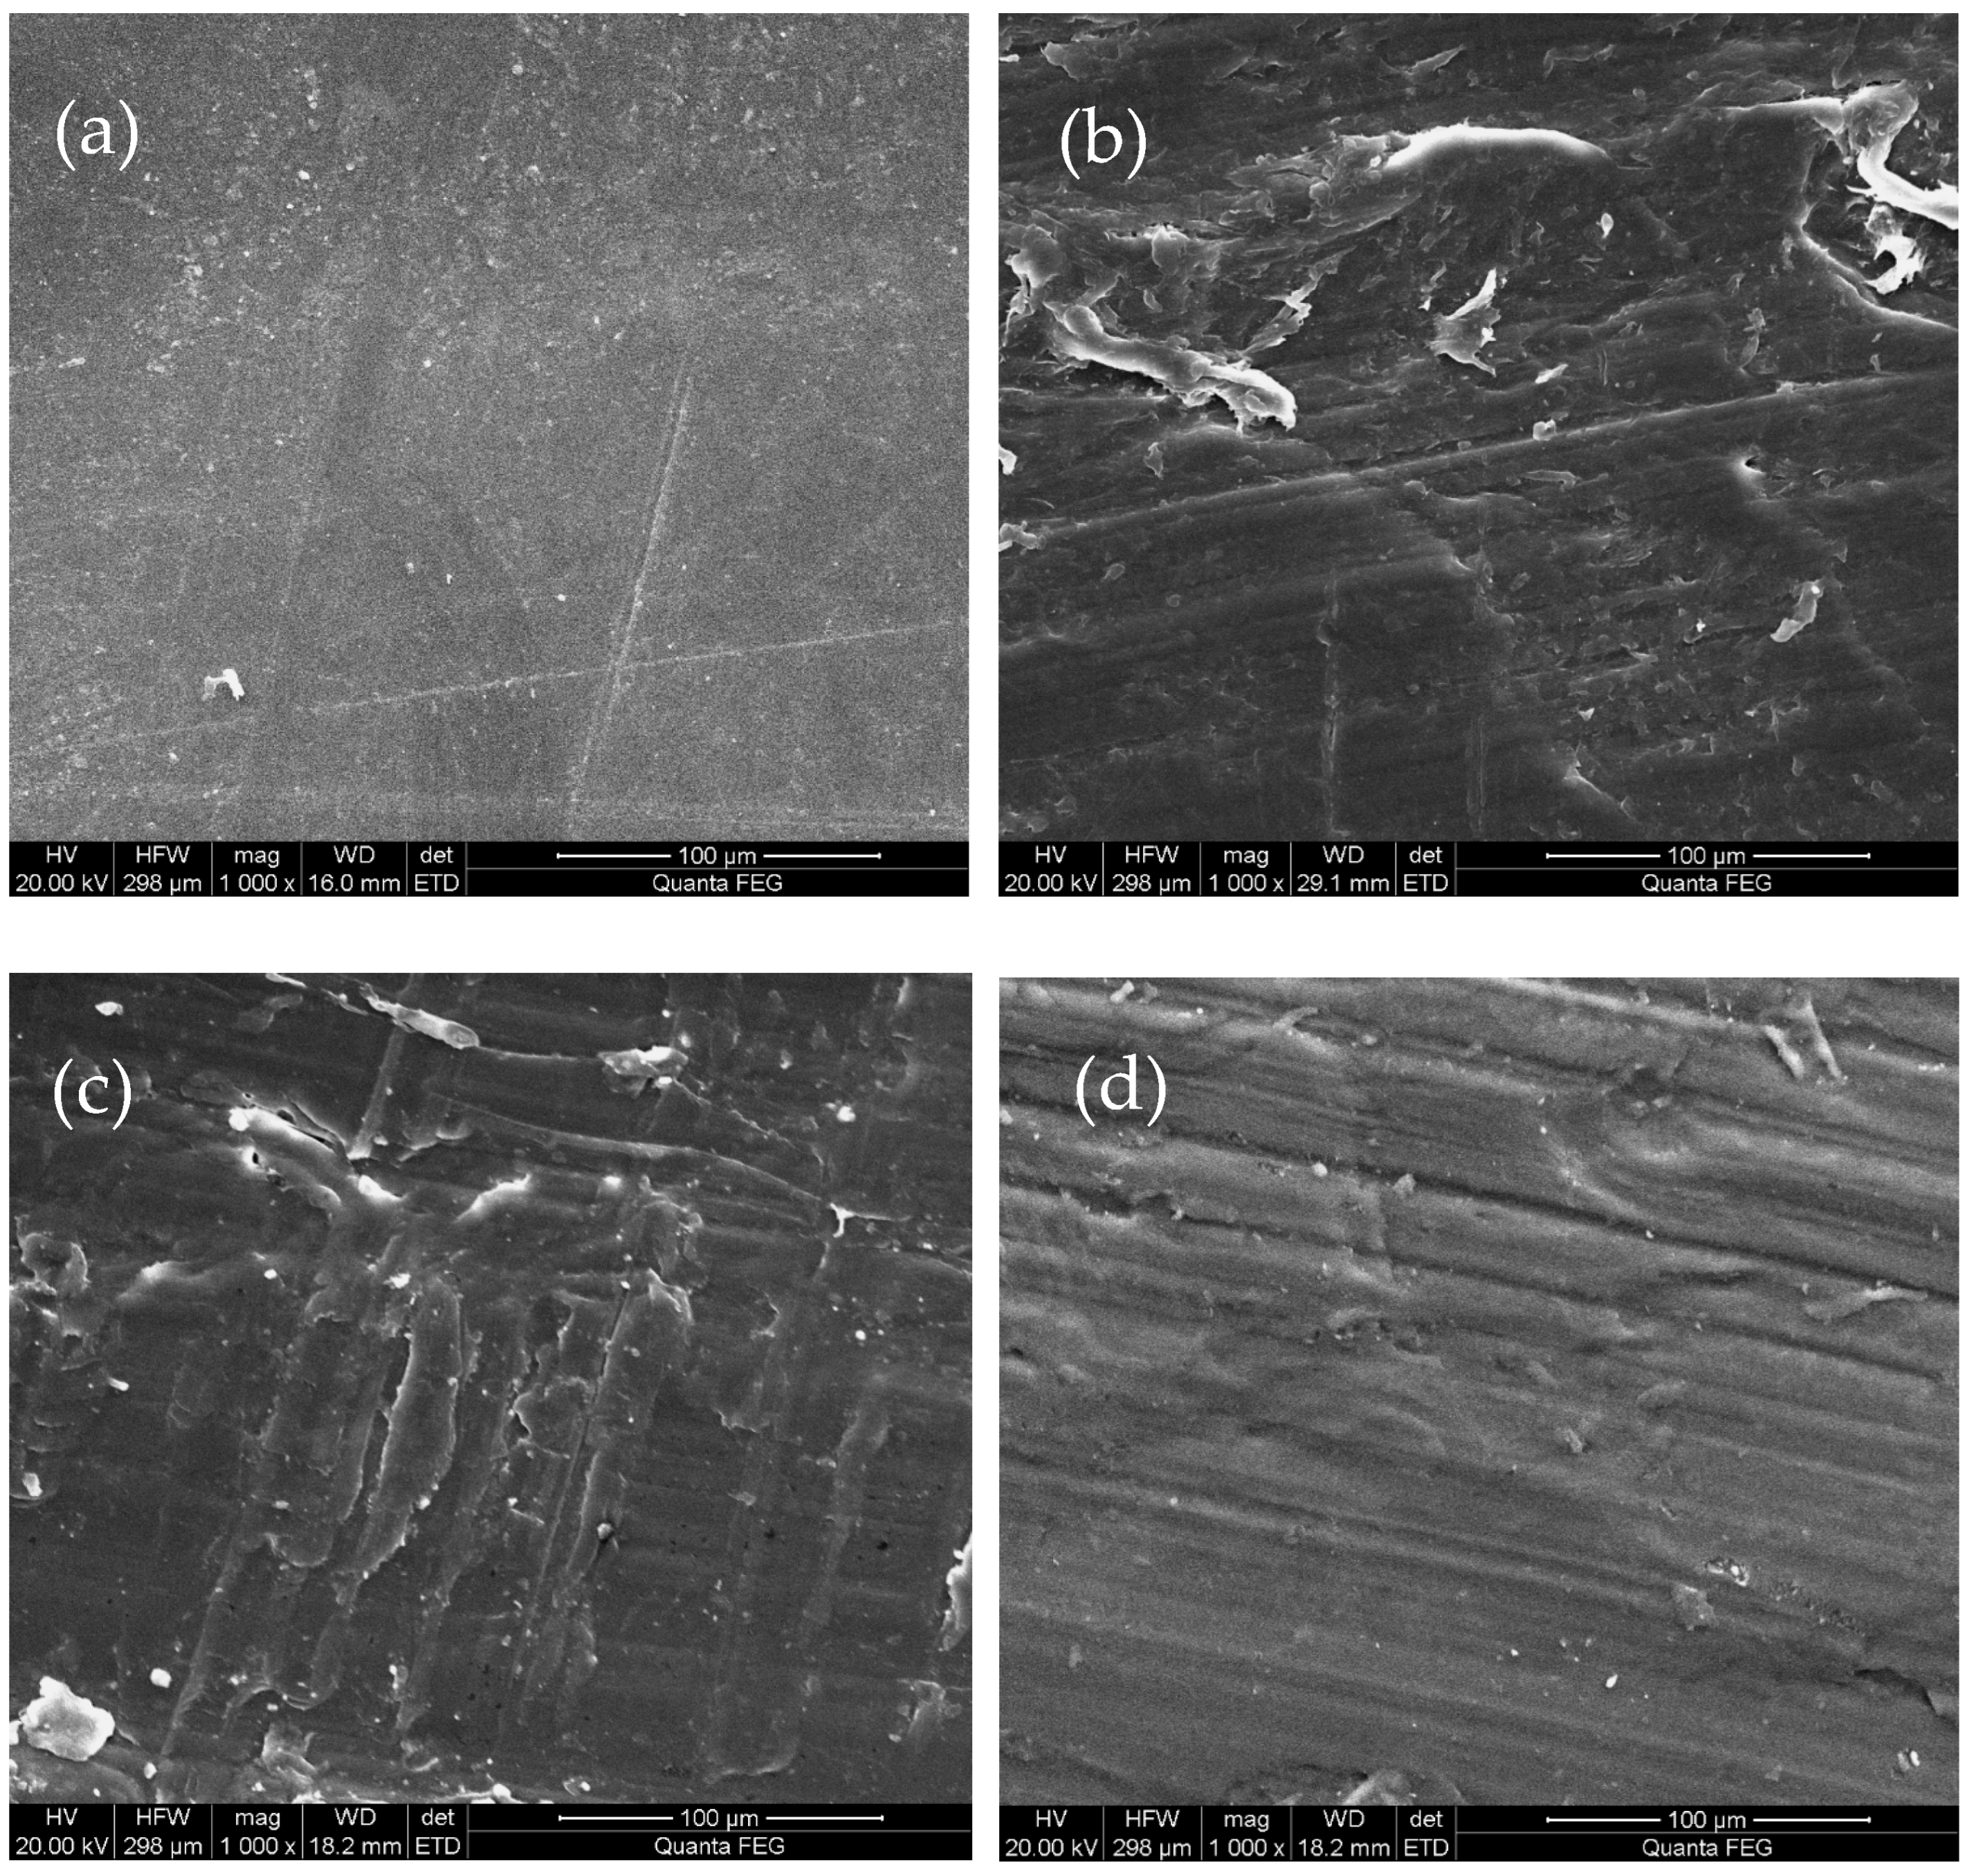
3.1.1. Morphological Changes

Corrosion simulation experiments of PVC-C in amine solution were conducted at different temperatures. The changes in the corrosion morphology of PVC-C were analyzed under simulated conditions of the absorption tower and regeneration tower. As shown in Figure 1, from a macroscopic perspective, the color of PVC-C slightly yellowed and as the temperature increased, the color change deepened until it turned brown.
As observed by scanning electron microscopy, as shown in Figure 2, with the increase in experimental temperature, the surface morphology of PVC-C became increasingly rough. When the experimental temperature reached 130 °C, the PVC-C sample was severely corroded and cracked, making it impossible to examine under the scanning electron microscope.

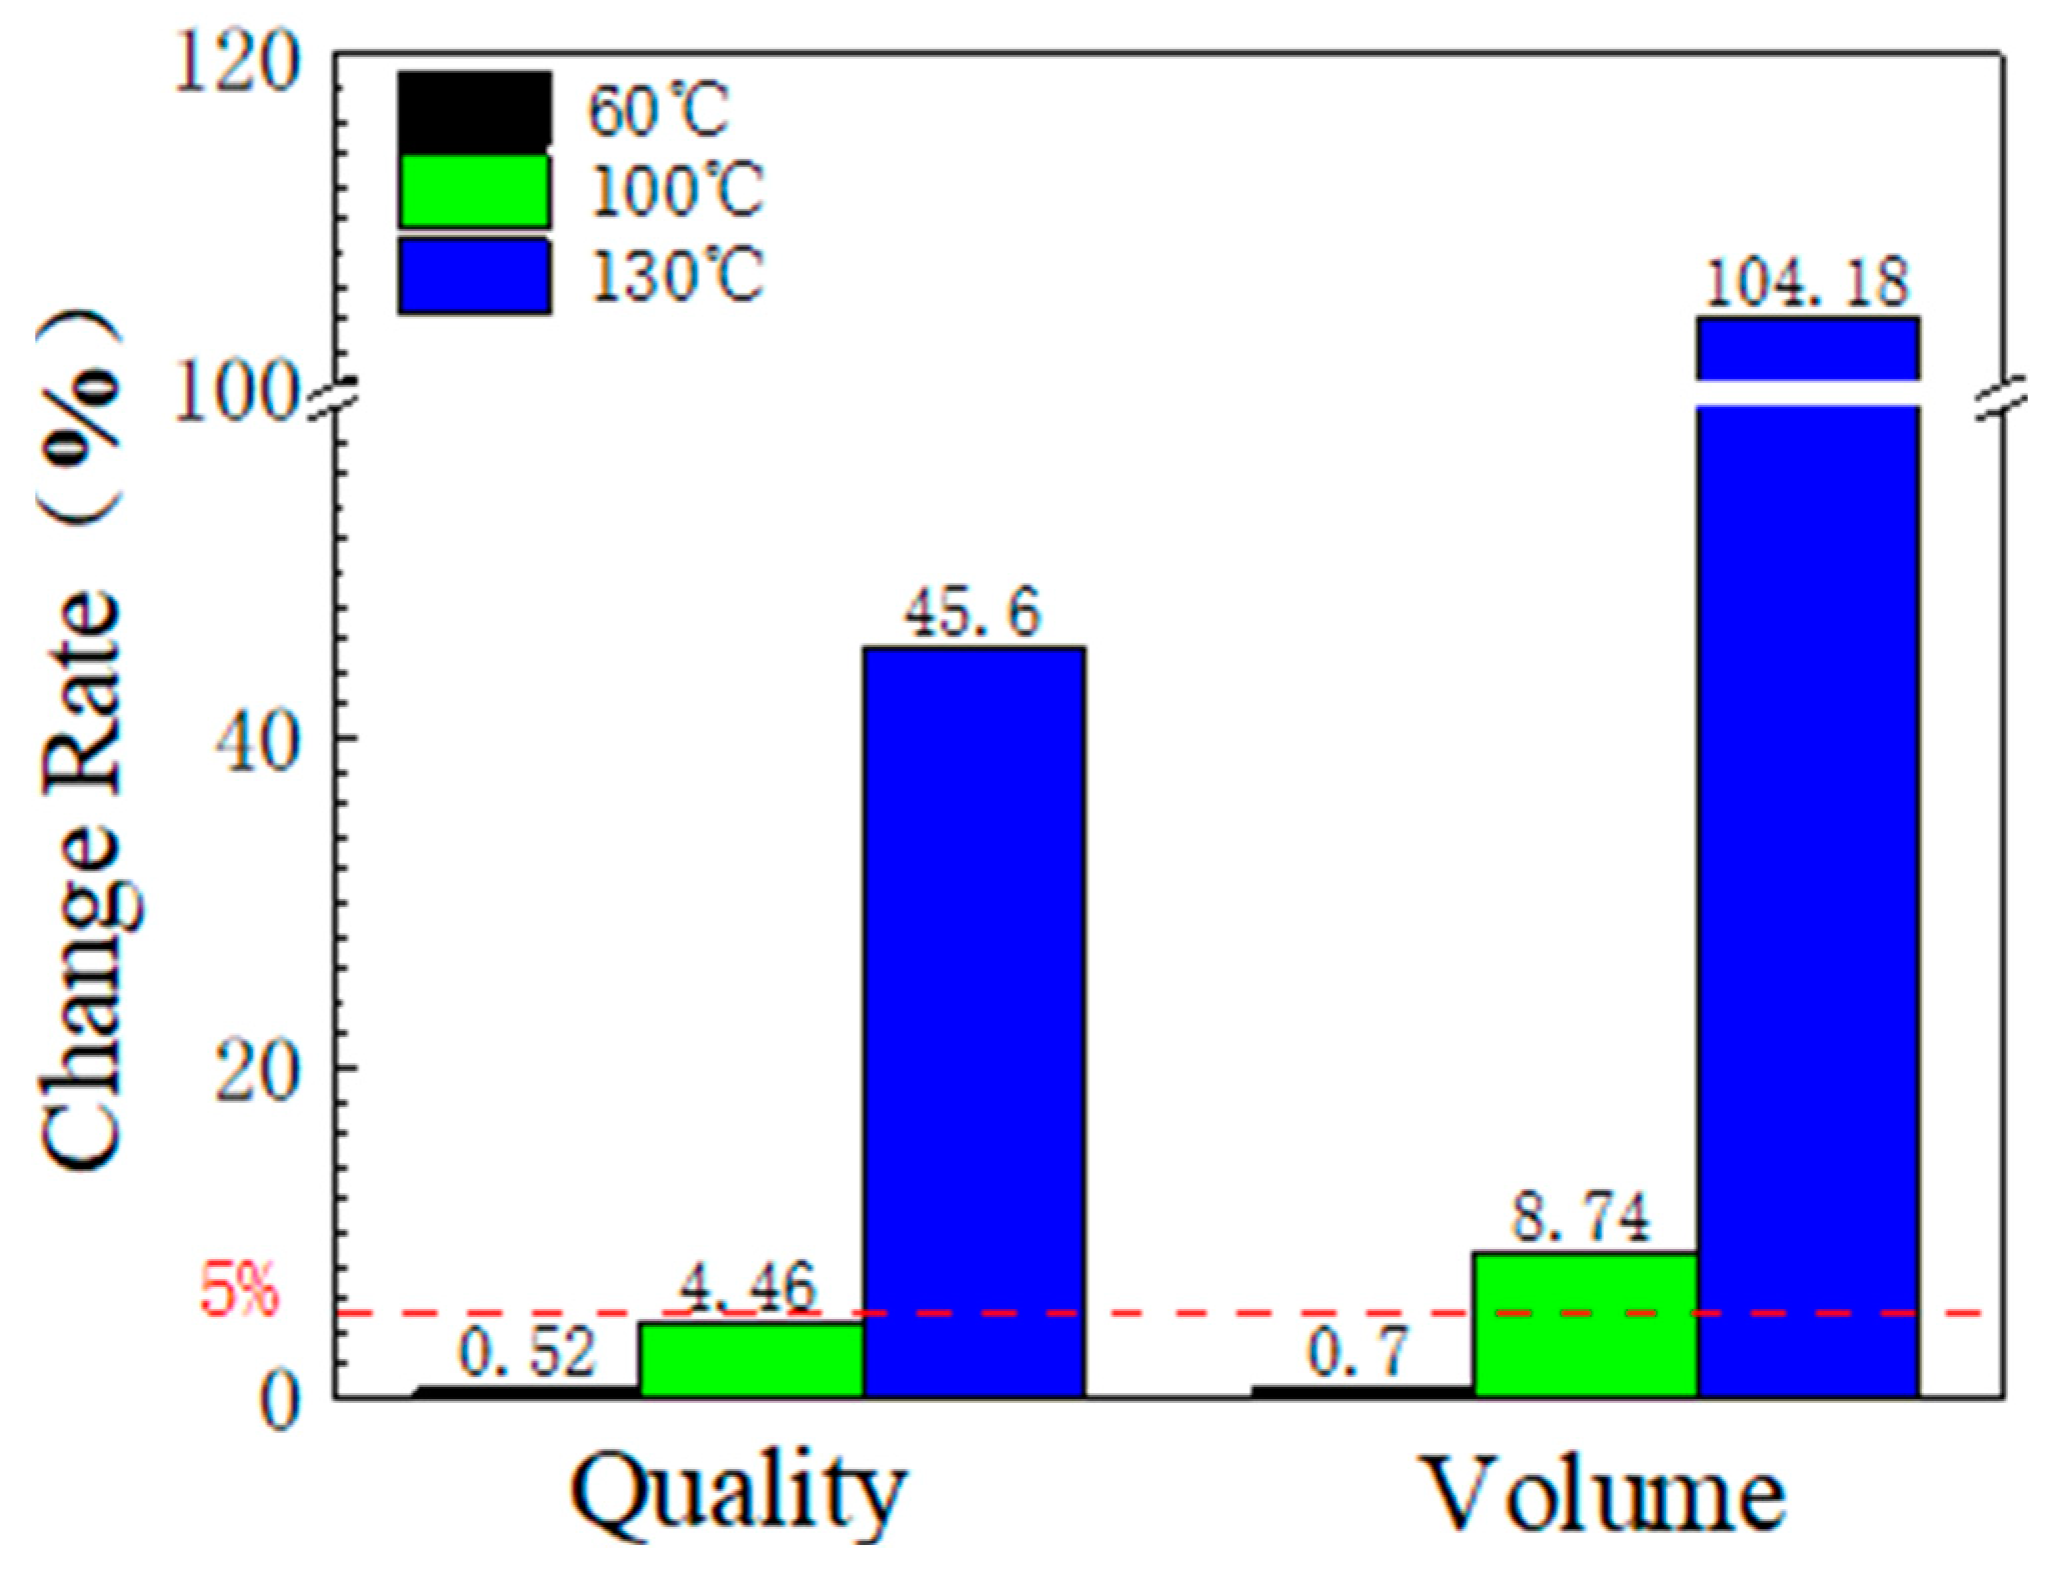
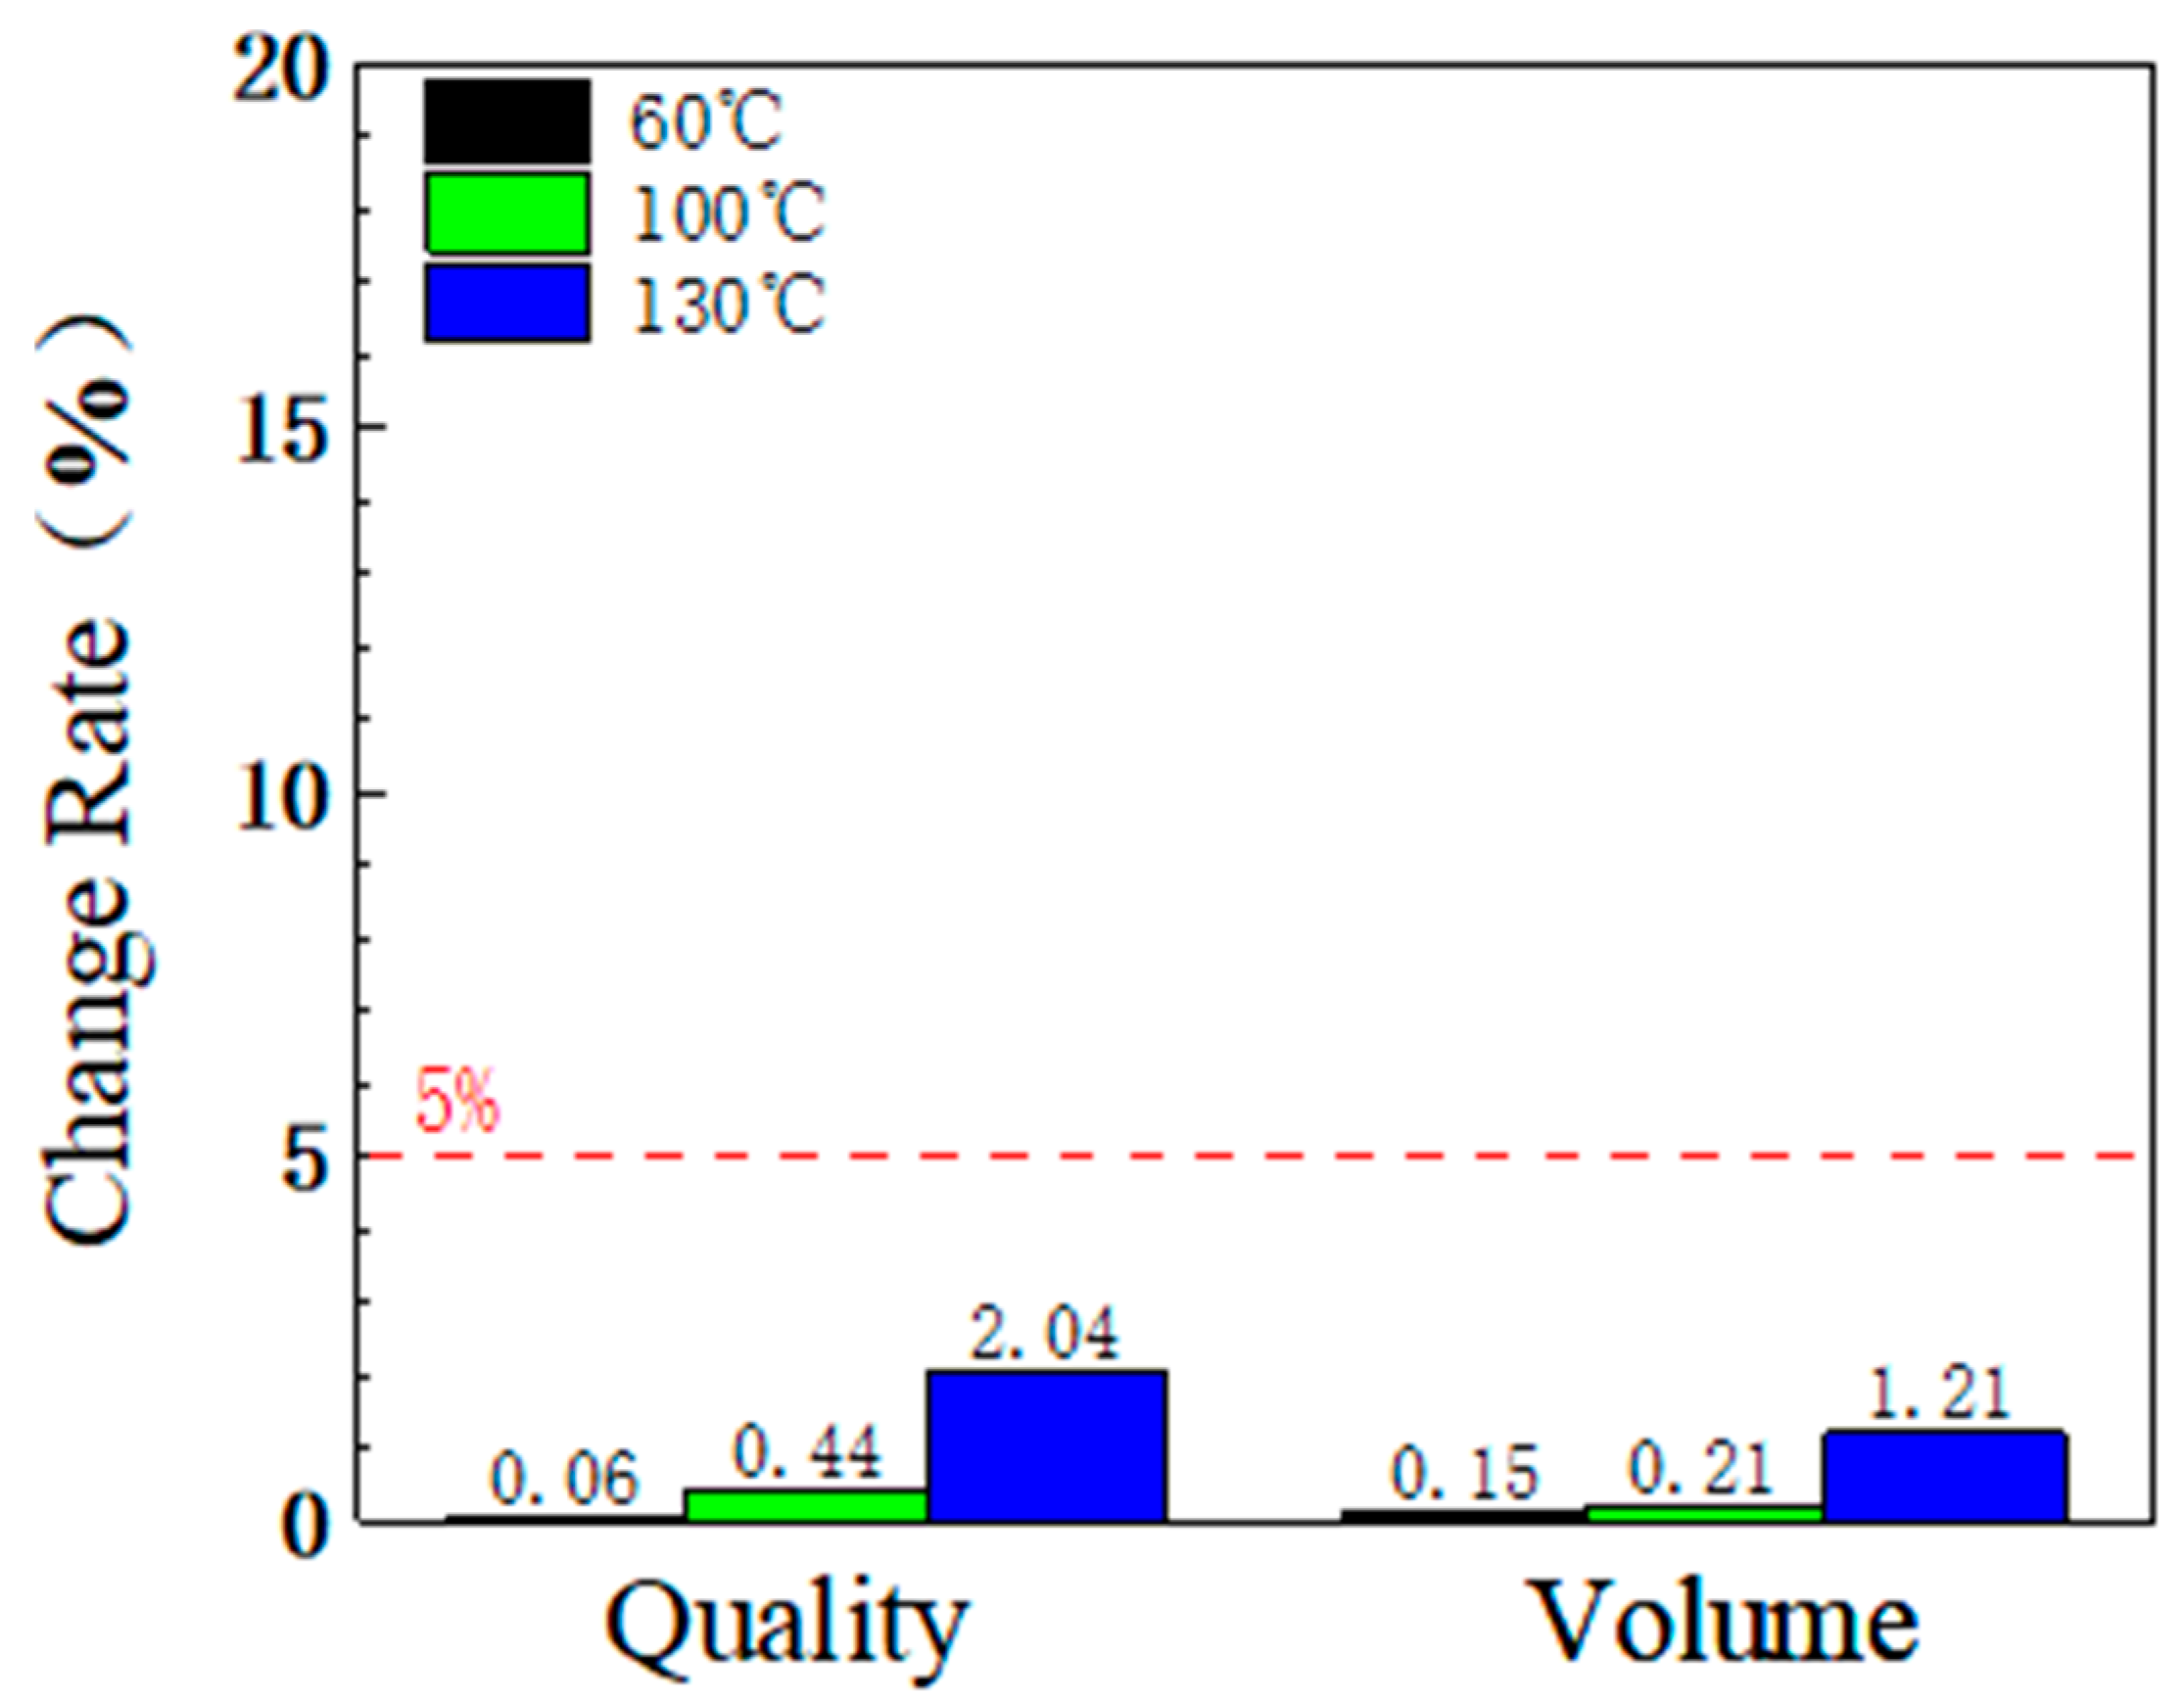
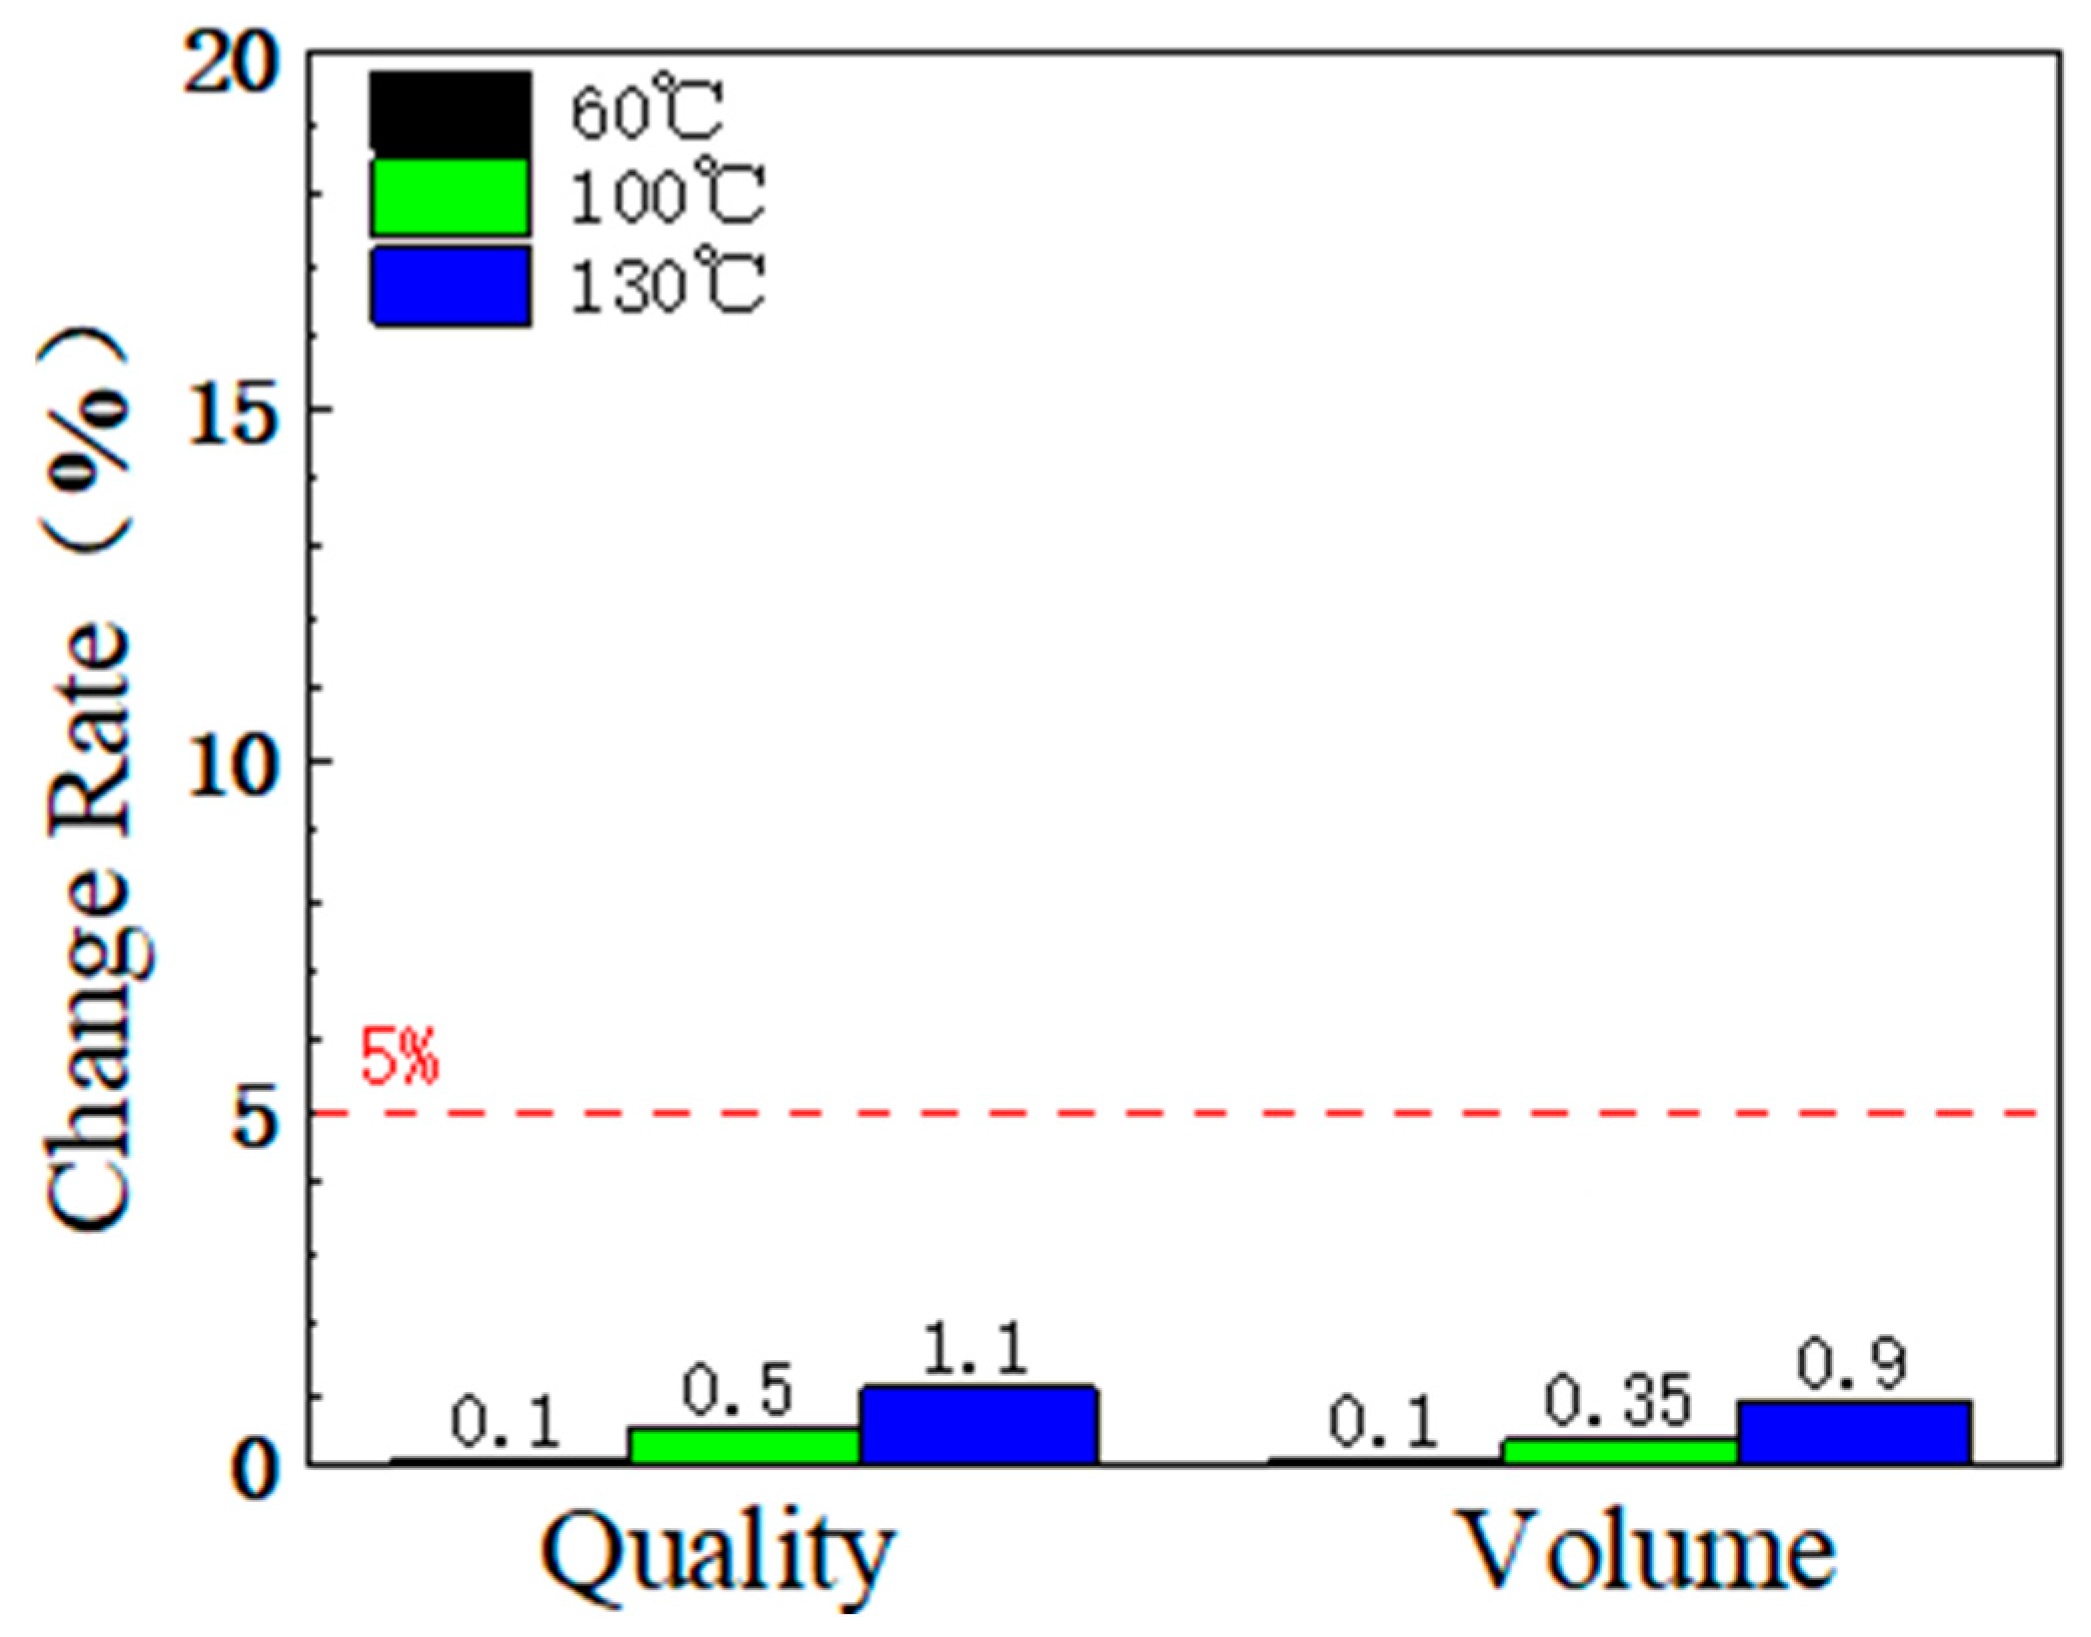
3.1.2. Mass and Volume Change

After processing the corroded specimens, the mass change rate and volume change rate of PVC-C under simulated working conditions were calculated using a precision electronic balance and corresponding formulas. As shown in Figure 3, the mass and volume change rates of PVC-C increased with rising temperature. At 100 °C and 130 °C, the volume change rates were 8.74% and 104.18%, respectively, while the mass change rate at 100 °C reached 45.6%, both exceeding 5%.

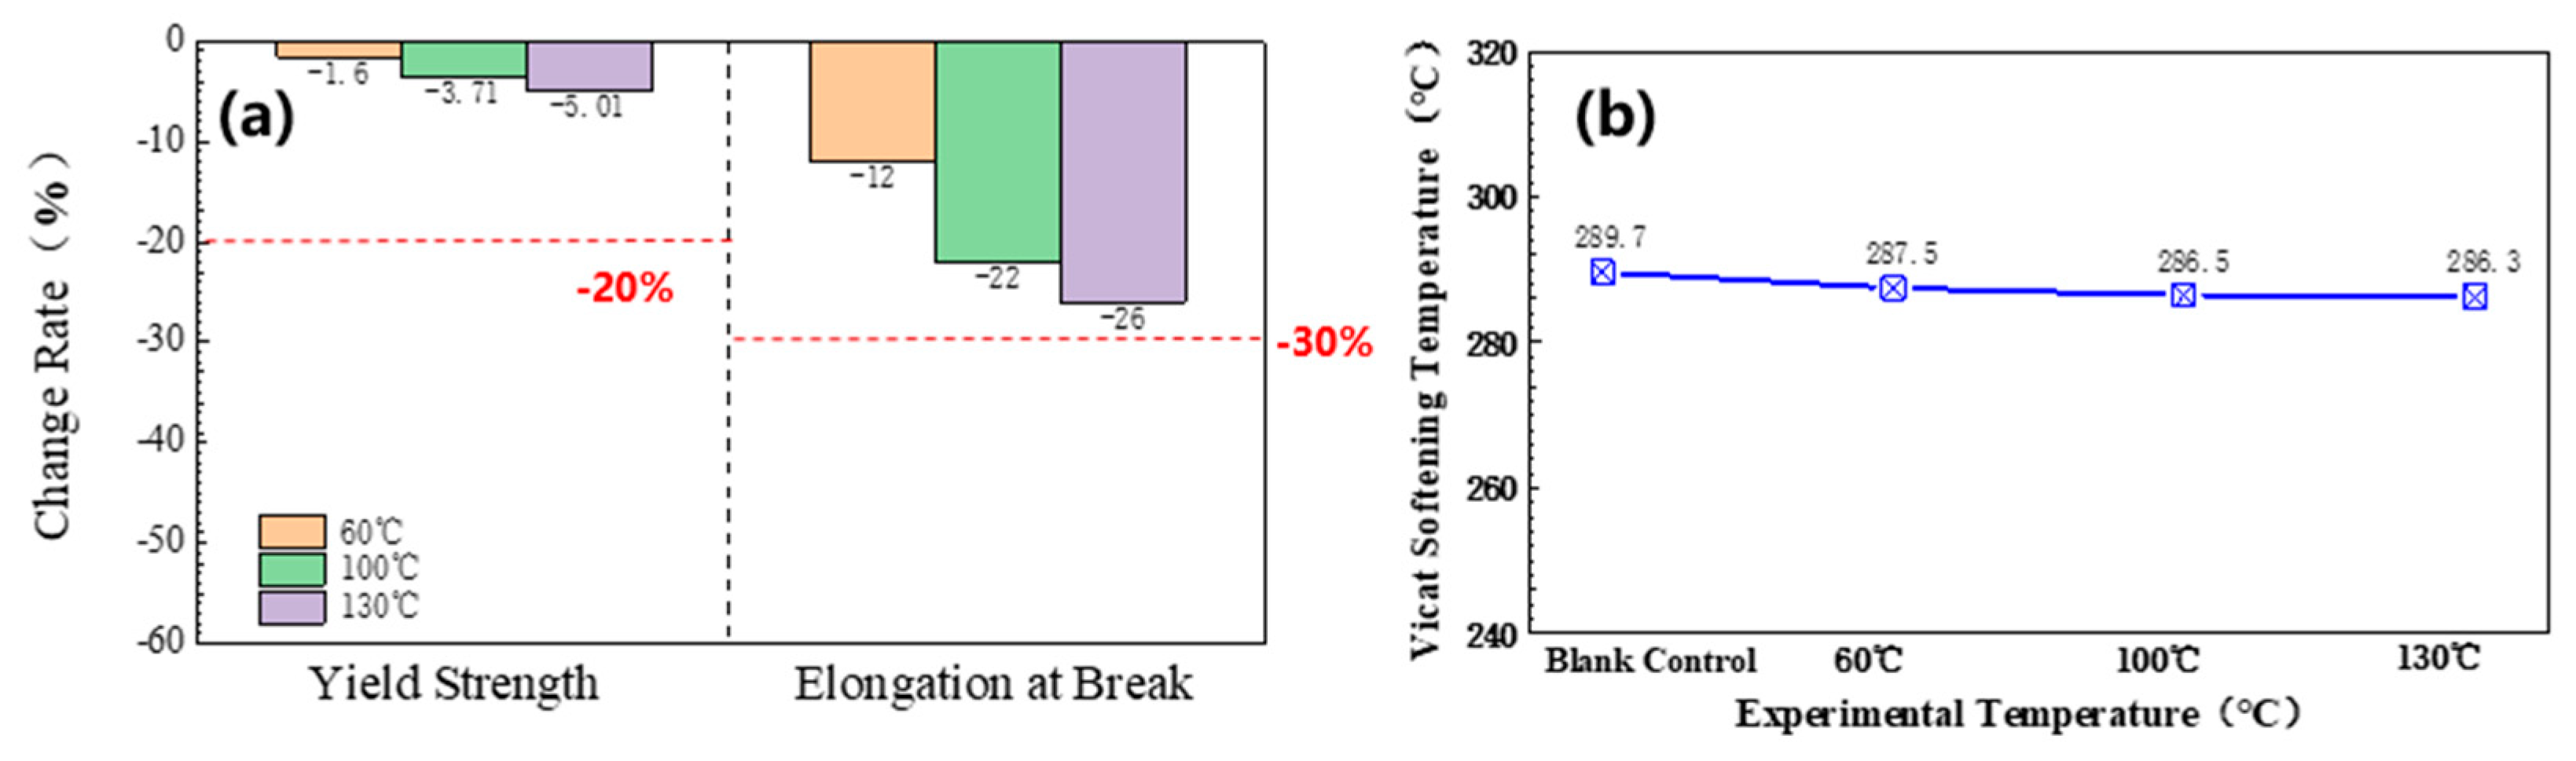
3.1.3. Mechanics and Change of Softening Temperature of Vicat

Tensile tests were conducted on a tensile machine, and the changes in the mechanical properties of PVC-C are shown in Figure 4a. The yield strength of PVC-C decreased with increasing temperature. At temperatures above 100 °C, the rate of change in elongation at break far exceeded −30%, reaching −74.9%. When the temperature reached 130 °C, the material had severely cracked, making it impossible to measure the yield strength and elongation. vicat softening point tests were performed on a vicat tester and the results are shown in Figure 4b. Under environments of 60 °C and 100 °C, the vicat softening temperature of PVC-C did not change, remaining at 112 °C.

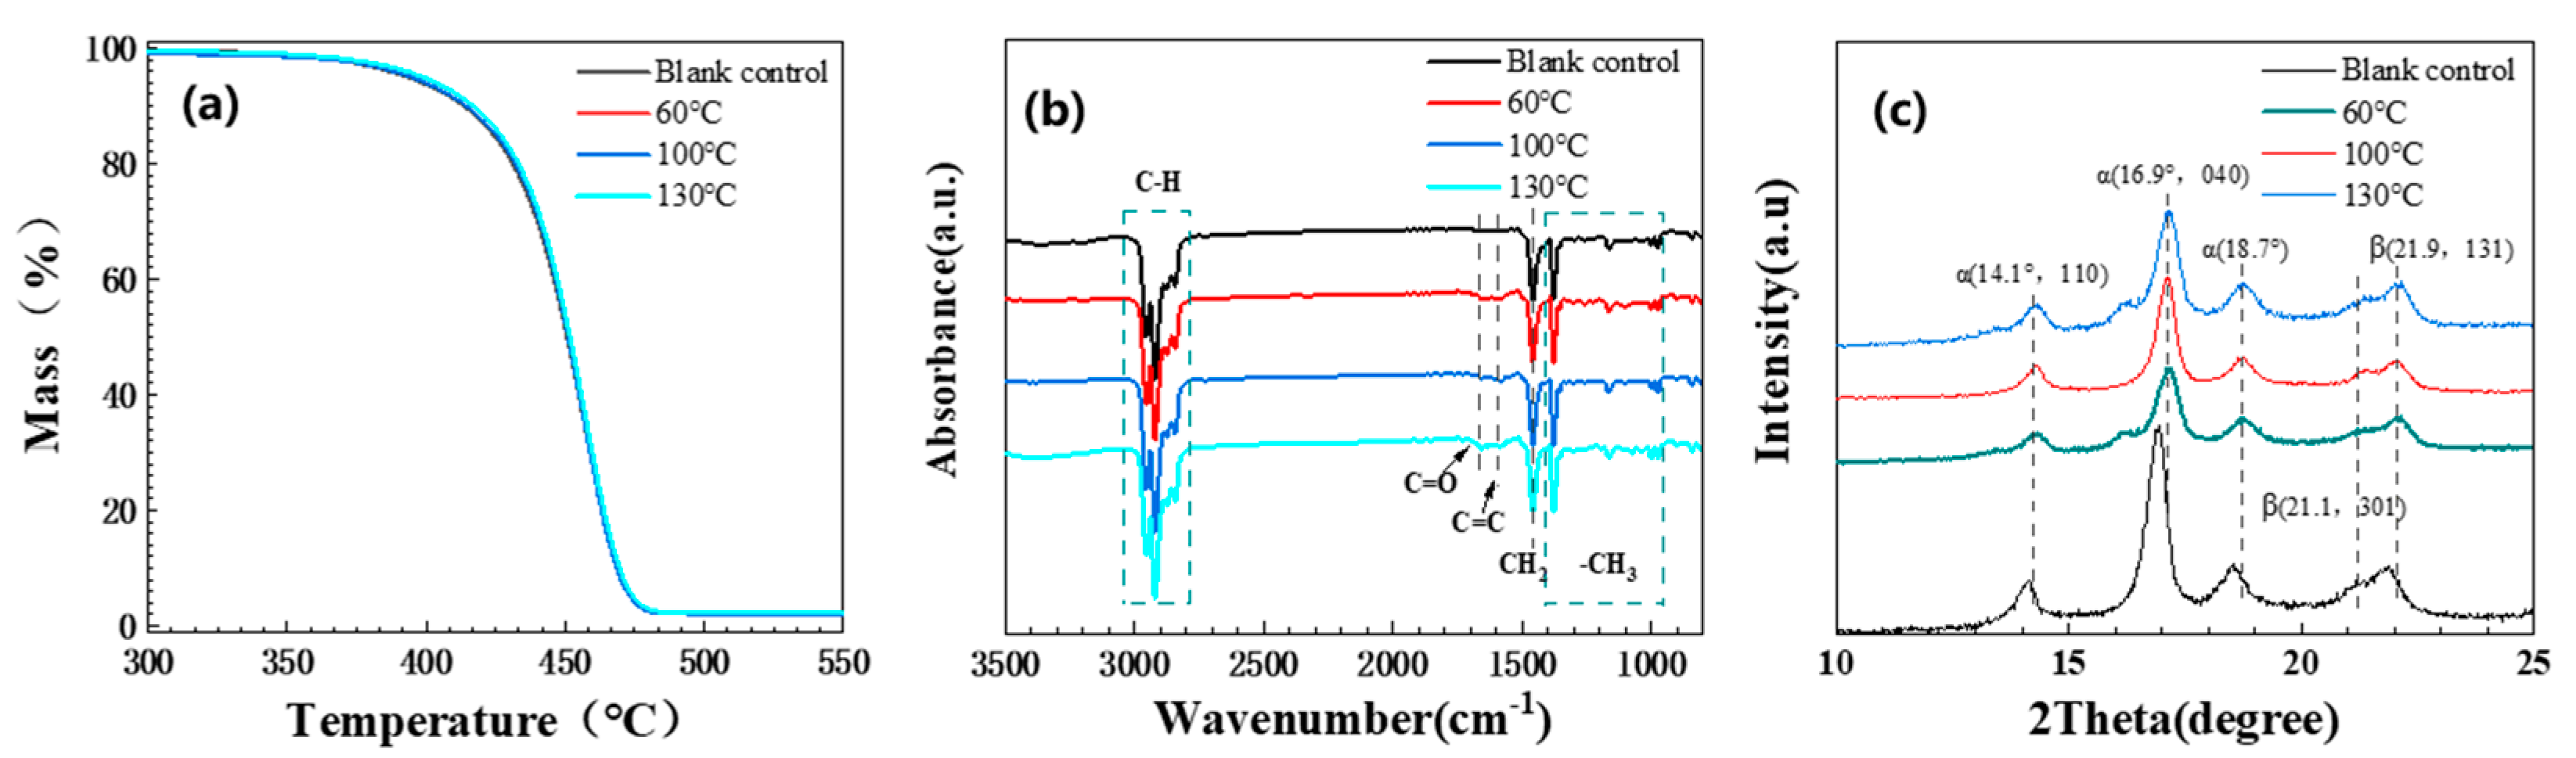
3.1.4. Other Performance Changes

To investigate the reaction mechanism between PVC-C and amine solutions, the changes in the chemical structure of the post-experiment samples at different temperatures were analyzed using FTIR spectroscopy. As shown in Figure 5b, the absorption peaks of C–H stretching vibrations in the range of 2800 cm−1 to 3000 cm−1 and the absorption peaks of C–H bending vibrations in the range of 950 cm−1 to 1450 cm−1 did not show significant changes. This indicates that the main structure of the PVC-C molecular chain did not undergo significant alterations during the thermal decomposition process under the experimental conditions. During the corrosion process, as the heating time of PVC-C increased, the O–H stretching vibration peak near 3450 cm−1, the C=O absorption peak near 1720 cm−1, and the C=C double bond absorption peaks in the range of 1500 cm−1 to 1700 cm−1 exhibited varying degrees of change. Notably, the O–H stretching vibration peak near 3450 cm−1 significantly decreased with increasing heating temperature. At 100 °C, the characteristic C–Cl peak of PVC-C at 797 cm−1 disappeared.
To investigate whether the amine solution affects the thermal stability of PVC-C, the thermal stability of PVC-C at different temperatures was analyzed through TGA testing, and the results are shown in Figure 5a. The degradation of all samples occurred around 270 °C, which is attributed to the fact that –Cl in PVC-C is easily removed upon heating, resulting in a relatively low degradation temperature. After the corrosion experiment at 100 °C, the initial degradation temperature of the PVC-C sample significantly decreased, indicating that the molecular chains of PVC-C may have decomposed under heating conditions.

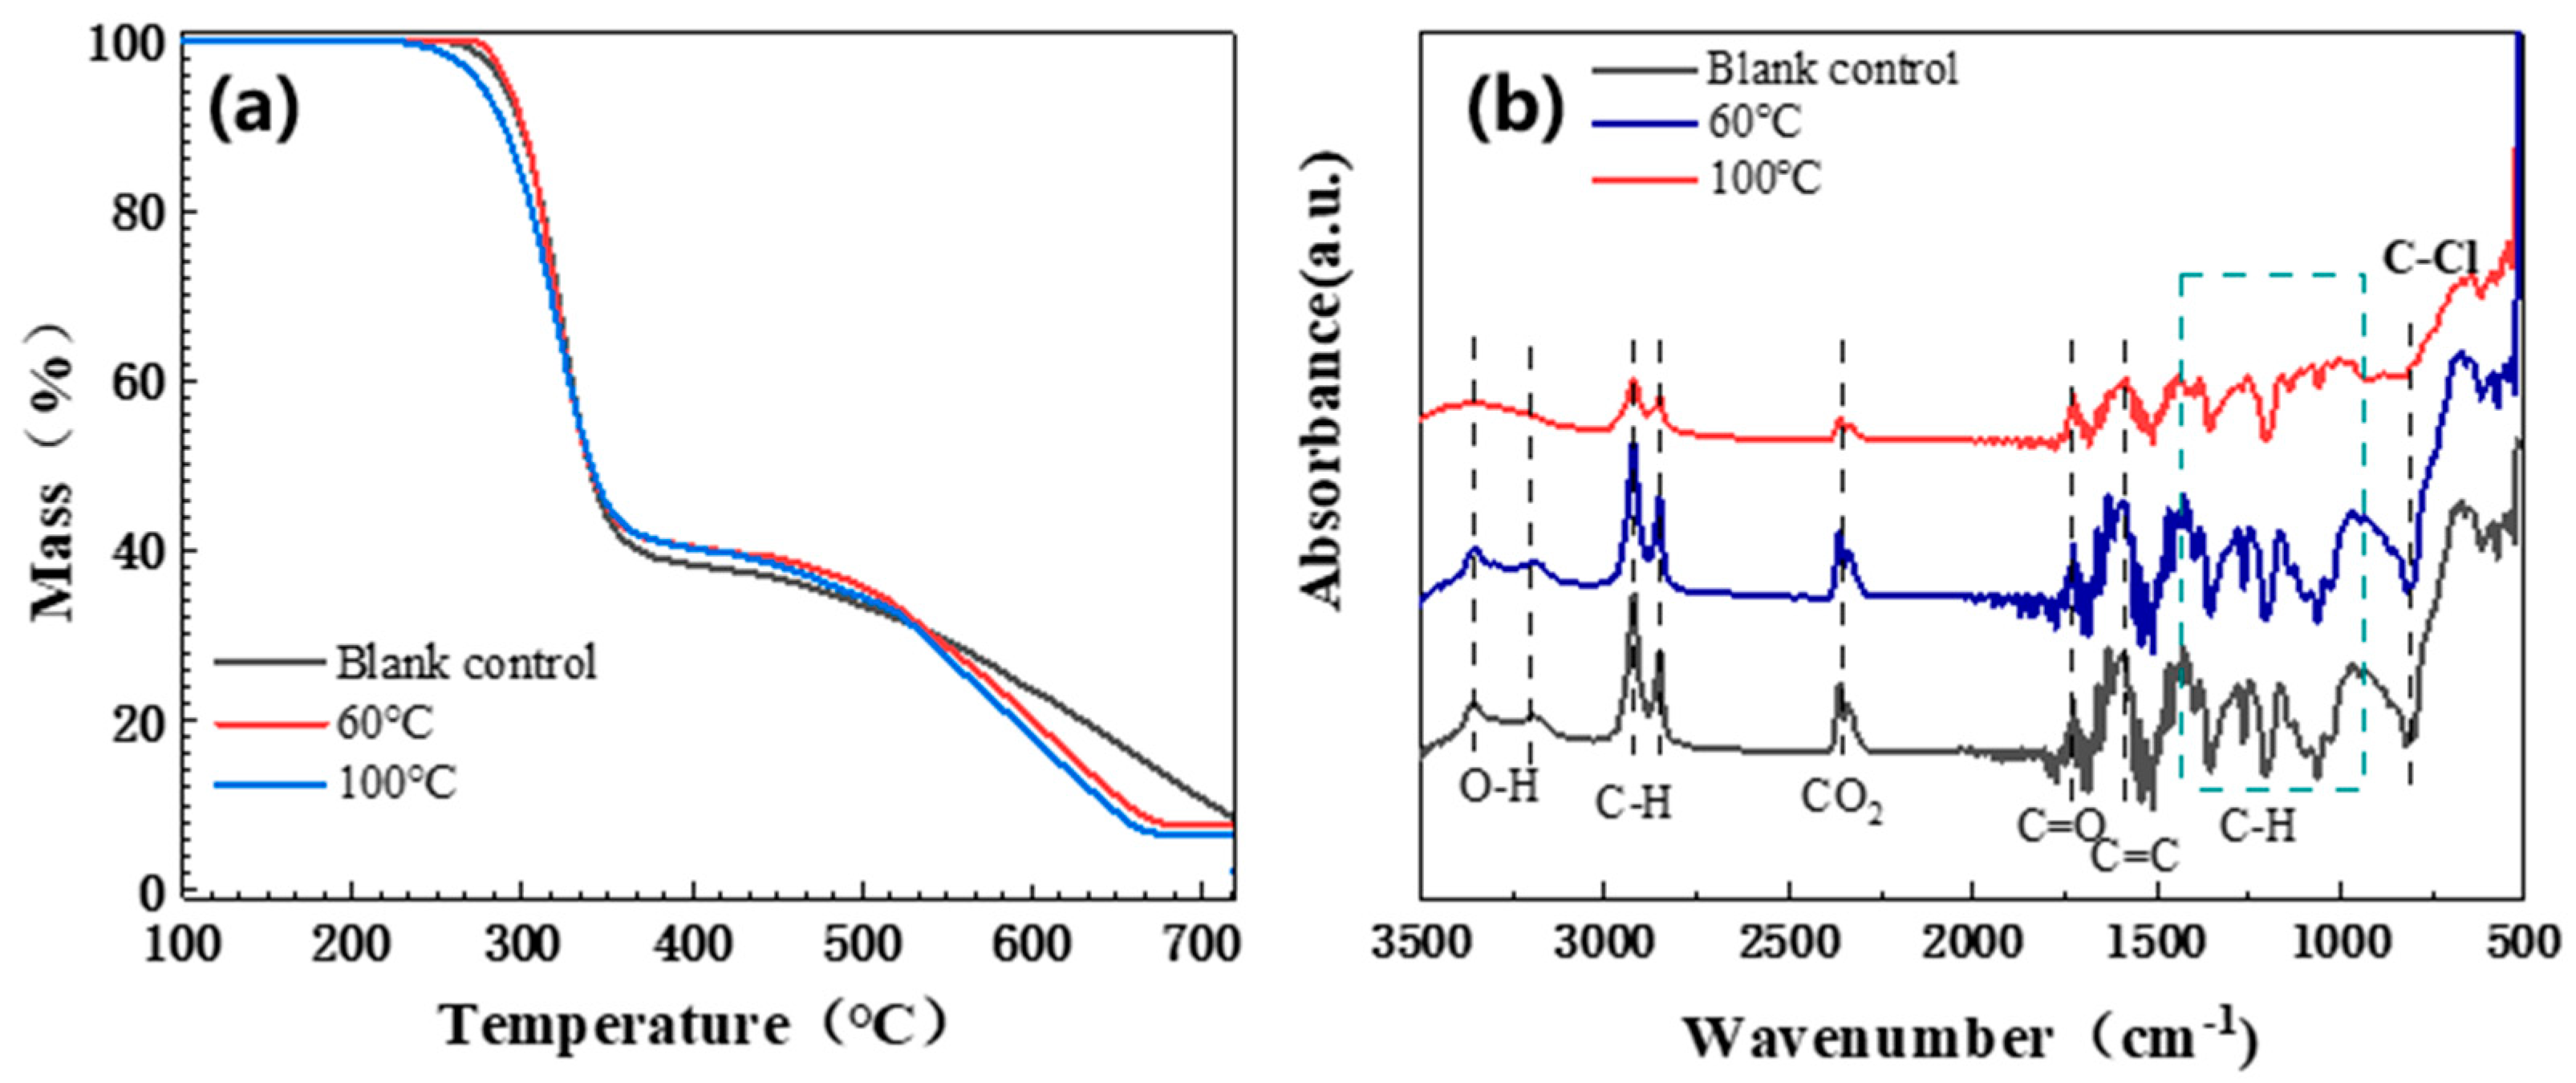
3.1.5. Aging Mechanism Analysis

PVC-C is a typical thermally sensitive polymer material that is prone to thermal decomposition. When exposed to heat, the molecular chains undergo chain transfer reactions, generating tertiary carbon atoms. The chlorine and hydrogen atoms connected to these tertiary carbon atoms have low bond energy due to their low electron cloud density, making them highly reactive. These atoms can easily detach from adjacent H and Cl atoms, forming HCl. The generated HCl further catalyzes the chain transfer reactions, and the newly formed allyl chloride is unstable, leading to thermal decomposition. As a result, PVC-C begins to yellow, gradually turns reddish-brown, and eventually undergoes severe aging and performance degradation. Additionally, the C–Cl bonds in PVC-C may react with amine solutions.
The experiments indicate that at 60 °C, the properties of PVC-C do not show significant changes. However, when the temperature rises to 100 °C, indicators such as volume change rate and elongation change rate decline significantly, failing to meet the operational requirements.

3.2. Polypropylene (PP) High Temperature and High Pressure Corrosion Resistance

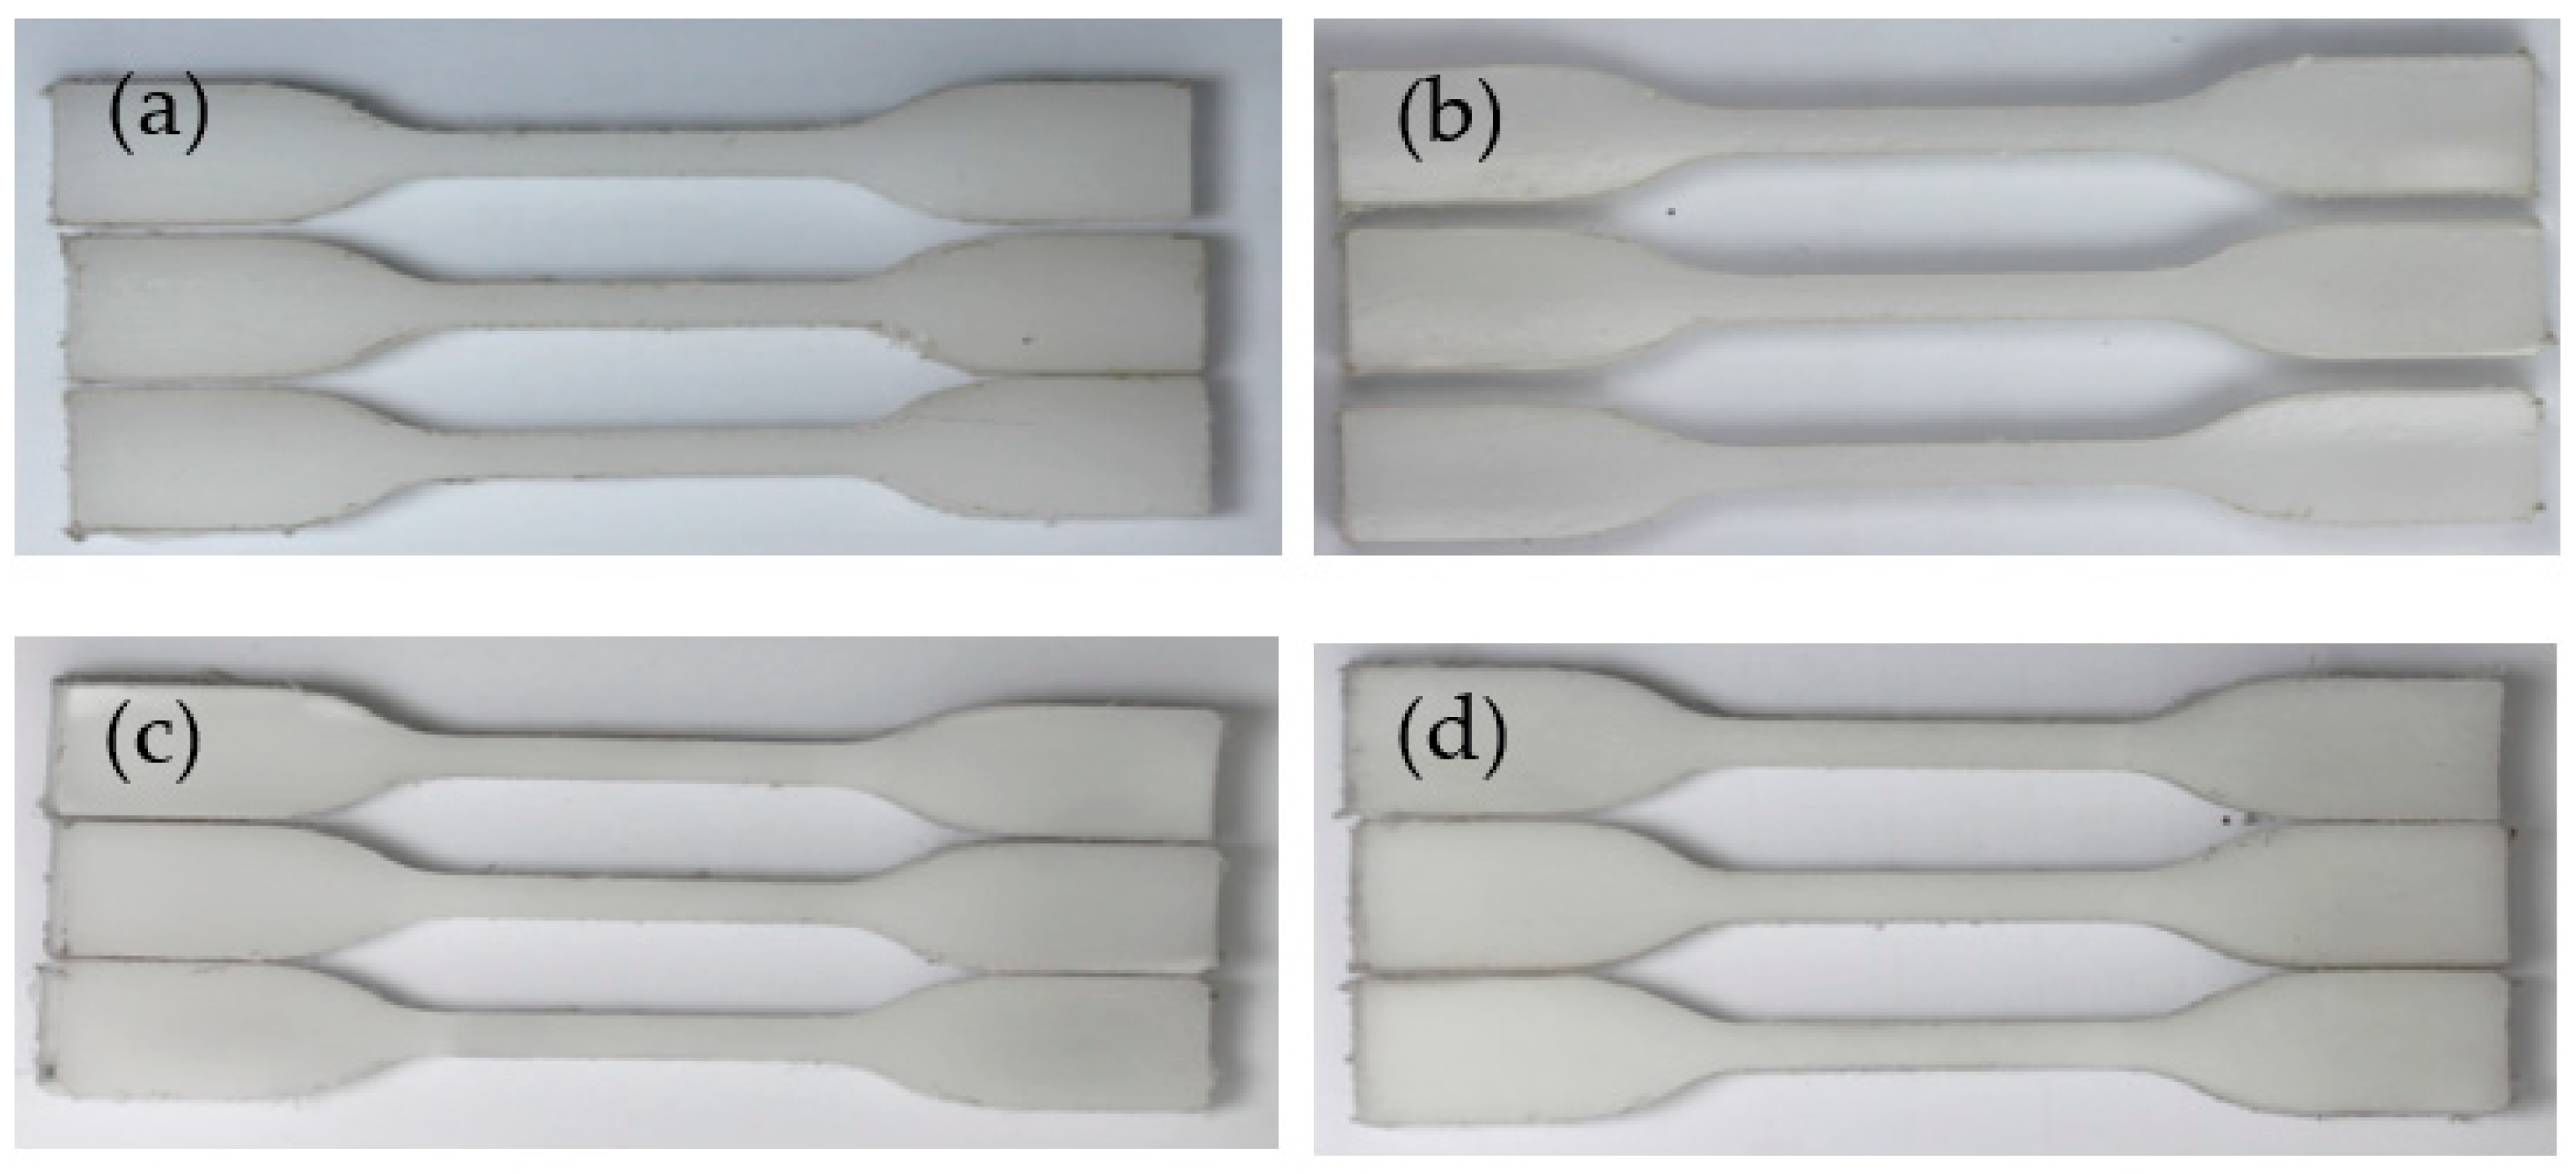
3.2.1. Morphological Changes

Amine solution corrosion simulation experiments were conducted on PP at different temperatures. The changes in the corrosion morphology of PP were analyzed under simulated conditions of the absorption tower and regeneration tower. At temperatures ranging from 60 to 130 °C, the macroscopic morphology of the PP samples did not show significant changes, as illustrated in Figure 6.
Scanning electron microscopy (SEM) images, shown in Figure 7, revealed that the surface roughness of the PP samples increased with rising experimental temperatures, reaching its maximum at 130 °C.

3.2.2. Mass and Volume Changes

After treating the corroded samples, the mass change rate and volume change rate of PP under simulated working conditions were calculated using a precision electronic balance and corresponding formulas. The results, as shown in Figure 8, indicate that both the mass and volume change rates of PP increased with rising temperature, but the overall change rates remained below 5%.

3.2.3. Mechanics and Change of Softening Temperature of Vicat

Tensile tests were conducted on a tensile testing machine and the changes in the mechanical properties of PP are shown in Figure 9a. The yield strength change rate and elongation at break of PP decreased with increasing temperature. When the temperature reached 130 °C, the yield strength change rate of PP was as high as −32.3%, exceeding −20%. Within the temperature range of 60–130 °C, the elongation at break change rate of PP showed a loss greater than −30%. At 130 °C, the elongation at break change rate of PP reached −53.5%. vicat softening point tests were performed on a vicat testing machine and the results are shown in Figure 9b. Within the temperature range of 60–130 °C, the vicat softening temperature of PP remained stable between 78 °C and 80 °C.

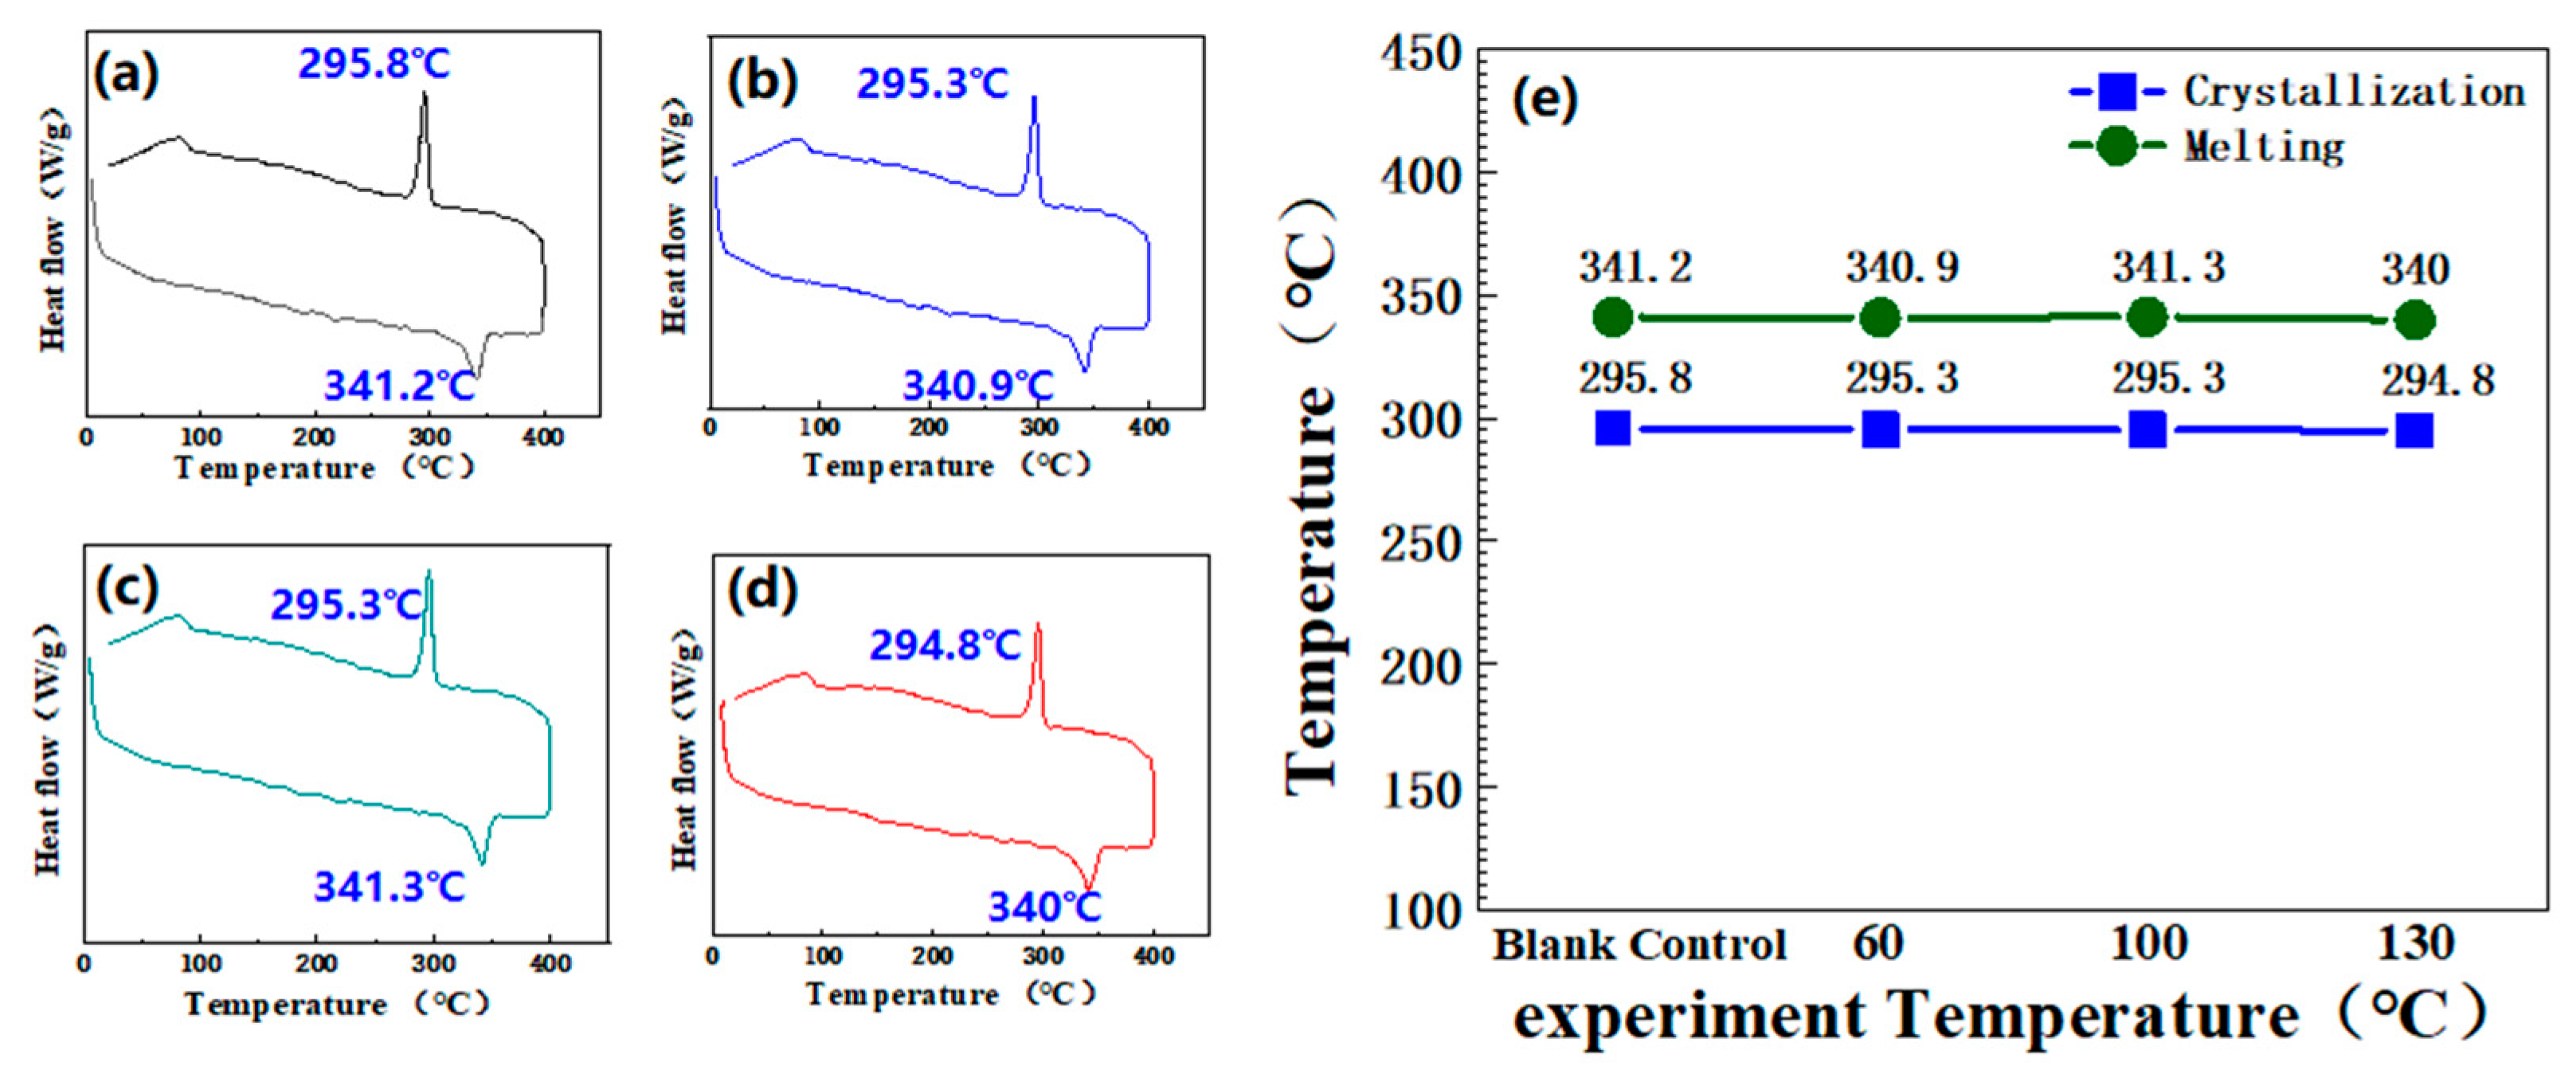
3.2.4. Molten Crystallization Condition

To investigate the effect of amine solution on the melting and crystallization behavior of polypropylene (PP), differential scanning calorimetry (DSC) was used to analyze the melting and crystallization behavior of the samples. The DSC results indicate that at temperatures ranging from 60 °C to 100 °C, the melting and crystallization temperatures of PP remained relatively stable, consistently around 170 °C, as shown in Figure 10a–d. However, when the temperature reached 130 °C, as shown in Figure 10e, the crystallization temperature of PP decreased significantly by 8.5 °C, indicating a reduction in the thermal stability of PP at 130 °C.

3.2.5. Other Performance Changes

To investigate the reaction mechanism between PP and the amine solution, changes in the chemical structure of the post-experiment samples at different temperatures were analyzed using FTIR testing. As shown in Figure 11b, the stretching vibration peaks of –CH3 or –CH2 are observed in the range of 2841–2953 cm−1, and the characteristic bands of –CH3 are found in the range of 971–1377 cm−1. There were no significant changes in PP before and after the experiment. However, at experimental temperatures ranging from 60 to 130 °C, characteristic peaks of C=O and C=C appeared at 1675 cm−1 and 1580 cm−1, respectively, indicating that the structure of PP had degraded.
To investigate whether the amine solution affects the thermal stability of PP, the thermal stability of PP at different temperatures was analyzed through TGA testing and the results are shown in Figure 11a. The degradation of all samples occurred between 380 °C and 500 °C, which is attributed to the breaking of C–H and C–C bonds. The TGA results indicate that the amine solution did not affect the thermal stability of PP. Additionally, there were no significant changes in the XRD spectra before and after the experiment, as shown in Figure 11c.

3.2.6. Aging Mechanism Analysis

Due to the presence of numerous tertiary carbon atoms on its molecular chain, PP undergoes the breaking of carbon-hydrogen bonds on these tertiary carbons under high temperatures, forming alkyl radicals and a free hydrogen atom. These alkyl radicals react with oxygen to form peroxy radicals, which then abstract a tertiary hydrogen atom from the polymer chain, forming peroxides and new radicals. These new radicals can further abstract hydrogen atoms from the polymer chain, leading to the decomposition of the molecular chain and a reduction in the elongation of PP. The decrease in molecular weight caused by decomposition makes nucleation more difficult during the crystallization process of PP molecules, resulting in a lower crystallization temperature. The experiments indicate that the elongation at break of PP decreases significantly within the temperature range of 60–100 °C. When the temperature reaches 130 °C, both the strength and thermal stability of PP no longer meet the usage requirements.

3.3. Fluorinated Ethylene Propylene Copolymer (FEP) Corrosion Resistance at High Temperature and Pressure

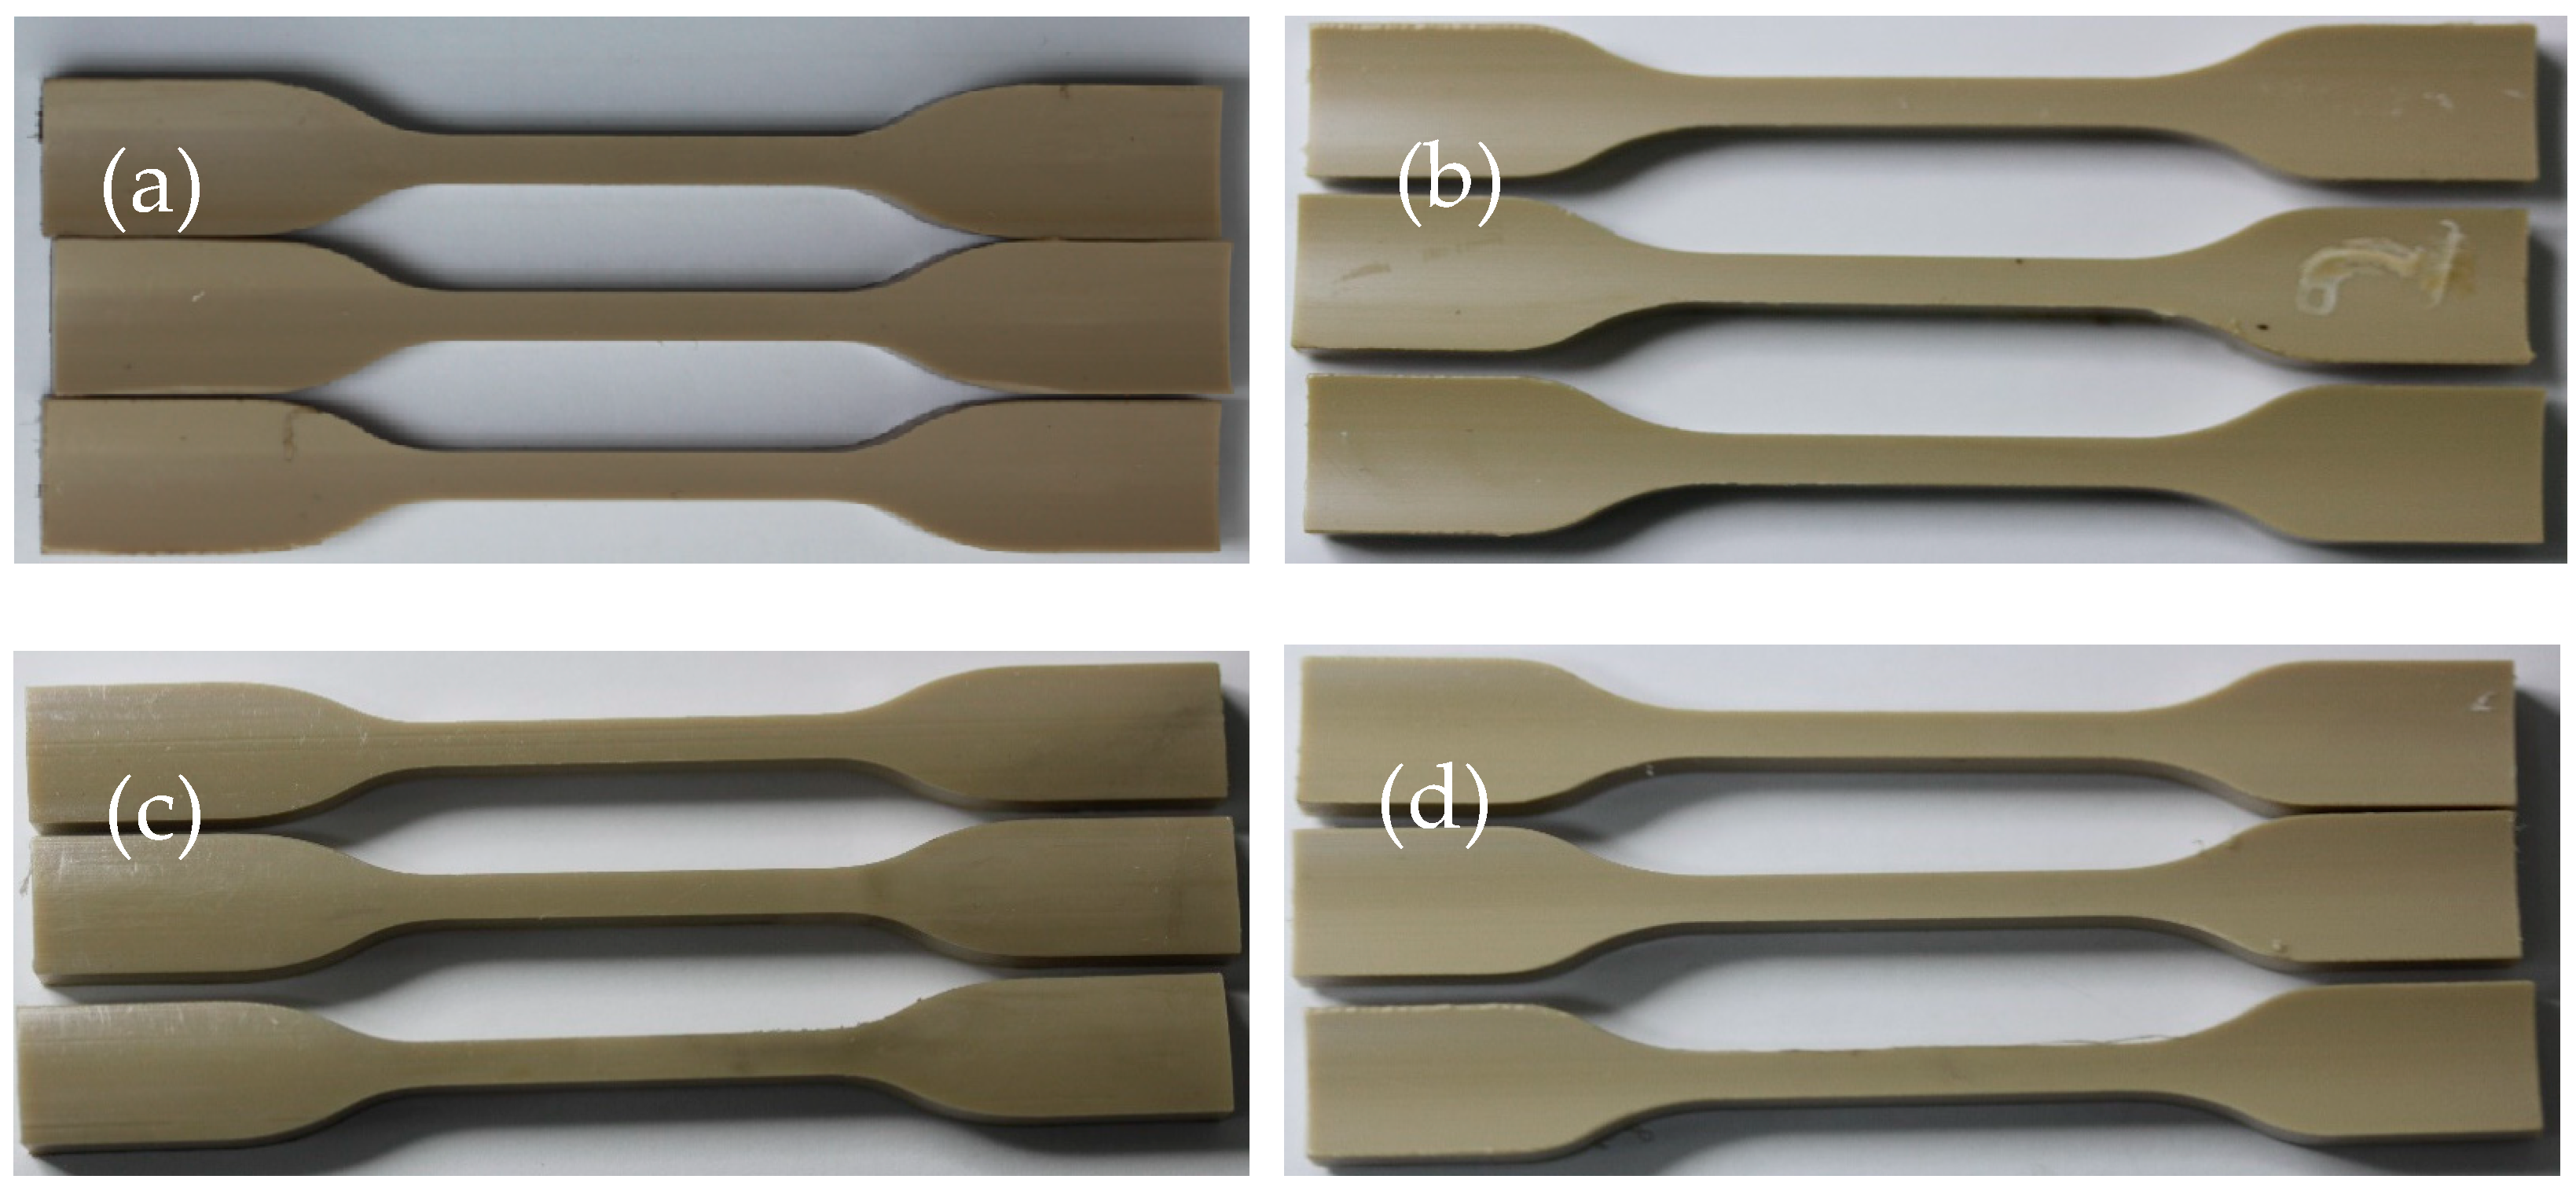
3.3.1. Morphology Change

A simulation experiment of amine liquid corrosion on FEP was conducted at different temperatures. The corrosion morphology of FEP was analyzed under the conditions of the absorption tower and the regeneration tower. At temperatures ranging from 60 °C to 130 °C, the macroscopic appearance of the FEP samples changed with increasing temperature, with the color deepening and the bending degree of the samples increasing, as shown in Figure 12a–d.
The scanning electron microscope images are shown in Figure 13a–d. From the images, it can be observed that the microscopic morphology of FEP remains largely unchanged. This indicates that FEP exhibits relatively stable performance within the temperature range of 60 °C to 130 °C.

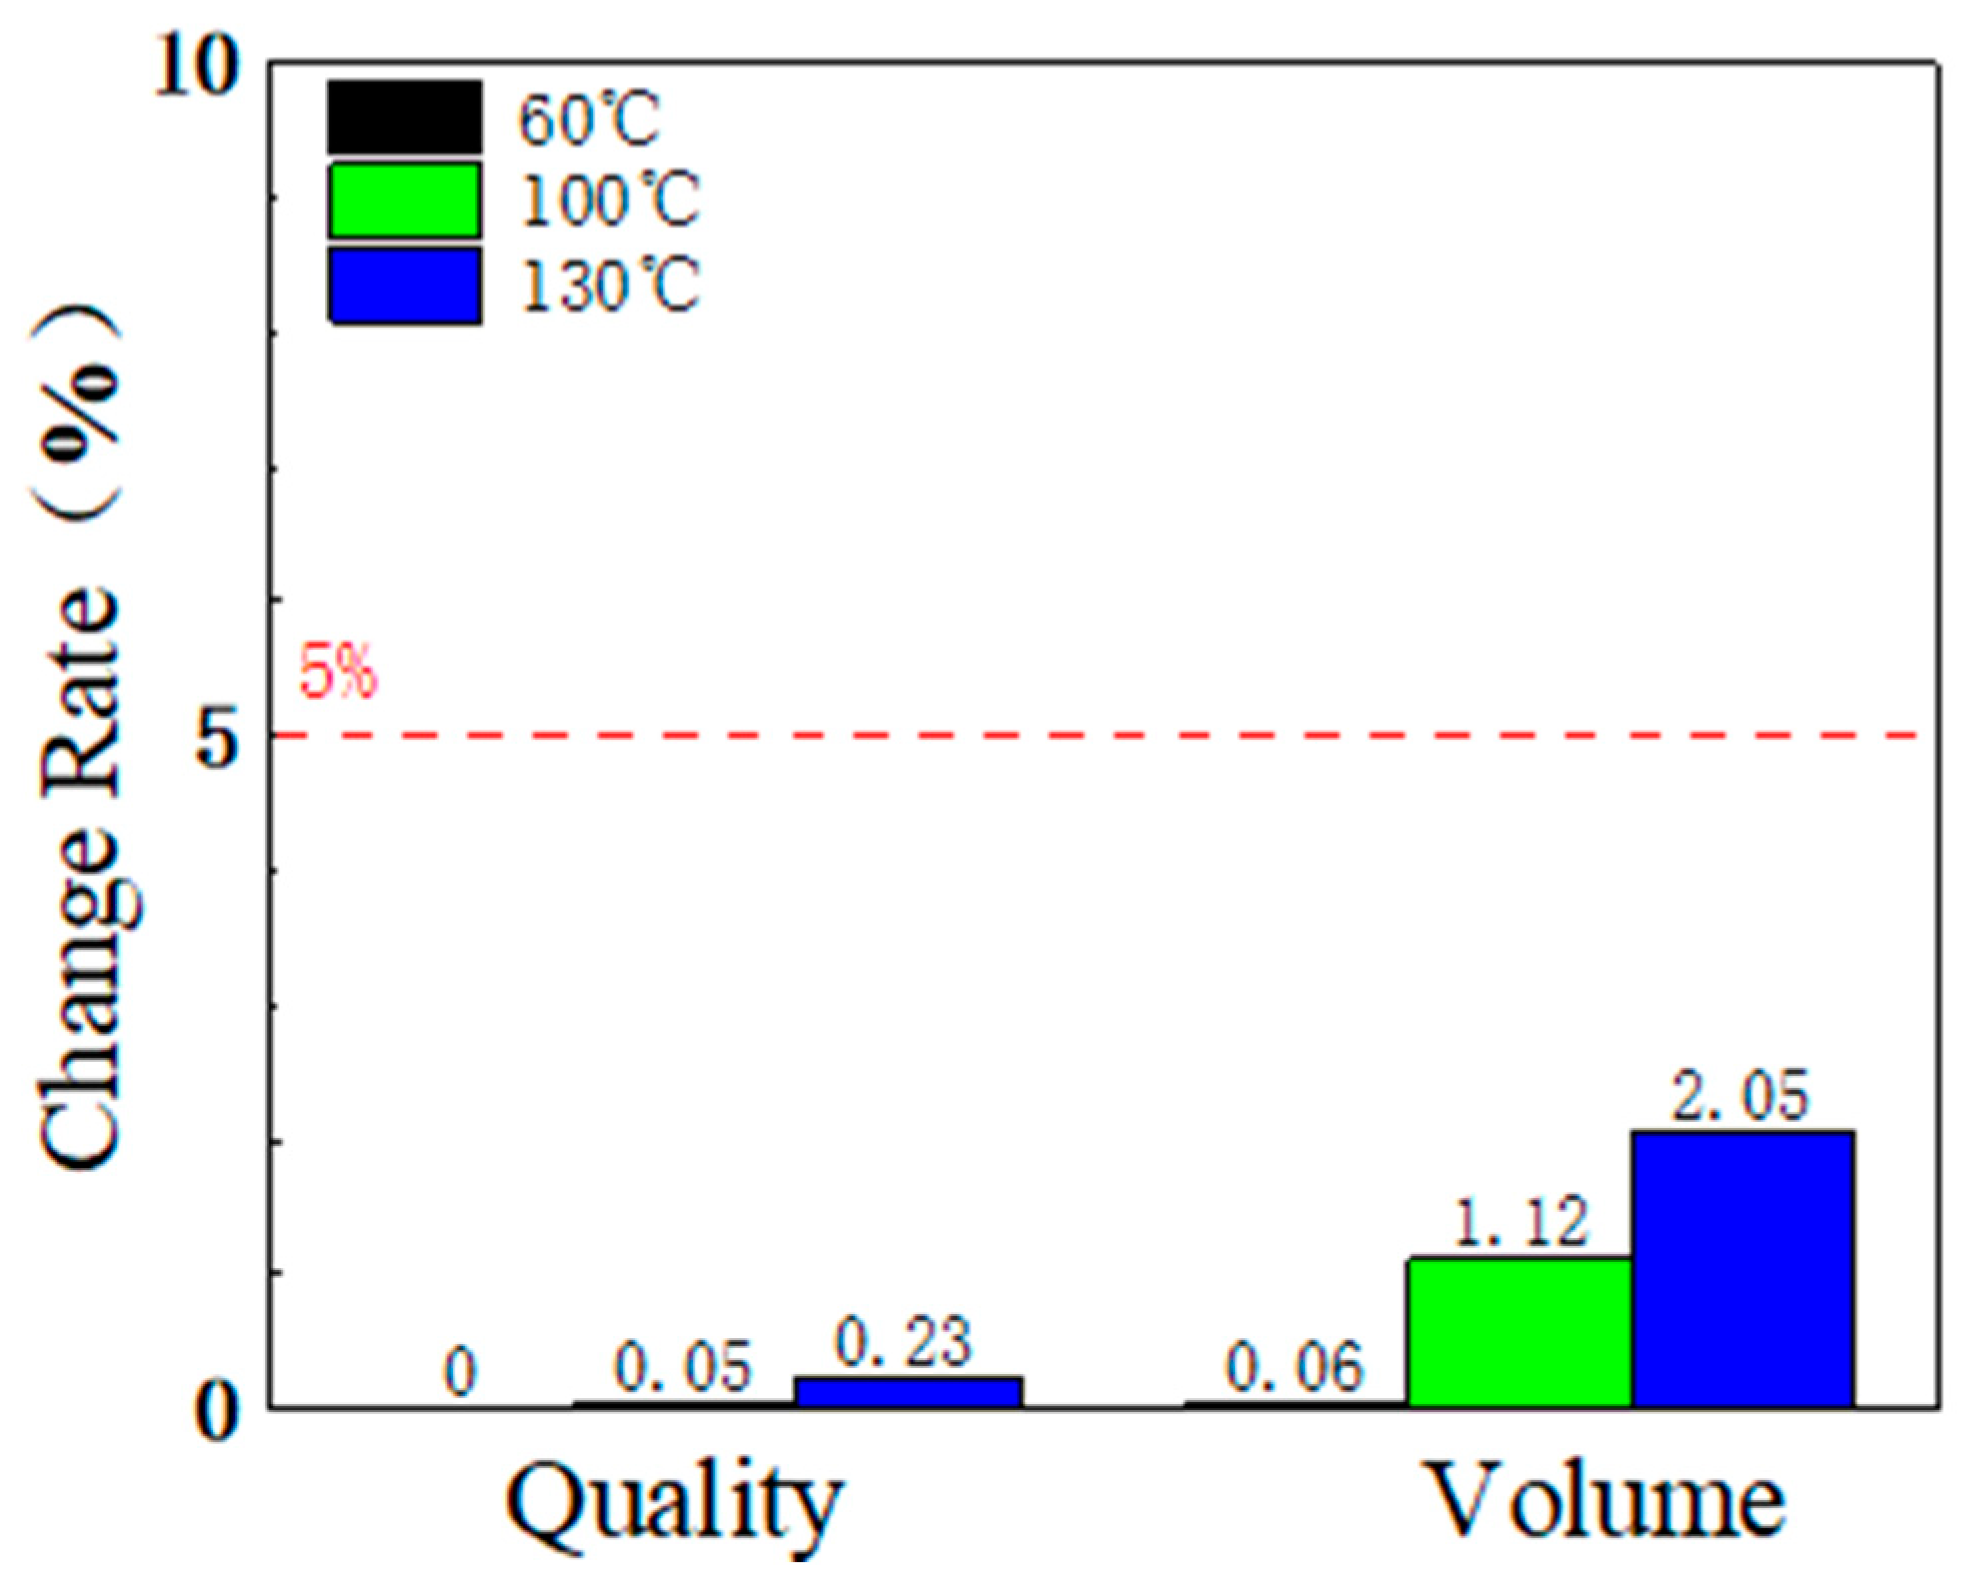
3.3.2. Mass and Volume Change

After treating the corroded samples, the mass change rate and volume change rate of FEP under simulated working conditions were calculated using a precision electronic balance and corresponding formulas. The results, as shown in Figure 14, indicate that both the mass and volume change rates of FEP increased slightly with rising temperature, but the changes were minimal, with the overall change rates remaining below 5%.

3.3.3. Mechanics and Change of Softening Temperature of Vicat

During tensile testing on a stretching machine, the mechanical property changes of FEP are illustrated in Figure 15a. The strength change rate and elongation at break change rate of FEP decrease with increasing temperature, but the variation is significantly less than 20%. In the vicat softening point test conducted on a vicat apparatus, the results are shown in Figure 15b. Within the experimental temperature range of 60–130 °C, the vicat softening temperature of FEP decreases as the experimental temperature rises, but the change is less than 5 °C.

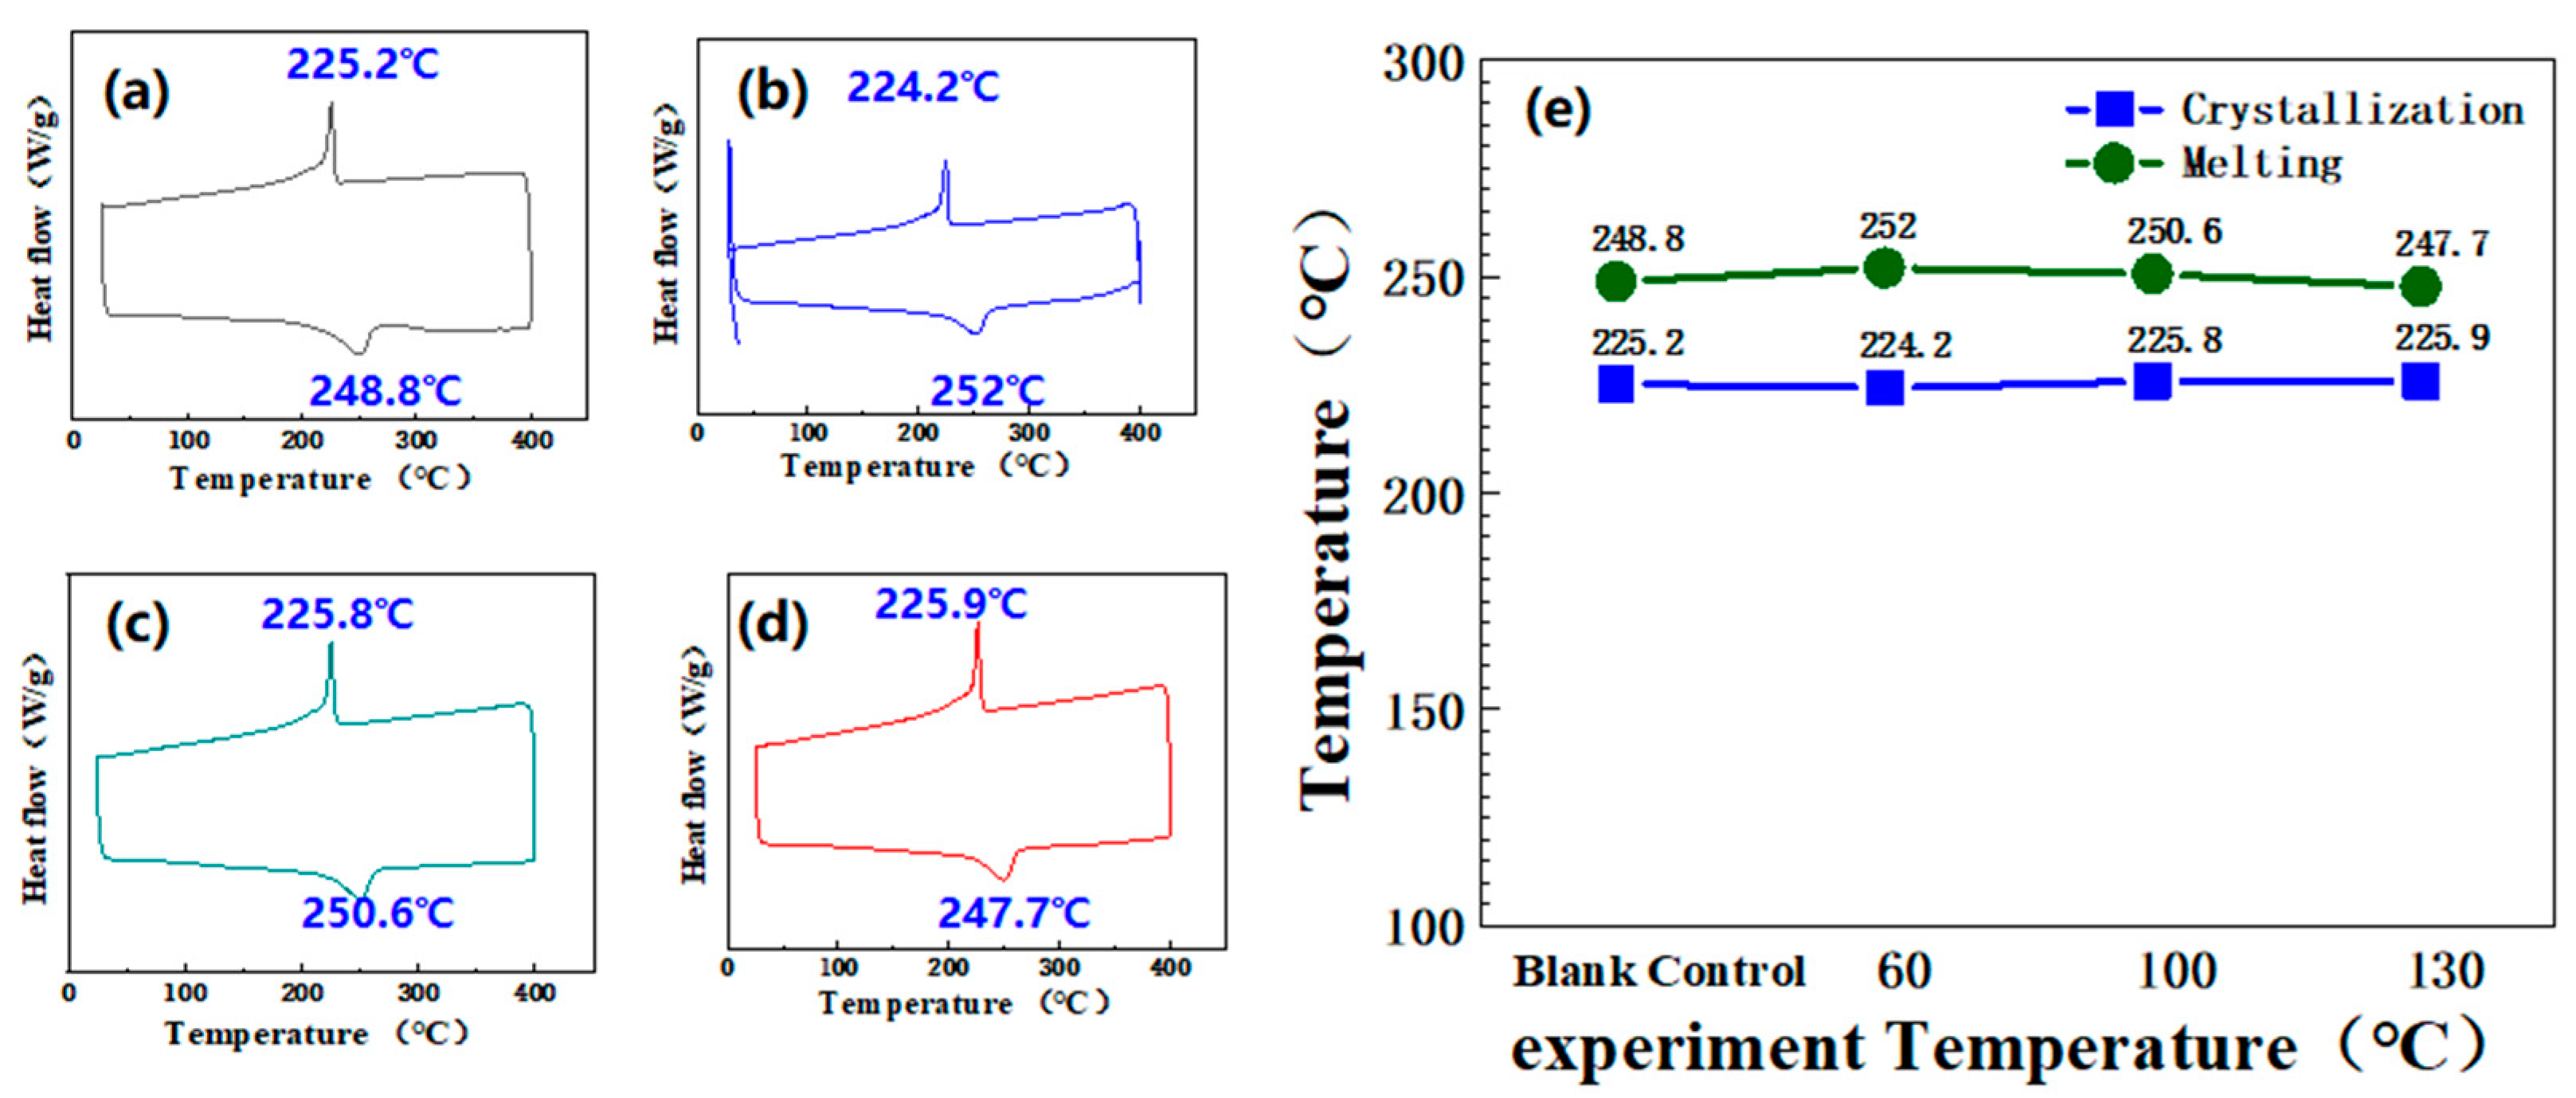
3.3.4. Molten Crystallization Condition

To investigate the effect of amine solution on the melting and crystallization behavior of FEP, the melting and crystallization behaviors of the samples were analyzed using differential scanning calorimetry (DSC). Figure 16 shows the melting and crystallization curves of FEP at different temperatures, as well as the changes in melting and crystallization temperatures. The DSC results indicate that within the experimental temperature range of 60–130 °C, the crystallization temperature of FEP remains stable at around 225 °C with almost no variation, while the change in melting temperature is less than 5 °C. This demonstrates that FEP exhibits good thermal stability within the experimental temperature range of 60–130 °C.

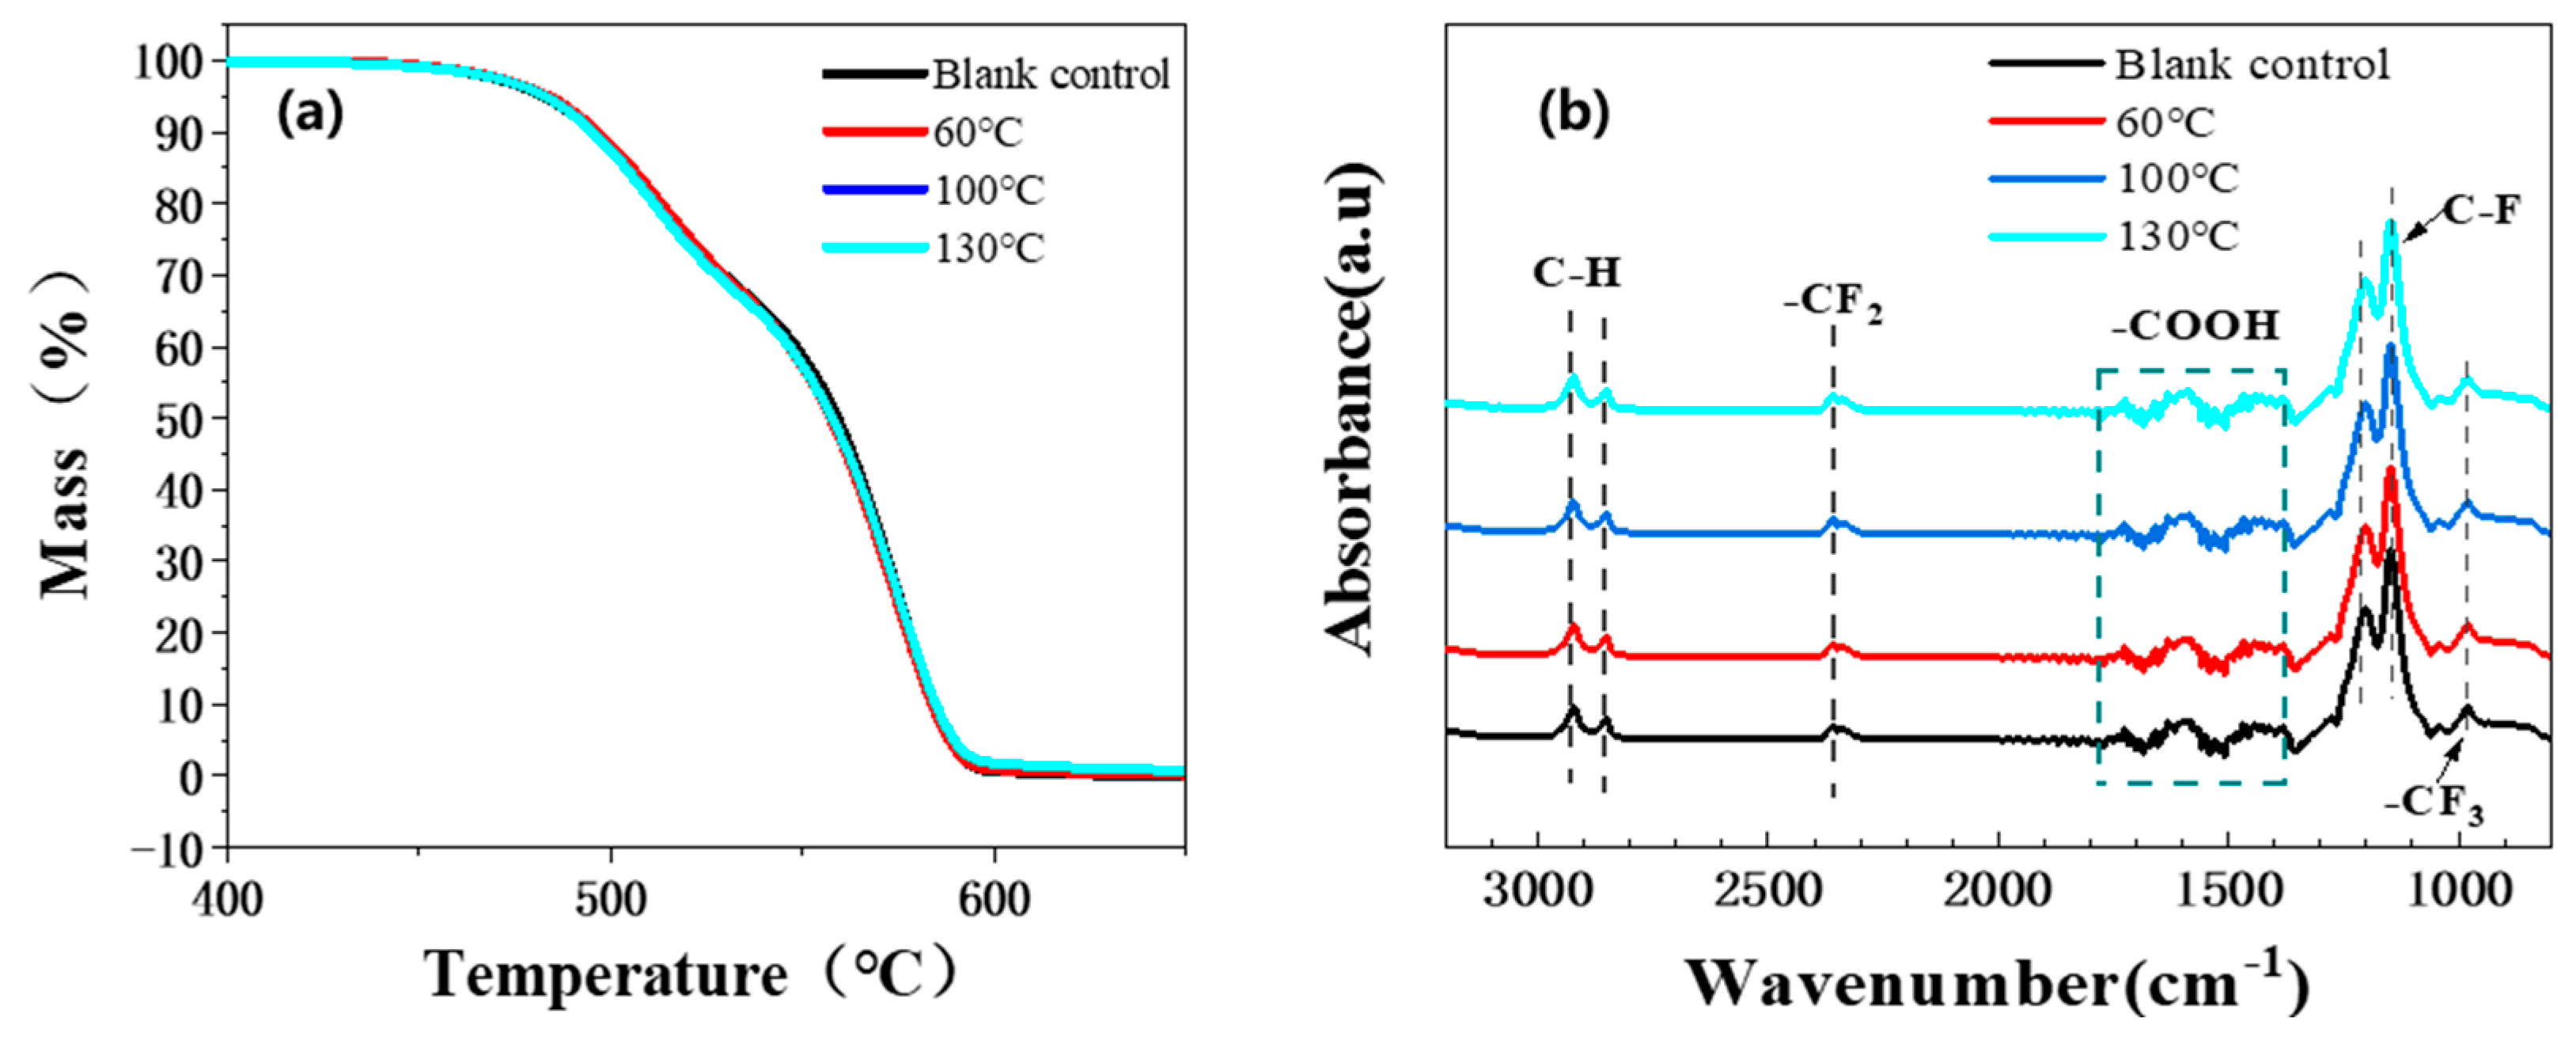
3.3.5. Other Performance Changes

To investigate the reaction mechanism between FEP and amine solution, changes in the chemical structure of the samples after experiments at different temperatures were analyzed using Fourier Transform Infrared Spectroscopy (FTIR). As shown in Figure 17b, the absorption peaks related to C–H stretching vibrations appear in the range of 2853–2928 cm−1, which may be attributed to the presence of –CF2H at the terminal groups of FEP. The absorption peak of –CF2 is located at 2356 cm−1. The characteristic peaks in the range of 1408–1726 cm−1 are due to the presence of –COOH at the terminal groups of FEP. The absorption peak of –CF3 appears at 980 cm−1. The presence of side groups –CF3 in the copolymer segments reduces the regularity of the molecules, thereby enhancing the flexibility of the molecular chains. Additionally, the low polarity of FEP molecular chains and weak intermolecular forces result in lower strength and hardness, making FEP prone to deformation. The experimental results indicate that the characteristic chemical bonds and group structures of FEP remain intact after corrosion by the amine solution, suggesting that the amine solution has no significant effect on the chemical structure of FEP.
To further explore whether the amine solution affects the thermal stability of FEP, the thermal stability of FEP at different temperatures was analyzed using Thermogravimetric Analysis (TGA), as shown in Figure 17a. In the range of 500–600 °C, all samples underwent degradation, but the thermogravimetric curves showed almost no change at these three temperatures, indicating that the amine solution has no significant impact on the thermal stability of FEP.
In summary, FEP exhibits excellent comprehensive performance within the temperature range of 60–130 °C, but it is prone to deformation.

3.4. Polyether Ether Ketone (PEEK) High Temperature and High Pressure

3.4.1. Morphology Change

Amine solution corrosion simulation experiments were conducted on PEEK at different temperatures. The changes in the corrosion morphology of PEEK were analyzed under simulated conditions of the absorption tower and regeneration tower. At temperatures ranging from 60 to 130 °C, the macroscopic morphology of the PEEK specimens showed no significant changes, as illustrated in Figure 18a–d.
Scanning electron microscopy images, depicted in Figure 19a–d, also revealed no notable alterations. This indicates that PEEK exhibits relatively stable performance within the temperature range of 60 °C to 130 °C.

3.4.2. Mass and Volume Change

After treating the corroded specimens, the mass change rate and volume change rate of PEEK under simulated working conditions were calculated using a precision electronic balance and the corresponding formulas. The results, as shown in Figure 20, indicate that the mass and volume change rates of PEEK increase with rising temperature, but the changes are minimal, with the overall change rates being less than 5%.

3.4.3. Mechanics and Change of Softening Temperature of Vicat

During tensile testing on a stretching machine, the mechanical properties of PEEK changed as shown in Figure 21a. The strength of PEEK decreased as the temperature increased, with the yield strength changing by less than 20%. The elongation at break also decreased with increasing temperature, with a change rate of less than 30%. The results indicate that PEEK has good applicability in amine solution environments. Vicat softening point testing was conducted on a vicat testing machine and the results are shown in Figure 21b. The vicat softening temperature of PEEK remained almost unchanged within the temperature range of 60–130 °C.

3.4.4. Molten Crystallization Condition

To investigate the effect of amine solution on the melting and crystallization behavior of PEEK, differential scanning calorimetry (DSC) was used to analyze the melting and crystallization behavior of the samples. Figure 22 shows the melting and crystallization curves of PEEK at different temperatures, as well as the changes in melting and crystallization temperatures. The DSC results indicate that within the experimental temperature range of 60–130 °C, the melting and crystallization temperatures of PEEK remained essentially unchanged. The melting temperature stabilized at around 341 °C, while the crystallization temperature stabilized at approximately 295 °C.

3.4.5. Other Performance Changes

To investigate the reaction mechanism between PEEK and amine solution, the chemical structural changes of the samples at different temperatures were studied using FTIR testing. In Figure 23b, the absorption band at 1650 cm−1 corresponds to the C=O stretching vibration; the bands at 1595 cm−1 and 1500 cm−1 are attributed to the in–plane vibrations of the R–O–R benzene ring; the band at 1305 cm−1 represents the in–plane vibration of the R–CO–R benzene ring; the band at 1233 cm−1 is associated with the asymmetric stretching vibration of R–O–R; the band at 1161 cm−1 corresponds to the C–H bending vibration of the benzene ring in the aromatic ether structure; and the band at 928 cm−1 is related to the symmetric stretching vibration of R–CO–R. Before and after the experiment, the amine solution did not disrupt the characteristic chemical bonds and group structures of PEEK.
To explore the thermal stability of PEEK under simulated working conditions, the thermal stability of PEEK at different temperatures was analyzed using TGA testing and the results are shown in Figure 23a. All samples began to degrade at 580 °C and there was still 30% residue remaining when the temperature reached 800 °C, indicating that PEEK has excellent thermal stability. Under temperature environments of 60 °C, 100 °C, and 130 °C, the thermal weight loss curves of the PEEK samples essentially overlapped, demonstrating that PEEK maintains good thermal stability under simulated working conditions. Additionally, within the experimental temperature range of 60–130 °C, the XRD patterns of PEEK did not show significant changes, as illustrated in Figure 23c.

3.4.6. Aging Mechanism Analysis

The molecular chain structure of PEEK is composed of repeating methylene units. Each methylene unit contains both single and double bonds, which endows PEEK with high strength and hardness, as well as excellent wear resistance and fatigue resistance. Additionally, due to the interactions between the methylene units and the presence of numerous rigid benzene rings on the molecular chain, PEEK exhibits outstanding thermal and chemical resistance. The aforementioned experiments demonstrate that PEEK has good applicability in amine solution environments at temperatures up to 130 °C.

4. Conclusions

This study, for the first time, evaluated the applicability of four plastic materials in a 35 wt% fresh amine solution environment under temperature gradients of 60 °C, 100 °C, and 130 °C.
PVC-C: At 60 °C, the performance changes were not significant. However, when the temperature rose to 100 °C, the initial degradation temperature decreased significantly, indicating possible molecular chain decomposition and material failure.
PP: At 60–100 °C, the performance changes were minor, but at 130 °C, the crystallization temperature decreased by 8.5 °C and the elongation at break significantly declined, resulting in reduced strength and thermal stability.
FEP: At 60–130 °C, the amine solution did not alter its molecular structure or thermal stability. The strength and elongation at break change rates were less than 20%, but the material was prone to deformation at high temperatures.
PEEK: At 60–130 °C, the amine solution did not change its molecular structure or thermal stability. The yield strength and elongation at break change rates were less than 20% and 30%, respectively, demonstrating excellent applicability.
In summary, in a CO2-amine solution environment, PVC-C fails above 100 °C, PP exhibits significant performance degradation at 130 °C, FEP is prone to deformation at high temperatures but with minor performance changes, and PEEK performs the best, making it suitable for applications at 60–130 °C.

Author Contributions

Methodology, K.F.; resources, X.F. and Y.L.; writing–original draft preparation, J.C. and X.Z.; software, L.D.; visualization, J.H.; data curation, S.L. and G.L.; investigation, J.S. All authors have read and agreed to the published version of the manuscript.

Funding

This research received no external funding.

Institutional Review Board Statement

We choose to exclude this statement.

Informed Consent Statement

Informed consent was obtained from all subjects involved in the study.

Data Availability Statement

Data are contained within the article.

Conflicts of Interest

Author Kun Fang, Xuehua Fan; Lei Dong; Jiahui Hu; Yiying Liu; Shengyuan Liu was employed by the company(China Petroleum Engineering & Construction Corp). The remaining authors declare that the research was conducted in the absence of any commercial or financial relationships that could be construed as a potential conflict of interest.

References

  1. Yusuf, M.; Ibrahim, H. A comprehensive review on recent trends in carbon capture, utilization, and storage techniques. J. Environ. Chem. Eng. 2023, 11, 111393. [Google Scholar] [CrossRef]
  2. Song, X.; Wang, F.; Ma, D.; Gao, M.; Zhang, Y. Progress and prospect of carbon dioxide capture, utilization and storage in CNPC oilfields. Pet. Explor. Dev. 2023, 50, 229–244. [Google Scholar] [CrossRef]
  3. McLaughlin, H.; Littlefield, A.A.; Menefee, M.; Kinzer, A.; Hull, T.; Sovacool, B.K.; Bazilian, M.D.; Kim, J.; Griffiths, S. Carbon capture utilization and storage in review: Sociotechnical implications for a carbon reliant world. Renew. Sustain. Energy Rev. 2023, 177, 113215. [Google Scholar] [CrossRef]
  4. Chen, S.; Liu, J.; Zhang, Q.; Teng, F.; McLellan, B.C. A critical review on deployment planning and risk analysis of carbon capture, utilization, and storage (CCUS) toward carbon neutrality. Renew. Sustain. Energy Rev. 2022, 167, 112537. [Google Scholar] [CrossRef]
  5. Baskaran, D.; Saravanan, P.; Nagarajan, L.; Byun, H.-S. An overview of technologies for Capturing, Storing, and utilizing carbon Dioxide: Technology Readiness, large–Scale Demonstration, and cost. Chem. Eng. J. 2024, 491, 151998. [Google Scholar] [CrossRef]
  6. Chu, H.; Huang, Z.; Zhang, Z.; Yan, X.; Qiu, B.; Xu, N. Integration of carbon emission reduction policies and technologies: Research progress on carbon capture, utilization and storage technologies. Sep. Purif. Technol. 2024, 343, 127153. [Google Scholar] [CrossRef]
  7. Rezaei, S.; Liu, A.; Hovington, P. Emerging technologies in post–Combustion carbon dioxide capture & removal. Catal. Today 2023, 423, 114286. [Google Scholar]
  8. Luo, H.; Zeng, S.; Wu, D. Development Status and Prospects of CCUS Technology Under the Background of Carbon Peak and Neutrality. Shandong Chem. Ind. 2023, 52, 101–106. [Google Scholar]
  9. Lu, B.; Zhang, L.; Xu, Y. Carbon Capture, Utilization and Storage (CCUS) Technology Helps to the Realization of Carbon Neutralization. Ind. Saf. Environ. Prot. 2021, 47 (Suppl. S1), 30–34. [Google Scholar]
  10. Zhang, G.; Liu, J.; Qian, J.; Zhang, X.; Liu, Z. Review of research progress and stability studies of amine–Based biphasic absorbents for CO2 capture. J. Ind. Eng. Chem. 2024, 134, 28–50. [Google Scholar] [CrossRef]
  11. Wei, F.; Zhang, W.; Han, L.; Zhang, X.; He, L. Mass transfer properties of structured wire mesh packing. J. Tianjin Univ. 2007, 40, 916–920. [Google Scholar]
  12. Zhang, H.; Liu, S.; Liang, P.; Ye, Z.; Li, Y. An Accelerated–Based Evaluation Method for Corrosion Lifetime of Materials Considering High–Temperature Oxidation Corrosion. Sustainability 2023, 15, 9102. [Google Scholar] [CrossRef]
  13. Li, N.; Wang, H.; Yin, H.; Liu, Q.; Tang, Z. Effect of Temperature and Impurity Content to Control Corrosion of 316 Stainless Steel in Molten KCl–MgCl2 Salt. Materials 2023, 16, 2025. [Google Scholar] [CrossRef] [PubMed]
  14. Niedermeier, K.; Lux, M.; Purwitasari, A.; Weisenburger, A.; Daubner, M.; Müller-Trefzer, F.; Wetzel, T. Design of the LIMELIGHT Test Rig for Component Testing for High–Temperature Thermal Energy Storage with Liquid Metals. Processes 2023, 11, 2975. [Google Scholar] [CrossRef]
  15. Rivolta, B.; Gerosa, R.; Panzeri, D.; Nazim, A. Optimization of the Mechanical and Corrosion Resistance of Alloy 625 through Aging Treatments. Crystals 2024, 14, 139. [Google Scholar] [CrossRef]
  16. Bhagavatula, K.G.; Leena, S.; Murugasamy, K.; Nanoth, R.; Narayanan, S.; Pegoretti, A.; Karingamanna, J. Epoxy nanocomposites with dual filler system: Improving surface protection against wear and thermocyclic corrosion. Surf. Interfaces 2024, 55, 105477. [Google Scholar] [CrossRef]
  17. Gong, L.; Chen, Y.; Cai, M.; Li, J.; Lu, Q.; Hou, D. Characterization and Analysis of Corrosion Resistance of Rubber Materials for Downhole Tools in a High–Stress Environment with Coupled H2S–CO2. Materials 2024, 17, 863. [Google Scholar] [CrossRef]
  18. Şen, İ.; Tuna, S.; Kurtlu, M.A. Evaluation of the use and performance of natural filler based polypropylene/leonardite composites. J. Clean. Prod. 2024, 480, 144105. [Google Scholar] [CrossRef]
  19. Wu, Y.; Gu, Y.; Zhao, R.; Huang, Y.; Fang, M.; Yu, X.; Dong, W.; Wang, T.; Wang, Q. Research on Mass Transfer Properties of modified plastic fillers for Carbon capture absorber. Proc. CSEE 2023, 43, 4688–4697. (In Chinese) [Google Scholar]
  20. Wang, X.; Zhang, D.; Yang, X. Research on the formula and performance of CPVC filler. Polyvinyl Chloride 2023, 51, 10–12+19. [Google Scholar]
  21. Wang, Y.; Gao, C.; Huang, J.; Li, C.; Wang, X. Study on Properties of Graphene and Polyphenyl Ester Co–Filled FEP. Mod. Plast. Process. Appl. 2020, 32, 18–20. [Google Scholar]
  22. Li, S.; Rocha, J.D.; Zhou, J.S.; Meyer, H.S.; Bikson, B.; Ding, Y. Post-combustion CO2 capture using super-hydrophobic, polyether ether ketone, hollow fiber membrane contactors. J. Membr. Sci. 2013, 430, 79–86. [Google Scholar] [CrossRef]
  23. GB/T 1040; Mechanical Properties of Plastics—Determination of Tensile Properties. Standards Press of China: Beijing, China, 2018.
  24. Zween, A.F.; Shakor, Z.M.; Sherhan, B.Y. Coke Decomposition Kinetic Model of Spent Hydrodesulfurization catalysts. J. Appl. Sci. Nanotechnol. 2024, 4, 29–46. [Google Scholar] [CrossRef]
  25. Khader, E.H.; Mohammed, T.J.; Albayati, T.M.; Zendehboudi, S. Preparation of Eco-Friendly Nanocatalyst Calcium Oxide (CaO) for Oily Wastewater Treatment by Advanced Oxidation Process. J. Appl. Sci. Nanotechnol. 2025, 5, 1. [Google Scholar]
Figure 1. Macroscopic morphology before and after the PVC-C experiment: (a) blank control; (b) at 60 °C; (c) at 100 °C; (d) at 130 °C.
Coatings 15 00360 g001
Figure 2. Microstructure before and after the PVC-C experiment: (a) blank control; (b) 60 °C; (c) 100 °C.
Coatings 15 00360 g002
Figure 3. The mass and volume change trend of PVC-C.
Coatings 15 00360 g003
Figure 4. (a) Mechanical properties of PVC-C; (b) Variation trend of Vicat softening temperature of PVC-C.
Coatings 15 00360 g004
Figure 5. (a) Thermogravimetric analysis curves of PVC-C at different experimental temperatures; (b) infrared absorption spectra of samples at different experimental temperatures.
Coatings 15 00360 g005
Figure 6. Macroscopic morphology before and after the PP experiment: (a) blank control; (b) at 60 °C; (c) at 100 °C; (d) at 130 °C.
Coatings 15 00360 g006
Figure 7. Microstructure before and after the PP experiment: (a) blank control; (b) 60 °C; (c) 100 °C; (d) 130 °C.
Coatings 15 00360 g007
Figure 8. The mass and volume change trend of PP.
Coatings 15 00360 g008
Figure 9. (a) Mechanical properties of PP; (b) Variation trend of Vicat softening temperature of PP.
Coatings 15 00360 g009
Figure 10. Changes of melt crystallization behavior of PP before and after experiment: (a) blank control; (b) 60 °C; (c) 100 °C; (d) 130 °C; (e) melting crystallization temperature change.
Coatings 15 00360 g010
Figure 11. (a) Thermogravimetric analysis curves of PP at different experimental temperatures; (b) infrared absorption spectrum; (c) X-ray diffraction.
Coatings 15 00360 g011
Figure 12. Macroscopic morphology before and after the FEP experiment: (a) blank control; (b) at 60 °C; (c) at 100 °C; (d) at 130 °C.
Coatings 15 00360 g012
Figure 13. Microstructure before and after the FEP experiment: (a) blank control; (b) 60 °C; (c) 100 °C; (d) 130 °C.
Coatings 15 00360 g013
Figure 14. The mass and volume change trend of FEP.
Coatings 15 00360 g014
Figure 15. (a) Mechanical properties of FEP; (b) Variation trend of Vicat softening temperature of FEP.
Coatings 15 00360 g015
Figure 16. Changes of molten crystallization behavior before and after FEP experiment: (a) blank control; (b) 60 °C; (c) 100 °C; (d) 130 °C; (e) melting crystallization temperature change.
Coatings 15 00360 g016
Figure 17. (a) Thermogravimetric analysis curves of FEP at different experimental temperatures; (b) Infrared absorption spectrum.
Coatings 15 00360 g017
Figure 18. Macroscopic morphology before and after the FEP experiment: (a) blank control; (b) at 60 °C; (c) at 100 °C; (d) at 130 °C.
Coatings 15 00360 g018
Figure 19. Microstructure before and after the PEEK experiment: (a) blank control; (b) 60 °C; (c) 100 °C; (d) 130 °C.
Coatings 15 00360 g019
Figure 20. The mass and volume change trend of PEEK.
Coatings 15 00360 g020
Figure 21. (a) Mechanical properties of PEEK; (b) Variation trend of Vicat softening temperature of PEEK.
Coatings 15 00360 g021
Figure 22. Changes of melt crystallization behavior before and after PEEK experiment: (a) blank control; (b) 60 °C; (c) 100 °C; (d) 130 °C; (e) melting crystallization temperature change.
Coatings 15 00360 g022
Figure 23. (a) Thermogravimetric analysis curves of PEEK at different experimental temperatures; (b) infrared absorption spectrum; (c) X-ray diffraction spectra.
Coatings 15 00360 g023
Table 1. Experimental raw materials.
Ingredients
Chlorinated polyvinyl chloride (PVC-C)
Polypropylene (PP)
Fluorinated ethylene propylene copolymer (FEP)
Polyether ether ketone (PEEK)
Table 2. Parameters of simulation test of aging of non-metallic materials under strong corrosion environment of CO2-O2 in CO2 capture system.
MaterialT, °CCO2O2,
V%
SO2,
mg/m3
NO2,
mg/m3
ClFlow Rate, m/sPeriod, d
PVC-C
PP
EFP
PEEK
60100%5%1002001000130
100100%1002001000130
130100%1002001000130
Table 3. Models of experimental instruments and equipment.
Name of InstrumentModel Number
Fourier transform infrared analyzerTENSOR Type II
Cold field emission scanning electron microscopySU8010
High temperature and high pressure reactor5L
Universal Material Testing MachineWDL-5kN-II
Differential scanning calorimeter204 F1
Vicat softening temperature testerXRW-300E
Thermogravimetric analyzerTA-60 WS
Electronic balanceME 104E/02
Electric thermostatic blast drying ovenDHG-9036A
Electronic density balanceJA3003J
Disclaimer/Publisher’s Note: The statements, opinions and data contained in all publications are solely those of the individual author(s) and contributor(s) and not of MDPI and/or the editor(s). MDPI and/or the editor(s) disclaim responsibility for any injury to people or property resulting from any ideas, methods, instructions or products referred to in the content.

