Article

Improving the Degree of Surface Isotropy of Parts Manufactured Using Hybrid Machining Processes

by
Daniel Grochała
1,*,
Rafał Grzejda
1,
Jerzy Józwik
2,* and
Zbigniew Siemiątkowski
3
1
Faculty of Mechanical Engineering and Mechatronics, West Pomeranian University of Technology in Szczecin, 19 Piastow Ave., 70-310 Szczecin, Poland
2
Faculty of Mechanical Engineering, Lublin University of Technology, 36 Nadbystrzycka Str., 20-618 Lublin, Poland
3
Faculty of Mechanical Engineering, Casimir Pulaski Radom University, 54 Stasieckiego Str., 26-600 Radom, Poland
*
Authors to whom correspondence should be addressed.
Coatings 2025, 15(4), 461; https://doi.org/10.3390/coatings15040461
Submission received: 1 March 2025 / Revised: 31 March 2025 / Accepted: 11 April 2025 / Published: 13 April 2025
(This article belongs to the Special Issue Wear and Corrosion Behavior of Coatings for Industrial Applications)

Abstract

:
Among the biggest challenges in modern manufacturing techniques is deliberately shaping the surface layer of a part to suit the conditions in which it will be used. The degree of difficulty increases with the increase in the functional requirements of the items to be manufactured and with the complexity of the technology developed. Hybrid machining processes allow functional surfaces to be shaped by combining different machining operations into a single operation. The values of the amplitude and length parameters of the resulting surface geometrical texture are largely determined by the technological parameters of the combined machining operations. However, it is the tool guidance and kinematic–geometric conditions during the hybrid machining process that are responsible for the surface texture. This paper describes the results of an investigation into the influence of the milling tool guidance strategy during shaping milling and tooling guidance during burnishing of workpieces made of 42CrMo4 steel tempered to a hardness of 35 ± 2 HRC—a material commonly used in the construction of machine parts. It was shown that running the burnishing with two crossing passes oriented obliquely to the marks left by the cutter was the most favourable of the burnishing strategies tested.

1. Introduction

Currently, technological surfaces, in addition to appropriate geometrical properties [1,2,3], often have to be characterised by an adequate ability to hold coatings, lubricants or resist abrasive wear (see, e.g., [4,5,6,7,8]). Surface shaping methods combining different manufacturing techniques are increasingly used in technology. Often, such non-obvious combinations of different machining methods on one bench are called hybrid technology [9]. Over the past decade, issues related to hybrid technology have attracted considerable research interest. This has resulted in many research centres attempting to create their own understanding of hybrid technology [10,11,12,13]. It has been depicted as a process in which various forms of energy derived from different sources are utilised simultaneously and in the same working space [14,15] or more generally as a combination of technological operations affecting the characteristics of the resulting process [16]. Hybrid technology, however, most often involves the use of several different, usually separate technological operations in a process [17,18].
One such common combination is the use of different machining techniques on CNC machine tools, which are integrated with plastic surface treatment by burnishing [19]. Among the machining operations combined with burnishing are milling [20,21,22], turning [23,24,25,26] or other methods of volumetric and ultrasonic machining [27,28,29,30]. An example of a hybrid machining process (HMP) combining milling and surface burnishing is illustrated in Figure 1.
The burnishing operation, when realizing HMP on CNC machine tools, results in an efficient decrease in the roughness height (thanks to high productivity and low costs) [9]. By applying a sufficiently high burnishing force, it is possible to remove any original roughness remaining after milling [31,32]. Depending on the method of burnishing and the type of machined material, the effectiveness factor of the technology, understood as the quotient of the roughness of the machined surface and the roughness of the burnished surface, can reach a value greater than 5 [33,34] or even 10 [35,36].
Several research studies were conducted in order to examine the burnishing process, using experimental, numerical and analytical methods. El-Taweel and El-Axir [37] performed an experimental investigation using response surface methodology to assess the influence of burnishing speed, burnishing feed rate, number of passes and burnishing force on the surface roughness and hardness of turned parts. Based on the analysis of variance, it was shown that the feed rate and burnishing force affected surface roughness and hardness the most. Gharbi et al. [38] conducted a survey by means of the Taguchi experimental design to investigate the effect of burnishing parameters on the surface properties of AISI 1010 planar surfaces using a multi-ball tool. The findings from the analysis of variance revealed that the burnishing force has a remarkable effect on both hardness and surface roughness. Korzynski et al. [39] designed a hydrostatic preload pressing burnishing tool for processing chrome-coated surfaces. They reported that coating operations induced tensile residual stresses on the samples and reduced fatigue life by inspiring micro-cracks on the surface. Nevertheless, after ball burnishing, surface quality and fatigue life were enhanced by eliminating surface roughness and decreasing the number of cracks. Furthermore, the residual tensile stresses on the surface of the coated samples were converted into compressive stresses following ball burnishing. Avilés et al. [40] explored the effect of a low plasticity ball-burning process on improving the fatigue strength of standardised AISI 1045 steel. Both untreated and blackened ball-burnished samples were subjected to rotary bending fatigue tests up to 3.25 × 10⁶ cycles. It was demonstrated that the fatigue strength of the ball-burnished samples, in comparison to the untreated samples, improved by about 21.25%. Travieso-Rodriguez et al. [41,42] also incorporated longitudinal vibration with a burnishing tool to enhance the surface properties of G10380 steel. They examined the surface roughness, hardness and residual stresses of the burnished parts. The outcomes revealed that the use of vibration to the burnishing tool substantially enhances the roughness of the burnished surface, but less robust results were observed with respect to sample hardness and residual stresses. Revankar et al. [43,44] utilised ball burnishing in the machining of titanium circular rods. They tested the surface roughness, hardness, wear resistance and residual stress of the samples exposed to burnishing and stated that the application of ball burnishing greatly improved the related features in comparison to turned samples.
Based on the above observations, most of the research was undertaken through experimental studies. Nevertheless, to better understand the mechanism of ball burnishing and to expand its applicability, theoretical examinations are very useful. Regarding this issue, very little research has been conducted to study the burnishing forces or the surface formation mechanism. Luo et al. [45] performed an analytical study to provide a prediction of the burnishing force. They utilised the elastic Hertz contact model to establish a core depth limit for elastic deformation. Then, they derived core depth values for elastic-plastic and plastic deformations. The results achieved from the analytical model were in line with the experimental results. Hiegemann et al. [46,47] established a theoretical model to calculate the surface roughness and pressure of the coated surface. They similarly applied the Hertz contact theory with appropriate approximations to consider the effect of burnishing depth in the model. The results indicated that the experimental results were in line with the analytical approach. Korzynski [48] established an analytical model on the basis of micro-mechanical slip line theory to determine the correlation between surface roughness and burnishing force. The model covered the mechanical parameters of the material, the burnishing force, the surface roughness parameters along a given length, the surface roughness angle and the geometric parameters of the burnishing process (e.g., ball diameter). Using this model, the surface roughness of the samples can be predicted after a one-time burnishing process.
In addition to optimising the height values of the roughness parameters, milling and burnishing operations performed in a single operation should also be combined in such a way as to ensure a sufficiently long tool service life during cutting and burnishing [49]. Excessively high burnishing forces can be hazardous, because in addition to shortening the service life of the mostly ceramic burnishing elements, they can lead to a potentially harmful state of stress in the surface layer. Consequently, this can lead to cracking and flaking of the burnished surface during the service life of the machine part [32]. Similar to the machining of soft materials, good smoothing results can also be achieved with hard milling and hard burnishing, even with considerably reduced cutting forces. The basic prerequisite for this is that the machining is carried out in several passes and with an appropriate trajectory of the burnishing tool in relation to the marks left by the cutter [50,51]. Apart from the height values of the surface geometrical texture (SGT) parameters of the surface produced under such conditions, a further condition for the evaluation of the surface produced in this case should be its isotropy. To recognise this issue, we investigated the influence of milling and burnishing tooling guidance strategies on the degree of surface isotropy (SI). In doing so, we assumed that tool guidance and kinematic–geometric conditions during HMPs are responsible for the SGT. In this respect, the research described in this paper should be regarded as an extension of the research outlined above.

2. Methodology for Testing Changes in the Degree of Surface Isotropy

2.1. Sample Preparation

In order to determine the effect of the reciprocal trajectory of shaping milling and finishing burnishing on SI, 100 mm × 100 mm × 20 mm samples of 42CrMo4 steel were prepared and tempered to a hardness of 35 ± 2 HRC. First, the samples were milled on a DMG DMU-60 MonoBLOCK milling centre (DMG MORI, Bielefeld, Germany) using a WNT R1000G.42.6.M16.IK torus head (Ceratizit Group, Mamer, Luksemburg) with six 10 mm diameter RD.X1003 MOT-WTN1205 cutting inserts (Ceratizit Group, Mamer, Luksemburg). The head was set at an angle of 15° to the rotational axis of the machine spindle. Machining was carried out with flood cooling using a 10% Statoil ToolWay oil-based emulsion, and the same machining fluid was used to feed the hydraulic burnishing tool. The samples were then burnished using a hydrostatic burnisher with a bellows actuator and a 10 mm diameter ceramic burnishing ball (covered by patent PAT.220528 [52]). A similar study, but with different milling and pressing conditions, was presented by Posdzich et al. [53], which confirms the validity of addressing such issues. Three burnishing strategies were selected for testing, shown in Figure 2, in contrast to [53], where samples burnished according to only one strategy (along one direction) were tested.
The value of the burnishing force FN of 1000 N was taken in such a way that a significant drop in the height of the irregularity of the milled surface is evident, at which point complete plastic deformation of the surface irregularity occurs after milling (see Figure 3). Our previous research has also shown that at this value of the burnishing force, there is a complete change in the character of the surface from anisotropic to isotropic.
In all cases, milling was carried out at a cutting speed vc of 100 m/min, a depth of cut ap of 0.5 mm and a milling cutter feed fm of 0.6 mm/rev. In contrast, the burnishing was carried out at a burnishing speed vb of 8 m/min. The other technological machining parameters used in the shaping milling and finishing burnishing are summarised in Table 1.
As can be seen from Table 1, samples containing four variants of milled surface (labelled A, B, C and D) were prepared for each of the three strategies tested. On each of the resulting milled fields, burnishing was carried out with four selected line feeds (labelled I, II, III and IV). This yielded a total of 48 measuring surfaces for which the SGT was determined. One reference sample was also prepared, which was not subjected to burnishing.

2.2. Surface Geometrical Texture Measurements

SGT measurements were carried out using an AltiSurf A520 multi-sensor measurement system (Altimet, Thonon-les-Bains, France) equipped with a chromatic confocal sensor CL1 [54] with an operating range of up to 130 µm and a vertical resolution of 8 nm. Measurements were made in fields of 3.0 mm × 3.0 mm. Experimentally, the scanning resolution was set at 0.47 µm along the X-axis and 5 µm along the Y-axis, resulting in almost 6400 points in 601 lines. The measurement of approximately 3.8 million points for each surface took an average of 3.5 h. Analysis of the collected data and SGT processing was carried out using MCubeMAP 8.1 software (Mitutoyo, Kanagawa, Japan). Each time, an SGT analysis methodology was applied to the recorded point cloud of the measured surface, which included setting a threshold value to remove erroneously collected surface points (deleted points were set as unmeasured values). The surfaces were then levelled (mean plane approximated by the least squares method [55]).
The following set of parameters was chosen to characterise the changes occurring on individual surfaces after milling and burnishing [56,57,58,59]: Sa—arithmetic mean surface height, Sz—maximum surface height, Sq—mean square surface height, Sp—maximum surface peak height, Sv—maximum surface valley depth.
So-called good metrology practice was followed in all measurements. A validation of the developed surface measurement methodology showed that, with an uncertainty spread of k0.95 = 2.0, the measurement system had an uncertainty ranging from 0.2% of the Sa parameter to 5% of the Sz parameter. Finally, we determined the topographic parameters used in the description of the isotropy and selected values of the stereometric roughness parameters, according to ISO 25178-2 [60,61,62], after the milling operation and after the operation combining milling and burnishing.

3. Results and Discussion

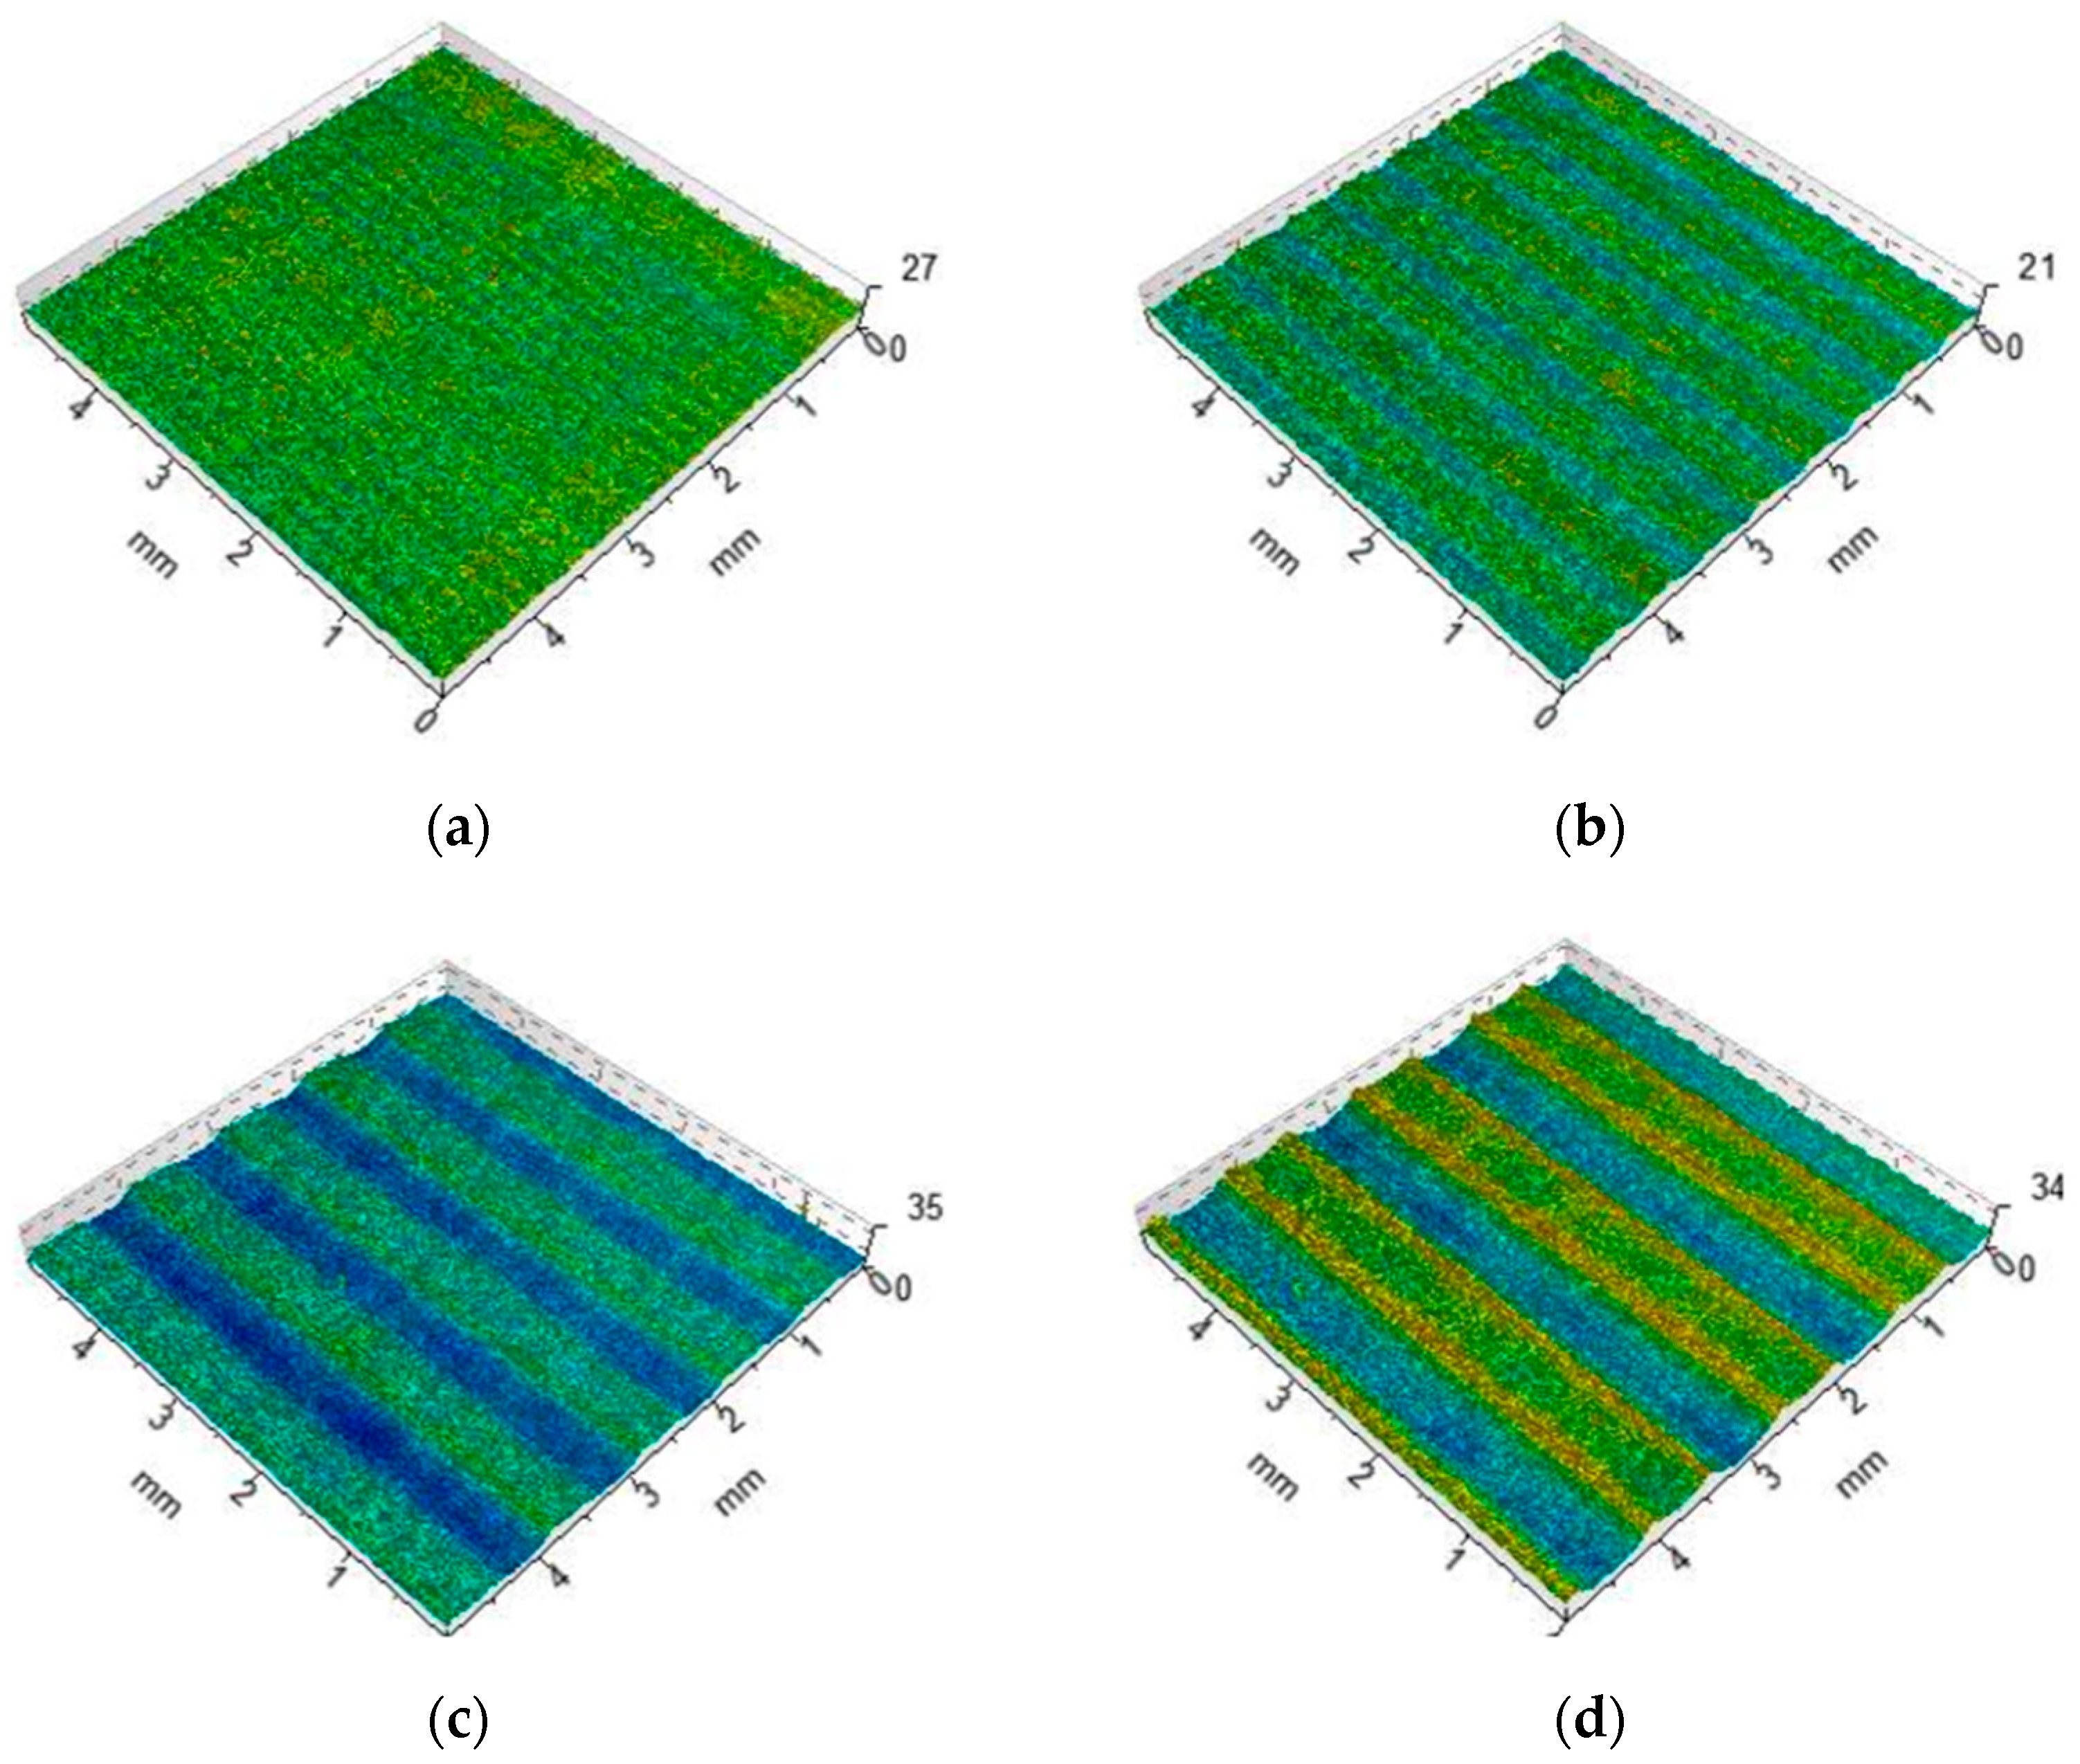
The set of surface roughness parameters and degrees of SI obtained after the milling operation are summarised in Table 2. The set of surface roughness parameters and degrees of SI obtained after the combined milling and burnishing operation are collected in Table 3. Examples of surfaces achieved after milling are shown in Figure 4.
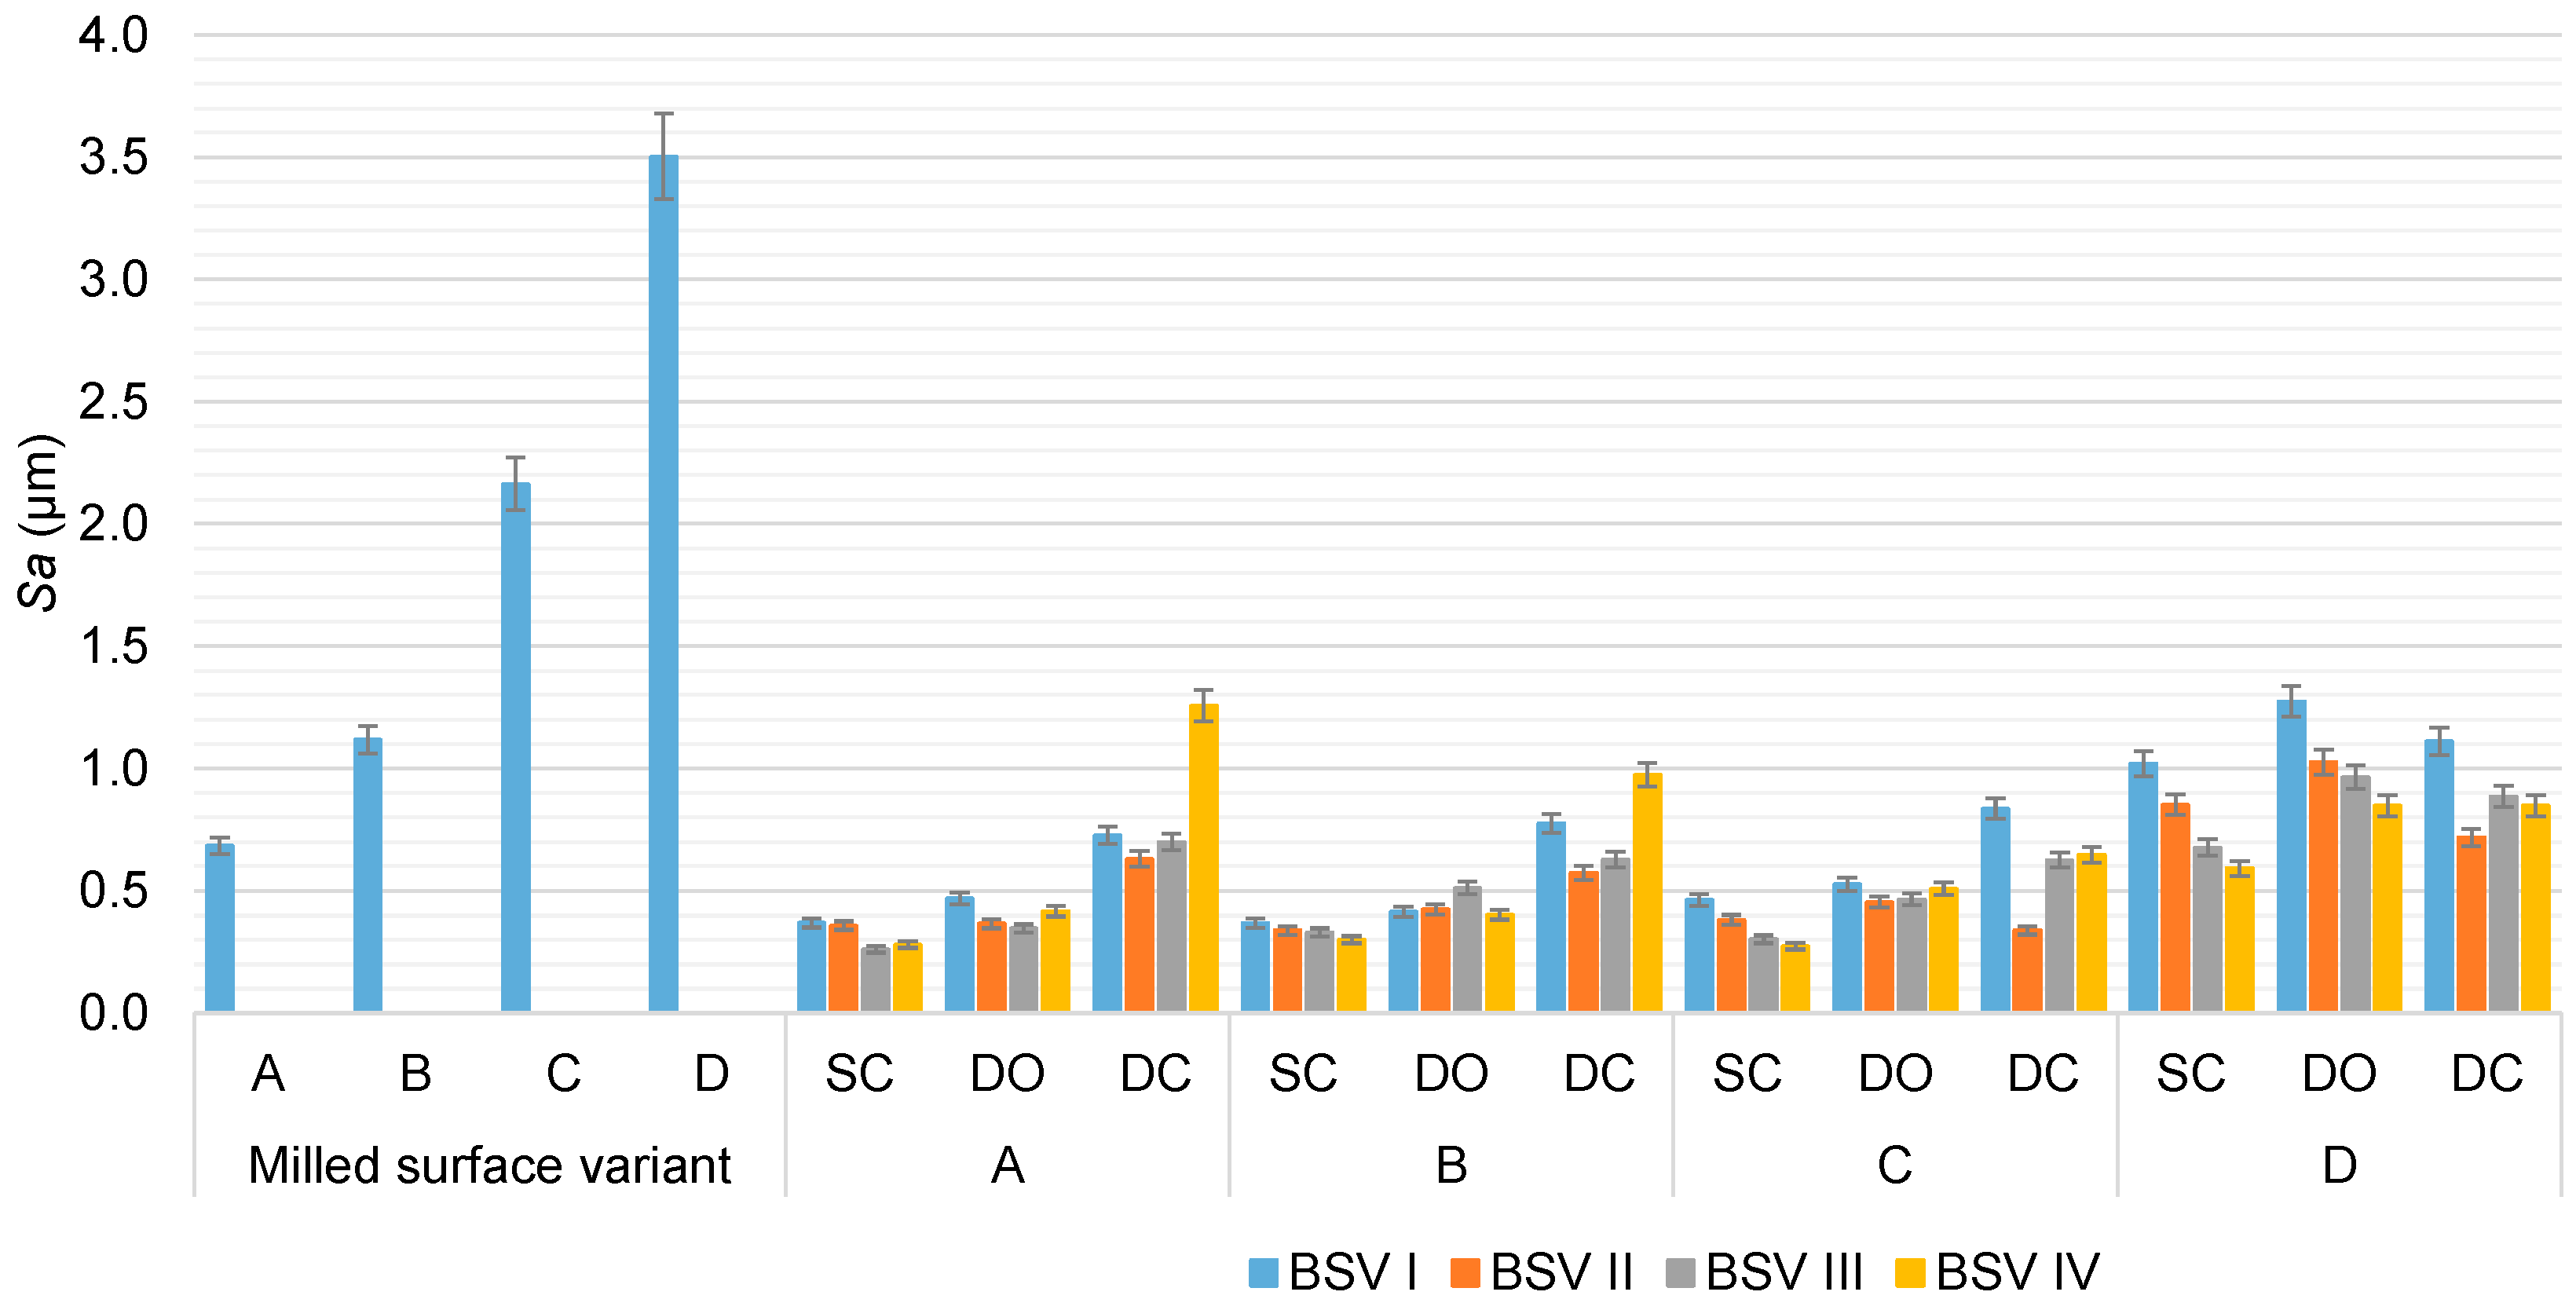
In all HMP cases, the value of the surface roughness left after milling decreased significantly (see Figure 5). The reduction in the value of the Sa parameter reached an average of 37% for surfaces milled with a milling cutter line feed flm = 0.1 mm. The burnishing of milled surfaces with a milling cutter line feed flm = 0.3 mm was more effective. In this case, the average reduction in the Sa parameter value reached 52%. In the case of milled surfaces with a milling cutter line feed flm = 0.5 mm, the average level of reduction in the Sa parameter value reached 74%, while with a milling cutter line feed flm = 0.7 mm, the average Sa parameter value decreased by 83%.
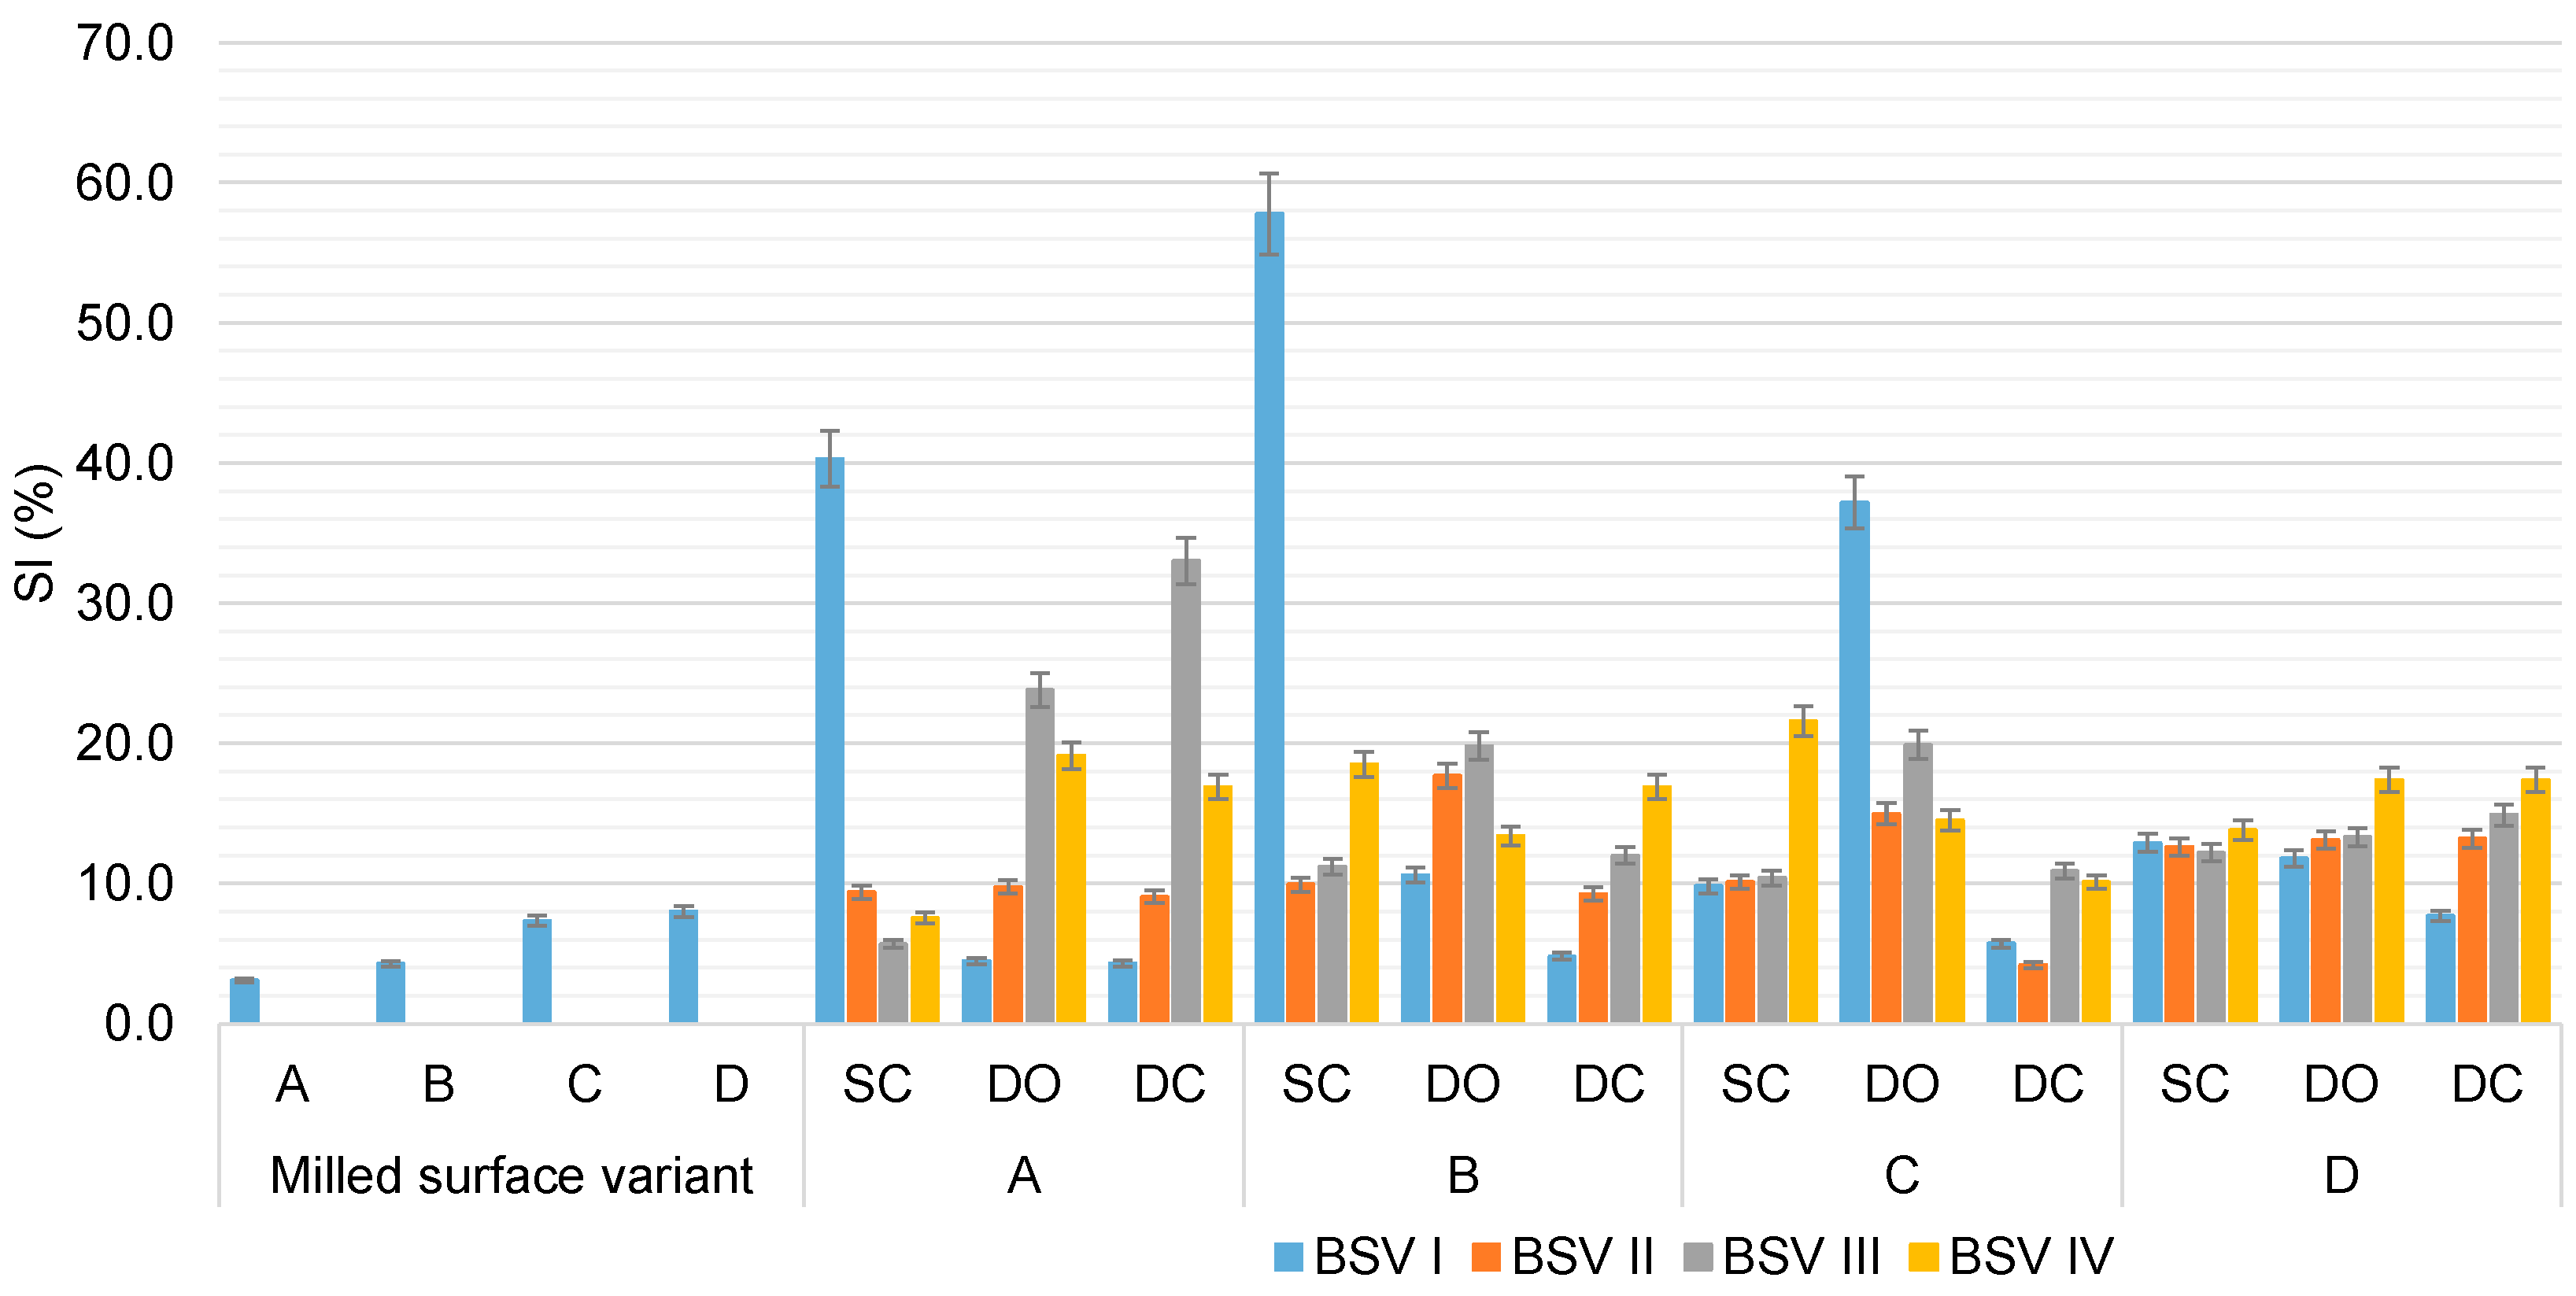
The degree of SI obtained after burnishing increased significantly compared to the value recorded on the surfaces immediately after milling. A substantial increase in the degree of SI was observed in most of the cases analysed (see Figure 6). For surfaces milled with milling cutter line feeds flm = 0.1 mm and flm = 0.3 mm, the degrees of SI improved by averages of about 458% and 160%, respectively. In the case of a milled surface with a milling cutter line feed flm = 0.5 mm, the degree of SI increased by an average of 112%, while with a milling cutter line feed flm = 0.7 mm, it increased by an average of 105%. In the fifteen machining cases carried out, the degree of SI was more than 15%.
By analysing only the reduction in the height parameters of the SGT, it could be considered that a significant plastic modification of the irregularities created by milling was made (change in height, shape and Abbott–Firestone curve [63]). However, during the tests, it was not possible to go from an anisotropic milled surface to an isotropic surface after burnishing, for which the degree of SI would be higher than 80%. This state of affairs is due to the defined geometry of the tools and the determined direction of their mutual guidance.
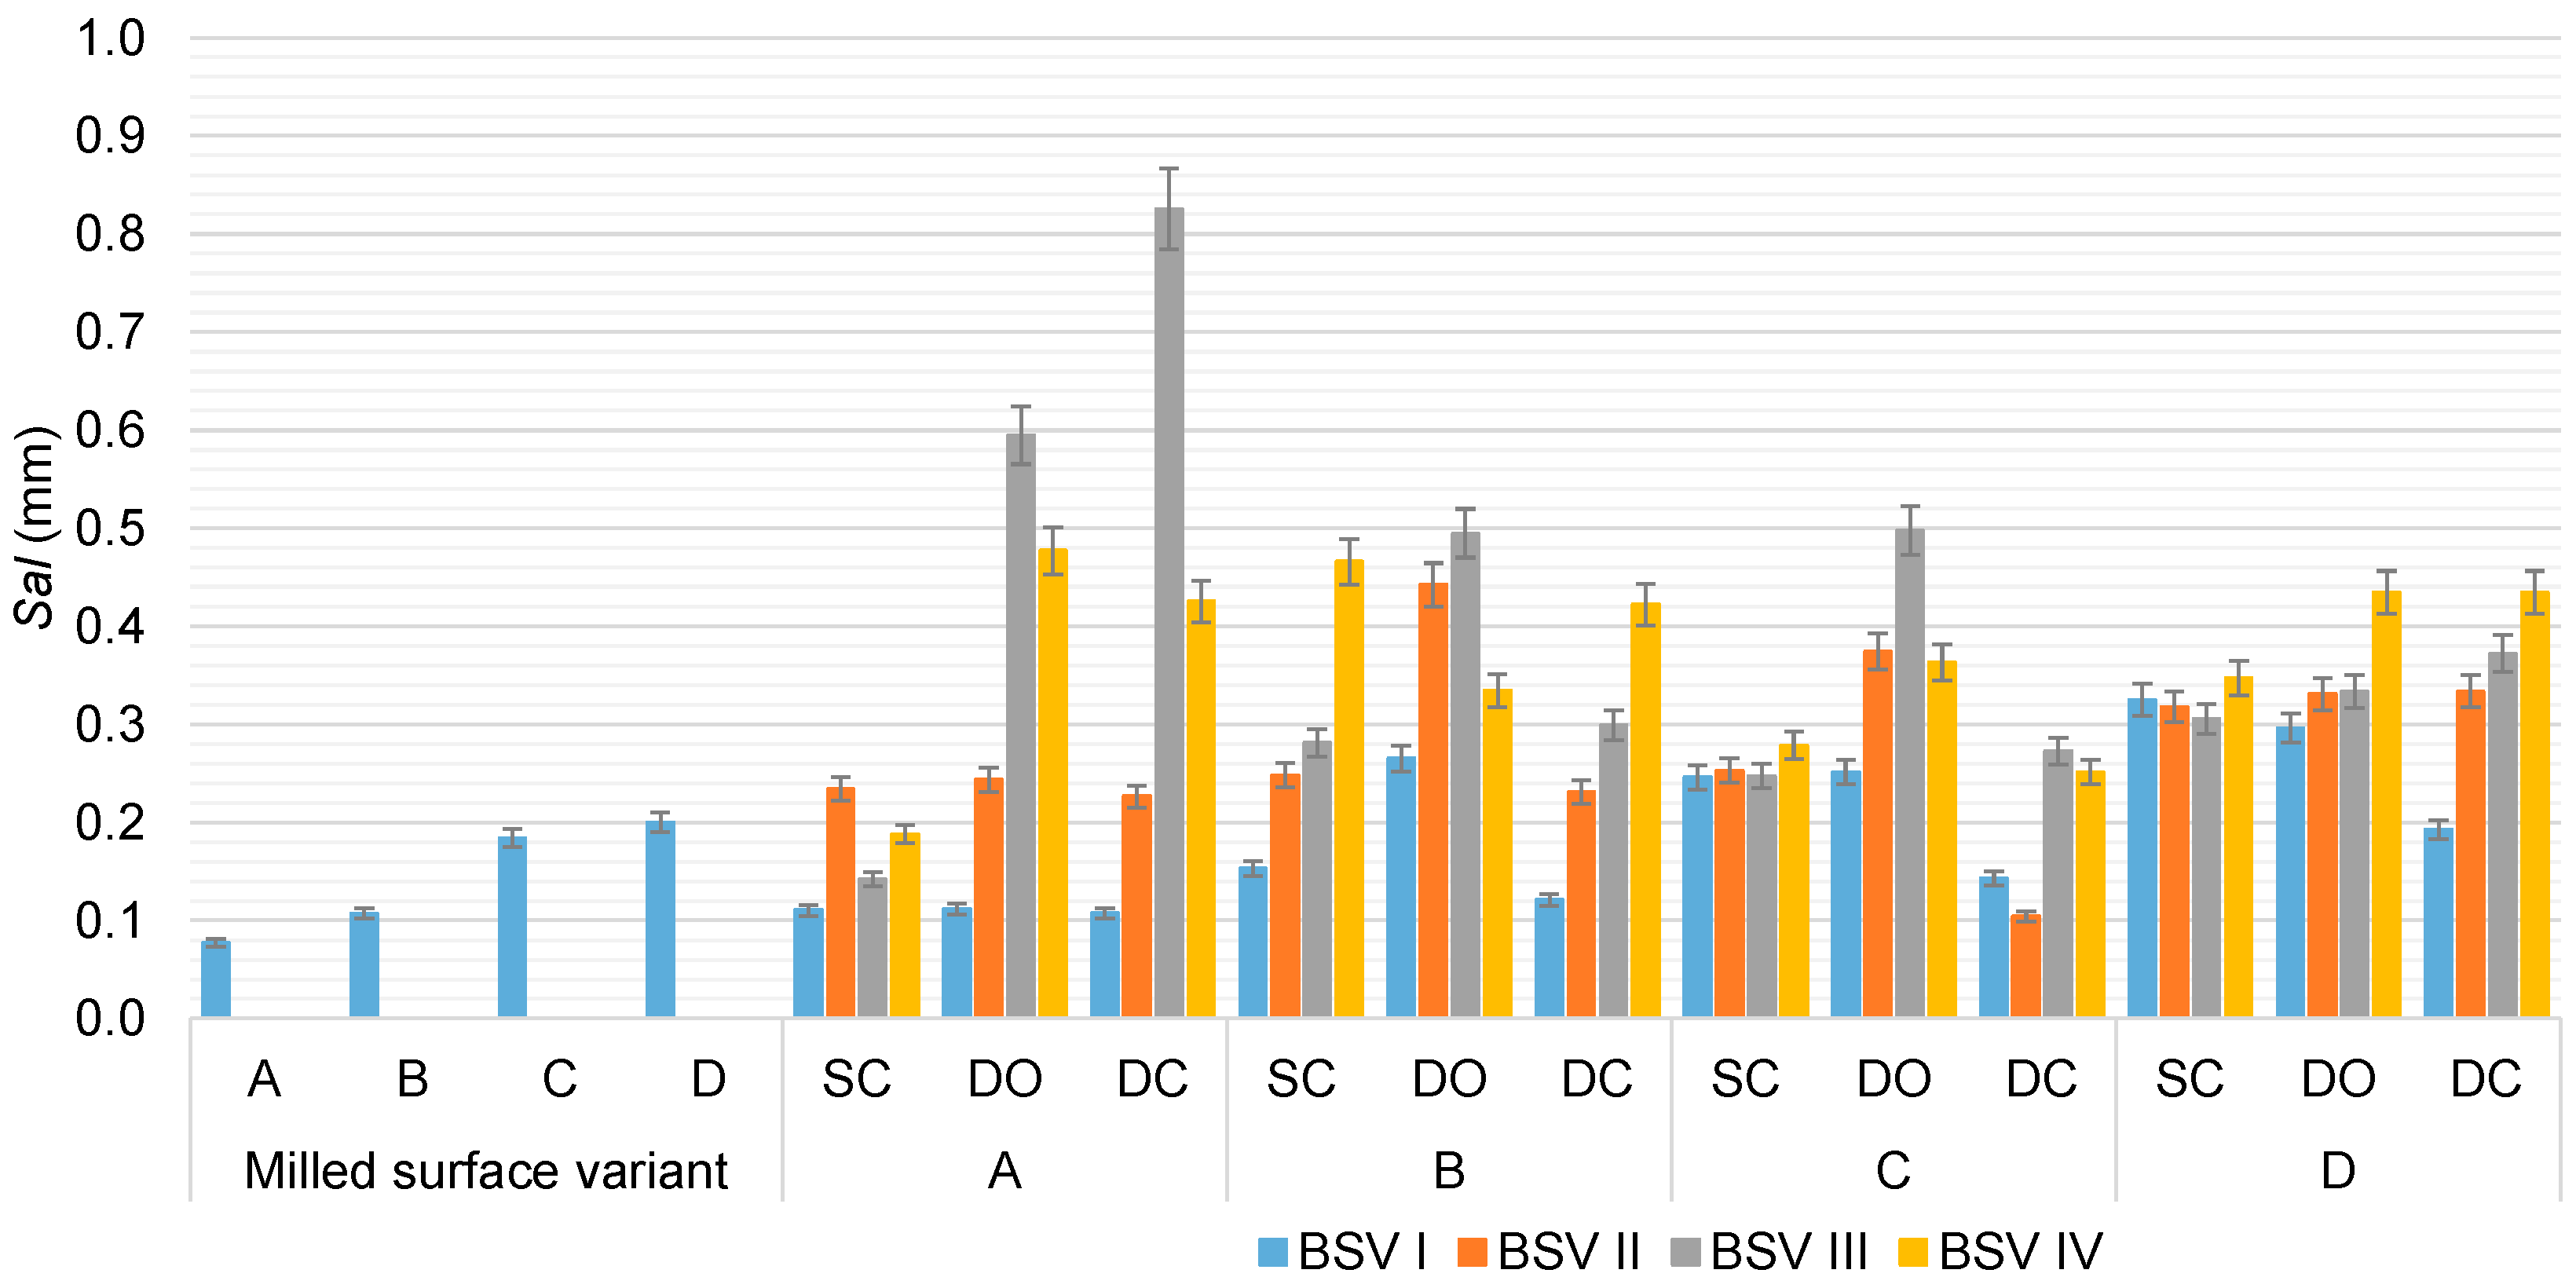
Variations in the Sal parameter as a function of the milling parameters and the applied strategy during burnishing are shown in Figure 7. In the case of the DC strategy, at a milling cutter line feed flm = 0.1 mm, this parameter reached a value close to 1, indicating that regular low-frequency waves were present on the surfaces produced according to this strategy. Despite the reduction in roughness in this case and the slight improvement in the degree of isotropy, the surfaces, which were originally milled, did not change their character to any significant extent after the burnishing.
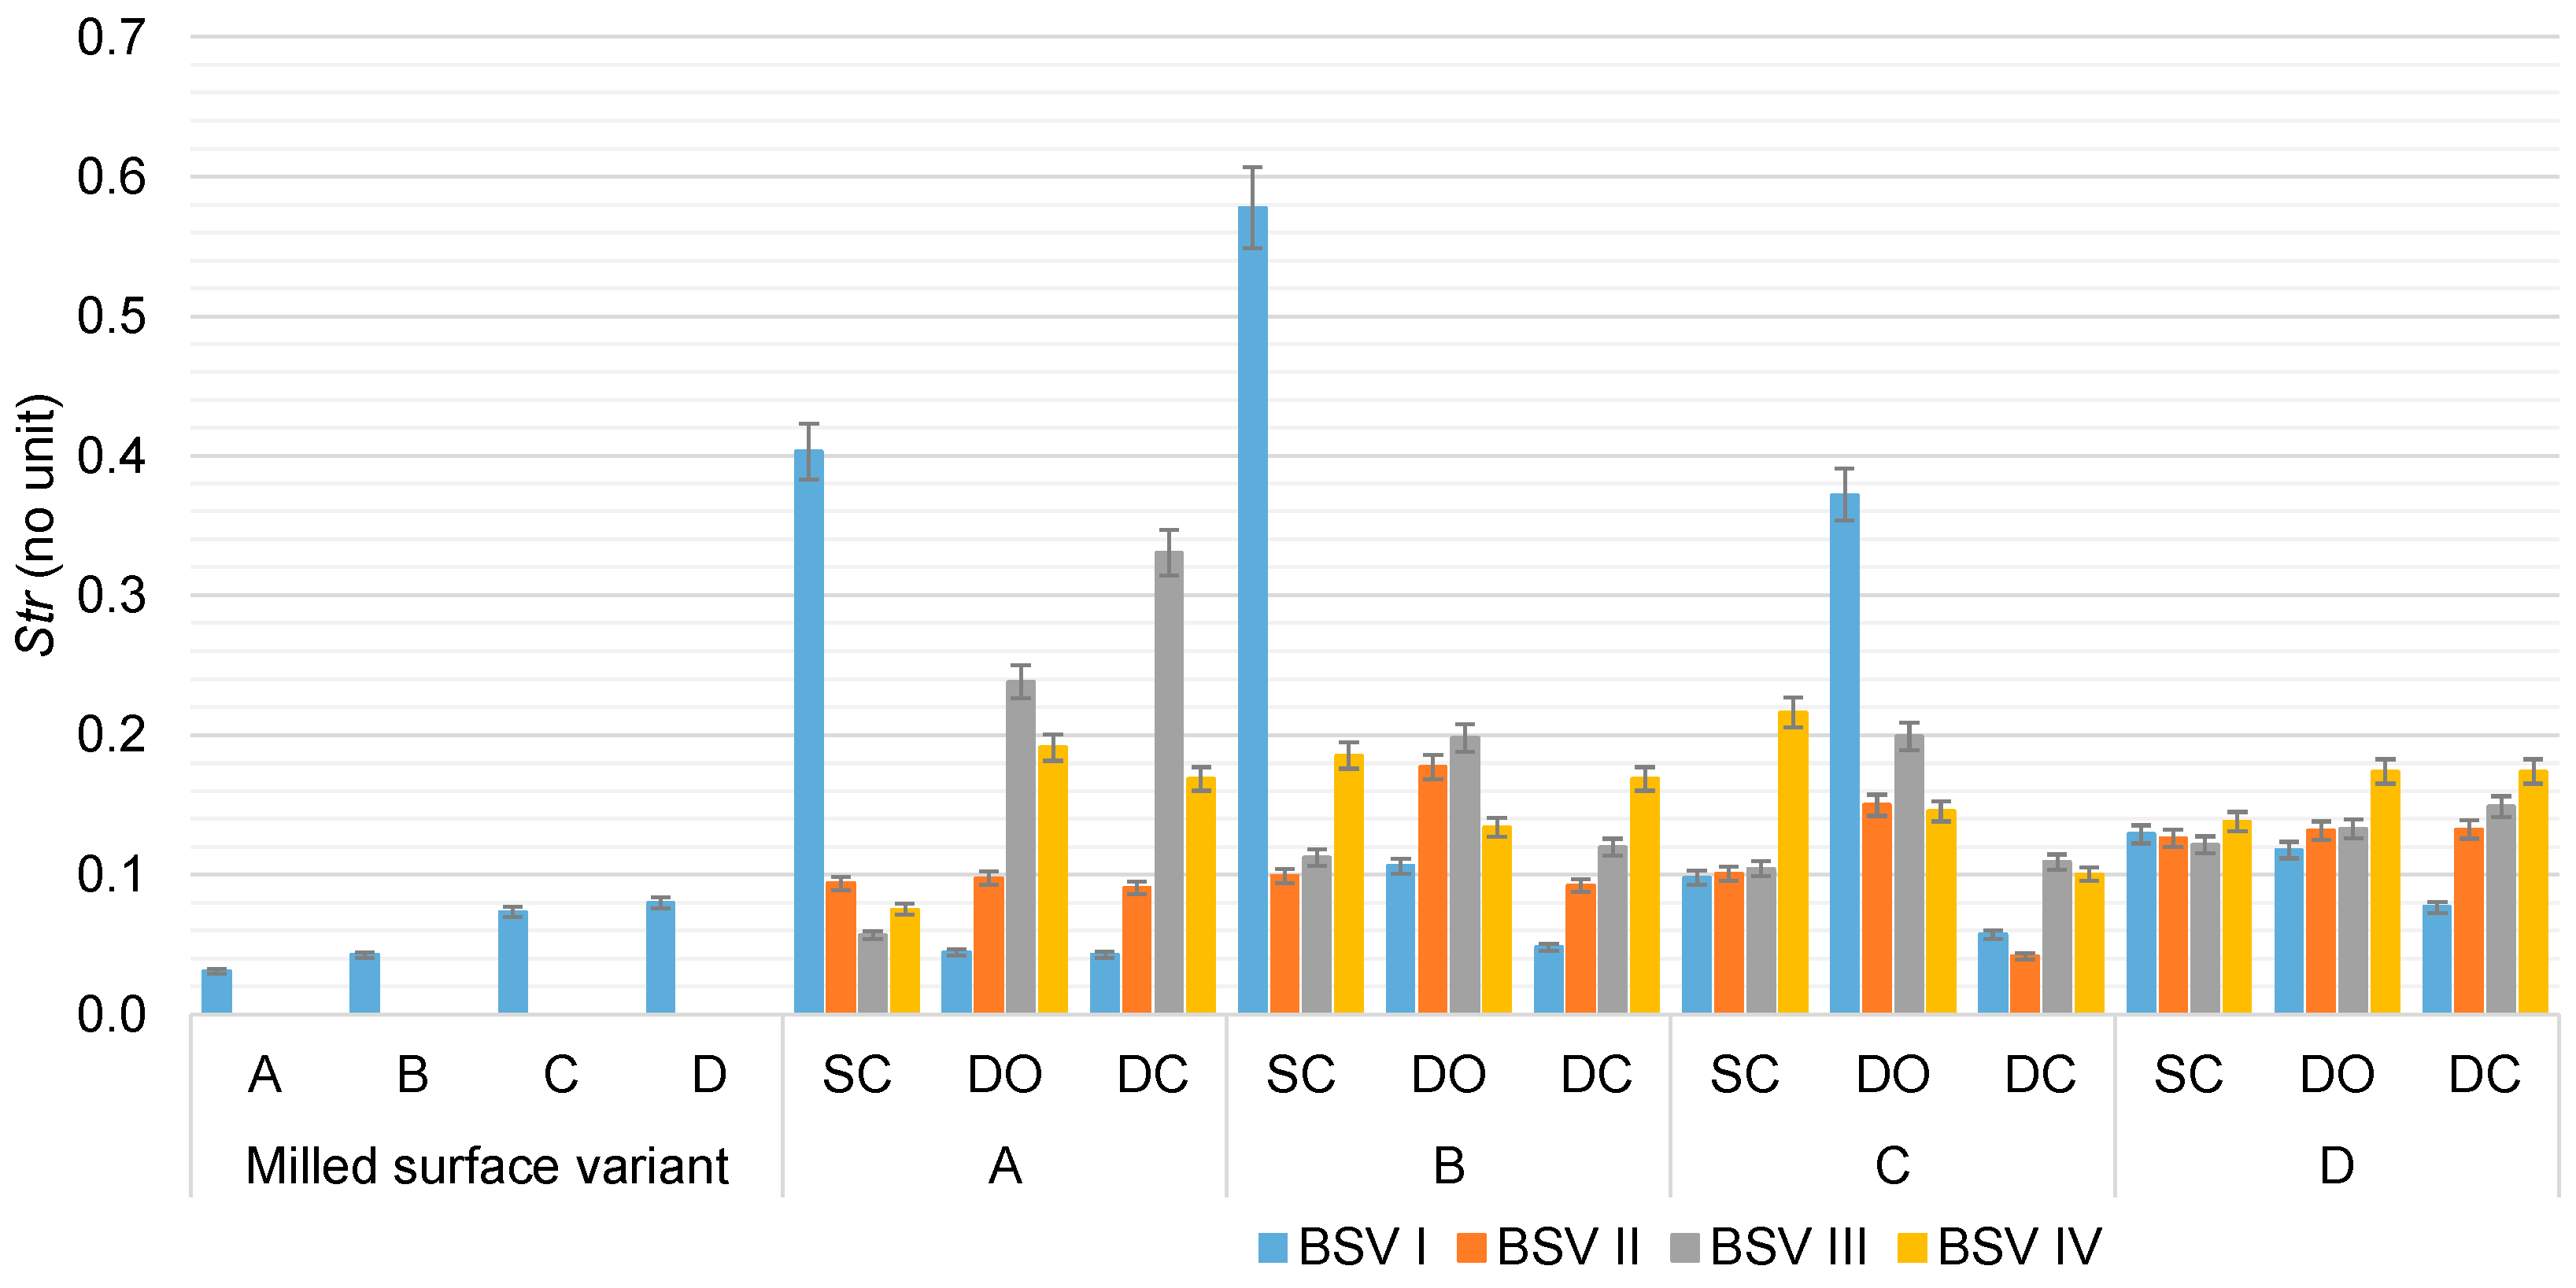
A similar nature of change to the degree of SI is indicated by the Str parameter (Figure 8). As mentioned in Appendix A, the value of the Str parameter ranges from 0 to 1, with a value of this parameter close to 0 indicating an anisotropic surface and a value of this parameter close to 1 indicating an isotropic surface. From the graphs in Figure 6 and Figure 8, it can be seen that there is a repeatability of the changes occurring in the degree of isotropy of the surface in all 12 cases.
The highest improvement in parameters related to surface isotropy (i.e., the transition from a periodic anisotropic structure to a non-directional isotropic structure) was provided by BSV I for all burnishing strategies. For this burnishing variant, increases were recorded for the Str parameter of 2.9 times compared to BSV II, 4.1 times compared to BSV III and 4.4 times compared to BSV IV.
Despite the significant reduction in the height parameters of the SGT, directionality in line with the direction of tool guidance during milling still prevailed on the surfaces (Figure 9).
Figure 10 shows the effect of different preparation conditions of the milled surface with the same strategy (SC type) on the degree of SI. It is easiest to improve the degree of SI with a single milling pass, provided that the irregularities left after milling are low with relatively gentle slopes (i.e., those obtained after fine finishing milling). On the other hand, the degree of SI changes quite considerably after shaping milling, where a milling cutter line feed flm greater than 0.5 mm was used. With this high-efficiency machining, although the change in roughness height (expressed by the parameters Sa and Sz) significantly exceeds 60%, the change in the degree of SI is only 20%–25%, as illustrated in Figure 10c.
Of the sixteen test variants carried out according to the SC strategy, the most favourable cases occurred when a milling cutter line feed flm of 0.1 mm and 0.3 mm were combined with a burnishing line feed flb of 0.02 mm. This strategy is the most sensitive to surface preparation during milling.
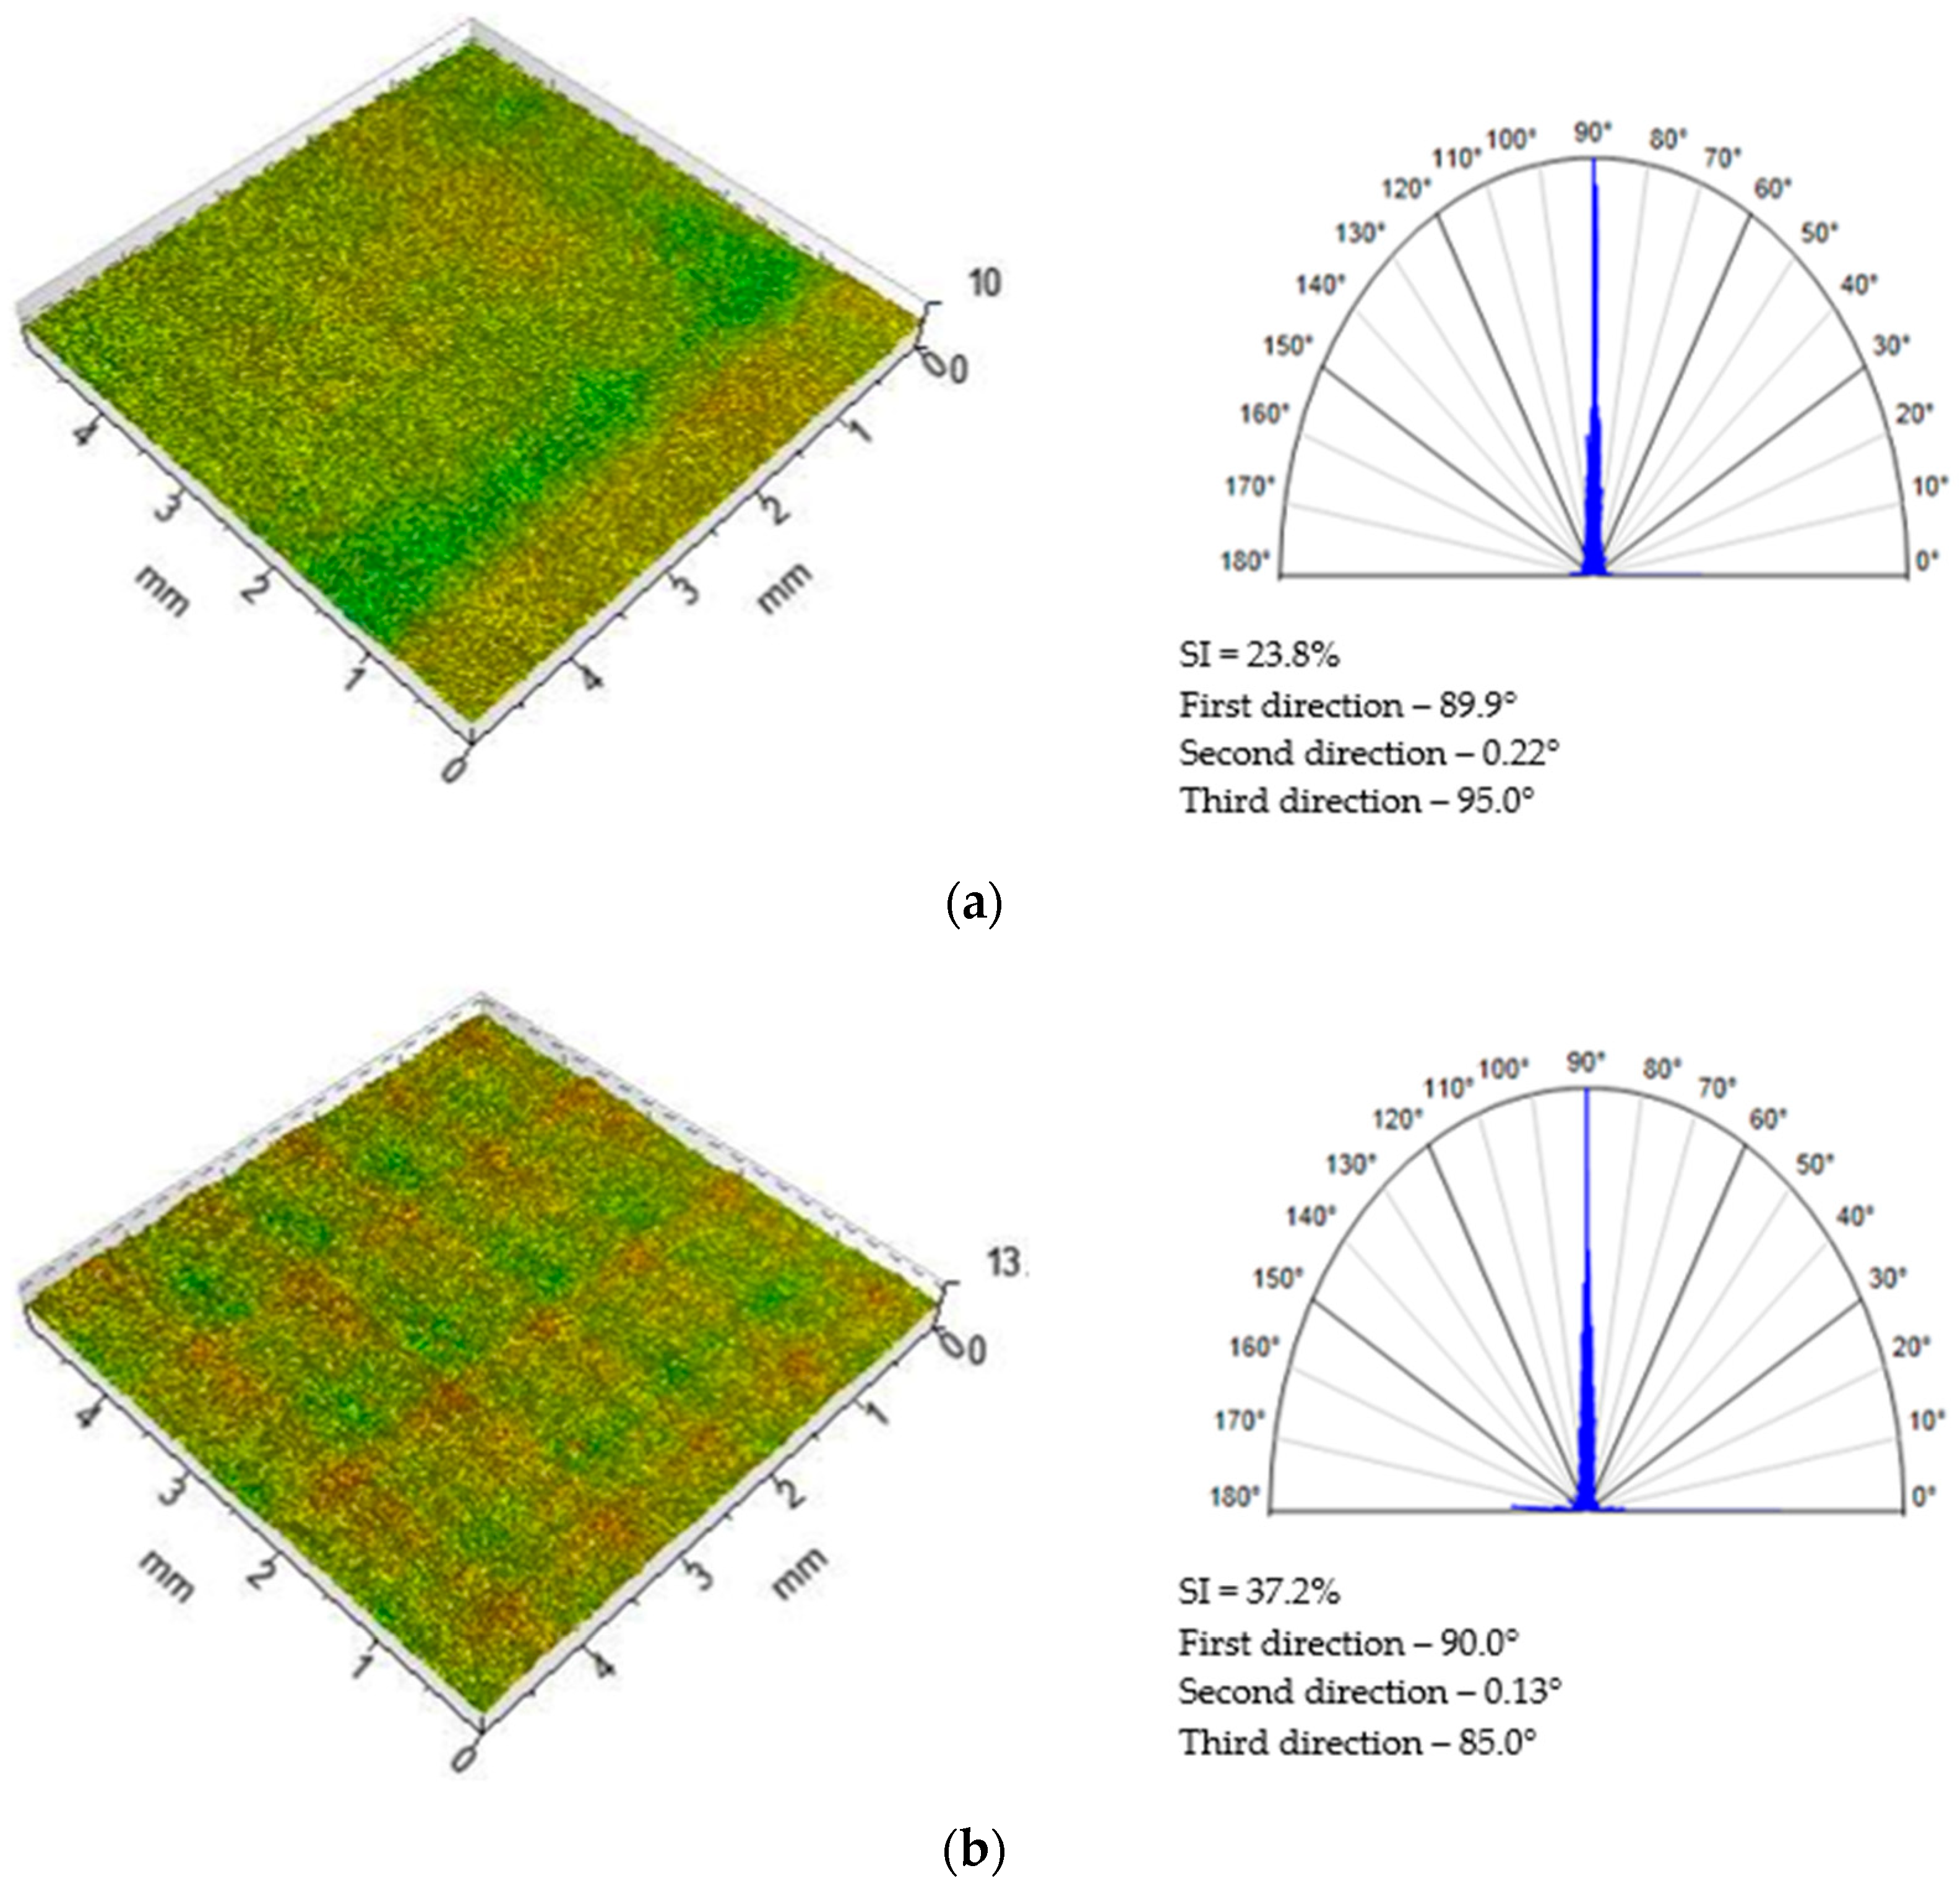
Very interestingly, an average degree of SI of 16.3% was recorded for burnishing according to the DO strategy. What is noteworthy is that, in comparison to burnishing according to the SC strategy, the DO strategy in all sixteen test systems yielded a smaller scatter in the degree of SI—reaching a level of 32.7%. The two-pass burnishing made it easier to achieve similar changes on the surface during shaping and finishing.
The two most interesting cases in which the greatest change in the degree of SI was obtained are presented in Figure 11. Figure 11a shows the surface obtained after milling with a cutter line feed flm = 0.1 mm and burnishing with a line feed flb = 0.14 mm, for which the degree of isotropy reached a value of 23.8%. Figure 11b, on the other hand, shows the surface obtained after milling with a cutter line feed flm = 0.5 mm and burnishing with a line feed flb = 0.02 mm, for which the degree of isotropy reached a value of 37.2%.
In none of the 48 completed experimental plan layouts was it possible to achieve a degree of SI higher than 80%. This means that during the experimental tests, it was not possible to go from an anisotropic surface after milling to an isotropic surface after pressing.
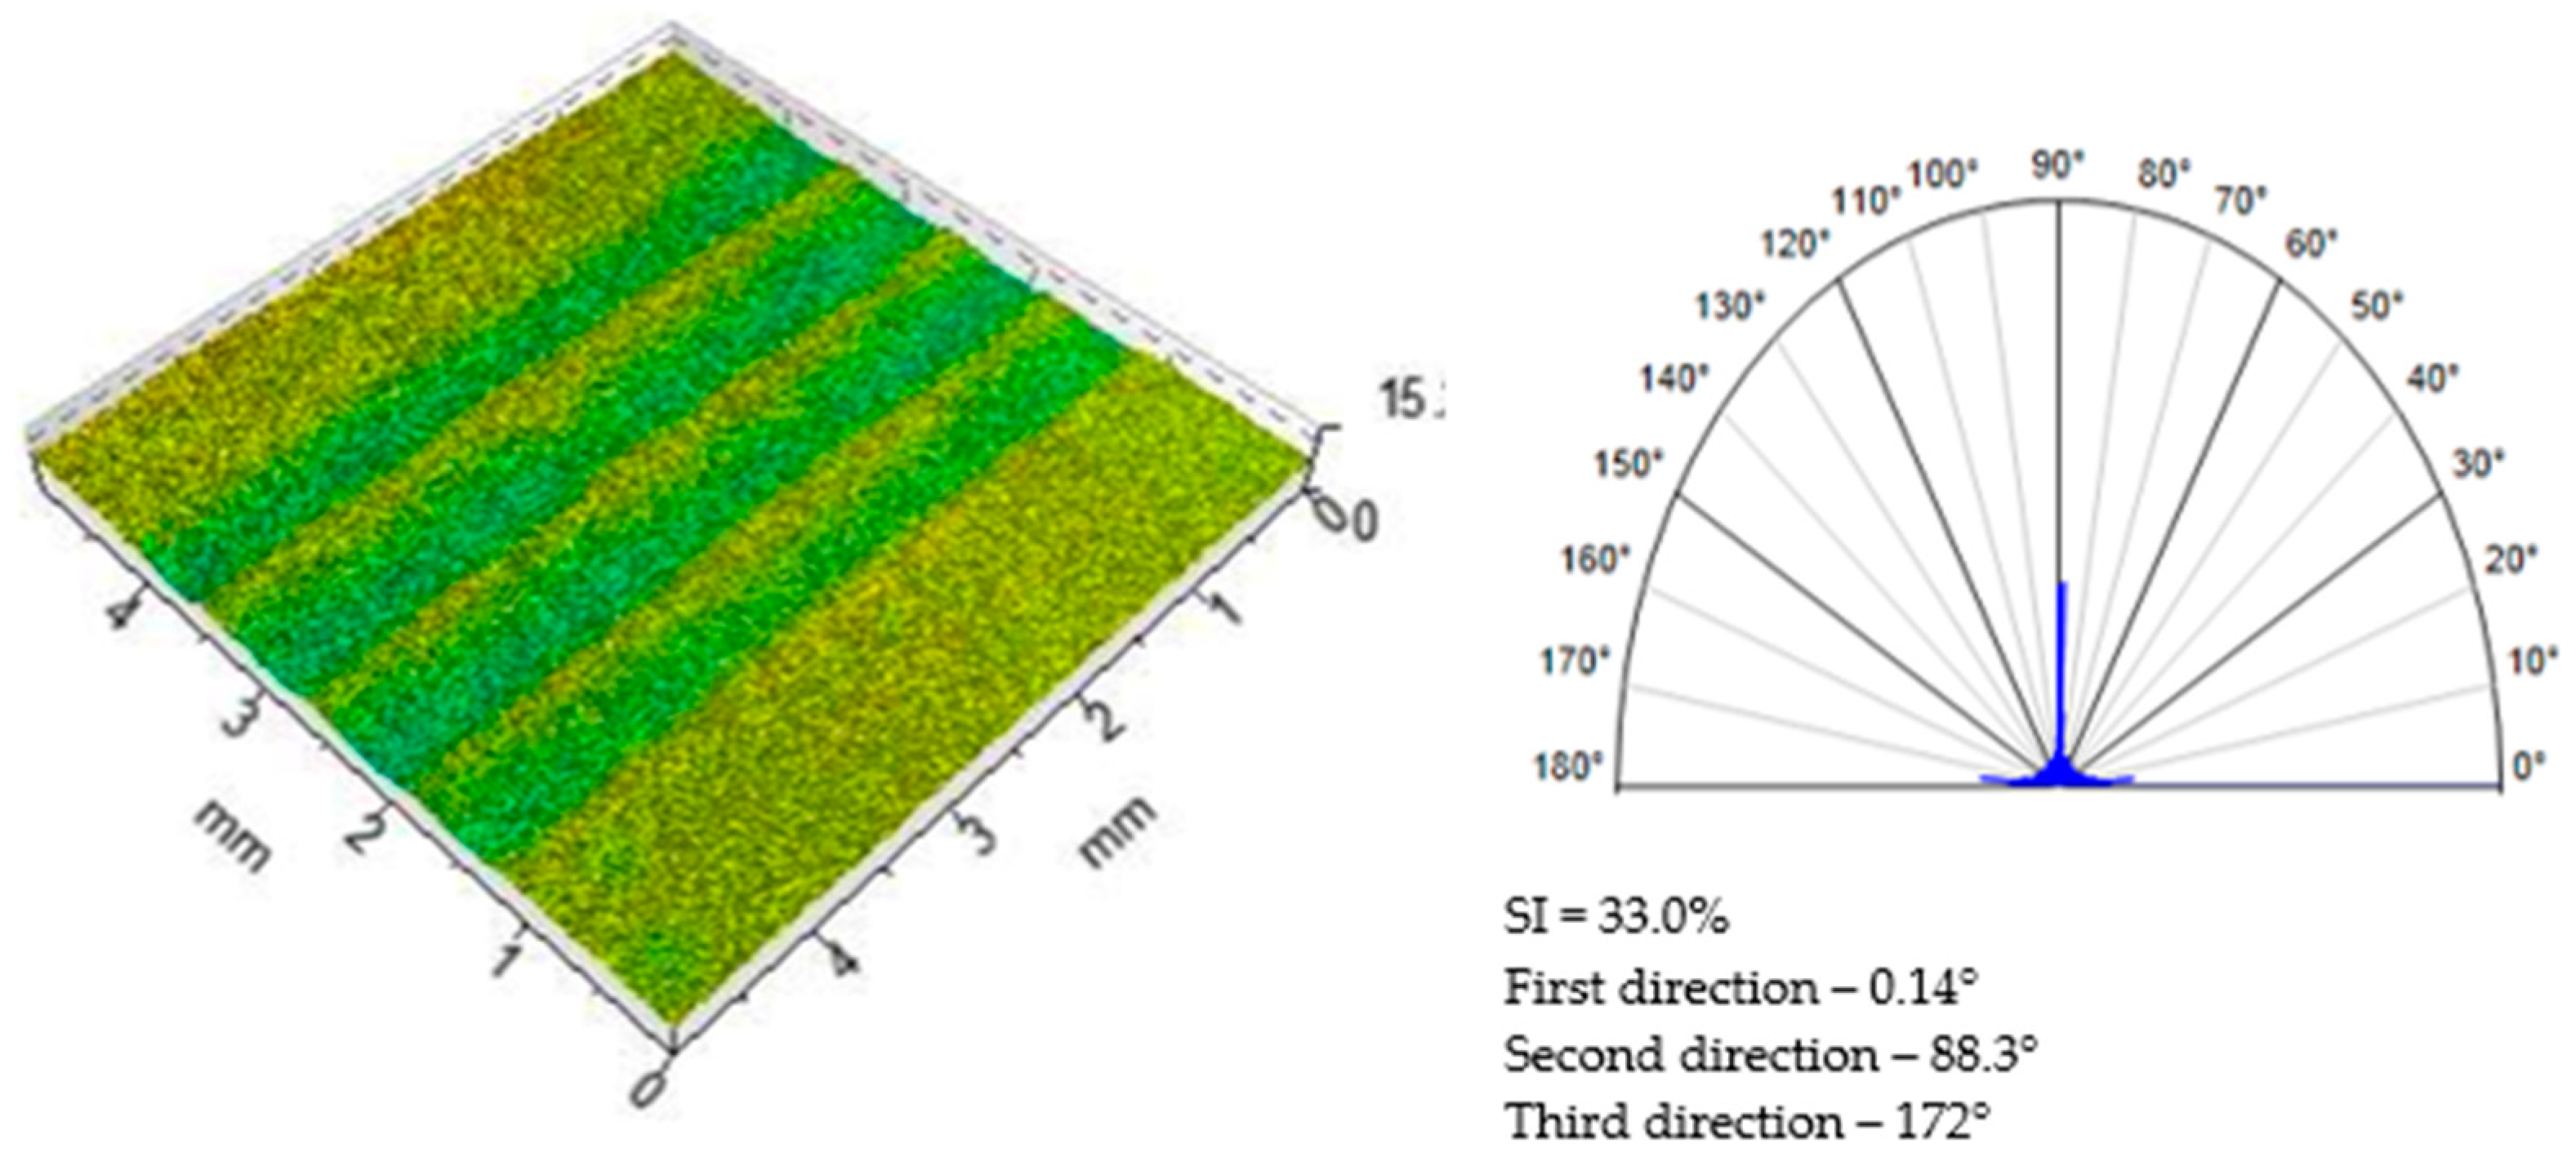
Of all the burnishing strategies tested, the DC strategy with two crossed burnishing passes oriented obliquely to the marks left by the cutter yielded on average the lowest degree of SI—at 11.9%. However, implementing the burnishing treatments in this way allowed the surface improvement to be achieved very evenly across all sixteen test systems. The smallest variation in effect was recorded for this strategy, with a variation of only 28.7%, making this the safest machining strategy for achieving uniform results across the entire range of technological machining parameters. This confirms the results of research by other authors, who compared burnishing according to a straight pass and various arrangements of intersecting passes [64,65]. One of the more interesting cases where milling with a cutter line feed flm = 0.1 mm and burnishing according to a DC strategy with a line feed flb = 0.14 mm are combined is shown in Figure 12.

4. Conclusions

Based on the research carried out, the following final conclusions can be drawn:
  • The use of SI parameters to describe the efficiency of machining avoids subjective evaluation of the produced surface by the technologist. In addition, the criterion of isotropy, combined with the values of the height parameters of the SGT, allows a more efficient selection of technological processing parameters of often different machining operations combined into a single HMP.
  • As the surface roughness decreases after milling, the marks left by the burnishing process become increasingly visible. This means that in the case of two-pass burnishing, in addition to the first direction of milling, there are often second and third directions of the marks left on the surface by the burnishing tool. This, in turn, prevents the transition from an anisotropic milled surface to an isotropic burnished surface, for which the degree of SI would be higher than 80%.
  • Burnishing strategies using two machining passes are characterised by a smaller degree of SI scatter compared to machining with one burnishing pass. This is due to the mechanics of the process and the lesser influence of the so-called machining after the mark left by the earlier machining.
  • In the course of the study, the DC strategy with two crossed burnishing passes oriented obliquely to the marks left by the cutter proved to be the most favourable of the burnishing strategies tested. Comparably good results can be achieved with an orthogonal strategy with a single burnishing pass (SC type). In this case, a prerequisite for success is the use of a low value of the line feed rate during burnishing. The weakest performance during the tests was with a double orthogonal strategy (DO type), in which two burnishing passes were made perpendicular to the cutter marks.
  • During the burnishing process, a low burnishing force of Fb = 1000 N was used, sufficient to reduce the high-amplitude components of surface roughness. Unfortunately, for the compensation of low-amplitude and long-period roughness components, tools with burnishing balls (rollers) must be used that significantly exceed the radii of the cutting inserts used in milling, in which case the burnishing must be carried out at a much higher value of the force Fb.
  • A radical improvement in the degree of SI, i.e., an increase of more than 80%, could be achieved by using tools in which, in addition to the basic feed movement of the burnishing, there would be an additional rotational movement of the burnishing head (equipped with a greater number of burnishing balls or rollers).
  • There is a high probability that the produced anisotropic SGT (e.g., of a stamping die or a die) will be transferred to the surface of the manufactured products, causing them to tarnish. Also, the quality of the protective coatings applied or the quality of lubrication of the product surfaces will depend on the dominant direction of the marks left by tools during milling.

Author Contributions

Conceptualisation, D.G.; methodology, D.G.; software, D.G.; validation, D.G., R.G., J.J. and Z.S.; formal analysis, D.G. and R.G.; investigation, D.G.; resources, D.G.; data curation, D.G.; writing—original draft preparation, D.G. and R.G.; writing—review and editing, D.G., R.G., J.J. and Z.S.; visualisation, D.G.; supervision, D.G., J.J. and Z.S.; project administration, R.G.; funding acquisition, J.J. All authors have read and agreed to the published version of the manuscript.

Funding

Research carried out on research apparatus purchased as part of the project No. RPZP.01.03.00-32-0004/18 was co-financed by the European Union from the European Regional Development Fund under the Regional Operational Programme of the West Pomeranian Voivodeship 2014–2020 and co-financed by the Polish Ministry of Education and Science.

Institutional Review Board Statement

Not applicable.

Informed Consent Statement

Not applicable.

Data Availability Statement

Data are available upon request from the corresponding authors.

Conflicts of Interest

The authors declare no conflicts of interest.

Abbreviations

The following abbreviations are used in this paper:
BSVBurnished surface variant
CNCComputer Numerical Control
DCDouble cross burnishing strategy
DODouble orthogonal burnishing strategy
HMPHybrid machining process
HRCRockwell hardness of hardened steel
SCSingle cross burnishing strategy
SGTSurface geometrical texture
SISurface isotropy

Appendix A. Surface Isotropy

The way in which the characteristic marks left on a surface by the machining (i.e., the tools and technological parameters) are distributed is called the degree of SI. Surfaces that are machined and then burnished have an important determined component that results from the mapping of the shape of the milling cutter blades, the milling cutter feed fm and the milling cutter line feed flm, but also from the diameter of the burnishing tool db and the applied line feed flb during burnishing. On a surface shaped in this way, besides the determined component, irregularities of a random nature can also be observed. The proportion of irregularities in the overall roughness height resulting from milling and burnishing can vary greatly [66,67]. Generally, these differences depend on the milling and burnishing strategy adopted. Isotropy is expressed as a percentage in the range from 0% to 100%. By convention, anisotropic surfaces are assumed to have a degree of isotropy of less than 20%, while isotropic surfaces have a degree of isotropy of more than 80% (see Figure A1).
Figure A1. Determination of the degree of SI: (a) Anisotropic milled surface with a degree of isotropy of 8.23%; (b) isotropic burnished surface with a degree of isotropy of 95.2% (source: own research).
Coatings 15 00461 g0a1
The isotropic nature of the SGT means that the surface structure is the same in all directions. Simultaneously, it is a structure that is perfectly symmetrical about all possible axes of symmetry [62]. There are different ways to determine the degree of SI. The most common way to establish it is to analyse the autocorrelation function at an autocorrelation level τ of 0.2 [62]. Anisotropic surfaces have an autocorrelation function shape that is asymmetric, elongated and slender in one direction, while isotropic surfaces have an autocorrelation function shape that is more oval, sometimes circular and symmetric (Figure A2).
Figure A2. Plots of the autocorrelation function of the surface at τ = 0.2 for: (a) Anisotropic milled surface with a degree of isotropy of 8.23%; (b) isotropic burnished surface with a degree of isotropy of 95.2% (source: own research).
Coatings 15 00461 g0a2
A correctly implemented machining process combining shaping milling with finishing burnishing, in addition to reducing the height parameters of the SGT, should lead to a change in the resulting texture from that typical of anisotropic surfaces (i.e., with parallel directionality) to that typical of isotropic surfaces (i.e., without directionality) [68]. The application of excessive force during burnishing can cause a transition from isotropic to anisotropic texture again with a reduction in surface roughness. Deep furrows are then observed on the surface as a result of the rolling away of the burnishing ball in two successive parallel passes.
In surface topography analysis, spatial parameters describing features related to the degree of SI are determined by spectral analysis of the information contained in the surface image in the two perpendicular X and Y directions (according to ISO 25178-2 [62,69]). These parameters include the following [70,71]:
  • Sal—Surface autocorrelation length;
  • Str—Surface texture aspect ratio;
  • Std—Surface texture directionality.
The Sal parameter expresses the presence of long and regular waves on the surface. A high value of this parameter indicates that regular low-frequency waves are present in the surface. The value of the Str parameter falls between 0 and 1. A value of the Str parameter close to 0 indicates that the surface is anisotropic, while a value of the Str parameter close to 1 indicates that the surface is isotropic. The Std parameter defines the main SGT angle based on the polar spectrum of the surface ordinates. It is defined for anisotropic surfaces when the value of the Str parameter is less than 0.5.

References

  1. Thomas, T.R. Rough Surfaces, 2nd ed.; World Scientific Publishing Company: Singapore, 1998. [Google Scholar]
  2. Smith, G.T. Industrial Metrology, Surfaces and Roundness; Springer: London, UK, 2002. [Google Scholar]
  3. Muralikrishnan, B.; Raja, J. Computational Surface and Roundness Metrology; Springer: London, UK, 2009. [Google Scholar]
  4. Nozdrzykowski, K.; Grządziel, Z.; Dunaj, P. Analysis of contact deformations in support systems using roller prisms. Materials 2021, 14, 2644. [Google Scholar] [CrossRef] [PubMed]
  5. Ryba, T.; Rucki, M.; Siemiatkowski, Z.; Bzinkowski, D.; Solecki, M. Design and calibration of the system supervising belt tension and wear in an industrial feeder. Facta Univ. 2022, 20, 167–176. [Google Scholar] [CrossRef]
  6. Sługocka, M.; Grochała, D.; Kwiatkowski, K.; Grzejda, R.; Zmarzły, P. Study of the impact of surface topography on selected mechanical properties of adhesive joints. Coatings 2024, 14, 944. [Google Scholar] [CrossRef]
  7. Grochała, D.; Jasiewicz, M.; Filipowicz, K.; Parus, A.; Powałka, B.; Grzejda, R.; Zmarzły, P. Assessment of the functional properties of the surfaces of ductile cast iron parts. Appl. Sci. 2024, 14, 9129. [Google Scholar] [CrossRef]
  8. Gdula, M.; Józwik, J.; Skoczylas, A. Tool wear and surface topography shaping after TPl multi-axis milling of Ni-based superalloy of the torus milling cutter using the strategy of adaptive change of the active cutting edge segment. Wear 2025, 562–563, 205637. [Google Scholar] [CrossRef]
  9. Grudzień, J.; Grochała, D.; Grzejda, R.; Kochmański, P. Testing the effectiveness of hybrid milling and surface burnishing in improving the wear resistance of machine parts made of structural steel. Lubricants 2024, 12, 458. [Google Scholar] [CrossRef]
  10. Zhu, Z.; Dhokia, V.G.; Nassehi, A.; Newman, S.T. A review of hybrid manufacturing processes—State of the art and future perspectives. Int. J. Comput. Integr. Manuf. 2013, 26, 596–615. [Google Scholar] [CrossRef]
  11. Chu, W.-S.; Kim, C.-S.; Lee, H.-T.; Choi, J.-O.; Park, J.-I.; Song, J.-H.; Jang, K.-H.; Ahn, S.-H. Hybrid manufacturing in micro/nano scale: A Review. Int. J. Precis. Eng. Manuf.-Green Technol. 2014, 1, 75–92. [Google Scholar] [CrossRef]
  12. Schuh, G.; Kreysa, J.; Orilski, S. Roadmap “Hybrid production”. Z. Wirtsch. Fabrikbetr. 2009, 104, 385–391. (In Germany) [Google Scholar] [CrossRef]
  13. Lauwers, B.; Klocke, F.; Klink, A.; Tekkaya, A.E.; Neugebauer, R.; Mcintosh, D. Hybrid processes in manufacturing. CIRP Ann. 2014, 63, 561–583. [Google Scholar] [CrossRef]
  14. Nau, B.; Roderburg, A.; Klocke, F. Ramp-up of hybrid manufacturing technologies. CIRP J. Manuf. Sci. Technol. 2011, 4, 313–316. [Google Scholar] [CrossRef]
  15. Klocke, F.; Stauder, J.; Mattfeld, P.; Müller, J. Modeling of manufacturing technologies during ramp-up. Procedia CIRP 2016, 51, 122–127. [Google Scholar] [CrossRef]
  16. Lauwers, B.; Klocke, F.; Klink, A. Advanced Manufacturing Through the Implementation of Hybrid and Media Assisted Processes. In Proceedings of the International Chemnitz Manufacturing Colloquium, Chemnitz, Germany, 29–30 September 2010; pp. 205–220. [Google Scholar]
  17. Rajurkar, K.P.; Zhu, D.; McGeough, J.A.; Kozak, J.; De Silva, A. New developments in electro-chemical machining. CIRP Ann. 1999, 48, 567–579. [Google Scholar] [CrossRef]
  18. Dandekar, C.R.; Shin, Y.C.; Barnes, J. Machinability improvement of titanium alloy (Ti-6Al-4V) via LAM and hybrid machining. Int. J. Mach. Tools Manuf. 2010, 50, 174–182. [Google Scholar] [CrossRef]
  19. Swirad, S.; Wdowik, R. Determining the effect of ball burnishing parameters on surface roughness using the Taguchi method. Procedia Manuf. 2019, 34, 287–292. [Google Scholar] [CrossRef]
  20. López de Lacalle, L.N.; Rodríguez, A.; Lamikiz, A.; Celaya, A.; Alberdi, R. Five-axis machining and burnishing of complex parts for the improvement of surface roughness. Mater. Manuf. Process. 2011, 26, 997–1003. [Google Scholar] [CrossRef]
  21. Kalisz, J.; Żak, K.; Wojciechowski, S.; Gupta, M.K.; Krolczyk, G.M. Technological and tribological aspects of milling-burnishing process of complex surfaces. Tribol. Int. 2021, 155, 106770. [Google Scholar] [CrossRef]
  22. Teimouri, R.; Grabowski, M.; Kowalczyk, M.; Skoczypiec, S. Simulation of surface roughness alternation in milling-burnishing sequence. Measurement 2023, 218, 113160. [Google Scholar] [CrossRef]
  23. Mezlini, S.; Mzali, S.; Sghaier, S.; Braham, C.; Kapsa, P. Effect of a combined machining/burnishing tool on the roughness and mechanical properties. Lubr. Sci. 2014, 26, 175–187. [Google Scholar] [CrossRef]
  24. Boozarpoor, M.; Elyasi, M.; Hosseinzadeh, M. An investigation of the surface quality of burnished AISI 4340 steel. Proc. Inst. Mech. Eng. Part E J. Process Mech. Eng. 2018, 232, 299–313. [Google Scholar] [CrossRef]
  25. Arsalani, M.; Razfar, M.R.; Abdullah, A.; Khajehzadeh, M. Fatigue behavior improvement of hardened parts using sequential hard turning, grinding, and ball burnishing operations. Proc. Inst. Mech. Eng. Part L J. Mater. Des. Appl. 2021, 235, 87–99. [Google Scholar] [CrossRef]
  26. Dyl, T.; Rydz, D.; Szarek, A.; Stradomski, G.; Fik, J.; Opydo, M. The influence of slide burnishing on the technological quality of X2CrNiMo17-12-2 steel. Materials 2024, 17, 3403. [Google Scholar] [CrossRef] [PubMed]
  27. Nadolny, K.; Plichta, J.; Radowski, M. Reciprocal internal cylindrical grinding integrated with dynamic centrifugal burnishing of hard-to-cut materials. Proc. Inst. Mech. Eng. Part E J. Process Mech. Eng. 2015, 229, 265–279. [Google Scholar] [CrossRef]
  28. Teimouri, R.; Amini, S.; Bami, A.B. Evaluation of optimized surface properties and residual stress in ultrasonic assisted ball burnishing of AA6061-T6. Measurement 2018, 116, 129–139. [Google Scholar] [CrossRef]
  29. Amini, S.; Bagheri, A.; Teimouri, R. Ultrasonic assisted ball burnishing of aluminum 6061 and AISI 1045 steel. Mater. Manuf. Process. 2018, 33, 1250–1259. [Google Scholar] [CrossRef]
  30. Khosrojerdi, M.; Razfar, M.R.; Fesharakifard, R.; Khajehzadeh, M. Improvement of the frictional behavior of Al 7075-T6 by ultrasonic-assisted ball burnishing process. Proc. Inst. Mech. Eng. Part L J. Mater. Des. Appl. 2023, 237, 1082–1092. [Google Scholar] [CrossRef]
  31. Ghodake, A.P.; Rakhade, R.D.; Maheshwari, A.S. Effect of burnishing process on behavior of engineering materials—A review. IOSR J. Mech. Civ. Eng. 2013, 5, 9–20. [Google Scholar]
  32. Bachtiak-Radka, E.; Grochała, D.; Chmielewski, K.; Olszak, W. The isotropy tests of a milled and hard-burnished surface of the X160CrMoV121 steel. Mechanik 2015, 88, 641–653. [Google Scholar] [CrossRef]
  33. Świrad, S.; Wydrzynski, D.; Nieslony, P.; Krolczyk, G.M. Influence of hydrostatic burnishing strategy on the surface topography of martensitic steel. Measurement 2019, 138, 590–601. [Google Scholar] [CrossRef]
  34. Qi, B.; Chai, Z.; Huang, X.; Guo, W.; Ren, X.; Chen, H.; Chen, X. Surface integrity improvement of the ground surface of Inconel 718 fabricated by forging and additive manufacturing using a robotic rotational burnishing method. J. Manuf. Process. 2024, 125, 566–579. [Google Scholar] [CrossRef]
  35. Zhou, Z.; Shi, H.; Zheng, Q.; Li, Y.; Jiang, Z.; Yuan, Z.; Piao, Z. Research on fabricating gradient nanostructure and enhancing wear resistance in aluminum alloy via two-dimensional ultrasonic surface burnishing. Surf. Coat. Technol. 2024, 494, 131302. [Google Scholar]
  36. Keymanesh, M.; Ji, H.; Zhang, X.; Wang, J.; Feng, P.; Zhang, J. Multi-roller taper burnishing of internal chamfers and its enhancement mechanism on 7050 aluminum alloy. Int. J. Fatigue 2024, 189, 108571. [Google Scholar] [CrossRef]
  37. El-Taweel, T.A.; El-Axir, M.H. Analysis and optimization of the ball burnishing process through the Taguchi technique. Int. J. Adv. Manuf. Technol. 2009, 41, 301–310. [Google Scholar] [CrossRef]
  38. Gharbi, F.; Sghaier, S.; Al-Fadhalah, K.J.; Benameur, T. Effect of ball burnishing process on the surface quality and microstructure properties of AISI 1010 steel plates. J. Mater. Eng. Perform. 2011, 20, 903–910. [Google Scholar] [CrossRef]
  39. Korzynski, M.; Pacana, A.; Cwanek, J. Fatigue strength of chromium coated elements and possibility of its improvement with slide diamond burnishing. Surf. Coat. Technol. 2009, 203, 1670–1676. [Google Scholar] [CrossRef]
  40. Avilés, R.; Albizuri, J.; Rodríguez, A.; López de Lacalle, L.N. Influence of low-plasticity ball burnishing on the high-cycle fatigue strength of medium carbon AISI 1045 steel. Int. J. Fatigue 2013, 55, 230–244. [Google Scholar] [CrossRef]
  41. Travieso-Rodriguez, J.A.; Gómez Gras, G.; Jorba Peiró, J.; Carrillo, F.; Dessein, G.; Alexis, J.; González Rojas, H. Experimental study on the mechanical effects of the vibration-assisted ball-burnishing process. Mater. Manuf. Process. 2015, 30, 1490–1497. [Google Scholar] [CrossRef]
  42. Travieso-Rodriguez, J.A.; Gomez-Gras, G.; Dessein, G.; Carrillo, F.; Alexis, J.; Jorba Peiró, J.; Aubazac, N. Effects of a ball-burnishing process assisted by vibrations in G10380 steel specimens. Int. J. Adv. Manuf. Technol. 2015, 81, 1757–1765. [Google Scholar] [CrossRef]
  43. Revankar, G.D.; Shetty, R.; Rao, S.S.; Gaitonde, V.N. Analysis of surface roughness and hardness in ball burnishing of titanium alloy. Measurement 2014, 58, 256–268. [Google Scholar] [CrossRef]
  44. Revankar, G.D.; Shetty, R.; Rao, S.S.; Gaitonde, V.N. Wear resistance enhancement of titanium alloy (Ti–6Al–4V) by ball burnishing process. J. Mater. Res. Technol. 2017, 6, 13–32. [Google Scholar] [CrossRef]
  45. Luo, H.; Liu, J.; Wang, L.; Zhong, Q. Study of the mechanism of the burnishing process with cylindrical polycrystalline diamond tools. J. Mater. Process. Technol. 2006, 180, 9–16. [Google Scholar] [CrossRef]
  46. Hiegemann, L.; Weddeling, C.; Khalifa, N.B.; Tekkaya, A.E. Analytical prediction of roughness after ball burnishing of thermally coated surfaces. Procedia Eng. 2014, 81, 1921–1926. [Google Scholar] [CrossRef]
  47. Hiegemann, L.; Weddeling, C.; Khalifa, N.B.; Tekkaya, A.E. Prediction of roughness after ball burnishing of thermally coated surfaces. J. Mater. Process. Technol. 2015, 217, 193–201. [Google Scholar] [CrossRef]
  48. Korzynski, M. Modeling and experimental validation of the force–surface roughness relation for smoothing burnishing with a spherical tool. Int. J. Mach. Tools Manuf. 2007, 47, 1956–1964. [Google Scholar] [CrossRef]
  49. Grochała, D.; Berczyński, S.; Grządziel, Z. Stress in the surface layer of objects burnished after milling. Int. J. Adv. Manuf. Technol. 2014, 72, 1655–1663. [Google Scholar] [CrossRef]
  50. López de Lacalle, L.N.; Lamikiz, A.; Muñoa, J.; Sánchez, J.A. Quality improvement of ball-end milled sculptured surfaces by ball burnishing. Int. J. Mach. Tools Manuf. 2005, 45, 1659–1668. [Google Scholar] [CrossRef]
  51. Rodríguez, A.; López de Lacalle, L.N.; Celaya, A.; Lamikiz, A.; Albizuri, J. Surface improvement of shafts by the deep ball-burnishing technique. Surf. Coat. Technol. 2012, 206, 2817–2824. [Google Scholar] [CrossRef]
  52. Olszak, W.; Grochała, D.; Koza, K. Tool for Surface Burnishing. PAT.220528, 5 March 2015. [Google Scholar]
  53. Posdzich, M.; Stöckmann, R.; Witt, M.; Putz, M. Determination of surface shape deviation by using force-controlled burnishing. Procedia CIRP 2020, 93, 1275–1280. [Google Scholar] [CrossRef]
  54. Winogrodzka, A.; Valefi, M.; de Rooij, M.B.; Schipper, D.J. Measurement of chemical and geometrical surface changes in a wear track by a confocal height sensor and confocal Raman spectroscopy. Arch. Civ. Mech. Eng. 2014, 14, 1–5. [Google Scholar] [CrossRef]
  55. Liang, Y.; Zhang, S. Least-squares versus partial least-squares finite element methods: Robust a priori and a posteriori error estimates of augmented mixed finite element methods. Comput. Math. Appl. 2025, 184, 45–64. [Google Scholar] [CrossRef]
  56. Zmarzły, P. Influence of bearing raceway surface topography on the level of generated vibration as an example of operational heredity. Indian J. Eng. Mater. Sci. 2020, 27, 356–364. [Google Scholar]
  57. Pawlus, P.; Reizer, R.; Zelasko, W. Prediction of parameters of equivalent sum rough surfaces. Materials 2020, 13, 4898. [Google Scholar] [CrossRef] [PubMed]
  58. Krajewski, S.J.; Grochała, D.; Tomków, J.; Grzejda, R. Analysis of the surface stereometry of alloyed austenitic steel after fibre laser cutting using confocal microscopy. Coatings 2023, 13, 15. [Google Scholar] [CrossRef]
  59. Grochała, D.; Grzejda, R.; Parus, A.; Berczyński, S. The wavelet transform for feature extraction and surface roughness evaluation after micromachining. Coatings 2024, 14, 210. [Google Scholar] [CrossRef]
  60. Podulka, P.; Knapčíková, L.; Tauberová, R.; Martiček, M.; Sukić, E. Study of etched surface topography with the compensation of contactless vibrational measurement errors. Measurement 2025, 242, 116218. [Google Scholar] [CrossRef]
  61. Podulka, P.; Rudawska, A.; Macek, W. Study of vibrational surface topography measurement errors of LPBF Inconel 718 alloy after shot peening process. Measurement 2025, 243, 116434. [Google Scholar] [CrossRef]
  62. PN-EN ISO 25178-2; Geometrical Product Specifications (GPS), Surface Texture: Areal, Part 2: Terms, Definitions and Surface Texture Parameters. Polish Committee for Standardization: Warsaw, Poland, 2022.
  63. Lawrence, K.D.; Shanmugamani, R.; Ramamoorthy, B. Evaluation of image based Abbott–Firestone curve parameters using machine vision for the characterization of cylinder liner surface topography. Measurement 2014, 55, 318–334. [Google Scholar] [CrossRef]
  64. Kovács, Z.F.; Viharos, Z.J.; Kodácsy, J. Surface flatness and roughness evolution after magnetic assisted ball burnishing of magnetizable and non-magnetizable materials. Measurement 2020, 158, 107750. [Google Scholar] [CrossRef]
  65. Kovács, Z.F.; Viharos, Z.J.; Kodácsy, J. Improvements of surface tribological properties by magnetic assisted ball burnishing. Surf. Coat. Technol. 2022, 437, 128317. [Google Scholar] [CrossRef]
  66. López de Lacalle, L.N.; Lamikiz, A.; Sánchez, J.A.; Arana, J.L. The effect of ball burnishing on heat-treated steel and Inconel The effect of ball burnishing on heat-treated steel and Inconel 718 milled surfaces. Int. J. Adv. Manuf. Technol. 2007, 32, 958–968. [Google Scholar] [CrossRef]
  67. Torres, A.; Amini, C.; Cuadrado, N.; Travieso-Rodriguez, J.A.; Llumà, J.; Vilaseca, M. Experimental validation of ball burnishing numerical simulation on ball-end milled martensitic stainless-steel considering friction and the initial surface topography. J. Mater. Res. Technol. 2023, 22, 3352–3361. [Google Scholar] [CrossRef]
  68. de Oliveira, D.A.; Martins, A.M.; de Castro Magalhães, F.; Abrão, A.M. Characterization of the topography generated by low plasticity burnishing using advanced techniques. Surf. Coat. Technol. 2022, 448, 128891. [Google Scholar] [CrossRef]
  69. Bulaha, N. Analysis of Service Properties of Cylindrically Ground Surfaces, Using Standard ISO 25178-2:2012 Surface Texture Parameters. In Proceedings of the 10th International Scientific and Practical Conference, Rēzekne, Latvia, 16–21 June 2015. [Google Scholar]
  70. Pawlus, P.; Reizer, R.; Wieczorowski, M.; Krolczyk, G.M. Study of surface texture measurement errors. Measurement 2023, 210, 112568. [Google Scholar] [CrossRef]
  71. Podulka, P.; Macek, W.; Zima, B.; Lesiuk, G.; Branco, R.; Królczyk, G. Roughness evaluation of turned composite surfaces by analysis of the shape of autocorrelation function. Measurement 2023, 222, 113640. [Google Scholar] [CrossRef]
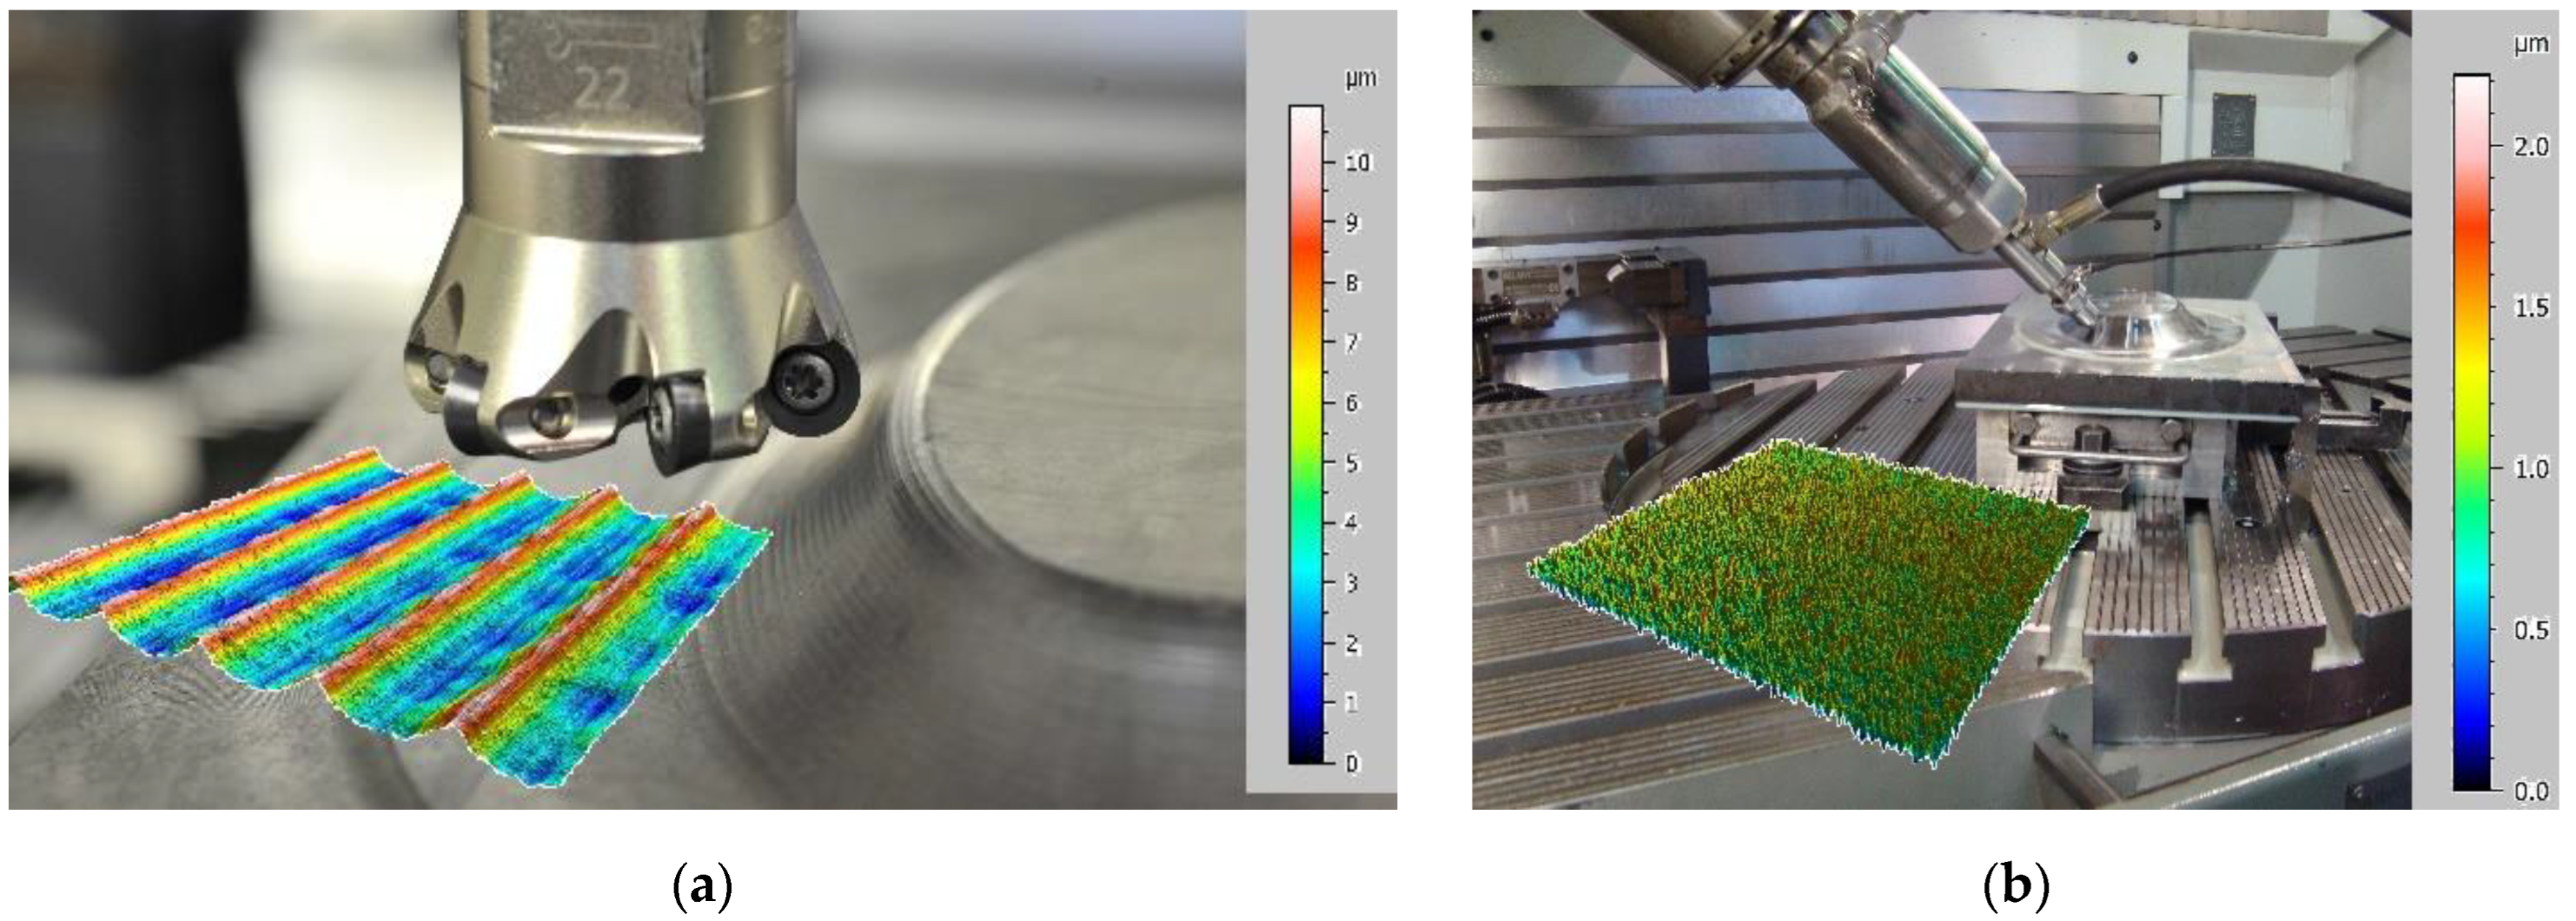
Figure 1. Example of HMP: (a) 3D surface milling; (b) surface burnishing (source: own preliminary research).
Coatings 15 00461 g001
Figure 2. Burnishing strategies: (a) SC—single cross, with one burnishing pass in the direction crosswise to the milling marks; (b) DO—double orthogonal, with two burnishing passes; (c) DC—double cross, with two burnishing passes.
Coatings 15 00461 g002
Figure 3. Course of the Ra parameter as a function of the burnishing force FN after burnishing of 42CrMo4 steel (with hardness 35 HRC) using a 10 mm diameter ball after milling with a milling cutter line feed flm = 0.5 mm (source: own preliminary research).
Coatings 15 00461 g003
Figure 4. Anisotropic surfaces of samples made of 42CrMo4 steel after milling with (a) flm = 0.1 mm (Sa = 0.68 μm, SI = 3.10%); (b) flm = 0.3 mm (Sa = 1.12 μm, SI = 4.27%); (c) flm = 0.5 mm (Sa = 2.16 μm, SI = 7.34%); (d) flm = 0.7 mm (Sa = 3.50 μm, SI = 7.98%).
Coatings 15 00461 g004
Figure 5. Variations in the Sa parameter as a function of the milling parameters and the applied strategy during burnishing.
Coatings 15 00461 g005
Figure 6. Variations in the degree of SI as a function of the milling parameters and the applied strategy during burnishing.
Coatings 15 00461 g006
Figure 7. Variations in the Sal parameter as a function of the milling parameters and the applied strategy during burnishing.
Coatings 15 00461 g007
Figure 8. Variations in the Str parameter as a function of the milling parameters and the applied strategy during burnishing.
Coatings 15 00461 g008
Figure 9. Changes in the directionality of SGT expressed by the basic angle of SGT for (a) Std = 89.48°, SC strategy, HMP variant A-I; (b) Std = 89.40°, DO strategy, HMP variant B-II; (c) Std = 89.26°, DC strategy, HMP variant A-I.
Coatings 15 00461 g009
Figure 10. Changes in the degree of SI depending on the milling conditions in burnishing according to the SC strategy for (a) SI = 40.3%, HMP variant A-I; (b) SI = 57.8%, HMP variant B-I; (c) SI = 21.6%, HMP variant C-IV.
Coatings 15 00461 g010
Figure 11. Changes in the degree of SI depending on the milling conditions in burnishing according to the DO strategy for (a) SI = 23.8%, HMP variant A-III; (b) SI = 37.2%, HMP variant C-I.
Coatings 15 00461 g011
Figure 12. Changes in the degree of SI depending on the milling conditions in burnishing according to the DC strategy for SI = 33.0% and HMP variant A-III.
Coatings 15 00461 g012
Table 1. Summary of technological parameters of milling and burnishing during tests of the influence of burnishing strategy on SI.
Strategyflm 1 (mm)flb 1 (mm)
ABCDIIIIIIIV
SC0.10.30.50.70.020.080.140.20
DO0.10.30.50.70.020.080.140.20
DC0.10.30.50.70.020.080.140.20
1 Designations are described in Appendix A.
Table 2. Values of selected surface roughness parameters and degrees of SI obtained after milling.
ParameterMilled Surface Variant
ABCD
SI (%)3.104.277.347.98
Sal (mm)0.080.110.180.20
Str (no unit)0.030.040.070.08
Std (°)89.7389.7089.7089.80
Sa (μm)0.681.122.163.50
Sz (μm)27.2621.4235.9234.70
Sq (μm)0.871.342.484.02
Sp (μm)15.3613.2425.3120.36
Sv (μm)11.908.1710.6114.34
Table 3. Values of selected surface roughness parameters and degrees of SI obtained after milling and burnishing.
ParameterBSV 1Burnishing Strategy
SCDODC
Milled Surface Variant
ABCDABCDABCD
SI (%)I40.357.89.8112.94.4710.637.211.84.274.835.717.69
II9.389.9310.112.69.7517.715.013.19.079.254.1813.2
III5.6811.210.412.223.819.819.913.333.012.010.914.9
IV7.5318.521.613.819.113.414.517.416.916.910.117.4
Sal (mm)I0.110.150.250.330.110.270.250.300.110.120.140.19
II0.230.250.250.320.240.440.370.330.230.230.110.33
III0.140.280.250.310.600.500.500.330.830.300.270.37
IV0.190.470.280.350.480.340.360.430.430.420.250.43
Str
(no unit)
I0.400.580.100.130.050.110.370.120.040.050.060.08
II0.090.100.100.130.100.180.150.130.090.090.040.13
III0.060.110.100.120.240.200.200.130.330.120.110.15
IV0.080.190.220.140.190.130.150.170.170.170.100.17
Std (°)I89.4889.2789.4789.2789.7589.7389.7589.7489.2689.2689.5089.50
II84.2589.4789.4789.4893.4889.4019.4089.5086.7586.7786.7789.25
III94.9989.4689.4789.2589.5189.5089.5089.500.3488.2688.2789.24
IV89.4989.2689.4789.2789.5089.5089.5089.5089.9787.0089.9789.50
Sa (μm)I0.370.370.461.020.470.410.531.270.730.780.841.11
II0.360.340.380.850.370.420.461.030.630.570.340.72
III0.260.330.300.680.350.510.470.960.700.630.630.89
IV0.280.300.270.590.420.400.510.851.260.970.650.85
Sz (μm)I20.6517.2312.4914.6311.6710.7413.6316.0124.5116.4035.3319.69
II17.3210.2810.9114.508.617.808.9913.2219.8220.699.8023.55
III10.925.305.5725.1010.0410.958.0413.7415.2520.5415.2214.82
IV17.1414.0714.9016.1615.317.6511.0818.4520.6316.6420.4417.79
Sq (μm)I0.480.470.571.190.580.530.661.480.880.951.041.37
II0.470.430.470.990.460.530.571.210.780.700.430.87
III0.340.410.380.800.440.620.581.160.830.760.761.08
IV0.360.380.340.720.520.540.671.041.591.240.791.04
Sp (μm)I10.699.574.507.354.844.436.057.4316.207.3225.849.22
II7.715.125.006.283.083.224.436.049.8013.914.6716.10
III4.872.292.4012.434.715.443.266.367.7214.509.887.62
IV8.597.178.909.068.562.835.4710.2211.449.2214.1810.22
Sv (μm)I9.967.668.007.286.836.317.588.578.319.089.5010.47
II9.615.165.918.235.534.584.567.1810.026.785.137.45
III6.063.013.1712.675.335.514.787.387.536.045.347.20
IV8.556.906.007.106.754.825.618.229.197.436.257.57
1 Burnished surface variant.
Disclaimer/Publisher’s Note: The statements, opinions and data contained in all publications are solely those of the individual author(s) and contributor(s) and not of MDPI and/or the editor(s). MDPI and/or the editor(s) disclaim responsibility for any injury to people or property resulting from any ideas, methods, instructions or products referred to in the content.