1. Introduction
In aquatic environments, microorganisms have a tendency to attach to surfaces along with organic and inorganic soil. For example in breweries, microorganisms have been shown to accumulate on sterile stainless steel surfaces within hours after the start of production [
1].
Consumer demand is driving the development of a new group of more sensitive beverages with less alcohol, hop substances, and preservatives; however, these products are more prone to spoilage than are traditional drinks [
2]. There are numerous operations involved in making beer. Each stage has a level of cleanliness that needs to be achieved and fouling is encountered at each stage [
3]. Attachment of primary colonizers to stainless steel has been shown to be increased by sugars and sweeteners [
1]. Thus removal of these deposits is essential since conditioning of a surface may be followed by biofilm formation. Biofilms on bottling plant surfaces are considered as serious sources for potential product spoiling microorganisms in the brewing industry [
4]. Further, Fornalik [
5] noted that minor fouling organisms resistant to cleaning in place (CIP) may become more resistant with time. Rheological studies indicated that increasing the temperature of the deposit generated a more elastic deposit which may decrease cleanability [
3]. Thus, regular daily cleaning is needed. The following media are usually used in the cleaning process in brewing industry: water and steam, peroxide and alcohol based disinfectants, alkaline and acidic detergents and organic solvents [
6,
7]. There are however numerous drivers for a revision of CIP operations including the need to minimise utility usage (energy and water) and production downtime, minimisation of waste and greenhouse gas (GHG) emissions, and the need for product safety and quality [
3].
One way to reduce cleaning costs and to improve process hygiene could be to use self-cleaning and antimicrobial coatings which can prevent the attachment of microorganisms and soil, or facilitate their efficient removal in the cleaning process.
TiO
2 is a widely used semiconductor. It has many different applications in optics [
8], the environment [
9], photovoltaics and solar cells [
10,
11], self-cleaning [
12,
13] and antimicrobial coatings [
14]. In the self-cleaning and antimicrobial applications, the intended mechanism of action is often photocatalytic; in which the action of light on the TiO
2 coating generates active species that may be detrimental to microbes. For these applications, thin TiO
2 films with submicron thicknesses are usually employed. Several studies have been carried out to investigate the effect of crystal structure on the photocatalytic performance of TiO
2. Whilst some studies have found a higher activity of the anatase form [
15,
16], others have reported the mixed phase anatase/rutile to show a better photocatalytic performance [
17]. Comparative studies of single phase anatase and rutile TiO
2 have concluded that the photocatalytic activity is dependent on the reaction being studied and different kinetics and intermediaries may be produced in each case [
18,
19]. As the surfaces used in the food and beverage industries are exposed to adverse environments (contact with water and beverages, cleaning solutions, abrasive wear during cleaning), scratch and corrosion resistance play important roles in their mechanical durability and chemical stability. Hence, it is important to satisfy several requirements, including good adhesion to the substrate, the retention of high activity and resistance to chemicals.
The adhesion of any film to its substrate is one of the most important properties of a thin film. The level of adhesion depends on the force required to separate atoms or molecules at the interface between film and substrate. The adhesion of a film to the substrate is strongly dependent on the chemical nature, cleanliness, and microscopic topography of the substrate surface [
20]. The presence of contaminants on the substrate surface may increase or decrease the adhesion depending on whether the adsorption energy is increased or decreased, respectively. Also the adhesion of a film can be improved by providing more nucleation sites on the substrate, for instance, by using a fine-grained substrate or a substrate pre-coated with suitable materials. Of the deposition processes available, magnetron sputtering has been shown to produce well adhered and uniform coatings over wide areas [
11]. In this process, the adhesion of the film to the substrate can be improved by ion-cleaning of the substrate prior to the coating deposition as well as additional ion bombardment during coating deposition which improves adhesion by providing intermixing on an atomic scale [
21].
It has been shown throughout the literature that the chemical and structural properties of the active film have a profound impact on the overall photocatalytic performance. Photocatalytic performance is influenced by film characteristics including; composition, bulk and surface structure and nanostructure, atomic to nanoscale roughness, hydroxyl concentration, and impurity concentration (e.g., Fe and Cr) [
22,
23,
24,
25].
The work described in this paper investigates the chemical and mechanical durability, wettability and the retention of photocatalytic activity of selected coatings after being placed in different brewery process environments, in this case bottle/can filling lines in three Finnish breweries.
2. Experimental Section
2.1. Preparation of Coated Surfaces
The substrate material for all coatings was stainless steel AISI 304 2B (75 × 25 × 1.6 mm
3). Coatings were produced using either closed field unbalanced magnetron sputtering (CFUBMS) [
21] or by spray-coating with a TiO
2 sol.
Table 1 shows the coatings produced.
Table 1.
Preparation method of coated surfaces.
Table 1.
Preparation method of coated surfaces.
| Code | Coating | Deposition Method |
|---|
| T1 | TiO2 | Reactive magnetron sputtering |
| T2 | TiO2-Ag (low) | – |
| T3 | TiO2-Ag (high) | – |
| U1 | TiO2 | Reactive magnetron sputtering + heat treatment |
| U2 | TiO2-Mo | – |
| MC | TiO2 | Spray-coated with TiO2 sol |
Coatings T1–T3 were deposited using reactive magnetron sputtering in a Teer Coatings UDP 450 coating system. One titanium target (99.5% purity) was used for the deposition of TiO
2. Argon (99.998% purity) was used as the working gas and oxygen (99.5% purity) as the reactive gas. The working pressure was 1 mbar. Ag (99.95% purity) was used as the dopant. Advanced Energy Pinnacle Plus pulsed DC power supplies were used to power the titanium magnetrons and bias the substrates. An Advanced Energy DC power supply was used to power the silver target. 10–30 substrates were ultrasonically cleaned in acetone prior to loading into the chamber in order to remove surface contaminants. The substrates were aligned on a flat plate parallel to the surface of the metal targets at a distance of 150 mm from the target plane. A high rotational speed of 10 rpm was applied to the substrates to ensure enhanced mixing of silver and titanium within the coatings rather than the preferential formation of multilayer coatings. The substrates were ion-cleaned for a period of 20 min prior to the coating deposition using a bias voltage of −400 V and a low current of 0.2–0.35 A on the targets. The coatings were deposited at a bias voltage of −40 V. A thin layer of Ti was initially deposited as the adhesion layer prior to the introduction of oxygen to the deposition chamber. The amount of oxygen was controlled using an optical emission monitor, using conditions known to produce stoichiometric TiO
2 [
26]. A pulsed-DC power of 2.5 kW was used on the Ti target at frequency 50 kHz and a duty of 97.75% (in synchronous mode). A continuous DC power of 70 W in the case of T2 and 150 W in the case of T3 was applied to the Ag target to vary the dopant content. The deposition rate was 17–22 nm/min depending on Ag content and coatings with thickness of 0.8–1 µm were produced. No additional heating was used during the coating process and the temperature did not exceed 200 °C during the process.
U1 and U2 coatings were deposited using reactive magnetron sputtering in a Teer Coatings UDP 450 coating system as described above. Two opposing magnetrons were fitted with titanium targets and one with the Mo dopant metal target (99.5% purity). The magnetrons with the titanium targets were in the closed field configuration and driven in pulsed DC sputtering mode using a dual channel Advanced Energy Pinnacle Plus supply at a frequency of 100 kHz and a duty of 50% (in synchronous mode). The Mo metal target was driven in a continuous DC mode (Advanced Energy MDX). The Ti targets were operated at a constant time-averaged power of 1 kW and the dopant target was operated at 180 W. Stainless steel samples were mounted on a substrate holder, which was rotated between the magnetrons at 4 rpm during deposition. The target to substrate separation was 8 cm. The titanium and Mo targets were cleaned by pre-sputtering in a pure argon atmosphere for 10 min. Deposition times were adapted to obtain a film thickness of 0.8–1 µm (deposition rate was 7.5 nm/min). The sputtered films were post deposition annealed at 600 °C for 30 min. in air.
Coating MC was prepared by spray-coating with a proprietary water-based TiO2 sol using the following method. This transparent, neutral sol contained 2% TiO2 (as anatase). Degreased stainless steel coupons were fixed to aluminium panels (approximately 150 × 100 mm2). The panels with attached coupons were accurately weighed. The TiO2 sol (0.2–0.3 g) was sprayed onto the aluminium panel with the attached coupons in a slow, steady motion, sweeping the panel in horizontal stripes from top to bottom, using a Badger Airbrush 200-3 model spray kit (Badger Air-Brush Co., Franklin Park, IL, USA). After air-drying for at least 15 min, the spraying procedure was repeated until 0.8–1.0 g/m2 of TiO2 sol was delivered to the surface. After air-drying overnight, the aluminium panel with the attached stainless steel coupons was re-weighed to give an accurate measurement of the weight per area of the coating.
2.2. Wettability
Water contact angle measurement is a practical tool to determine the wettability of a surface. Contact angle values were measured using a Digidrop instrument. At least two drops were measured for each surface and the measurements averaged. Measurements were conducted after exposure in light, either SUNTEST CPS+ (xenon arc, filtered with special window glass, 550 W/m2 across the irradiance range 320–800 nm) or UVA light (Philips blacklight, 10–12 W/m2 across the irradiance range 350–400 nm), or after storage in the dark.
2.3. Adhesion of Coatings
The scratch and wear resistance of the coatings were assessed using a Teer ST3001 scratch–wear tester (Teer Coatings Ltd, Droitwich, UK) [
27]. The coated surfaces were evaluated using a Rockwell diamond tip (radius 200 μm). A load rate of 100 N·min
−1 and a constant sliding speed of 10.0 mm·min
−1 were used with the load increasing from 10 to 40 N. The scratch tracks were examined using a Cambridge Stereoscan 200 scanning electron microscope (Cambridge Instruments, Cambridge, UK) in order to detect any flaking.
2.4. Photocatalytic Characterization of Coatings
The photocatalytic activities of the coatings were analyzed using the methylene blue (MB) degradation assay under UV and fluorescent light sources. In brief, MB solutions were made up to an initial concentration of 0.0105 mMol·L−1. Photocatalytic surfaces were placed in 10 mL of the MB solution and irradiated at an integrated power flux of 40 W/m2 with two 15 W UV lamps (365 nm wavelength). Tests were also carried out using two 15 W fluorescent tubes in place of the UV tubes to simulate typical lighting environments. The integrated power flux to the coatings with the fluorescent tubes was 64 W/m2, of which the UV component (300–400 nm) was 13 W/m2. A 10 cm distance between the light source and MB solution was used. Samples of the MB solution were taken before testing and at 1 hour intervals up to a total of 5–8 h. and analyzed using a UV-Vis spectrophotometer (Perkin Elmer, Waltham, MA, USA). Spectra were taken in the range of 650–668 nm and the height of the absorption peak in this region was monitored.
A graph of peak height absorbance against irradiation time, which has an exponential form was generated. An index of photocatalytic activity (
Pa) was defined by comparing the degradation rate of the MB solution in contact with the coated surfaces to the rate for an irradiated MB solution with no coating present. The equation below was used to calculate the photocatalytic activity of each of the films. Two parameters were defined:
PaUV for UV irradiation and
PaFL for fluorescent light irradiation [
28].
where
C0 = peak height at time = 0;
C0e
−mx = decay rate of methylene blue;
C0e
−cx = decay rate of methylene blue in contact with photocatalytic coating.
2.5. Process Tests
Coated stainless steel pieces were placed on process surfaces within three breweries for a period of three months.
Figure 1 shows an example of samples in location. Details of the location of test pieces in each brewery are given in
Table 2. There was no special provision of lighting for the photocatalytic coatings; the process test took place under the usual brewery conditions of lighting, with coupons receiving varying amounts of light depending on their position in each machine. Furthermore, all samples underwent the normal process conditions and cleaning regimes used in each brewery which included acid and alkaline cleaning chemicals such as acetic acid and sodium hydroxide, ethanol, steam and mechanical brushing. For each coating, two replicates were used in each of the breweries. Additionally, two replicates were retained as controls and were kept in the dark for the same period. After three months, each replicate was cut into six sections. The mechanical durability, photocatalytic activity and wettability were evaluated each on two of these sections.
Figure 1.
Samples in location at Brewery B.
Figure 1.
Samples in location at Brewery B.
Table 2.
Coatings evaluated in process tests (for a period of three months).
Table 2.
Coatings evaluated in process tests (for a period of three months).
| Coating | Control | Brewery A 1 | Brewery B 2 | Brewery C 3 |
|---|
| TiO2 (T1) | T1-R1 T1-R2 | T1-1 T1-2 | T1-3 T1-4 | T1-5 T1-6 |
| TiO2-Ag (low) (T2) | T2-R1 T2-R2 | T2-1 T2-2 | T2-3 T2-4 | T2-5 T2-6 |
| TiO2-Ag (high) (T3) | T3-R1 T3-R2 | T3-1 T3-2 | T3-3 T3-4 | T3-5 T3-6 |
| TiO2 (U1) | U1-R1 U1-R2 | U1-1 U1-2 | U1-3 U1-4 | U1-5 U1-6 |
| TiO2-Mo (U2) | U2-R1 U2-R2 | U2-1 U2-2 | U2-3 U2-4 | U2-5 U2-6 |
| TiO2 (MC) | MC-R1 MC-R2 | MC-1 MC-2 | MC-3 MC-4 | MC-5 MC-6 |
3. Results and Discussion
This work compared three TiO
2 surfaces: as-deposited and heat-treated coatings deposited by reactive magnetron sputtering (T1 and U1, respectively), and a spray-coated TiO
2 (MC). Two dopants (Ag and Mo) were also investigated. Ag was used as it is a well-known antimicrobial material which could impart additional antimicrobial functionality to the coating. Mo was used as a dopant to reduce the band gap of TiO
2 in order to improve the visible light activity of TiO
2. Mo-TiO
2 has been reported to shift the band gap of TiO
2 by −0.20 eV [
28]. The photoactivity and mechanical properties of the surfaces were studied for the as-prepared coatings and those having undergone process conditions. The effect of the process conditions on the properties of the coatings was investigated.
3.1. As Prepared Coatings
SEM and EDX were used to analyze the topography and dopant concentration (as atomic percent of total metals) in the as-prepared doped coatings. Ag-TiO
2 and Mo-TiO
2 surfaces showed small submicron sized particles which were characterized by EDX as silver rich phases, suggesting that the dopant separated from the matrix TiO
2. The silver content was 0.50 ± 0.05 at% in T2 and 30.0 ± 3.1 at% in T3. The Mo content in U2 was 7.0 ± 0.8 at %. The structure of coatings was analysed using XRD (
Figure 2). The as-deposited TiO
2 coating (T1), showed an anatase structure. Ag-TiO
2 coatings showed strong silver peaks. The heat treated TiO
2 and Mo-TiO
2 (U1 and U2) showed anatase and rutile peaks as well as monoclinic β-TiO
2 which were very strong in the case of the doped coating.
Figure 2.
Microstructure of coatings as evaluated using XRD, (a) as deposited TiO2 and Ag-TiO2 coatings (T1–T3 ); and (b) TiO2 and Mo-TiO2 coatings after heat treatment (U1 and U2) (S—substrate, An—anatase, Ru—rutile).
Figure 2.
Microstructure of coatings as evaluated using XRD, (a) as deposited TiO2 and Ag-TiO2 coatings (T1–T3 ); and (b) TiO2 and Mo-TiO2 coatings after heat treatment (U1 and U2) (S—substrate, An—anatase, Ru—rutile).
Figure 3 shows the photocatalytic activity for the as-prepared coatings and compares these values with those obtained for Pilkington Activ™ as a standard commercial product. As can be seen, all coatings showed high photocatalytic activity. In the case of T3, a change was also observed in the colour of the solution. This was thought to have been caused by leaching of silver from the surface. SEM analysis of the coating was performed before and after immersion in water for 2 h and showed the presence of microparticles on the surface which EDX confirmed to be silver (
Figure 4). The silver microparticles in the as deposited coating were embedded in the matrix. Immersion in water resulted in the silver particles to protrude from the surface and EDX showed a reduction in the silver content, confirming that silver was indeed diffusing out of the coating.
Figure 3.
Photocatalytic activity of the as-deposited coatings and comparison with a commercially available photocatalytic surface (Pilkington Activ™).
Figure 3.
Photocatalytic activity of the as-deposited coatings and comparison with a commercially available photocatalytic surface (Pilkington Activ™).
Figure 4.
SEM micrographs of T3, (a) as deposited coating; and (b) after being under water for 2 h.
Figure 4.
SEM micrographs of T3, (a) as deposited coating; and (b) after being under water for 2 h.
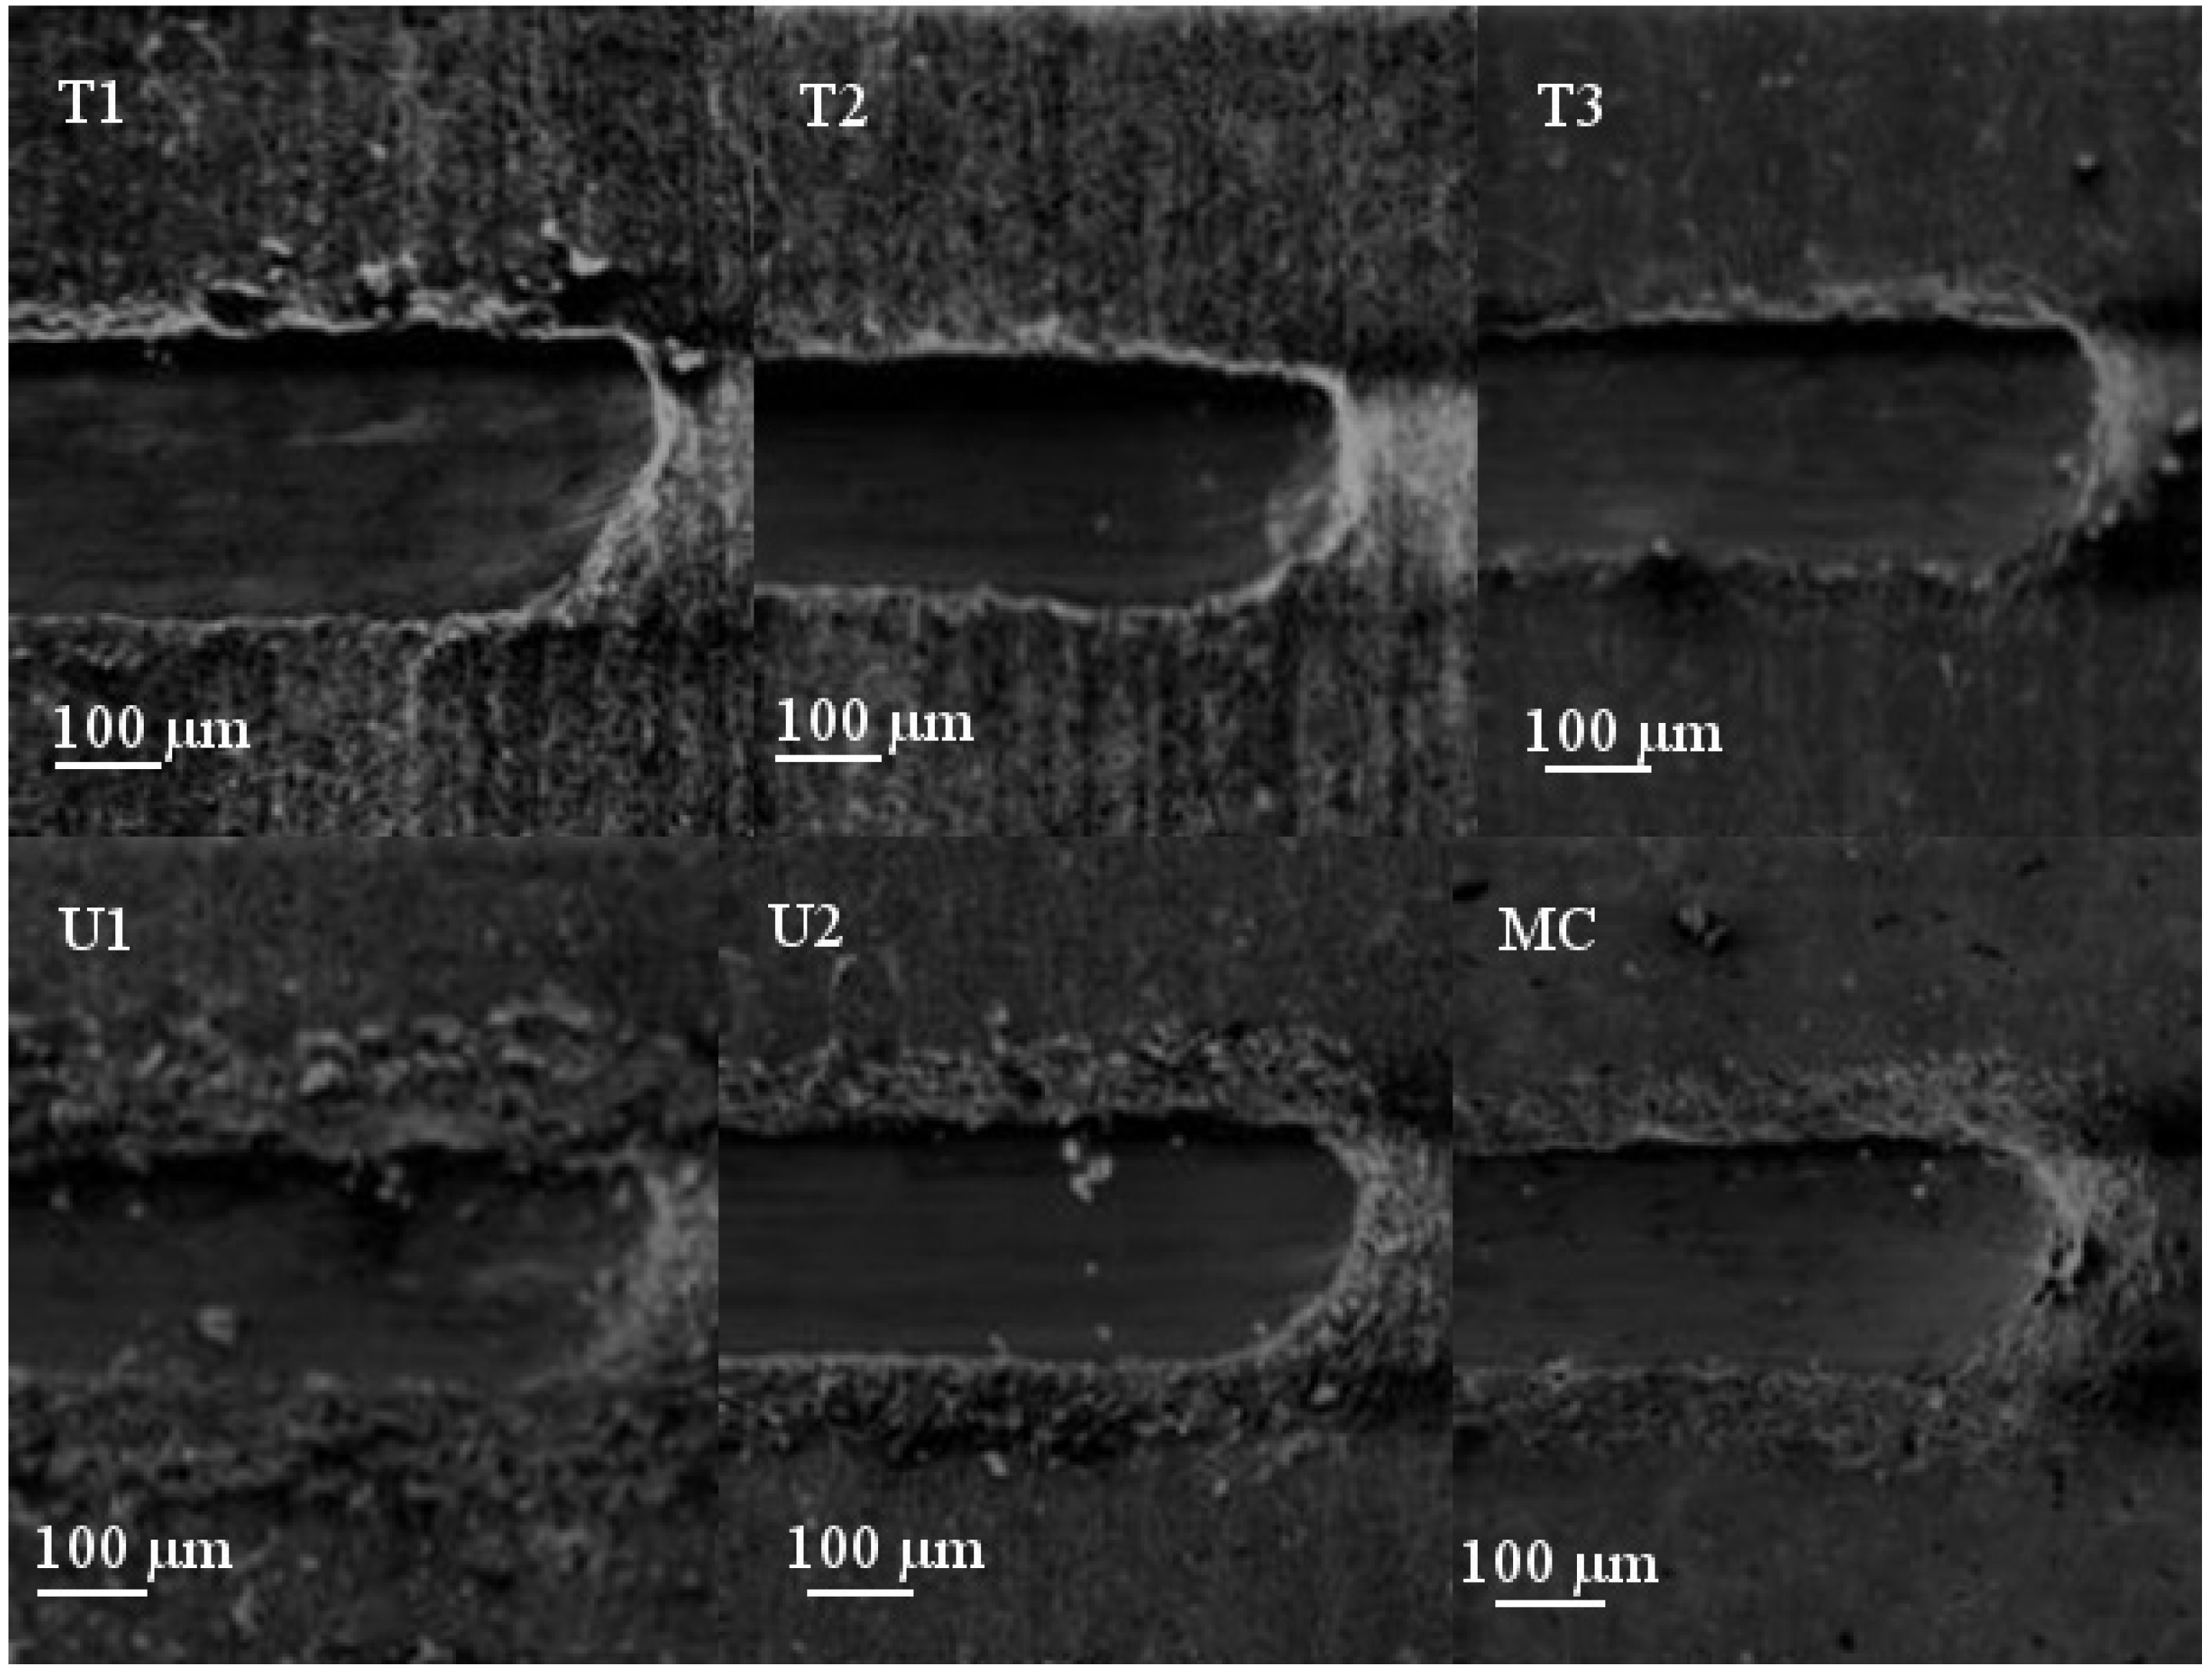
Mechanical resistance of the coatings was analyzed using scratch testing.
Figure 5 shows the scratch tracks of the coatings after production, as observed using the SEM. Coatings T1–T3 and MC showed excellent adhesion to the stainless steel substrate and no flaking was observed around the scratch tracks. Slight flaking was observed in U1 and U2, which was localized to the area immediately next to the scratch track. This may have been caused by the lack of a Ti adhesion layer in these coatings or due to the stresses applied to the coating during annealing. Given the destructive nature of the scratch test and the high load levels used in this test, all coatings were deemed to show sufficient mechanical resistance for use on food and drinks processing surfaces.
Figure 5.
Progressive load scratch tracks of (a) T1; (b) T2; (c) T3; (d) U1; (e) U2 and (f) MC.
Figure 5.
Progressive load scratch tracks of (a) T1; (b) T2; (c) T3; (d) U1; (e) U2 and (f) MC.
3.2. Properties of the Surfaces after Process Tests
Visual inspection of the coatings after the three months process trial and their comparison with the control surfaces showed that all coatings prepared by magnetron sputtering (T1, T2, T3, U1 and U2) were physically present, although some color changes were apparent (
Figure 6). The TiO
2 sol coating (MC) appeared to be still present after the process test at Brewery C but was at least partially removed at the other two breweries. It was noticeable that many of the surfaces were heavily soiled, particularly those that had been on trial at Breweries A and B.
Figure 6.
Images of coupons after the three month brewery trial. See
Table 2 for sample descriptions.
Figure 6.
Images of coupons after the three month brewery trial. See
Table 2 for sample descriptions.
3.3. Mechanical Durability of the Coatings
The results of scratch adhesion tests performed on samples after the process trial confirmed the observations made on the appearance of coatings. Representative results are shown in
Figure 7. T1–T3 coatings showed good adhesion with no flaking after the process studies. U1–U2 coatings showed some flaking, which in most cases was confined to the area immediately next to the scratch track. Some of the samples, however, showed a more widespread flaking. This was most likely caused by the lack of a Ti base layer, which can enhance the adhesion of TiO
2 to the stainless steel substrate or alternatively could be a result of the heat treatment. The MC coating from Breweries A and C showed some flaking near the scratch track. Samples removed from Brewery B showed no flaking. EDX analysis of these samples showed a Ti peak which had been greatly reduced compared to that of the control samples, suggesting that the coating had been heavily worn. This could be due to the different cleaning regimes, e.g., chemicals and scrubbing methods used in the different breweries, with some conditions exceeding the chemical and mechanical resistance of the coating.
Figure 7.
SEM micrographs showing the scratch tracks of coatings before and after process tests at Brewery C.
Figure 7.
SEM micrographs showing the scratch tracks of coatings before and after process tests at Brewery C.
3.4. Composition of the Coatings
EDX results showed that the Ag content in T2 remained fairly constant. T3 showed a high level of Ag leaching possibly caused due to the poor dispersion and segregation of Ag within the coating as was seen from the SEM image of this coating (
Figure 3). U2 showed a fairly constant concentration of Mo, except that in the areas where coating had been partially removed, it was not possible to measure the relative concentration of Mo in the coatings due to the weak signal and overlapping of the emission lines from the coating with those from the substrate (
Table 3).
Table 3.
Concentration of dopant as analysed using EDX (error in the measurements was ±10%).
Table 3.
Concentration of dopant as analysed using EDX (error in the measurements was ±10%).
| Coating | As Deposited | Control | Brewery A | Brewery B | Brewery C |
|---|
| R1 | R2 | 1 | 2 | 3 | 4 | 5 | 6 |
|---|
| TiO2-Ag (low Ag) (T2) | 0.5 | 0.5 | | 0.2 | 0.1 | 0.3 | 0.6 | 0.7 | 0.1 |
| TiO2-Ag (high Ag) (T3) | 30.0 | 32.0 | 34.0 | 1.8 | 1.6 | 9.2 | 1.1 | 3.6 | 10.3 |
| TiO2-Mo (U2) | 7.0 | 7.3 | 7.2 | – | – | – | 8 | 8.1 | 8.0 |
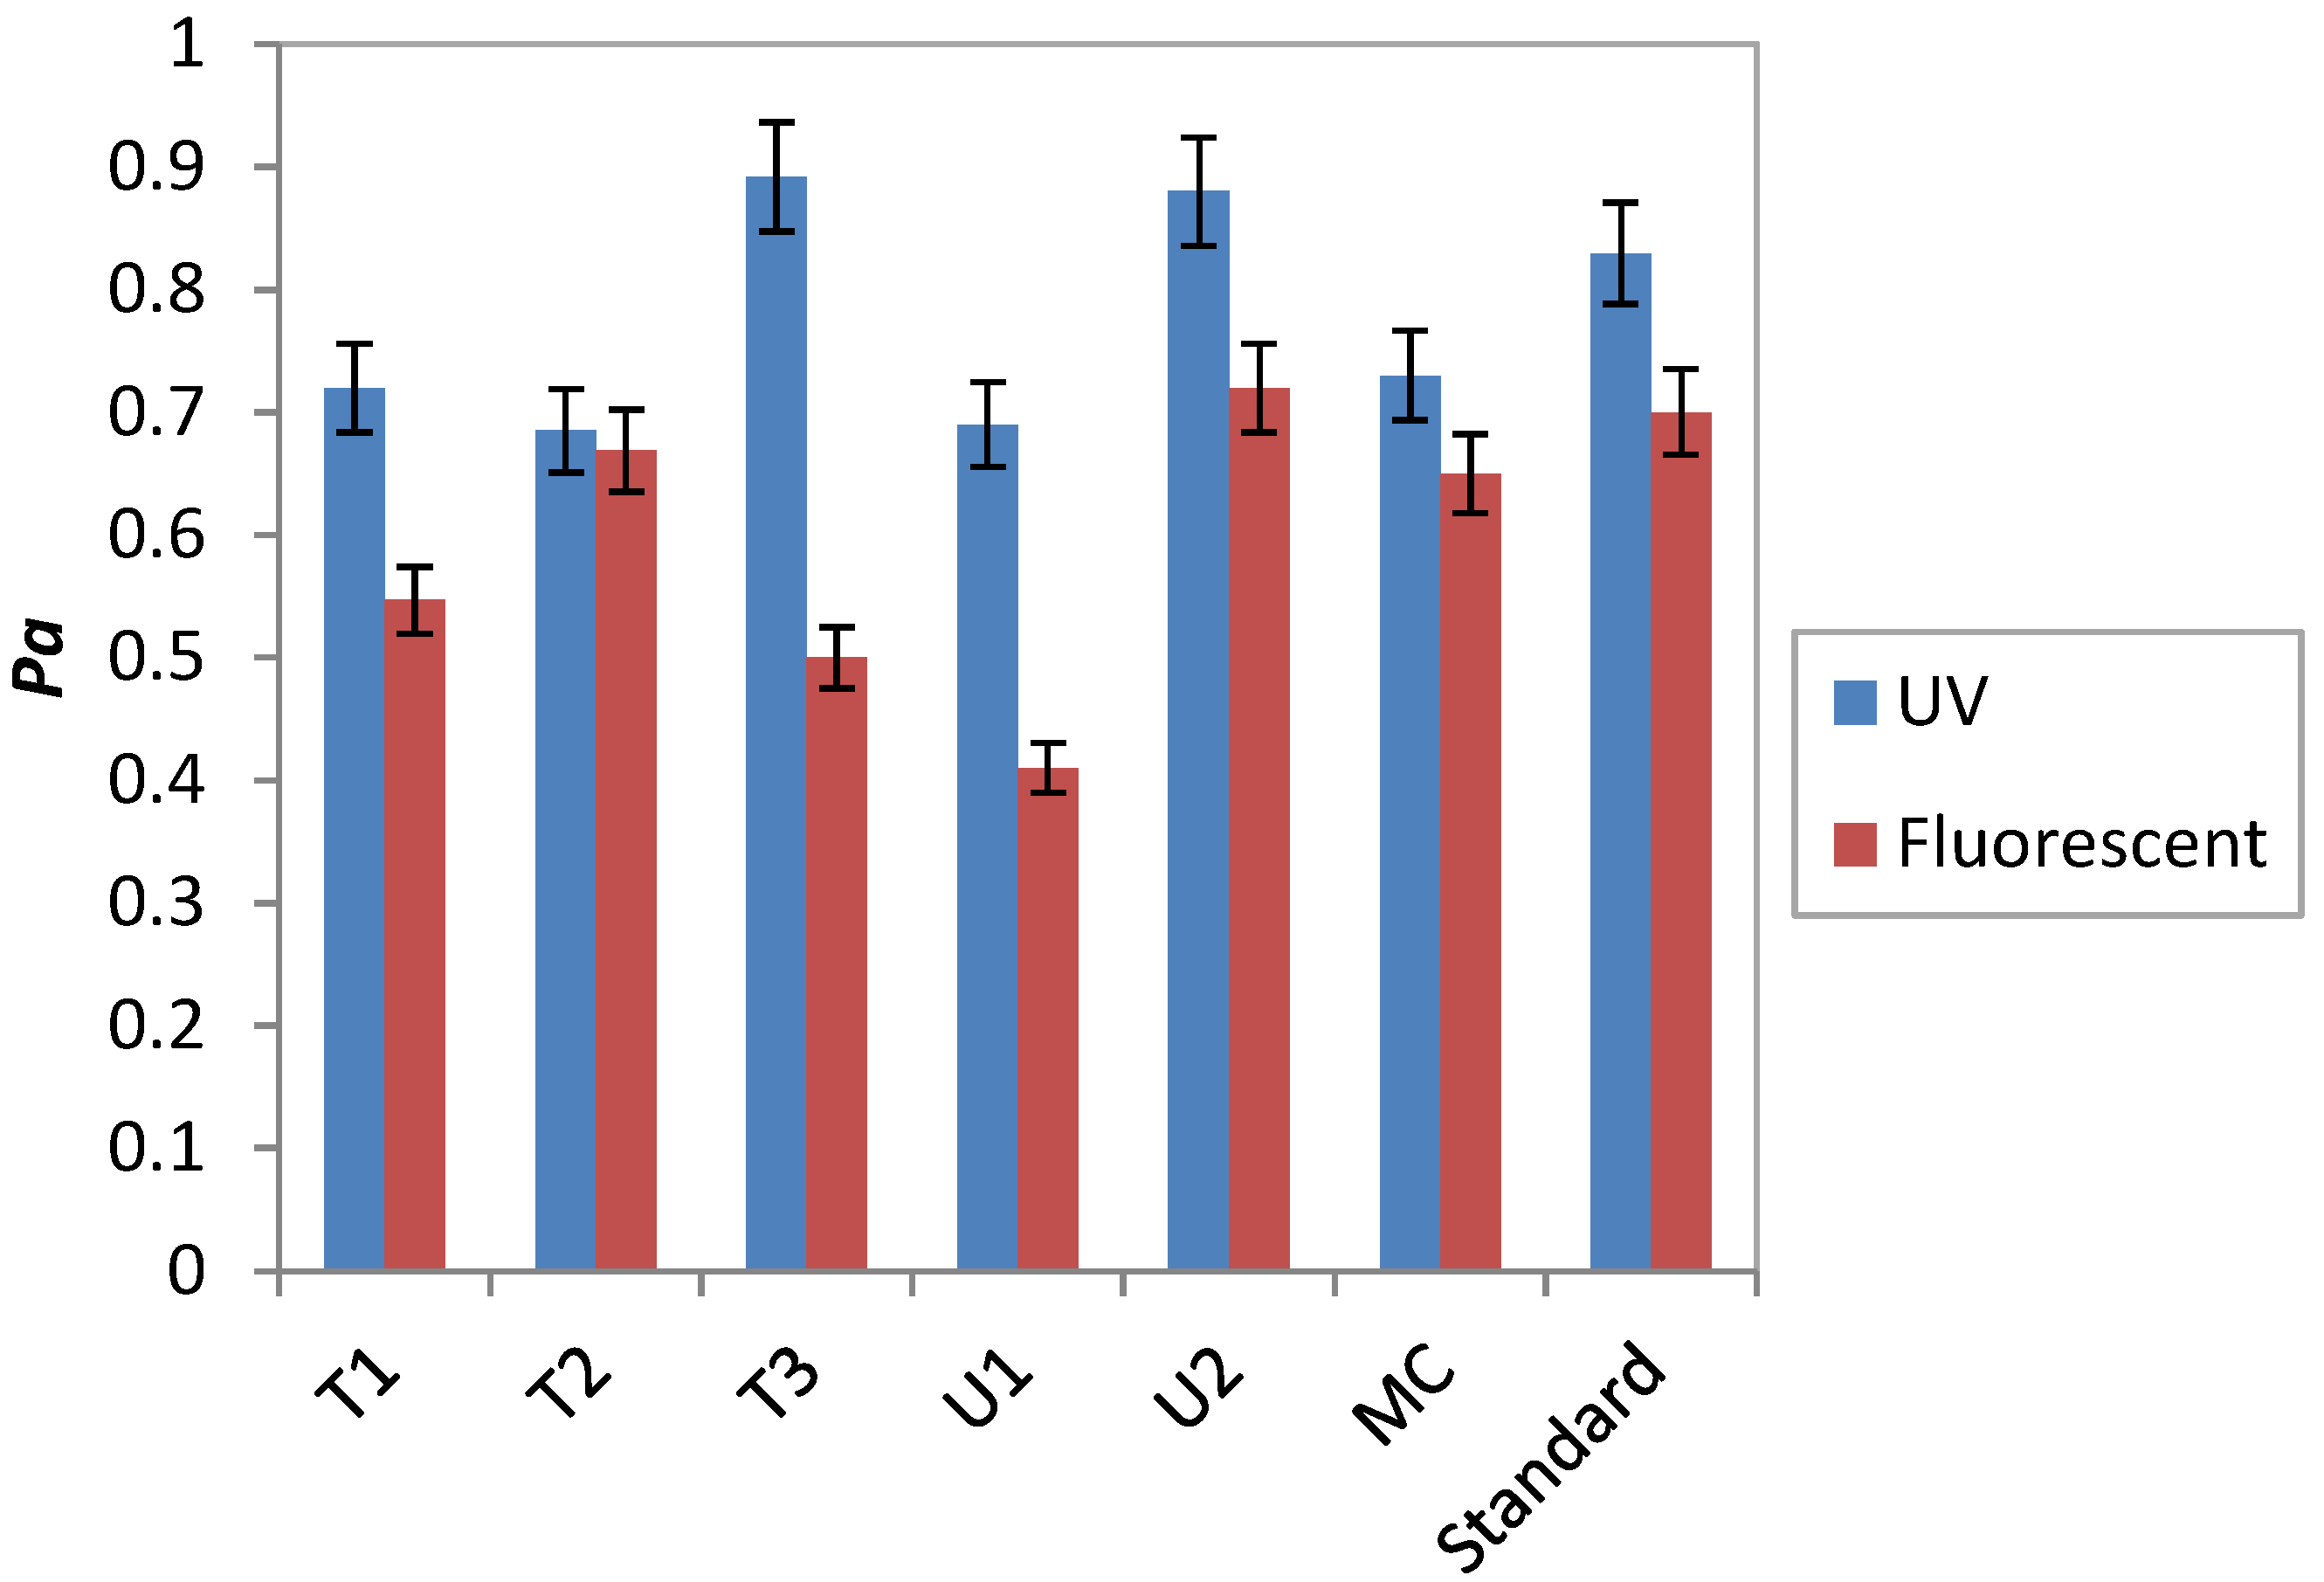
3.5. Photocatalytic Properties
Figure 8 shows the photocatalytic activity of the coatings under fluorescent and UV irradiation.
Figure 8.
Photoactivity of TiO2 and doped TiO2 coatings under UV (blue bars) and fluorescent light (red bars) irradiation. (a) T1; (b) T2; (c) T3; (d) U1; (e) U2; (f) MC.
Figure 8.
Photoactivity of TiO2 and doped TiO2 coatings under UV (blue bars) and fluorescent light (red bars) irradiation. (a) T1; (b) T2; (c) T3; (d) U1; (e) U2; (f) MC.
A loss of activity for T1–T3 coatings under UV light following the brewery trials was seen to varying degrees. The lower content TiO2-Ag surface (T2) retained the most activity with the exception of samples received from Brewery C. A greater loss of photocatalytic properties of the higher doped Ag coatings was seen, possibly due to the leaching of silver during the process studies. The controls also lost activity following three months storage in the dark compared to the as-deposited samples (UV light). Similar results were seen when photocatalytic activity was assessed under fluorescent light. Comparison of the photocatalytic properties of U1 and U2, showed that the addition of Mo to the heat-treated TiO2 surface increased its photocatalytic activity under UV and fluorescent light and this remained the case following the process studies. Photoactivity was largely retained for Mo-doped surfaces from all breweries with the exception of one of the two samples received from Brewery B. TiO2 alone retained some of its photoactivity to varying degrees when irradiated with UV, although values between the duplicate samples differ. Less activity was shown under fluorescent light exposure, as expected and controls also showed lower photocatalytic activity compared to the as-deposited samples. Compared to the controls stored in the dark, the MC TiO2 surfaces retained much of their photocatalytic activity, with the exception of samples received from Brewery B (under UV), where scratch test and EDX results had shown very little coating had been left on the substrate surface after the trial. As a small area of the substrate remained uncoated during the spray coating process, duplicate samples were not available in the case of MC surfaces.
The differences in photocatalytic activities of the surfaces received from the breweries could be due to the position of the samples and the cleaning regimes used. Work by others has shown that canning machines were markedly less prone to accumulation of microorganisms than bottling machines which use recycled glass bottles [
1]. Further, it has been suggested that horizontal surfaces were prone to microbial accumulation and should be avoided in constructions as much as possible. Biofilm formation has also been shown to occur on certain surfaces despite daily cleaning and disinfection [
1]. Thus, deposits formed by reaction processes or microbes usually cannot be wholly removed with water from stainless steel [
29]. Various cleaners may have different success. In a surface test without soil a hypochlorite-based disinfectant was shown to be effective after an exposure of 10 min against all the microbes tested whereas an isopropanol-based cleaning agent was effective against all the vegetative cells tested [
30]. In the presence of soil, hypochlorite was effective against
Listeria monocytogenes and
Pseudomonas aeruginosa [
30]. The nature of clean may also affect efficacy. At 30 and 50 °C water rinsing at the flow velocities investigated could remove up to 85% of a yeast deposit. At a water rinsing temperature of 70 °C, less yeast deposit could be removed overall [
3]. If surfaces were soiled with chemical residue and not cleaned sufficiently, it is possible that this may have an effect on photocatalytic activity. Conversely over aggressive cleaners might damage the surface, as noted previously.
3.6. Wettability
Photo-induced hydrophilicity is often associated with photocatalytic TiO
2 coatings [
31]. Large differences in the wettability of TiO
2 coatings after irradiation by light or after storage in the dark are believed to be due to the generation of hydrophilic radicals on the TiO
2 surface by the action of light. Measurement of contact angle had been found to be an effective and easy method of detecting the presence of the TiO
2 sol coating, MC. In addition, it is expected that the contact of contaminants with the surface is enhanced in the case of hydrophilic surfaces, resulting in an increase in the effect of the photocatalyst. Thus water contact angle measurements were made on each test coupon listed in
Table 3 to help determine the presence and activity of each coating.
Contact angles were firstly measured for the coupons immediately on unpacking (dark), and then after 20 hours irradiation. It was noticeable that many of the coupons were heavily soiled so a portion of each sample was cleaned by wiping with 2-propanol on a soft cloth and then with water. Contact angles were re-measured after 20 h. under UVA light, and again after 6–7 days in the dark. The results are shown in
Figure 9,
Figure 10 and
Figure 11.
Figure 9,
Figure 10 and
Figure 11 show that for most coatings, the effect of light on the wettability was more pronounced in the case of the reference surfaces than those having undergone the processing conditions. This may indicate changes in the coating activity resulting from the exposure to the cleaning chemicals
etc. used during the processing.
Figure 9.
Water contact angle measurements for (a) TiO2 (T1); and (b) TiO2-Ag (low) (T2) coupons after three-month Brewery Trial.
Figure 9.
Water contact angle measurements for (a) TiO2 (T1); and (b) TiO2-Ag (low) (T2) coupons after three-month Brewery Trial.
Figure 10.
Water contact angle measurements for (a) TiO2-Ag (high) (T3) and (b) TiO2 (U1) coupons after three month Brewery Trial.
Figure 10.
Water contact angle measurements for (a) TiO2-Ag (high) (T3) and (b) TiO2 (U1) coupons after three month Brewery Trial.
For the TiO
2 sol coating, MC, the two coupons sited at the Brewery C showed similar wettability to the control sample (MC-R2), after cleaning, both in the dark and the light. Visual inspection of the coupons sited at the other two breweries showed that the coating was wholly or partly removed from these coupons, and the contact angle measurements reflect this loss of coating (
Figure 11b). Contact angle values on blank stainless steel surfaces after cleaning were 70°–80°.
Figure 11.
Water contact angle measurements for (a) TiO2-Mo (U2); and (b) TiO2 (MC) coupons after three month Brewery Trial (Coated area of MC-R1 was too small to test).
Figure 11.
Water contact angle measurements for (a) TiO2-Mo (U2); and (b) TiO2 (MC) coupons after three month Brewery Trial (Coated area of MC-R1 was too small to test).
4. Conclusions
TiO2 coatings were deposited either using reactive magnetron sputtering, both with and without subsequent heat treatment, or prepared by spray coating. Photocatalytic activity, determined by methylene blue degradation, was high under UV irradiation. The coatings were also active under fluorescent irradiation. Doping of magnetron sputtered TiO2 with Ag- (0.5 at%) and Mo- (7 at%) increased the activity under fluorescent light. High Ag loading (~30%) had a detrimental effect on the fluorescent light induced photoactivity, possibly due to the replacement of Ti atoms in the TiO2 matrix with Ag. The coatings were placed in three different breweries for three months. The magnetron sputtered TiO2 surfaces which had not undergone heat treatment showed the best mechanical resistance, whilst the spray coated TiO2 and Mo-TiO2 showed the best retention of photoactivity. Irradiation of the coatings resulted in an increase in wettability, but the spray-coated TiO2 was the only coating showing light-induced hydrophilicity after the process trial.
This work presented the potential of magnetron sputtered TiO2 and doped TiO2 coatings for surfaces used in food and beverage processing where there is a requirement for robust coatings. Selection of the optimum deposition parameters and dopants can lead to coatings which retain photoactivity and are durable in harsh processing conditions. The use of spray coatings is preferred on surfaces which do not experience severe mechanical wear and abrasion.

 ,
, 


