Article

Empirical-Statistical Study on the Relationship between Deposition Parameters, Process Variables, Deposition Rate and Mechanical Properties of a-C:H:W Coatings

1
Engineering Design, Friedrich-Alexander-Universität Erlangen-Nürnberg, Martensstraße 9, D-91058 Erlangen, Germany
2
Physical Metallurgy, Technische Universität Darmstadt, Allarich-Weiss-Straße 2, D-64287 Darmstadt, Germany
*
Author to whom correspondence should be addressed.
Coatings 2014, 4(4), 772-795; https://doi.org/10.3390/coatings4040772
Submission received: 22 October 2014 / Revised: 28 October 2014 / Accepted: 8 December 2014 / Published: 15 December 2014

Abstract

:
Tungsten-modified hydrogenated amorphous carbon coatings (a-C:H:W) were deposited on high speed steel by reactive magnetron sputtering of a tungsten carbide target in an argon-ethine atmosphere. The deposition parameters, sputtering power, bias voltage, argon and ethine flow rate, were varied according to a central composite design comprising 25 different parameter combinations. For comparison, a tungsten carbide coating was deposited, as well. During coating deposition, the process variables, total pressure, sputtering voltage and bias current, were measured as process characteristics. The thickness of the deposited coatings was determined using the crater grinding method, and the deposition rate was calculated. Young’s modulus E and indentation hardness H IT were characterized by means of nanoindentation. With E = 80 253 GPa and H IT = 7.8 22.0 GPa, the mechanical properties were found to vary strongly in between different a-C:H:W variants. Using statistical methods, it is shown that these properties, as well as the deposition rate significantly depend on all four varied parameters. Despite a very similar influence of the parameters on modulus and hardness, as well as a very strong correlation of both properties, it is pointed out statistically that the H / E ratio, which is an indicator of the wear resistance, can be adapted in a targeted way and with some degree of independence.

Graphical Abstract

1. Introduction

Amorphous carbon coatings [1] are well-established low-friction wear-protection coatings employed in numerous engineering applications [2]. For applications under high contact pressures, coating variants that are alloyed with transition metals (a-C:H:Me) are generally preferred over pure amorphous carbon. The reason is that a-C:H:Me is more tolerant to overloading [3,4] as a result of an improved effective adhesion to the substrate due to lower residual compressive stresses [5], as well as the increased mechanical toughness of the coating material [6,7]. Further, in highly loaded sliding contacts against steel, a lowered adhesion tendency during the running-in phase may also play a role [8,9]. The type of a-C:H:Me coating that is probably most widely used nowadays is tungsten-modified hydrogenated amorphous carbon (a-C:H:W).
a-C:H:W coatings are usually deposited by reactive magnetron sputtering of tungsten [5,10,11] or tungsten carbide [5,10,12] in an argon-hydrocarbon atmosphere. Commonly, ethine ( C 2 H 2 , acetylene) is used as the gaseous hydrocarbon precursor [5,10,11,12]. It is known that with increasing availability of hydrocarbons in the deposition chamber, the carbon content of the deposited a-C:H:W films is increased [10], allowing the adaptation of the a-C:H/WC ratio. The films often have a columnar microstructure [5,13,14] (see also Section 3.2). Typically, a-C:H:W is composed of nanoscale tungsten carbide grains that are homogeneously distributed in an a-C:H matrix [12,14,15,16]. For films that are deposited under conditions where the kinetics generally allow for crystallite formation, exceptions are the extreme cases with rather low or high tungsten content. In very carbon-rich a-C:H:W, the tungsten atoms are finely distributed, and no tungsten carbide clusters can be found [14,16]. In contrast, if the carbon content is sufficiently low, the coatings only consist of nanocrystalline tungsten carbide [16].
Neglecting these extreme cases, which are rather uncommon in industrial practice, a-C:H:W can be considered a two-phase nanocomposite material. Whilst the intrinsic properties of the carbide particles in a-C:H:Me coatings are likely not much influenced by a variation of the deposition parameters [17], those of the a-C:H matrix generally are. For pure a-C:H, deposited by plasma-enhanced chemical vapor deposition (PECVD), it is known that it can be a soft and compliant material, as well as a hard and stiff material, depending on the plasma composition and the energy of film forming and bombarding species [18,19,20]. These mechanical properties are closely linked to the characteristic chemical-structural properties of a-C:H films, namely hydrogen content, the sp 2 /sp 3 ratio, sp 2 clustering and orientation [21]. Hence, the mechanical properties, in particular the Young’s modulus [12] and hardness [12,13,22], of a-C:H:W should be adaptable, not only by adjusting the a-C:H/WC ratio, but also by variation of the chemical-structural composition of the a-C:H matrix.
This is of practical interest, as the Young’s modulus and hardness of the coating decisively influence the effective mechanical strength and wear resistance of a coating-substrate system. With regard to the effective strength, a well-recognized parameter is the ratio of the Young’s moduli of coating and substrate E c / E s (c, coating; s, substrate). Under mechanical loading during a tribological contact, the substrate deflects, and the coating is subjected to the strain resulting from the substrate’s elastic resilience. The magnitude of the deflection, and, hence, the strain of the coating, is decreased in the case of a stiffer substrate material, i.e., if E s is increased. Under the given strain resulting from the deflection of the substrate, the stress within the coating is lower in the case of a compliant coating material, i.e., if E c is decreased. Therefore, from a solely mechanical point of view, lowering the E c / E s ratio generally results in a more favorable stress state of a tribological coating under load [23,24]. As, in practice, the substrate material, and, hence, E s , is commonly determined by external factors, like the design requirements and costs, decreasing E c should usually be the method of choice to lower the E c / E s ratio.
With regard to the wear resistance, a well-recognized parameter is the ratio of hardness and Young’s modulus H / E , which characterizes the coating material’s elastic strain to failure. A high H / E ratio is generally associated with high wear resistance [25]. Therefore, the resistance to wear can either be increased by increasing the hardness or by decreasing the Young’s modulus of the coating, with the latter also being favorable with regard to the coating’s stress state under load, since the E c / E s ratio is lowered. Particularly, nanocomposite coating materials, as is a-C:H:W, should allow some degree of independence in the control of their Young’s moduli and hardness values [25] by proper adjustment of the relevant parameters of the deposition process.
Concerning reactively-sputtered a-C:H:W coatings, other authors have mostly studied the influence of the ethine flow rate [11,12,14] and, in less detail, the influence of the bias voltage [5,12] on the Young’s modulus [5,11,12,14] and hardness [5,11,12,14]. Pujada and Janssen [12] suggested that the rules of mixture, which are normally employed to calculate the Young’s modulus of fiber-reinforced composites lengthwise and transverse to the fiber direction, also apply to estimating an upper and lower limit of the Young’s moduli of WC particles and the a-C:H matrix. They concluded that their studied a-C:H:W coatings deposited at different ethine flow rates (and no bias voltage), with correspondingly differing a-C:H/WC ratios, should consist of stiff WC particles and a considerably less stiff a-C:H matrix. Without giving further evidence, they suggested that the stated rules of mixture should apply to the hardness of a-C:H:W coatings likewise. In other work, Corbella et al. [13,22] found an approximately linear relationship between hardness and tungsten content, which decreases with the decreasing W/(W + C) ratio of the coating, respectively with increasing hydrocarbon flow rate of the deposition process. Even though this finding indicates that the hardness values of the coatings are influenced in a similar manner as are their Young’s moduli, it is still left open for further investigation to elucidate how firmly the two mechanical properties of nanocomposite a-C:H:W coatings are generally coupled, respectively to what extent they can be varied independently.
Therefore, the present study uses an empirical and statistical approach to shed more light on the influence of the deposition parameters on the hardness and Young’s modulus of a-C:H:W coatings, as well as the interrelationship of these two material’s properties, which is represented by the H / E ratio. Besides the two commonly-varied deposition parameters, the ethine flow rate and bias voltage, two further parameters, namely sputtering power and argon flow rate, were varied systematically within the scope of a central composite design. Furthermore, the relationship between the deposition parameters and the deposition rate is considered. Additionally, the recorded process variables, total pressure, sputtering voltage and bias current are statistically evaluated to enable a broader understanding of the effect of the varied parameters on the process conditions.

2. Experimental Section

2.1. Specimens and Deposition Process

In this study, polished flat disks (Ø30 ×5 mm, R a = 0.02 µm) of high-speed steel 1.3343 (0.9 wt.% C, 4.0 wt.% Cr, 5.0 wt.% Mo, 0.9 wt.% V, 6.4 wt.% W), hardened and tempered to 62 ± 1 HRC, were used as substrates. The a-C:H:W coatings were deposited using an industrial-scale coating machine, H-O-T TT 300, described elsewhere [26], with a three-fold rotating charging rack. Prior to coating deposition, the specimens were ultra-sonically cleaned in acetone and isopropanol, dried using nitrogen and plasma etched inside the coating machine. To improve coating adhesion to the substrate, a thin chromium layer was deposited by steered arc evaporation of a Cr target at a low arc current of 70 A. Further, prior to the a-C:H:W functional layer, a thin inter-layer of tungsten carbide was deposited by unbalanced magnetron (UBM) sputtering of a binder-free WC target. The WC and Cr layers were joined by a Cr/WC gradient, produced by simultaneous operation of the arc and sputtering cathode. The a-C:H:W functional layer was deposited by reactive UBM sputtering of the WC target in an argon-ethine atmosphere. At the base of the functional layer, a thin gradient of increasing carbon content was realized by ramping the ethine flow rate. The sputtering cathode was operated at bipolar pulsed DC voltage with a frequency of 40 kHz and a duration of the positive pulses of 5 µs. The voltage level of the positive pulses was set to 15 % of the voltage set point, which represents the negative pulse amplitude. In this last process step, the four deposition parameters, sputtering power P sputter , bias voltage U bias , argon flow rate ϕ ( Ar ) and ethine flow rate ϕ ( C 2 H 2 ) , were varied systematically from batch to batch according to the experimental design described in Section 2.3. For all batches, all of the other parameters, including the deposition time, were kept constant. For the deposition of the adhesive layers, the substrate temperature was about 160 ℃. During deposition of the functional layer, the temperature was held in the range of 100 to 140 ℃. The deposition time of the adhesive layers was about 1 h, and that of the functional layer was 2 h. For all produced a-C:H:W variants, a thickness typical for amorphous carbon coatings used in automotive, aerospace and tool applications was obtained. In order to compensate for target erosion, the magnetron unit was slightly moved backwards after each deposition process, so that the sputtering voltage during deposition of the WC adhesive layer was kept at 460 ± 10 V. The total pressure during coating deposition was measured using a thermal conductivity vacuum meter.

2.2. Coating Characterization

Coating thickness was assessed using the crater grinding method [27]. Per coated specimen, three craters were evaluated with a digital optical microscope, and the mean value of the coating thickness was calculated. The indentation hardness H IT and Young’s modulus E were measured by instrumented indentation [28] using an MTS Nanoindenter XP with a Berkovich tip geometry in continuous stiffness mode. The values of H IT and E were determined at a maximum indentation depth of 10 % of the respective coating thickness, averaged over an indentation depth range of 25 nm. In order to derive E from the reduced modulus E r , a Poisson’s ratio of 0.3 was assumed in any case. Each specimen was subjected to nine individual indentation measurements from which the average value was calculated. Per series of measurements, at maximum, three significant outliers, which typically result from the indenter hitting coating defects or other surface irregularities, were deleted. The coating cross-sections shown in Section 3.2 were prepared with a focused ion beam (FIB) Zeiss Crossbeam 1540 EsB.

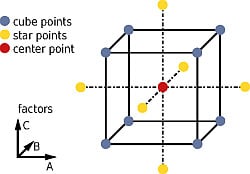
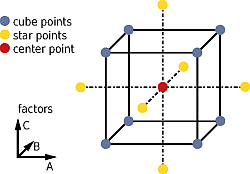
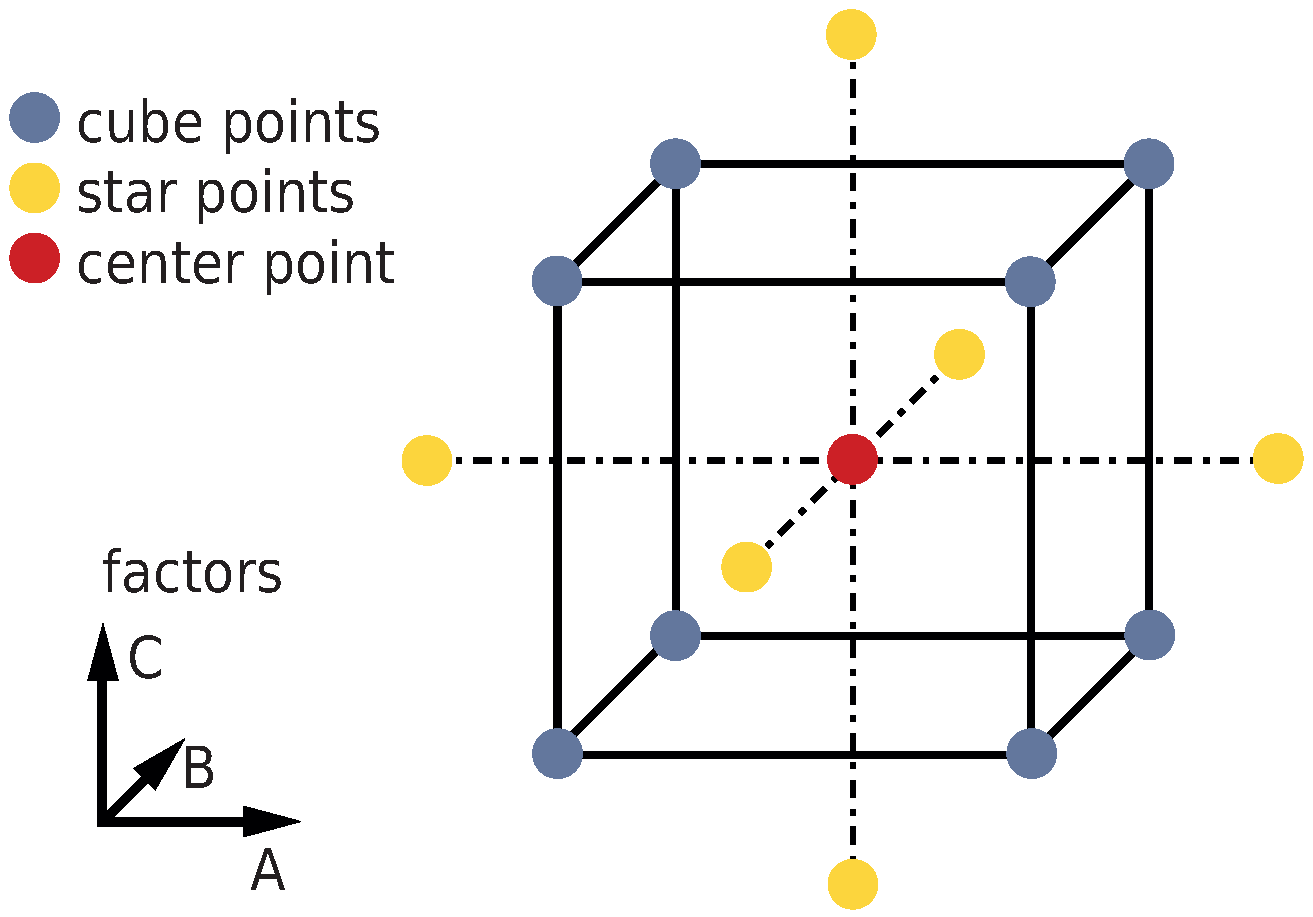
2.3. Design of Experiments and Statistical Methods

To enable the systematic evaluation of the effect of all four deposition parameters (factors) on the measured process variables and the properties of the a-C:H:W layer (result variables), a central composite design was chosen (Figure 1). In the definition of the set points (factor levels), a compromise between settings covering an as large as possible area of the process window and process stability in all realized factor combinations had to be found beforehand. The design allows assessing the main effects of the parameters on the result variables, as well as two-factor interactions and quadratic effects.
Figure 1. Schema of a central composite design with three factors, A, B and C. It consists of a full factorial design (cube points), which is extended by a center point and star points.
Coatings 04 00772 g001
Table 1 shows the realized combinations of the factor levels. In addition to the a-C:H:W coatings, a pure WC coating was deposited as a reference. The deposition parameters were identical to those of the center point of the experimental design, except of the ethine flow rate, which was zero. The actual order of the batches was randomized to avoid a systematic impact of not completely controllable influencing factors, like erosion of the sputtering target or cleanness of the deposition chamber. The center point was realized seven times, allowing the assessment of the general magnitude of the scatter of the results.
To visualize the effect of the individual factors on the result variables depending on the respective factor levels, main effect plots were used. In these plots, each data point represents the mean value of the result variable under consideration of those occurrences that correspond to a parameter combination with the level of the respective factor (e.g., the mean value of the hardness of all a-C:H:W variants that were deposited at a bias voltage of 57 V, regardless of the set points of the other factors). Further, for each result variable, a regression model, which describes the contribution of the individual effects to the value of the result variable depending on the set points of the factors, was determined. For this purpose, the statistics software, Minitab 16, was used. Due to the chosen design, the regression coefficients in the applied mathematical models are proportional to the absolute effect size. Based on significance tests, an adapted regression model for each result variable was established. According to Occam’s razor adage [29] that “the simplest model that explains the data is the best model”, all terms corresponding to effects with a significance level α > 0.05 were neglected. In other words, only effects that were found to be statistically significant ( α 0.05 ), highly significant ( α 0.01 ) or even extremely significant ( α 0.001 ) were considered. For example, α 0.01 means that the effect of the respective factor or factor interaction on a specific result variable exists with a probability of at least 0.99 (confidence level). As a measure of the standardized effect size, the t ratio was used. The t ratio of an effect is equivalent to the corresponding normalized regression coefficient, which is proportional to the absolute effect size, divided by the standard deviation that is associated with this coefficient. These standardized effect sizes were plotted as Pareto charts. Correlation diagrams and contour line plots were used as further intuitively comprehensible ways of visualizing the statistical data.
Table 1. Set points of the deposition parameters (factors), which were systematically varied for the deposition of different a-C:H:W coatings according to the central composite design. Each of the individual parameters was varied in five factor levels.
IDPoint typeA: P sputter (W)B: U bias (V)C: ϕ(Ar) (sccm)D: ϕ(C2H2) (sccm)
V01cube1,0425712816
V02cube1,3585712816
V03cube1,04220312816
V04cube1,35820312816
V05cube1,0425723216
V06cube1,3585723216
V07cube1,04220323216
V08cube1,35820323216
V09cube1,0425712840
V10cube1,3585712840
V11cube1,04220312840
V12cube1,35820312840
V13cube1,0425723240
V14cube1,3585723240
V15cube1,04220323240
V16cube1,35820323240
V17star90313018028
V18star1,48013018028
V19star1,2001*18028
V20star1,20025918028
V21star1,2001308828
V22star1,20013027228
V23star1,2001301807
V24star1,20013018049
V25center1,20013018028
WCreference1,2001301800
* To represent a parameter set with a non-floating bias potential of zero, U bias = 1 V had to be set instead for technical reasons.

3. Results

3.1. Measured Process Variables

During coating deposition, total pressure p, sputtering voltage U sputter and bias current I bias were recorded. In each of the batches, the process conditions during (non-reactive) sputtering of the WC inter-layer could be kept very constant with p = 0.74 ± 0.06 Pa, U sputter = 461 ± 6 V and I bias = 0.28 ± 0.02 A. In the last process step for the reactive sputter deposition of the functional a-C:H:W layer, rather, different values of the process variables were measured depending on the respective set of deposition parameters: p = 0.53 1.2 Pa, U sputter = 505 705 V and I bias = 0 0.59 A. For the WC reference coating, the values of the measured process variables were p = 0.64 Pa, U sputter = 470 V and I bias = 0.38 A.

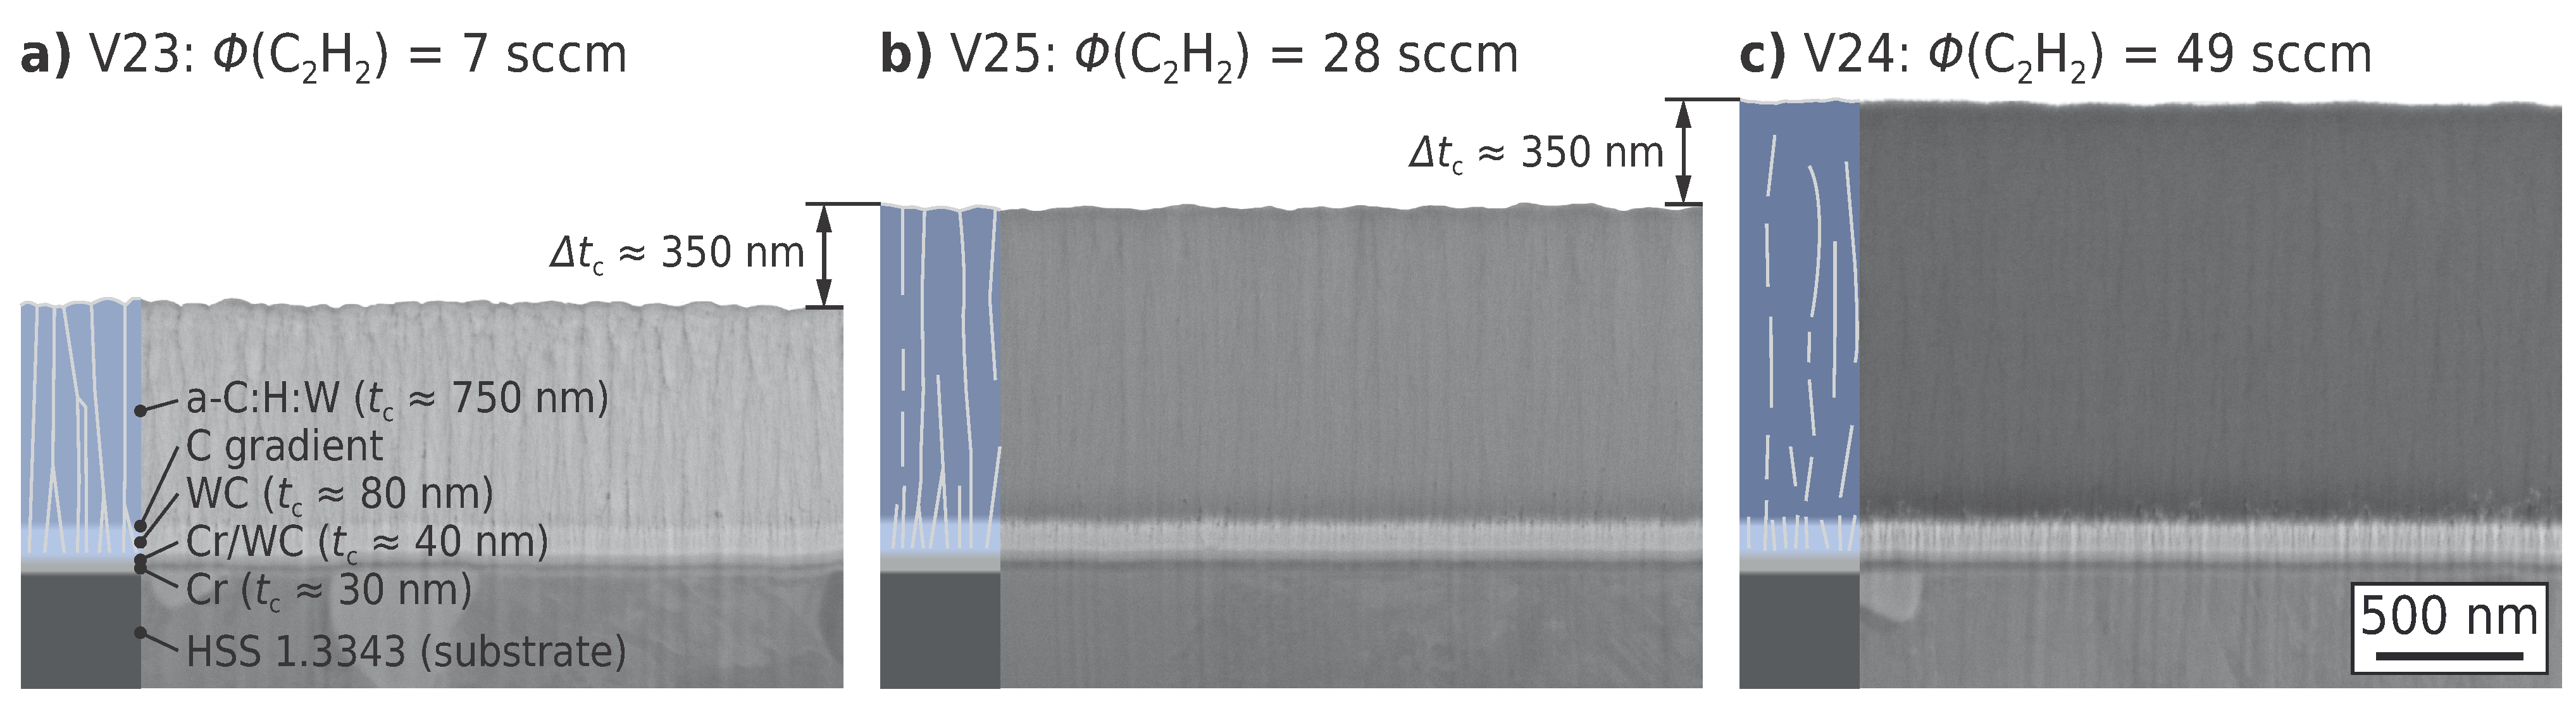
3.2. Architecture and Microstructure of the Coatings

Figure 2 shows the architecture and the microstructure of three selected a-C:H:W variants that were deposited at different ethine flow rates of ϕ ( C 2 H 2 ) = 7 , 28 and 49 sccm.
Figure 2. Focused ion beam (FIB) cross-sections of three a-C:H:W coating variants that were deposited at different ethine flow rates and otherwise identical set points of the deposition parameters (with the schematic overlay to the left).
Coatings 04 00772 g002
In each case, the other parameters were adjusted to identical set points corresponding to the respective medium factor level. As can be seen, the overall thickness of the adhesive layers (Cr, Cr/WC, WC) is only about 150 nm and approximately equal for each of the coatings. The thickness of the deposited a-C:H:W layers increases by about 350 nm as the ethine flow rate is increased by Δ ϕ ( C 2 H 2 ) = 21 sccm. In accordance with [10], this supposes a proportional increase of the volume fraction of the a-C:H matrix. The corresponding increase of the carbon content is evident by the decreasing secondary electron intensity of the a-C:H:W functional layer in the SEM images (the contrast and brightness of the depicted SEM images were closely matched under consideration of the appearance of the adhesive layers). In each case, the functional layer exhibits a columnar microstructure, which is typical for a-C:H:W (see Section 1). Columnar growth already starts within the WC adhesive layer. The microstructure of a-C:H:W obviously becomes less pronounced as the ethine flow rate, respectively the volume fraction of the a-C:H matrix, increases. It is noteworthy that none of the depicted a-C:H:W variants shows nanolayers of a periodically alternating W/C ratio, as they can result from the discontinuous contribution of the sputtering process to coating growth due to substrate rotation [10,30,31]. Hence, it can be concluded that, for the a-C:H:W coatings deposited within the scope of this study, the frequency of substrate rotation was sufficiently high, so as to obtain a homogeneous coating composition, which is an optimal prerequisite for the assessment of representative mechanical properties by nanoindentation.

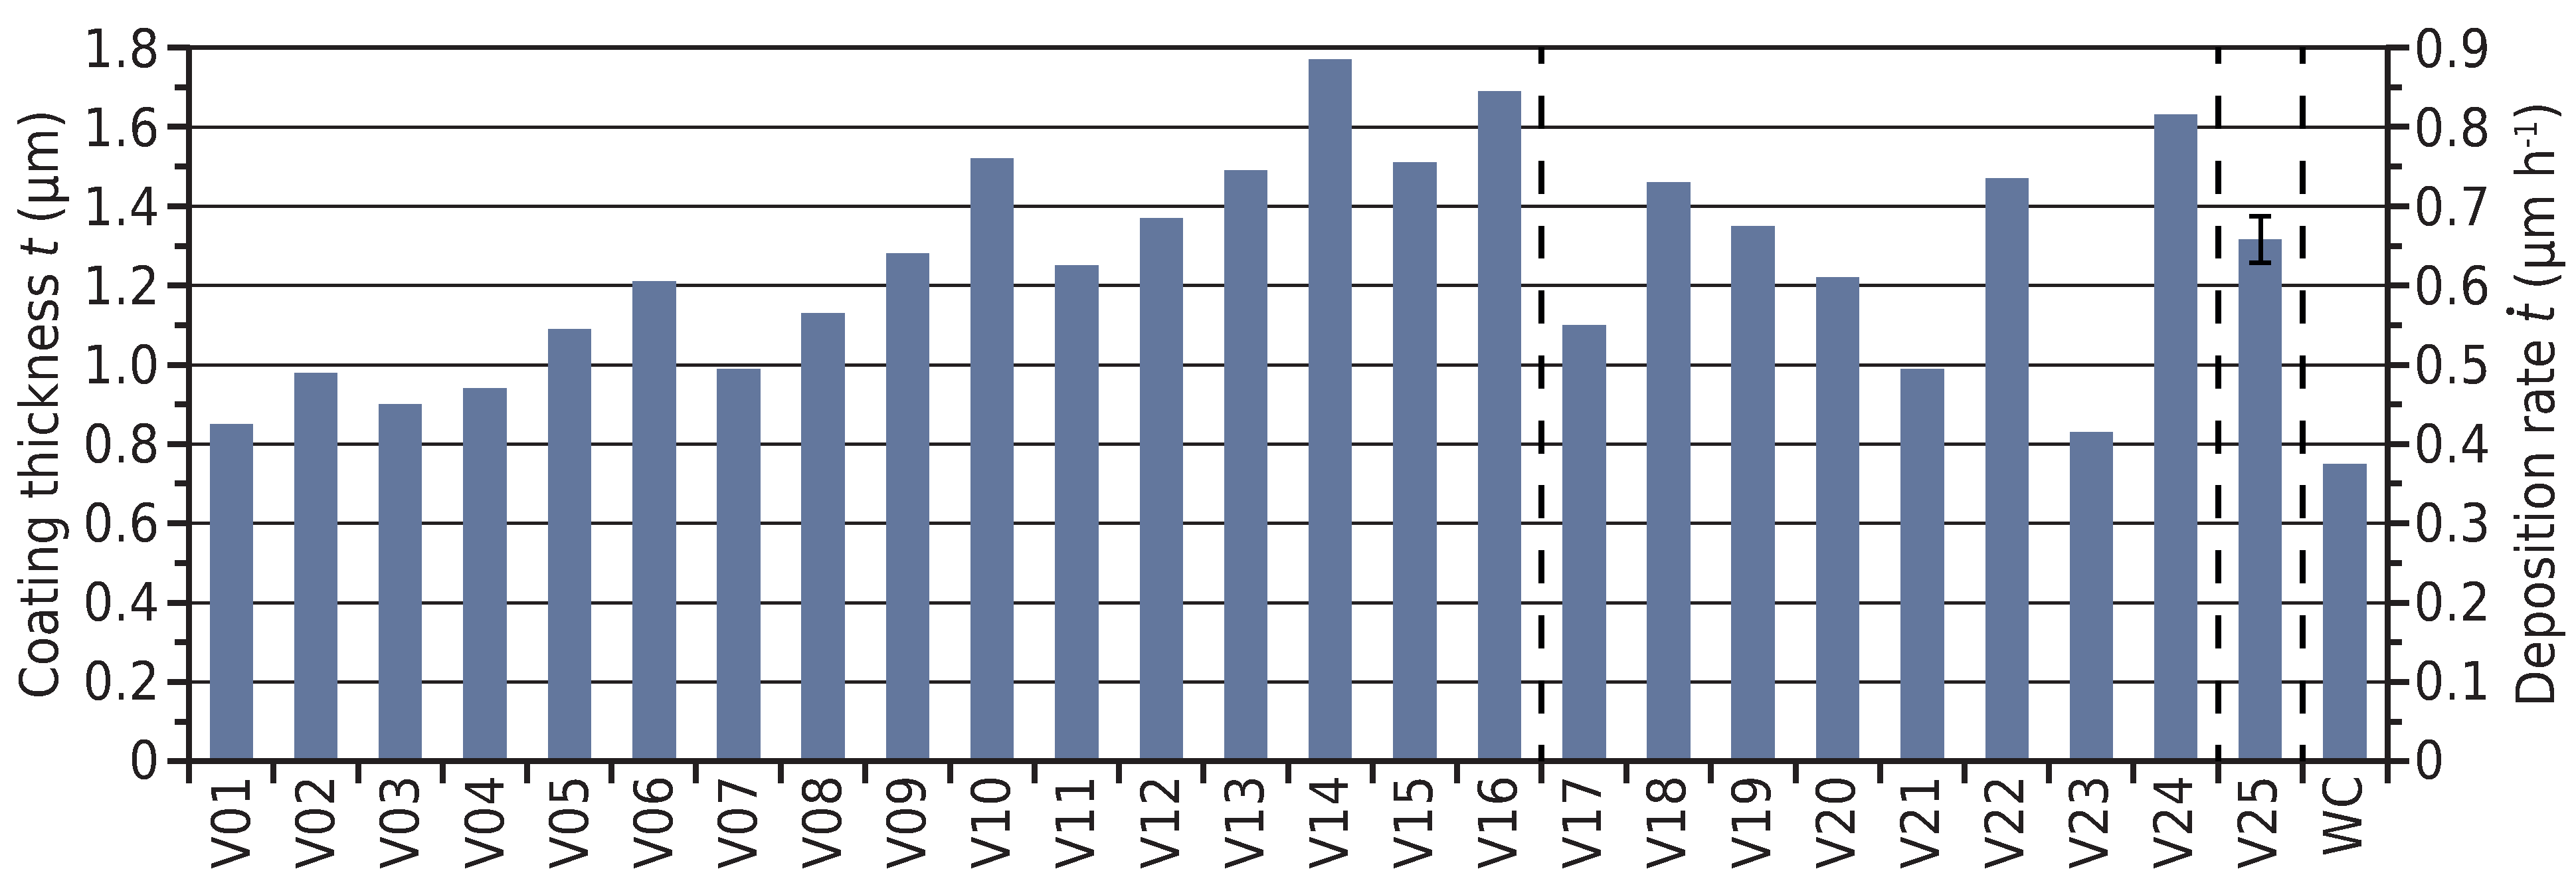
3.3. Deposition Rate

For the different a-C:H:W variants, the coating thicknesses t ranged from 0.83 µm to 1.77 µm, corresponding to deposition rates t ˙ between 0.42 µm h−1 and 0.89 µm h−1. With respect to the average value of the center points V25 ( t ˙ = 0.66 ± 0.03 µm h−1), this constitutes a variation of the deposition rate of up to 35 %. With t = 0.77 µm and t ˙ = 0.39 µm h−1, coating thickness, respectively the deposition rate, of the WC reference coating are lower, as in the case of any a-C:H:W variant. The results are graphically summarized in Figure 3.
Figure 3. Coating thickness t and deposition rate t ˙ of the a-C:H:W variants and the WC coating. Due to the constant deposition time, t and t ˙ are directly proportional.
Coatings 04 00772 g003

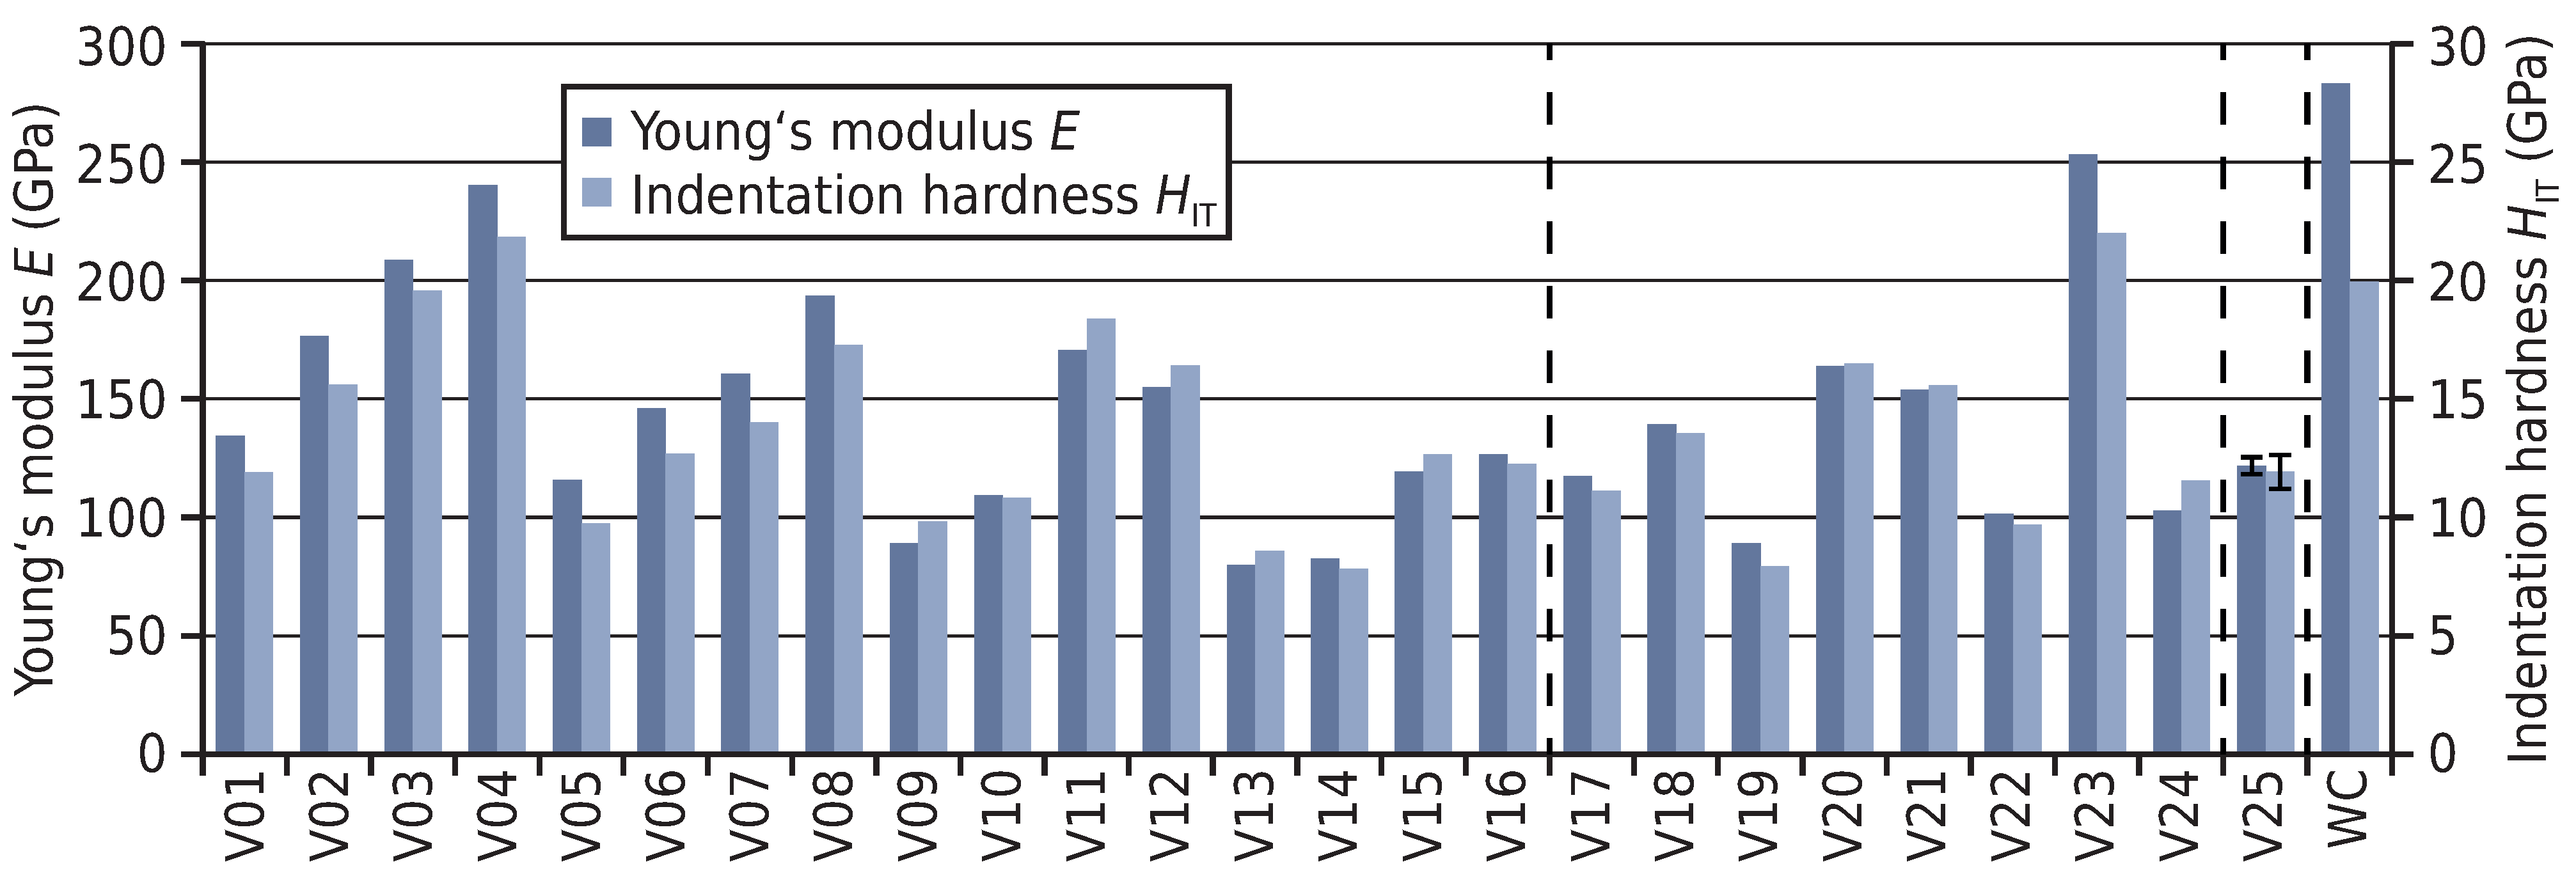
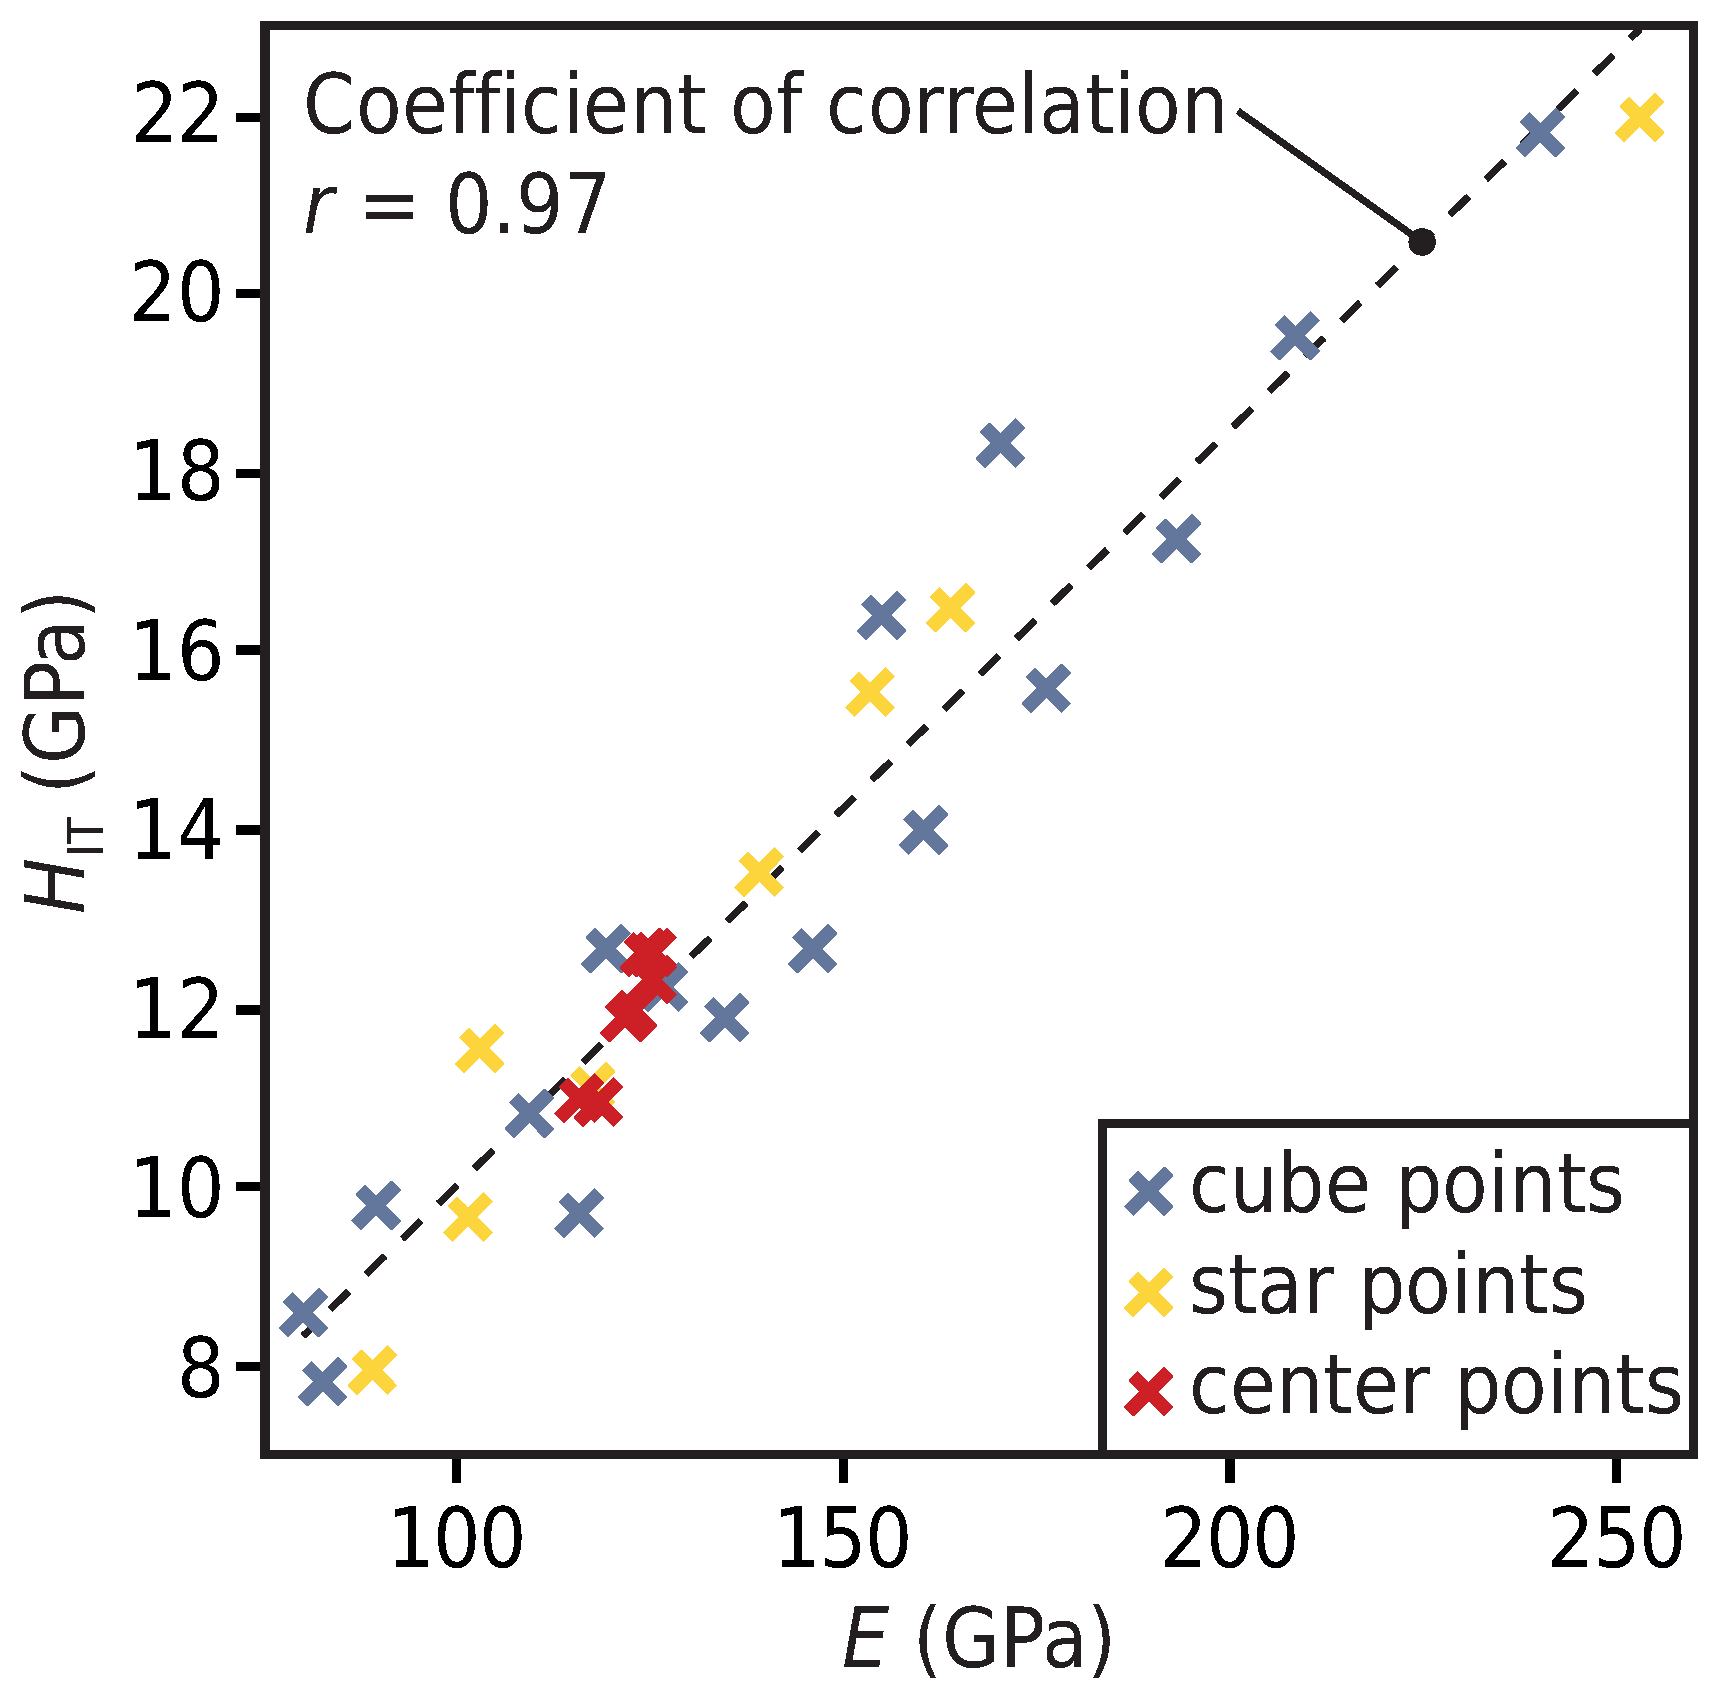
3.4. Mechanical Properties

The Young’s modulus E and indentation hardness H IT of the a-C:H:W coatings and the WC reference coating are graphically summarized in Figure 4. With the modulus between 80 GPa (V13) and 253 GPa (V23), Young’s moduli of the a-C:H:W coatings have a considerable range of variation. With respect to the average value of the center points V25 ( E = 122 ± 4 GPa), this means a variation in the elasticity of up to 107 %. Nevertheless, all a-C:H:W variants have a lower stiffness than the WC coating, which has E = 270 GPa.
The indentation hardness of the a-C:H:W coatings is in the range of 7.8 GPa (V14) to 22.0 GPa (V23). With up to 85 %, the variation of the hardness with respect to the average value of the center points V25 ( H IT = 11.9 ± 0.7 GPa) is not as strong as that of E. Six of the 25 different a-C:H:W variants exhibit a hardness of less than 10 GPa. According to the generic classification of thin solid films given in [2], these can be regarded as rather soft coatings. With H IT = 19.9 GPa, the WC coating is comparatively hard. However, for two a-C:H:W variants (V04, V23) the mean value of the hardness is even about 10 % higher.
Figure 4. Young’s modulus E and indentation hardness H IT of the a-C:H:W variants and the WC coating. Both mechanical properties vary strongly depending on the respective set of deposition parameters.
Coatings 04 00772 g004
The H / E ratio of the a-C:H:W coatings is in the range of 0.084 (V05) to 0.112 (V24), and the average value of all a-C:H:W variants is H / E = 0.096 ± 0.008 . Despite the additional WC, which is presumably present in the form of nanoparticles [12,14,15,16], this is rather close to the relationship H / E 0.1 that is commonly assumed for pure amorphous carbon coatings if no precise value is known [32]. In contrast, with H / E = 0.070 , the WC coating has a notably lower ratio of hardness to Young’s modulus.

4. Statistical Evaluation and Discussion

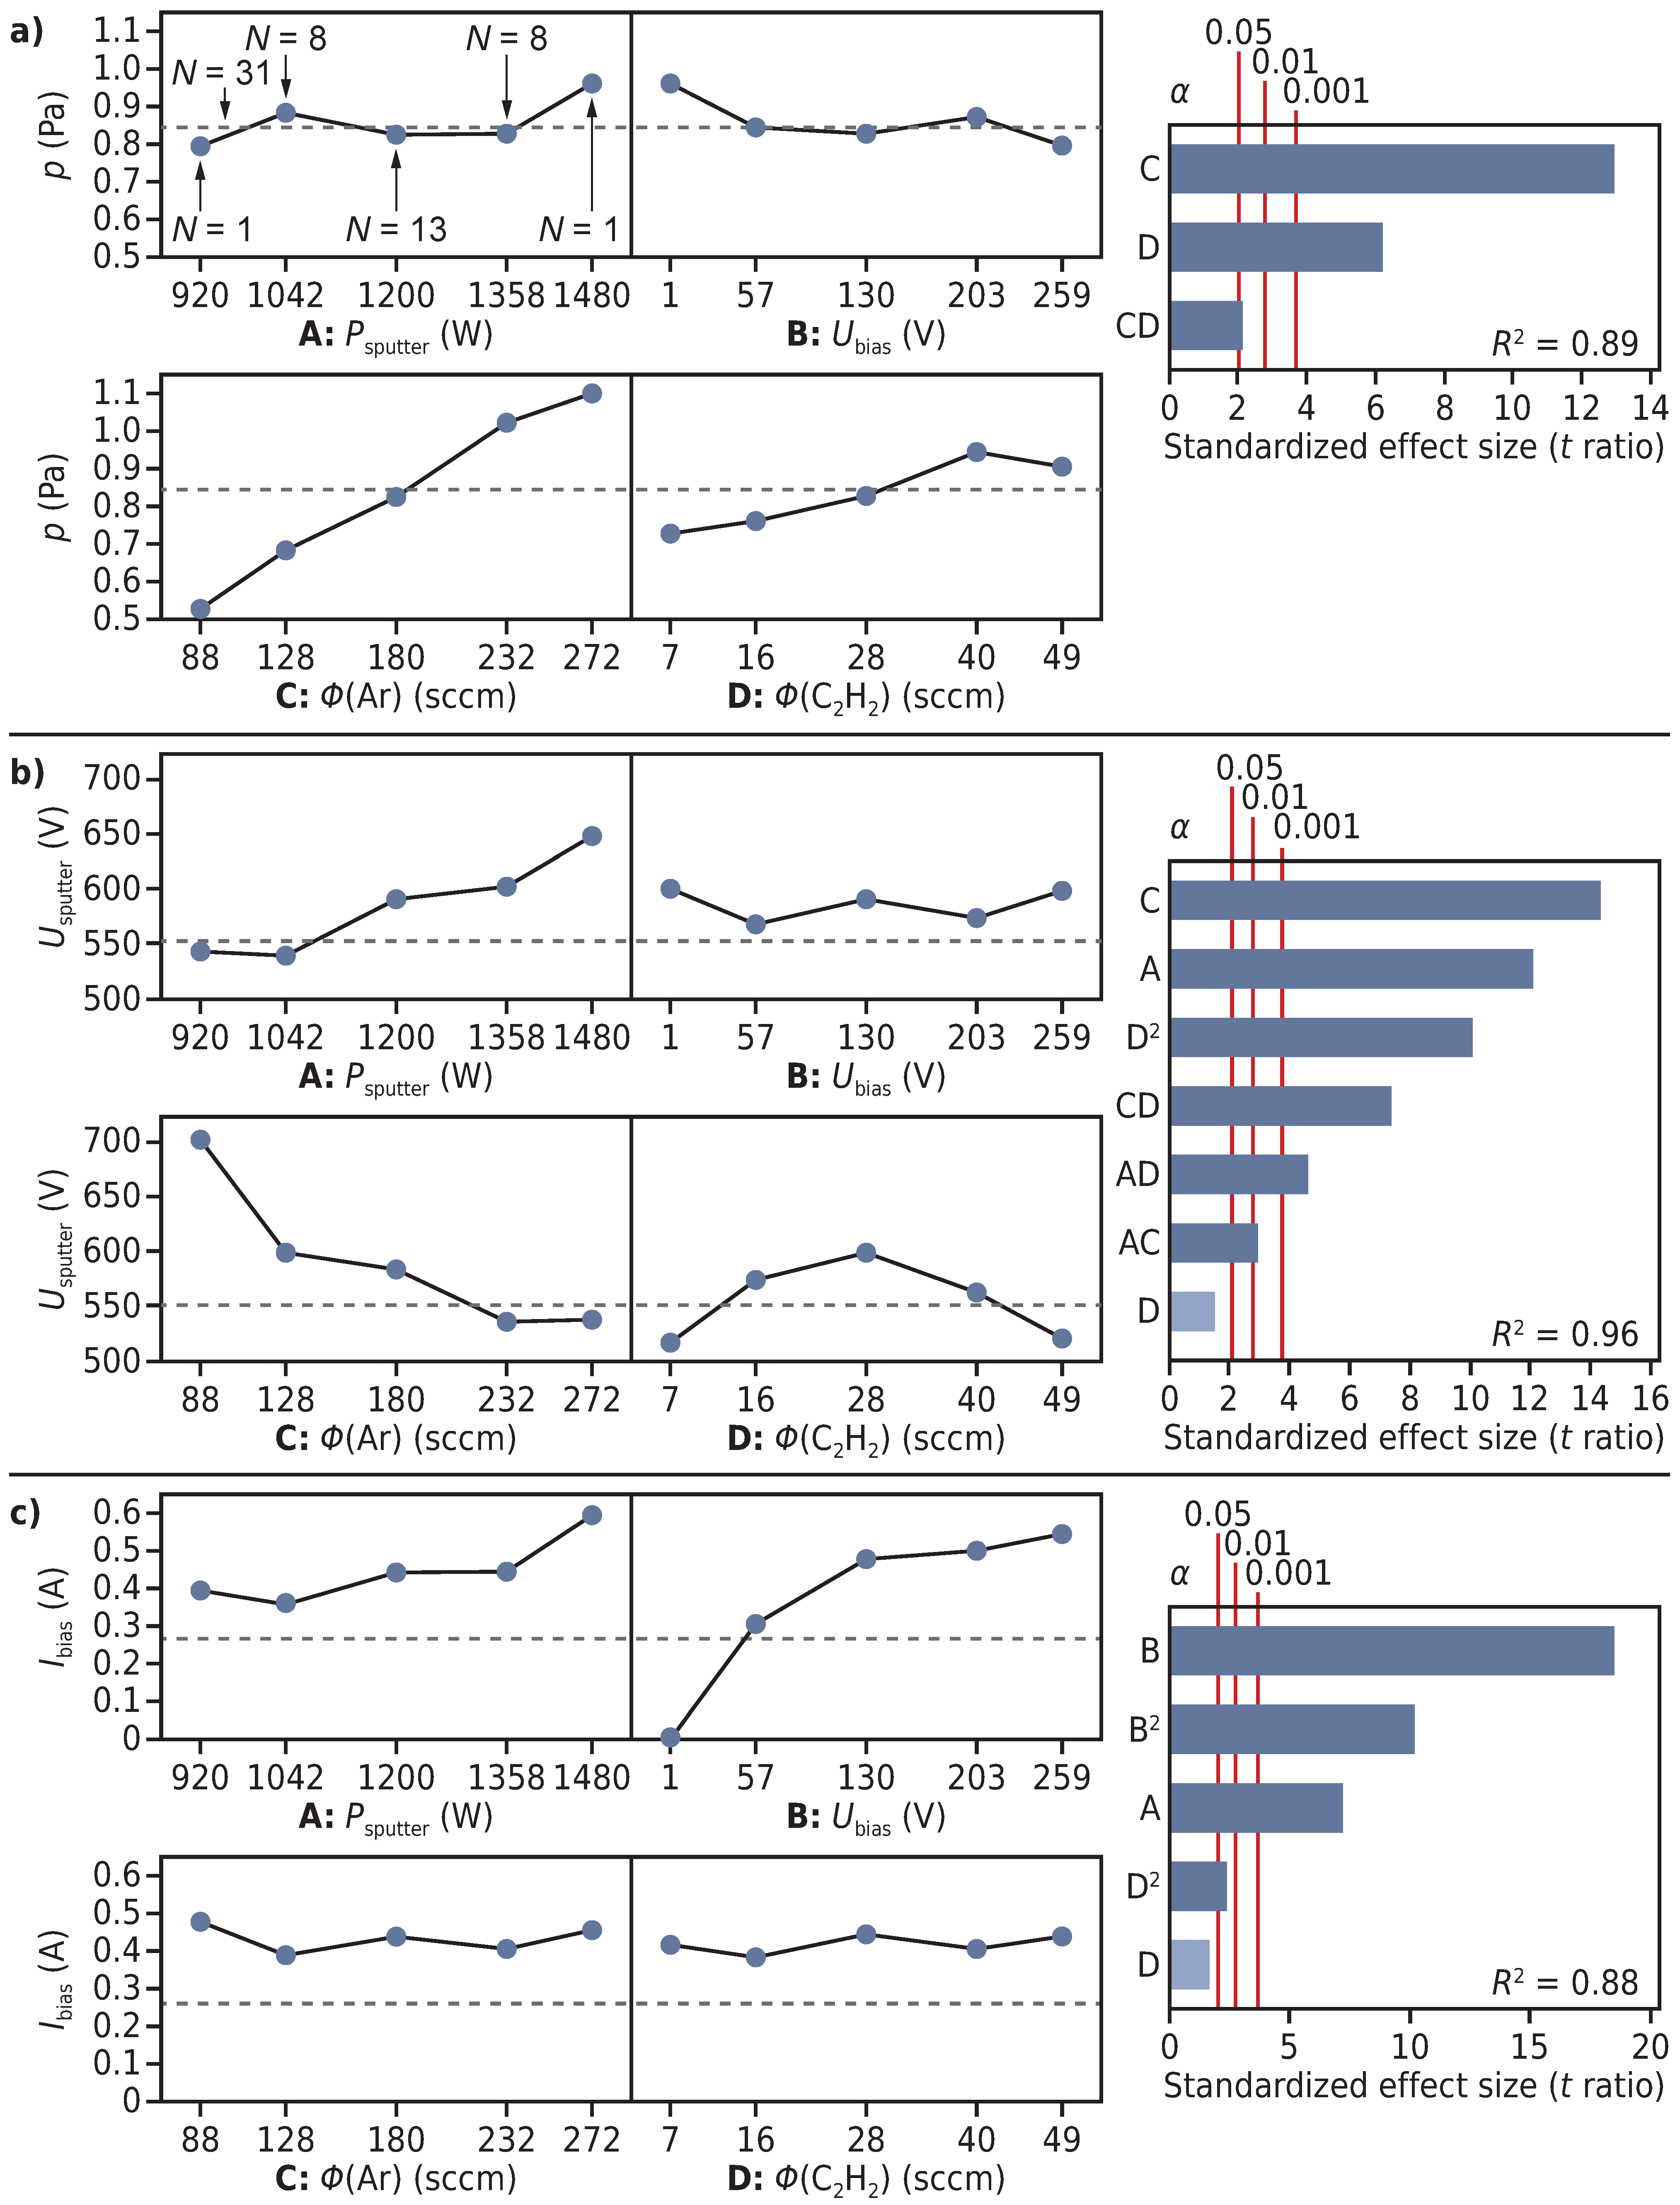
4.1. Measured Process Variables

4.1.1. Total Pressure

The results of the statistical evaluation concerning the total pressure p during reactive sputter deposition of a-C:H:W are shown in Figure 5a. As can be seen, the absolute effect of the argon flow rate (C) on p is stronger than that of the ethine flow rate (D) for the chosen parameter ranges. The slight two-factor interaction of the gas flows might result from the fact that the measurement reading of the thermal conductivity vacuum meter is not fully independent of the gas species and their respective partial pressures. The positive effect of the sputtering power (A), which should result from an increased release of sputtered atoms, and the negative effect of the bias voltage (B), which might result from increased absorption of gas species at the charging rack due to elevated plasma-enhanced chemical reactivity, are not sufficiently strong and not clearly pronounced to be significant. The fact that the resulting total pressure is not fully explained by the significant effects of the two gas flows can likely be ascribed to the non-significant effects and interactions of the other two factors, sputtering power and bias voltage, as well as disturbance variables, like the release rate of residual gases from the walls of the vacuum chamber, which always hold small amounts of unintentionally deposited more or less porous coating material.
Figure 5. Main effect plots and Pareto charts of standardized effects showing the relationship between the varied deposition parameters and the measured process variables: Total pressure (a), sputtering voltage (b) and bias current (c).
Coatings 04 00772 g005

4.1.2. Sputtering Voltage

Even for power-regulated sputtering processes, the actual sputtering voltage U sputter is an important process variable. The reason is that it decisively influences the impact energy of the argon ions on the target. Hence, besides the chemical composition of the target’s near-surface region, it is a strong influential factor affecting the sputtering yield, as well as the kinetic energy of the sputtered atoms and molecules [33]. Since between the different batches, there is a considerable variation of U sputter , correspondingly, a variation of the energy of the film forming atoms and molecules and, thus, an influence on the micro- and nanostructure of the deposited coating can be anticipated. Additionally, there should also be a non-negligible interaction with the total pressure that determines the mean free path length of the transport phase.
As expected, the statistical evaluation (Figure 5b) shows that U sputter does not only depend on P sputter , but also on the flow rates ϕ ( Ar ) and ϕ ( C 2 H 2 ) , as well as the interactions of these three factors. Not surprisingly, U sputter is proven to be independent of the bias voltage applied to the charging rack. The strong negative effect of the argon flow rate (C) can be explained by the increase in the argon-partial pressure going along with an increased electrical conductivity of the glow discharge plasma. The positive effect of P sputter can be trivially reduced to the fact that an increase in the discharge current requires an increased voltage as its cause. In contrast to the argon flow rate, the ethine flow rate has a quadratic effect (D 2 ) on U sputter , whereby, for ϕ ( C 2 H 2 ) = 28 sccm, on average, a maximum of U sputter is reached. A qualitatively similar dependence of U sputter on the precursor flow rate in reactive magnetron sputtering of a WC target in argon-ethine atmosphere, at a comparable voltage level ( U sputter = 490 660 V), was also reported by Bewilogua and Dimigen [15]. They explained the initially observed rise in the voltage with increasing ethine flow rate and at constant power through a decreased secondary electron emission due to the target being increasingly covered with carbon. According to them, the drop in the voltage after the maximum is reached can be attributed to the increasing contribution of ethine to the plasma density and the correspondingly increased electrical conductivity. Additionally, it can be assumed that, after the voltage maximum is reached, the thickness of the carbon-rich reaction layer, forming on the target surface, grows increasingly weaker with further increasing discharge power. This should result in the secondary electron emission decreasing less and less. The observed significant two-factor interactions could also be related to the varying reactivity and conductivity of the glow discharge plasma. In this context, it should be added that, in preparatory work, ethine flow rates of ϕ ( C 2 H 2 ) > 70 sccm were found to result in the formation of powder due to an obviously excessive chemical reactivity at the sputtering cathode. Summing up, it can be said that a high sputtering voltage and hence a high initial kinetic energy of the sputtered species can be reached by:
  • a low argon flow rate ϕ ( Ar ) ,
  • a high sputtering power P sputter and/or
  • a medium value of the ethine flow rate ϕ ( C 2 H 2 ) ,
insofar as the corresponding parameter settings do not affect the process stability.

4.1.3. Bias Current

The negative bias voltage U bias applied to the substrates is an important control parameter in unbalanced magnetron sputtering, as it causes an increased ion bombardment of the growing film, promoting a denser microstructure. Further, in reactive unbalanced magnetron sputtering, a sufficiently high bias voltage can enhance the reactivity of the precursor at the substrate surfaces. The bias current I bias can be regarded as an easy to measure approximate quantity describing the flux of incident ions, which are usually single positive charged. However, besides the actual ion current, I bias also comprises a superimposed current due to the emission of secondary electrons [34]. As is to be expected, the statistical evaluation (Figure 5c) proves that, in the first place, I bias depends on a positive effect of its cause, U bias (B). The linear effect has a superimposed quadratic proportion (B 2 ), which is due to a saturation of I bias at U bias 130 V. This is similar to the ion saturation current of a Langmuir probe within a low-density plasma [35,36]. Hence, it can be assumed that, at U bias 130 V, most of the available ions are extracted from the Debye sheath at the substrates, respectively the charging rack. Therefore, the further slight increase in the bias current might be due to the emission of secondary ions increasing with increased energy of the incident ions. The sputtering power also has a positive, but less pronounced, effect (A). This is explained by the fact that, with increasing discharge power, ionization within the glow discharge zone, which, due to the unbalanced magnetron configuration, extends from the cathode to the substrates, is increased, resulting in an elevated ion current that can be extracted at the charging rack.

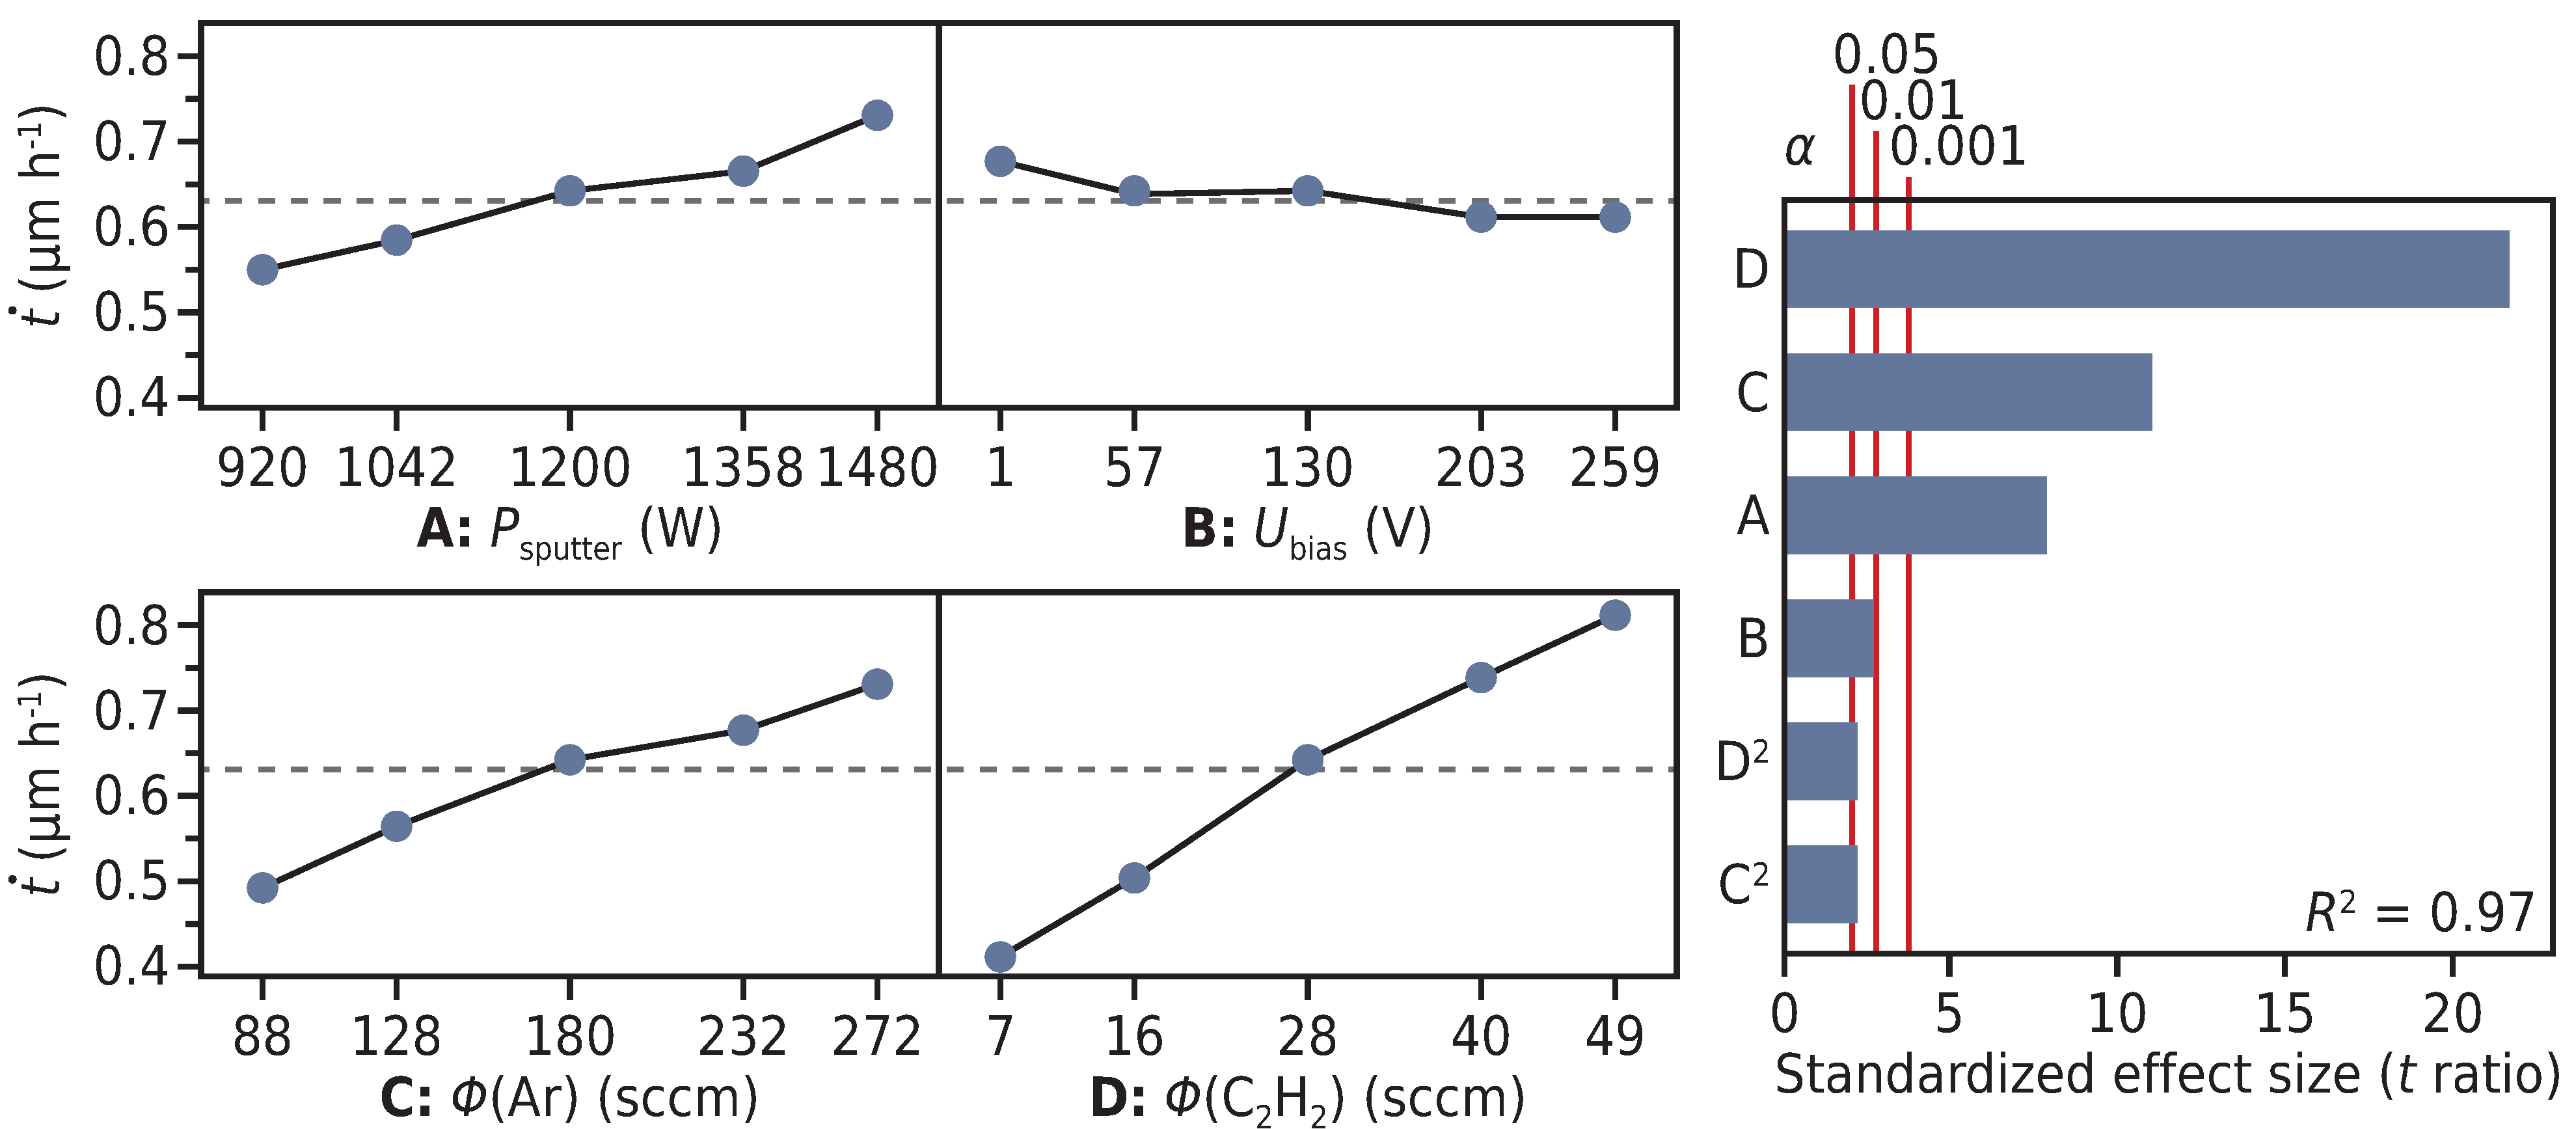
4.2. Deposition Rate

Figure 6 shows that all four factors significantly and also independently influence the deposition rate of the a-C:H:W coatings. The ethine flow rate has the strongest effect (D). With ascending ethine flow rate, the deposition rate approximately linearly increases. A comparison between the deposition rate at the lowest and at the highest factor level of ϕ ( C 2 H 2 ) shows that, within this parameter range, t ˙ almost doubles (see also Figure 2). A similarly strong increase in the deposition rate with increasing ethine flow rate, whilst other parameters are kept constant, is also reported in [11] and [15]. As already mentioned in Section 1, the reason is that, with the increasing availability of the precursor, the reactive component of the film deposition process is enhanced, resulting in an increased carbon content of a-C:H:W [10,12,37] and a decreased film density [12].
The results of the present study show that, besides the ethine flow rate, also the argon flow rate (C) and the sputtering power (A) have an extremely significant effect on the deposition rate. These positive effects of the two factors should generally be related to an increased sputtering rate due to a greater availability, respectively an increased energy, of argon ions. At raised sputtering power, the stronger reactivity of the hydrocarbon precursor due to the enhanced excitation of the glow discharge plasma and the contained precursor molecules should also contribute to an increased deposition rate. Further, for elevated argon flow rates, the reduction of the mean free path length of the transport phase, which leads to a decreased energy of the film-forming species, resulting in a less dense micro- and nanostructure of the coating, should also increase the apparent deposition rate.
In comparison to the other main effects, the effect of the bias voltage (B) is rather weak. This indicates that neither resputtering [38] nor compaction mechanisms caused by energetic ions play an important role, nor are being compensated by enhanced reactive film growth at the substrates. This is in general agreement with the findings of Pujada and Janssen [12] that, depending on the ethine flow rate, the density of reactively-sputtered a-C:H:W is not or only weakly increased if the bias voltage is elevated from 0 to 140 V.
The quadratic proportions of the effects of the argon (C 2 ) and the ethine flow rate (D 2 ) are significant, but comparatively weak. The high coefficient of determination R 2 = 0.97 indicates that a regression model, which can be associated with the significant effects shown in Figure 6, almost completely describes the relationship between the four varied deposition parameters and the deposition rate of the a-C:H:W films.
Figure 6. Main effect plot and Pareto chart of standardized effects showing the relationship between the varied deposition parameters and the deposition rate. It is most strongly influenced by the ethine and argon flows, as well as the sputtering power.
Coatings 04 00772 g006

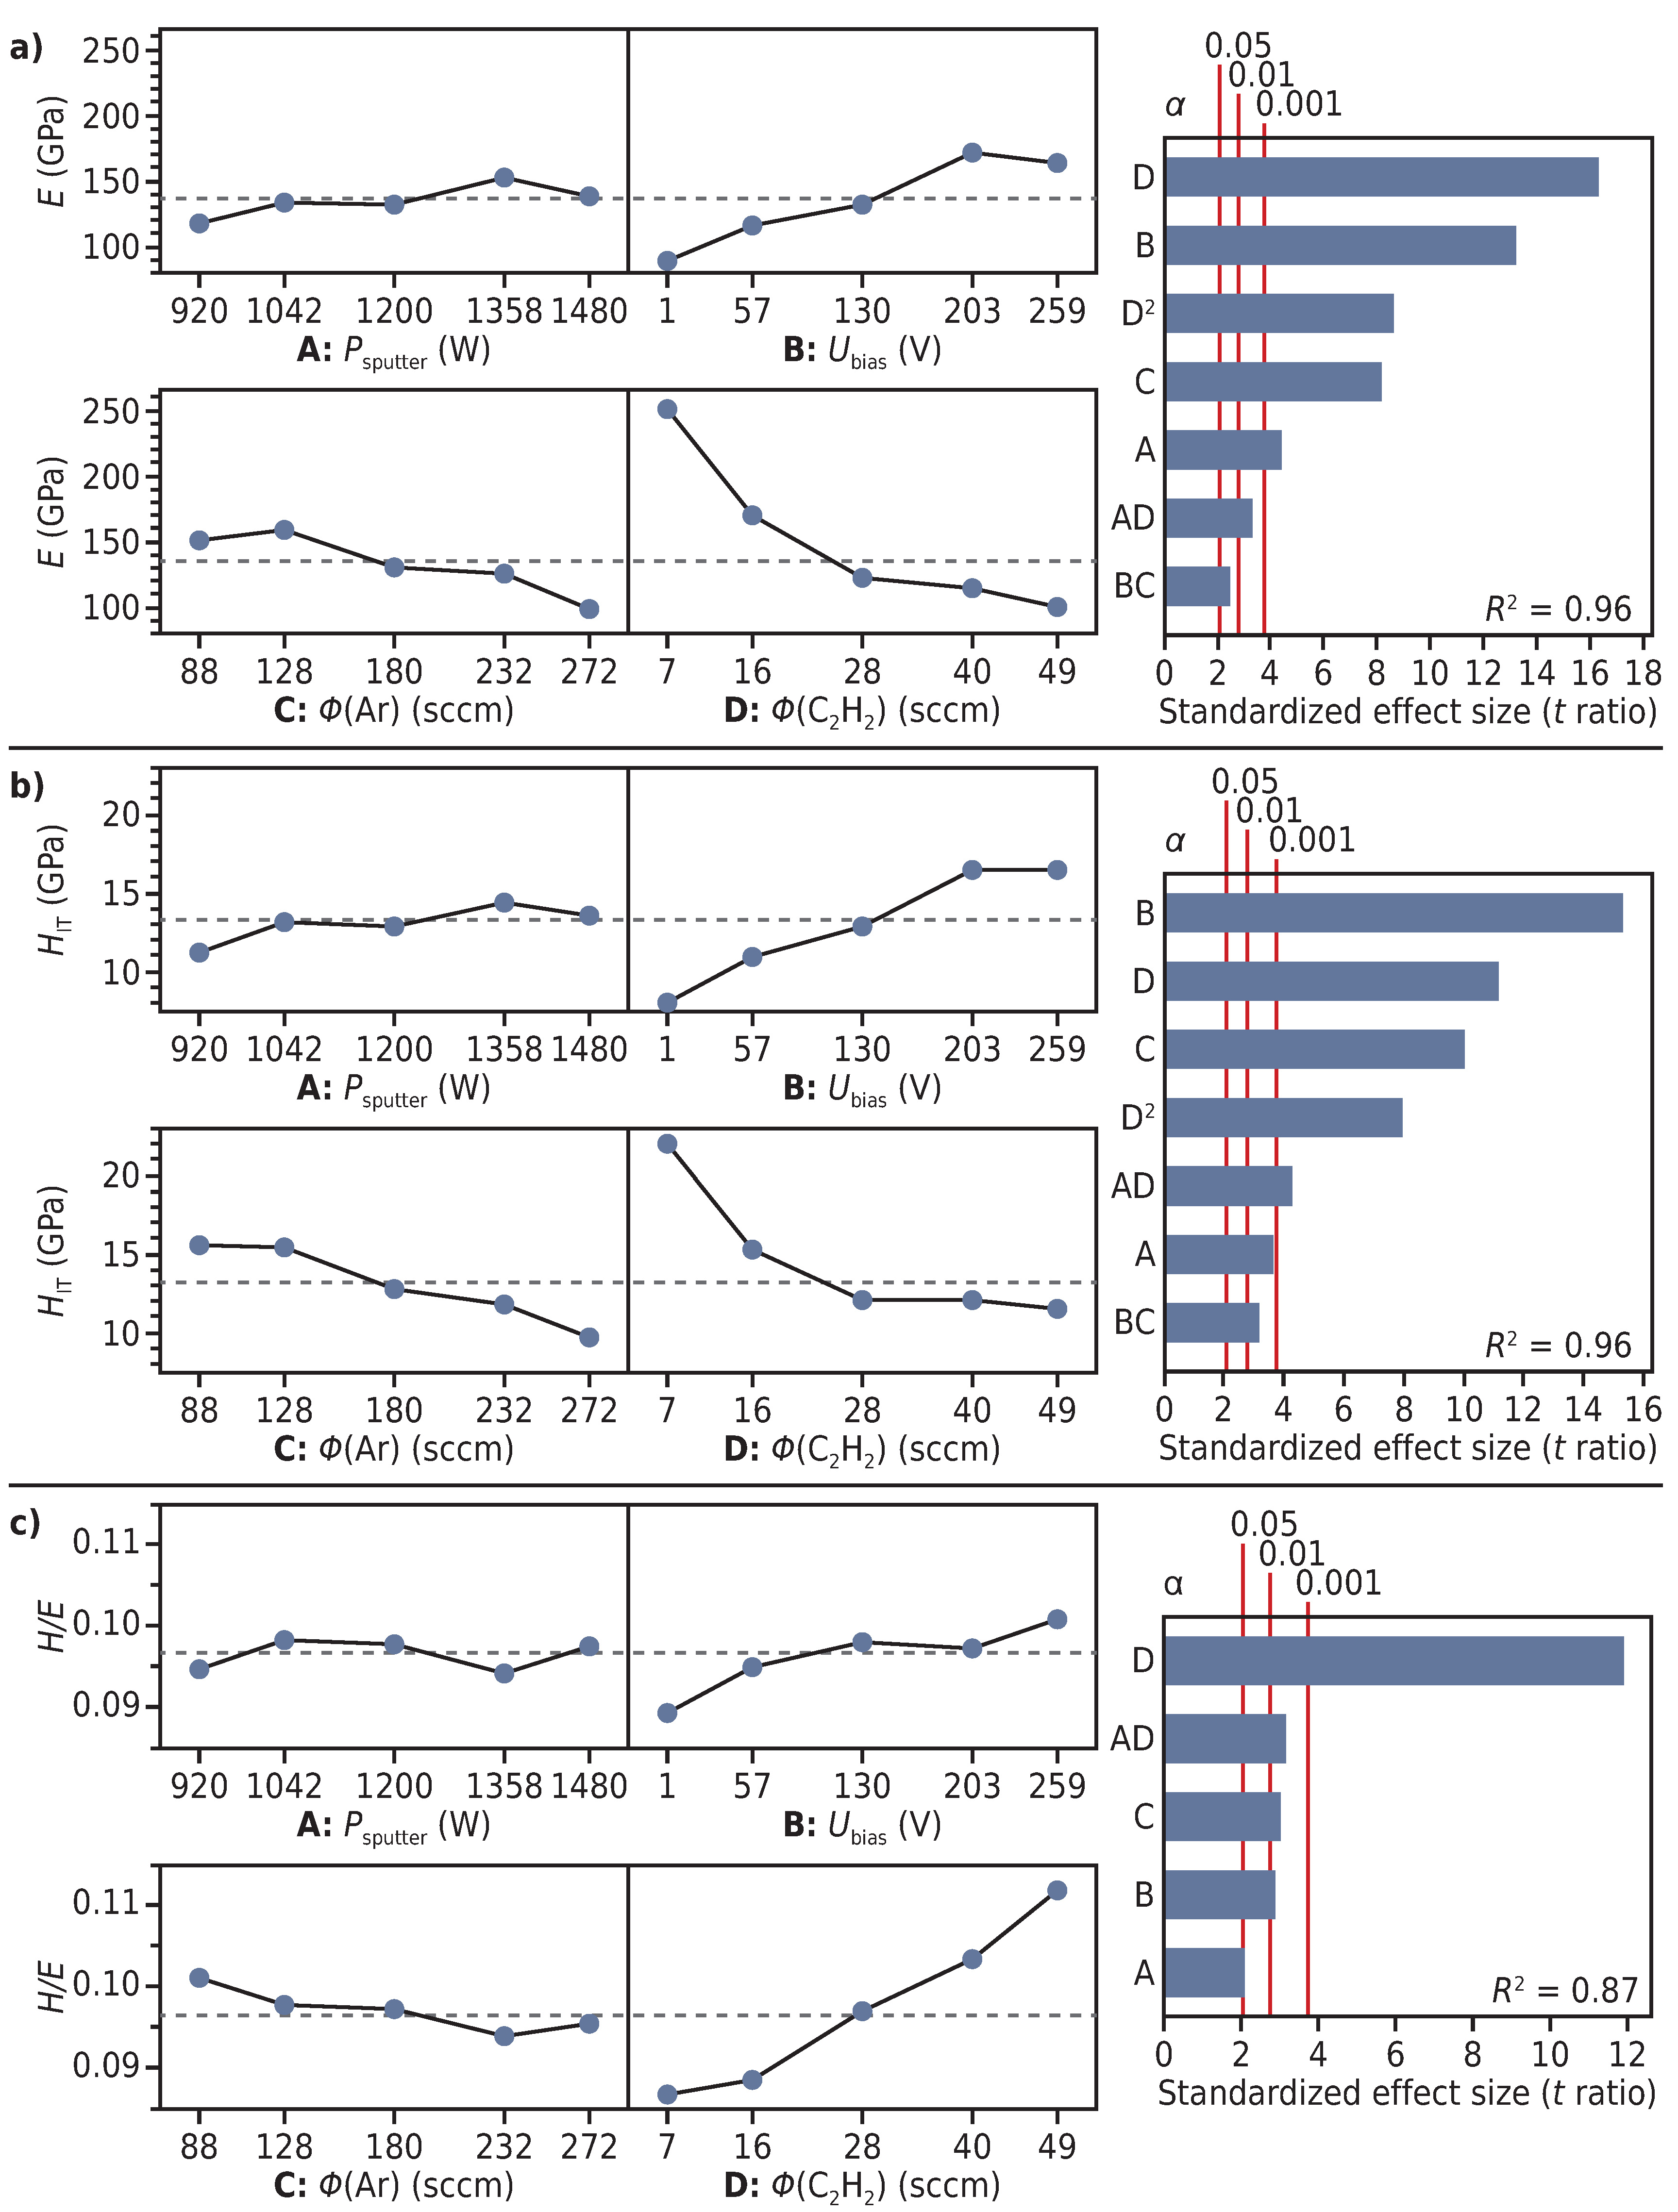
4.3. Young’s Modulus and Indentation Hardness

The range of measured values of the Young’s modulus of the a-C:H:W variants of E = 80 253 GPa is in good agreement with those published by other authors ( E = 92 143 GPa [11]; E = 140 240 GPa [5]). The same applies to the measured values of the indentation hardness in the range of H IT = 7.8 22.0 GPa. Hardness values documented in the literature are almost entirely covered ( H IT = 8 17 GPa [13]; H IT = 8 18 GPa [5]; H IT = 11 14 GPa [11]; H IT = 16 23 GPa [12]). As shown in Figure 7, there is a very strong correlation between E and H IT . This is in agreement with the typical assumption that the H / E ratio of pure amorphous carbon coatings is close to 0.1 [32]. At first glance, this suggests that there is generally not too much scope for independently adapting the Young’s modulus and hardness of a-C:H:W coatings.
Figure 7. Correlation diagram of Young’s modulus versus indentation hardness of the a-C:H:W coatings. E and H IT correlate very strongly. This is in accordance with H / E 0.1 , which is a typically-assumed ratio for pure amorphous carbon coatings.
Coatings 04 00772 g007
The results of the statistical evaluation in Figure 8a,b show that the Young’s modulus and hardness of the a-C:H:W coatings are significantly influenced by all four factors. With respect to each of these two mechanical properties, a non-linear negative effect of the ethine flow (D + D 2 ) has the greatest absolute effect size. Both its linear and its quadratic term are extremely significant. A positive linear effect of the bias voltage (B) and a negative linear effect of the argon flow rate (C) are also of extreme significance, having the second and the third largest absolute effect sizes. Further, there is a positive linear effect of the sputtering power (A). However, its absolute effect size is comparably small.
The effects of ethine flow rate and bias voltage are in agreement with the results of other authors having studied a-C:H:W. In contrast, the further effects have not received much attention yet.
Within the scope of smaller studies, an increase in hardness with increasing bias voltage is also described in [5,12,39]. A general decrease in hardness with increasing ethine flow rate is shown in [12,39]. Furthermore, [12] describes a relationship between the deposition parameters, ethine flow and bias voltage, and the mechanical properties, reduced Young’s modulus and hardness, which is similar to that observed in the present study. Nevertheless, these two effects are not equally pronounced within all areas of the process window of the present study, being defined by four factors. This is indicated by the observed interactions AD and BC, which will be discussed later. In each case, the high coefficient of determination R 2 = 0.96 proves that the established effects largely explain the relationship between the deposition parameters and E, respectively H IT .

4.3.1. Effect of the Ethine Flow Rate

According to Pujada and Janssen [12], the observed effect of the ethine flow rate can be attributed to a-C:H:W being a nanocomposite material, which consists of WC nanoparticles within an a-C:H matrix. With increasing ethine flow rate, the W/C ratio is altered in favor of the matrix going along with a change of the mechanical properties. As already mentioned in Section 1, Pujada and Janssen used the so-called rules of mixture in order to estimate an upper and lower limit of Young’s modulus of particles and matrix, assuming that a lowered W/C ratio is equivalent to a correspondingly increased volume fraction of the coating’s a-C:H matrix. They concluded that, with E 350 GPa, the WC particles of their a-C:H:W coatings should have a considerably higher Young’s modulus than the a-C:H matrix, which should have E 147 GPa, however mentioning that their estimated modulus of the WC particles is only half that of bulk hexagonal WC. Nevertheless, their estimation is in general agreement with the fact that the WC coating ( E = 283 GPa) investigated in the present study is about 12 % stiffer than the stiffest a-C:H:W coating V23 ( E = 253 GPa), which, at the same time, is the variant deposited at the lowest ethine flow rate ϕ ( C 2 H 2 ) = 7 sccm. On the other side of this argument, this means that the a-C:H:W variants with a low Young’s modulus, like V13 and V14 ( E 80 GPa), should have an a-C:H matrix of very low stiffness. However, this is also plausible, since it is known that pure a-C:H coatings can be produced with Young’s moduli down to 25 GPa [1].
Pujada and Janssen [12] stress that the rules of mixture can also be used to explain the corresponding effect on the hardness of a-C:H:W coatings. This is in agreement with the findings of Corbella et al. [13,22], who observed an approximately linear relationship between the hardness and the tungsten content of their studied a-C:H:W coatings, which decreases with increasing ethine flow rate. The general trend in the relationship between hardness and ethine flow rate found here also agrees with these findings. However, a-C:H:W variants with relatively low hardness, like V13 and V14, and relatively high hardness, like V04 and V23, indicate that the above-mentioned rules and relationships cannot be entirely generalized. On the one hand, in view of the high hardness of the WC coating ( H IT 20 GPa), which gives a lower estimate of the hardness of WC particles, unrestricted validity of the rules of mixture should require a-C:H:W variants with H IT 8 GPa to have a matrix of rather soft a-C:H [18,19,20], as was mentioned in Section 1. On the other hand, an exclusive dependence of the hardness on the tungsten content is also in contradiction to the fact that there are two a-C:H:W variants with an about 10 % higher hardness than that of the WC coating. In these cases, the variants might have a matrix with a hardness of more than 20 GPa, as is typical for pure a-C:H coatings used in industrial applications [1]. Thus, these are indications that the actual mechanical properties of the a-C:H matrix and WC particles, as well as the chemical and nanostructural features, are more diversified as assumed by simple models.

4.3.2. Effects of the Bias Voltage and the Argon Flow Rate

Even though the observed positive effect of the bias voltage on E and H IT was also reported by other authors [5,12,39], no full explanation has been provided yet. With respect to a-C:H:W coatings, the negative effect of the argon flow (C) on E an H IT has not yet been described in the literature. Both effects have in common that they influence the energy flux towards the substrates [40]. Increasing the bias voltage intensifies the argon ion bombardment of the growing film [40]. The argon flow rate primarily influences the energy of the film forming neutral species, as the latter not only depends on the sputtering voltage U sputter , but also on the mean free path length, which is proportional to the total pressure p. In Section 4.1.1 and Section 4.1.2, it was shown that the argon flow rate ϕ ( Ar ) is the factor with the strongest effect on these two process variables. Thereby, with decreasing ϕ ( Ar ) , U sputter increases and p decreases. Consequently, the energy at which the sputtered atoms arrive at the substrates is increased by two complementary physical effects. On the one hand, the energy of the incident argon ions increases directly proportional with U sputter , which, in turn, leads to a raised mean energy of the sputtered species, which is particularly due to a greater statistical frequency of very energetic ions having a kinetic energy of more than 100 eV [41]. On the other hand, at the same time, the increase of the mean free path length with the reduction in pressure leads to a reduced probability that energetic species loose much of their kinetic energy in the transport phase due to collisions.
According to the structure zone models of Thornton [42] and Messier et al. [43], a higher energy of the film-forming species, caused by a decreased argon flow rate, as well as an intensified ion bombardment of the growing film due to increased bias voltage should result in the transition to a denser columnar microstructure of a sputtered coating. Further, in the case of a-C:H:W coatings, the raised energy of the film-forming and bombarding species should result in a decreased hydrogen content and an increased number of sp 3 -hybridized C–C bonds, analogous to the mechanisms that are known for pure a-C:H [44]. Increased density and cross-linking of the a-C:H matrix, in turn, should enhance the stiffness and yield strength of the nanocomposite. In contrast, the properties of WC particles within the matrix are likely not much influenced by an increase of the bias voltage. In the case of a-C:H:Ti coatings, which are similar to a-C:H:W, Galvan et al. [17] showed that the size of TiC particles does not vary strongly as a function of the bias voltage. It is further assumed that the mechanical properties of the carbide particles do not vary strongly either. Following this line of argument, it can be concluded that the effects of bias voltage and argon flow rate on E and H IT of the a-C:H:W coatings should be much more closely linked to the mentioned structural changes of the a-C:H matrix.
Concerning the effects of bias voltage and argon flow rate on E and H IT , there is also a significant, respectively highly significant, two-factor interaction BC. It can be traced back to the fact that the effect of U bias is more pronounced for ϕ ( Ar ) = 128 sccm than for ϕ ( Ar ) = 232 sccm. The cause is presumably that the kinetic energy of the argon ions, which are accelerated towards the substrate surface, is reduced due to the shortened mean free path length at a higher argon flow rate, whilst, as discussed in Section 4.1.3, the ion current is almost independent of the argon partial pressure.

4.3.3. Effect of the Sputtering Power

The positive effect of the sputtering power (A) on hardness and Young’s modulus should be related to an elevated sputtering rate and/or increased kinetic energy of the sputtered species. In principle, this should result in a slightly raised tungsten content and/or density and cross-linking of the a-C:H:W coatings, depending on the level of target poisoning. In comparison to the other main effects, the effect of P sputter has a rather small absolute effect size. In statistical terms, this is due to a significant two-factor interaction with the ethine flow rate (AD). The effect of P sputter is only pronounced at the low factor level of the ethine flow rate ϕ ( C 2 H 2 ) = 16 sccm, whilst at high ϕ ( C 2 H 2 ) = 40 sccm, it is close to zero. Therefore, in terms of the deposition process, the small effect size is related to the changed characteristic of the reactive sputtering process at ϕ ( C 2 H 2 ) > 28 sccm, which was already discussed in Section 4.1.2. At sufficiently low values of ϕ ( C 2 H 2 ) , carbon-rich reaction products forming on the target surface are sputtered promptly. Hence, the sputtering rate of WC increases with P sputter , resulting in the increased hardness and Young’s modulus of the a-C:H:W coatings due to a higher volume fraction of hard and stiff WC particles. In contrast, at high ethine flow rates, the intense formation of a carbon-rich reaction layer on the target surface limits the sputtering of tungsten carbide more strongly than at low precursor flow rates. Hence, the tungsten content, which, due to the high availability of hydrocarbon species, should already be reduced in favor of the softer and more elastic a-C:H matrix, does likely not change much at altered sputtering power. Further, it is to be assumed that, under these conditions, the chemical and structural composition of the matrix is also largely independent of P sputter .
Figure 8. Main effect plots and Pareto charts of standardized effects showing the relationship between the varied deposition parameters and the mechanical properties of the a-C:H:W coatings: Young’s modulus (a), indentation hardness (b) and H / E ratio (c).
Coatings 04 00772 g008

4.4. H / E Ratio

Despite the very strong correlation between Young’s modulus and hardness (Figure 7), the H / E ratio of the different a-C:H:W variants is not exactly identical, but actually varies in the range of 0.084 to 0.112. Further, detailed comparison of Figure 8a,b shows that the influence of the deposition parameters on modulus and hardness differs slightly in the relative effect size and the significance level of the identified effects. The cause with regard to process control is revealed by dedicated statistical analysis of the relationship between the deposition parameters and the H / E ratio. According to Figure 8c, especially the ethine flow rate (D) has an extremely significant effect on H / E . Therefore, the obvious slight scatter in the correlation diagram (Figure 7) is definitely not primarily caused by random influences. Additionally, the results of the present study indicate that this effect of ϕ ( C 2 H 2 ) , which was also reported by Czyżniewski [39], is more pronounced at low sputtering power (two-factor interaction AD). An increase in the ethine flow rate results in an increased and, hence, more favorable H / E ratio. However, for ϕ ( C 2 H 2 ) = 16 28 sccm, it goes along with a noticeable decrease of the average hardness (Figure 8b). Since the H / E ratio of the WC coating is lower than that of any a-C:H:W variant, the effect of ϕ ( C 2 H 2 ) should basically be connected with the volume fraction of the a-C:H matrix. In contrast, the weaker effects of the bias voltage (B) and the argon flow rate (C) improve the H / E ratio through a disproportionate decrease of E compared to H IT . Both of these effects might be related to the chemical and structural composition of the a-C:H matrix, namely the sp 2 /sp 3 ratio and hydrogen content.

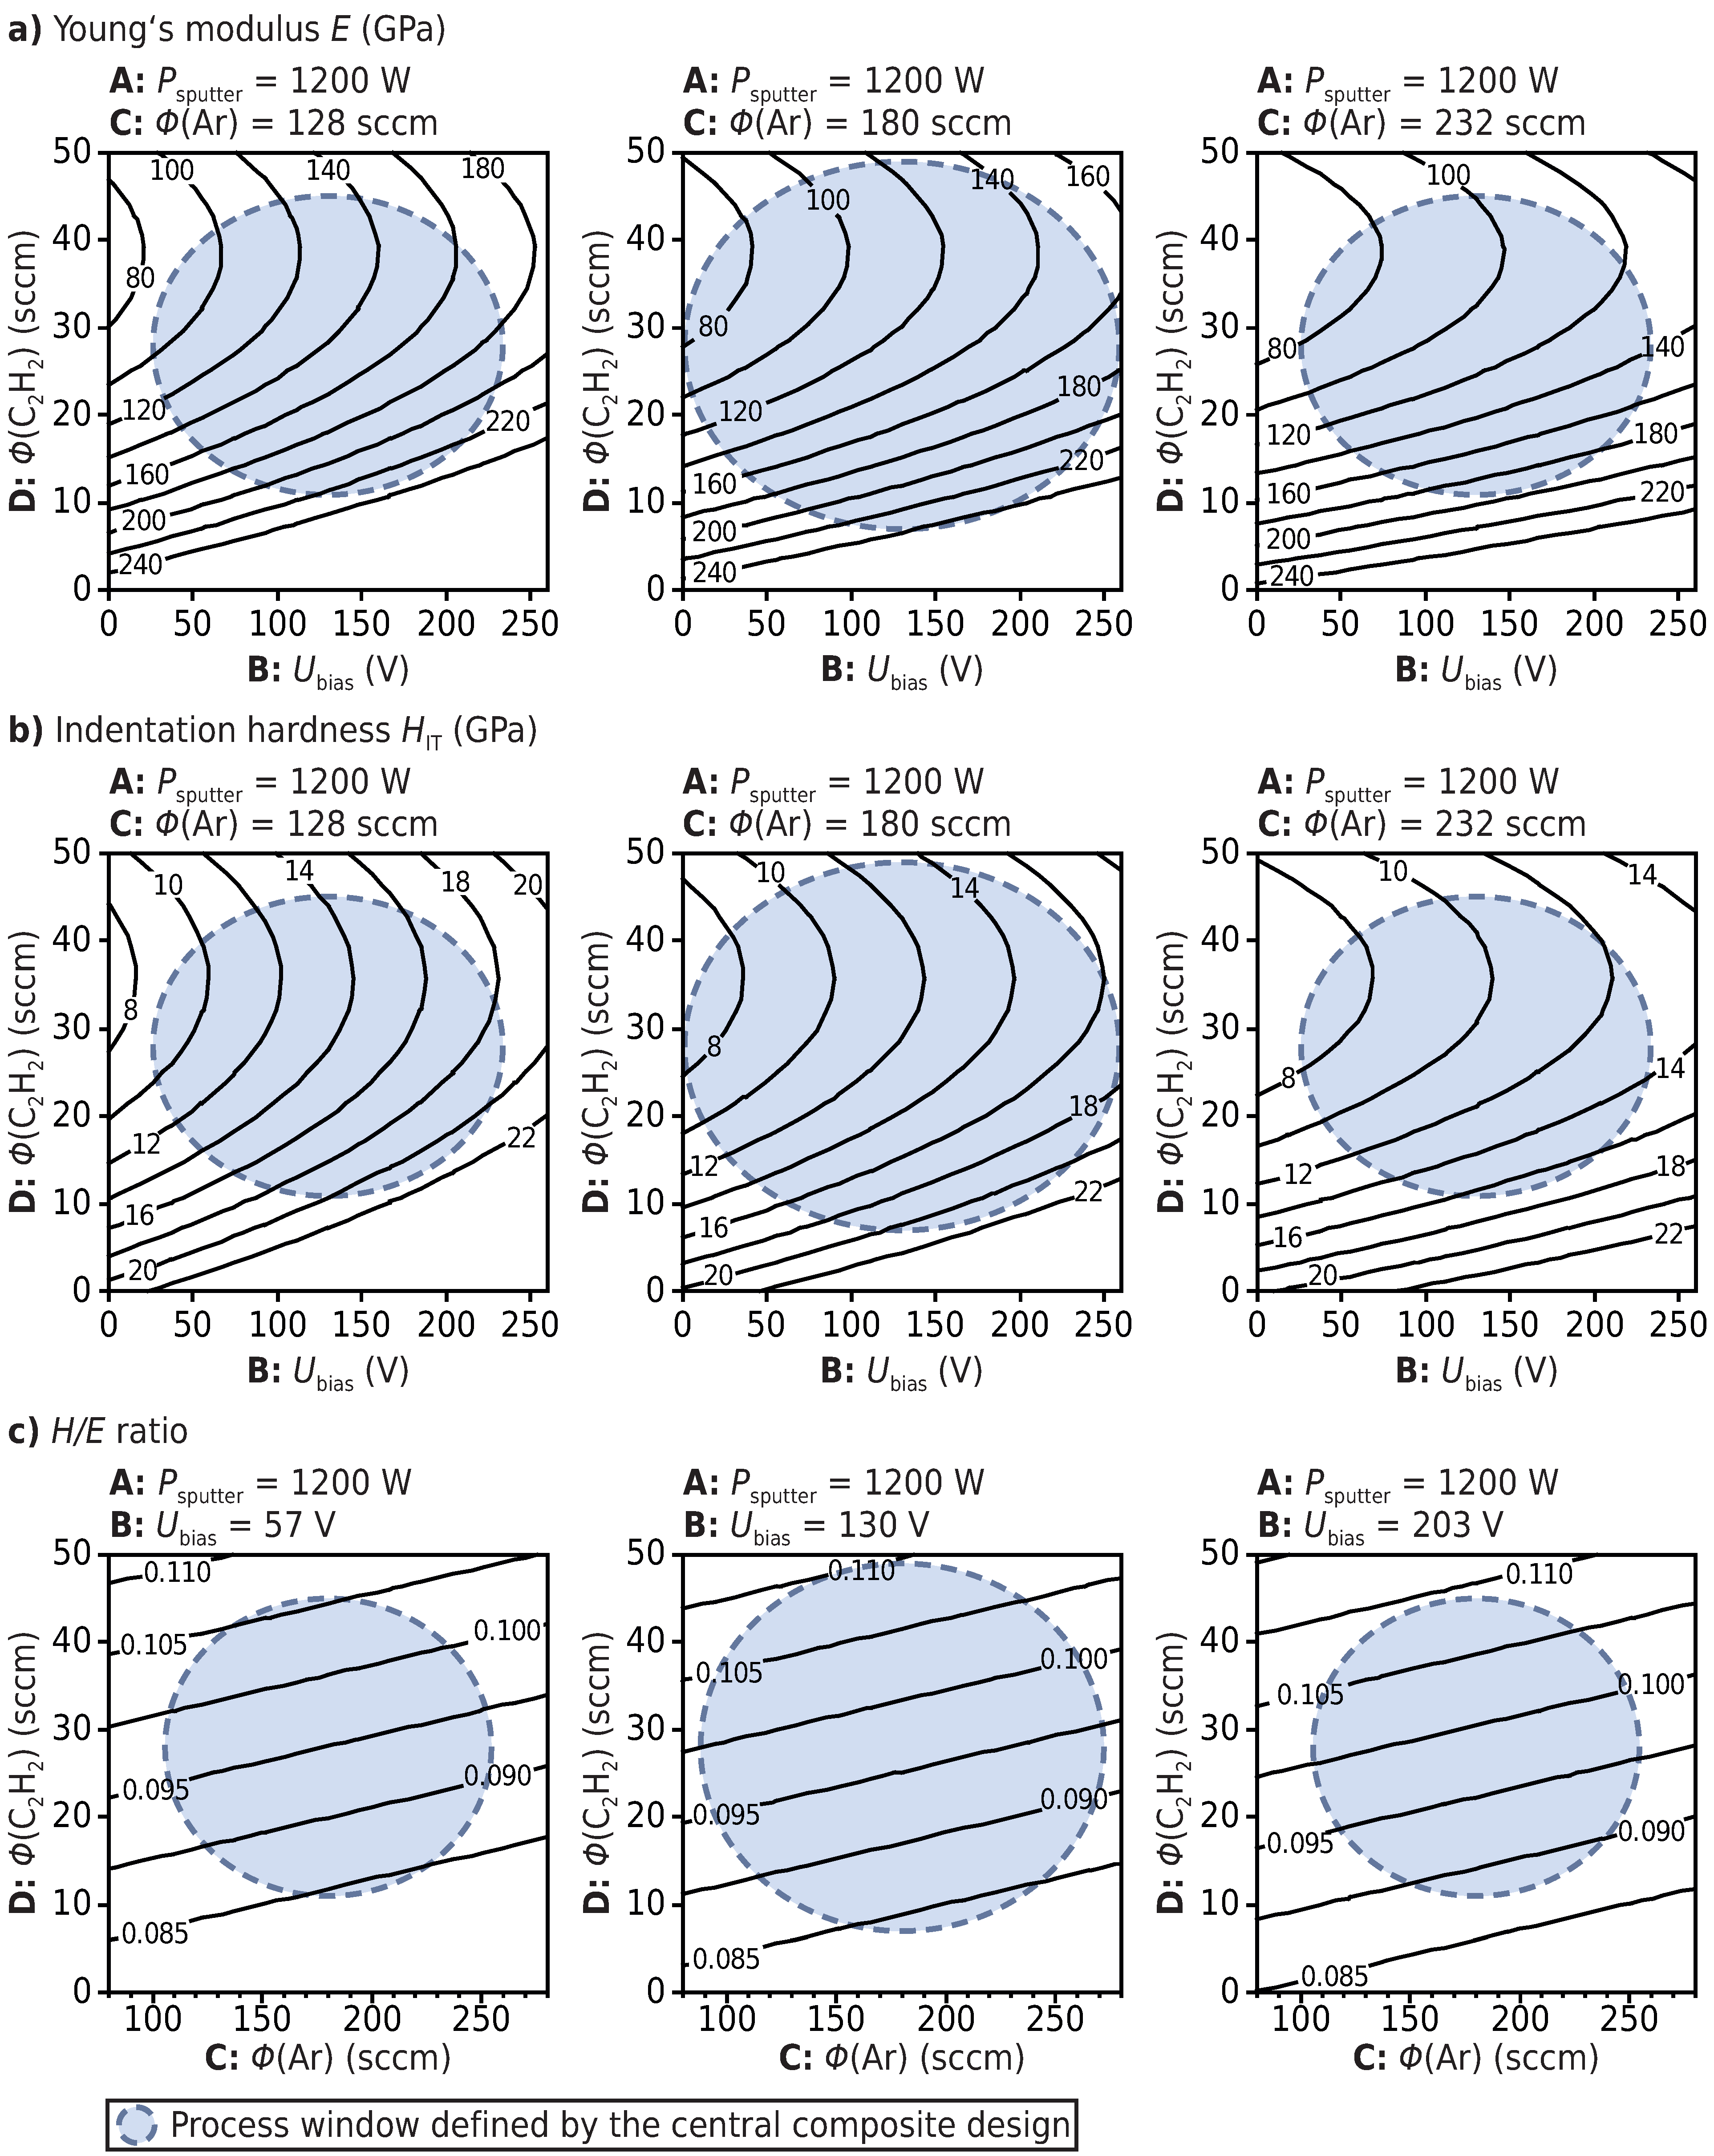
5. Graphical Summary of the Empirical-Statistical Relationships by Contour Line Plots

To give a graphical summary, Figure 9 shows contour line plots of the statistical relationship between the studied mechanical properties and the three most influential deposition parameters, ethine flow rate ϕ ( C 2 H 2 ) , bias voltage U bias and argon flow rate ϕ ( Ar ) . The least influential parameter, sputtering power P sputter , is held constant at the medium factor level of 1,200 W. As can be seen in Figure 9a,b, a-C:H:W variants of equal Young’s modulus, respectively hardness, are located on parabolas with respect to the plot’s coordinate axes, U bias and ϕ ( C 2 H 2 ) . These relationships are similar to those described in [45,46] for pure a-C:H coatings. With increasing ϕ ( Ar ) (plots from left to right), parabolas of equal modulus, respectively hardness, are shifted towards higher values of U bias , and pulled apart, i.e., the increment in U bias that is required to cause a certain increase in hardness and stiffness is elevated. The parabola shape of the contour lines means that, for any given set points of the bias voltage and the argon flow rate, a-C:H:W coatings with a defined value of hardness, respectively Young’s modulus, can generally be obtained by two substantially different set points of the ethine flow rate.
Figure 9c shows that a-C:H:W variants with an equal H / E ratio are located on oblique straight lines of a positive slope with respect to the two process parameters, argon and ethine flow rate, which have the strongest influence on this derived coating property. With increasing bias voltage, lines of an equal H / E ratio are shifted towards lower values of ϕ ( C 2 H 2 ) , respectively higher values of ϕ ( Ar ) . a-C:H:W coatings with an as high as possible H / E ratio, which should be favorable in terms of wear resistance, can be obtained at high ethine flow rates and, at the same time, low argon flow rates and a high level of the bias voltage. Even though chemical-structural properties of the a-C:H:W variants were not investigated, it can generally be said that such a parameter set should result in a-C:H:W coatings with a pronounced a-C:H matrix that has a comparatively strong cross-linking and a comparatively low hydrogen content.
Figure 9. Contour line plots showing the statistical relationship between the three most influential deposition parameters, ethine flow rate, bias voltage and argon flow rate, at constant sputtering power and E (a), H IT (b), as well as H / E (c) of the a-C:H:W coatings.
Coatings 04 00772 g009

6. Conclusions

Twenty five different tungsten-modified hydrogenated amorphous carbon coatings (a-C:H:W) and a tungsten carbide coating (WC) were deposited by reactive unbalanced magnetron sputtering. The deposition parameters (factors), sputtering power, bias voltage, argon and ethine flow rate, were varied according to a central composite design. The process variables, total pressure, sputtering voltage and bias current, were measured and statistically evaluated, revealing a process characteristic typical for the employed type of reactive sputtering process. Deposition rate t ˙ , Young’s modulus E and indentation hardness H IT of the coatings were determined, in each case showing very different values ( t ˙ = 0.42 0.89 µm h−1; E = 80 253 GPa; H IT = 7.8 22.0 GPa; H / E = 0.084 0.112 ), depending on the respective parameter set (factor level combination) applied for the deposition of the functional coating layer.
By statistical evaluation, all four factors were found to influence the deposition rate significantly and independently of each other, with the effect size of the ethine flow rate being the largest, that of the argon flow rate and sputtering power being medium and that of the bias voltage being the smallest. Due to its high coefficient of determination, an associated regression model should allow the reliable prediction of the coating thickness, respectively the deposition time required to obtain a-C:H:W coatings of a predefined thickness, in further work.
With regard to Young’s modulus and indentation hardness, it was found that both of these properties depend on the factors in a very similar way. In each case, ethine flow rate and bias voltage have the strongest effect, whilst the argon flow rate has a medium effect, and the sputtering power has the smallest. The effect of the ethine flow rate is non-linear and becomes less pronounced at increased levels of the ethine flow rate. Further, there are also two-factor interactions indicating that the detailed characteristic of these relationships differs in different parts of the process window. Under consideration of the relevant literature, it is to be assumed that the considerable changes in the mechanical properties that are observed on the variation of the four deposition parameters are not only related to changes in the W/C ratio of the a-C:H:W coatings, but also to changes in the chemical-structural properties of the a-C:H matrix.
Despite a generally very strong correlation of Young’s modulus and indentation hardness, it could be revealed that this derived property, which is often related to the wear resistance, is extremely significantly influenced by the ethine flow rate. Additionally, significant effects of the other three deposition parameters could be shown, with these, however, having a comparatively small effect size. Due to WC having a less favorable H / E ratio as compared to presumably carbon-rich a-C:H:W variants, the major effect of the ethine flow rate is very likely related to the W/C ratio of the a-C:H:W coatings. In contrast, the smaller effects of the other deposition parameters should be the result of the changes in the sp 2 /sp 3 ratio and hydrogen content of the a-C:H matrix. As individual effects of the deposition parameters could be identified statistically, it can be concluded that Young’s modulus and indentation hardness of a-C:H:W coatings can generally be adapted independently. This allows tailoring of the H / E ratio and, hence, should, in principle, enable a targeted enhancement of the wear resistance of such coatings.

7. Outlook

Another point of interest to enhance the coating’s performance under tribological load is whether and to what extent the magnitude of the residual stresses of the a-C:H:W coatings can be adapted independently from their mechanical properties by targeted variation of selected process parameters. The first investigations concerning the residual stress state of the coatings as a function of the ethine flow rate and bias voltage have already been performed [47] and will be carried out in the future. For this purpose, a method based on combined FIB milling and digital image correlation was employed to measure the residual stress of the thin amorphous coatings deposited on steel substrates.

Acknowledgments

This work was supported by the German Research Foundation (DFG) within the scope of the Transregional Collaborative Research Centre on Sheet Bulk Metal Forming (Sonderforschungsbereich/Transregio 73) in the subproject B4 and within the project Investigation on the Microstructural Damage Mechanisms in Hydrogenated Amorphous Carbon Coating Systems (grant agreement no. Du-424/7-1). The preparation of the FIB cross-sections and the nanoindentations were performed at the Institute for General Materials Properties at Friedrich-Alexander-Universität Erlangen-Nürnberg.

Author Contributions

Harald Hetzner: design of experiments, coating deposition, statistical evaluation and interpretation of results. Christoph Schmid: nanoindentation measurements, FIB cross-sections and SEM images. Harald Hetzner, Christoph Schmid, Stephan Tremmel, Karsten Durst and Sandro Wartzack: manuscript preparation.

Conflicts of Interest

The authors declare no conflict of interest.

References

  1. Association of German Engineers (VDI). VDI 2840. Carbon films; VDI: Düsseldorf, Germany, 2012. [Google Scholar]
  2. Donnet, C.; Erdemir, A. New horizon in the tribology of diamondlike carbon films. Surf. Eng. 2008, 24, 399–401. [Google Scholar] [CrossRef]
  3. Weber, M.; Bewilogua, K.; Thomsen, H.; Wittorf, R. Influence of different interlayers and bias voltage on the properties of a-C:H and a-C:H:Me coatings prepared by reactive d.c. magnetron sputtering. Surf. Coat. Technol. 2006, 201, 1576–1582. [Google Scholar] [CrossRef]
  4. Westergard, R.; Svahn, F.; Wiklund, U. Novel load-carrying layers to support low-friction PVD coatings. Surf. Coat. Technol. 2003, 176, 14–22. [Google Scholar] [CrossRef]
  5. Strondl, C.; Carvalho, N.M.; de Hosson, J.T.M.; Krug, T.G. Influence of energetic ion bombardment on W-C:H coatings deposited with W and WC targets. Surf. Coat. Technol. 2005, 200, 1142–1146. [Google Scholar] [CrossRef]
  6. Sánchez-López, J.C.; Fernández, A. Doping and alloying effects on DLC coatings. In Tribology of Diamond-Like Carbon Films; Donnet, C., Erdemir, A., Eds.; Springer: New York, NY, USA, 2008; pp. 311–338. [Google Scholar]
  7. Voevodin, A.A. Hard DLC growth and gnclusion in nanostructured wear-protective coatings. In Tribology of Diamond-Like Carbon Films; Donnet, C., Erdemir, A., Eds.; Springer: New York, NY, USA, 2008; pp. 263–281. [Google Scholar]
  8. Hetzner, H.; Schaufler, J.; Tremmel, S.; Durst, K.; Wartzack, S. Failure mechanisms of a hydrogenated amorphous carbon coating in load-scanning tests. Surf. Coat. Technol. 2012, 206, 4864–4871. [Google Scholar] [CrossRef]
  9. Hetzner, H.; Schaufler, J.; Tremmel, S.; Durst, K.; Wartzack, S. Failure mechanisms of a tungsten-modified hydrogenated amorphous carbon coating in load-scanning tests. Surf. Coat. Technol. 2012, 212, 46–54. [Google Scholar] [CrossRef]
  10. Bewilogua, K.; Cooper, C.V.; Specht, C.; Schröder, J.; Wittorf, R.; Grischke, M. Erratum to: “Effect of target material on deposition and properties of metal-containing DLC (Me-DLC) coatings”: [Surf. Coat. Technol. 127 (2000) 224-232]. Surf. Coat. Technol. 2000, 132, 275–283. [Google Scholar] [CrossRef]
  11. Czyżniewski, A.; Gulbiński, W.; Radnćzi, G.; Szerencsi, M.; Pancielejko, M. Microstructure and mechanical properties of W-C:H coatings deposited by pulsed reactive magnetron sputtering. Surf. Coat. Technol. 2011, 205, 4471–4479. [Google Scholar] [CrossRef]
  12. Pujada, B.R.; Janssen, G.C.A.M. Density, stress, hardness and reduced Young’s modulus of W-C:H coatings. Surf. Coat. Technol. 2006, 201, 4284–4288. [Google Scholar] [CrossRef]
  13. Corbella, C.; Bertran, E.; Polo, M.C.; Pascual, E.; Andújar, J.L. Structural effects of nanocomposite films of amorphous carbon and metal deposited by pulsed-DC reactive magnetron sputtering. Diam. Relat. Mater. 2007, 16, 1828–1834. [Google Scholar] [CrossRef]
  14. Strondl, C.; Carvalho, N.M.; de Hosson, J.T.M.; van der Kolk, G. J. Investigation on the formation of tungsten carbide in tungsten-containing diamond like carbon coatings. Surf. Coat. Technol. 2003, 162, 288–293. [Google Scholar] [CrossRef]
  15. Bewilogua, K.; Dimigen, H. Preparation of W-C:H coatings by reactive magnetron sputtering. Surf. Coat. Technol. 1993, 61, 144–150. [Google Scholar] [CrossRef]
  16. Czyżniewski, A. Deposition and some properties of nanocrystalline WC and nanocomposite WC/a-C:H coatings. Thin Solid Films 2003, 61, 180–185. [Google Scholar] [CrossRef]
  17. Galvan, D.; Pei, Y.T.; de Hosson, J.T.M. Influence of deposition parameters on the structure and mechanical properties of nanocomposite coatings. Surf. Coat. Technol. 2006, 201, 590–598. [Google Scholar] [CrossRef]
  18. Fontaine, J.; Loubet, J.L.; le Mogne, T.; Grill, A. Superlow friction of diamond-like carbon films: A relation to viscoplastic properties. Tribol. Lett. 2004, 17, 709–714. [Google Scholar] [CrossRef]
  19. Lemoine, P.; Quinn, J.P.; Maguire, P.; Papakonstantinou, P.; Dougan, N. Rheological analysis of creep in hydrogenated amorphous carbon films. Thin Solid Films 2006, 514, 223–230. [Google Scholar] [CrossRef]
  20. Sánchez-López, J.C.; Donnet, C.; Loubet, J.L.; Belin, M.; Grill, A.; Patel, V.; Jahnes, C. Tribological and mechanical properties of diamond-like carbon prepared by high-density plasma. Diam. Relat. Mater. 2001, 10, 1063–1069. [Google Scholar] [CrossRef]
  21. Ferrari, A.C. Non-destructive characterization of carbon films. In Tribology of Diamond-Like Carbon Films; Donnet, C., Erdemir, A., Eds.; Springer: New York, NY, USA, 2008; pp. 25–82. [Google Scholar]
  22. Corbella, C.; Oncins, G.; Gómez, M.A.; Polo, M.C.; Pascual, E.; García-Céspedes, J.; Andújar, J.L.; Bertran, E. Structure of diamond-like carbon films containing transition metals deposited by reactive magnetron sputtering. Diam. Relat. Mater. 2005, 14, 1103–1107. [Google Scholar] [CrossRef]
  23. Bhushan, B. Principles and Applications of Tribology; Wiley-VCH: New York, NY, USA, 2013. [Google Scholar]
  24. Holmberg, K.; Matthews, A. Coatings Tribology; Elsevier: Amsterdam, The Netherlands, 2009. [Google Scholar]
  25. Leyland, A.; Matthews, A. On the significance of the H/E ratio in wear control: A nanocomposite coating approach to optimised tribological behaviour. Wear 2000, 246, 1–11. [Google Scholar] [CrossRef]
  26. Vierneusel, B.; Tremmel, S.; Wartzack, S. Effects of deposition parameters on hardness and lubrication properties of thin MoS2 films. Matwiss. Werkst. 2012, 43, 1029–1031. [Google Scholar]
  27. EN 1071-2:2002 Advanced technical ceramics—Methods of test for ceramic coatings—Part 2: Determination of coating thickness by the crater grinding method; BSI: London, UK, 2002.
  28. ISO 14577:2002 Metallic materials—Instrumented indentation test for hardness and materials parameters; ISO: Geneva, Switzerland, 2002.
  29. Matthews, P. Design of Experiments with MINITAB; ASQ Quality Press: Milwaukee, WI, USA, 2005. [Google Scholar]
  30. Miki, H.; Takeno, T.; Tagaki, T. Tribological properties of multilayer DLC/W-DLC films on Si. Thin Solid Films 2008, 516, 5414–5418. [Google Scholar] [CrossRef]
  31. Strondl, C.; van der Kolk, G.J.; Hurkmans, T.; Fleischer, W.; Trinh, T.; Carvalho, N.M.; de Hosson, J.T.M. Properties and characterization of multilayers of carbides and diamond-like carbon. Surf. Coat. Technol. 2001, 142–144, 707–713. [Google Scholar] [CrossRef]
  32. Lemoine, P.; Quinn, J.P.; Maguire, P.D.; McLaughlin, J.A. Mechanical characterization and properties of DLC films. In Tribology of Diamond-Like Carbon Films; Donnet, C., Erdemir, A., Eds.; Springer: New York, NY, USA, 2008; pp. 83–101. [Google Scholar]
  33. Ono, T.; Kenmotsu, T.; Muramoto, T. Simulation of the sputtering process. In Reactive Sputter Deposition; Depla, D., Mahieu, S., Eds.; Springer: Berlin, Germany, 2008; pp. 1–42. [Google Scholar]
  34. Baragiola, R.A.; Riccardi, P. Electron emission from surfaces induced by slow ions and atoms. In Reactive Sputter Deposition; Depla, D., Mahieu, S., Eds.; Springer: Berlin, Germany, 2008; pp. 43–60. [Google Scholar]
  35. Bradley, J.W.; Welzel, T. Process diagnostics. In Reactive Sputter Deposition; Depla, D., Mahieu, S., Eds.; Springer: Berlin, Germany, 2008; pp. 255–300. [Google Scholar]
  36. Stroth, U. Plasmaphysik; Vieweg+Teubner: Wiesbaden, Germany, 2011. [Google Scholar]
  37. Corbella, C.; Vives, M.; Pinyol, A.; Bertran, E.; Canal, C.; Polo, M.C.; Andújar, J.L. Preparation of metal (W, Mo, Nb, Ti) containing a-C:H films by reactive magnetron sputtering. Surf. Coat. Technol. 2004, 177–178, 409–414. [Google Scholar] [CrossRef]
  38. Maissel, L.I.; Schaible, P.M. Thin films deposited by bias sputtering. J. Appl. Phys. 1965, 36, 237–242. [Google Scholar] [CrossRef]
  39. Czyżniewski, A. Optimising deposition parameters of W-DLC coatings for tool materials of high speed steel and cemented carbide. Vacuum 2012, 86, 2140–2147. [Google Scholar] [CrossRef]
  40. Ekpe, S.D.; Dew, S.K. Energy deposition at the substrate in a magnetron sputtering system. In Reactive Sputter Deposition; Depla, D., Mahieu, S., Eds.; Springer: Berlin, Germany, 2008; pp. 229–254. [Google Scholar]
  41. Dembowski, H.; Oechsner, H.; Yamamura, Y.; Urbassek, M. Energy distributions of neutral atoms sputtered from Cu, V and Nb under different bombardment and ejection angles. Nuc. Instr. Meth. Phys. Res. B 1986, 18, 464–470. [Google Scholar] [CrossRef]
  42. Thornton, J.A. Influence of apparatus geometry and deposition conditions on the structure and topography of thick sputtered coatings. J. Vac. Sci. Technol. 1974, 11, 666–670. [Google Scholar] [CrossRef]
  43. Messier, R.; Giri, A.P.; Roy, R.A. Revised structure zone model for thin film physical structure. Vac. Sci. Technol. A 1984, 2, 500–503. [Google Scholar] [CrossRef]
  44. Robertson, J. Diamond-like amorphous carbon. Mater. Sci. Eng. R 1984, 27, 129–281. [Google Scholar] [CrossRef]
  45. Sønderby, S.; Berthelsen, A.N.; Almtoft, K.P.; Christensen, B.H.; Nielsen, L.P.; Bøttiger, J. Optimization of the mechanical properties of magnetron sputtered diamond-like carbon coatings. Diam. Realt. Mater. 2011, 20, 682–686. [Google Scholar] [CrossRef]
  46. Diesselberg, M.; Stock, H.-R.; Mayr, P. Friction and wear behaviour of PVD chromium nitride supported carbon coatings. Surf. Coat. Technol. 2004, 188–189, 612–616. [Google Scholar] [CrossRef]
  47. Schmid, C.; Hetzner, H.; Tremmel, S.; Hilpert, F.; Durst, K. Tailored mechanical properties and residual stresses of a-C:H:W Coatings. Adv. Mat. Res. 2014, 996, 14–21. [Google Scholar] [CrossRef]

