Article

Mechanical Properties and Oxidation Behavior of Multilayered Hf–Si–N Coatings

1
Department of Materials Engineering, Ming Chi University of Technology, New Taipei 24301, Taiwan
2
Center for Plasma and Thin Film Technologies, Ming Chi University of Technology, New Taipei 24301, Taiwan
3
Institute of Materials Engineering, National Taiwan Ocean University, Keelung 20224, Taiwan
*
Author to whom correspondence should be addressed.
Coatings 2018, 8(10), 354; https://doi.org/10.3390/coatings8100354
Submission received: 6 September 2018 / Revised: 21 September 2018 / Accepted: 2 October 2018 / Published: 3 October 2018
(This article belongs to the Special Issue Advanced Thin Films Deposited by Magnetron Sputtering)

Abstract

:
Monolithic Hf–Si–N coatings and multilayered Hf–Si–N coatings with cyclical gradient concentration were fabricated using reactive direct current magnetron cosputtering. The structure of the Hf–Si–N coatings varied from a crystalline HfN phase, to a mixture of HfN and amorphous phases and to an amorphous phase with continuously increasing the Si content. The multilayered Hf48Si3N49 coatings exhibited a mixture of face-centered cubic and near-amorphous phases with a maximal hardness of 22.5 GPa, a Young’s modulus of 244 GPa and a residual stress of −1.5 GPa. The crystalline phase-dominant coatings exhibited a linear relationship between the hardness and compressive residual stress, whereas the amorphous phase-dominant coatings exhibited a low hardness level of 15–16 GPa; this hardness is close to that of Si3N4. Various oxides were formed after annealing of the Hf–Si–N coatings at 600 °C in a 1% O2–99% Ar atmosphere. Monoclinic HfO2 formed after Hf54N46 annealing and amorphous oxide formed for the oxidation-resistant Hf32Si19N49 coatings. The oxidation behavior with respect to the Si content was investigated by using transmission electron microscopy and X-ray photoelectron spectroscopy.

1. Introduction

The group IVB (Ti, Zr and Hf) metal nitride coatings possess extraordinary characteristics of hardness [1,2,3,4], corrosion resistance [5,6,7] and decoration [8], but demonstrate inadequate oxidation resistance [9,10]. Ti–Si–N [11,12] and Zr–Si–N [13,14] have displayed enhanced oxidation resistance by Si addition. Although Hf–Si–N coatings have been applied as gate electrodes [15,16], corrosion-resistant films [17] and biocompatible films [18], few studies have focused on improving their oxidation resistance. In our previous study [19], Zr–Si–N coatings of 15–30 at.% Si maintained near-amorphous phases as examined through X-ray diffraction and exhibited excellent oxidation resistance at 600 °C in a 1% O2–99% Ar atmosphere for up to 100 h of annealing. These Zr–Si–N coatings with a cyclical gradient concentration fabricated using cosputtering with a low substrate holder rotation speed formed a multilayered structure consisting of alternatively-stacked high- and low-Si-content sublayers, which exhibited the characteristics of high oxidation resistance and mechanical properties, respectively [19]. The significant oxidation resistance was attributed to the lack of oxygen diffusion paths in near-amorphous phases without evident grain boundaries [20]. In this study, the effects of Si-addition on the mechanical properties and oxidation resistance of Hf–Si–N coatings periodically stacked of various Si-content sublayers were investigated. The phase and bonding characteristics’ variations after annealing were examined.

2. Materials and Methods

Hf–Si–N coatings were prepared on Si substrates at room temperature through reactive direct current magnetron cosputtering. Figure 1a shows the schematic of the cosputtering equipment (MGS-500, JUNSUN, New Taipei, Taiwan). Monolithic and multilayered Hf–Si–N coatings were prepared at substrate holder rotation speeds of 0 and 5 rpm, respectively. The monolithic coatings were deposited with a Ti interlayer. The Ti interlayer was deposited using an Ar flow of 20 sccm in a working pressure of 0.4 Pa, a substrate holder rotation speed of 5 rpm and a DC power of 200 W for 9 min, which formed an interlayer of approximately 100 nm. The target-to-substrate distance was kept at 90 mm for all sputtering runs. The flow rates of Ar and N2 gas were 12 and 8 sccm for fabricating nitride coatings in a working pressure of 0.4 Pa, respectively. The sample positions are labeled in Figure 1b. Targets of 99.95% pure Ti, 99.95% Hf and 99.999% Si with diameters of 50.8 mm were adopted as source materials. The sputtering equipment and cosputtering processes for fabricating Hf–Si–N coatings were similar to those for preparing Ta–Si–N and Zr–Si–N coatings, described in detail in previous studies [19,21]. The annealing environment was 1% O2–99% Ar at 600 °C; this condition was an oxidation-promoting atmosphere for evaluating the performance of protective coatings on glass molding dies [19,21].
Chemical composition analysis of the samples was carried out with a field-emission electron probe microanalyzer (FE-EPMA, JXA-8500F, JEOL, Akishima, Japan). The thickness of coatings was evaluated by field emission scanning electron microscopy (FE-SEM, S4800, Hitachi, Tokyo, Japan). An X-ray diffractometer (XRD, X’Pert PRO MPD, PANalytical, Almelo, The Netherlands) with Cu Kα radiation was used to analyze the phases of the coatings, using the grazing incidence technique with an incidence angle of 1°. The hardness (H) and elastic modulus (E) values of coatings were measured using a nanoindentation tester (TI-900 Triboindenter, Hysitron, Minneapolis, MN, USA) equipped with a Berkovich diamond probe tip. The indentation depth was 80 nm. The H and E values were calculated based on the Oliver and Pharr method [22]. The residual stress of the films was calculated using Stoney’s equation [23]:
σ f t f = E S h S 2 6 ( 1 ν S ) R f
where σf is the in-plane stress component in the film, tf is the thickness of the film, ES is the Young’s modulus of the Si substrate (130.2 GPa), νS is the Poisson’s ratio for the Si substrate (0.279) [24], hS is the thickness of the substrate (525 μm) and Rf is the radius of the curvature of the film. The nanostructure of the annealed coatings was examined using transmission electron microscopy (TEM, JEM-2010F, JEOL, Tokyo, Japan). TEM samples were prepared by applying a focused ion beam system (FEI Nova 200, Hillsboro, OR, USA). A Pt layer was deposited to protect the free surface during sample preparation. The chemical states of the constituent elements were examined by using an X-ray photoelectron spectroscope (XPS, PHI 1600, PHI, Kanagawa, Japan) with an Mg Kα X-ray beam (energy = 1253.6 eV and power = 250 W) operated at 15 kV. The calibration of the binding energy scale was done with the C 1s line (284.6 eV) from the carbon contamination layer. An Ar+ ion beam of 3 keV was used to sputter the coatings for depth profiling. The sputter etching rate was set at 9.5 or 25.6 nm/min for SiO2.

3. Results

3.1. As-Deposited Hf–Si–N Coatings

3.1.1. Monolithic Hf–Si–N Coatings

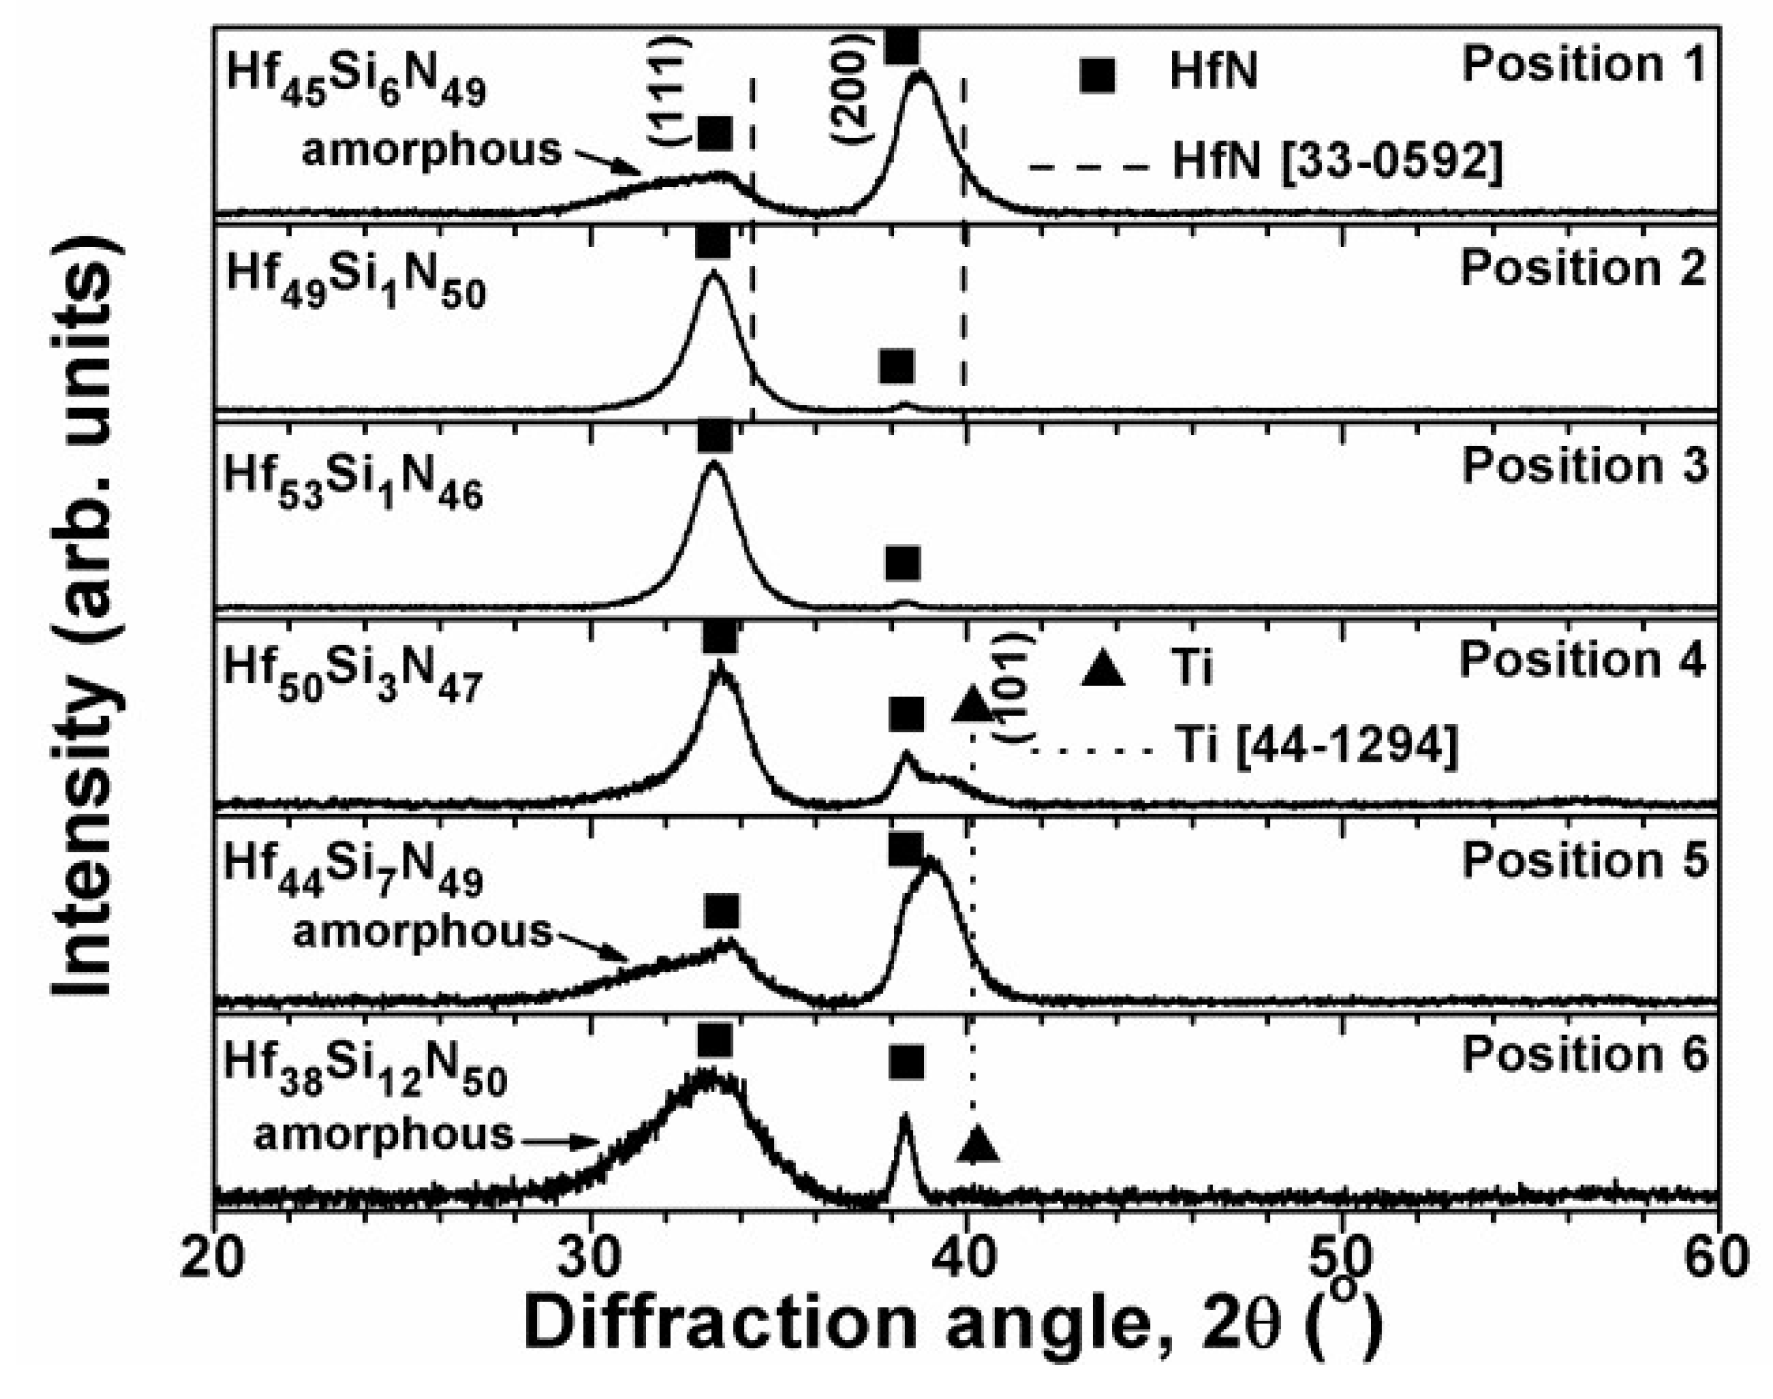
Table 1 shows the chemical compositions and coating thicknesses of six monolithic samples prepared using a WHf of 250 W and a WSi of 25 W for 85 min while the substrate holder was not rotated. The positions of these coatings on the substrate holder are labeled in Figure 1b. The oxygen content in the as-deposited states was 0.6–1.9 at.%. The samples were designated in the form HfxSiyN100-x-y. Figure 2 illustrates the XRD patterns of the six monolithic Hf–Si–N coatings. The samples with 1 at.% Si at Positions 2 and 3 exhibited face-centered cubic (f.c.c.) HfN (111) and (200) reflections [ICDD 00-033-0592] with evident peak shifting toward lower 2θ values. The phase diagram of Hf–N binary alloy depicted equilibrium phases of HfN, Hf3N2 and Hf4N3 [25]; moreover, a metastable Hf3N4 was reported [16,26,27,28]. The two-theta angles of the main reflections of Hf3N2 [ICDD 01-073-1114] and Hf4N3 [ICDD 01-073-1115] were 35.81° and 35.295°, respectively, which were further away from the observed reflections. The sample with 3 at.% Si at Position 4 exhibited a mixture of HfN and Ti phases. The detected Ti reflections for the samples at Positions 4–6 were due to a low coating thickness level of 628–667 nm. The samples with 6–7 at.% Si at Positions 1 and 5 exhibited a mixture of HfN, Ti and near-amorphous phases, and the dominant reflection of the f.c.c. phase was HfN (200). The sample with 12 at.% Si at Position 6 had an X-ray amorphous phase-dominant structure accompanied by HfN and Ti reflections. Table 1 presents the mechanical properties and residual stress values of the monolithic Hf–Si–N coatings. The hardness of the monolithic Hf–Si–N coatings decreased with increasing Si content. The monolithic Hf–Si–N coatings with 1–3 at.% Si exhibited high mechanical properties (21.3–21.8 GPa) and compressive residual stress (−1.6 to −2.0 GPa) accompanied by evident HfN (111) reflections (Figure 2).

3.1.2. Multilayered Hf–Si–N Coatings

The multilayered coatings were constructed by cyclical gradient concentration deposition as the substrate holder rotation speed was maintained at a low level [19,21]. According to the calculation model for multilayered Zr–Si–N [19] and Ta–Si–N [21] based on the chemical compositions and thicknesses of the monolithic coatings:
< C ( X ) > = C ( X ) Δ θ Δ t Δ θ Δ t
where Δθ is the angle between the two adjacent sample positions and Δt and C(X) are the average coating thickness and element X content of the adjacent two samples prepared without rotating the substrate-holder, respectively, the chemical composition of a Hf–Si–N coating prepared using sputtering powers of WHf = 250 W and WSi = 25 W and a substrate holder rotation speed of 5 rpm was determined to be Hf47Si4N49. This composition was close to the real composition, Hf48Si3N49, as listed in Table 2. Table 2 shows the chemical compositions of the as-deposited multilayered HfN and Hf–Si–N coatings prepared at various sputtering powers and a substrate holder rotation speed of 5 rpm. The oxygen content in the as-deposited states was 0.9–3.2 at.%. Hf54N46 coatings exhibited a thickness of 957 nm after sputtering for 90 min, representing a deposition rate of 10.6 nm/min. At a fixed Hf sputtering power (WHf) of 250 W, the deposition rates of the Hf–Si–N coatings were 10.2, 12.7, 12.8, 14.1 and 16.5 nm/min at Si target powers (WSi) of 25, 50, 75, 100 and 150 W and sputter times of 85, 80, 75, 70 and 60 min, respectively; the coating thicknesses were in the range of 866–1018 nm.
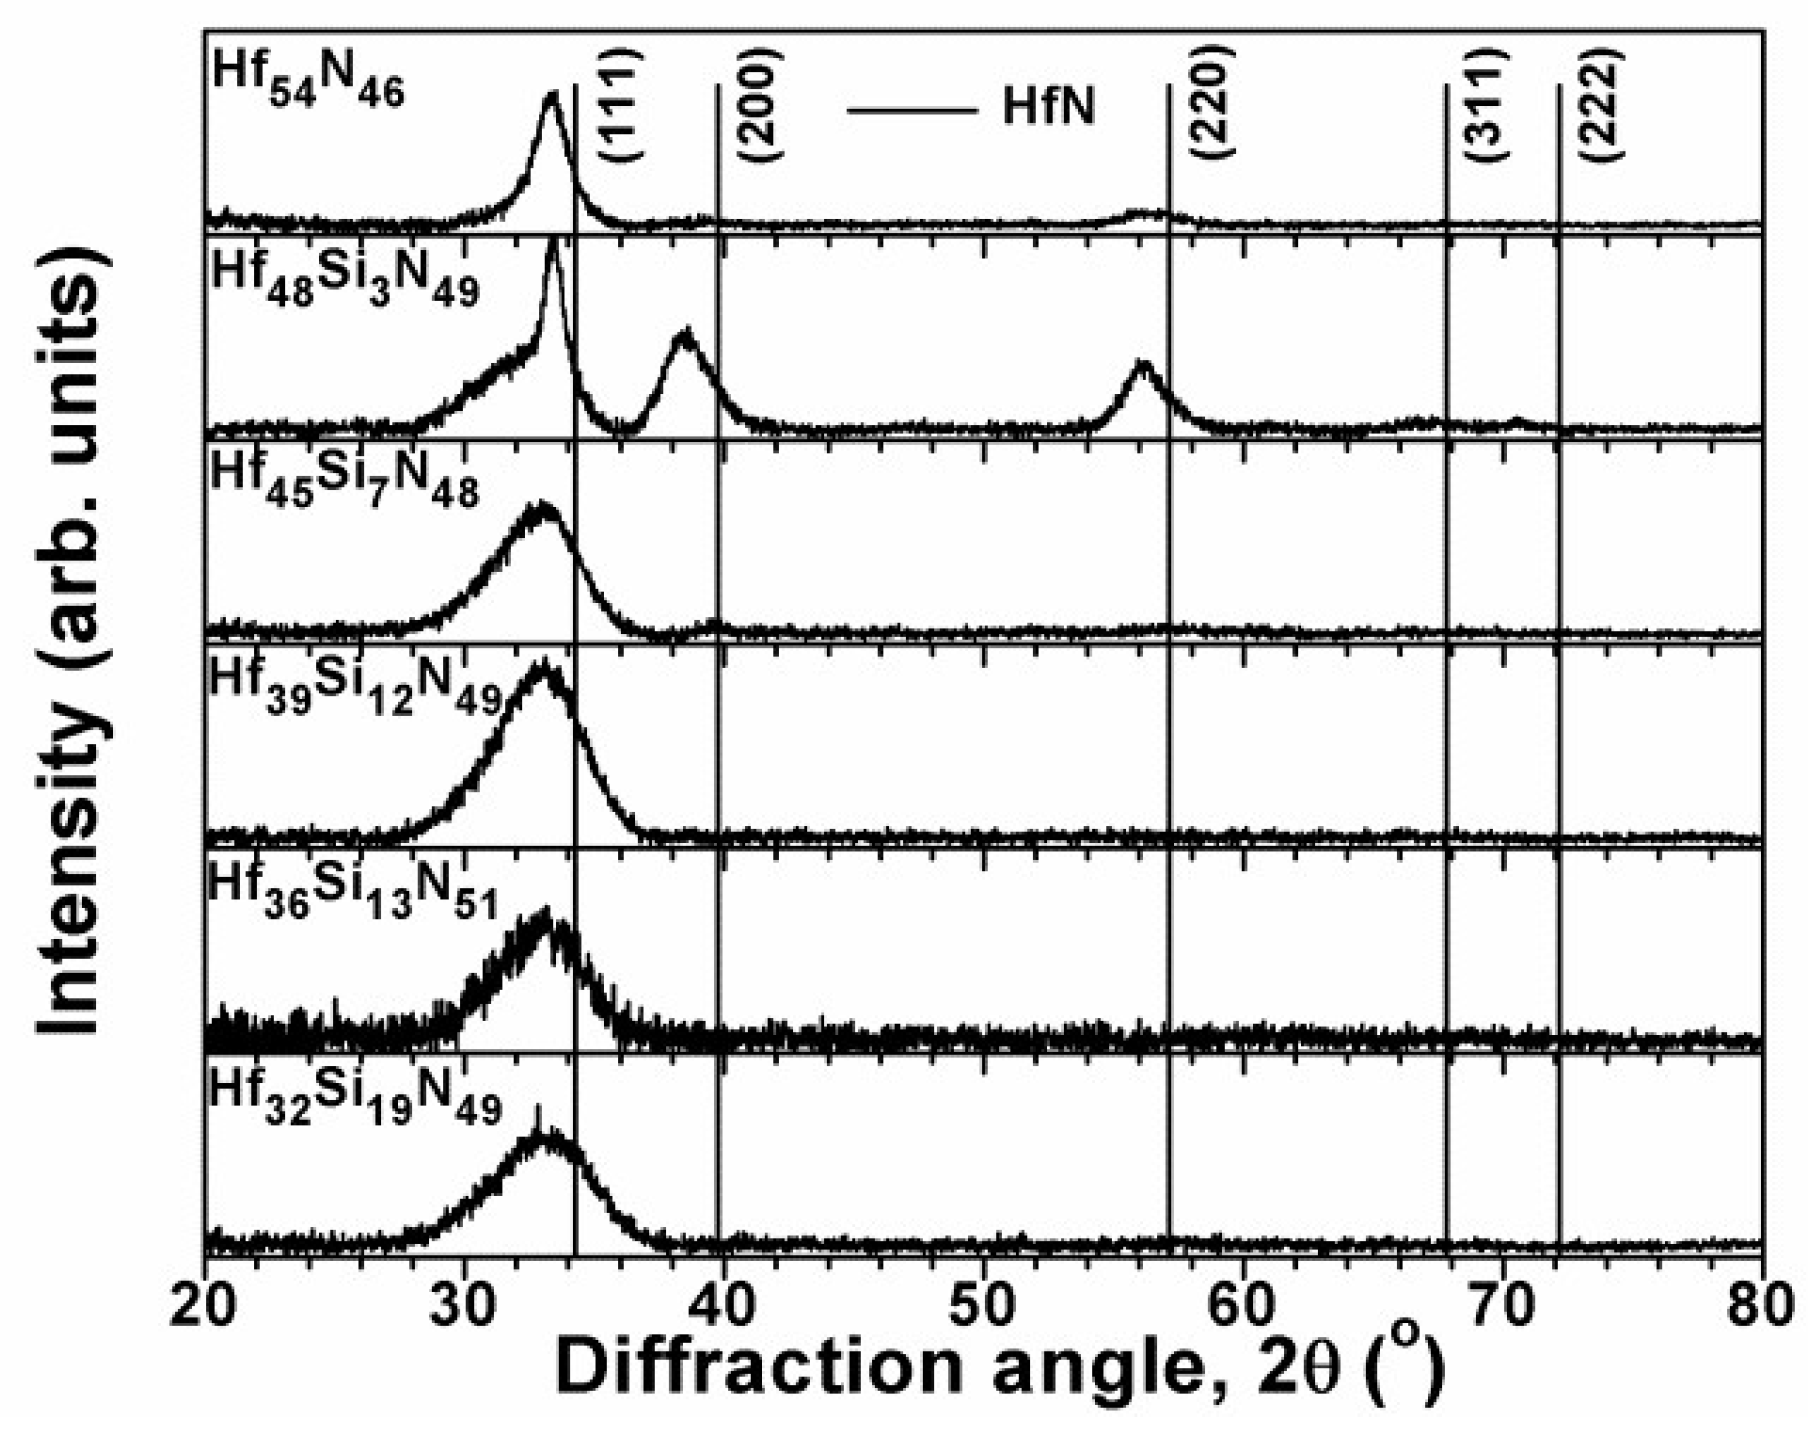
Figure 3 illustrates the XRD patterns of the as-deposited multilayered Hf–Si–N coatings. The XRD pattern of the Hf54N46 coatings revealed an f.c.c. HfN phase. Hf48Si3N49 coatings exhibited a mixture of f.c.c. and near-amorphous phases, whereas Hf46Si7N48 coatings were dominated by a near-amorphous phase accompanied with a minor f.c.c. (200) reflection, and the (111) reflection could overlap a broadened amorphous reflection. The f.c.c. reflections of the Hf54N46 and Hf48Si3N49 coatings shifted to lower 2θ values, implying an expanded lattice. The residual stresses of the crystalline Hf54N46 and Hf48Si3N49 coatings were −2.4 and −1.5 GPa (Table 2), respectively. The Si atoms dissolved as interstitial atoms in the HfN structure, which expanded the lattice parameters of an f.c.c. HfN phase, resulting a residual stress in compression. The Hf46Si7N48 coatings exhibited a residual stress of −0.7 GPa. The Hf–Si–N coatings with a Si content in the range of 12–19 at.% exhibited a near-amorphous phase and near-zero residual stress that ranged from −0.4 to −0.5 GPa.
Figure 4 illustrates the nanoindentation hardness and Young’s modulus of the as-deposited multilayered Hf–N and Hf–Si–N coatings, which exhibit similar trends as varying the Si content. The hardness of the as-deposited Hf54N46 coatings was 22.3 ± 0.6 GPa, which is comparable to the reported values of 19−21 GPa [4,29,30] for HfN films prepared through sputtering. Seo et al. [3] reported a high hardness value of 25.2 GPa for epitaxial HfN(001) layers. As Si was introduced successively into the coatings, the hardness varied: the Hf48Si3N49 coatings had a hardness of 22.5 ± 0.8 GPa, whereas the hardness decreased sharply to 15.3 ± 0.6 GPa for the Hf46Si7N48 coatings and then remained at 15–16 GPa for the Hf39Si12N49, Hf36Si13N51 and Hf32Si19N49 coatings; this level is close to 17–19 GPa for Si3N4 [31,32,33,34].
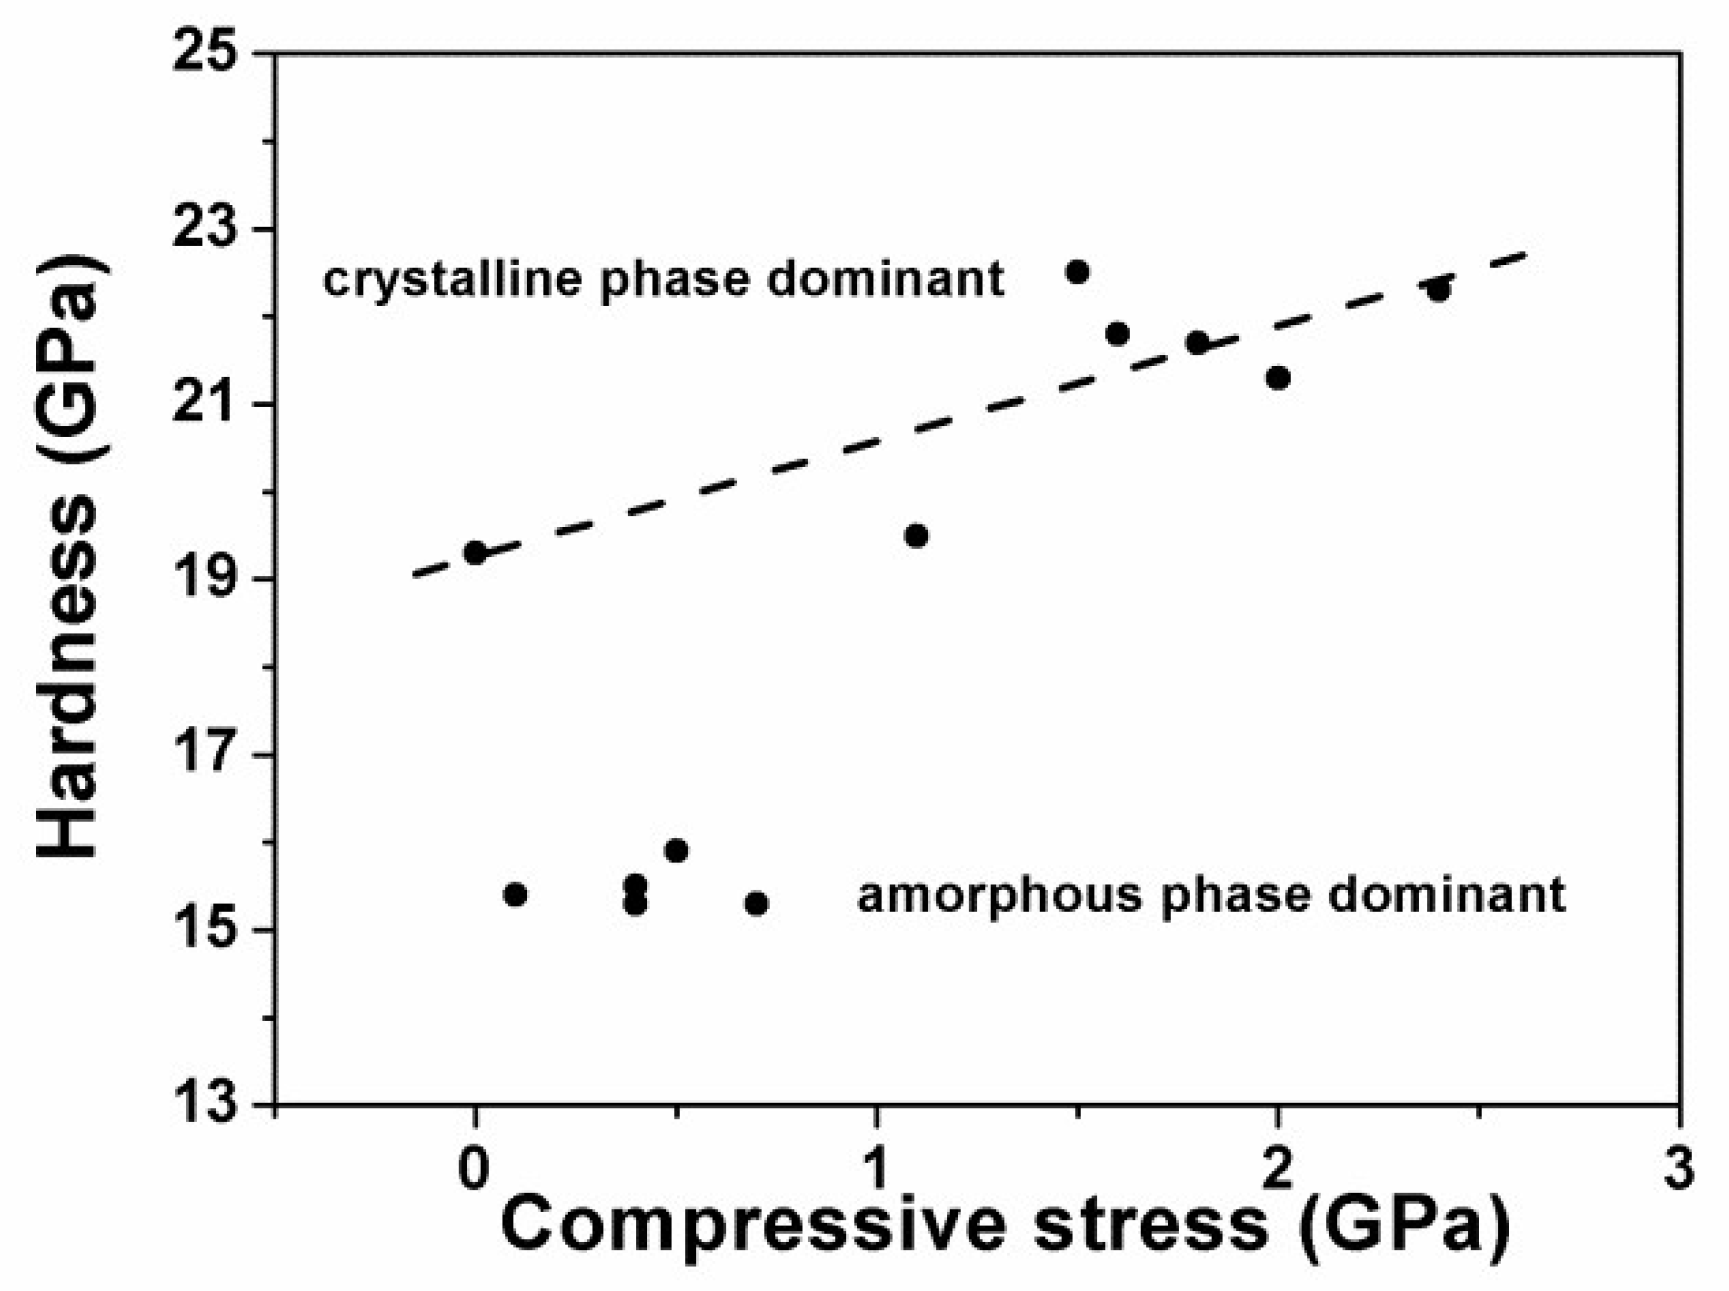
Figure 5 shows the relationship of hardness and residual stress of the monolithic and multilayered Hf–Si–N coatings. Two categories of the Hf–Si–N coatings were observed. The crystalline phase-dominant coatings exhibited a linear relationship between hardness and residual stress, whereas the X-amorphous phase-dominant coatings maintained a relatively low residual stress level accompanied by a low hardness level of 15–16 GPa.
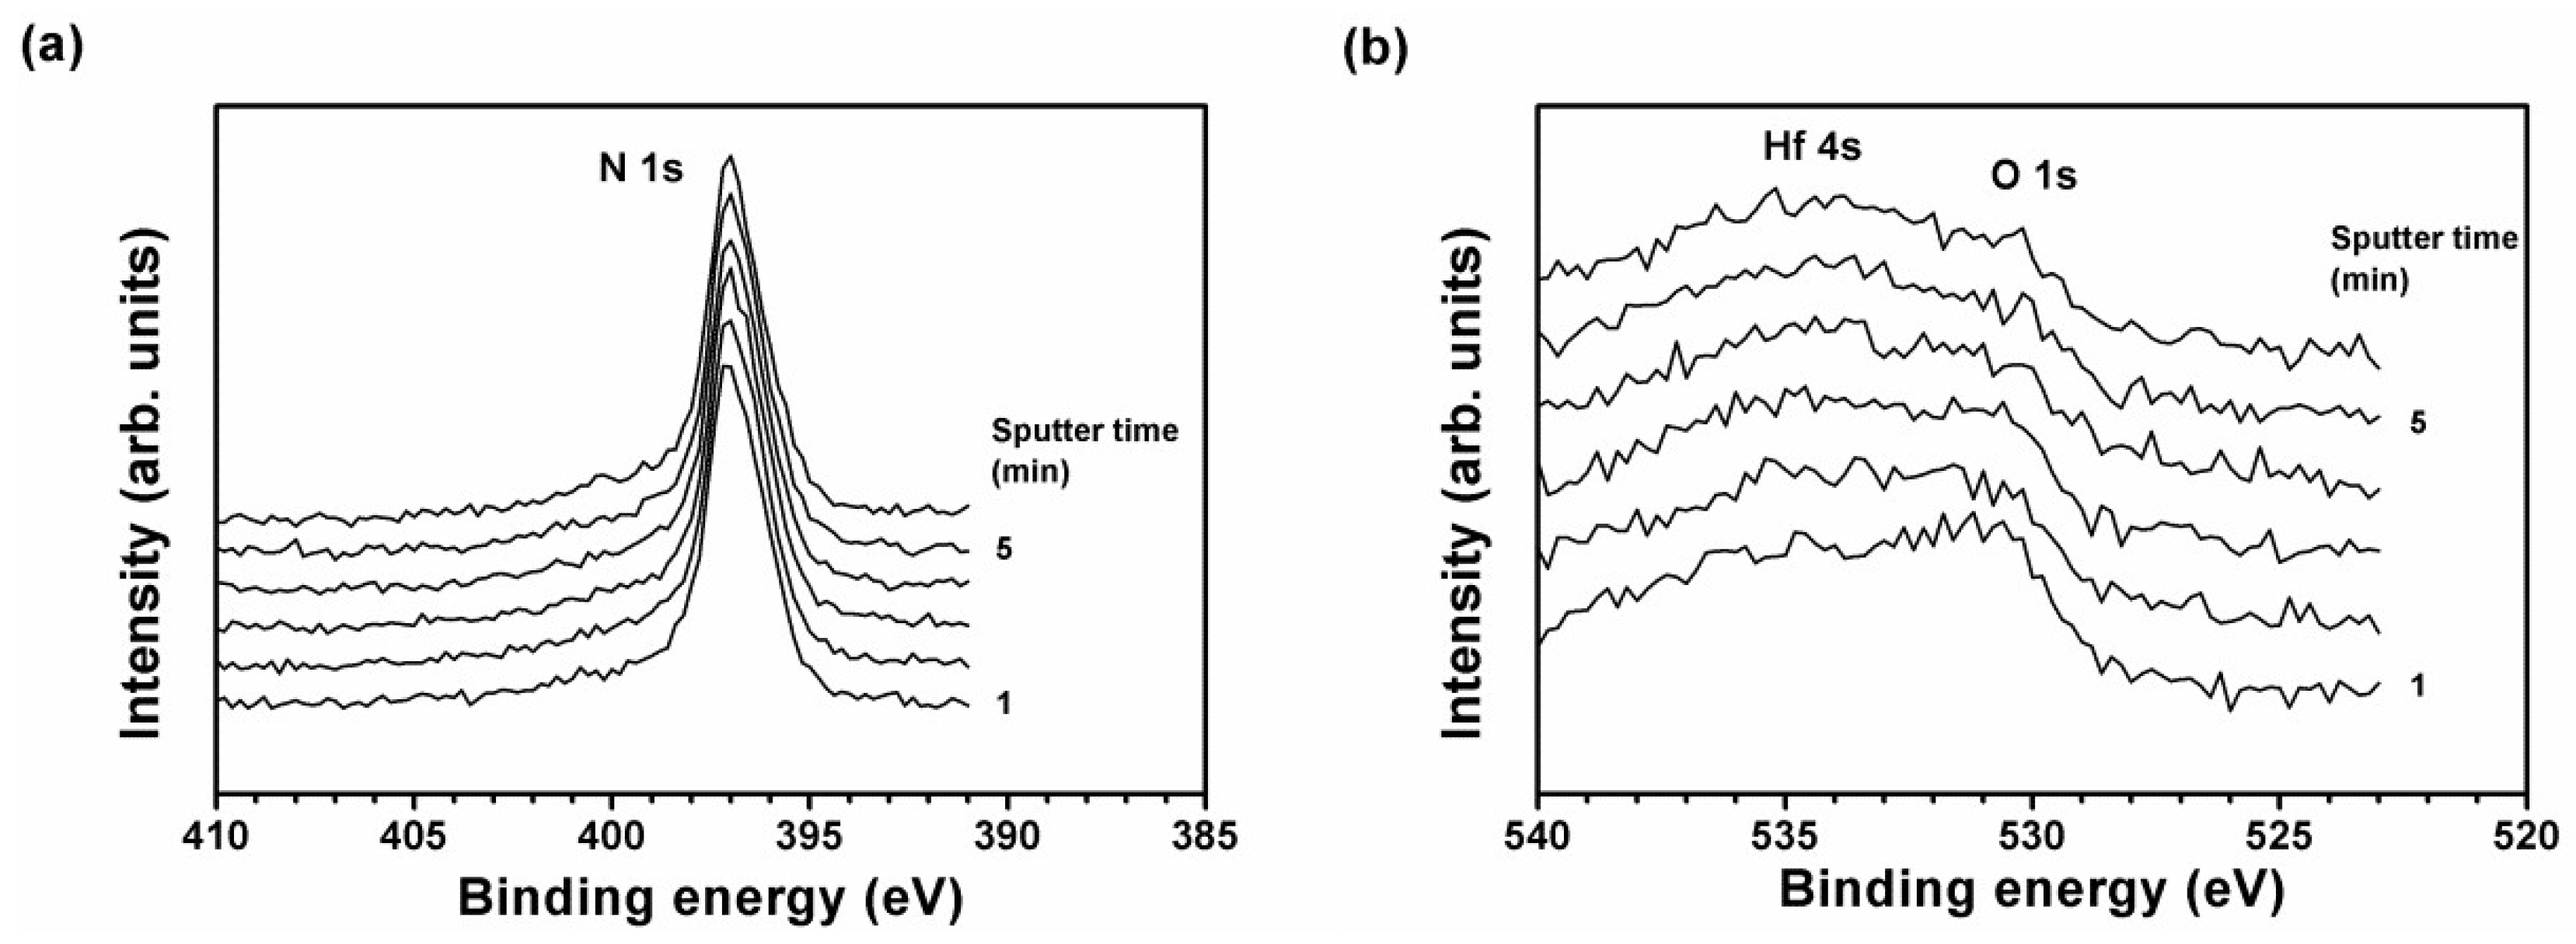
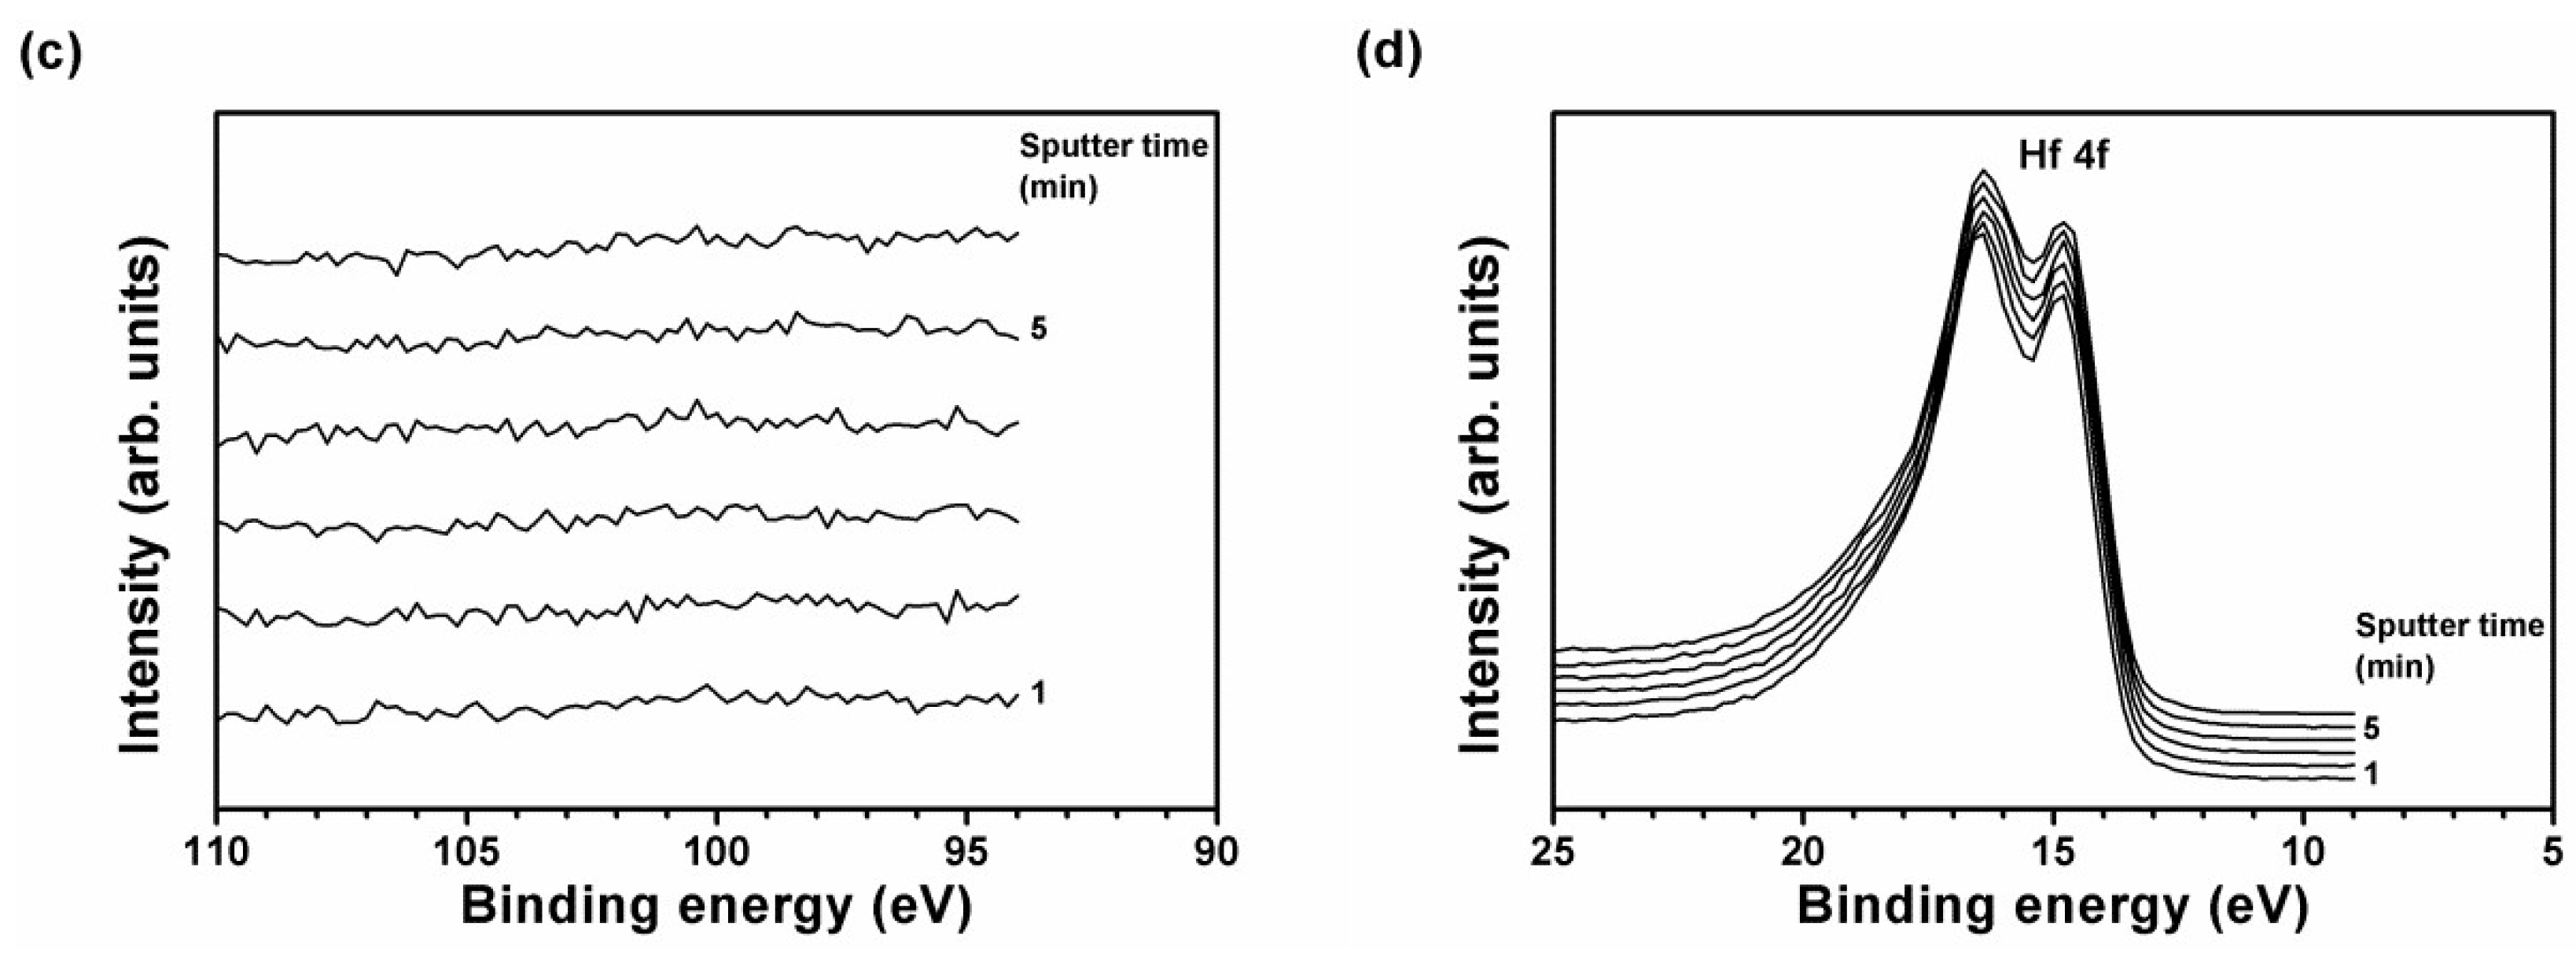
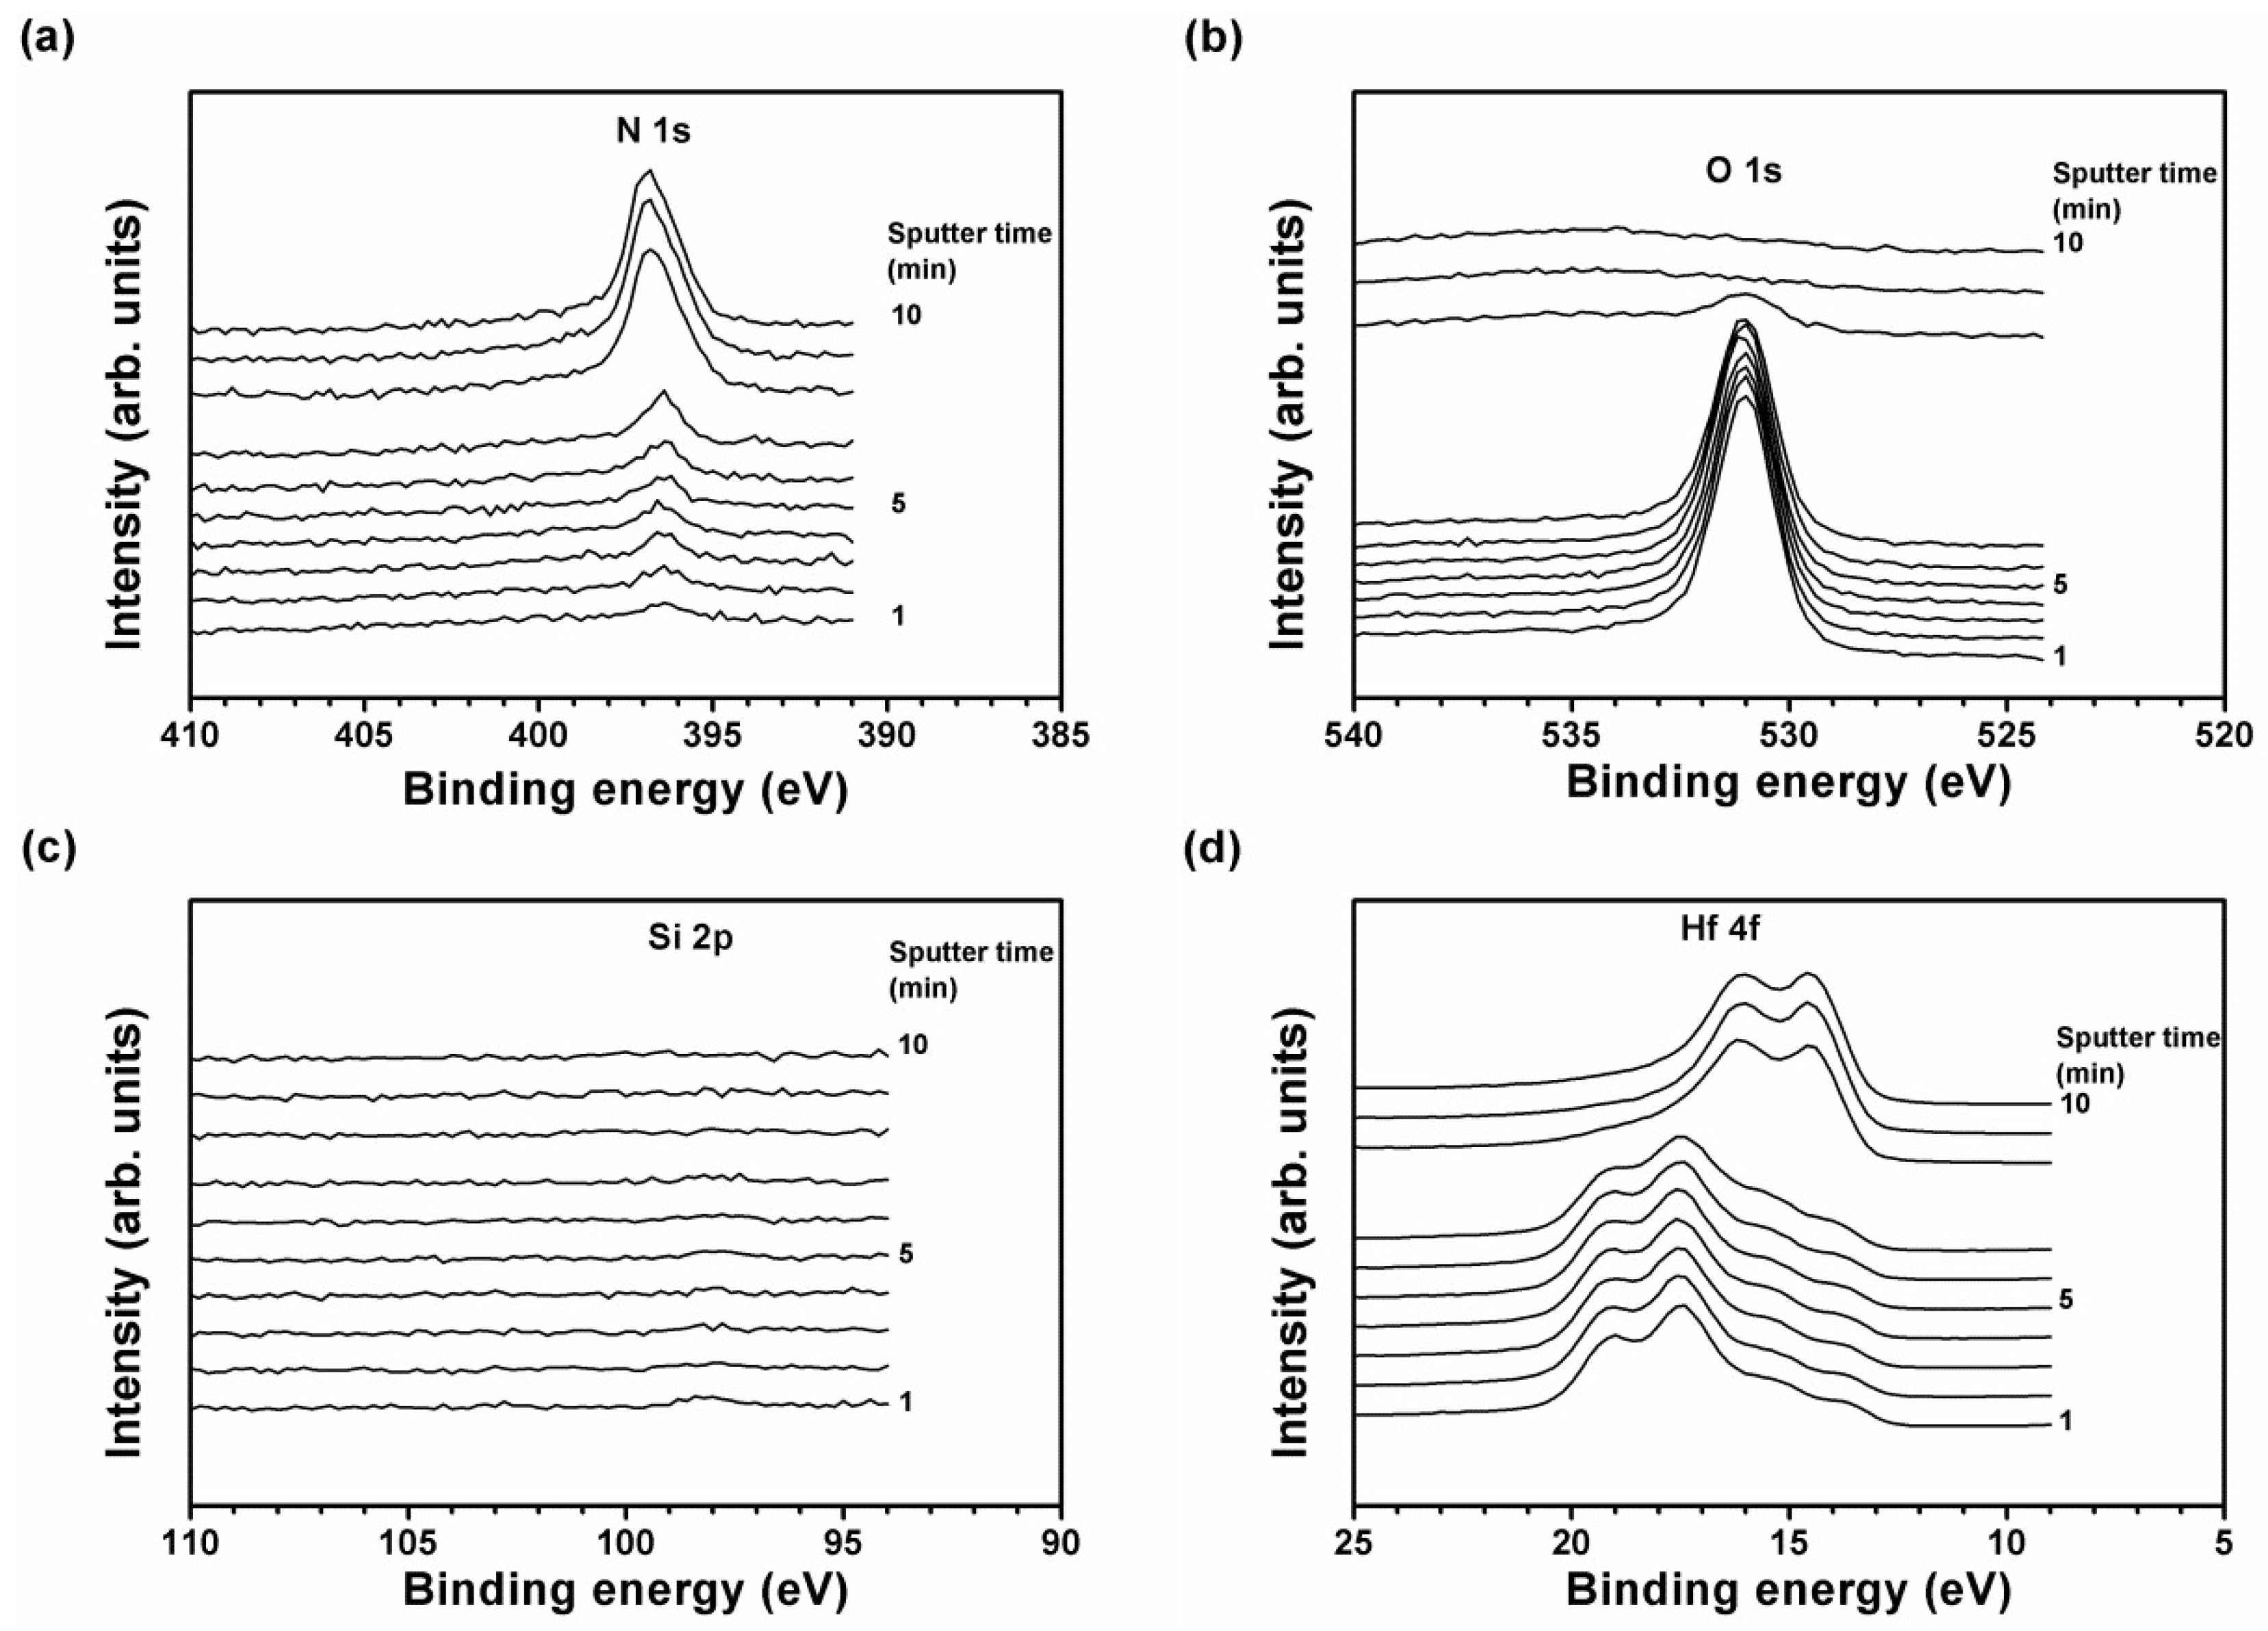
The bonding characteristics of three typical Hf–Si–N coatings, a crystalline and amorphous mixed Hf48Si3N49, an X-ray amorphous dominated Hf45Si7N48 and an X-ray amorphous Hf32Si19N49 coatings, respectively representing low-, medium- and high-Si-contents Hf–Si–N coatings, were analyzed. Figure 6 shows the XPS depth profiles of the N 1s, O 1s, Si 2p and Hf 4f core levels of the Hf48Si3N49 coatings. The binding energies of N 1s were identified as 396.88 ± 0.02 eV at a depth range of 9.5–57 nm, labeled as sputter times of 1–6 min in Figure 6a, which was comparable to the reported values of 396.9 eV for the HfN and Hf3N2/Hf4N3 compounds [35]. Because the binding energies between various N–Hf bonds were not distinguishable [36], the characteristics of Hf–N bonds were verified by the Hf signals. The O 1s signal was observed on the free surface (not shown in Figure 6b), whereas beneath the surface, the profile at approximately 534 eV was overlapped with an Hf 4s signal. No Si signal was detected beneath the free surface due to a low-Si-content of 3 at.%. Arranz [35] reported that the binding energies of Hf 4f7/2 were identified as 13.9, 14.5, 15.0 and 15.5 eV for the Hf0, Hf3N2/Hf4N3, HfN and Hf3N4 components, respectively. The Hf–N bonds for Hf3N2 and Hf4N3 were not distinct and denoted using Hf4N3.
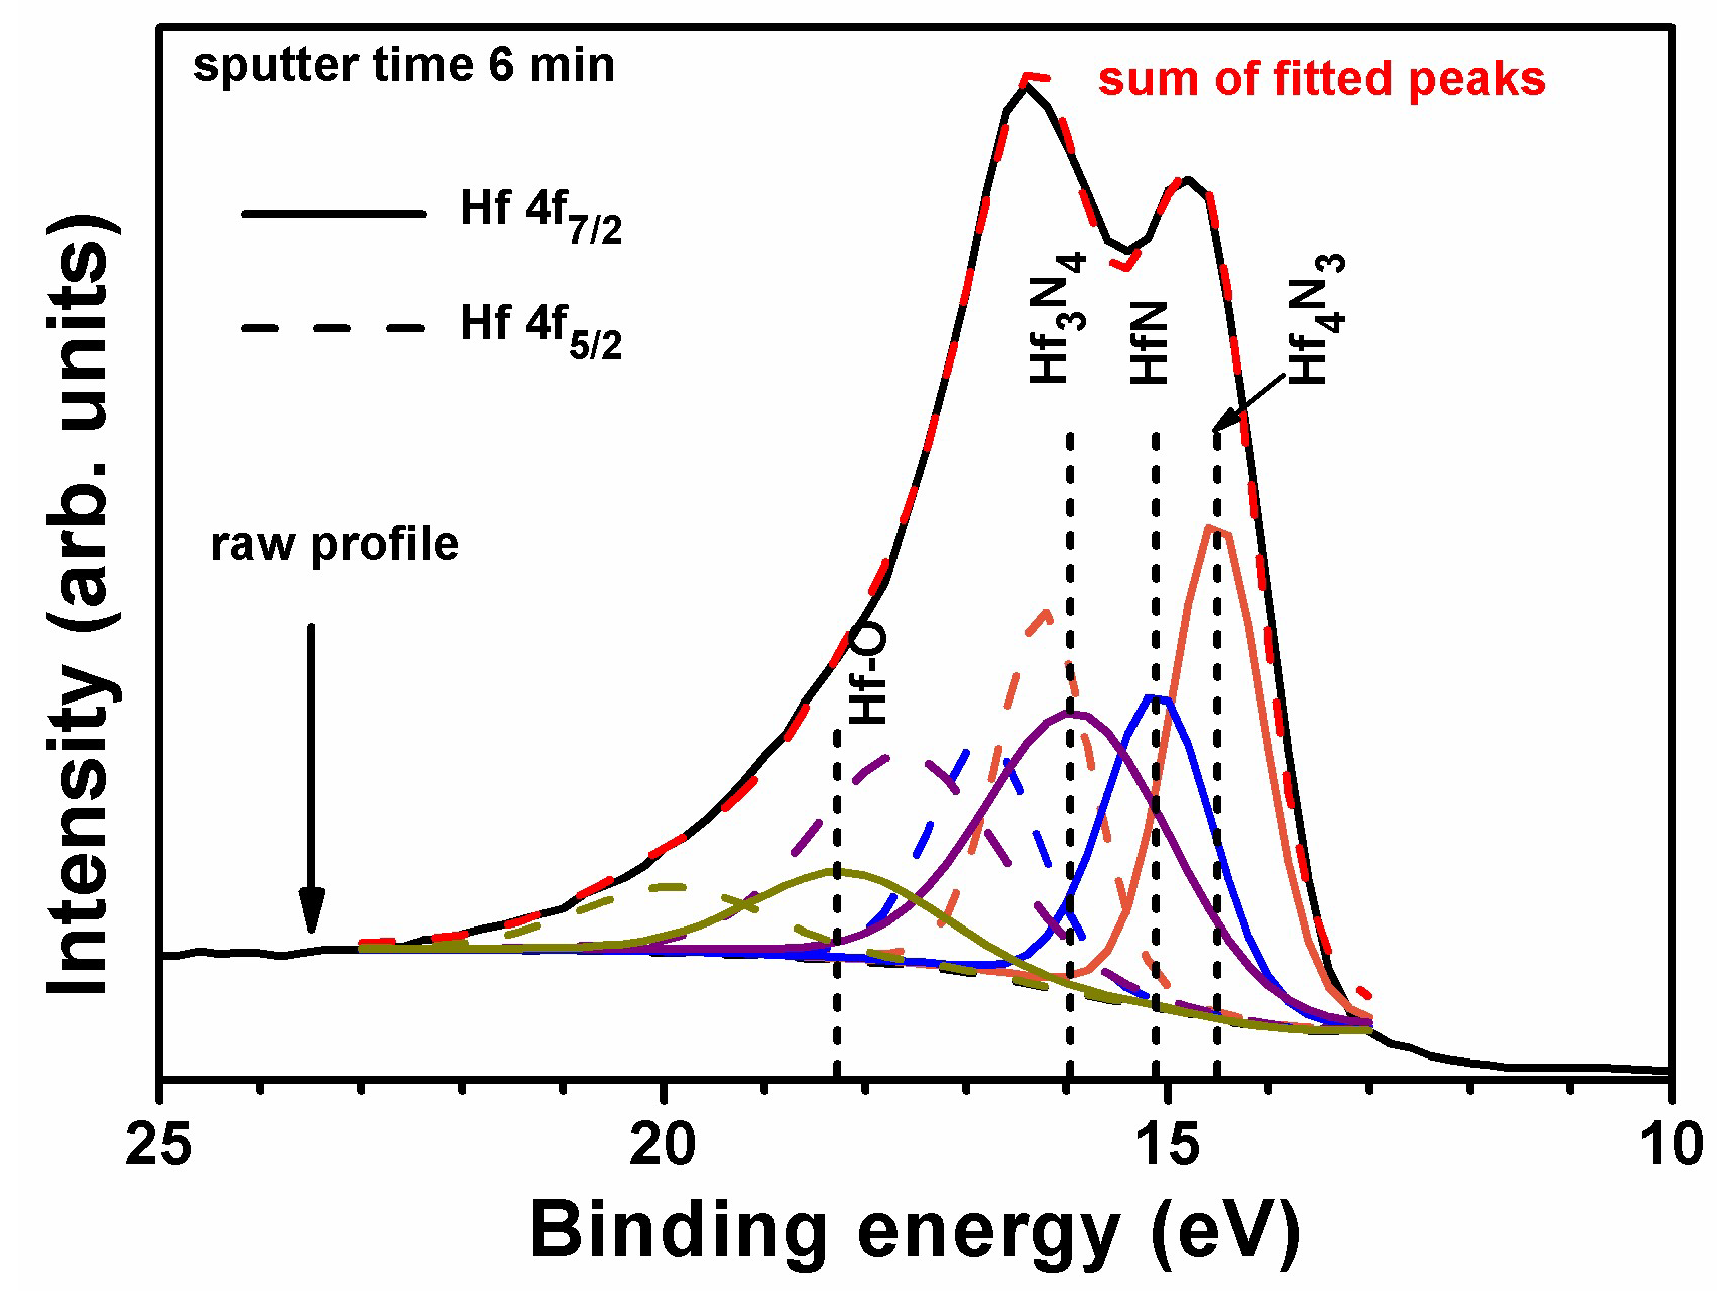
Figure 7 presents the curve fitting of the Hf 4f signal at a depth of 57 nm, which exhibited four doubles with 4f7/2 binding energies of 14.51, 15.10, 15.89 and 18.19 eV. The 4f7/2 binding energies at a depth range of 9.5–57.0 nm (Figure 6d) were identified as 14.46 ± 0.06, 15.13 ± 0.03, 16.01 ± 0.07 and 18.11 ± 0.09 eV, which respectively belonged to the bonding energies of Hf4N3, HfN, Hf3N4 and Hf–O. The intensity ratio of Hf4N3:HfN:Hf3N4:Hf–O determined using Hf 4f7/2 signals was 31:24:34:11. Table 3 lists the Hf 4f7/2 binding energies of the Hf48Si3N49, Hf45Si7N48 and Hf32Si19N49 coatings. These deviations between various Hf species affected the oxidation resistance of Hf–Si–N coatings as illustrated in Section 3.2. It was argued that the curve fitting of multiple peaks of the XPS signals might be uncertain. Nevertheless, the results agreed with the deviation of oxidation behavior for various Hf–Si–N coatings.
The binding energies of N 1s for Hf45Si7N48 coatings were identified as 396.10 ± 0.05 eV at a depth range of 9.5–57.0 nm, whereas the Si signal was still invisible. Figure 8 presents the curve fitting of the Hf 4f signal of the Hf45Si7N48 coatings at a depth of 57 nm. The Hf 4f signals consisted of Hf0, Hf4N3, HfN, Hf3N4 and Hf–O, the intensity ratio of which was 28:36:11:12:13 for Hf0:Hf4N3:HfN:Hf3N4:Hf–O. The presence of metallic Hf0 and decreased amounts of HfN and Hf3N4 bonds related to those of the Hf48Si3N49 coatings implied the introduced Si preferential bonding with N.
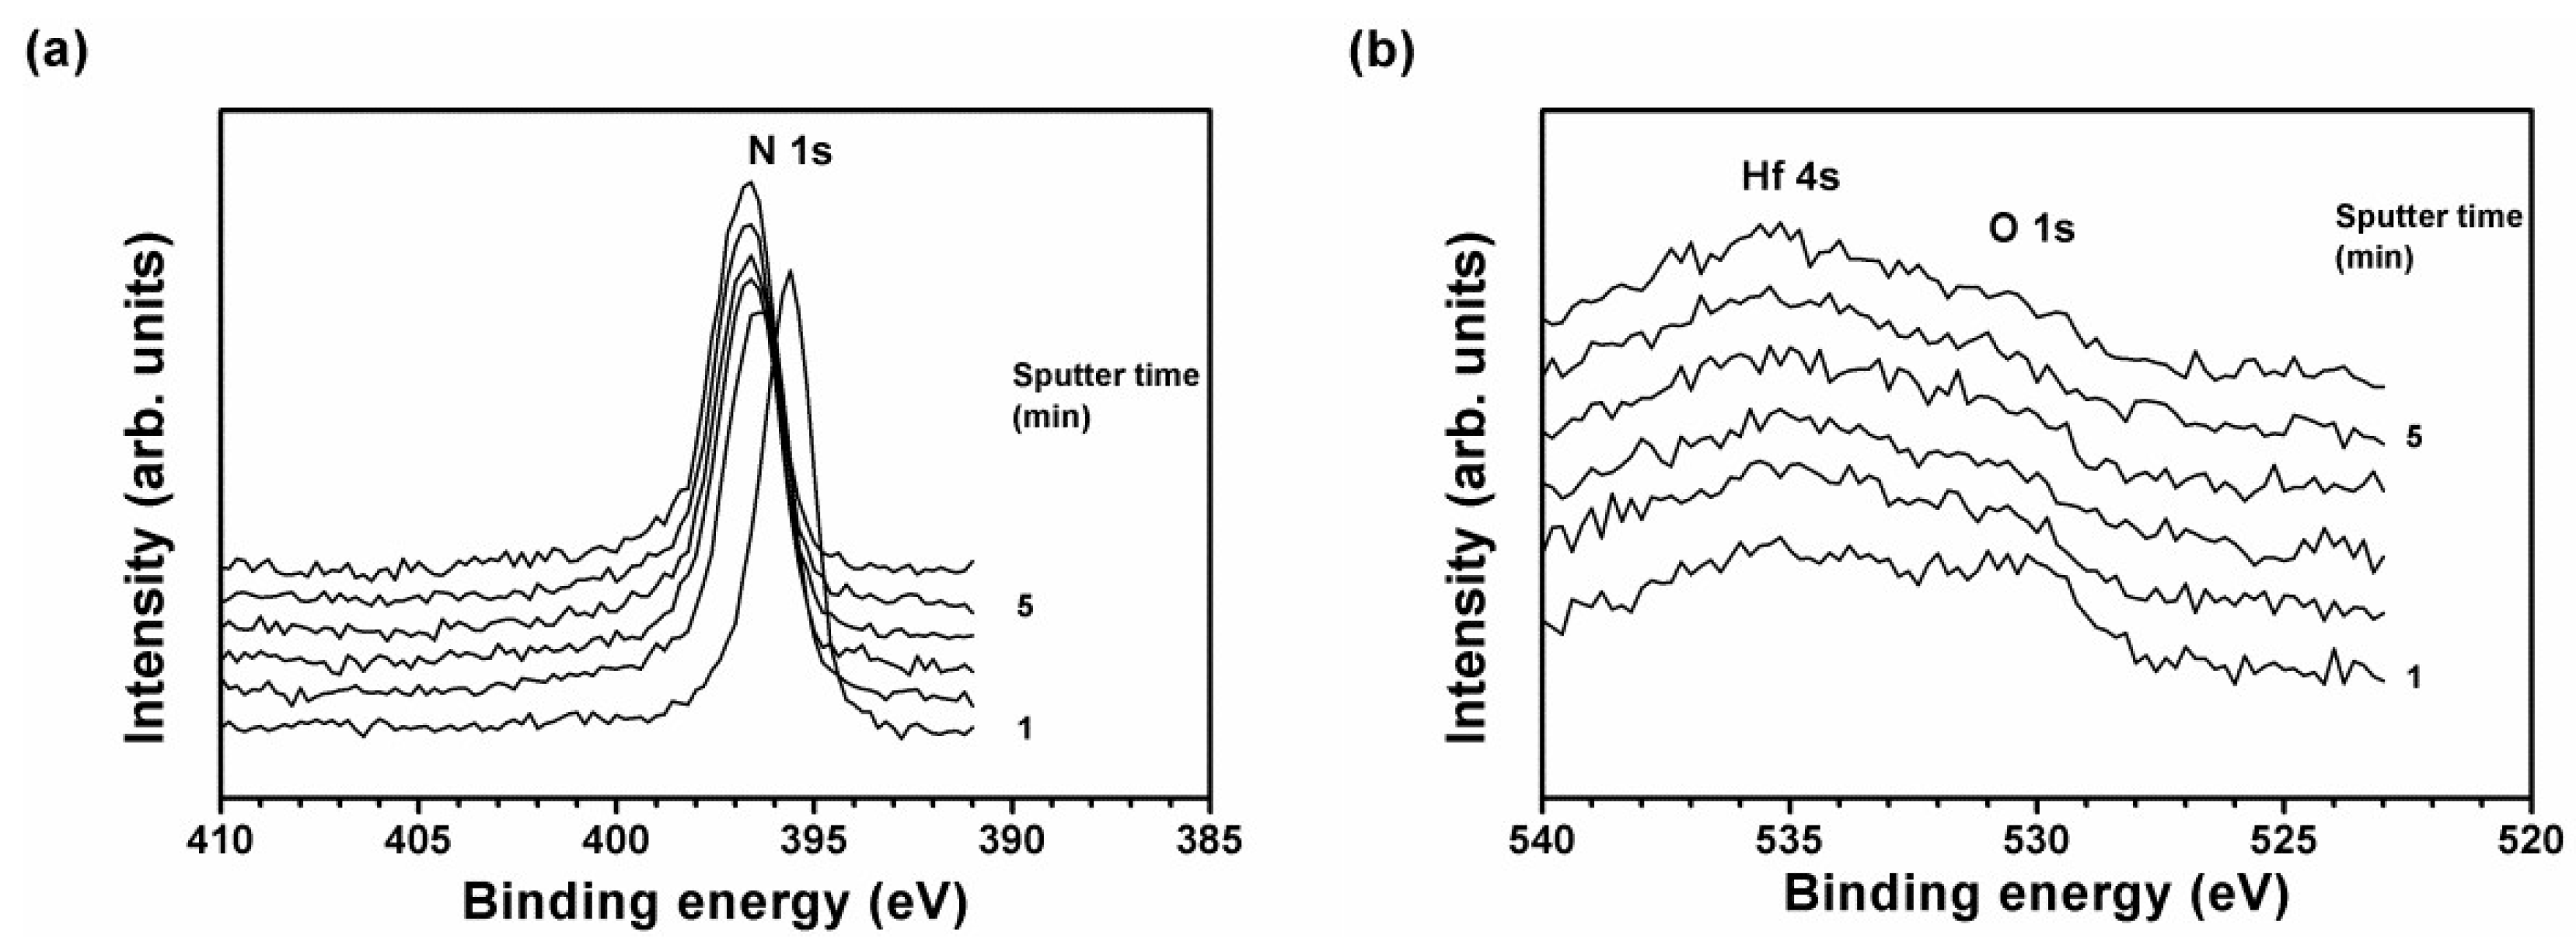
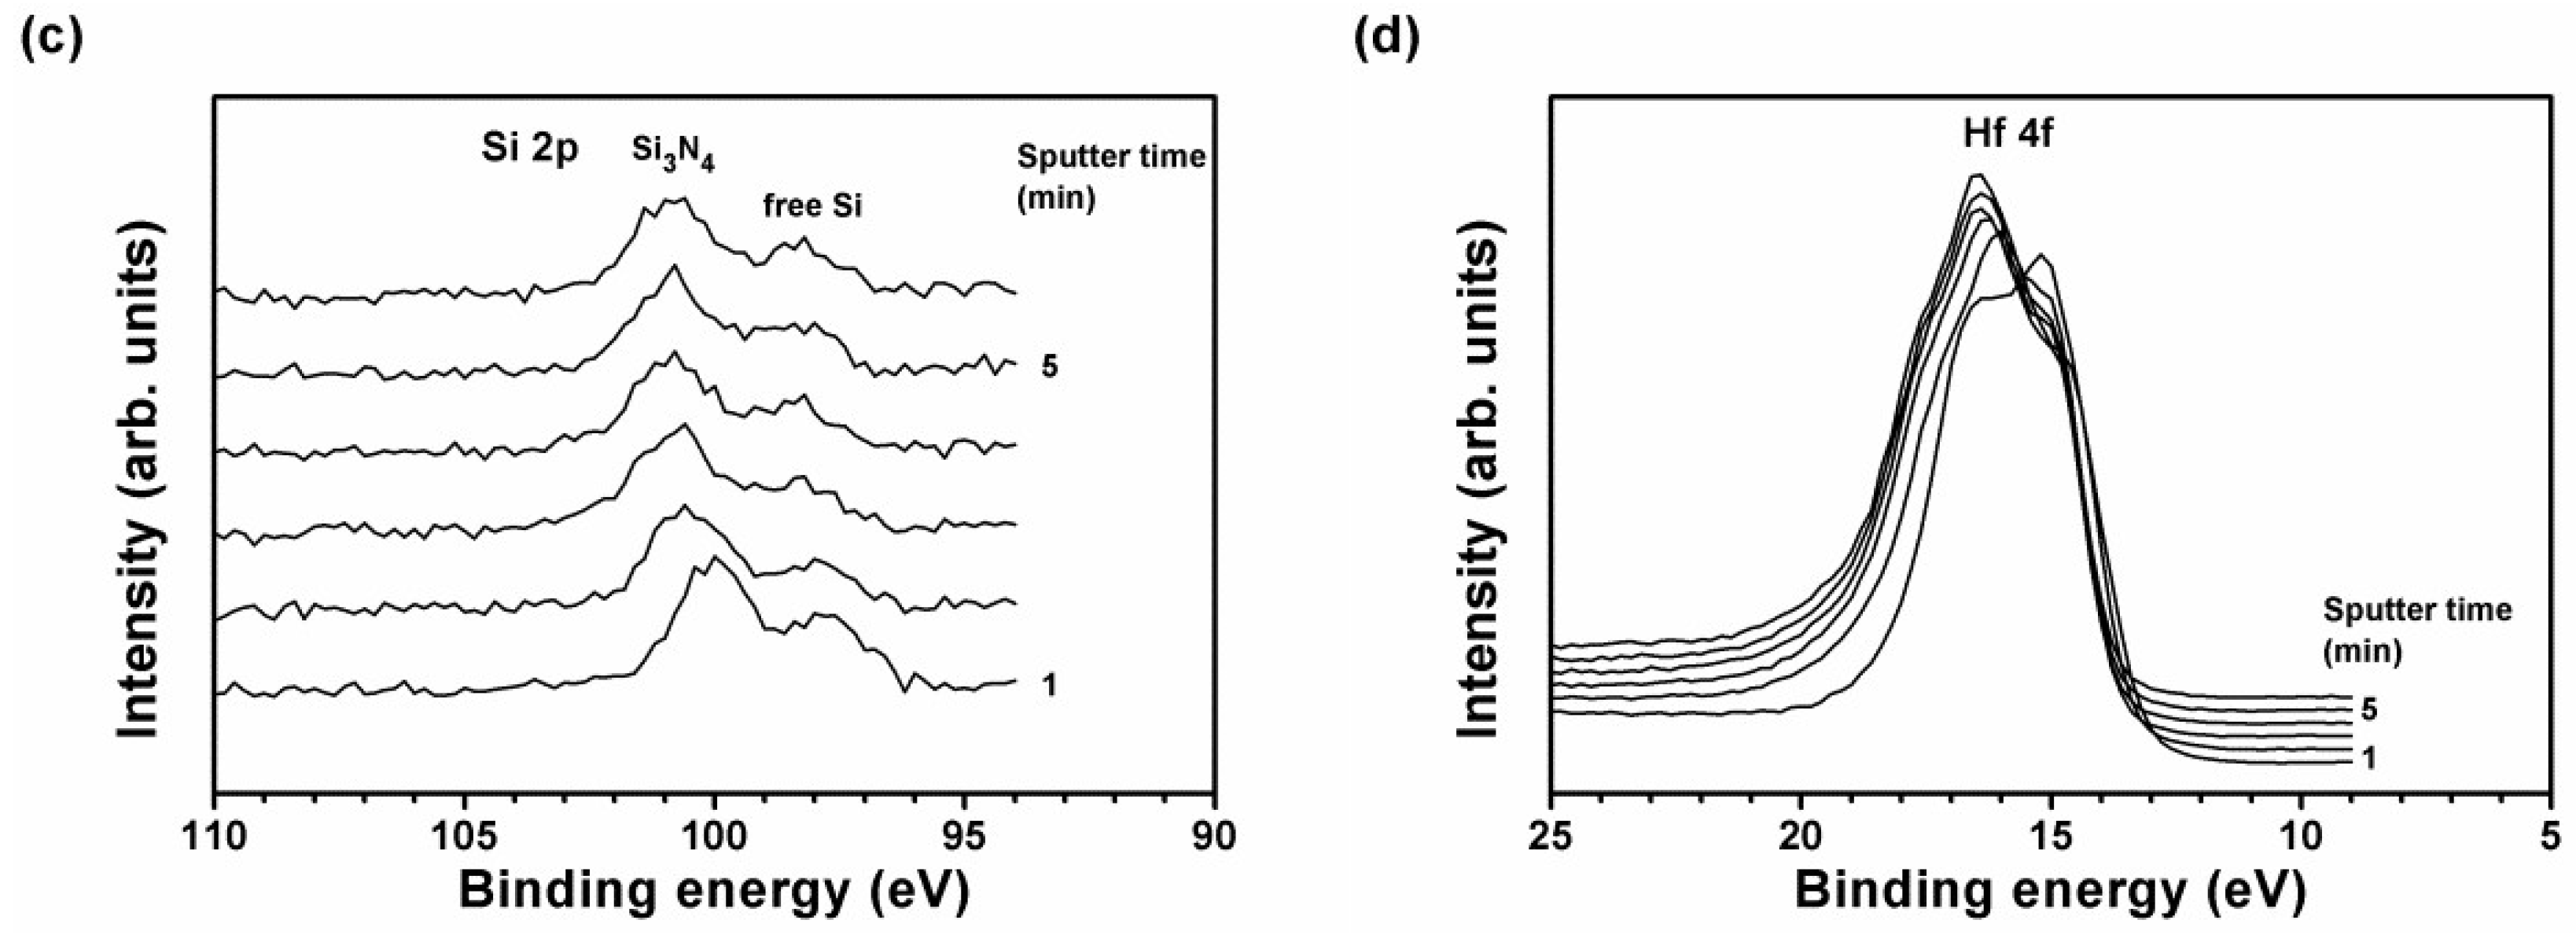
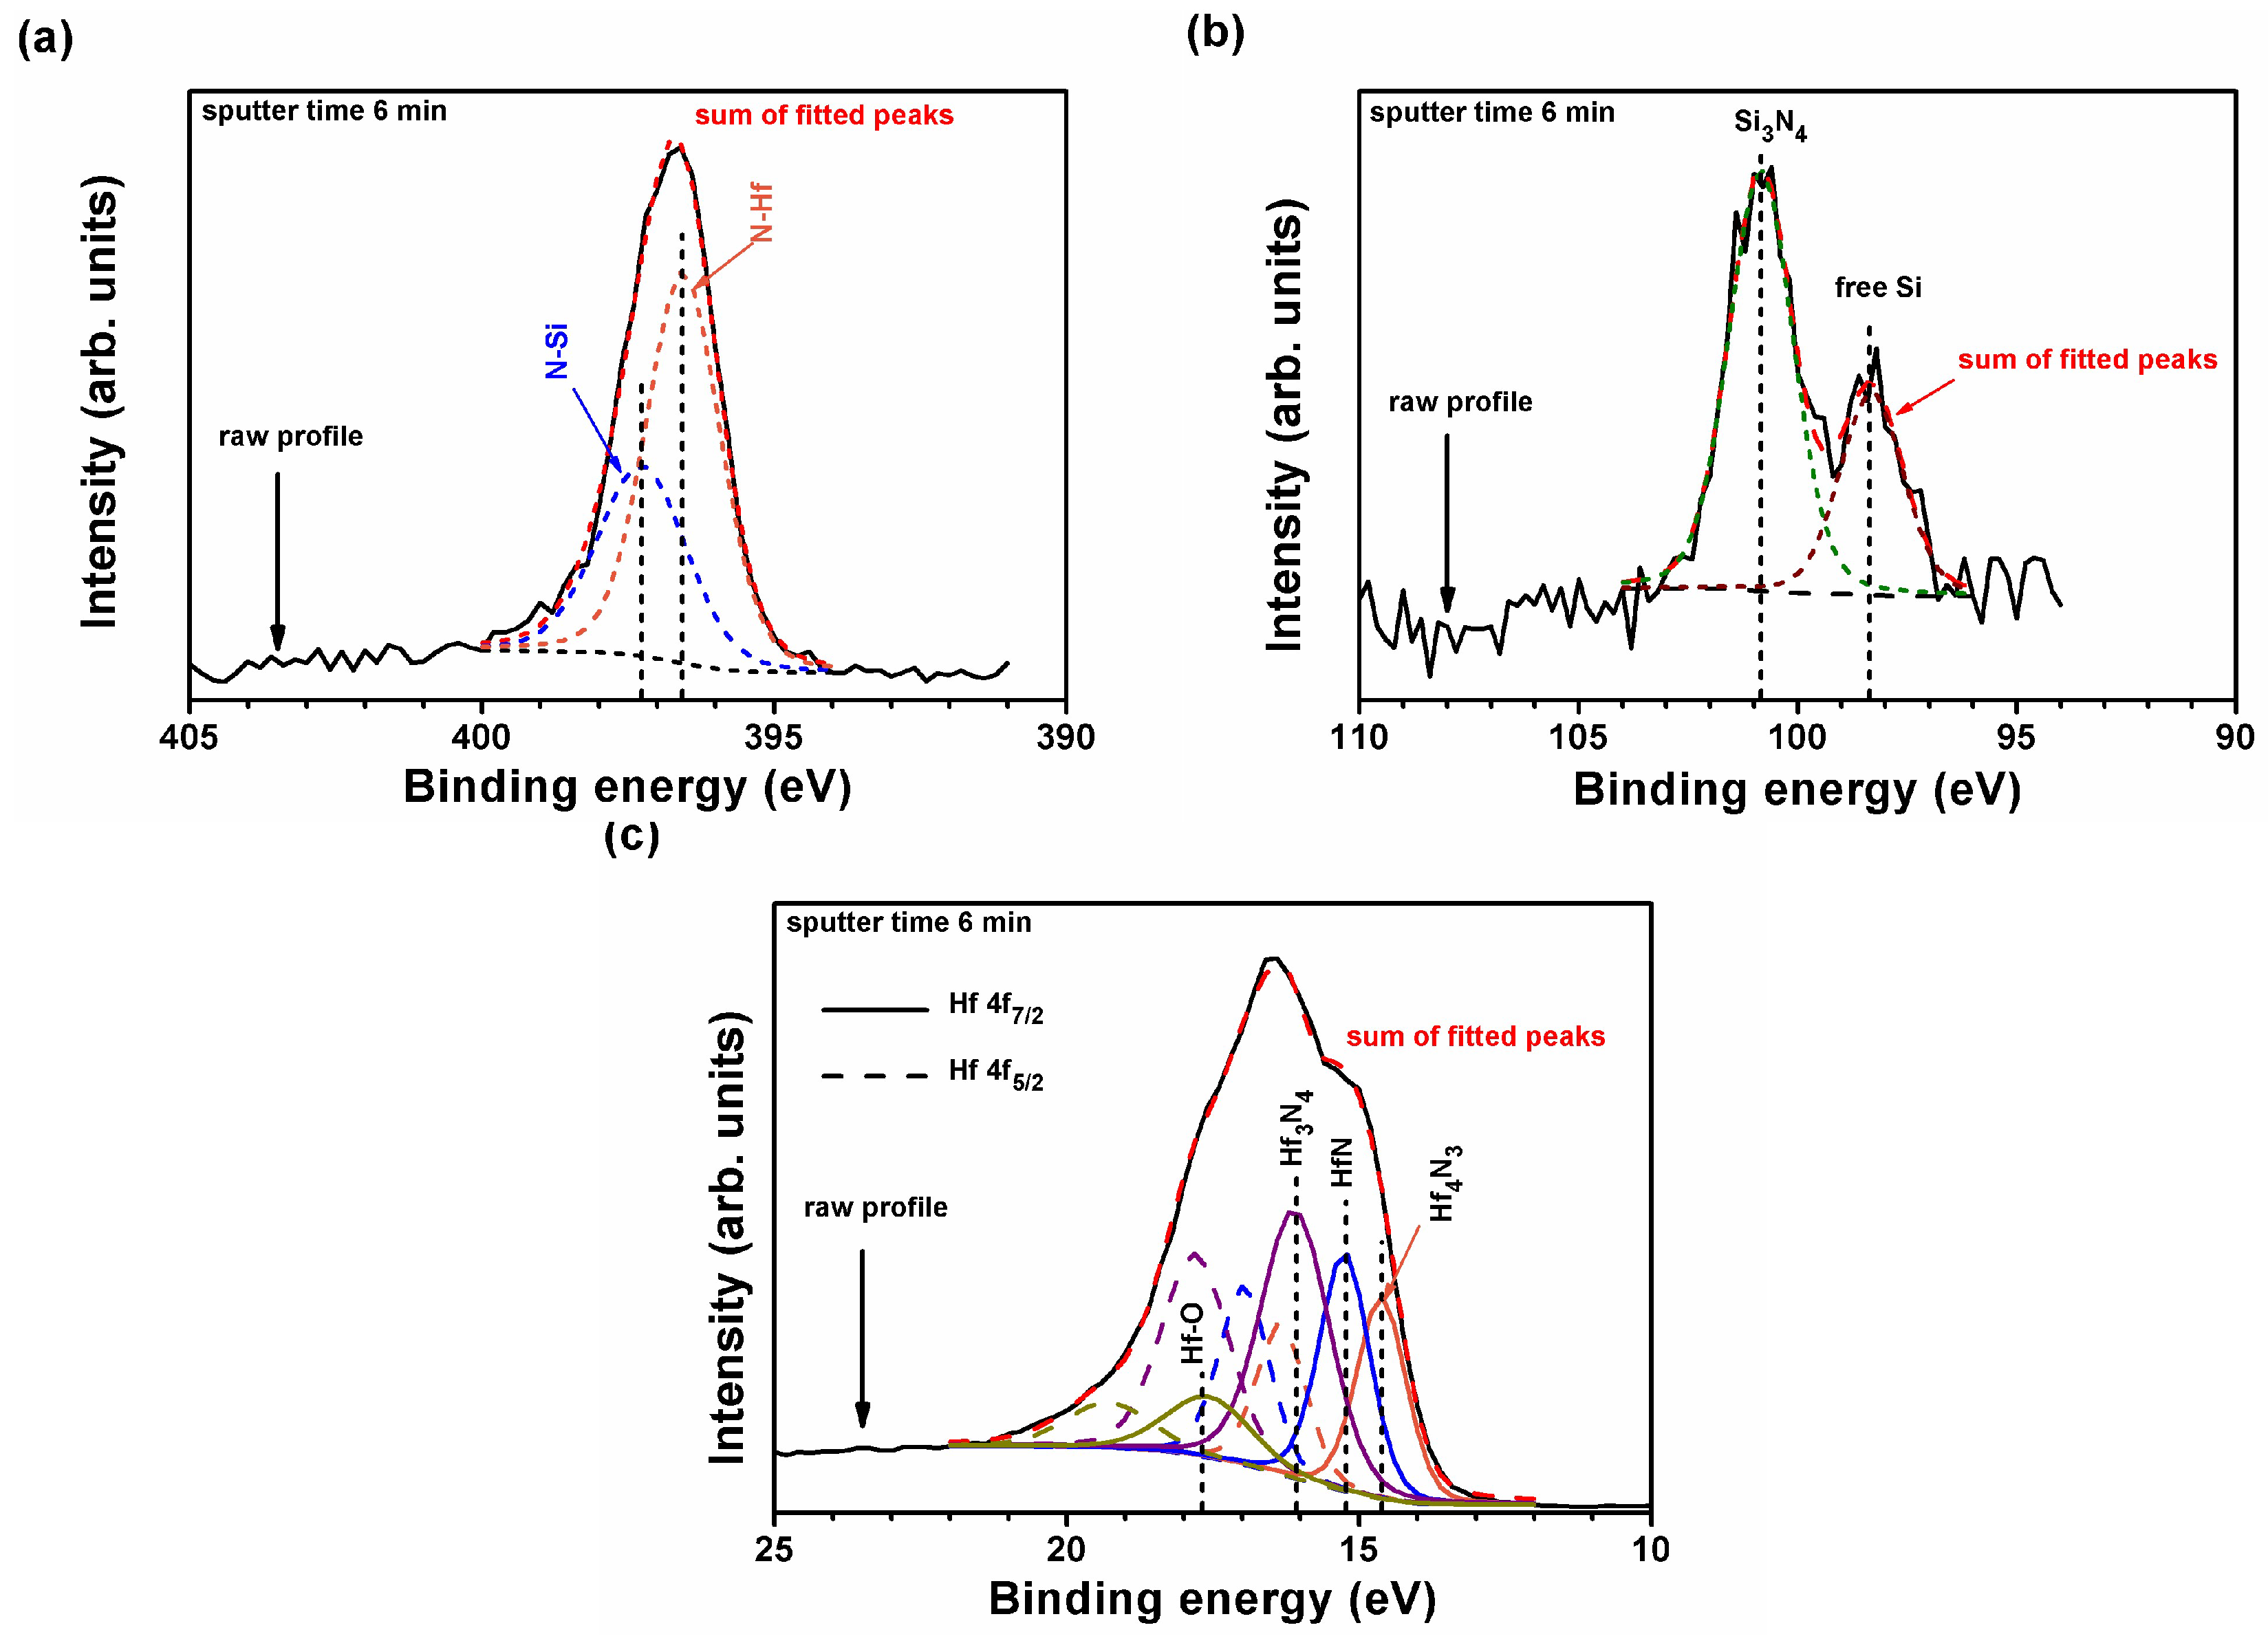
Figure 9 shows the XPS depth profiles of the N 1s, O 1s, Si 2p and Hf 4f core levels of the Hf32Si19N49 coatings. The binding energies in the shallow region, a depth range of 9.5–19.0 nm, deviated from those in an interior region of 28.5–57.0 nm. Figure 10 shows the curve fitting of the N 1s, Si 2p and Hf 4f signal at a depth of 57 nm. In the interior region, the N 1s of Hf32Si19N49 coatings comprised two signals of 396.49 ± 0.06 and 397.17 ± 0.06 eV (Figure 10a), which respectively fitted the binding energies of N–Hf and N–Si bonds. The Si 2p (Figure 10b) comprised two signals of 98.40 ± 0.06 and 100.87 ± 0.04 eV for the free Si (un-nitrified Si [37]) and Si–N bonds [38] in the interior region, respectively. The Hf 4f signals consisted of Hf4N3, HfN, Hf3N4 and Hf–O (Figure 10c), the intensity ratio of which was 23:26:40:11 for Hf4N3:HfN:Hf3N4:Hf–O. The absence of metallic Hf0 and the presence of free Si and increased amounts of Hf3N4 bonds related to those of the Hf48Si3N49 coatings implied that the amount of Si–N bonds was saturated and Hf tended to form the Hf3N4 compound accompanied by a high Si content, which was similar to that reported for the Zr–Si–N coatings [39]. Zr3N4 and Hf3N4 with the Th3P4 structure have been reported [27,28,40].

3.2. Annealed Hf–Si–N Coatings

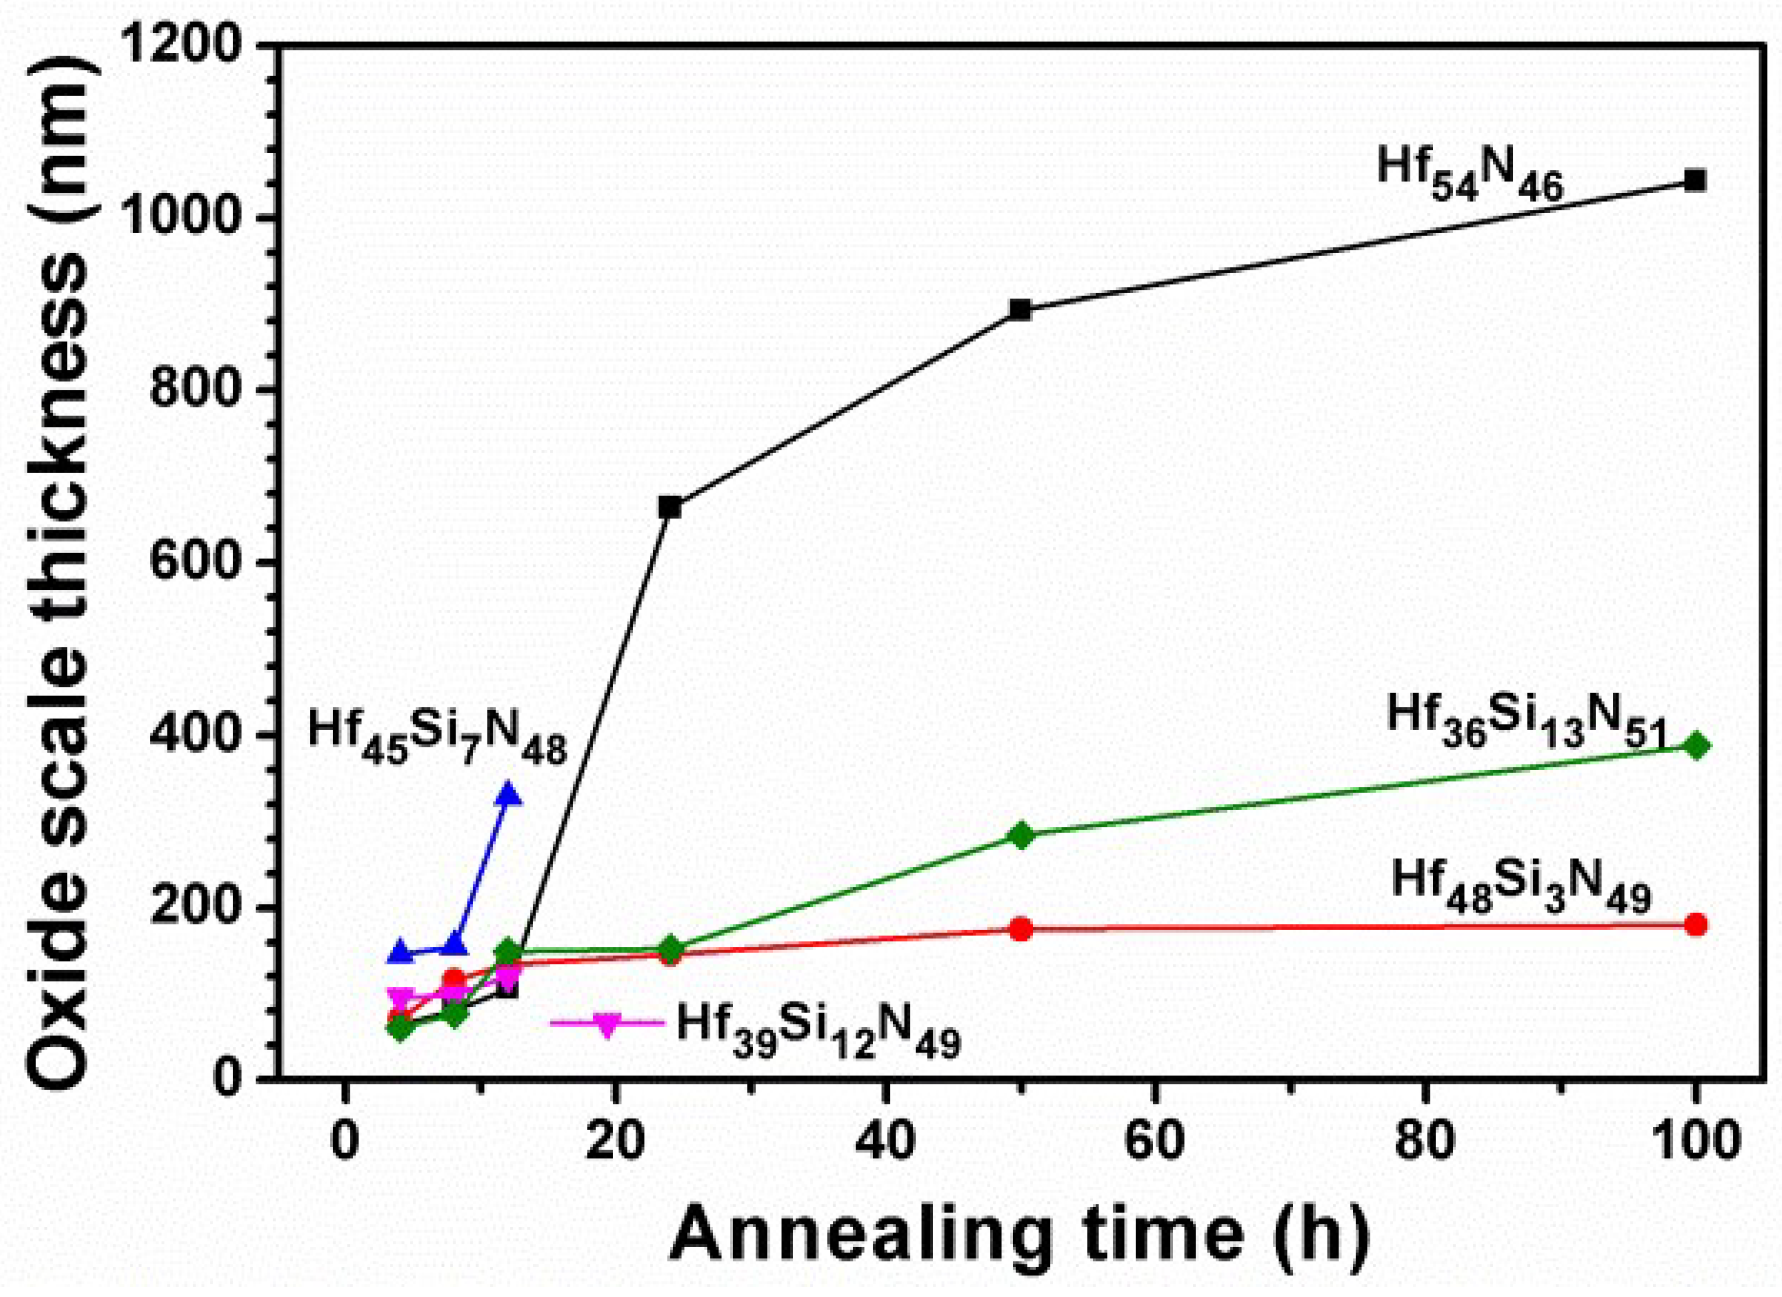
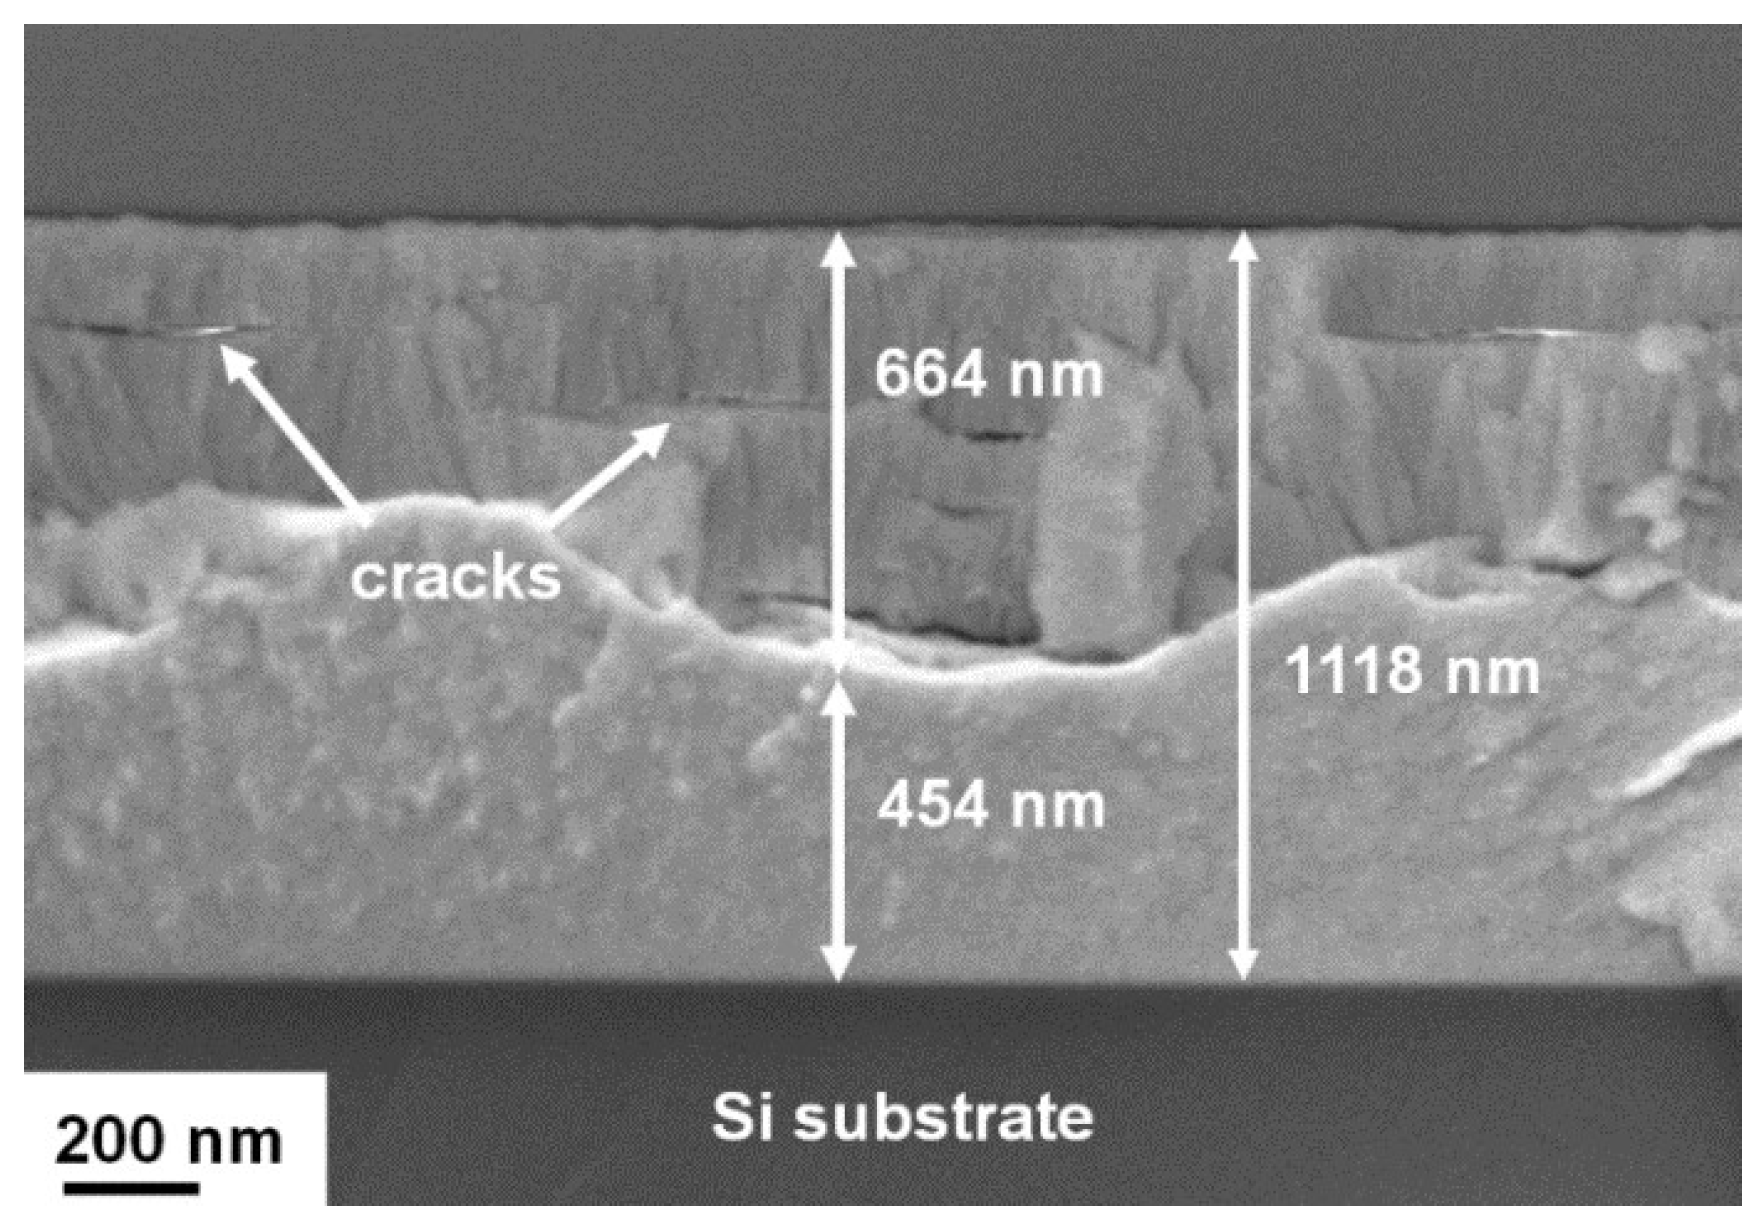
Figure 11 illustrates the XRD patterns of the multilayered Hf–Si–N coatings after annealing at 600 °C in 1% O2–99% Ar for 4 h. A monoclinic HfO2 phase [ICDD 34-0104] was observed for the annealed Hf54N46 and Hf48Si3N49 coatings in addition to the original f.c.c. phase, with reflections shifted back to the standard values. By contrast, the Hf–Si–N coatings with Si contents of 7–19 at.% exhibited phases similar to those of the as-deposited states. Figure 12 illustrates the oxide scale thicknesses of the annealed Hf–Si–N coatings examined using SEM. The oxide depths of the annealed Hf32Si19N49 coatings were too low to be examined using SEM. The Hf54N46 coatings exhibited a rapid increase in the oxide scale thickness as the annealing duration was increased from 12 to 24 h. Moreover, cross-sectional SEM images showed lateral cracks in the oxide scale of the Hf54N46 coatings after annealing for 24–100 h (Figure 13). The volumes of HfN and HfO2 were 0.02309 and 0.03457 nm3/metal atom, respectively. Therefore, the volume ratio of oxide/nitride was 1.50, which resulted in cracks forming.
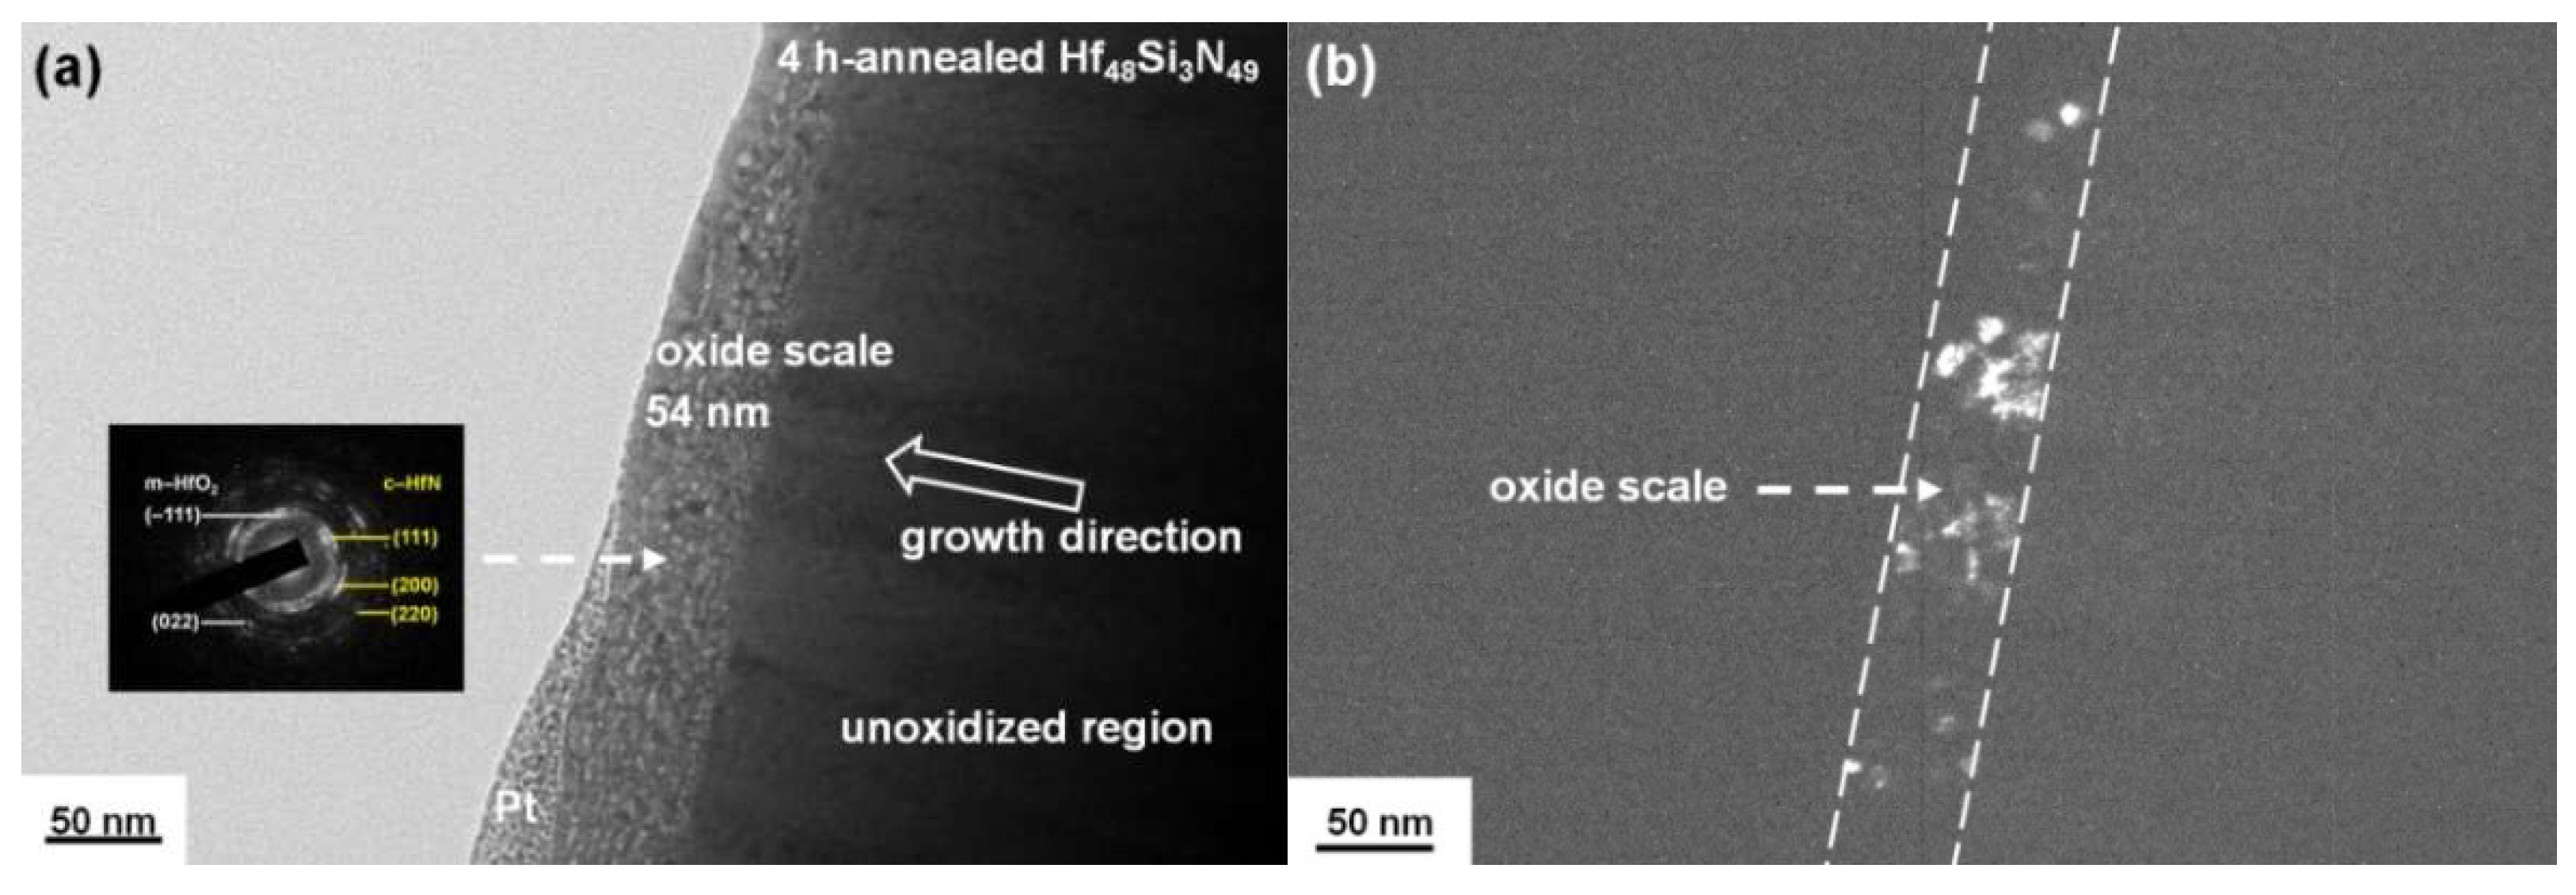
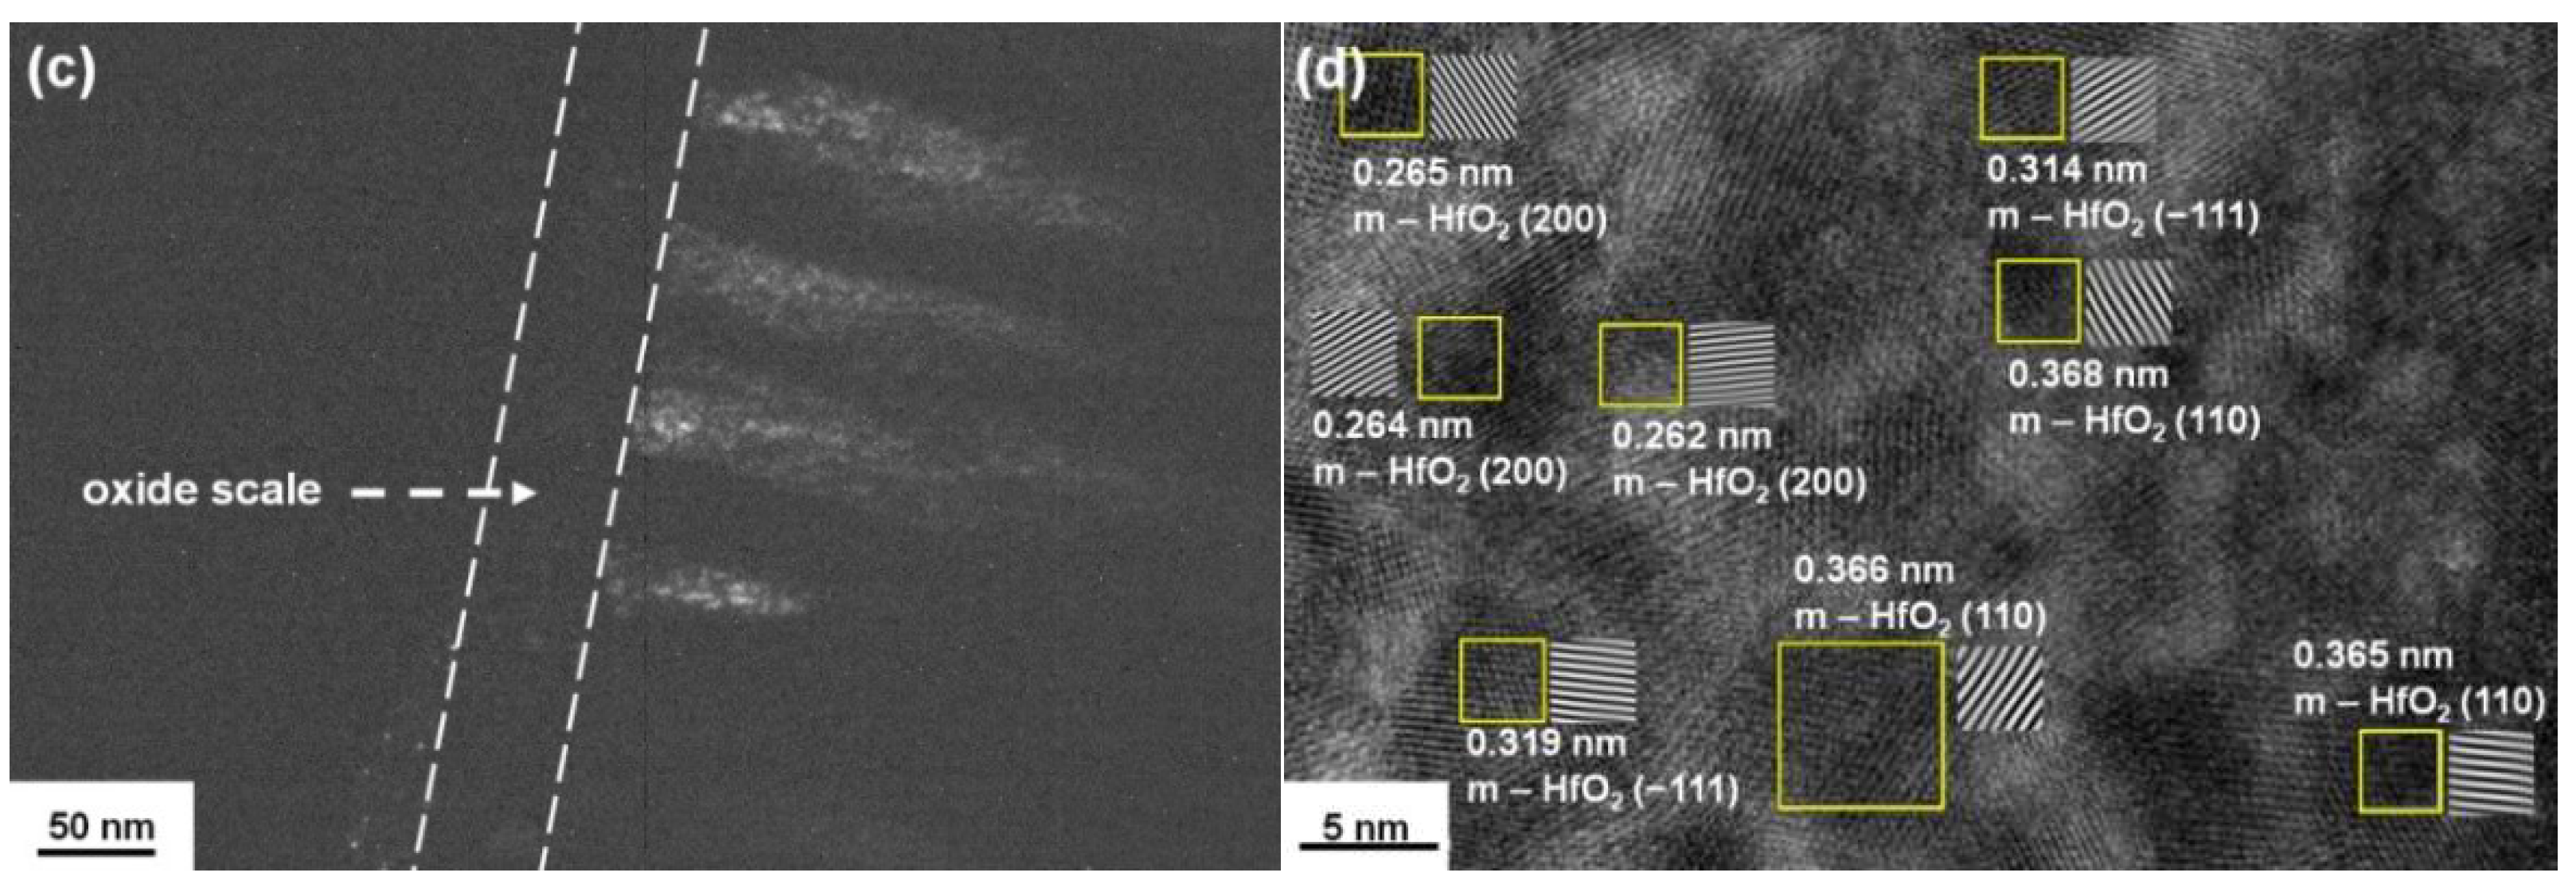
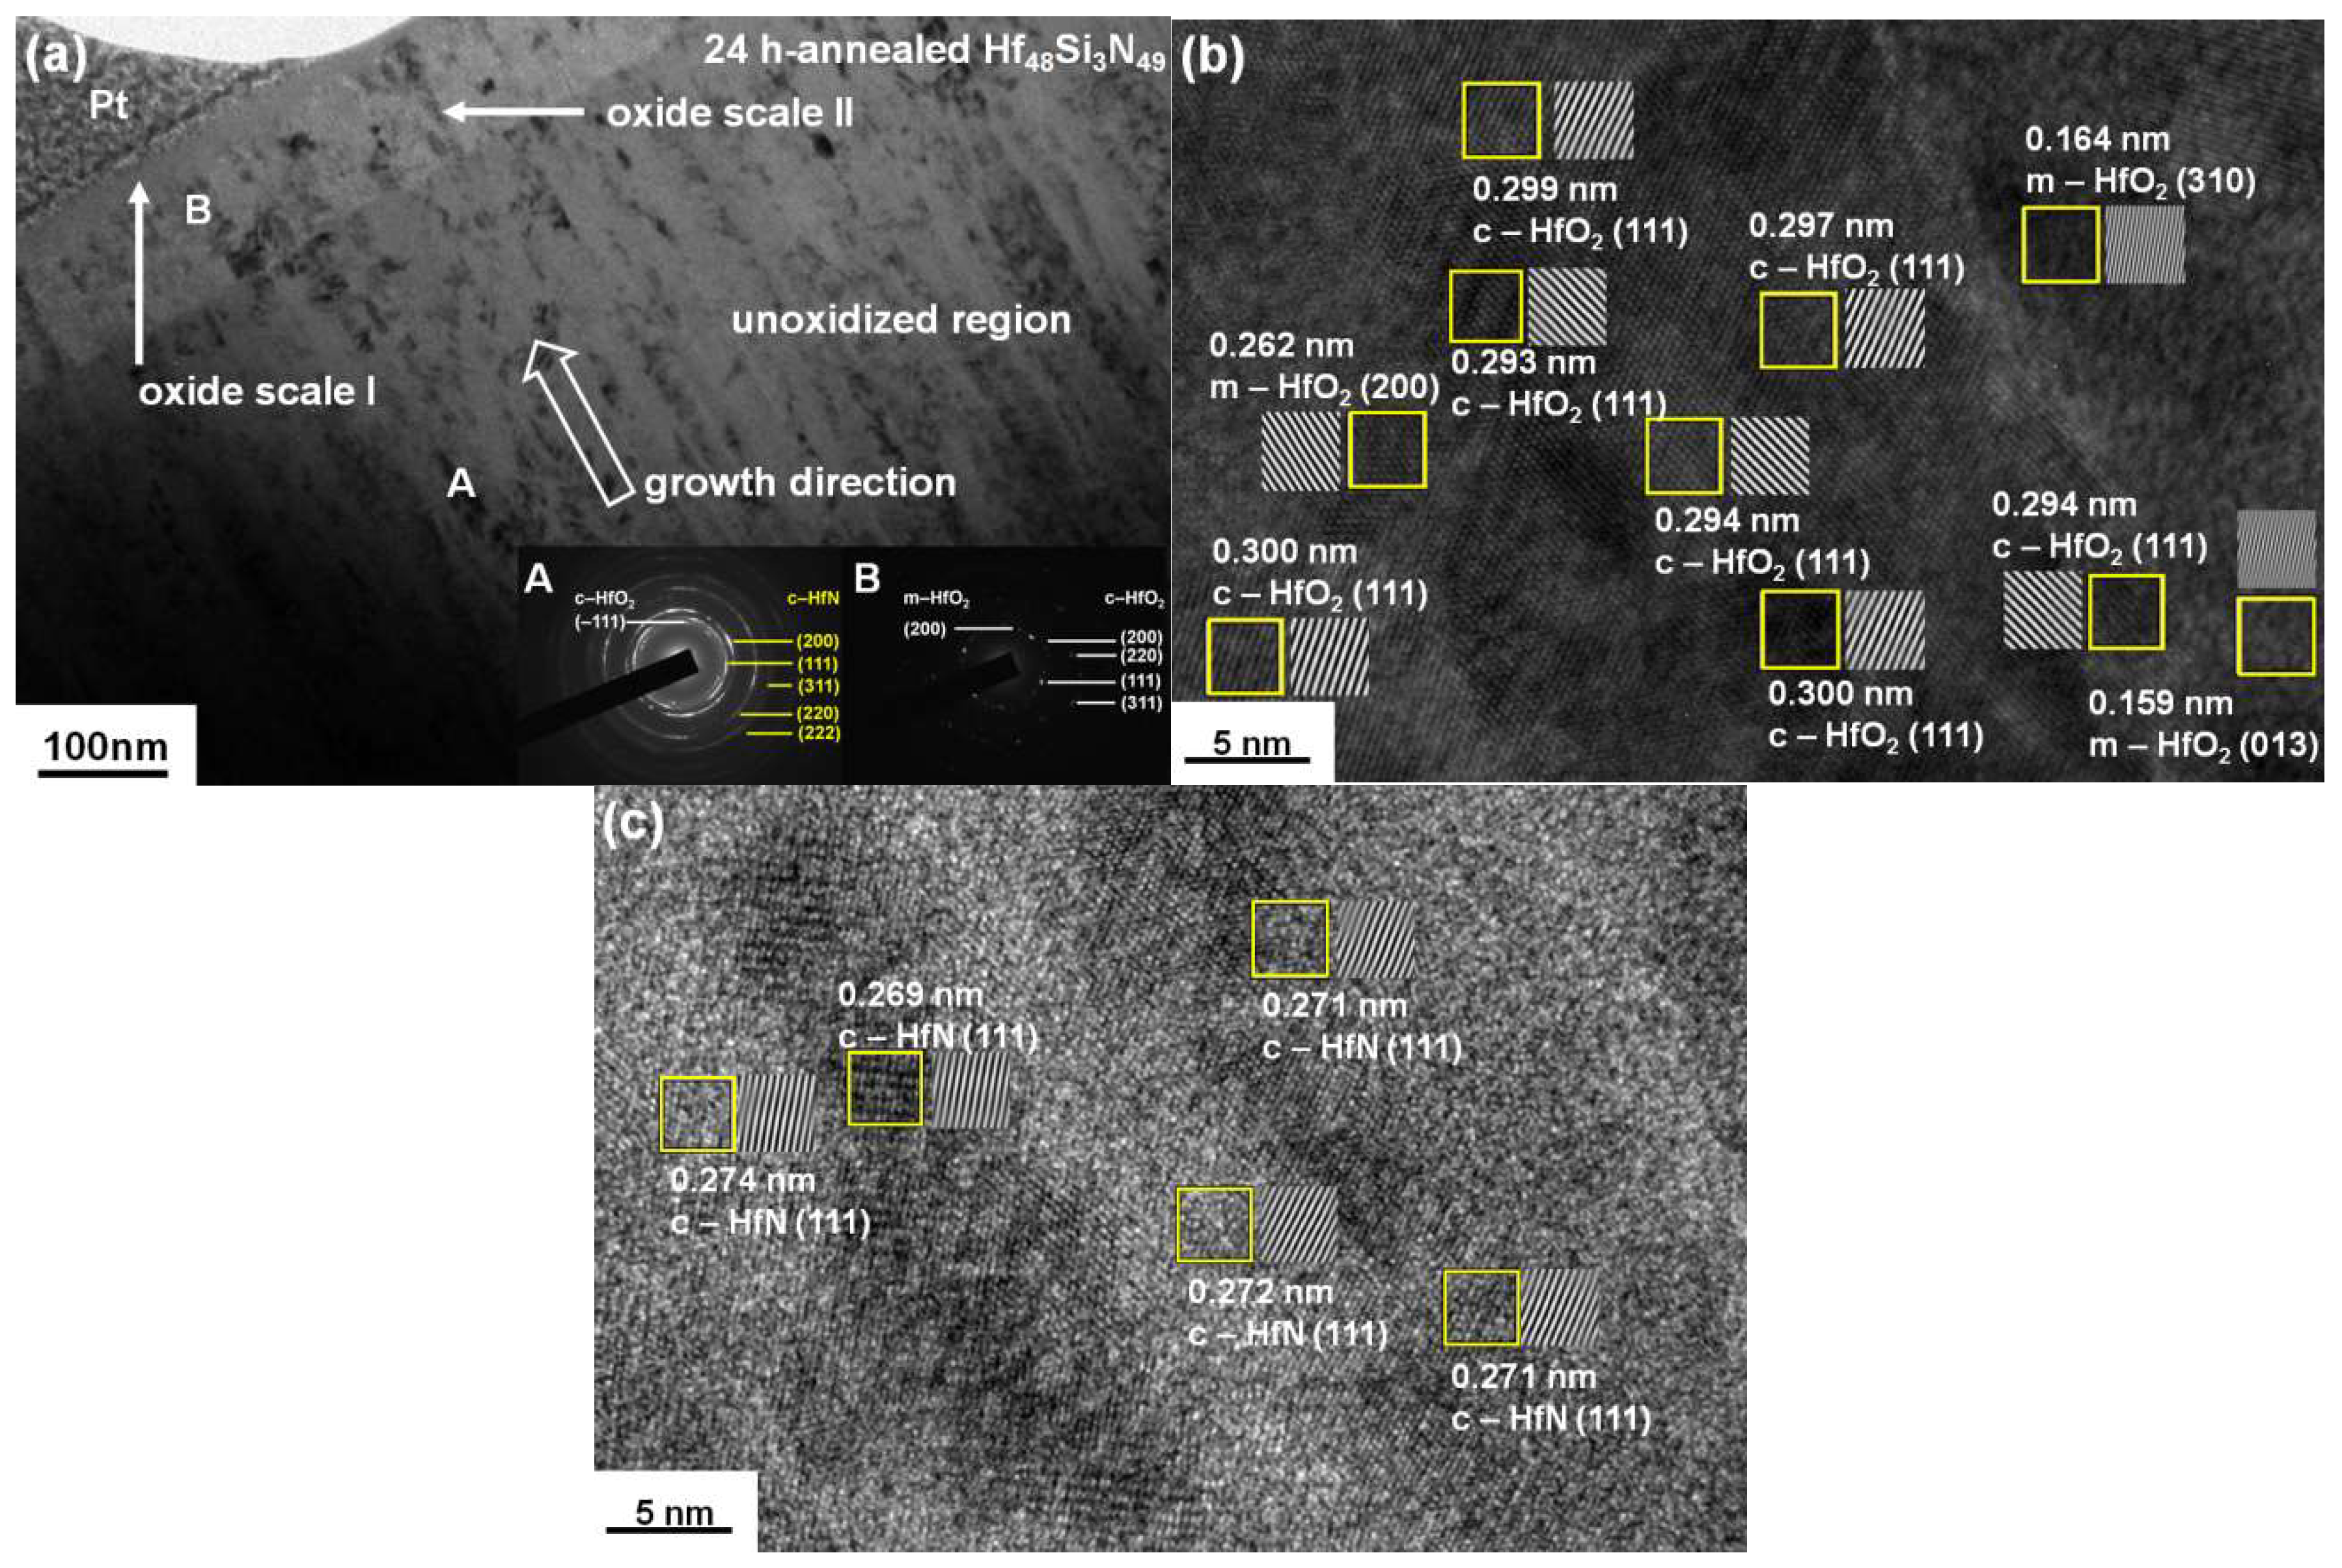
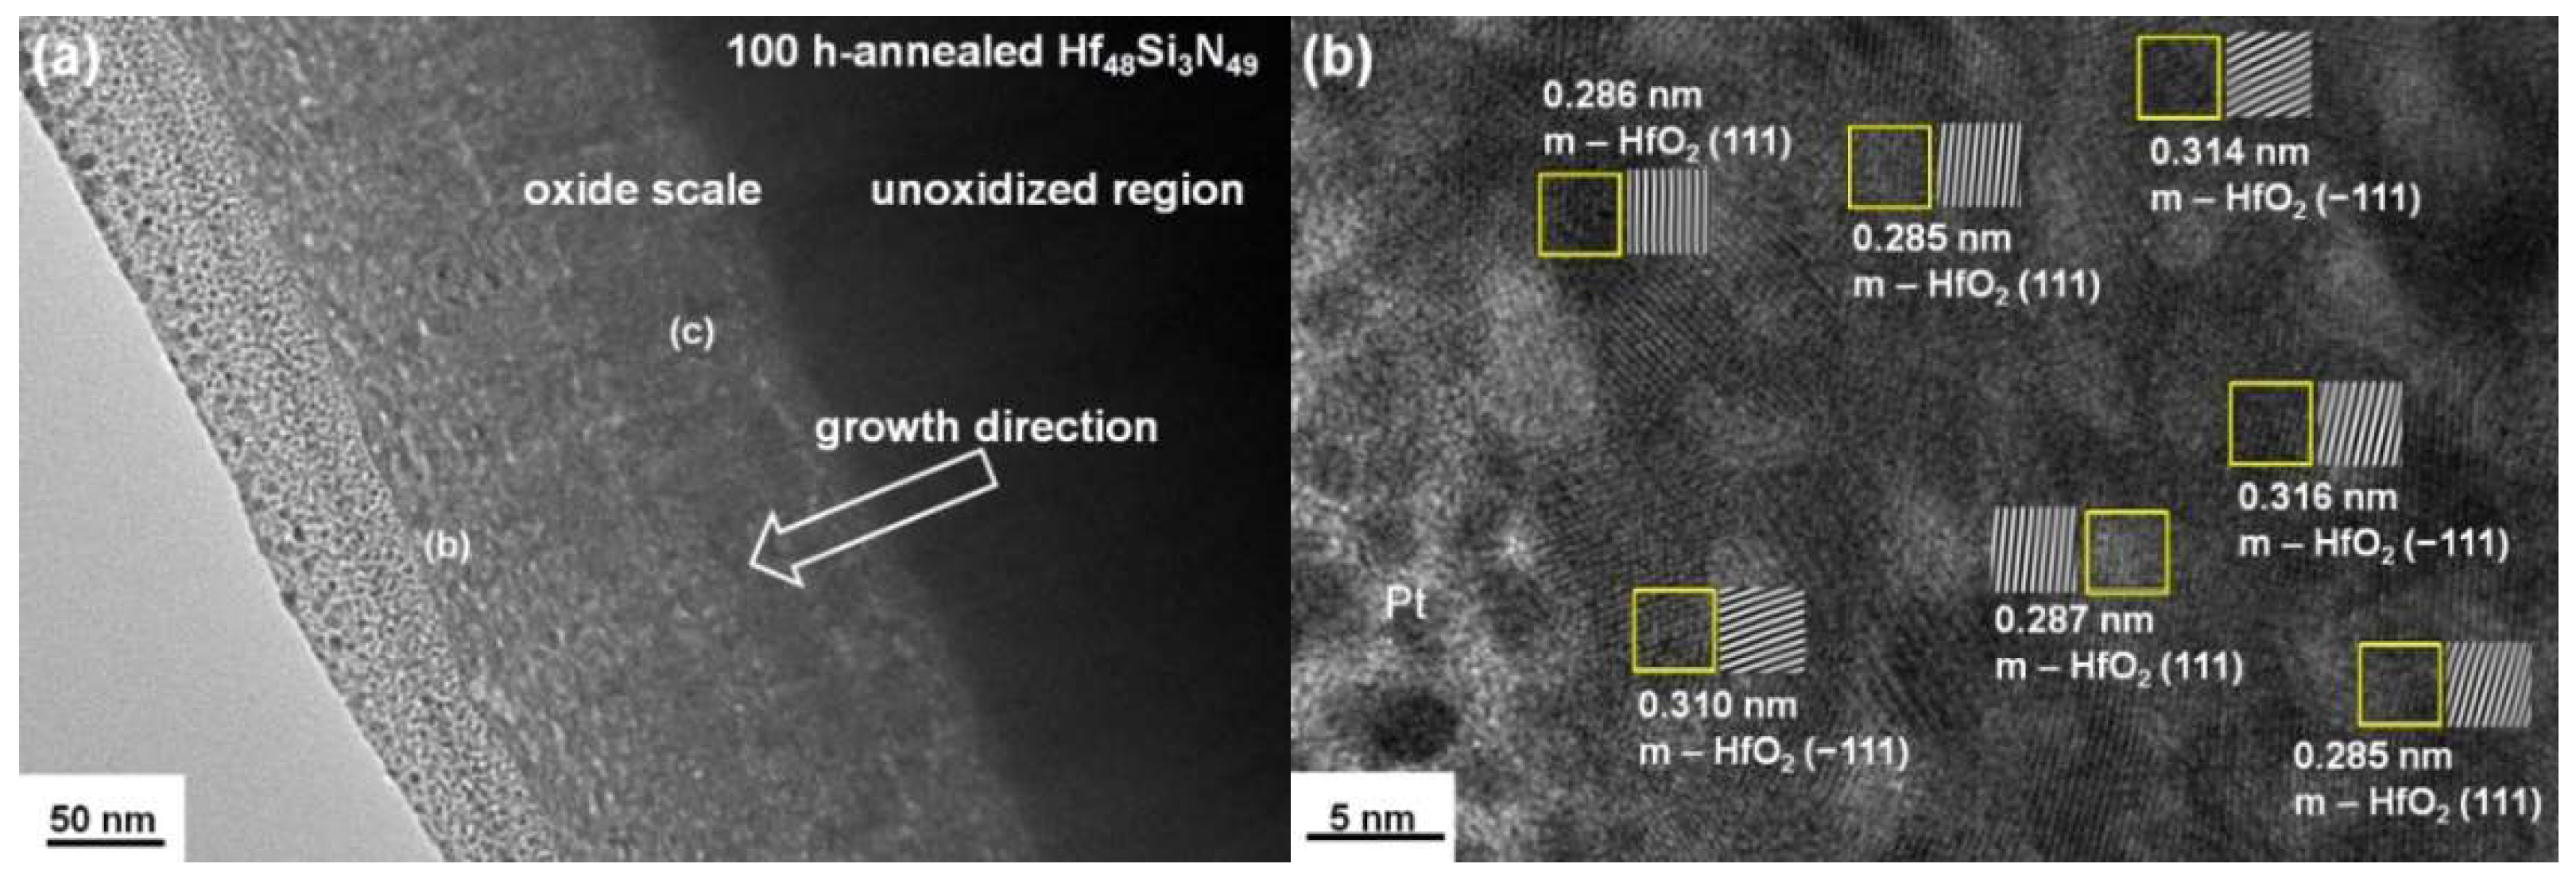
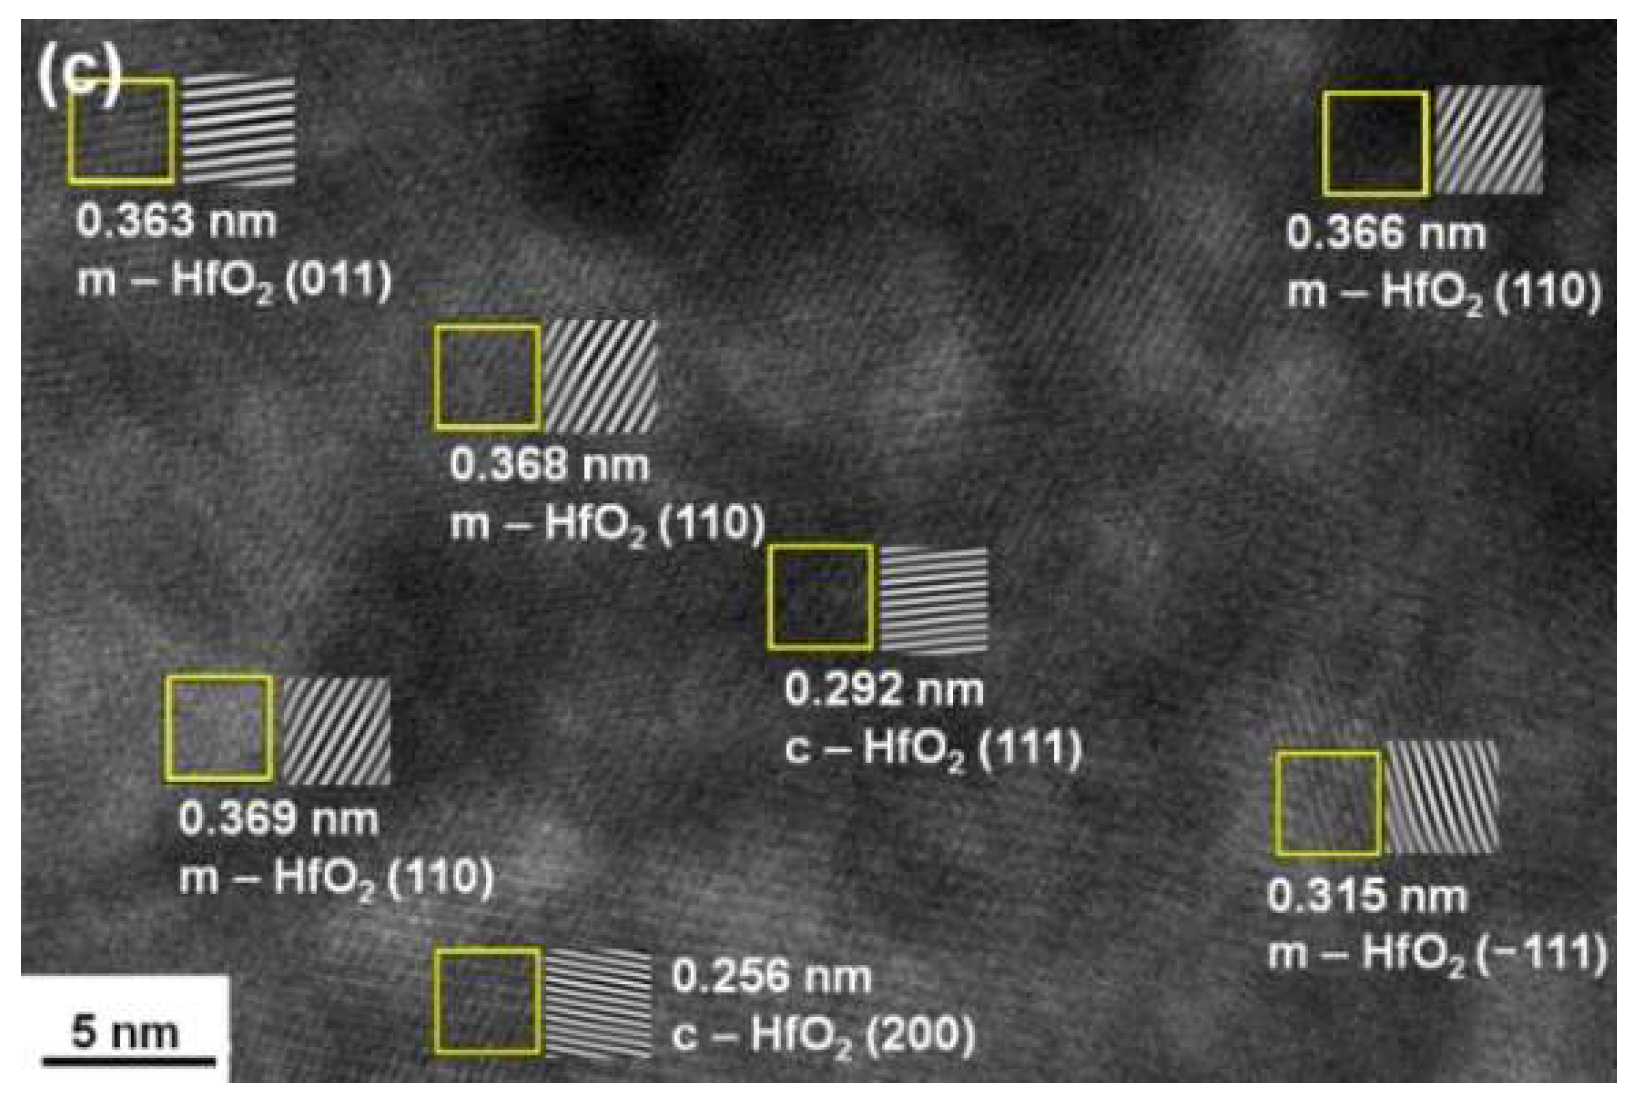
The oxidation scale thicknesses of the Hf48Si3N49 coatings examined using SEM were 146, 175 and 180 nm after annealing for 24, 50 and 100 h, respectively (Figure 12), which exhibited a decreasing oxidation rate. The XRD pattern of the 8-h annealed Hf48Si3N49 coatings exhibited a mixture of monoclinic and cubic HfO2 [ICDD 00-053-0550] and HfN phases, which was maintained until 100 h of annealing (Figure 14). Figure 15a illustrates a cross-sectional TEM image of the Hf48Si3N49 coatings after annealing for 4 h at 600 °C in 1% O2–99% Ar. An oxide layer was observed on the surface, and the selected area diffraction pattern (SADP) from the near-surface region exhibited ring patterns of HfN and monoclinic HfO2 phases. Figure 15b,c exhibits dark-filed images correlated with the HfO2(–111) and HfN(200) diffraction spots of the SADP, respectively indicating the surface oxide layer and interior columnar structure. The high-resolution image of the oxide scale exhibited lattice fringes of monoclinic HfO2 (Figure 15d). Figure 16a illustrates a cross-sectional TEM image of the Hf48Si3N49 coatings after annealing for 24 h. The oxide scale was divided into two sublayers. The near-surface region labeled as Oxide Scale I was an amorphous structure, whereas Oxide Scale II at a higher depth was crystalline. The high-resolution image of Oxide Scale II exhibited lattice fringes of monoclinic and cubic HfO2 (Figure 16b), whereas the high-resolution image of the unoxidized region showed lattice fringes of HfN (Figure 16c). Figure 17a illustrates a cross-sectional TEM image of the Hf48Si3N49 coatings after annealing for 100 h; the interface between the two sublayers observed for the 24-h annealed sample was not clear. The high-resolution image of the oxide scale near the surface exhibited lattice fringes of the monoclinic HfO2 phase (Figure 17b), whereas the high-resolution image of the oxide scale at a higher depth showed lattice fringes of monoclinic and cubic HfO2 (Figure 17c), similar to those in Oxide Scale II of the 24-h annealed sample. Because the standard Gibbs free energy levels of HfO2 and SiO2 at 600 °C are −983.438 and −752.535 kJ/mol of O2 [41], respectively, HfO2 formed preferentially during the oxidation of the Hf48Si3N49 coatings, as observed for the 4-h annealed sample. Subsequently, Si diffused outward in the following oxidation and formed an amorphous oxide scale on the free surface, which inhibited the inward diffusion of O; therefore, the oxidation of the Hf48Si3N49 coatings was restricted, as observed for the 24-h annealed sample. However, because the Si content of the Hf48Si3N49 coatings was only 3 at.% and Hf became a sink for gettering O, oxidation proceeded continuously, and Oxide Scale I, amorphous Si-oxide, was exhausted and replaced by crystalline monoclinic HfO2.
Both the Hf46Si7N48 and Hf39Si12N49 coatings exhibited buckling after annealing for 12 h and detaching after annealing for 24 h, whereas the Hf36Si13N51 and Hf32Si19N49 coatings maintained adherent to the substrates. Figure 18 illustrates the XRD patterns of the Hf–Si–N coatings after annealing for 100 h. The annealed Hf54N46 coatings exhibited a monoclinic HfO2 phase, whereas the annealed Hf36Si13N51 and Hf32Si19N49 coatings retained near-amorphous phases. Figure 19a illustrates a cross-sectional TEM image of the Hf32Si19N49 coatings after annealing at 600 °C in 1% O2–99% Ar for 24 h. A shallow oxide scale less than 10 nm was observed on the free surface, and the image contrast of the coatings revealed a multilayered structure attributed to the cyclical gradient concentration deposition. The SADP from the near-surface region exhibited a near-amorphous phase. The high-resolution image of the oxide scale exhibited an amorphous phase, and lattice fringes of cubic HfO2 were seldom observed in the Hf32Si19N49 coatings (Figure 19b).
The high oxidation resistances of Hf48Si3N49 and Hf32Si19N49 coatings and reduced oxidation resistance of Hf45Si7N48 coatings were further examined by XPS analyses. Figure 20 shows the XPS depth profiles of the 24-h annealed Hf48Si3N49 coatings. The sputtering rate for XPS analysis was set at 25.6 nm/min. Two evident regions exhibited the oxidized and unoxidized parts of the annealed Hf48Si3N49 coatings. The unoxidized region at a depth range of 205–256 nm exhibited Hf–N bonds with binding energies similar to those of the Hf–N bonds of the as-deposited samples (Table 3). Moreover, the intensity ratio of Hf0:Hf4N3:HfN:Hf3N4:Hf–O changed from 0:31:24:34:11 to 18:29:34:12:7 after 600 °C annealing, which implied that Hf3N4 was not stable and decomposed to HfN and Hf0. By contrast, the intensity ratio of the oxidized region at a depth range of 26–179 nm was 11:2:5:30:52, which consisted of major Hf–O bonds and Hf–N bonds of Hf3N4. The variation between the Hf–N bonds indicated that Hf4N3 and HfN oxidized preferentially, but Hf3N4 maintained the original amounts.
Table 3 lists the XPS Hf 4f7/2 signals of the 24-h annealed Hf32Si19N49 coatings. Because the oxide depth was less than 10 nm (Figure 19a), the sputtering rate of XPS analyses was set at 4.2 nm/min. The Hf 4f7/2 signals in the unoxidized region at a depth of 16.8–33.6 nm comprised all the mentioned Hf0, Hf–N and Hf–O bonds, and the intensity ratio of Hf0:Hf4N3:HfN:Hf3N4:Hf–O was 18:29:30:16:7. The presence of metallic Hf0 and declined intensity of Hf3N4 bonds related to those of the as-deposited Hf32Si19N49 coatings implied that Hf3N4 was not stable as the coatings were annealed at 600 °C, which agreed with the observation on the unoxidized region of the 24-h annealed Hf48Si3N49 coatings. The Si 2p comprised two signals of 97.84 ± 0.11 and 100.25 ± 0.06 eV for the free Si and Si–N bonds, respectively. The oxidized region at a depth of 8.4 nm exhibited Hf 4f7/2 signals of 16.00 and 16.78 eV, which were Hf–N bonds of Hf3N4 and Hf–O bonds, respectively, and the intensity ratio of Hf–N:Hf–O was 20:80. The Si 2p signal at the oxidized region was 101.47 eV, which implied the formation of Si-oxide at the near surface region and enhanced the oxidation resistance.
The presence of metallic Hf0 in the as-deposited state of the Hf46Si7N48 coatings resulted in the highest oxidation rate among the Hf–Si–N coatings in the beginning stage of oxidation (Figure 12). The intensity ratio of various Hf species at the unoxidized region annealed for 8 h maintained a similar ratio, whereas the Hf0 and Hf4N3 constitutions in the oxidized region diminished evidently.
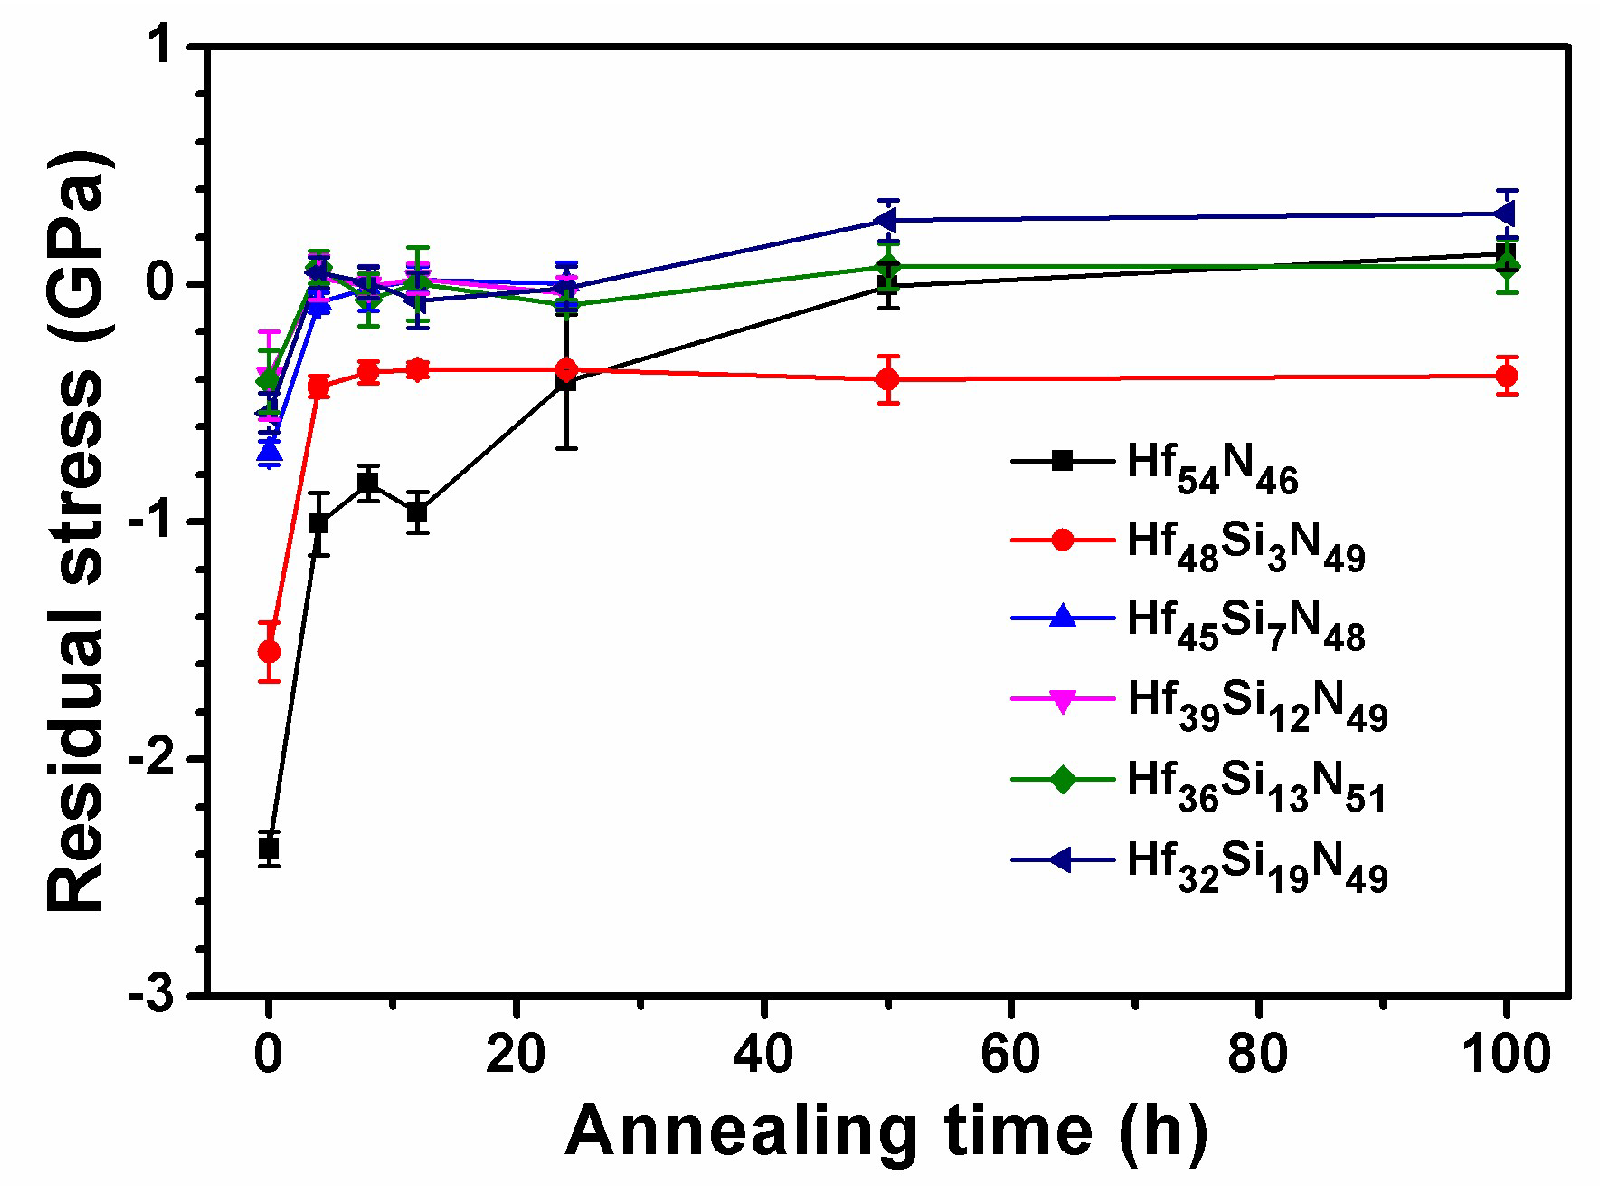
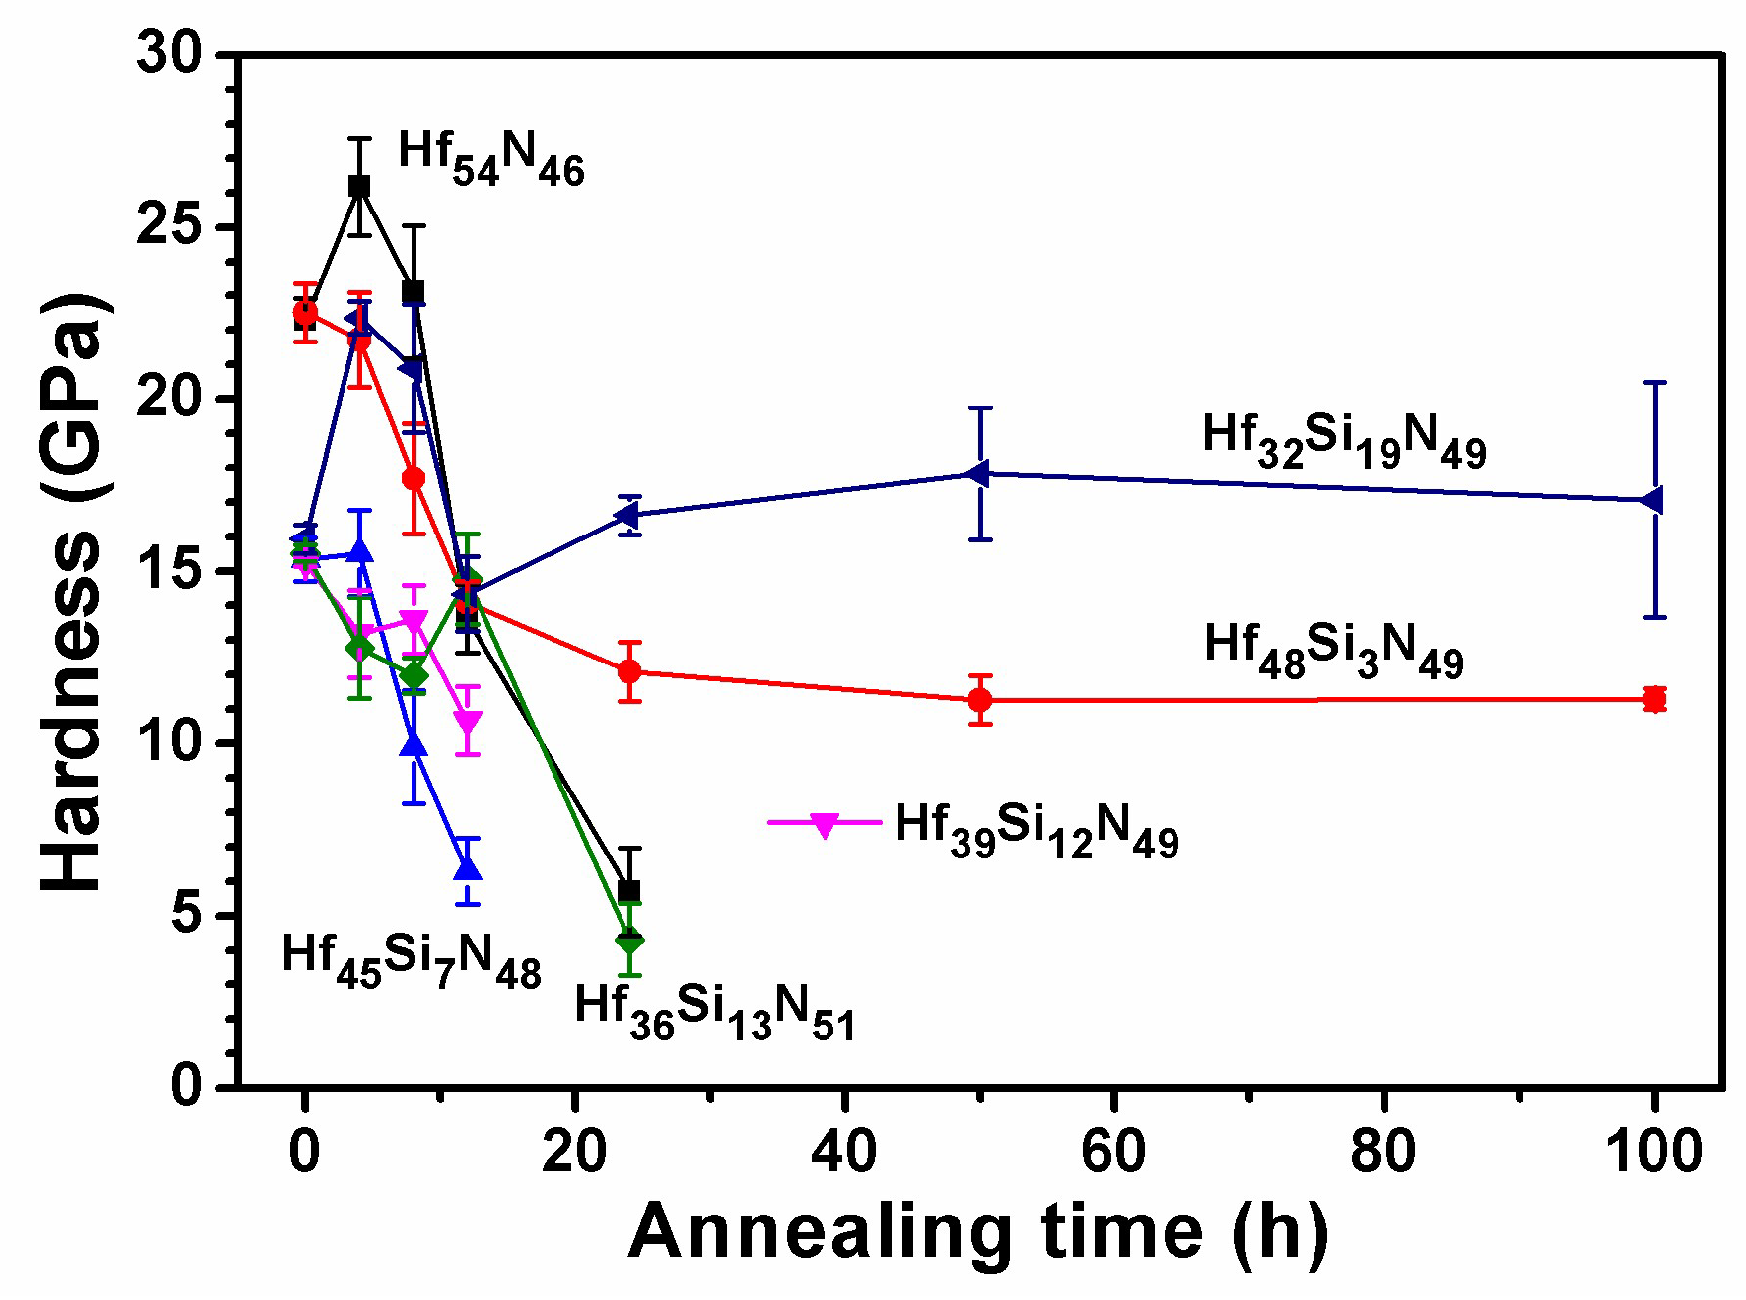
Figure 21 and Figure 22 illustrate the variations in residual stress and hardness values after annealing. The residual stress of the crystalline Hf54N46 coatings varied from compressive stress to zero stress during 50 h of annealing. By contrast, the nanoindentation hardness increased in the first 4 h of annealing and then decreased continuously until 24 h of annealing. Previous studies have reported hardness values of 9–12 GPa for HfO2 phases [42,43,44]. The 12-h and 24-h annealed Hf54N46 coatings exhibited a hardness of 13.6 and 5.7 GPa, respectively. The residual stress of the annealed Hf48Si3N49 coatings remained at −0.4 GPa after annealing for 4–24 h. The hardness decreased gradually to 12.1 GPa as the annealing time increased to 24 h and remained at this level for up to 100 h of annealing. Both the oxide scale and the unoxidized coating of the 24-h annealed Hf48Si3N49 coating exhibited a dense structure without pores and cracks (Figure 16). All the near-amorphous Hf–Si–N coatings with 7–19 at.% Si remained in a stress-free state after 4 h of annealing. The 24-h annealed Hf32Si19N49 coatings exhibited a high hardness level of 16.6 GPa and retained an amorphous structure for up to 100 h of annealing.

4. Conclusions

Monolithic and multilayered Hf–Si–N coatings deposited on Si substrates were fabricated by using reactive direct current magnetron cosputtering with substrate holder rotation speeds of 0 and 5 rpm, respectively. The construction of multilayered coatings from monolithic sublayers was elucidated. In the monolithic coatings, the low-Si-content (1–3 at.%) coatings exhibited an f.c.c. structure, whereas the middle-Si-content (6–12 at.%) coatings exhibited a mixture of HfN and amorphous phases. In the multilayered coatings, the Hf54N46 coatings exhibited an f.c.c. structure, whereas the low-Si-content (3 at.%) coatings exhibited a mixture of f.c.c. and amorphous phases, and the high-Si-content (7–19 at.%) coatings exhibited X-ray amorphous structures. The nanoindentation hardness of the as-deposited multilayered Hf48Si3N49 coatings exhibited a maximum value of 22.5 ± 0.8 GPa, and the hardness values decreased abruptly to 15.3 ± 0.6 GPa for Hf46Si7N48 and remained at 15–16 GPa for the high-Si-content coatings, approaching that of Si3N4. Moreover, the crystalline phase-dominant coatings of the surveyed monolithic and multilayered Hf–Si–N coatings exhibited a linear relationship between hardness and residual stress in compression. The XPS analyses indicated that Hf and Hf4N3 preferentially oxidized at 600 °C in an oxidizing circumstance, whereas Hf3N4 was not stable at 600 °C in non-oxidizing condition; therefore, the high oxidation resistances of Hf48Si3N49 and Hf32Si19N49 coatings were attributed to the performance of Si-addition in various mechanisms. The oxidation of Hf48Si3N49 coatings was restricted because of the outward diffusion of Si, which formed an amorphous oxide scale on the free surface of the initially-formed HfO2 oxide scale, although the amorphous oxide scale was replaced by HfO2 after subsequent annealing. By contrast, the oxidation of the Hf32Si19N49 coatings was restricted because their structures were maintained X-ray amorphous for up to 100 h of annealing.

Author Contributions

Conceptualization, L.-C.C. and Y.-I.C. Data Curation, L.-C.C. Funding Acquisition, L.-C.C. and Y.-I.C. Investigation, B.-W.L. Project Administration, Y.-I.C. Resources, Y.-I.C. Writing–Original Draft, Y.-I.C.

Funding

This research was funded by the Ministry of Science and Technology, Taiwan (Nos. 105-2221-E-019-007-MY3 and 106-2221-E-131-002).

Acknowledgments

The authors thank Mei-Chen Chiang at Ming Chi University of Technology for the technical support of the TEM observations.

Conflicts of Interest

The authors declare no conflict of interest.

References

  1. Shin, C.-S.; Gall, D.; Hellgren, N.; Patscheider, J.; Petrov, I.; Greene, J.E. Vacancy hardening in single-crystal TiNx(001) layers. J. Appl. Phys. 2003, 93, 6025–6028. [Google Scholar] [CrossRef]
  2. Chou, W.J.; Yu, G.P.; Huang, J.H. Bias effect of ion-plated zirconium nitride film on Si(100). Thin Solid Films 2002, 405, 162–169. [Google Scholar] [CrossRef]
  3. Seo, H.-S.; Lee, T.-Y.; Wen, J.G.; Petrov, I.; Greene, J.E.; Gall, D. Growth and physical properties of epitaxial HfN layers on MgO(001). J. Appl. Phys. 2004, 96, 878–884. [Google Scholar] [CrossRef]
  4. Escobar, C.; Villarreal, M.; Caicedo, J.C.; Esteve, J.; Prieto, P. Mechanical and tribological behavior of VN and HfN films deposited via reactive magnetron sputtering. Surf. Rev. Lett. 2013, 20, 1350040. [Google Scholar] [CrossRef]
  5. Massiani, Y.; Medjahed, A.; Crousier, J.P.; Gravier, P.; Rebatel, I. Corrosion of sputtered titanium nitride films deposited on iron and stainless steel. Surf. Coat. Technol. 1991, 45, 115–120. [Google Scholar] [CrossRef]
  6. Chou, W.J.; Yu, G.P.; Huang, J.H. Corrosion resistance of ZrN films on AISI 304 stainless steel substrate. Surf. Coat. Technol. 2003, 167, 59–67. [Google Scholar] [CrossRef]
  7. Escobar, C.; Villarreal, M.; Caicedo, J.C.; Aperador, W.; Prieto, P. Novel performance in physical and corrosion resistance HfN/VN coating system. Surf. Coat. Technol. 2013, 221, 182–190. [Google Scholar] [CrossRef]
  8. Budke, E.; Krempel-Hesse, J.; Maidhof, H.; Schüssler, H. Decorative hard coatings with improved corrosion resistance. Surf. Coat. Technol. 1999, 112, 108–113. [Google Scholar] [CrossRef]
  9. Wittmer, M.; Noser, J.; Melchior, H. Oxidation kinetics of TiN thin films. J. Appl. Phys. 1981, 52, 6659–6664. [Google Scholar] [CrossRef]
  10. Münz, W.D. Titanium aluminum nitride films: A new alternative to TiN coatings. J. Vac. Sci. Technol. A 1986, 4, 2717–2725. [Google Scholar] [CrossRef]
  11. Vepřek, S.; Haussmann, M.; Reiprich, S.; Shizhi, L.; Dian, J. Novel thermodynamically stable and oxidation resistant superhard coating materials. Surf. Coat. Technol. 1996, 86–87, 394–401. [Google Scholar] [CrossRef]
  12. Steyer, P.; Pilloud, D.; Pierson, J.F.; Millet, J.-P.; Charnay, M.; Stauder, B.; Jacquot, P. Oxidation resistance improvement of arc-evaporated TiN hard coatings by silicon addition. Surf. Coat. Technol. 2006, 201, 4158–4162. [Google Scholar] [CrossRef]
  13. Pilloud, D.; Pierson, J.F.; Marco de Lucas, M.C.; Alnot, M. Stabilisation of tetragonal zirconia in oxidized Zr–Si–N nanocomposite coatings. Appl. Surf. Sci. 2004, 229, 132–139. [Google Scholar] [CrossRef]
  14. Zeman, P.; Musil, J. Difference in high-temperature oxidation resistance of amorphous Zr–Si–N and W–Si–N films with a high Si content. Appl. Surf. Sci. 2006, 252, 8319–8325. [Google Scholar] [CrossRef]
  15. Callegari, A.C.; Frank, M.M.; Jammy, R.; Lacey, D.L.; McFeely, F.R.; Zafar, S. Method of Forming HfSiN Metal for n-FET Applications. U.S. Patent 7521346, 21 April 2009. [Google Scholar]
  16. Miyamoto, K.; Furumai, K.; Urban, B.E.; Kondo, H.; Zaima, S. Nitrogen-content dependence of crystalline structures and resistivity of Hf–Si–N gate electrodes for metal–oxide–semiconductor field-effect transistors. Jpn. J. Appl. Phys. 2009, 48, 045505. [Google Scholar] [CrossRef]
  17. Jin, G.; Cui, X.; Hao, J.; Liu, E.; Wei, S.; Shao, T. Structure and corrosion resistance in physiological solution of Hf–Si–N films deposited by IBAD. Surf. Coat. Technol. 2013, 228, S449–S451. [Google Scholar] [CrossRef]
  18. Cui, X.; Hao, J.; Wang, Y.; Dong, M.; Jin, G. The effect of Si content on the performance of magnetron sputtering Hf–Si–N films. Phys. Procedia 2013, 50, 427–432. [Google Scholar] [CrossRef]
  19. Chen, Y.I.; Chang, S.C.; Chang, L.C. Oxidation resistance and mechanical properties of Zr–Si–N coatings with cyclic gradient concentration. Surf. Coat. Technol. 2017, 320, 168–173. [Google Scholar] [CrossRef]
  20. Musil, J. Hard nanocomposite coatings: Thermal stability, oxidation resistance and toughness. Surf. Coat. Technol. 2012, 207, 50–65. [Google Scholar] [CrossRef]
  21. Chen, Y.I.; Lin, K.Y.; Wang, H.H.; Cheng, Y.R. Characterization of Ta–Si–N coatings prepared using direct current magnetron co-sputtering. Appl. Surf. Sci. 2014, 305, 805–816. [Google Scholar] [CrossRef]
  22. Oliver, W.C.; Pharr, G.M. An improved technique for determining hardness and elastic modulus using load and displacement sensing indentation experiments. J. Mater. Res. 1992, 7, 1564–1583. [Google Scholar] [CrossRef]
  23. Janssen, G.C.A.M.; Abdalla, M.M.; van Keulen, F.; Pujada, B.R.; van Venrooy, B. Celebrating the 100th anniversary of the Stoney equation for film stress: Developments from polycrystalline steel strips to single crystal silicon wafers. Thin Solid Films 2009, 517, 1858–1867. [Google Scholar] [CrossRef]
  24. Brantley, W.A. Calculated elastic constants for stress problems associated with semiconductor devices. J. Appl. Phys. 1973, 44, 534–535. [Google Scholar] [CrossRef]
  25. Massalski, T.B. Hf–N (Hafnium–Nitrogen). In Binary Alloy Phase Diagrams, 2nd ed.; Massalski, T.B., Okamoto, H., Subramanian, P.R., Kacprzak, L., Eds.; ASM International: Materials Park, OH, USA, 1990; p. 2090. [Google Scholar]
  26. Johansson, B.O.; Helmersson, U.; Hibbs, M.K.; Sundgren, J.E. Reactively magnetron sputtered HfN films. I. Composition and structure. J. Appl. Phys. 1985, 58, 3104–3111. [Google Scholar] [CrossRef]
  27. Zerr, A.; Miehe, G.; Riedel, R. Synthesis of cubic zirconium and hafnium nitride having Th3P4 structure. Nat. Mater. 2003, 2, 185–189. [Google Scholar] [CrossRef] [PubMed]
  28. Kroll, P. Hafnium nitride with thorium phosphide structure: Physical properties and an assessment of the Hf–N, Zr–N, and Ti–N phase diagrams at high pressures and temperatures. Phys. Rev. Lett. 2003, 90, 125501. [Google Scholar] [CrossRef] [PubMed]
  29. Escobar, C.; Villarreal, M.; Caicedo, J.C.; Aperador, W.; Prieto, P. Mechanical properties of steel surfaces coated with HfN/VN superlattices. J. Mater. Eng. Perform. 2014, 23, 3963–3974. [Google Scholar] [CrossRef]
  30. García-González, L.; Zamora-Peredo, L.; Flores-Ramírez, N.; Garnica-Romo, M.G.; Hernández-Torres, J. Influence of nitrogen flow rates on the structure, hardness, and electrical resistivity of HfN coatings by DC sputtering. J. Mater. Eng. Perform. 2015, 24, 1558–1564. [Google Scholar] [CrossRef]
  31. Dong, Y.; Zhao, W.; Yue, J.; Li, G. Crystallization of Si3N4 layers and its influences on the microstructure and mechanical properties of ZrN/Si3N4 nanomultilayers. Appl. Phys. Lett. 2006, 89, 121916. [Google Scholar] [CrossRef]
  32. Abadias, G.; Uglov, V.V.; Saladukhin, I.A.; Zlotski, S.V.; Tolmachova, G.; Dub, S.N.; Janse van Vuuren, A. Growth, structural and mechanical properties of magnetron-sputtered ZrN/SiNx nanolaminated coatings. Surf. Coat. Technol. 2016, 308, 158–167. [Google Scholar] [CrossRef]
  33. Cardarelli, F. Materials Handbook, 2nd ed.; Springer: London, UK, 2008. [Google Scholar]
  34. Chen, Y.H.; Guruz, M.; Chung, Y.W.; Keer, L.M. Thermal stability of hard TiNySiNx multilayer coatings with an equiaxed microstructure. Surf. Coat. Technol. 2002, 154, 162–166. [Google Scholar] [CrossRef]
  35. Arranz, A. Synthesis of hafnium nitride films by 0.5–5 keV nitrogen implantation of metallic Hf: An X-ray photoelectron spectroscopy and factor analysis study. Surf. Sci. 2004, 563, 1–12. [Google Scholar] [CrossRef]
  36. Wang, W.; Nabatame, T.; Shimogaki, Y. Interface structure of HfNx/SiO2 stack grown by MOCVD using TDEAHf precursor. Surf. Sci. 2005, 588, 108–116. [Google Scholar] [CrossRef]
  37. Choi, J.B.; Cho, K.; Lee, M.H.; Kim, K.H. Effects of Si content and free Si on oxidation behavior of Ti–Si–N coating layers. Thin Solid Films 2004, 447–448, 365–370. [Google Scholar] [CrossRef]
  38. Chen, Y.I.; Gao, Y.X.; Chang, L.C.; Ke, Y.E.; Liu, B.W. Mechanical properties, bonding characteristics, and oxidation behaviors of Nb–Si–N coatings. Surf. Coat. Technol. 2018, 350, 831–840. [Google Scholar] [CrossRef]
  39. Chang, L.-C.; Zheng, Y.-Z.; Chen, Y.-I.; Chang, S.-C.; Liu, B.-W. Bonding characteristics and chemical inertness of Zr–Si–N coatings with a high Si content in glass molding. Coatings 2018, 8, 181. [Google Scholar] [CrossRef]
  40. Xu, M.; Wang, S.; Yin, G.; Li, J.; Zheng, Y.; Chen, L.; Jia, Y. Optical properties of cubic Ti3N4, Zr3N4, and Hf3N4. Appl. Phys. Lett. 2006, 89, 151908. [Google Scholar] [CrossRef]
  41. Barin, I. Thermochemical Data of Pure Substances, 3rd ed.; Wiley-VCH Verlag GmbH & Co. KGaA: New York, NY, USA, 1995. [Google Scholar]
  42. Okutomi, M.; Kasamatsu, M.; Tsukamoto, K.; Shiratori, S.; Uchiyama, F. Sintering of new oxide ceramics using a high power cw CO2 laser. Appl. Phys. Lett. 1984, 44, 1132–1134. [Google Scholar] [CrossRef]
  43. Tapily, K.; Jakes, J.E.; Stone, D.S.; Shrestha, P.; Gu, D.; Baumgart, H.; Elmustafa, A.A. Nanoindentation investigation of HfO2 and Al2O3 films grown by atomic layer deposition. J. Electrochem. Soc. 2008, 155, H545–H551. [Google Scholar] [CrossRef]
  44. Al-Khatatbeh, Y.; Lee, K.K.M.; Kiefer, B. Phase diagram up to 105 GPa and mechanical strength of HfO2. Phys. Rev. B 2010, 82, 144106. [Google Scholar] [CrossRef]
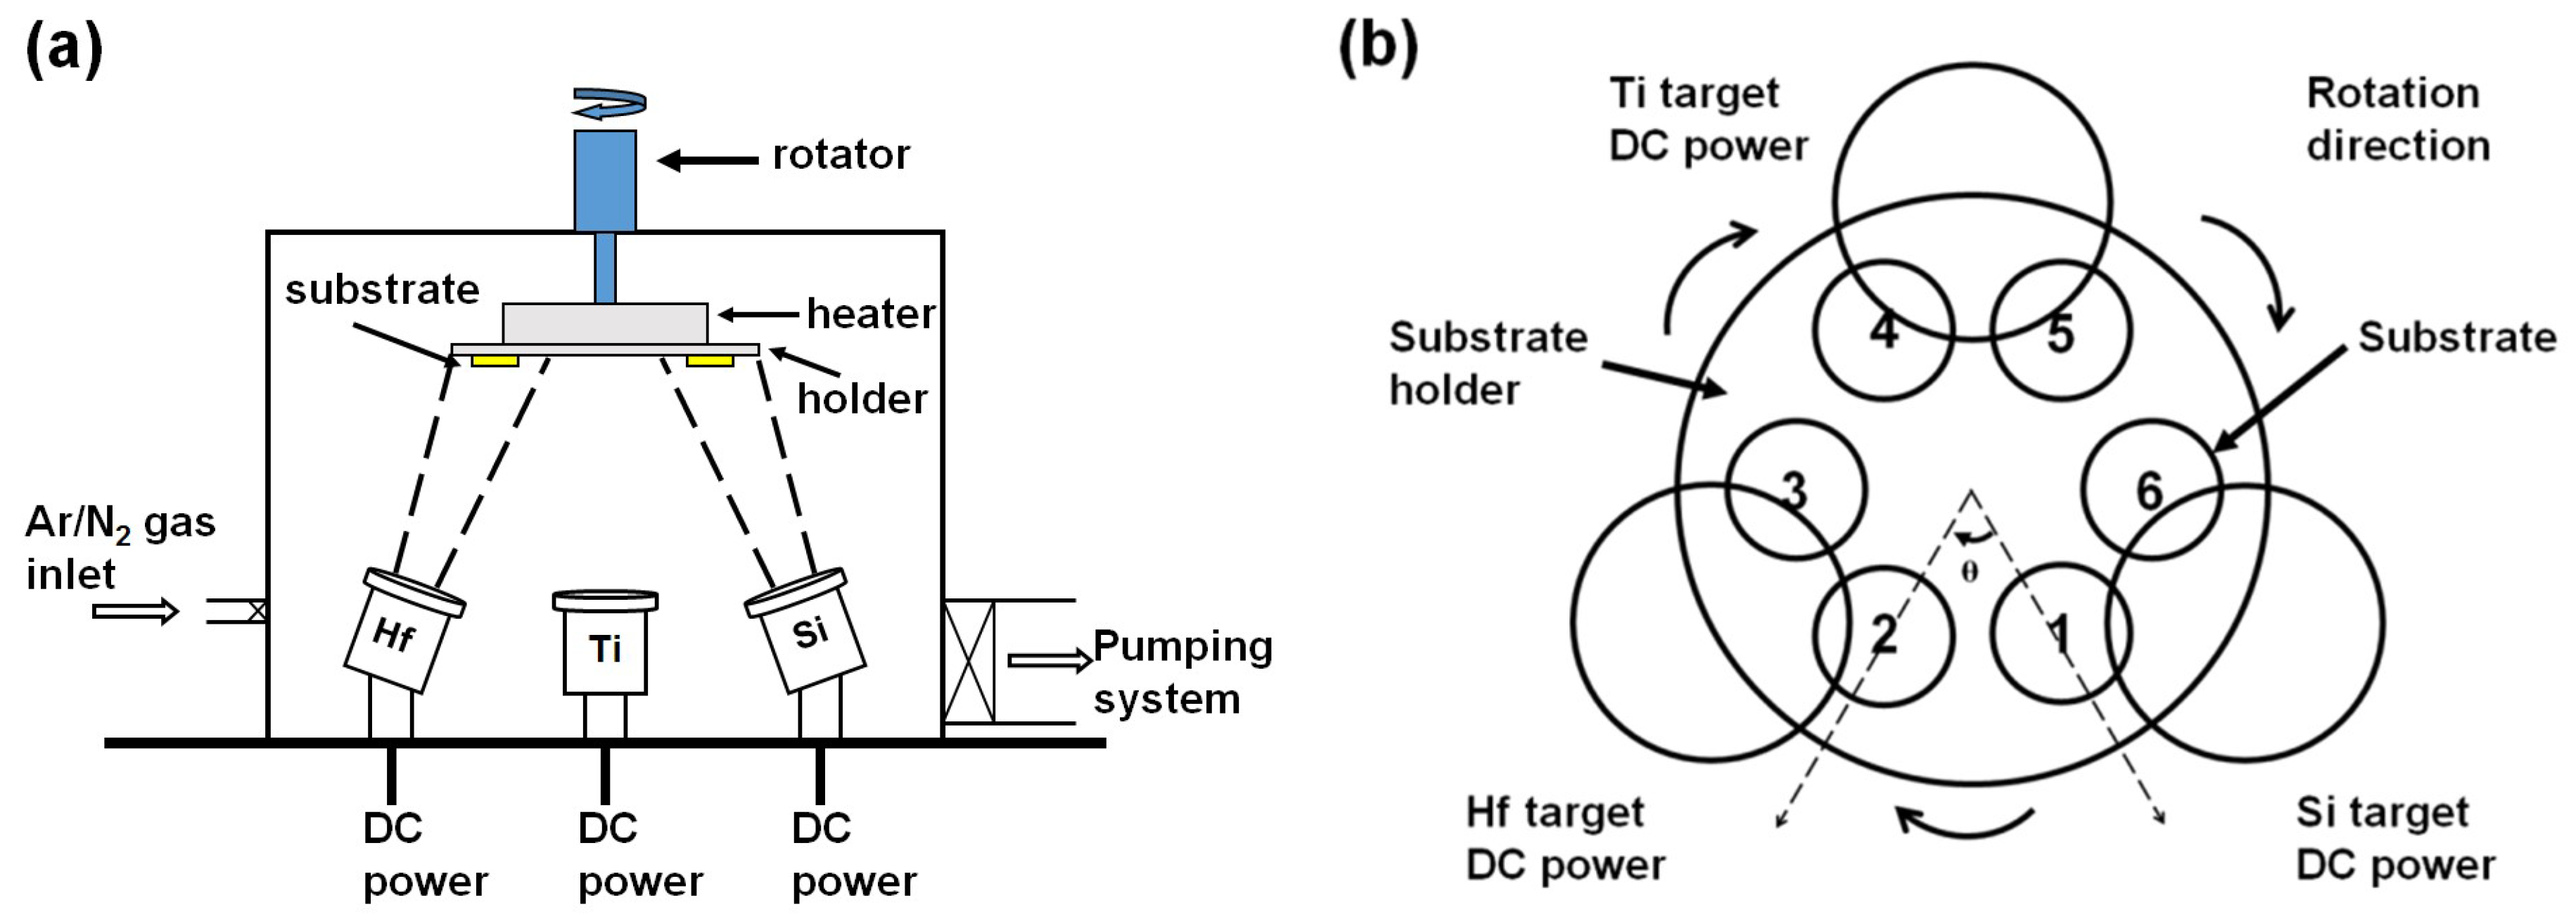
Figure 1. (a) Schematic of the magnetron cosputtering equipment and (b) relationship of sputter targets to the sample positions.
Coatings 08 00354 g001
Figure 2. XRD patterns of the as-deposited monolithic Hf–Si–N coatings prepared without rotating the substrate holder.
Coatings 08 00354 g002
Figure 3. XRD patterns of as-deposited multilayered Hf–Si–N coatings.
Coatings 08 00354 g003
Figure 4. Nanoindentation hardness and Young’s modulus values of the as-deposited multilayered Hf–Si–N coatings.
Coatings 08 00354 g004
Figure 5. Nanoindentation hardness and residual stress values of the monolithic and multilayered Hf–Si–N coatings.
Coatings 08 00354 g005
Figure 6. XPS depth profiles of the Hf48Si3N49 coatings: (a) N 1s, (b) O 1s, (c) Si 2p, (d) Hf 4f (sputter rate: 9.5 nm/min for SiO2).
Coatings 08 00354 g006aCoatings 08 00354 g006b
Figure 7. Curve fitting of the Hf 4f signal of Hf48Si3N49 coatings at a depth of 57 nm.
Coatings 08 00354 g007
Figure 8. Curve fitting of the Hf 4f signal of Hf45Si7N48 coatings at a depth of 57 nm.
Coatings 08 00354 g008
Figure 9. XPS depth profiles of the Hf32Si19N49 coatings: (a) N 1s, (b) O 1s, (c) Si 2p, (d) Hf 4f (sputter rate: 9.5 nm/min for SiO2).
Coatings 08 00354 g009aCoatings 08 00354 g009b
Figure 10. Curve fitting of XPS profiles of: (a) N 1s, (b) Si 2p and (c) Hf 4f signals of the Hf32Si19N49 coatings at a depth of 57 nm.
Coatings 08 00354 g010
Figure 11. XRD patterns of multilayered Hf–Si–N coatings after they were annealed at 600 °C in 1% O2–99% Ar for 4 h.
Coatings 08 00354 g011
Figure 12. Oxide scale thicknesses of multilayered Hf–Si–N coatings after they were annealed at 600 °C in 1% O2–99% Ar.
Coatings 08 00354 g012
Figure 13. Cross-sectional SEM image of the Hf54N46 coating after annealing at 600 °C in 1% O2–99% Ar for 24 h.
Coatings 08 00354 g013
Figure 14. XRD patterns of Hf48Si3N49 coatings after they were annealed at 600 °C in 1% O2–99% Ar for 0–100 h.
Coatings 08 00354 g014
Figure 15. (a) Cross-sectional TEM image and selected area diffraction pattern of the Hf48Si3N49 coating after annealing at 600 °C in 1% O2–99% Ar for 4 h; the dark-field images correlated with diffraction spots of (b) HfO2(–111) and (c) HfN(200) in the selected area diffraction pattern (SADP); (d) high-resolution image of the oxide layer.
Coatings 08 00354 g015aCoatings 08 00354 g015b
Figure 16. (a) Cross-sectional TEM image and selected area diffraction pattern of the Hf48Si3N49 coating after annealing at 600 °C in 1% O2–99% Ar for 24 h; high-resolution images of (b) Oxide Scale II and (c) the unoxidized region in (a).
Coatings 08 00354 g016
Figure 17. (a) Cross-sectional TEM image of the Hf48Si3N49 coating after annealing at 600 °C in 1% O2–99% Ar for 100 h; High-resolution images of the oxide scale (b) near the surface and (c) in the deeper region.
Coatings 08 00354 g017aCoatings 08 00354 g017b
Figure 18. XRD patterns of multilayered Hf–Si–N coatings after they were annealed at 600 °C in 1% O2–99% Ar for 100 h.
Coatings 08 00354 g018
Figure 19. (a) Cross-sectional TEM image and selected area diffraction pattern; (b) High-resolution image of the Hf32Si19N49 coating after annealing at 600 °C in 1% O2–99% Ar for 24 h.
Coatings 08 00354 g019
Figure 20. XPS depth profiles of the Hf48Si3N49 coatings after annealing for 24 h: (a) N 1s; (b) O 1s; (c) Si 2p; (d) Hf 4f. Sputter rate: 25.6 nm/min for SiO2.
Coatings 08 00354 g020
Figure 21. Residual stress of multilayered Hf–Si–N coatings after they were annealed at 600 °C in 1% O2–99% Ar.
Coatings 08 00354 g021
Figure 22. Nanoindentation hardness values of the annealed multilayered Hf–Si–N coatings.
Coatings 08 00354 g022
Table 1. Chemical compositions, thicknesses, mechanical properties and residual stresses of the monolithic Hf–Si–N coatings.
PositionSampleChemical Composition (at.%)T
(nm)
H
(GPa)
E
(GPa)
Stress
(GPa)
HfSiNO
1Hf45Si6N4944.5 ± 0.95.5 ± 0.149.0 ± 1.61.0 ± 0.1100919.5 ± 0.4256 ± 7−1.1 ± 0.2
2Hf49Si1N5048.3 ± 1.81.2 ± 0.149.6 ± 2.10.9 ± 0.4155921.7 ± 1.1284 ± 6−1.8 ± 0.2
3Hf53Si1N4652.1 ± 0.81.3 ± 0.145.5 ± 0.81.1 ± 0.3112221.3 ± 1.4283 ± 9−2.0 ± 0.0
4Hf50Si3N4750.0 ± 1.42.8 ± 0.145.9 ± 1.21.3 ± 0.366721.8 ± 1.3264 ± 8−1.6 ± 0.8
5Hf44Si7N4943.4 ± 0.36.6 ± 0.148.1 ± 0.71.9 ± 0.562819.3 ± 2.2246 ± 160.0 ± 0.6
6Hf38Si12N5038.1 ± 0.811.9 ± 0.249.4 ± 0.50.6 ± 0.264915.4 ± 1.1227 ± 10−0.1 ± 0.2
Note: T stands for thickness; H stands for hardness; E stands for Young’s modulus.
Table 2. Sputtering parameters, chemical compositions, thicknesses and mechanical properties of multilayered Hf–Si–N coatings.
SamplePower (W)Time (min)Chemical Composition (at.%)Thickness (nm)Hardness (GPa)Young’s Modulus (GPa)Stress (GPa)
HfSiHfSiNO
Hf54N4625009052.2 ± 4.00.2 ± 0.144.4 ± 4.53.2 ± 0.495722.3 ± 0.6248 ± 3−2.4 ± 0.1
Hf48Si3N49250258547.2 ± 0.73.1 ± 0.147.8 ± 0.31.9 ± 0.686622.5 ± 0.8244 ± 3−1.5 ± 0.1
Hf45Si7N48250508044.7 ± 0.57.0 ± 0.247.1 ± 0.11.2 ± 0.2101815.3 ± 0.6206 ± 3−0.7 ± 0.0
Hf39Si12N49250757539.0 ± 0.811.4 ± 0.448.5 ± 1.41.1 ± 0.396115.3 ± 0.1203 ± 2−0.4 ± 0.2
Hf36Si13N512501007035.4 ± 1.013.4 ± 0.150.3 ± 1.20.9 ± 0.298515.5 ± 0.2208 ± 2−0.4 ± 0.1
Hf32Si19N492501506031.8 ± 0.418.5 ± 0.548.7 ± 1.01.0 ± 0.299015.9 ± 0.4209 ± 5−0.5 ± 0.1
Table 3. XPS analysis results of Hf 4f7/2 of as-deposited and annealed Hf–Si–N coatings.
SampleDepth Range (nm)Hf 4f7/2 (eV)Intensity Ratio of Hf0:Hf4N3:HfN:Hf3N4:Hf–O
Hf0Hf4N3HfNHf3N4Hf–O
Hf48Si3N49
as-deposited9.5–57.014.46 ± 0.0615.13 ± 0.0316.01 ± 0.0718.11 ± 0.090:31:24:34:11
annealed, 24 h205–256, unoxidized13.84 ± 0.0214.48 ± 0.0115.02 ± 0.0216.01 ± 0.0017.50 ± 0.0718:29:34:12:7
26–179, oxidized13.85 ± 0.0214.48 ± 0.0314.98 ± 0.0116.07 ± 0.0417.51 ± 0.0211:2:5:30:52
Hf45Si7N48
as-deposited9.5–57.013.82 ± 0.0314.53 ± 0.0114.82 ± 0.0315.82 ± 0.0317.06 ± 0.0828:36:11:12:13
annealed, 8 h161–230, unoxidized13.86 ± 0.0114.50 ± 0.0215.00 ± 0.2815.72 ± 0.0916.90 ± 0.0323:39:10:16:12
23–115, oxidized13.50 ± 0.0214.84 ± 0.0815.09 ± 0.0716.21 ± 0.0416.97 ± 0.025:9:15:10:61
Hf32Si19N49
as-deposited28.5–57.014.60 ± 0.0215.25 ± 0.0116.07 ± 0.0317.53 ± 0.060:23:26:40:11
annealed, 24 h16.8–33.6, unoxidized13.92 ± 0.0214.53 ± 0.0315.18 ± 0.0215.70 ± 0.0316.98 ± 0.0518:29:30:16:7
8.4, oxidized16.0016.780:0:0:20:80